Embed Size (px)
Citation preview
Design and Validation of an Image-GuidedRobot for Small Animal Research
Peter Kazanzides1, Jenghwa Chang3, Iulian Iordachita1, Jack Li2,C. Clifton Ling3, and Gabor Fichtinger1
1 Department of Computer Science, Johns Hopkins University, [email protected]
2 Department of Mechanical Engineering, Johns Hopkins University, USA3 Medical Physics Department, Memorial Sloan Kettering Cancer Center, USA�
Abstract. We developed an image-guided robot system to achieve highlyaccurate placement of thin needles and probes into in-vivo rodent tumortissue in a predefined pattern that is specified on a preoperative image.This system can be used for many experimental procedures where thegoal is to correlate a set of physical measurements with a correspondingset of image intensities or, more generally, to perform a physical actionat a set of anatomic points identified on a preoperative image. Thispaper focuses on the design and validation of the robot system, wherethe first application is to insert oxygen measurement probes in a three-dimensional (3D) grid pattern defined with respect to a PET scan ofa tumor. The design is compatible with CT and MRI, which we planto use to identify targets for biopsy and for the injection of adenoviralsequences for gene therapy. The validation is performed using a phantomand includes a new method for estimating the Fiducial Localization Error(FLE) based on the measured Fiducial Distance Error (FDE).
1 Introduction
We are investigating non-invasive methods for identifying hypoxic (oxygen de-ficient) cells in tumors. This is important because hypoxic cells are resistantto radiation treatment and therefore treatment can be improved by tailoringthe radiation dosage directed at them. By measuring the tissue oxygen tension(pO2) level of the cells using an Oxylite probe[1] and correlating these mea-surements with Positron Emission Tomography (PET) scan data, it is possibleto verify the efficacy of PET scans for locating hypoxic cancer cells prior toradiation treatment[2]. Initially, we used a manual method to verify the corre-lation between PET scan data and pO2 measurements for tumors on rodents.The procedure was to place the anesthetized rodent inside a foam-filled bed thatcontained a template with PET-compatible markers. After the PET scans, theentire rodent and bed assembly were placed beneath a passive fixture that held
� We thank Emese Balogh, Anton Deguet, Russell Taylor (JHU), Bixiu Wen, PatZanzonico, Andrei Pugachev, Qing Chen, Jose Campa (MSKCC) for their assistance.This work is supported by NIH RO1 CA84596 and NSF EEC 9731748.
R. Larsen, M. Nielsen, and J. Sporring (Eds.): MICCAI 2006, LNCS 4190, pp. 50–57, 2006.c© Springer-Verlag Berlin Heidelberg 2006
Design and Validation of an Image-Guided Robot for Small Animal Research 51
the Oxylite probe. A set of measurement targets (a “track”) on the PET imagewas selected and the corresponding template hole was located. After the skinand tumor were punctured with a needle, the Oxylite probe was manually ad-vanced through the template hole to measure the pO2 level at each point alongthe track. This procedure was repeated for multiple template holes (tracks). Ourgoal was to design and build a robot system to automate this time-consumingand labor-intensive procedure, while eliminating the constraint that measure-ment tracks be defined only through template holes. The desired accuracy of therobot system was specified to be 0.25 mm or better, not including the error dueto the imaging system.
2 System Design
2.1 Hardware Design
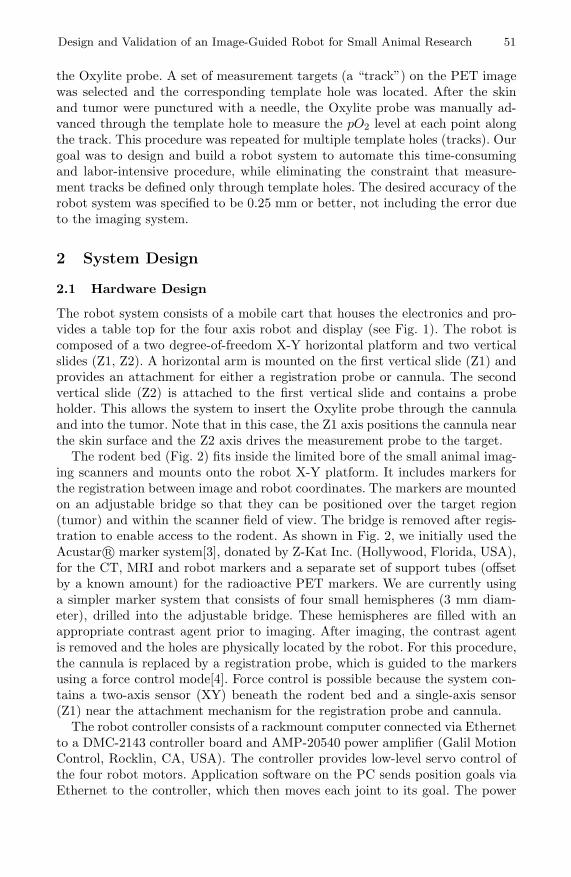
The robot system consists of a mobile cart that houses the electronics and pro-vides a table top for the four axis robot and display (see Fig. 1). The robot iscomposed of a two degree-of-freedom X-Y horizontal platform and two verticalslides (Z1, Z2). A horizontal arm is mounted on the first vertical slide (Z1) andprovides an attachment for either a registration probe or cannula. The secondvertical slide (Z2) is attached to the first vertical slide and contains a probeholder. This allows the system to insert the Oxylite probe through the cannulaand into the tumor. Note that in this case, the Z1 axis positions the cannula nearthe skin surface and the Z2 axis drives the measurement probe to the target.
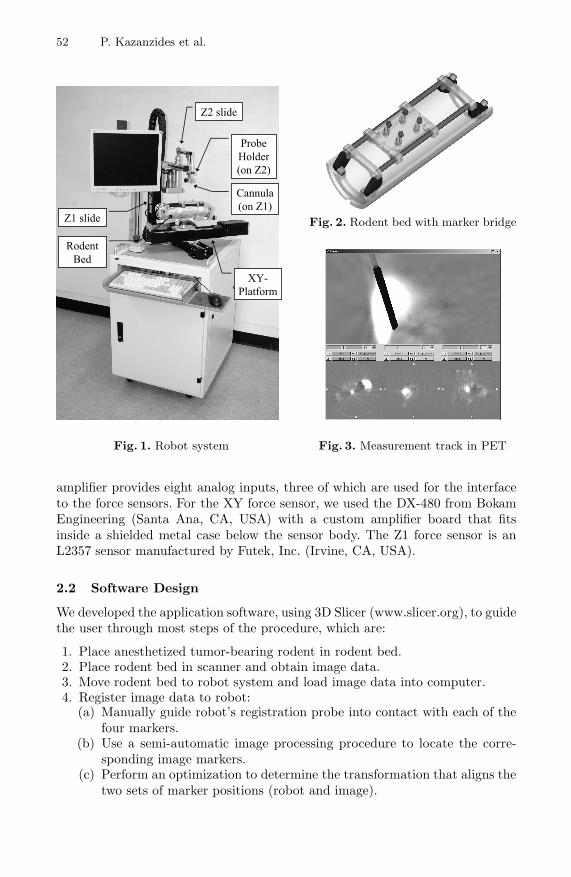
The rodent bed (Fig. 2) fits inside the limited bore of the small animal imag-ing scanners and mounts onto the robot X-Y platform. It includes markers forthe registration between image and robot coordinates. The markers are mountedon an adjustable bridge so that they can be positioned over the target region(tumor) and within the scanner field of view. The bridge is removed after regis-tration to enable access to the rodent. As shown in Fig. 2, we initially used theAcustar R© marker system[3], donated by Z-Kat Inc. (Hollywood, Florida, USA),for the CT, MRI and robot markers and a separate set of support tubes (offsetby a known amount) for the radioactive PET markers. We are currently usinga simpler marker system that consists of four small hemispheres (3 mm diam-eter), drilled into the adjustable bridge. These hemispheres are filled with anappropriate contrast agent prior to imaging. After imaging, the contrast agentis removed and the holes are physically located by the robot. For this procedure,the cannula is replaced by a registration probe, which is guided to the markersusing a force control mode[4]. Force control is possible because the system con-tains a two-axis sensor (XY) beneath the rodent bed and a single-axis sensor(Z1) near the attachment mechanism for the registration probe and cannula.
The robot controller consists of a rackmount computer connected via Ethernetto a DMC-2143 controller board and AMP-20540 power amplifier (Galil MotionControl, Rocklin, CA, USA). The controller provides low-level servo control ofthe four robot motors. Application software on the PC sends position goals viaEthernet to the controller, which then moves each joint to its goal. The power
52 P. Kazanzides et al.
XY-
Platform
Rodent
Bed
Z1 slide
Z2 slide
Cannula
(on Z1)
Probe
Holder
(on Z2)
Fig. 1. Robot system
Fig. 2. Rodent bed with marker bridge
Fig. 3. Measurement track in PET
amplifier provides eight analog inputs, three of which are used for the interfaceto the force sensors. For the XY force sensor, we used the DX-480 from BokamEngineering (Santa Ana, CA, USA) with a custom amplifier board that fitsinside a shielded metal case below the sensor body. The Z1 force sensor is anL2357 sensor manufactured by Futek, Inc. (Irvine, CA, USA).
2.2 Software Design
We developed the application software, using 3D Slicer (www.slicer.org), to guidethe user through most steps of the procedure, which are:
1. Place anesthetized tumor-bearing rodent in rodent bed.2. Place rodent bed in scanner and obtain image data.3. Move rodent bed to robot system and load image data into computer.4. Register image data to robot:
(a) Manually guide robot’s registration probe into contact with each of thefour markers.
(b) Use a semi-automatic image processing procedure to locate the corre-sponding image markers.
(c) Perform an optimization to determine the transformation that aligns thetwo sets of marker positions (robot and image).
Design and Validation of an Image-Guided Robot for Small Animal Research 53
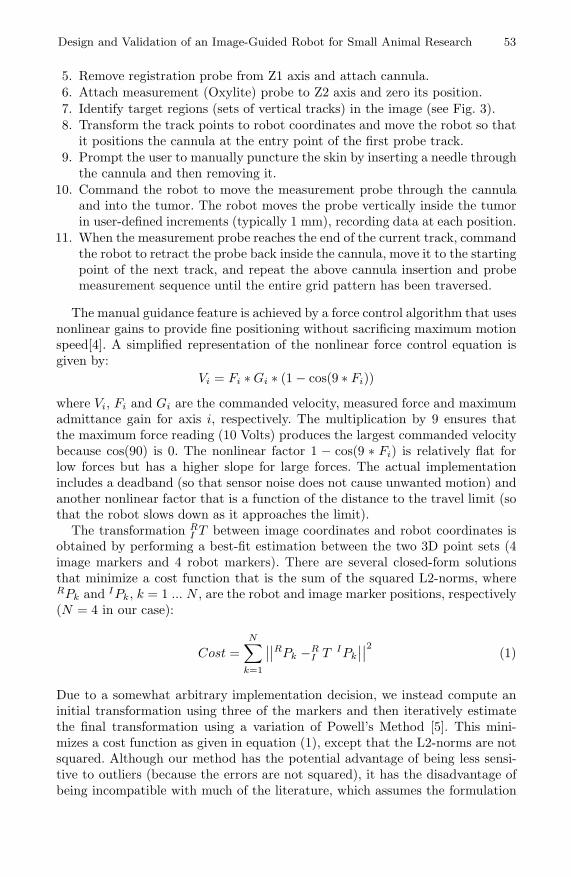
5. Remove registration probe from Z1 axis and attach cannula.6. Attach measurement (Oxylite) probe to Z2 axis and zero its position.7. Identify target regions (sets of vertical tracks) in the image (see Fig. 3).8. Transform the track points to robot coordinates and move the robot so that
it positions the cannula at the entry point of the first probe track.9. Prompt the user to manually puncture the skin by inserting a needle through
the cannula and then removing it.10. Command the robot to move the measurement probe through the cannula
and into the tumor. The robot moves the probe vertically inside the tumorin user-defined increments (typically 1 mm), recording data at each position.
11. When the measurement probe reaches the end of the current track, commandthe robot to retract the probe back inside the cannula, move it to the startingpoint of the next track, and repeat the above cannula insertion and probemeasurement sequence until the entire grid pattern has been traversed.
The manual guidance feature is achieved by a force control algorithm that usesnonlinear gains to provide fine positioning without sacrificing maximum motionspeed[4]. A simplified representation of the nonlinear force control equation isgiven by:
Vi = Fi ∗ Gi ∗ (1 − cos(9 ∗ Fi))
where Vi, Fi and Gi are the commanded velocity, measured force and maximumadmittance gain for axis i, respectively. The multiplication by 9 ensures thatthe maximum force reading (10 Volts) produces the largest commanded velocitybecause cos(90) is 0. The nonlinear factor 1 − cos(9 ∗ Fi) is relatively flat forlow forces but has a higher slope for large forces. The actual implementationincludes a deadband (so that sensor noise does not cause unwanted motion) andanother nonlinear factor that is a function of the distance to the travel limit (sothat the robot slows down as it approaches the limit).
The transformation RI T between image coordinates and robot coordinates is
obtained by performing a best-fit estimation between the two 3D point sets (4image markers and 4 robot markers). There are several closed-form solutionsthat minimize a cost function that is the sum of the squared L2-norms, whereRPk and IPk, k = 1 ... N , are the robot and image marker positions, respectively(N = 4 in our case):
Cost =N∑
k=1
∣∣∣∣RPk −RI T IPk
∣∣∣∣2 (1)
Due to a somewhat arbitrary implementation decision, we instead compute aninitial transformation using three of the markers and then iteratively estimatethe final transformation using a variation of Powell’s Method [5]. This mini-mizes a cost function as given in equation (1), except that the L2-norms are notsquared. Although our method has the potential advantage of being less sensi-tive to outliers (because the errors are not squared), it has the disadvantage ofbeing incompatible with much of the literature, which assumes the formulation
54 P. Kazanzides et al.
of equation (1). For example, the Fiducial Registration Error (FRE) is definedbased on the minimum value of equation (1):
FRE =
√√√√ 1N
N∑
k=1
∣∣∣∣RPk −RI Ti
IPk
∣∣∣∣2 (2)
To avoid confusion, the results of the phantom experiments reported in thenext section were computed (offline) using the standard technique describedby Arun[6] and modified by Umeyama[7], instead of the iterative technique. Inour testing, we noted minor differences between the registrations obtained withthese two methods and we intend to replace the iterative technique with thisclosed-form technique.
3 Phantom Experiments
We performed several tests using a phantom to evaluate the accuracy of theoverall system, as well as the accuracy of the major subsystem components(imaging system and robot). Following the terminology of [3], we focus on thefollowing categories of error:
Fiducial localization error (FLE): error in determining the position of amarker in image coordinates (FLE-I) or robot coordinates (FLE-R).
Target registration error (TRE): mean error for locating markers that werenot used for registration. This is most relevant to the application.
3.1 Phantom Design
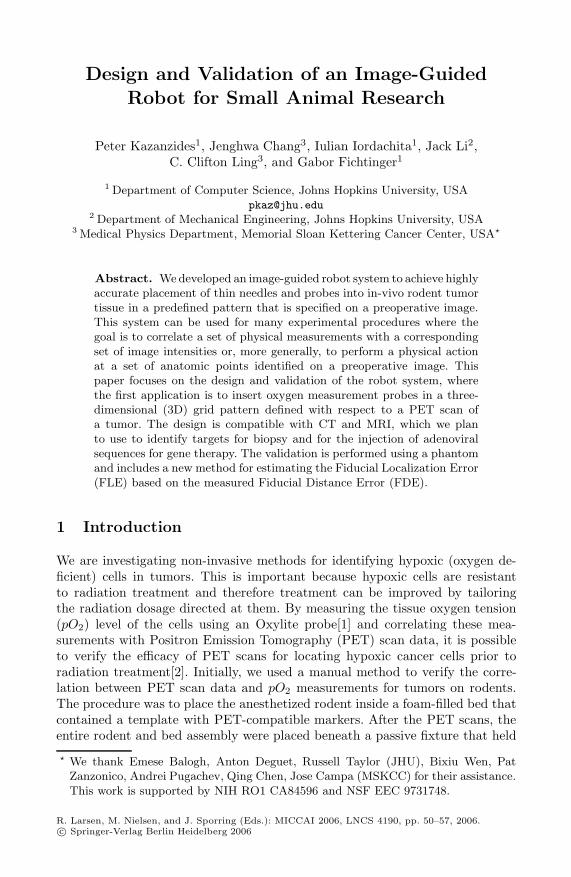
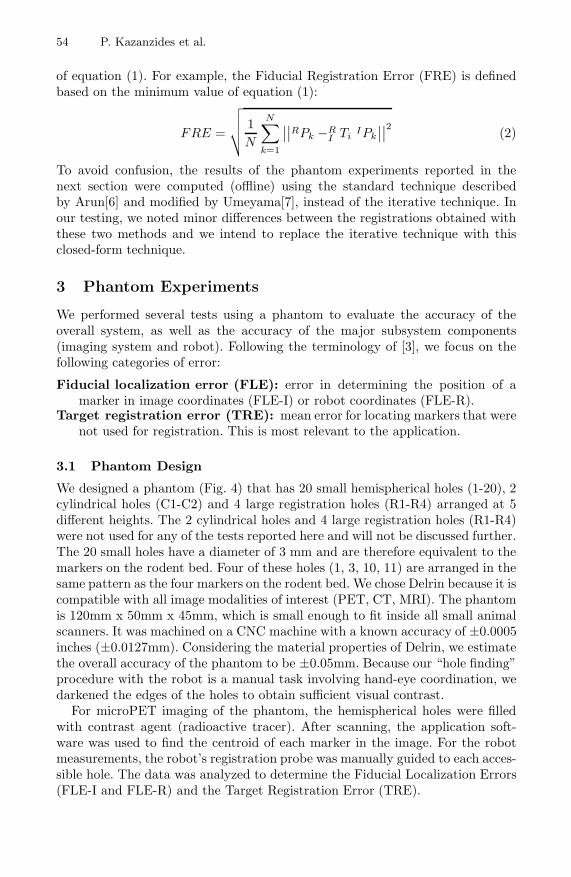
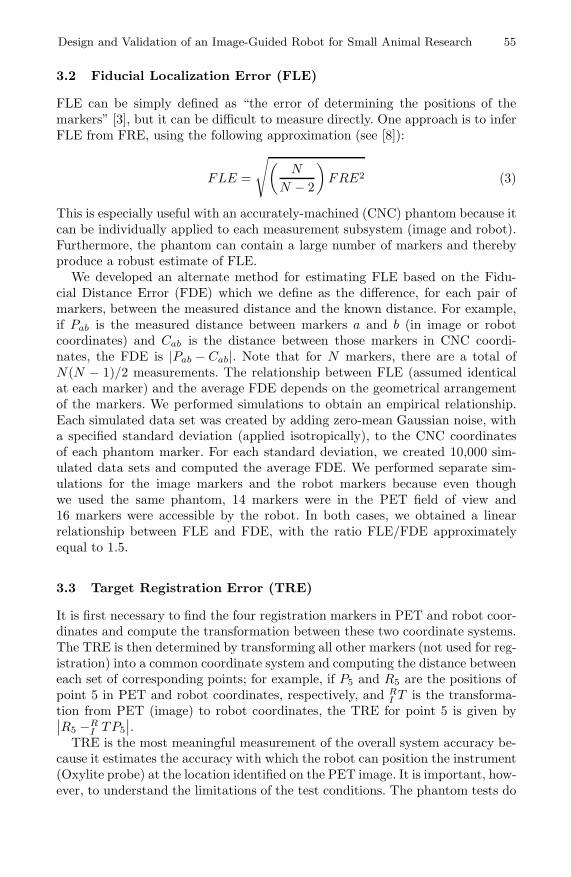
We designed a phantom (Fig. 4) that has 20 small hemispherical holes (1-20), 2cylindrical holes (C1-C2) and 4 large registration holes (R1-R4) arranged at 5different heights. The 2 cylindrical holes and 4 large registration holes (R1-R4)were not used for any of the tests reported here and will not be discussed further.The 20 small holes have a diameter of 3 mm and are therefore equivalent to themarkers on the rodent bed. Four of these holes (1, 3, 10, 11) are arranged in thesame pattern as the four markers on the rodent bed. We chose Delrin because it iscompatible with all image modalities of interest (PET, CT, MRI). The phantomis 120mm x 50mm x 45mm, which is small enough to fit inside all small animalscanners. It was machined on a CNC machine with a known accuracy of ±0.0005inches (±0.0127mm). Considering the material properties of Delrin, we estimatethe overall accuracy of the phantom to be ±0.05mm. Because our “hole finding”procedure with the robot is a manual task involving hand-eye coordination, wedarkened the edges of the holes to obtain sufficient visual contrast.
For microPET imaging of the phantom, the hemispherical holes were filledwith contrast agent (radioactive tracer). After scanning, the application soft-ware was used to find the centroid of each marker in the image. For the robotmeasurements, the robot’s registration probe was manually guided to each acces-sible hole. The data was analyzed to determine the Fiducial Localization Errors(FLE-I and FLE-R) and the Target Registration Error (TRE).
Design and Validation of an Image-Guided Robot for Small Animal Research 55
3.2 Fiducial Localization Error (FLE)
FLE can be simply defined as “the error of determining the positions of themarkers” [3], but it can be difficult to measure directly. One approach is to inferFLE from FRE, using the following approximation (see [8]):
FLE =
√(N
N − 2
)FRE2 (3)
This is especially useful with an accurately-machined (CNC) phantom because itcan be individually applied to each measurement subsystem (image and robot).Furthermore, the phantom can contain a large number of markers and therebyproduce a robust estimate of FLE.
We developed an alternate method for estimating FLE based on the Fidu-cial Distance Error (FDE) which we define as the difference, for each pair ofmarkers, between the measured distance and the known distance. For example,if Pab is the measured distance between markers a and b (in image or robotcoordinates) and Cab is the distance between those markers in CNC coordi-nates, the FDE is |Pab − Cab|. Note that for N markers, there are a total ofN(N − 1)/2 measurements. The relationship between FLE (assumed identicalat each marker) and the average FDE depends on the geometrical arrangementof the markers. We performed simulations to obtain an empirical relationship.Each simulated data set was created by adding zero-mean Gaussian noise, witha specified standard deviation (applied isotropically), to the CNC coordinatesof each phantom marker. For each standard deviation, we created 10,000 sim-ulated data sets and computed the average FDE. We performed separate sim-ulations for the image markers and the robot markers because even thoughwe used the same phantom, 14 markers were in the PET field of view and16 markers were accessible by the robot. In both cases, we obtained a linearrelationship between FLE and FDE, with the ratio FLE/FDE approximatelyequal to 1.5.
3.3 Target Registration Error (TRE)
It is first necessary to find the four registration markers in PET and robot coor-dinates and compute the transformation between these two coordinate systems.The TRE is then determined by transforming all other markers (not used for reg-istration) into a common coordinate system and computing the distance betweeneach set of corresponding points; for example, if P5 and R5 are the positions ofpoint 5 in PET and robot coordinates, respectively, and R
I T is the transforma-tion from PET (image) to robot coordinates, the TRE for point 5 is given by∣∣R5 −R
I TP5∣∣.
TRE is the most meaningful measurement of the overall system accuracy be-cause it estimates the accuracy with which the robot can position the instrument(Oxylite probe) at the location identified on the PET image. It is important, how-ever, to understand the limitations of the test conditions. The phantom tests do

56 P. Kazanzides et al.
not include errors due to instrument compliance/bending or to the motion ofthe target (tumor). In the case of the fiber-optic Oxylite probe, the error dueto bending can be significant. Furthermore, the TRE value does not include anyerror due to the tool drive axis (Z2).
4 Results
The hemispherical markers in the phantom were filled with 5 μl of 18F-FDG (26.5μCi). Only 14 markers (1-14) were visible in the microPET scanner’s limited fieldof view. On the robot, it proved to be too difficult to see the 4 deepest markers(2, 7, 13, 17) and therefore they were eliminated from the testing.
4.1 PET Image Fiducial Localization Error (FLE-I)
One microPET scan of the phantom was acquired and the application softwarewas used to find all 14 imaging markers (filled holes) in the field of view. Weused a corrected value (1.229 mm) for the PET slice spacing that had beenexperimentally determined during earlier testing.
The 14 markers resulted in 91 computed distance errors and yielded an FDE-Iof 0.172 ±0.121 mm (mean ± standard deviation). The largest distance errorwas 0.497 mm. Our simulations produced the empirical relationship FLE-I =1.49*FDE-I, which estimates FLE-I to be 0.26 mm.
For comparison, we applied the standard least-squares registration technique[6][7] to all 14 imaging markers. The resulting FRE was 0.236 mm, which ac-cording to equation (3), with N = 14, estimates FLE-I to be 0.26 mm.
4.2 Robot Fiducial Localization Error (FLE-R)
The robot was used to locate the 16 accessible markers in three different trials.Each trial yielded 120 computed distance errors, with an FDE-R value (over allthree trials) of 0.121 ± 0.096 mm (mean ± standard deviation). The largest dis-tance error was 0.455 mm. Our simulations produced the empirical relationshipFLE-R = 1.51*FDE-R, which estimates FLE-R to be 0.18 mm.
Once again, we compared our result to the one obtained by applying equation(3) to the FRE from the least-squares registration of all 16 markers. For the dataobtained from the three trials, the FRE was 0.168, 0.127, and 0.117 mm, for amean value of 0.137 mm. This estimates FLE-R to be 0.15 mm.
4.3 Target Registration Error (TRE)
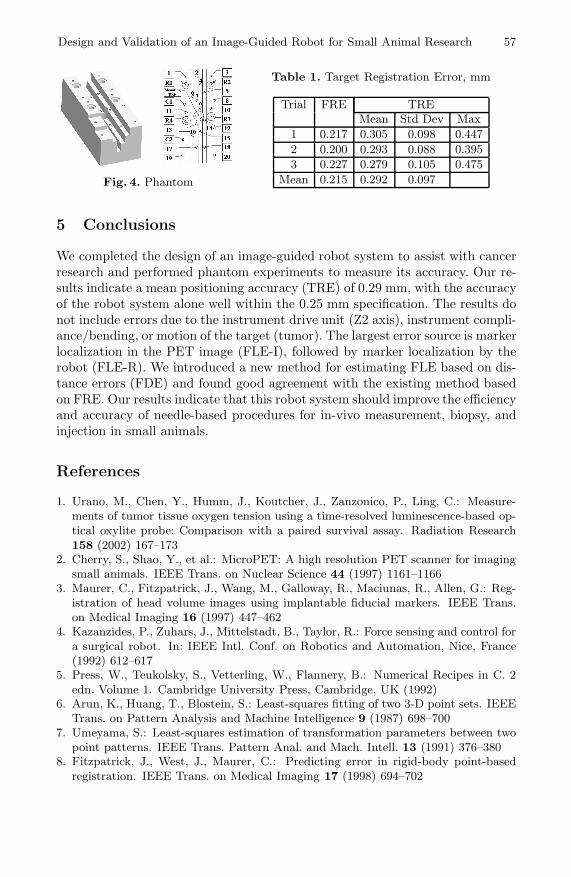
There were 11 markers, including all 4 reference markers, that were found in thePET image and by the robot. Therefore, it was possible to register the PET dataset to each of the 3 robot data sets and compute TRE for the 7 target markers(see Table 1).
Design and Validation of an Image-Guided Robot for Small Animal Research 57
Fig. 4. Phantom
Table 1. Target Registration Error, mm
Trial FRE TREMean Std Dev Max
1 0.217 0.305 0.098 0.4472 0.200 0.293 0.088 0.3953 0.227 0.279 0.105 0.475
Mean 0.215 0.292 0.097
5 Conclusions
We completed the design of an image-guided robot system to assist with cancerresearch and performed phantom experiments to measure its accuracy. Our re-sults indicate a mean positioning accuracy (TRE) of 0.29 mm, with the accuracyof the robot system alone well within the 0.25 mm specification. The results donot include errors due to the instrument drive unit (Z2 axis), instrument compli-ance/bending, or motion of the target (tumor). The largest error source is markerlocalization in the PET image (FLE-I), followed by marker localization by therobot (FLE-R). We introduced a new method for estimating FLE based on dis-tance errors (FDE) and found good agreement with the existing method basedon FRE. Our results indicate that this robot system should improve the efficiencyand accuracy of needle-based procedures for in-vivo measurement, biopsy, andinjection in small animals.
References
1. Urano, M., Chen, Y., Humm, J., Koutcher, J., Zanzonico, P., Ling, C.: Measure-ments of tumor tissue oxygen tension using a time-resolved luminescence-based op-tical oxylite probe: Comparison with a paired survival assay. Radiation Research158 (2002) 167–173
2. Cherry, S., Shao, Y., et al.: MicroPET: A high resolution PET scanner for imagingsmall animals. IEEE Trans. on Nuclear Science 44 (1997) 1161–1166
3. Maurer, C., Fitzpatrick, J., Wang, M., Galloway, R., Maciunas, R., Allen, G.: Reg-istration of head volume images using implantable fiducial markers. IEEE Trans.on Medical Imaging 16 (1997) 447–462
4. Kazanzides, P., Zuhars, J., Mittelstadt, B., Taylor, R.: Force sensing and control fora surgical robot. In: IEEE Intl. Conf. on Robotics and Automation, Nice, France(1992) 612–617
5. Press, W., Teukolsky, S., Vetterling, W., Flannery, B.: Numerical Recipes in C. 2edn. Volume 1. Cambridge University Press, Cambridge, UK (1992)
6. Arun, K., Huang, T., Blostein, S.: Least-squares fitting of two 3-D point sets. IEEETrans. on Pattern Analysis and Machine Intelligence 9 (1987) 698–700
7. Umeyama, S.: Least-squares estimation of transformation parameters between twopoint patterns. IEEE Trans. Pattern Anal. and Mach. Intell. 13 (1991) 376–380
8. Fitzpatrick, J., West, J., Maurer, C.: Predicting error in rigid-body point-basedregistration. IEEE Trans. on Medical Imaging 17 (1998) 694–702