Embed Size (px)
Citation preview
Department of Fisheries, Bangladesh Ministry of Fisheries and Livestock
Yearbook of Fisheries Statistics of Bangladesh (July 2015 - June 2016)
Volume: 33 Published: April 2017 Published by : Syed Arif Azad
Director General Department of Fisheries, Bangladesh
Cover design: FRSS and ICT Section of DoF
Printed by: BG Press Any individual or institution can use the information for referral use of publication with acknowledgement. The Yearbook can be collected from Matshya Bhaban, Ramna, Dhaka free of cost. Website: http://www.fisheries.gov.bd Citation: FRSS, 2017. Yearbook of Fisheries Statistics of Bangladesh. Fisheries Resources Survey System (FRSS), Department of Fisheries, Bangladesh. Volume 33: 124 p.
YEARBOOK OF FISHERIES STATISTICS OF BANGLADESH
2015-16
Editorial Panel
Sk. Mustafizur Rahman
Principal Scientific Officer Department of Fisheries
Convener
Farida Begum Deputy Director (Dhaka Division) Department of Fisheries
Member
Md. Guljar Hossain Deputy Director (Aquaculture) Department of Fisheries
Member
Quazi Shams Afroz Deputy Director (Shrimp) Department of Fisheries
Member
Ferdous Ahmed Deputy Chief (Marine) Department of Fisheries
Member
A B M Anwarul Islam National Project Director, BMFCB Project Department of Fisheries
Member
Md. Arifur Rahman Tarafder PD, ID Card Project Department of Fisheries
Member
Dr. Mohd. Sainar Alam District Fisheries Officer (Reserve) Department of Fisheries
Member
Md. Alamgir Hossain Deputy Director Bangladesh Bureau of Statistics
Member
Dr. G. M. Shamsul Kabir Assistant Chief Department of Fisheries
Member Secretary
YEARBOOK OF FISHERIES STATISTICS
OF
BANGLADESH
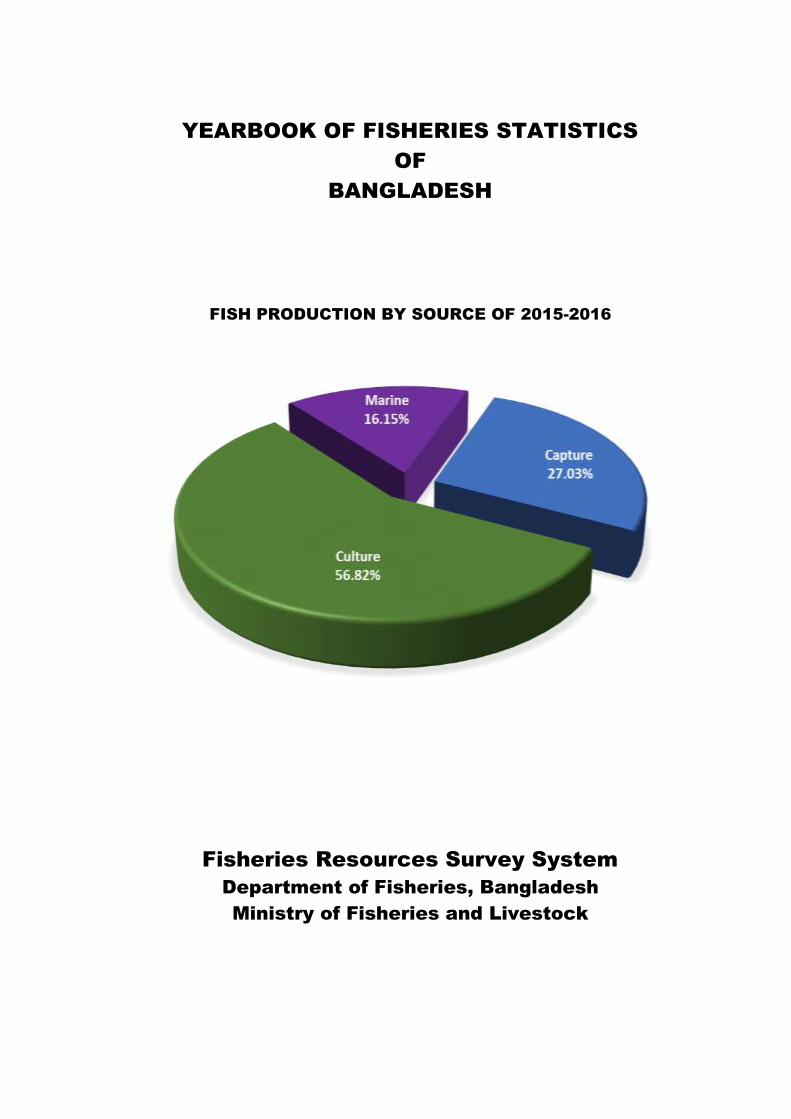
FISH PRODUCTION BY SOURCE OF 2015-2016
Fisheries Resources Survey System
Department of Fisheries, Bangladesh
Ministry of Fisheries and Livestock

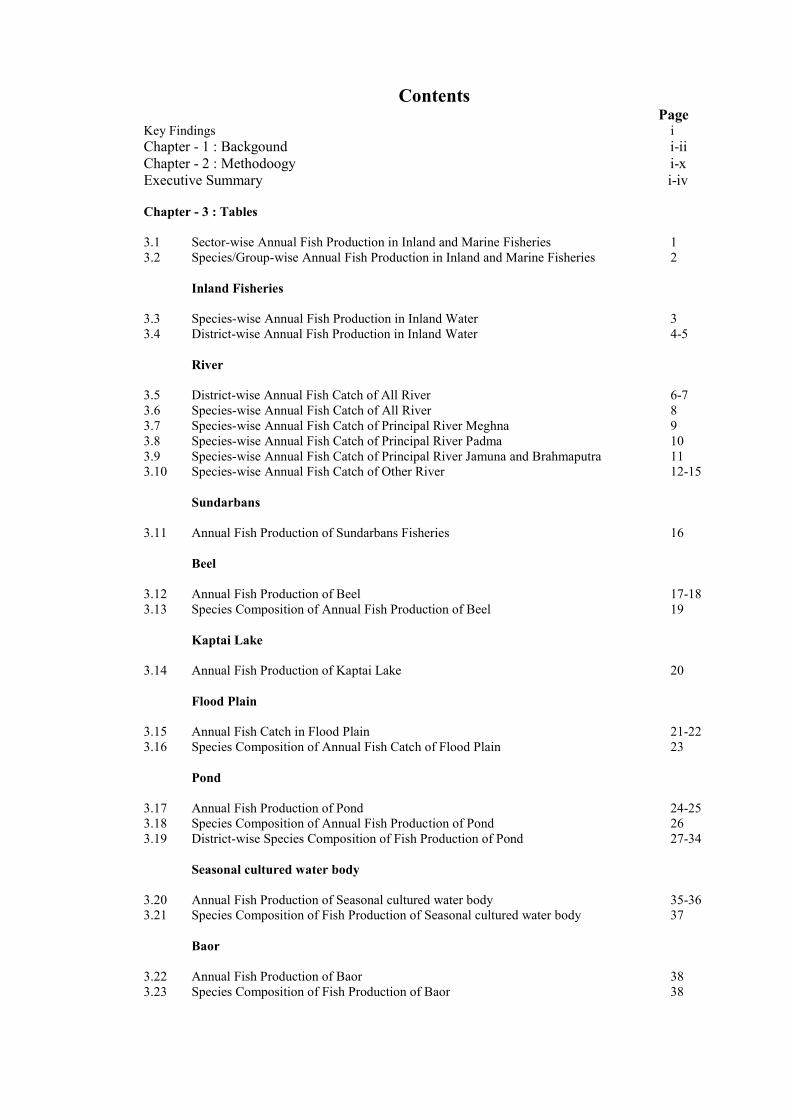
Contents Page
Key Findings i Chapter - 1 : Backgound i-ii Chapter - 2 : Methodoogy i-x Executive Summary i-iv
Chapter - 3 : Tables
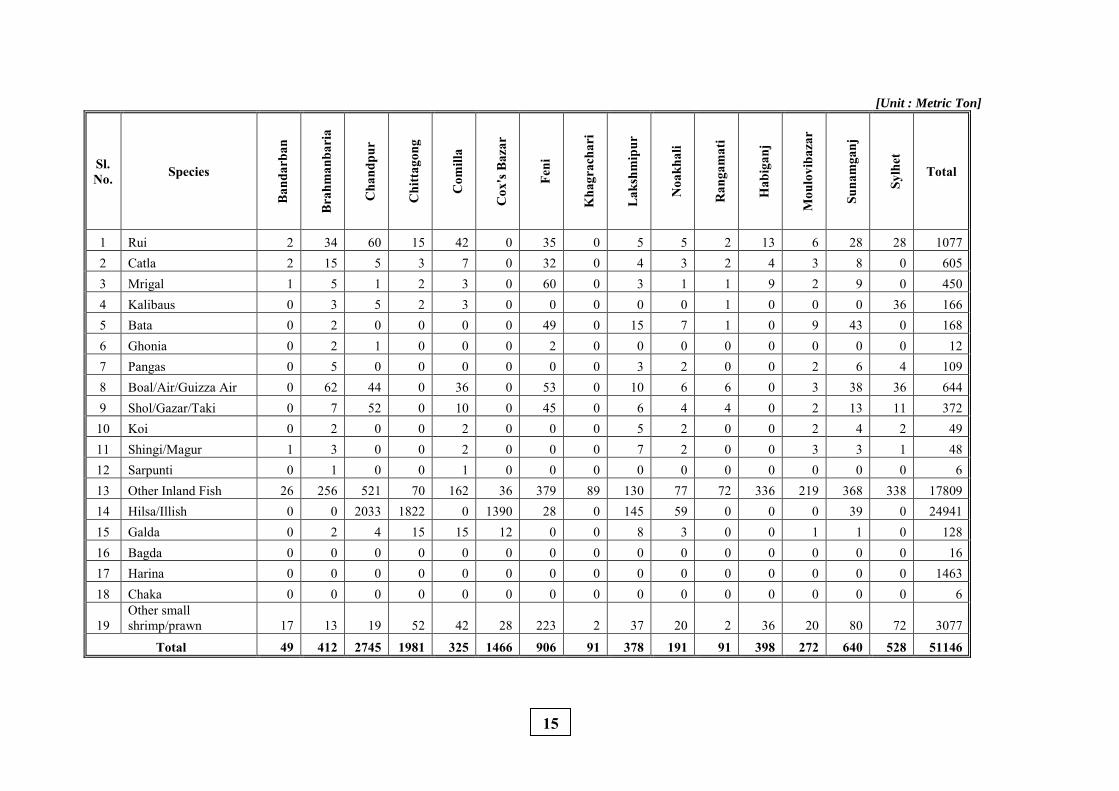
3.1 Sector-wise Annual Fish Production in Inland and Marine Fisheries 1 3.2 Species/Group-wise Annual Fish Production in Inland and Marine Fisheries 2 Inland Fisheries 3.3 Species-wise Annual Fish Production in Inland Water 3 3.4 District-wise Annual Fish Production in Inland Water 4-5 River 3.5 District-wise Annual Fish Catch of All River 6-7 3.6 Species-wise Annual Fish Catch of All River 8 3.7 Species-wise Annual Fish Catch of Principal River Meghna 9 3.8 Species-wise Annual Fish Catch of Principal River Padma 10 3.9 Species-wise Annual Fish Catch of Principal River Jamuna and Brahmaputra 11 3.10 Species-wise Annual Fish Catch of Other River 12-15 Sundarbans
3.11 Annual Fish Production of Sundarbans Fisheries 16 Beel
3.12 Annual Fish Production of Beel 17-18 3.13 Species Composition of Annual Fish Production of Beel 19
Kaptai Lake
3.14 Annual Fish Production of Kaptai Lake 20 Flood Plain 3.15 Annual Fish Catch in Flood Plain 21-22 3.16 Species Composition of Annual Fish Catch of Flood Plain 23 Pond 3.17 Annual Fish Production of Pond 24-25 3.18 Species Composition of Annual Fish Production of Pond 26 3.19 District-wise Species Composition of Fish Production of Pond 27-34 Seasonal cultured water body 3.20 Annual Fish Production of Seasonal cultured water body 35-36 3.21 Species Composition of Fish Production of Seasonal cultured water body 37 Baor 3.22 Annual Fish Production of Baor 38 3.23 Species Composition of Fish Production of Baor 38
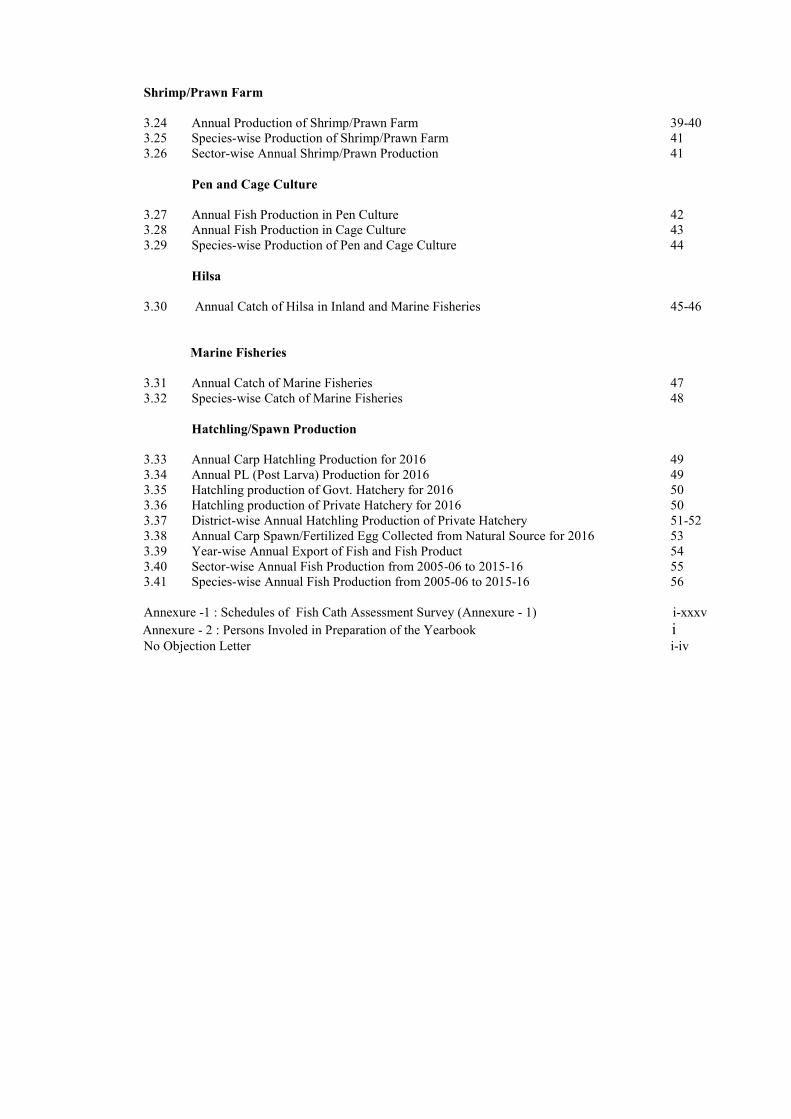
Shrimp/Prawn Farm
3.24 Annual Production of Shrimp/Prawn Farm 39-40 3.25 Species-wise Production of Shrimp/Prawn Farm 41 3.26 Sector-wise Annual Shrimp/Prawn Production 41 Pen and Cage Culture 3.27 Annual Fish Production in Pen Culture 42 3.28 Annual Fish Production in Cage Culture 43 3.29 Species-wise Production of Pen and Cage Culture 44 Hilsa 3.30 Annual Catch of Hilsa in Inland and Marine Fisheries 45-46
Marine Fisheries
3.31 Annual Catch of Marine Fisheries 47 3.32 Species-wise Catch of Marine Fisheries 48 Hatchling/Spawn Production 3.33 Annual Carp Hatchling Production for 2016 49 3.34 Annual PL (Post Larva) Production for 2016 49
3.35 Hatchling production of Govt. Hatchery for 2016 50 3.36 Hatchling production of Private Hatchery for 2016 50 3.37 District-wise Annual Hatchling Production of Private Hatchery 51-52 3.38 Annual Carp Spawn/Fertilized Egg Collected from Natural Source for 2016 53
3.39 Year-wise Annual Export of Fish and Fish Product 54 3.40 Sector-wise Annual Fish Production from 2005-06 to 2015-16 55 3.41 Species-wise Annual Fish Production from 2005-06 to 2015-16 56
Annexure -1 : Schedules of Fish Cath Assessment Survey (Annexure - 1) i-xxxv Annexure - 2 : Persons Involed in Preparation of the Yearbook i No Objection Letter i-iv
Key Findings
Sector of Fisheries 2015-16 2014-15
Prod. increase
Growth
Rate % Water Area (Ha)
Prod. (MT)
Productivity Kg/ Ha)
Water Area (Ha)
Prod. (MT)
Productivity (Kg/ Ha)
i) Inland Open Water (Capture) 3918608 1048242 268 3906434 1023991 262 24251 2.37 1. River and Estuary 853863 178458 209 853863 174878 205 3580 2.05
2. Sundarbans 177700 16870 95 177700 17580 99 -710 (-) 4.03
3. Beel
(a) Natural 101492 81338 801 101621 79358 781 1980 2.50
(b) Beel Nursery 12669 14115 1114 12540 13320 1062 795 5.96
Beel Total 114161 95453 836 114161 92676 812 2777 3.00
4. Kaptai Lake 68800 9589 139 68800 8645 126 944 10.92
5. Floodplain
(a) Subsistance Fisheries 2317175 611334 264 2317175 600876 259 10458 1.74
(b) Fry Released Program 158086 43121 273 145912 40478 277 2643 6.53
(c) Haor 228823 93417 408 228823 88856 388 4561 5.13
Floodplain Total 2704084 747872 276 2691910 730210 271 17662 2.42
ii) Inland Close Water (Culture) 795841 2203554 2877 794361 2060408 2594 143146 6.94
6. Pond 372405 1719783 4618 372397 1613240 4332 106543 6.61
7. Seasonal cultured waterbody
(a) Paddy Field/Floodplain 126329 193191 1529 124868 187073 1498 6118 3.27
(b) Boropit 8547 14467 1692 8462 14207 1679 260 1.83
Seasonal waterbody Total 134876 207658 1539 133330 201280 1510 6378 3.17
8. Baor 5488 7729 1408 5488 7267 1324 462 6.36
9. Shrimp/Prawn Farm
(a) Shrimp/Prawn Production 125699 456 126077 457 (-) 378 (-) 0.30
(b) Fish Production 114099 414 97505 354 16594 17.02
Shirimp Farm Total 275509 239798 870 275583 223582 811 16216 7.25
(c) Crab* 19408 13160 678 -- -- -- -- --
10. Pen Culture 7553 13364 1769 7553 13070 1730 294 2.24
11. Cage Culture 10 2062 21
kg/cum 10 1969 20
kg/cum 93 4.72
iii) Marine Fisheries -- 626528 --
-- 599846 --
26682 4.49
12. Industrial 105348
84846
20502 24.16
13. Artisanal 521180
515000
6180 1.20
Total Fish Production 3878324 3684245 194079
5.27
* Crab area is included with Shrimp farm area.
Species 2015-16 2014-15 Prod. Increase
Growth Rate (%)
Hilsa Production (MT) 394951 387211 7740 2.01 Shrimp/Prawn Production (MT) 234188 230244 3944 1.71 Hatchling Production (Kg) 614433 551910 62523 11.33 PL Production (Core) 1318.85 1248.18 70.67 5.66
i
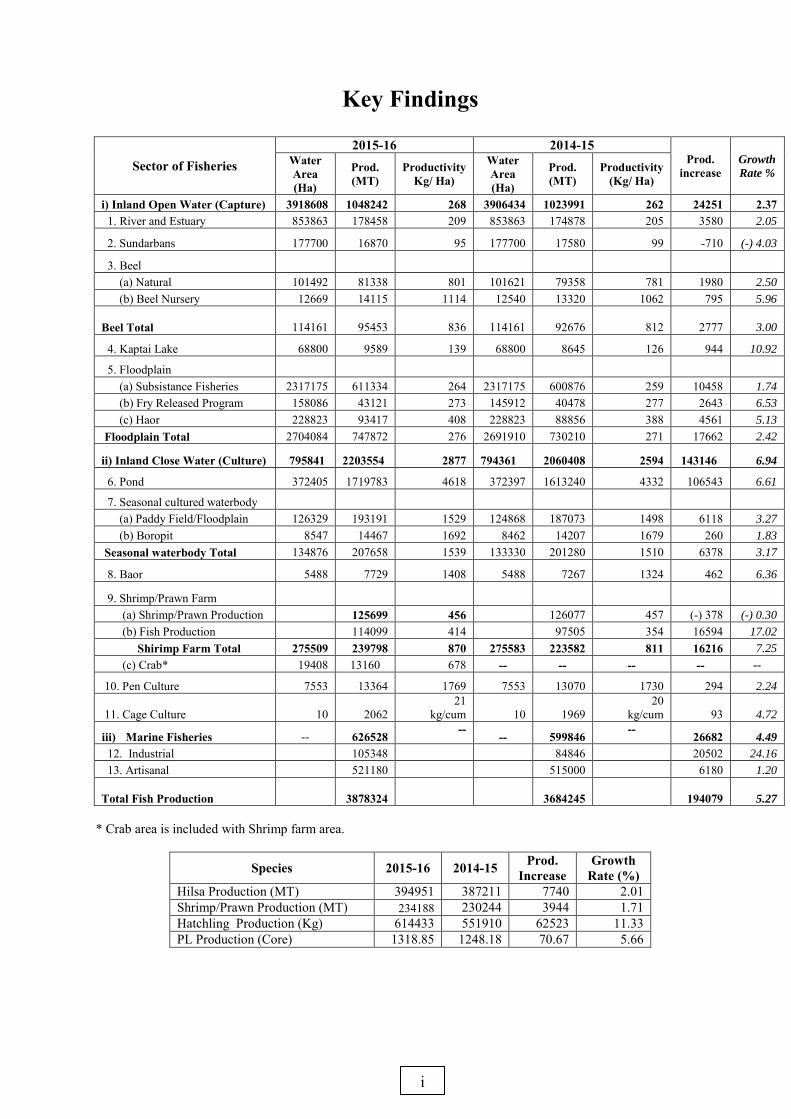
Key Findings Bangladesh is one of the world's leading fish producing countries with a total production of 38.78 lakh MT in 2015-16, where as inland open water (capture) contributes 27.03 percent (10.48 lakh MT) and inland closed water (culture) contributes 56.82 percent (22.04 lakh MT) to total production. So, 83.85 percent of total production comes from inland fisheries. The growth rates of inland capture and inland culture are 2.37 and 6.94 percent respectively. On the other hand, Marine fisheries production is 6.26 lakh MT and its contribution to total fish production is 16.15 percent with growth rate 4.49 percent. Overall growthrate of total fish production in 2015-16 is 5.27 percent.The overall growth performance from inland aquaculture shows a moderate increased trend. The fish production has increased more than five times (7.54 MT in 1983-84 to 38.78 lakh MT in 2015-16) over the last three decades. The fish production divesity of fishries resources of inland open water fisheries of river, beel, floodplain and Kaptai lake in 2015-16 are 1.78 lakh MT, 0.95 lakh MT, 17.48 lakh MT and 0.09 lakh MT respectively and corresponding growth rates are 2.05, 3.00, 2.42 and 10.92 percent respectively. The respective contributions to total production are 4.60, 2.46, 19.28 and 0.25 percent. Fish production has been incresed compare to previuos year. But the production of Sundarbans fishery has decreased comparatively, its contribution is 0.43 percent to total production and consequently its growth rate is (-) 4.03 percent. The fish production (aquaculture) in 2015-16 of pond, seasoal cultured waterbody, baor, shrimp farm, pen culture, cage culture (inland closed waterbod-culture) are 17.19 lakh MT, 2.07 lakh MT, 0.07 lakh MT, 2.39 lakh MT, 0.13 lakh MT, 0.14 lakh MT respectively. Subsequently, the corresponding contribution to total production are 44.34, 5.35, 0.20 6.18, 0.34 and 0.05 percent respectively. The correponding growth rates are 6.61, 3.17, 6.36, 7.25, 2.24 and 4.72 percent respectively. Crab production is 0.13 lakh MT which is included first time in this yearbook. The aquaculture production became more than double (9.19 lakh MT in 2005-06 to 22.04 lakh MT in 2015-16) during the last ten years. The overall growth performance from inland aquaculture shows a moderate and creditable increasing trend.
In 1983-84, the contribution of inland capture and culture fisheries to total fish production were 62.59 percent and 15.53 percent respectively; whereas in 2015-16, inland capture fisheries contributes only 27.03 percent and inland culture fisheries contributes 56.82 percent to total fish production. A slight growth in the production from both inland capture and marine fisheries was also noticed during the recent past years with some exceptions. Hilsa (Ilish) is the national fish of Bangladesh. More than 10.18 percent of the country’s total fish production comes from hilsa. As a result, hilsa production increased from 1.99 lakh MT in 2003-04 to 3.95 lakh MT in 2015-16. The growth rate of hilsa production is 2.07 percent. Shrimp is one of the major export items in Bangladesh. Total shrimp and prawn production including capture has been increased from 1.60 lakh MT in 2002-03 to 2.34 lakh MT in 2015-16 and its growth rate is 1.71. This yearbook of fisheries statistics is published with the objective of providing necessary and precise fisheries production information facilitating resource based fisheries planning by the related organizations.
ii
CHAPTER -1
Background :
Fisheries in Bangladesh have both prospects and challenges. Fisheries sector represents one of the most productive and dynamic sectors in Bangladesh. The fisheries sector of Bangladesh is playing an incresingly important role in the economy for the last few decades. Bangladesh has achieved remarkable progress in the fisheries sector since it s independence in 1971. Fisheries sector is contributing a very significant role in the socio-economic development and deserve potential for future development in the agrarian economy of Bangladesh. This sector represents one of the most productive and dynamic sectors in Bangladesh. It contributes 3.65 percent to our national GDP and around one-fourth (23.81 percent) to the agricultural GDP. Bangladesh is blessed with vast and rich fisheries resources. The diversified fisheries resources of the country are divided into two groups as Inland and Marine fisheries. Inland fisheries has two sub sectors as Inland Capture and Inland Culture fisheries. Inland Capture fisheries comprises with river and estuaries, beels, floodplain, Sundarbans and Kaptai lake. On other hand, Inland Culture fisheries includes pond, seasonal cutured waterbody, baor, shrimp/prawn farm, crab, pen culture, cage culture. Again, Marine fisheries includes industrial (Trawl) and artisanal fisheries. Yearbook of Fisheries Statistics of Bangladesh, 2015-16 is designed to provide statistical information of diversified fisheries resources and their contribution in fisheries production in Bangladesh. It represents the brief compilation of statistics of fish production of different sub-sectors of fisheries resources prepared by Department of Fisheries. Department of fisheries is conducting catch assessment survey for Inland (Capture & Culture) and Marine fisheries. Department of Fisheries (DoF) Bangladesh usually produces the yearbook for unique yearly publication since 1983. This is the 33th annual publication of Department of Fisheries containing updated fisheries statistical accurate information on different sources of fisheries production in Bangladesh.This yearbook represents detailed yearly fisheries production information of Bangladesh of 2015-16 which is reliable and authentic one. Considering the importance, Department of Fisheries tried to furnish the latest information on different areas of fisheries production in Bangladesh. Crab production has been included this year. The data accumulated in this publication has been collected in various ways, such as field survey, fish landing records, data from DoF field offices, reports of different projects of DoF and statistics of other concerned departments. Strong supervision and monitoring has been done for reliability and accuracy of the data. The valuable feedback from other concerned agencies and persons has been accounted during the processing. The collected information has been presented in the simplest way in this publication after necessary analysis and scrutiny. The production of fish and shellfish from different waterbodies or fisheries resources has been presented on account of country, division and district basis. The comparison of fish production of different years from various resources has also added. Bangladesh fisheries have ample scope of development to strengthen the national economy. Accurate fisheries statistical information is prerequisite for the better planning. This fisheries statistical yearbook is published with the objective of providing necessary and precise fisheries production information facilitating resource based fisheries planning by the related organizations. .
i
Objective of the Yearbook :
To estimate total fish production of different fisheries resources/sectors of Bangladesh. To compile fish production area wise (district wise). To compile production species wise. To provide official statistics of fish production to fisheries professionals, planners,
decision makers, researchers, government agencies, non-government agencies, private entreprenuurs, different agencies, development partners and other relevant key stakeholders of fisheries sector.
To use production information for national, regional and global fisheries development and management planning.
To provide fisheries production information to facilitate planning for resource based fisheries by the releted different stakeholders.
Scope:
Proper planning for better improvement of fishries resources. Information dissemination and sharing. Action plan to be taken. Fisheries development strategy.
Limitation : The sampling frame was done in 1985 and data is being processed on the basis of this frame survey. It may lead in different estimation from the actual production.
ii
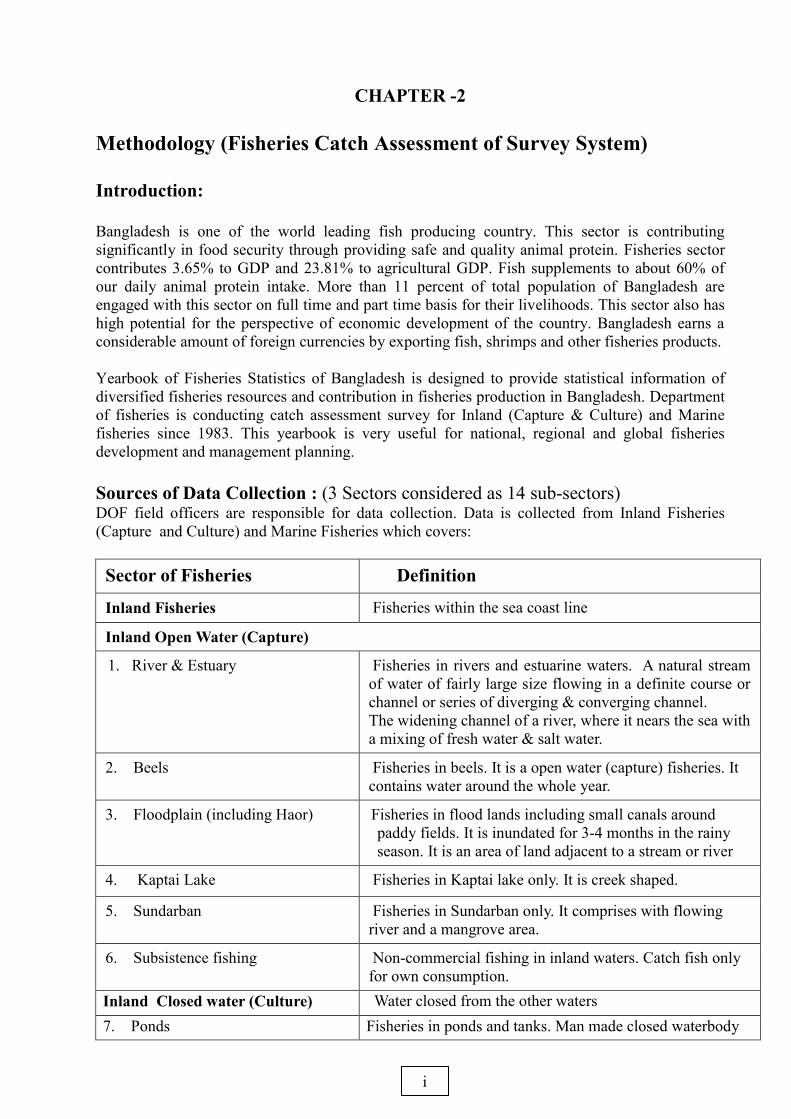
CHAPTER -2 Methodology (Fisheries Catch Assessment of Survey System) Introduction: Bangladesh is one of the world leading fish producing country. This sector is contributing significantly in food security through providing safe and quality animal protein. Fisheries sector contributes 3.65% to GDP and 23.81% to agricultural GDP. Fish supplements to about 60% of our daily animal protein intake. More than 11 percent of total population of Bangladesh are engaged with this sector on full time and part time basis for their livelihoods. This sector also has high potential for the perspective of economic development of the country. Bangladesh earns a considerable amount of foreign currencies by exporting fish, shrimps and other fisheries products. Yearbook of Fisheries Statistics of Bangladesh is designed to provide statistical information of diversified fisheries resources and contribution in fisheries production in Bangladesh. Department of fisheries is conducting catch assessment survey for Inland (Capture & Culture) and Marine fisheries since 1983. This yearbook is very useful for national, regional and global fisheries development and management planning. Sources of Data Collection : (3 Sectors considered as 14 sub-sectors) DOF field officers are responsible for data collection. Data is collected from Inland Fisheries (Capture and Culture) and Marine Fisheries which covers:
Sector of Fisheries Definition
Inland Fisheries Fisheries within the sea coast line
Inland Open Water (Capture)
1. River & Estuary Fisheries in rivers and estuarine waters. A natural stream of water of fairly large size flowing in a definite course or channel or series of diverging & converging channel. The widening channel of a river, where it nears the sea with a mixing of fresh water & salt water.
2. Beels Fisheries in beels. It is a open water (capture) fisheries. It contains water around the whole year.
3. Floodplain (including Haor) Fisheries in flood lands including small canals around paddy fields. It is inundated for 3-4 months in the rainy season. It is an area of land adjacent to a stream or river
4. Kaptai Lake Fisheries in Kaptai lake only. It is creek shaped.
5. Sundarban Fisheries in Sundarban only. It comprises with flowing river and a mangrove area.
6. Subsistence fishing Non-commercial fishing in inland waters. Catch fish only for own consumption.
Inland Closed water (Culture) Water closed from the other waters 7. Ponds Fisheries in ponds and tanks. Man made closed waterbody
i
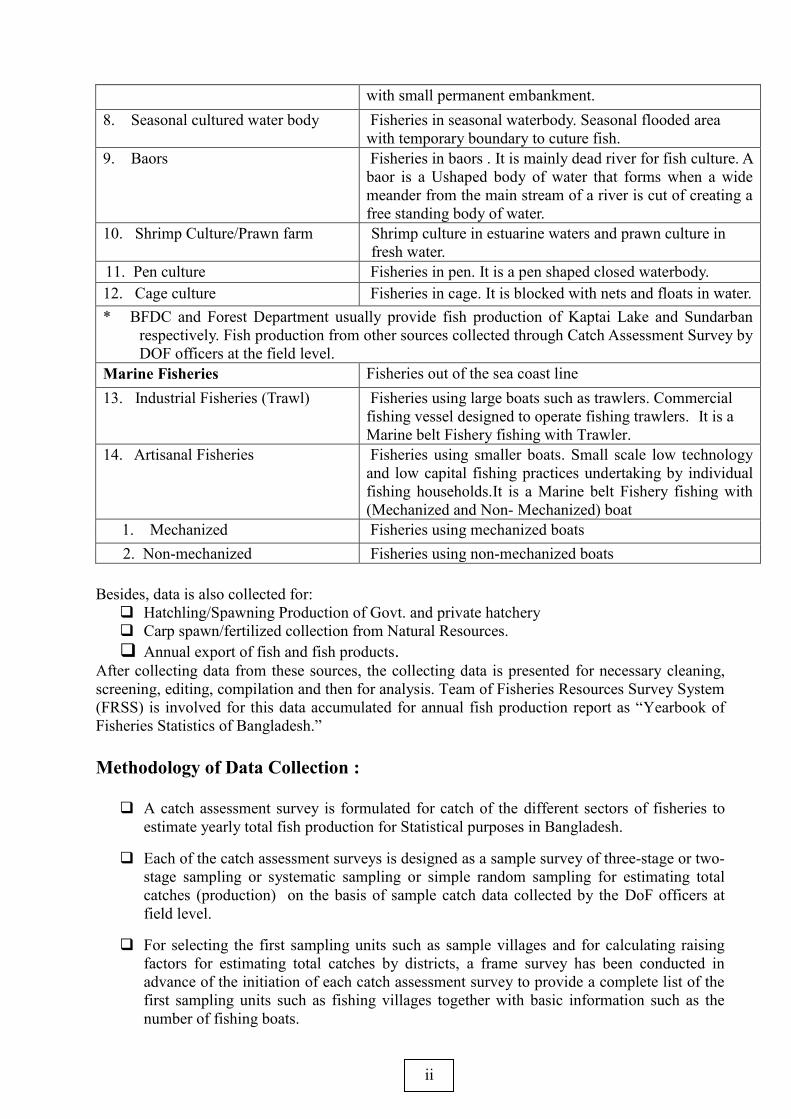
with small permanent embankment. 8. Seasonal cultured water body Fisheries in seasonal waterbody. Seasonal flooded area
with temporary boundary to cuture fish. 9. Baors Fisheries in baors . It is mainly dead river for fish culture. A
baor is a Ushaped body of water that forms when a wide meander from the main stream of a river is cut of creating a free standing body of water.
10. Shrimp Culture/Prawn farm Shrimp culture in estuarine waters and prawn culture in fresh water.
11. Pen culture Fisheries in pen. It is a pen shaped closed waterbody. 12. Cage culture Fisheries in cage. It is blocked with nets and floats in water. * BFDC and Forest Department usually provide fish production of Kaptai Lake and Sundarban
respectively. Fish production from other sources collected through Catch Assessment Survey by DOF officers at the field level.
Marine Fisheries Fisheries out of the sea coast line 13. Industrial Fisheries (Trawl) Fisheries using large boats such as trawlers. Commercial
fishing vessel designed to operate fishing trawlers. It is a Marine belt Fishery fishing with Trawler.
14. Artisanal Fisheries Fisheries using smaller boats. Small scale low technology and low capital fishing practices undertaking by individual fishing households.It is a Marine belt Fishery fishing with (Mechanized and Non- Mechanized) boat
1. Mechanized Fisheries using mechanized boats 2. Non-mechanized Fisheries using non-mechanized boats
Besides, data is also collected for:
Hatchling/Spawning Production of Govt. and private hatchery Carp spawn/fertilized collection from Natural Resources. Annual export of fish and fish products.
After collecting data from these sources, the collecting data is presented for necessary cleaning, screening, editing, compilation and then for analysis. Team of Fisheries Resources Survey System (FRSS) is involved for this data accumulated for annual fish production report as “Yearbook of Fisheries Statistics of Bangladesh.” Methodology of Data Collection :
A catch assessment survey is formulated for catch of the different sectors of fisheries to estimate yearly total fish production for Statistical purposes in Bangladesh.
Each of the catch assessment surveys is designed as a sample survey of three-stage or two-stage sampling or systematic sampling or simple random sampling for estimating total catches (production) on the basis of sample catch data collected by the DoF officers at field level.
For selecting the first sampling units such as sample villages and for calculating raising factors for estimating total catches by districts, a frame survey has been conducted in advance of the initiation of each catch assessment survey to provide a complete list of the first sampling units such as fishing villages together with basic information such as the number of fishing boats.
ii
Fixed sample villages :
Sample villages are carefully selected and fixed for several years for keeping track of the annual trend and seasonally changes of total fish catches.
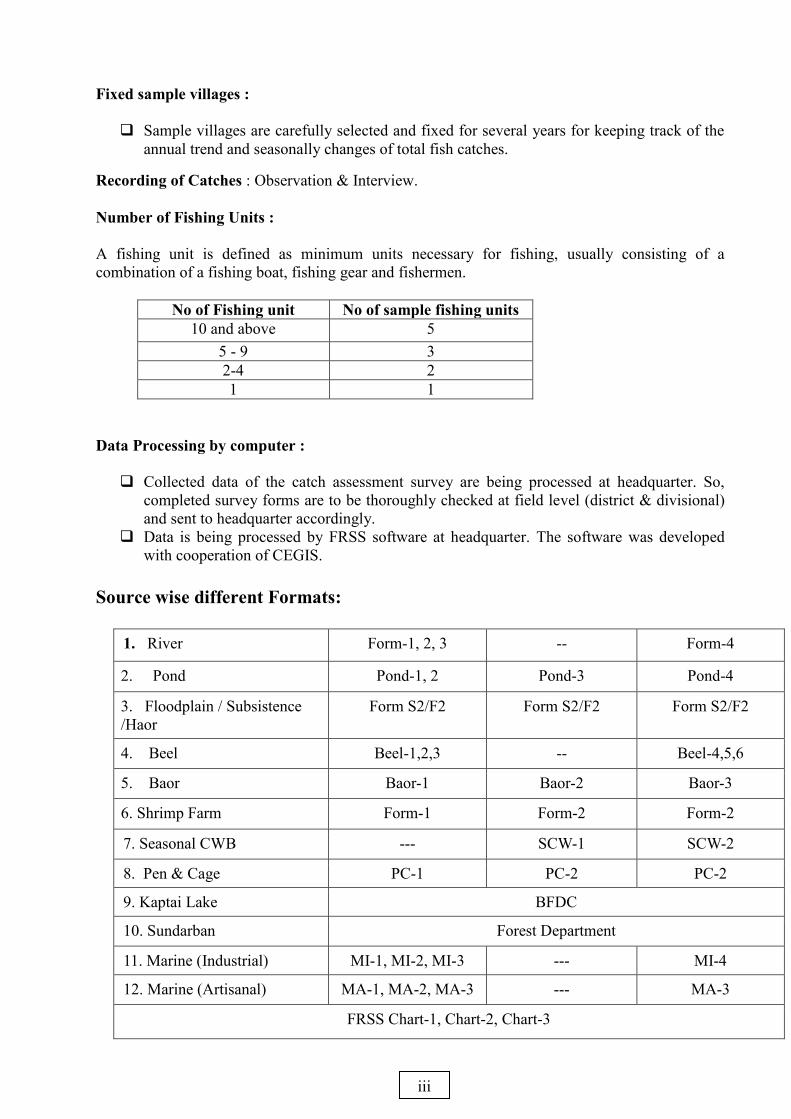
Recording of Catches : Observation & Interview. Number of Fishing Units : A fishing unit is defined as minimum units necessary for fishing, usually consisting of a combination of a fishing boat, fishing gear and fishermen.
No of Fishing unit No of sample fishing units 10 and above 5
5 - 9 3 2-4 2 1 1
Data Processing by computer :
Collected data of the catch assessment survey are being processed at headquarter. So, completed survey forms are to be thoroughly checked at field level (district & divisional) and sent to headquarter accordingly.
Data is being processed by FRSS software at headquarter. The software was developed with cooperation of CEGIS.
Source wise different Formats:
1. River Form-1, 2, 3 -- Form-4
2. Pond Pond-1, 2 Pond-3 Pond-4
3. Floodplain / Subsistence /Haor
Form S2/F2 Form S2/F2 Form S2/F2
4. Beel Beel-1,2,3 -- Beel-4,5,6
5. Baor Baor-1 Baor-2 Baor-3
6. Shrimp Farm Form-1 Form-2 Form-2
7. Seasonal CWB --- SCW-1 SCW-2
8. Pen & Cage PC-1 PC-2 PC-2
9. Kaptai Lake BFDC
10. Sundarban Forest Department
11. Marine (Industrial) MI-1, MI-2, MI-3 --- MI-4
12. Marine (Artisanal) MA-1, MA-2, MA-3 --- MA-3
FRSS Chart-1, Chart-2, Chart-3
iii
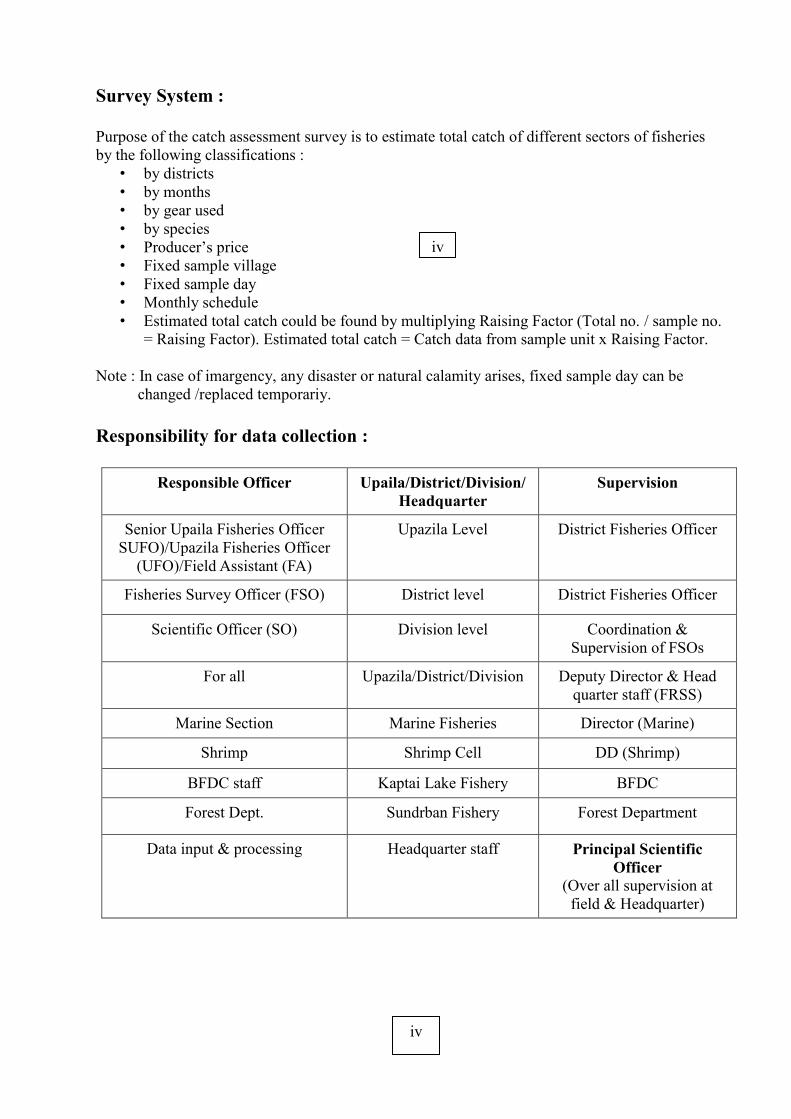
Survey System : Purpose of the catch assessment survey is to estimate total catch of different sectors of fisheries by the following classifications :
• by districts • by months • by gear used • by species • Producer’s price • Fixed sample village • Fixed sample day • Monthly schedule • Estimated total catch could be found by multiplying Raising Factor (Total no. / sample no.
= Raising Factor). Estimated total catch = Catch data from sample unit x Raising Factor. Note : In case of imargency, any disaster or natural calamity arises, fixed sample day can be
changed /replaced temporariy. Responsibility for data collection :
Responsible Officer Upaila/District/Division/Headquarter
Supervision
Senior Upaila Fisheries Officer SUFO)/Upazila Fisheries Officer
(UFO)/Field Assistant (FA)
Upazila Level District Fisheries Officer
Fisheries Survey Officer (FSO) District level District Fisheries Officer
Scientific Officer (SO) Division level Coordination & Supervision of FSOs
For all Upazila/District/Division Deputy Director & Head quarter staff (FRSS)
Marine Section Marine Fisheries Director (Marine)
Shrimp Shrimp Cell DD (Shrimp)
BFDC staff Kaptai Lake Fishery BFDC
Forest Dept. Sundrban Fishery Forest Department
Data input & processing Headquarter staff Principal Scientific Officer
(Over all supervision at field & Headquarter)
iv
iv
Sampling Method : Riverine Fisheries : Purpose of the catch assessment survey for the riverine fisheries is to collect sample catch data and producer’s price data necessary for estimating total catches, their values and corresponding fishing effort by districts as well as principal, major and other rivers, by months, by types of gear used and by species. Sample Selection: Sample stage : Sample unit Primary sampling : Fishing village Secondary sampling : Day Tertiary sampling : Fishing unit A fishing unit is defined as minimum units necessary for fishing, usually consisting of a combination of a fishing boat, fishing and fishermen. Recording of catches. Two sample days in each month.
• Observation of catches : The data collector has to be on board of one or two sample fishing units to actually observe their catches before they are sold to buyers on the river.
• Interview of catches : The responsible person for data collection has to interview to fishermen of the other sample fishing units to ask their catches, when they returned from their fishing. (Form River 1 & 2)
Note : Sample villages are fixed for several years. Selection of sample villages :
(i) For each Principal river, two largest villages and one medium sized village in terms of the number of fishing boats are selected as representatives.
(ii) For the other rivers, two largest villages and one medium sized village are selected from all the rivers. Representativeness in terms of locations and types of gear used and also accessibility of the selected villages are to be checked.
Selection of sample days : Two sample days (fixed) are selected in each month for each of the sample villages to have an interval of 15 days and fixed for several years.
Estimation of daily total catch : The total of sample catch data thus obtained are to be extrapolated by a raising factor (daily raising factor), which is to be calculated by dividing the number of all fishing units operated by the number of sample fishing units of the type of fishing gear on that sample day to get an estimated daily total catch (Form River 3 &4)
Estimated total catch of the day = Sample Total x Raising Factor Raising Factor = Number of total units operated in the day/Number of sample units observed /interviewed District Total Catch for the month = Average Total Catch of Sample Villages X District Raising Factor X Days of the Month/1000 (MT) District Raising Factor = District Total Boat of the River/Total Boat of Sample Villages
POND Fisheries: Purpose of the catch assessment survey of the pond fisheries is to collect sample catch data for estimating the average annual catch per hectare of pond by district, by conditions of ponds and by species.
01 sample village is to be selected in each Upazila as representative for several years List of 100 ponds has to be done.
v
Fixed sample pond for several years Sample ponds - 05 at least for each category Sample day : once every month for each sample village (same day for every month) to
interview for previous month on fish catch and input for fish culture. Pond condition survey : On the first day of survey of each year, the Officer is to survey
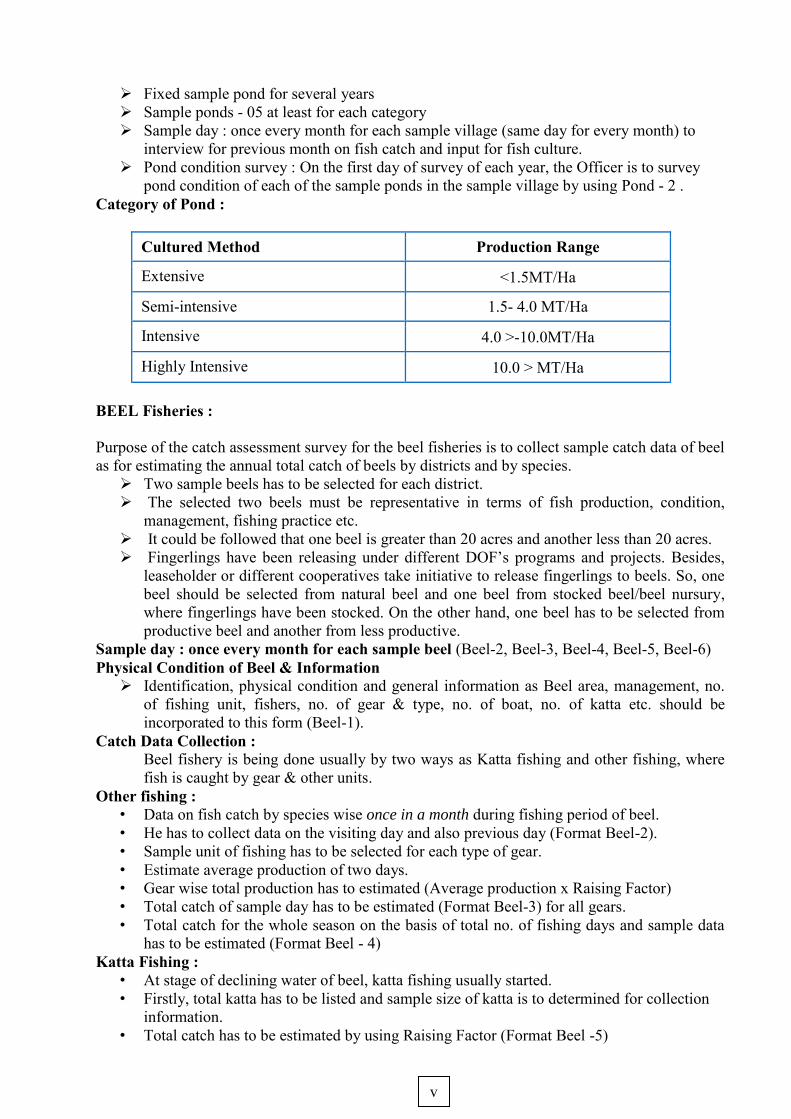
pond condition of each of the sample ponds in the sample village by using Pond - 2 . Category of Pond :
Cultured Method Production Range
Extensive <1.5MT/Ha
Semi-intensive 1.5- 4.0 MT/Ha
Intensive 4.0 >-10.0MT/Ha
Highly Intensive 10.0 > MT/Ha BEEL Fisheries : Purpose of the catch assessment survey for the beel fisheries is to collect sample catch data of beel as for estimating the annual total catch of beels by districts and by species.
Two sample beels has to be selected for each district. The selected two beels must be representative in terms of fish production, condition,
management, fishing practice etc. It could be followed that one beel is greater than 20 acres and another less than 20 acres. Fingerlings have been releasing under different DOF’s programs and projects. Besides,
leaseholder or different cooperatives take initiative to release fingerlings to beels. So, one beel should be selected from natural beel and one beel from stocked beel/beel nursury, where fingerlings have been stocked. On the other hand, one beel has to be selected from productive beel and another from less productive.
Sample day : once every month for each sample beel (Beel-2, Beel-3, Beel-4, Beel-5, Beel-6) Physical Condition of Beel & Information
Identification, physical condition and general information as Beel area, management, no. of fishing unit, fishers, no. of gear & type, no. of boat, no. of katta etc. should be incorporated to this form (Beel-1).
Catch Data Collection : Beel fishery is being done usually by two ways as Katta fishing and other fishing, where fish is caught by gear & other units.
Other fishing : • Data on fish catch by species wise once in a month during fishing period of beel. • He has to collect data on the visiting day and also previous day (Format Beel-2). • Sample unit of fishing has to be selected for each type of gear. • Estimate average production of two days. • Gear wise total production has to estimated (Average production x Raising Factor) • Total catch of sample day has to be estimated (Format Beel-3) for all gears. • Total catch for the whole season on the basis of total no. of fishing days and sample data
has to be estimated (Format Beel - 4) Katta Fishing :
• At stage of declining water of beel, katta fishing usually started. • Firstly, total katta has to be listed and sample size of katta is to determined for collection
information. • Total catch has to be estimated by using Raising Factor (Format Beel -5)
vi
Estimation of Annual Production :
• Annual total fish production can be estimated from (Format Beel-6) other fishing and katta fishing
Shrimp /Prwan Farm Fisheries : Purpose of the catch assessment survey for the shrimp farm fisheries is to collect sample catch data of shrimp farms as well as sample data for calculating the increase rate of the total area of shrimp farms, necessary for estimating the annual total catch of shrimp farms by districts and by species. The reports of shrimp farm, shrimp production and shrimp farm area are being collected from Shrimp Cell of DOF. Actually Shrimp Cell compiled this type of report and supply to FRSS. Besides, Officers also collect data in relation to Shrimp farms using Shrimp Farm Form-1 & 2.
Shrimp Cell of DoF usually compile this report. All catches from govt. shrimp farms. Monthly catch from private shrimp farms ( Form-1 & 2.) Two types (i) exclusively shrimp/prawn & (ii) Mixed (Shrimp & Fish)
Subsistence/Floodplain : Purpose of catch assessment survey of the subsistence/floodplain fisheries is to collect sample catch data of flood waters in the monsoon season as for estimating the annual total catch of subsistence by districts and by species..
One sample village is to be selected for each district which should be representative for the district.
Firstly, 100 households are to be listed in each sample village (Form - S1/F1) 10 sample households are to be selected out of 100 households by systematic sample. In order to see seasonal change and long term trend of catch by the sample fishing
households, the sample households are not to be changed for a few years • A certain day of the month is to be selected as a survey day for sample village. The survey
day is to be the same day of the month every month. • The Officer is to visit sample subsistence/floodplain fishing households and interview to
the head of household or any other member on their fishing activities during the previous month (Form - S2/F2). Besides, he will try to observe actual catches by subsistence catchers.
Baor Fisheries : Purpose of the catch assessment survey for the baor fisheries is to collect sample catch data and producer’s price of baor for estimating total catches and their values by months and by species. There are some baors at Dhaka division and Khulna division. Out of these, some baors are managed by the government and others are managed privately.
Some baors are managed by the government and others are managed privately. There are some baors at 04 districts of Dhaka division (04 nos. baors) and 10 districts of Khulna division (14 nos. baors).
Government managed Baor : 06 baors are managed by the Government. Respective Baor Manager provides necessary yearly production data of Govt. managed
baor (6 baors) by species wise (Form - Baor-1& Baor -2).
vii
• Private Managed Baor : Sample baor (1 to 3 nos.) has to selected for each district for accumulating data. The Investigator will visit baor once a month and talk to leaseholder, cooperative and fishers to collect information (Form - Baor-1& Baor -2).
Seasonal Cultured Waterbody (SCW): Purpose of the catch assessment survey for the seasonal cultured waterbody (SCW) fisheries is to collect sample catch data from seasonal cultured waterbody, where fish is cultured seasonally at paddy field and floodplain. Besides, there is also seasonal cultured practice of fish at boropit, polder etc.
Purpose of the catch assessment survey for the seasonal cultured waterbody fisheries is to collect sample catch data from seasonal cultured waterbody, where fish is cultured seasonally at paddy field and floodplain. Besides, there is also seasonal cultured practice of fish at boropit, polder etc.
Listing of all SCWs with area and no. Data collection on sample basis at Upazila level. (Form SCW1 & SCW2).
Pen and Cage Culture :
In most places, there is increasing practice of fish culture at Pen and Cage. Purpose of the catch assessment survey for the Pen and Cage fisheries is to collect sample catch data from Pen and Cage (Form PC-1 & PC-2) Kaptai Lake Fisheries: Purpose of the catch assessment survey for the Kaptai Lake fisheries is to collect data on catch and fishing effort of the fisheries for estimating the total catch my months, fishing gear and by species.
Bangladesh Fisheries Development Corporation (BFDC) usually provides yearly total production of Kaptai Lake fisheries. After compilation of catch statistics of Kaptai lake done by BFDC is included in the Yearbook of Fisheries Statistics of Bangladesh.
Sundarbans Fisheries: The pupose of this compilation of catch statistics of Sundarbans Fisheries is to yearly compile such statistics for inclusion in the Fisheries Statistical Report of Bangladesh by utilizing data already collected by the Diviosional Forest Officer. Yearly compiled catch data provided by Forest Department is included in Yearbook of Fisheries Statistics in Bangladesh. Marine Fisheries: Marine Industrial Fisheries (Trawlers): Purpose of the catch Assessment Survey of the Marine Industrial Fisheries (Trawler) is to collect catch and effort data of trawlers for compiling statistics on the monthly total catch of Trawlers by types of fishing (Shrimp trawlers, fish trawlers and mixed trawlers ) and by species and their corresponding fishing effort such as the total number of fishing days.
• The purpose of the catch report survey is to collect catch and effort data of each trip made by trawlers at their arrival.
viii
• Survey organization : The Marine Fisheries Sector of Department of Fisheries, Chittagong is to conduct the survey with its inspectors.
• Collection of reports : The inspector is to attend each arrival of trawlers from their fishing trip and request the captain to submit the completed catch report form. The inspector should check the data reported in the form (Form -MI-1, MI-2 and MI-3), and if there is any deficit in the data he should correct it by asking the captain. The catch data are also to be checked with export data appearing in the invoice when it becomes available.
• Checking and collection of forms: The inspector is to visit companies every month to see recording of the fishing trip survey form and check completeness of the coverage of catch reports by comparing with the fishing trips recorded. At the end of the survey year, completed forms are to be collected for thorough checking of the catch reports for the whole year.
Marine Artisanal Fisheries : Purpose of the catch assessment survey for the marine artisanal fisheries is to collect sample catch data and producer’s price data necessary for estimating total catches, their values and corresponding Fishing effort by former districts, by months, by types of gear and by species. Frame Survey : A frame survey for the marine artisanal fisheries is being conducted preferably once every year. Data on the number of fishing units will be used for estimating the total catch Sample landing centers.: Sample landing centers are selected from larger centers for each type of gear as follows:
• Gill net …Chittagong, Cox’s Bazar, Khulna. • Small size --- Sandip Island, Hatia Island, Kumira & Cox’s Bazar. • Long line --- Jew fish long line --- Three landing sites selected from jew fish processing
plants in (Seasonal ) Cox’s Bazar. • Seine net, Cast net and miscellaneous --- The sea coast is divided into six sections as
follows. Cox’s Bazar, South of Chittagong, North of Chittagong, Sandip Island, Hatis Islan in each section.
Sample days
i) Gill net
For each landing center, four sample days are to be selected in a month with an interval of 8 days. (for example: 3rd , 11th , 19th and 27th ). The sample days thus selected are to be the same every month.
` ii ) Other types of gear For each landing ecnter.two sample days are to be selected in a month with an internal of 15 days. (for example, 7th and 22nd).The sample days thus selected are to be the same every month. Sample landing : When the concern Officer visits a sample landing center of a certain type of gear on a sample day, first he is to make a contact with a well informed fisherman and ask the expected number of landings (boat arrival for landing ) of that particular type of gear during the sample day. This number is to be recorded in the column “No of all landings” on Survey Form MA - 1.
iX
Maximum five sample landings are to be selected from all the expected landing during the sample day. The expected number of landings recorded in the column “No of all landings” is to be corrected to the actual number of landings at the end of the sample day. Observation of sample landings : Since the purpose of observation of sample landings is to record sample catch data of one trip of fishing, if any sample landing consists of catches by more than one fishing unit or only a part of catch by one fishing unit the concern officer has to ask the fisherman catch by only one fishing unit and record it. If it is impossible the sample landing is to be changed to the next landing. The concerned officer is to interview to the head fisherman on the fishing trip, observe the landing of fish, and record catch data on Survey Form MA-1.
The concerned Officer observe landings of the sample fishing units and interview to the head fisherman for asking on his fishing operation and record such data on Form-MA-1 for each type of fishing gear used. Accuracy of eye-estimation of the quantity of landings is to be improved by actually weighing fish with a portable balance once in a while. Estimation of monthly total catches. Monthly total catches by types of fishing gear used are to be estimated by Districts as follows :
(Estimated monthly total catch ) = ( Average catch per fishing unit per month obtained by the catch assessment survey ) x ( Total number of fishing units by former District obtained by the Frame Survey ).
The average catch per fishing unit per month is to be calculated as follows: ( Average catch per fishing unit per month ) = ( Average catch per trip obtained as an average of observed sample catch data ) x ( Average number of trips per fishing unit per month obtained as
an average of sample data on the number of trips per month
X
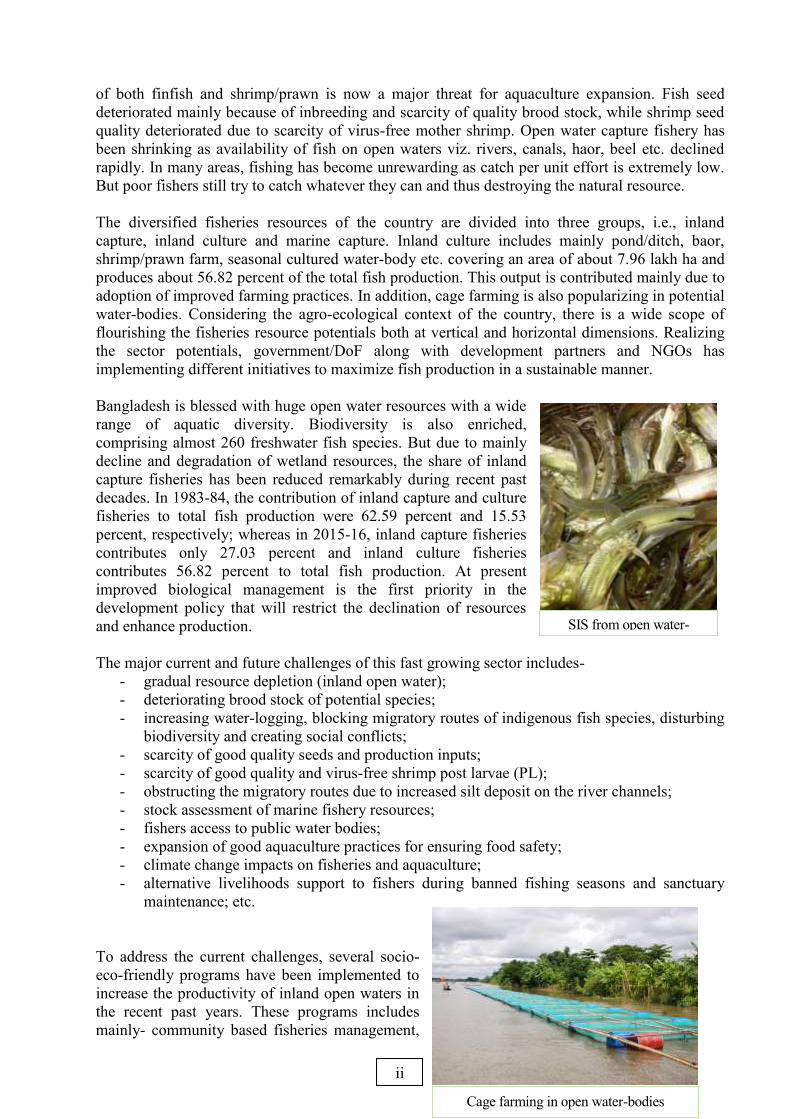
Prawn farming by local beneficiaries
Executive Summary
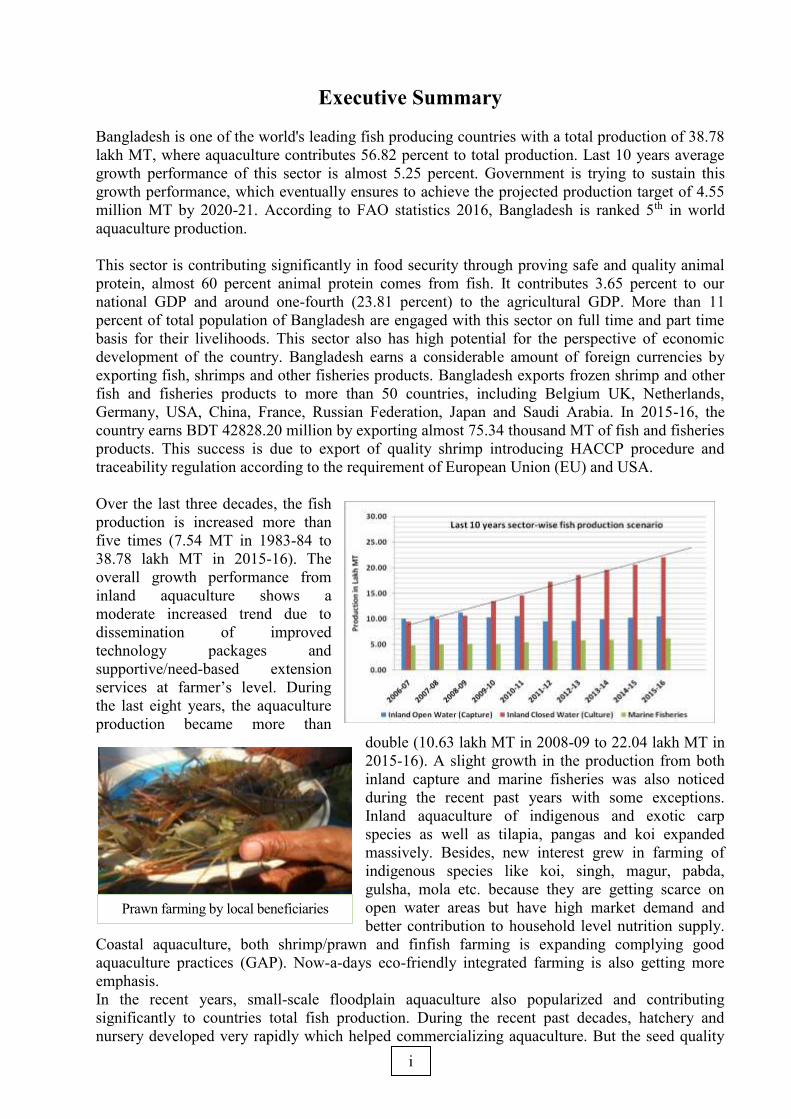
Bangladesh is one of the world's leading fish producing countries with a total production of 38.78 lakh MT, where aquaculture contributes 56.82 percent to total production. Last 10 years average growth performance of this sector is almost 5.25 percent. Government is trying to sustain this growth performance, which eventually ensures to achieve the projected production target of 4.55 million MT by 2020-21. According to FAO statistics 2016, Bangladesh is ranked 5th in world aquaculture production. This sector is contributing significantly in food security through proving safe and quality animal protein, almost 60 percent animal protein comes from fish. It contributes 3.65 percent to our national GDP and around one-fourth (23.81 percent) to the agricultural GDP. More than 11 percent of total population of Bangladesh are engaged with this sector on full time and part time basis for their livelihoods. This sector also has high potential for the perspective of economic development of the country. Bangladesh earns a considerable amount of foreign currencies by exporting fish, shrimps and other fisheries products. Bangladesh exports frozen shrimp and other fish and fisheries products to more than 50 countries, including Belgium UK, Netherlands, Germany, USA, China, France, Russian Federation, Japan and Saudi Arabia. In 2015-16, the country earns BDT 42828.20 million by exporting almost 75.34 thousand MT of fish and fisheries products. This success is due to export of quality shrimp introducing HACCP procedure and traceability regulation according to the requirement of European Union (EU) and USA. Over the last three decades, the fish production is increased more than five times (7.54 MT in 1983-84 to 38.78 lakh MT in 2015-16). The overall growth performance from inland aquaculture shows a moderate increased trend due to dissemination of improved technology packages and supportive/need-based extension services at farmer’s level. During the last eight years, the aquaculture production became more than
double (10.63 lakh MT in 2008-09 to 22.04 lakh MT in 2015-16). A slight growth in the production from both inland capture and marine fisheries was also noticed during the recent past years with some exceptions. Inland aquaculture of indigenous and exotic carp species as well as tilapia, pangas and koi expanded massively. Besides, new interest grew in farming of indigenous species like koi, singh, magur, pabda, gulsha, mola etc. because they are getting scarce on open water areas but have high market demand and better contribution to household level nutrition supply.
Coastal aquaculture, both shrimp/prawn and finfish farming is expanding complying good aquaculture practices (GAP). Now-a-days eco-friendly integrated farming is also getting more emphasis. In the recent years, small-scale floodplain aquaculture also popularized and contributing significantly to countries total fish production. During the recent past decades, hatchery and nursery developed very rapidly which helped commercializing aquaculture. But the seed quality
i
Cage farming in open water-bodies
SIS from open water-bodies
of both finfish and shrimp/prawn is now a major threat for aquaculture expansion. Fish seed deteriorated mainly because of inbreeding and scarcity of quality brood stock, while shrimp seed quality deteriorated due to scarcity of virus-free mother shrimp. Open water capture fishery has been shrinking as availability of fish on open waters viz. rivers, canals, haor, beel etc. declined rapidly. In many areas, fishing has become unrewarding as catch per unit effort is extremely low. But poor fishers still try to catch whatever they can and thus destroying the natural resource. The diversified fisheries resources of the country are divided into three groups, i.e., inland capture, inland culture and marine capture. Inland culture includes mainly pond/ditch, baor, shrimp/prawn farm, seasonal cultured water-body etc. covering an area of about 7.96 lakh ha and produces about 56.82 percent of the total fish production. This output is contributed mainly due to adoption of improved farming practices. In addition, cage farming is also popularizing in potential water-bodies. Considering the agro-ecological context of the country, there is a wide scope of flourishing the fisheries resource potentials both at vertical and horizontal dimensions. Realizing the sector potentials, government/DoF along with development partners and NGOs has implementing different initiatives to maximize fish production in a sustainable manner. Bangladesh is blessed with huge open water resources with a wide range of aquatic diversity. Biodiversity is also enriched, comprising almost 260 freshwater fish species. But due to mainly decline and degradation of wetland resources, the share of inland capture fisheries has been reduced remarkably during recent past decades. In 1983-84, the contribution of inland capture and culture fisheries to total fish production were 62.59 percent and 15.53 percent, respectively; whereas in 2015-16, inland capture fisheries contributes only 27.03 percent and inland culture fisheries contributes 56.82 percent to total fish production. At present improved biological management is the first priority in the development policy that will restrict the declination of resources and enhance production. The major current and future challenges of this fast growing sector includes-
- gradual resource depletion (inland open water); - deteriorating brood stock of potential species; - increasing water-logging, blocking migratory routes of indigenous fish species, disturbing
biodiversity and creating social conflicts; - scarcity of good quality seeds and production inputs; - scarcity of good quality and virus-free shrimp post larvae (PL); - obstructing the migratory routes due to increased silt deposit on the river channels; - stock assessment of marine fishery resources; - fishers access to public water bodies; - expansion of good aquaculture practices for ensuring food safety; - climate change impacts on fisheries and aquaculture; - alternative livelihoods support to fishers during banned fishing seasons and sanctuary
maintenance; etc.
To address the current challenges, several socio-eco-friendly programs have been implemented to increase the productivity of inland open waters in the recent past years. These programs includes mainly- community based fisheries management,
ii
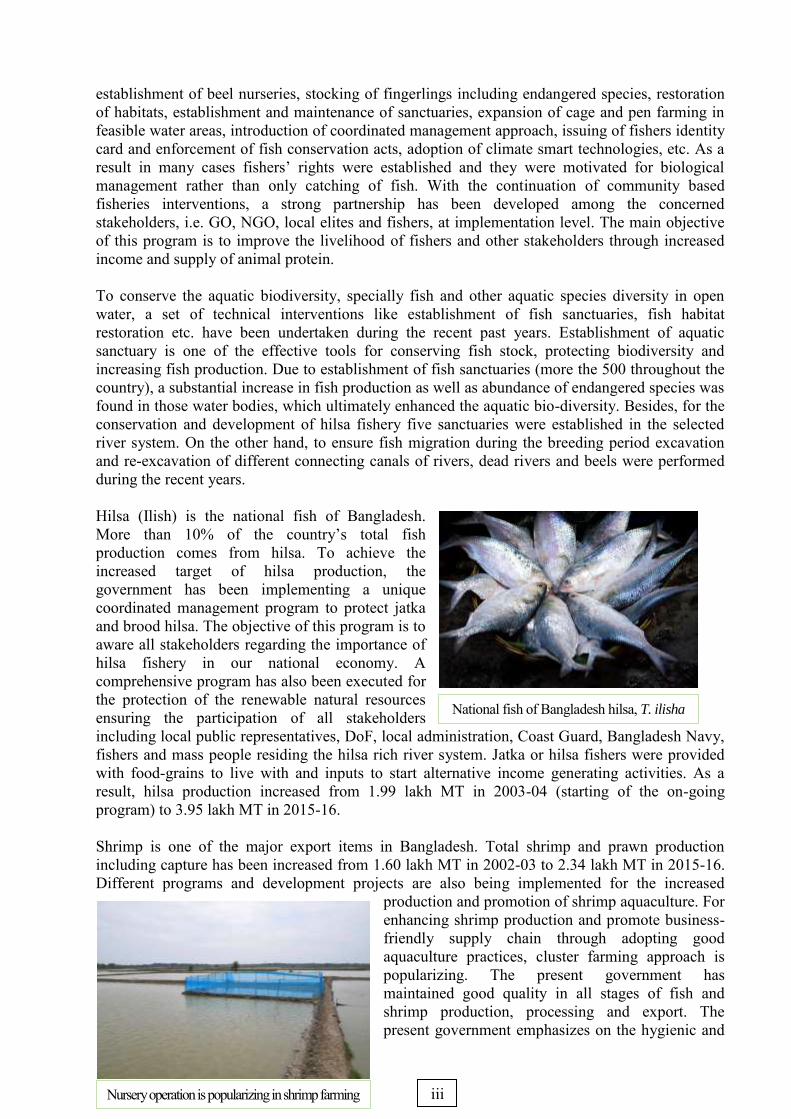
National fish of Bangladesh hilsa, T. ilisha
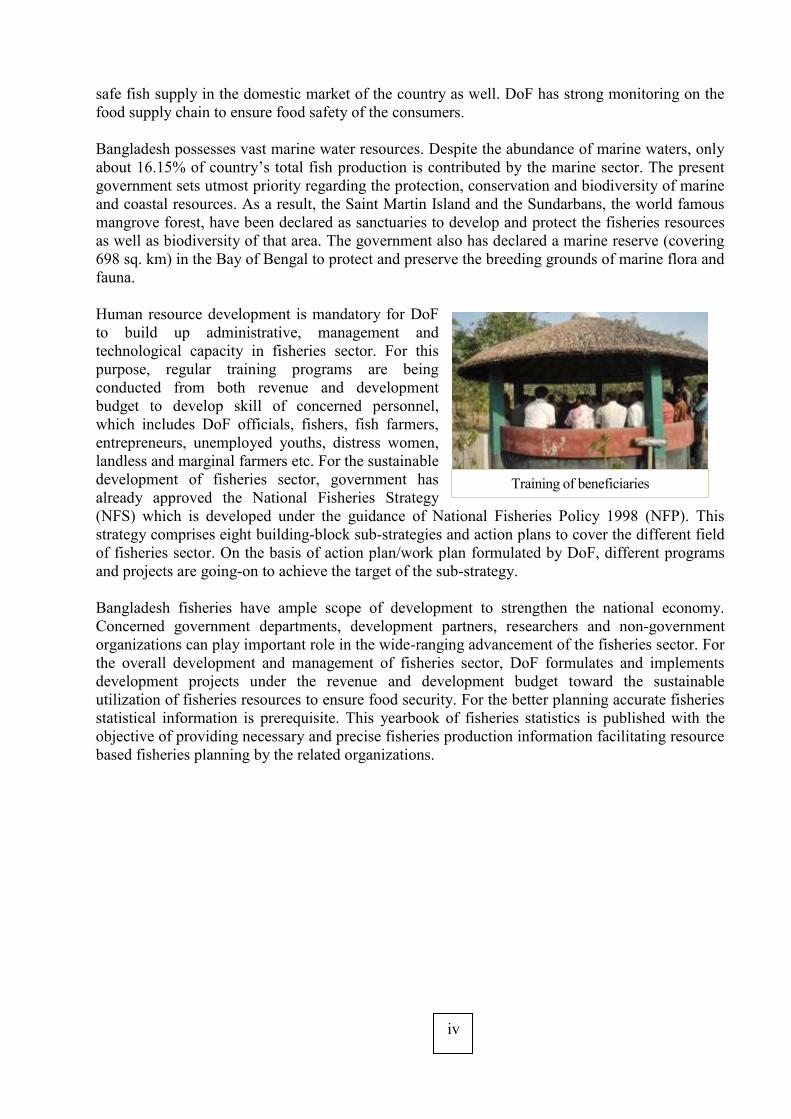
Nursery operation is popularizing in shrimp farming through cluster approach
establishment of beel nurseries, stocking of fingerlings including endangered species, restoration of habitats, establishment and maintenance of sanctuaries, expansion of cage and pen farming in feasible water areas, introduction of coordinated management approach, issuing of fishers identity card and enforcement of fish conservation acts, adoption of climate smart technologies, etc. As a result in many cases fishers’ rights were established and they were motivated for biological management rather than only catching of fish. With the continuation of community based fisheries interventions, a strong partnership has been developed among the concerned stakeholders, i.e. GO, NGO, local elites and fishers, at implementation level. The main objective of this program is to improve the livelihood of fishers and other stakeholders through increased income and supply of animal protein. To conserve the aquatic biodiversity, specially fish and other aquatic species diversity in open water, a set of technical interventions like establishment of fish sanctuaries, fish habitat restoration etc. have been undertaken during the recent past years. Establishment of aquatic sanctuary is one of the effective tools for conserving fish stock, protecting biodiversity and increasing fish production. Due to establishment of fish sanctuaries (more the 500 throughout the country), a substantial increase in fish production as well as abundance of endangered species was found in those water bodies, which ultimately enhanced the aquatic bio-diversity. Besides, for the conservation and development of hilsa fishery five sanctuaries were established in the selected river system. On the other hand, to ensure fish migration during the breeding period excavation and re-excavation of different connecting canals of rivers, dead rivers and beels were performed during the recent years. Hilsa (Ilish) is the national fish of Bangladesh. More than 10% of the country’s total fish production comes from hilsa. To achieve the increased target of hilsa production, the government has been implementing a unique coordinated management program to protect jatka and brood hilsa. The objective of this program is to aware all stakeholders regarding the importance of hilsa fishery in our national economy. A comprehensive program has also been executed for the protection of the renewable natural resources ensuring the participation of all stakeholders including local public representatives, DoF, local administration, Coast Guard, Bangladesh Navy, fishers and mass people residing the hilsa rich river system. Jatka or hilsa fishers were provided with food-grains to live with and inputs to start alternative income generating activities. As a result, hilsa production increased from 1.99 lakh MT in 2003-04 (starting of the on-going program) to 3.95 lakh MT in 2015-16. Shrimp is one of the major export items in Bangladesh. Total shrimp and prawn production including capture has been increased from 1.60 lakh MT in 2002-03 to 2.34 lakh MT in 2015-16. Different programs and development projects are also being implemented for the increased
production and promotion of shrimp aquaculture. For enhancing shrimp production and promote business-friendly supply chain through adopting good aquaculture practices, cluster farming approach is popularizing. The present government has maintained good quality in all stages of fish and shrimp production, processing and export. The present government emphasizes on the hygienic and
iii
Training of beneficiaries
safe fish supply in the domestic market of the country as well. DoF has strong monitoring on the food supply chain to ensure food safety of the consumers. Bangladesh possesses vast marine water resources. Despite the abundance of marine waters, only about 16.15% of country’s total fish production is contributed by the marine sector. The present government sets utmost priority regarding the protection, conservation and biodiversity of marine and coastal resources. As a result, the Saint Martin Island and the Sundarbans, the world famous mangrove forest, have been declared as sanctuaries to develop and protect the fisheries resources as well as biodiversity of that area. The government also has declared a marine reserve (covering 698 sq. km) in the Bay of Bengal to protect and preserve the breeding grounds of marine flora and fauna. Human resource development is mandatory for DoF to build up administrative, management and technological capacity in fisheries sector. For this purpose, regular training programs are being conducted from both revenue and development budget to develop skill of concerned personnel, which includes DoF officials, fishers, fish farmers, entrepreneurs, unemployed youths, distress women, landless and marginal farmers etc. For the sustainable development of fisheries sector, government has already approved the National Fisheries Strategy (NFS) which is developed under the guidance of National Fisheries Policy 1998 (NFP). This strategy comprises eight building-block sub-strategies and action plans to cover the different field of fisheries sector. On the basis of action plan/work plan formulated by DoF, different programs and projects are going-on to achieve the target of the sub-strategy. Bangladesh fisheries have ample scope of development to strengthen the national economy. Concerned government departments, development partners, researchers and non-government organizations can play important role in the wide-ranging advancement of the fisheries sector. For the overall development and management of fisheries sector, DoF formulates and implements development projects under the revenue and development budget toward the sustainable utilization of fisheries resources to ensure food security. For the better planning accurate fisheries statistical information is prerequisite. This yearbook of fisheries statistics is published with the objective of providing necessary and precise fisheries production information facilitating resource based fisheries planning by the related organizations.
iv
CHAPTER -3 Table 3.1. Sector-wise Annual Fish Production in Inland and Marine Fisheries
2015-16
Sector of Fisheries Water Area (Hectare)
Production (Metric Ton)
% of Production Productivity
A. Inland Fisheries (i) Inland Open Water (Capture) 1. River and Estuary 853863 178458 4.60 209 kg/ha 2. Sundarbans 177700 16870 0.43 95 kg/ha 3. Beel 114161 95453 2.46 836 kg/ha 4. Kaptai Lake 68800 9589 0.25 139 kg/ha
5. Floodplain 2704084 747872 19.28 276 kg/ha
Capture Total 3918608 1048242 27.03
(ii) Inland Closed Water (Culture) 6. Pond 372405 1719783 44.34 4618 kg/ha 7. Seasonal cultured water body 134876 207658 5.35 1539 kg/ha 8. Baor 5488 7729 0.20 1408 kg/ha 9. Shrimp/Prawn Farm 275509 239798 6.18 870 kg/ha 10. Crab 19408** 13160 0.34 678 kg/ha 11. Pen Culture 7553 13364 0.34 1769 kg/ha 12. Cage Culture 10 2062 0.05 21 kg/cu m Culture Total 795841 2203554 56.82
Inland Fisheries Total 4714449 3251796 83.85 B. Marine Fisheries 13. Industrial (Trawl) 105348 2.72 14. Artisanal 521180 13.44 Marine Fisheries Total 626528 16.15
COUNTRY TOTAL 3878324 100.00
Note: 1. Catch of River, Beel and Baor is estimated by catch assessment survey on the basis of Frame Survey
and water area from SPARRSO (Space Research and Remote Sensing Organization) Report, 1983.
2. Catch data of Sundarbans are supplied by Forest Department and water area of Sundarbans is
estimated on the basis of Integrated Resource Development of Sundarbans Reserved Forest, 1994.
3. Catch data of Kaptai Lake are supplied by Bangladesh Fisheries Development Corporation (BFDC).
4. Seasonal cultured water body means Paddy field, Floodplain, Boropit etc. which are under in fish
culture.
5. Catch data of Marine Fisheries are supplied by Marine Wing, Department of Fisheries.
6. 7553 hectare Floodplain area used in Pen Culture for modern aqua-culture system.
** Crab production has included from this year. Crab area is also included with Shrimp farm area.
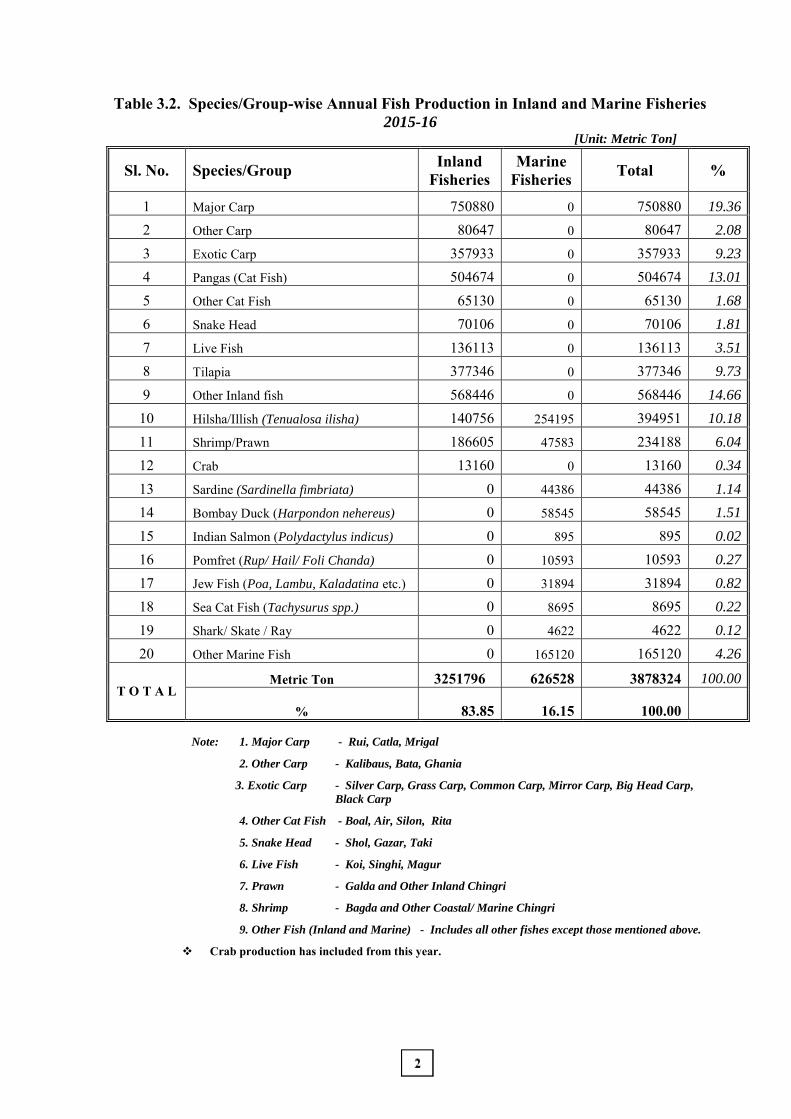
Table 3.2. Species/Group-wise Annual Fish Production in Inland and Marine Fisheries 2015-16
[Unit: Metric Ton]
Sl. No. Species/Group Inland Fisheries
Marine Fisheries Total %
1 Major Carp 750880 0 750880 19.36
2 Other Carp 80647 0 80647 2.08
3 Exotic Carp 357933 0 357933 9.23
4 Pangas (Cat Fish) 504674 0 504674 13.01
5 Other Cat Fish 65130 0 65130 1.68
6 Snake Head 70106 0 70106 1.81
7 Live Fish 136113 0 136113 3.51
8 Tilapia 377346 0 377346 9.73
9 Other Inland fish 568446 0 568446 14.66
10 Hilsha/Illish (Tenualosa ilisha) 140756 254195 394951 10.18
11 Shrimp/Prawn 186605 47583 234188 6.04
12 Crab 13160 0 13160 0.34
13 Sardine (Sardinella fimbriata) 0 44386 44386 1.14
14 Bombay Duck (Harpondon nehereus) 0 58545 58545 1.51
15 Indian Salmon (Polydactylus indicus) 0 895 895 0.02
16 Pomfret (Rup/ Hail/ Foli Chanda) 0 10593 10593 0.27
17 Jew Fish (Poa, Lambu, Kaladatina etc.) 0 31894 31894 0.82
18 Sea Cat Fish (Tachysurus spp.) 0 8695 8695 0.22
19 Shark/ Skate / Ray 0 4622 4622 0.12
20 Other Marine Fish 0 165120 165120 4.26
T O T A L Metric Ton 3251796 626528 3878324 100.00
% 83.85 16.15 100.00
Note: 1. Major Carp - Rui, Catla, Mrigal
2. Other Carp - Kalibaus, Bata, Ghania
3. Exotic Carp - Silver Carp, Grass Carp, Common Carp, Mirror Carp, Big Head Carp,
Black Carp
4. Other Cat Fish - Boal, Air, Silon, Rita
5. Snake Head - Shol, Gazar, Taki
6. Live Fish - Koi, Singhi, Magur
7. Prawn - Galda and Other Inland Chingri
8. Shrimp - Bagda and Other Coastal/ Marine Chingri
9. Other Fish (Inland and Marine) - Includes all other fishes except those mentioned above.
Crab production has included from this year.
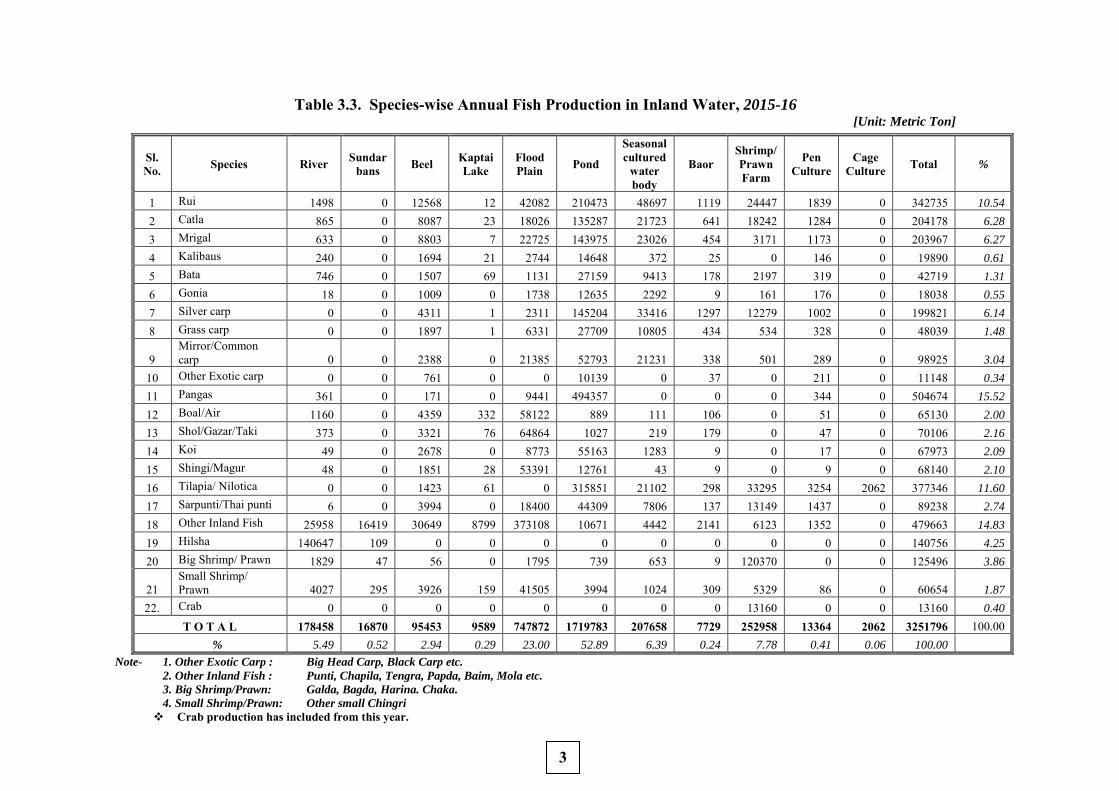
Table 3.3. Species-wise Annual Fish Production in Inland Water, 2015-16 [Unit: Metric Ton]
[
Sl. No. Species River Sundar
bans Beel Kaptai Lake
Flood Plain Pond
Seasonal cultured
water body
Baor Shrimp/ Prawn Farm
Pen Culture
Cage Culture Total %
1 Rui 1498 0 12568 12 42082 210473 48697 1119 24447 1839 0 342735 10.54
2 Catla 865 0 8087 23 18026 135287 21723 641 18242 1284 0 204178 6.28
3 Mrigal 633 0 8803 7 22725 143975 23026 454 3171 1173 0 203967 6.27
4 Kalibaus 240 0 1694 21 2744 14648 372 25 0 146 0 19890 0.61
5 Bata 746 0 1507 69 1131 27159 9413 178 2197 319 0 42719 1.31
6 Gonia 18 0 1009 0 1738 12635 2292 9 161 176 0 18038 0.55
7 Silver carp 0 0 4311 1 2311 145204 33416 1297 12279 1002 0 199821 6.14
8 Grass carp 0 0 1897 1 6331 27709 10805 434 534 328 0 48039 1.48
9 Mirror/Common carp 0 0 2388 0 21385 52793 21231 338 501 289 0 98925 3.04
10 Other Exotic carp 0 0 761 0 0 10139 0 37 0 211 0 11148 0.34
11 Pangas 361 0 171 0 9441 494357 0 0 0 344 0 504674 15.52
12 Boal/Air 1160 0 4359 332 58122 889 111 106 0 51 0 65130 2.00
13 Shol/Gazar/Taki 373 0 3321 76 64864 1027 219 179 0 47 0 70106 2.16
14 Koi 49 0 2678 0 8773 55163 1283 9 0 17 0 67973 2.09
15 Shingi/Magur 48 0 1851 28 53391 12761 43 9 0 9 0 68140 2.10
16 Tilapia/ Nilotica 0 0 1423 61 0 315851 21102 298 33295 3254 2062 377346 11.60
17 Sarpunti/Thai punti 6 0 3994 0 18400 44309 7806 137 13149 1437 0 89238 2.74
18 Other Inland Fish 25958 16419 30649 8799 373108 10671 4442 2141 6123 1352 0 479663 14.83
19 Hilsha 140647 109 0 0 0 0 0 0 0 0 0 140756 4.25
20 Big Shrimp/ Prawn 1829 47 56 0 1795 739 653 9 120370 0 0 125496 3.86
21 Small Shrimp/ Prawn 4027 295 3926 159 41505 3994 1024 309 5329 86 0 60654 1.87
22. Crab 0 0 0 0 0 0 0 0 13160 0 0 13160 0.40
T O T A L 178458 16870 95453 9589 747872 1719783 207658 7729 252958 13364 2062 3251796 100.00 % 5.49 0.52 2.94 0.29 23.00 52.89 6.39 0.24 7.78 0.41 0.06 100.00
Note- 1. Other Exotic Carp : Big Head Carp, Black Carp etc.
2. Other Inland Fish : Punti, Chapila, Tengra, Papda, Baim, Mola etc.
3. Big Shrimp/Prawn: Galda, Bagda, Harina. Chaka.
4. Small Shrimp/Prawn: Other small Chingri
Crab production has included from this year.
3
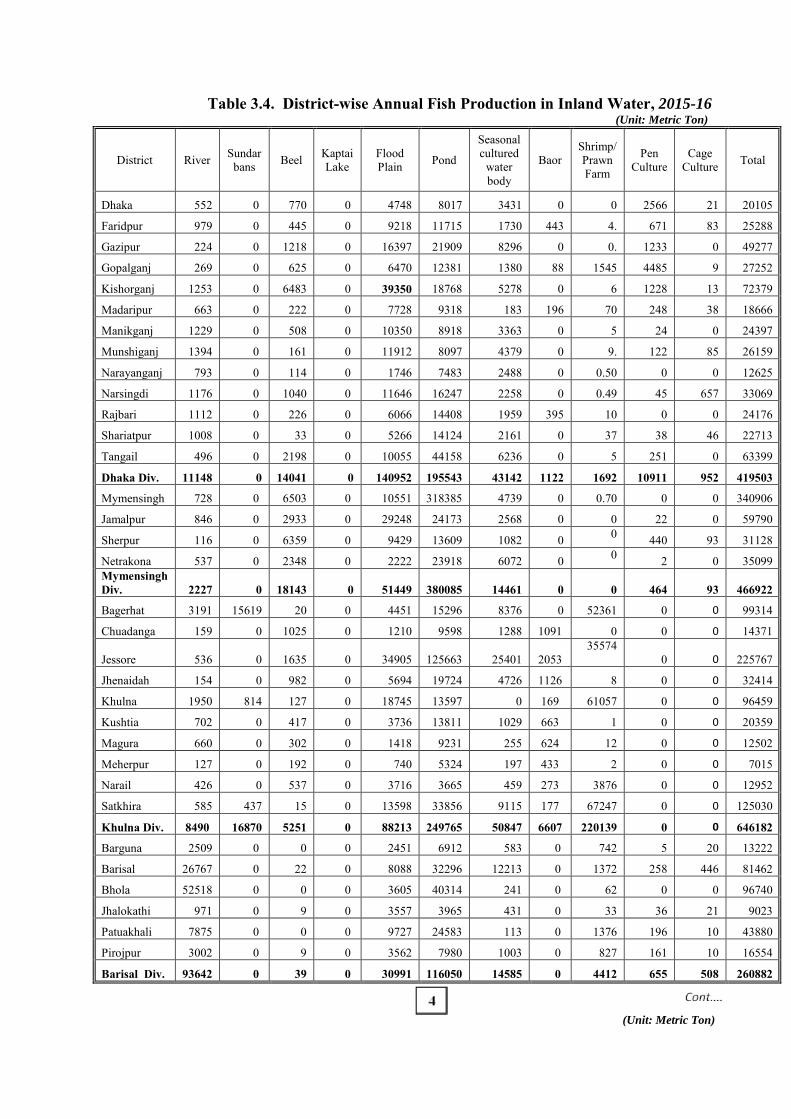
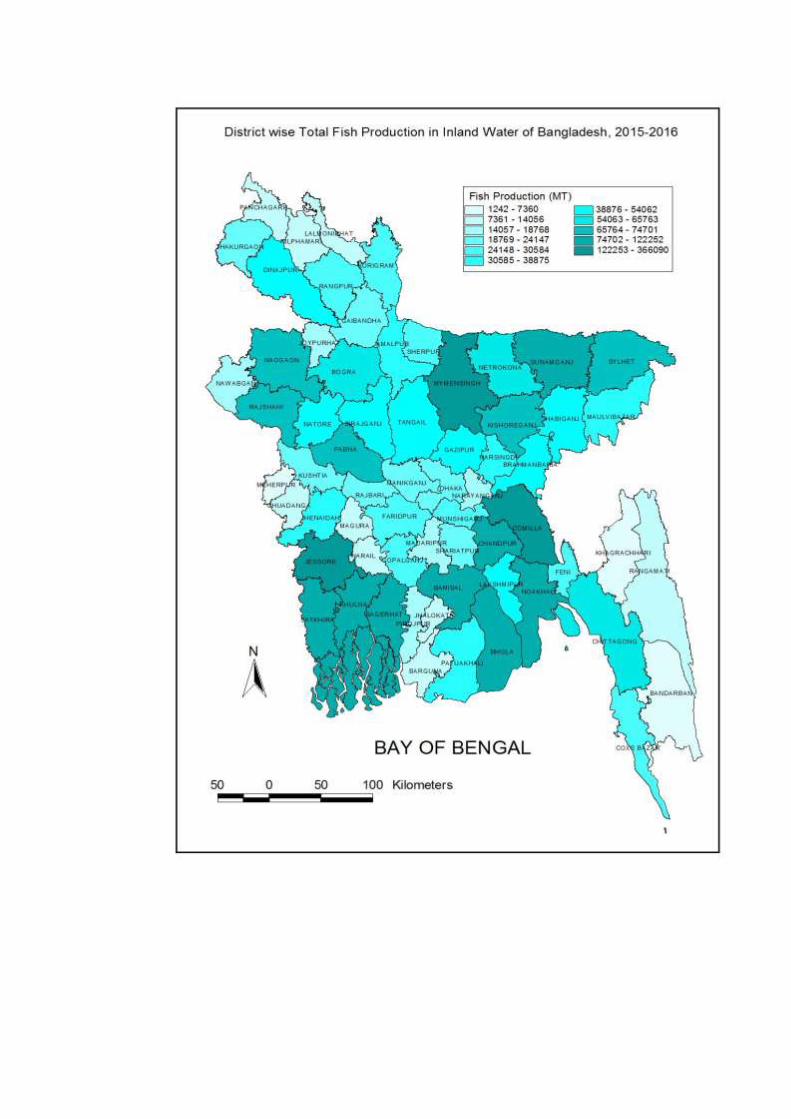
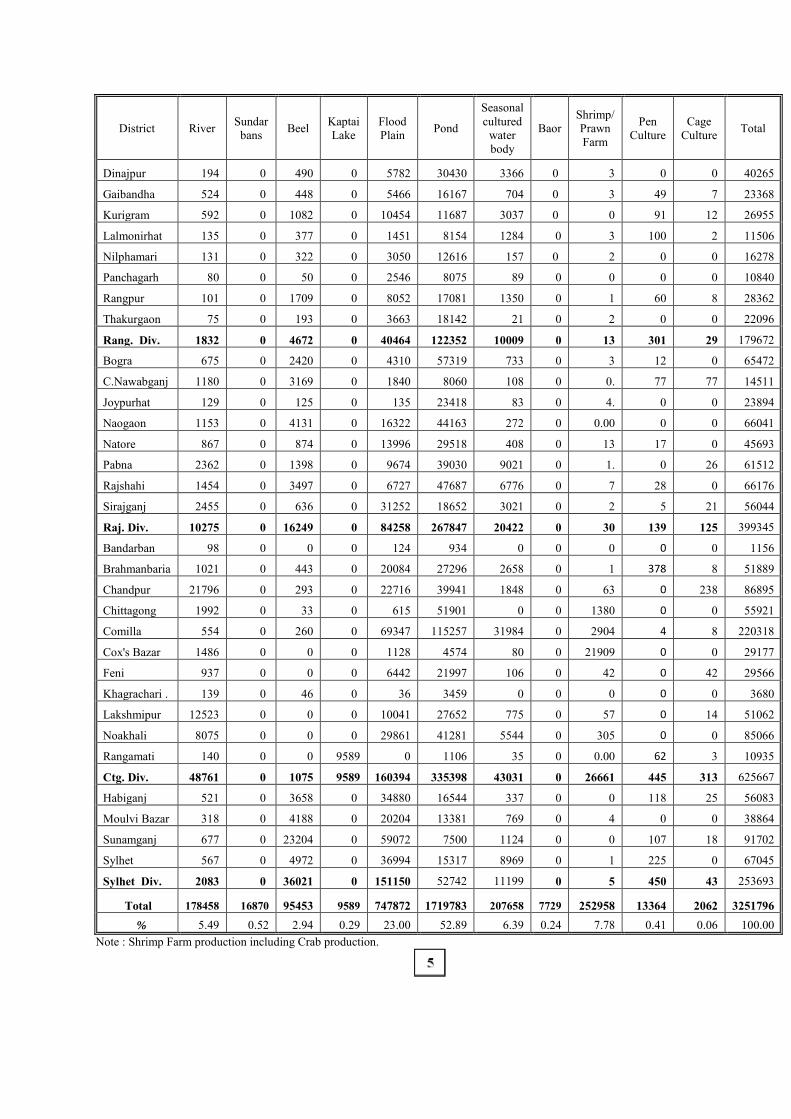
Table 3.4. District-wise Annual Fish Production in Inland Water, 2015-16 (Unit: Metric Ton)
District River Sundar bans Beel Kaptai
Lake Flood Plain Pond
Seasonal cultured
water body
Baor Shrimp/ Prawn Farm
Pen Culture
Cage Culture Total
Dhaka 552 0 770 0 4748 8017 3431 0 0 2566 21 20105
Faridpur 979 0 445 0 9218 11715 1730 443 4. 671 83 25288
Gazipur 224 0 1218 0 16397 21909 8296 0 0. 1233 0 49277
Gopalganj 269 0 625 0 6470 12381 1380 88 1545 4485 9 27252
Kishorganj 1253 0 6483 0 39350 18768 5278 0 6 1228 13 72379
Madaripur 663 0 222 0 7728 9318 183 196 70 248 38 18666
Manikganj 1229 0 508 0 10350 8918 3363 0 5 24 0 24397
Munshiganj 1394 0 161 0 11912 8097 4379 0 9. 122 85 26159
Narayanganj 793 0 114 0 1746 7483 2488 0 0.50 0 0 12625
Narsingdi 1176 0 1040 0 11646 16247 2258 0 0.49 45 657 33069
Rajbari 1112 0 226 0 6066 14408 1959 395 10 0 0 24176
Shariatpur 1008 0 33 0 5266 14124 2161 0 37 38 46 22713
Tangail 496 0 2198 0 10055 44158 6236 0 5 251 0 63399
Dhaka Div. 11148 0 14041 0 140952 195543 43142 1122 1692 10911 952 419503
Mymensingh 728 0 6503 0 10551 318385 4739 0 0.70 0 0 340906
Jamalpur 846 0 2933 0 29248 24173 2568 0 0 22 0 59790
Sherpur 116 0 6359 0 9429 13609 1082 0 0 440 93 31128
Netrakona 537 0 2348 0 2222 23918 6072 0 0 2 0 35099 Mymensingh Div. 2227 0 18143 0 51449 380085 14461 0 0 464 93 466922
Bagerhat 3191 15619 20 0 4451 15296 8376 0 52361 0 0 99314
Chuadanga 159 0 1025 0 1210 9598 1288 1091 0 0 0 14371
Jessore 536 0 1635 0 34905 125663 25401 2053 35574
0 0 225767
Jhenaidah 154 0 982 0 5694 19724 4726 1126 8 0 0 32414
Khulna 1950 814 127 0 18745 13597 0 169 61057 0 0 96459
Kushtia 702 0 417 0 3736 13811 1029 663 1 0 0 20359
Magura 660 0 302 0 1418 9231 255 624 12 0 0 12502
Meherpur 127 0 192 0 740 5324 197 433 2 0 0 7015
Narail 426 0 537 0 3716 3665 459 273 3876 0 0 12952
Satkhira 585 437 15 0 13598 33856 9115 177 67247 0 0 125030
Khulna Div. 8490 16870 5251 0 88213 249765 50847 6607 220139 0 0 646182
Barguna 2509 0 0 0 2451 6912 583 0 742 5 20 13222
Barisal 26767 0 22 0 8088 32296 12213 0 1372 258 446 81462
Bhola 52518 0 0 0 3605 40314 241 0 62 0 0 96740
Jhalokathi 971 0 9 0 3557 3965 431 0 33 36 21 9023
Patuakhali 7875 0 0 0 9727 24583 113 0 1376 196 10 43880
Pirojpur 3002 0 9 0 3562 7980 1003 0 827 161 10 16554
Barisal Div. 93642 0 39 0 30991 116050 14585 0 4412 655 508 260882
(Unit: Metric Ton)
District River Sundar bans Beel Kaptai
Lake Flood Plain Pond
Seasonal cultured
water body
Baor Shrimp/ Prawn Farm
Pen Culture
Cage Culture Total
Dinajpur 194 0 490 0 5782 30430 3366 0 3 0 0 40265
Gaibandha 524 0 448 0 5466 16167 704 0 3 49 7 23368
Kurigram 592 0 1082 0 10454 11687 3037 0 0 91 12 26955
Lalmonirhat 135 0 377 0 1451 8154 1284 0 3 100 2 11506
Nilphamari 131 0 322 0 3050 12616 157 0 2 0 0 16278
Panchagarh 80 0 50 0 2546 8075 89 0 0 0 0 10840
Rangpur 101 0 1709 0 8052 17081 1350 0 1 60 8 28362
Thakurgaon 75 0 193 0 3663 18142 21 0 2 0 0 22096
Rang. Div. 1832 0 4672 0 40464 122352 10009 0 13 301 29 179672
Bogra 675 0 2420 0 4310 57319 733 0 3 12 0 65472
C.Nawabganj 1180 0 3169 0 1840 8060 108 0 0. 77 77 14511
Joypurhat 129 0 125 0 135 23418 83 0 4. 0 0 23894
Naogaon 1153 0 4131 0 16322 44163 272 0 0.00 0 0 66041
Natore 867 0 874 0 13996 29518 408 0 13 17 0 45693
Pabna 2362 0 1398 0 9674 39030 9021 0 1. 0 26 61512
Rajshahi 1454 0 3497 0 6727 47687 6776 0 7 28 0 66176
Sirajganj 2455 0 636 0 31252 18652 3021 0 2 5 21 56044
Raj. Div. 10275 0 16249 0 84258 267847 20422 0 30 139 125 399345
Bandarban 98 0 0 0 124 934 0 0 0 0 0 1156
Brahmanbaria 1021 0 443 0 20084 27296 2658 0 1 378 8 51889
Chandpur 21796 0 293 0 22716 39941 1848 0 63 0 238 86895
Chittagong 1992 0 33 0 615 51901 0 0 1380 0 0 55921
Comilla 554 0 260 0 69347 115257 31984 0 2904 4 8 220318
Cox's Bazar 1486 0 0 0 1128 4574 80 0 21909 0 0 29177
Feni 937 0 0 0 6442 21997 106 0 42 0 42 29566
Khagrachari . 139 0 46 0 36 3459 0 0 0 0 0 3680
Lakshmipur 12523 0 0 0 10041 27652 775 0 57 0 14 51062
Noakhali 8075 0 0 0 29861 41281 5544 0 305 0 0 85066
Rangamati 140 0 0 9589 0 1106 35 0 0.00 62 3 10935
Ctg. Div. 48761 0 1075 9589 160394 335398 43031 0 26661 445 313 625667
Habiganj 521 0 3658 0 34880 16544 337 0 0 118 25 56083
Moulvi Bazar 318 0 4188 0 20204 13381 769 0 4 0 0 38864
Sunamganj 677 0 23204 0 59072 7500 1124 0 0 107 18 91702
Sylhet 567 0 4972 0 36994 15317 8969 0 1 225 0 67045
Sylhet Div. 2083 0 36021 0 151150 52742 11199 0 5 450 43 253693
Total 178458 16870 95453 9589 747872 1719783 207658 7729 252958 13364 2062 3251796 % 5.49 0.52 2.94 0.29 23.00 52.89 6.39 0.24 7.78 0.41 0.06 100.00
Note : Shrimp Farm production including Crab production.
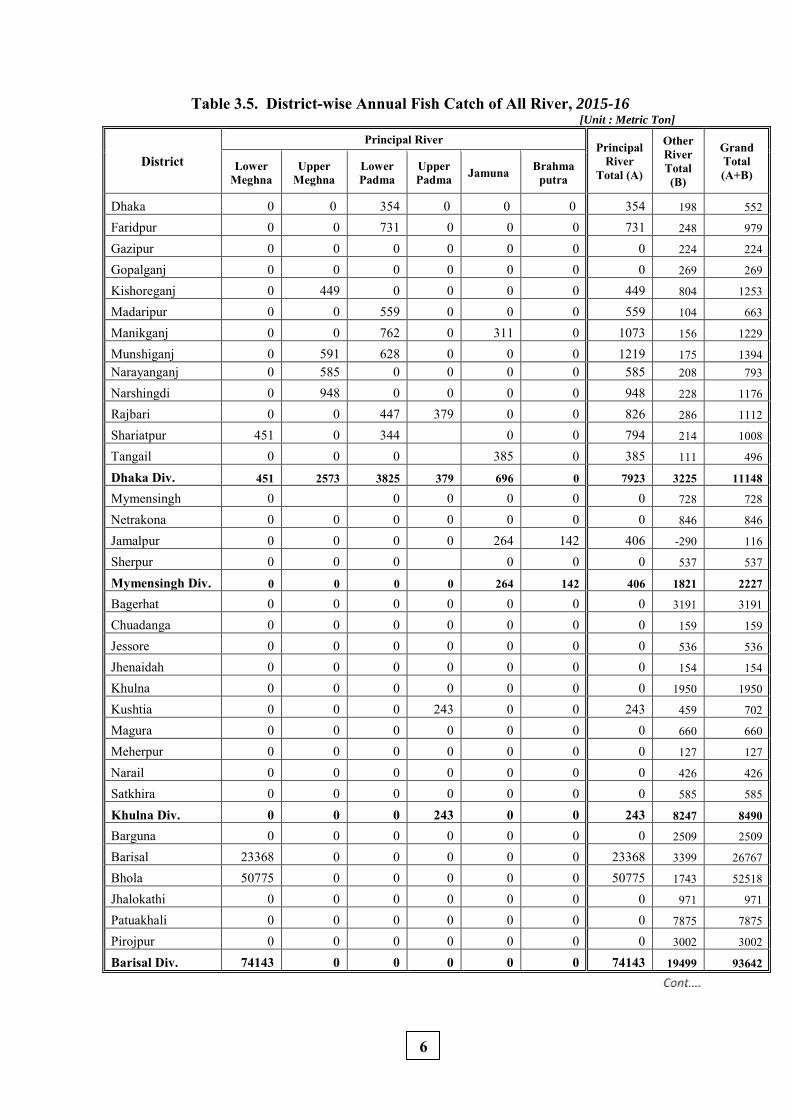
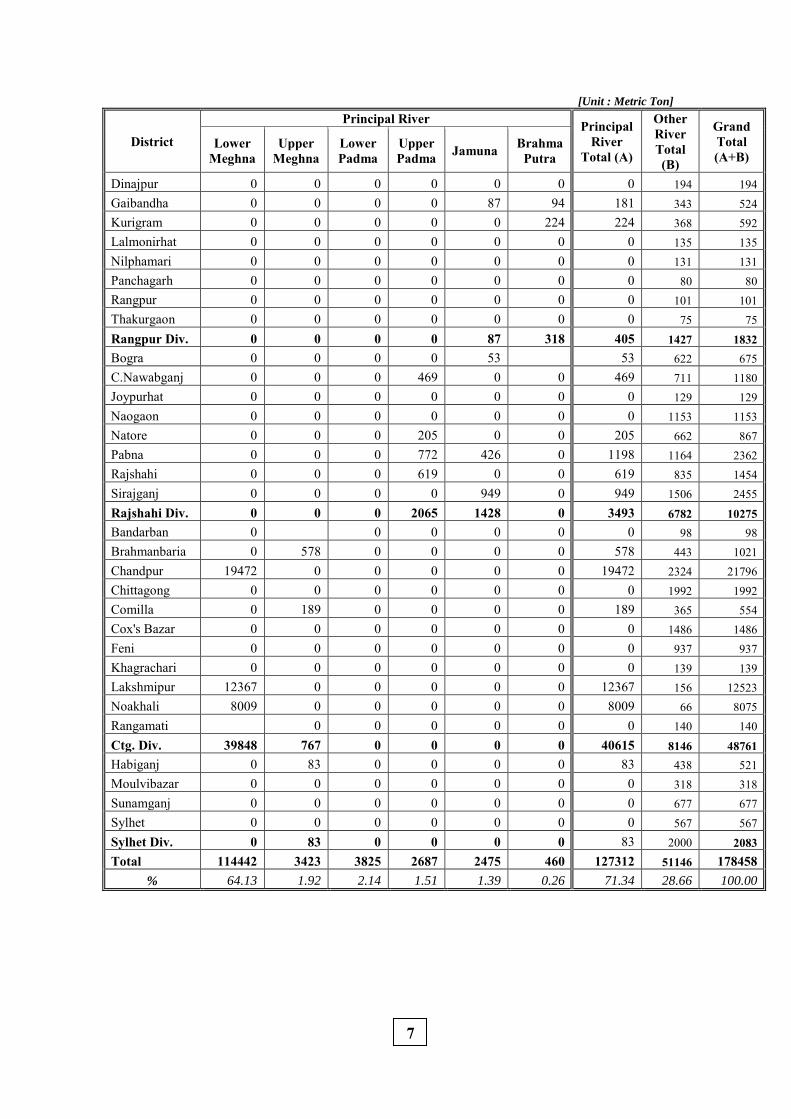
Table 3.5. District-wise Annual Fish Catch of All River, 2015-16
[Unit : Metric Ton]
District
Principal River Principal
River Total (A)
Other River Total (B)
Grand Total (A+B)
Lower Meghna
Upper Meghna
Lower Padma
Upper Padma Jamuna Brahma
putra
Dhaka 0 0 354 0 0 0 354 198 552
Faridpur 0 0 731 0 0 0 731 248 979
Gazipur 0 0 0 0 0 0 0 224 224
Gopalganj 0 0 0 0 0 0 0 269 269
Kishoreganj 0 449 0 0 0 0 449 804 1253
Madaripur 0 0 559 0 0 0 559 104 663
Manikganj 0 0 762 0 311 0 1073 156 1229
Munshiganj 0 591 628 0 0 0 1219 175 1394 Narayanganj 0 585 0 0 0 0 585 208 793
Narshingdi 0 948 0 0 0 0 948 228 1176
Rajbari 0 0 447 379 0 0 826 286 1112
Shariatpur 451 0 344 0 0 794 214 1008
Tangail 0 0 0 385 0 385 111 496
Dhaka Div. 451 2573 3825 379 696 0 7923 3225 11148
Mymensingh 0 0 0 0 0 0 728 728
Netrakona 0 0 0 0 0 0 0 846 846
Jamalpur 0 0 0 0 264 142 406 -290 116
Sherpur 0 0 0 0 0 0 537 537
Mymensingh Div. 0 0 0 0 264 142 406 1821 2227
Bagerhat 0 0 0 0 0 0 0 3191 3191
Chuadanga 0 0 0 0 0 0 0 159 159
Jessore 0 0 0 0 0 0 0 536 536
Jhenaidah 0 0 0 0 0 0 0 154 154
Khulna 0 0 0 0 0 0 0 1950 1950
Kushtia 0 0 0 243 0 0 243 459 702
Magura 0 0 0 0 0 0 0 660 660
Meherpur 0 0 0 0 0 0 0 127 127
Narail 0 0 0 0 0 0 0 426 426
Satkhira 0 0 0 0 0 0 0 585 585
Khulna Div. 0 0 0 243 0 0 243 8247 8490
Barguna 0 0 0 0 0 0 0 2509 2509
Barisal 23368 0 0 0 0 0 23368 3399 26767
Bhola 50775 0 0 0 0 0 50775 1743 52518
Jhalokathi 0 0 0 0 0 0 0 971 971
Patuakhali 0 0 0 0 0 0 0 7875 7875
Pirojpur 0 0 0 0 0 0 0 3002 3002
Barisal Div. 74143 0 0 0 0 0 74143 19499 93642
6
[Unit : Metric Ton]
District
Principal River Principal River
Total (A)
Other River Total (B)
Grand Total (A+B)
Lower Meghna
Upper Meghna
Lower Padma
Upper Padma Jamuna Brahma
Putra
Dinajpur 0 0 0 0 0 0 0 194 194 Gaibandha 0 0 0 0 87 94 181 343 524 Kurigram 0 0 0 0 0 224 224 368 592 Lalmonirhat 0 0 0 0 0 0 0 135 135 Nilphamari 0 0 0 0 0 0 0 131 131 Panchagarh 0 0 0 0 0 0 0 80 80 Rangpur 0 0 0 0 0 0 0 101 101 Thakurgaon 0 0 0 0 0 0 0 75 75 Rangpur Div. 0 0 0 0 87 318 405 1427 1832 Bogra 0 0 0 0 53 53 622 675 C.Nawabganj 0 0 0 469 0 0 469 711 1180 Joypurhat 0 0 0 0 0 0 0 129 129 Naogaon 0 0 0 0 0 0 0 1153 1153 Natore 0 0 0 205 0 0 205 662 867 Pabna 0 0 0 772 426 0 1198 1164 2362 Rajshahi 0 0 0 619 0 0 619 835 1454 Sirajganj 0 0 0 0 949 0 949 1506 2455 Rajshahi Div. 0 0 0 2065 1428 0 3493 6782 10275 Bandarban 0 0 0 0 0 0 98 98 Brahmanbaria 0 578 0 0 0 0 578 443 1021 Chandpur 19472 0 0 0 0 0 19472 2324 21796 Chittagong 0 0 0 0 0 0 0 1992 1992 Comilla 0 189 0 0 0 0 189 365 554 Cox's Bazar 0 0 0 0 0 0 0 1486 1486 Feni 0 0 0 0 0 0 0 937 937 Khagrachari 0 0 0 0 0 0 0 139 139 Lakshmipur 12367 0 0 0 0 0 12367 156 12523 Noakhali 8009 0 0 0 0 0 8009 66 8075 Rangamati 0 0 0 0 0 0 140 140 Ctg. Div. 39848 767 0 0 0 0 40615 8146 48761 Habiganj 0 83 0 0 0 0 83 438 521 Moulvibazar 0 0 0 0 0 0 0 318 318 Sunamganj 0 0 0 0 0 0 0 677 677 Sylhet 0 0 0 0 0 0 0 567 567 Sylhet Div. 0 83 0 0 0 0 83 2000 2083 Total 114442 3423 3825 2687 2475 460 127312 51146 178458
% 64.13 1.92 2.14 1.51 1.39 0.26 71.34 28.66 100.00
7
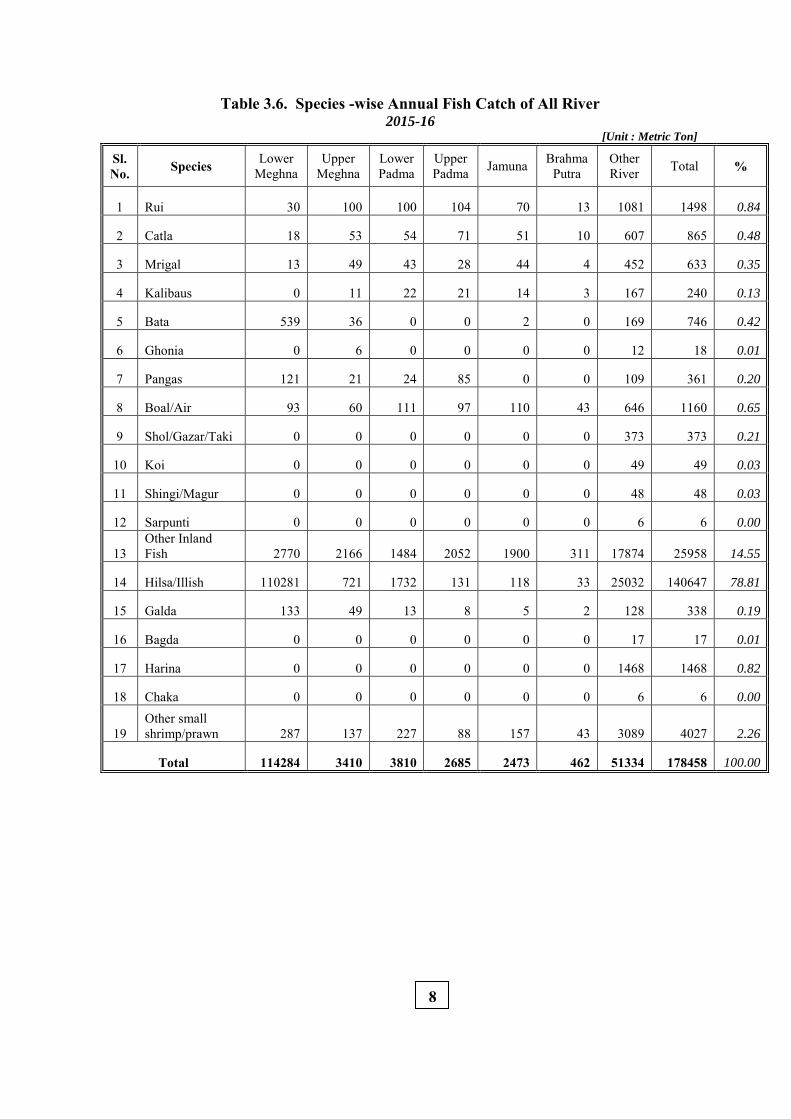
Table 3.6. Species -wise Annual Fish Catch of All River 2015-16
[Unit : Metric Ton]
Sl. No. Species Lower
Meghna Upper
Meghna Lower Padma
Upper Padma Jamuna Brahma
Putra Other River Total %
1 Rui 30 100 100 104 70 13 1081 1498 0.84
2 Catla 18 53 54 71 51 10 607 865 0.48
3 Mrigal 13 49 43 28 44 4 452 633 0.35
4 Kalibaus 0 11 22 21 14 3 167 240 0.13
5 Bata 539 36 0 0 2 0 169 746 0.42
6 Ghonia 0 6 0 0 0 0 12 18 0.01
7 Pangas 121 21 24 85 0 0 109 361 0.20
8 Boal/Air 93 60 111 97 110 43 646 1160 0.65
9 Shol/Gazar/Taki 0 0 0 0 0 0 373 373 0.21
10 Koi 0 0 0 0 0 0 49 49 0.03
11 Shingi/Magur 0 0 0 0 0 0 48 48 0.03
12 Sarpunti 0 0 0 0 0 0 6 6 0.00
13 Other Inland Fish 2770 2166 1484 2052 1900 311 17874 25958 14.55
14 Hilsa/Illish 110281 721 1732 131 118 33 25032 140647 78.81
15 Galda 133 49 13 8 5 2 128 338 0.19
16 Bagda 0 0 0 0 0 0 17 17 0.01
17 Harina 0 0 0 0 0 0 1468 1468 0.82
18 Chaka 0 0 0 0 0 0 6 6 0.00
19 Other small shrimp/prawn 287 137 227 88 157 43 3089 4027 2.26
Total 114284 3410 3810 2685 2473 462 51334 178458 100.00
8
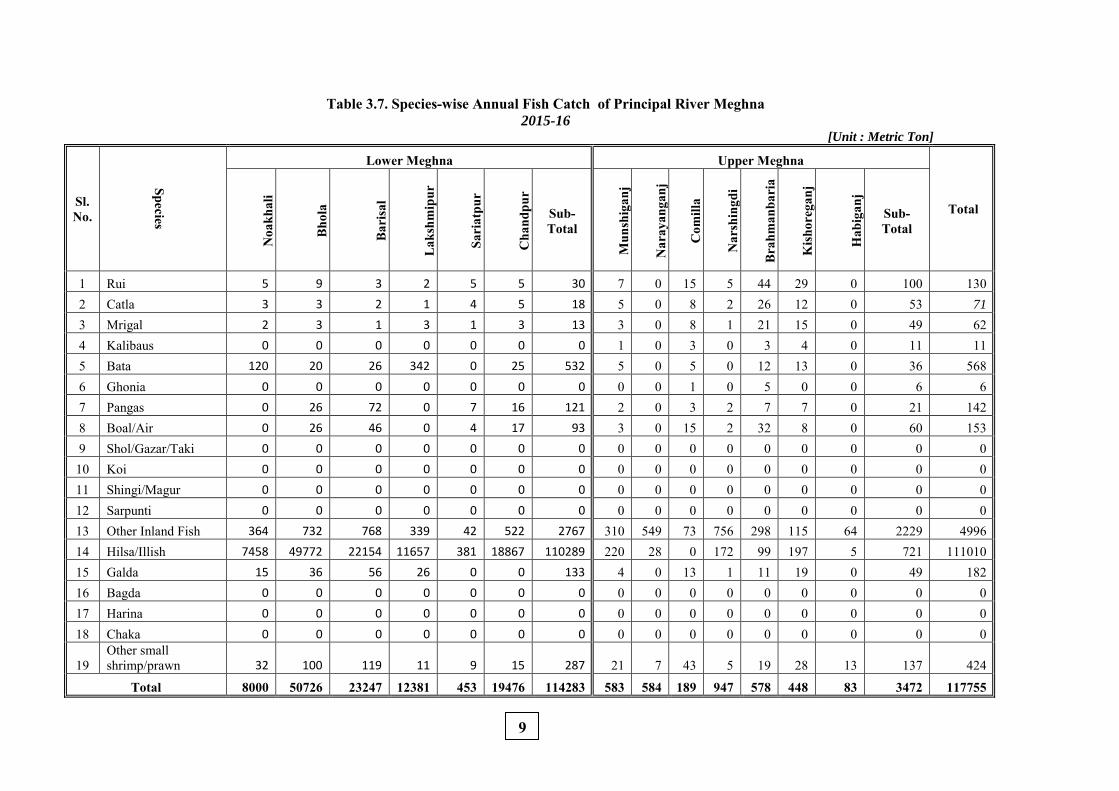
Table 3.7. Species-wise Annual Fish Catch of Principal River Meghna 2015-16
[Unit : Metric Ton]
Sl. No.
Species
Lower Meghna Upper Meghna
Total
Noa
khal
i
Bho
la
Bar
isal
Lak
shm
ipur
Sari
atpu
r
Cha
ndpu
r
Sub- Total
Mun
shig
anj
Nar
ayan
ganj
Com
illa
Nar
shin
gdi
Bra
hman
bari
a
Kis
hore
ganj
Hab
igan
j
Sub- Total
1 Rui 5 9 3 2 5 5 30 7 0 15 5 44 29 0 100 130 2 Catla 3 3 2 1 4 5 18 5 0 8 2 26 12 0 53 71
3 Mrigal 2 3 1 3 1 3 13 3 0 8 1 21 15 0 49 62 4 Kalibaus 0 0 0 0 0 0 0 1 0 3 0 3 4 0 11 11 5 Bata 120 20 26 342 0 25 532 5 0 5 0 12 13 0 36 568 6 Ghonia 0 0 0 0 0 0 0 0 0 1 0 5 0 0 6 6 7 Pangas 0 26 72 0 7 16 121 2 0 3 2 7 7 0 21 142 8 Boal/Air 0 26 46 0 4 17 93 3 0 15 2 32 8 0 60 153 9 Shol/Gazar/Taki 0 0 0 0 0 0 0 0 0 0 0 0 0 0 0 0 10 Koi 0 0 0 0 0 0 0 0 0 0 0 0 0 0 0 0 11 Shingi/Magur 0 0 0 0 0 0 0 0 0 0 0 0 0 0 0 0 12 Sarpunti 0 0 0 0 0 0 0 0 0 0 0 0 0 0 0 0 13 Other Inland Fish 364 732 768 339 42 522 2767 310 549 73 756 298 115 64 2229 4996 14 Hilsa/Illish 7458 49772 22154 11657 381 18867 110289 220 28 0 172 99 197 5 721 111010 15 Galda 15 36 56 26 0 0 133 4 0 13 1 11 19 0 49 182 16 Bagda 0 0 0 0 0 0 0 0 0 0 0 0 0 0 0 0 17 Harina 0 0 0 0 0 0 0 0 0 0 0 0 0 0 0 0 18 Chaka 0 0 0 0 0 0 0 0 0 0 0 0 0 0 0 0
19 Other small shrimp/prawn 32 100 119 11 9 15 287 21 7 43 5 19 28 13 137 424
Total 8000 50726 23247 12381 453 19476 114283 583 584 189 947 578 448 83 3472 117755
9
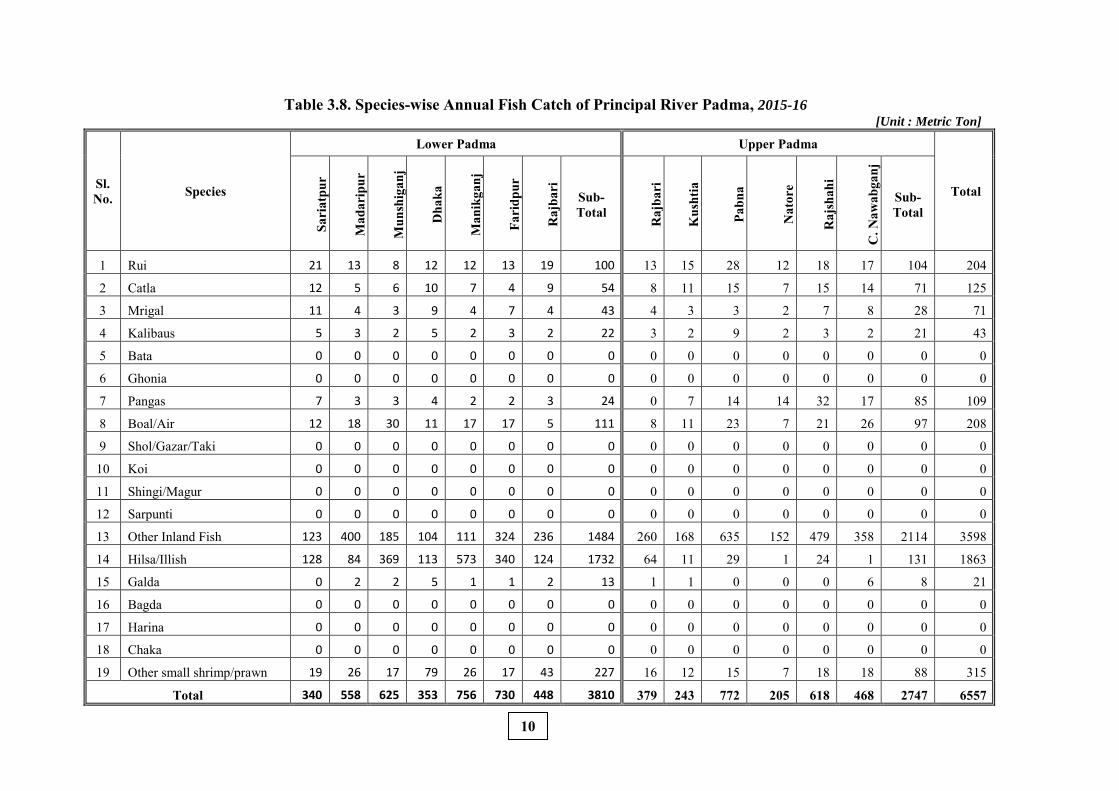
Table 3.8. Species-wise Annual Fish Catch of Principal River Padma, 2015-16 [Unit : Metric Ton]
Sl. No. Species
Lower Padma Upper Padma
Total
Sari
atpu
r
Mad
arip
ur
Mun
shig
anj
Dha
ka
Man
ikga
nj
Fari
dpur
Raj
bari
Sub- Total
Raj
bari
Kus
htia
Pabn
a
Nat
ore
Raj
shah
i
C. N
awab
ganj
Sub- Total
1 Rui 21 13 8 12 12 13 19 100 13 15 28 12 18 17 104 204
2 Catla 12 5 6 10 7 4 9 54 8 11 15 7 15 14 71 125
3 Mrigal 11 4 3 9 4 7 4 43 4 3 3 2 7 8 28 71
4 Kalibaus 5 3 2 5 2 3 2 22 3 2 9 2 3 2 21 43
5 Bata 0 0 0 0 0 0 0 0 0 0 0 0 0 0 0 0
6 Ghonia 0 0 0 0 0 0 0 0 0 0 0 0 0 0 0 0
7 Pangas 7 3 3 4 2 2 3 24 0 7 14 14 32 17 85 109
8 Boal/Air 12 18 30 11 17 17 5 111 8 11 23 7 21 26 97 208
9 Shol/Gazar/Taki 0 0 0 0 0 0 0 0 0 0 0 0 0 0 0 0
10 Koi 0 0 0 0 0 0 0 0 0 0 0 0 0 0 0 0
11 Shingi/Magur 0 0 0 0 0 0 0 0 0 0 0 0 0 0 0 0
12 Sarpunti 0 0 0 0 0 0 0 0 0 0 0 0 0 0 0 0
13 Other Inland Fish 123 400 185 104 111 324 236 1484 260 168 635 152 479 358 2114 3598
14 Hilsa/Illish 128 84 369 113 573 340 124 1732 64 11 29 1 24 1 131 1863
15 Galda 0 2 2 5 1 1 2 13 1 1 0 0 0 6 8 21
16 Bagda 0 0 0 0 0 0 0 0 0 0 0 0 0 0 0 0
17 Harina 0 0 0 0 0 0 0 0 0 0 0 0 0 0 0 0
18 Chaka 0 0 0 0 0 0 0 0 0 0 0 0 0 0 0 0
19 Other small shrimp/prawn 19 26 17 79 26 17 43 227 16 12 15 7 18 18 88 315
Total 340 558 625 353 756 730 448 3810 379 243 772 205 618 468 2747 6557
101
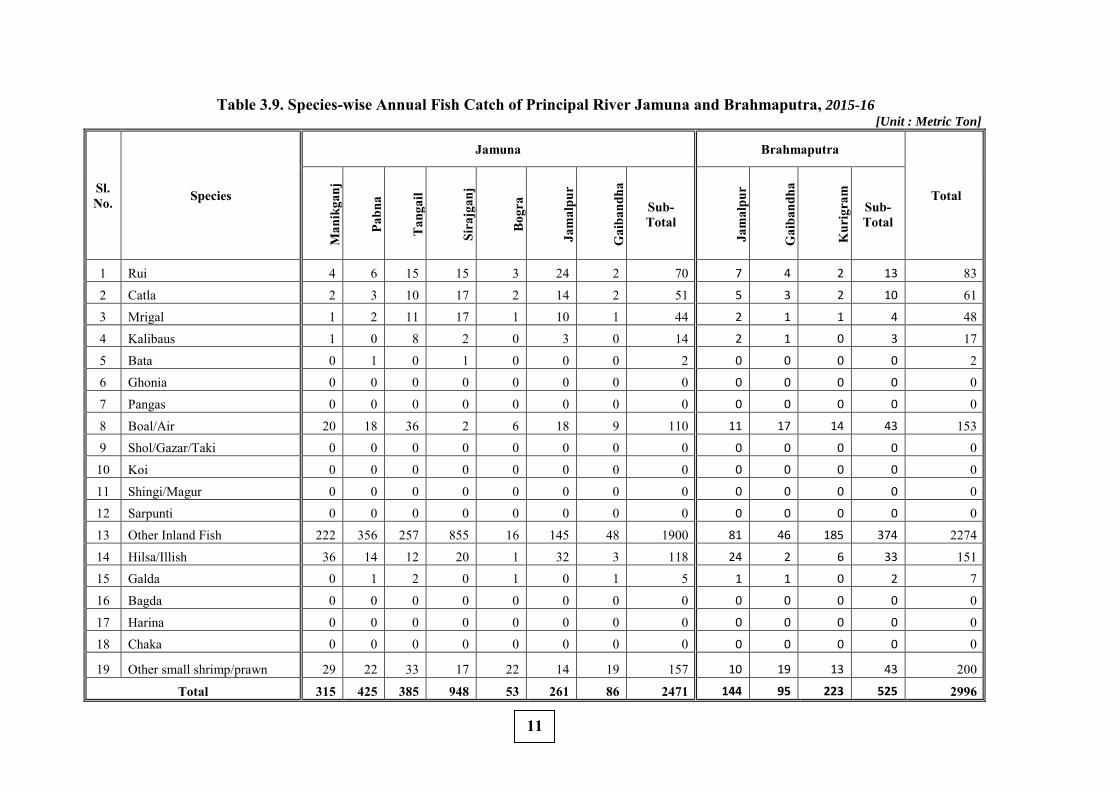
Table 3.9. Species-wise Annual Fish Catch of Principal River Jamuna and Brahmaputra, 2015-16 [Unit : Metric Ton]
Sl. No. Species
Jamuna Brahmaputra
Total
Man
ikga
nj
Pabn
a
Tan
gail
Sira
jgan
j
Bog
ra
Jam
alpu
r
Gai
band
ha
Sub- Total
Jam
alpu
r
Gai
band
ha
Kur
igra
m
Sub- Total
1 Rui 4 6 15 15 3 24 2 70 7 4 2 13 83
2 Catla 2 3 10 17 2 14 2 51 5 3 2 10 61 3 Mrigal 1 2 11 17 1 10 1 44 2 1 1 4 48
4 Kalibaus 1 0 8 2 0 3 0 14 2 1 0 3 17
5 Bata 0 1 0 1 0 0 0 2 0 0 0 0 2 6 Ghonia 0 0 0 0 0 0 0 0 0 0 0 0 0
7 Pangas 0 0 0 0 0 0 0 0 0 0 0 0 0
8 Boal/Air 20 18 36 2 6 18 9 110 11 17 14 43 153 9 Shol/Gazar/Taki 0 0 0 0 0 0 0 0 0 0 0 0 0
10 Koi 0 0 0 0 0 0 0 0 0 0 0 0 0
11 Shingi/Magur 0 0 0 0 0 0 0 0 0 0 0 0 0 12 Sarpunti 0 0 0 0 0 0 0 0 0 0 0 0 0
13 Other Inland Fish 222 356 257 855 16 145 48 1900 81 46 185 374 2274
14 Hilsa/Illish 36 14 12 20 1 32 3 118 24 2 6 33 151 15 Galda 0 1 2 0 1 0 1 5 1 1 0 2 7
16 Bagda 0 0 0 0 0 0 0 0 0 0 0 0 0
17 Harina 0 0 0 0 0 0 0 0 0 0 0 0 0 18 Chaka 0 0 0 0 0 0 0 0 0 0 0 0 0
19 Other small shrimp/prawn 29 22 33 17 22 14 19 157 10 19 13 43 200
Total 315 425 385 948 53 261 86 2471 144 95 223 525 2996
11
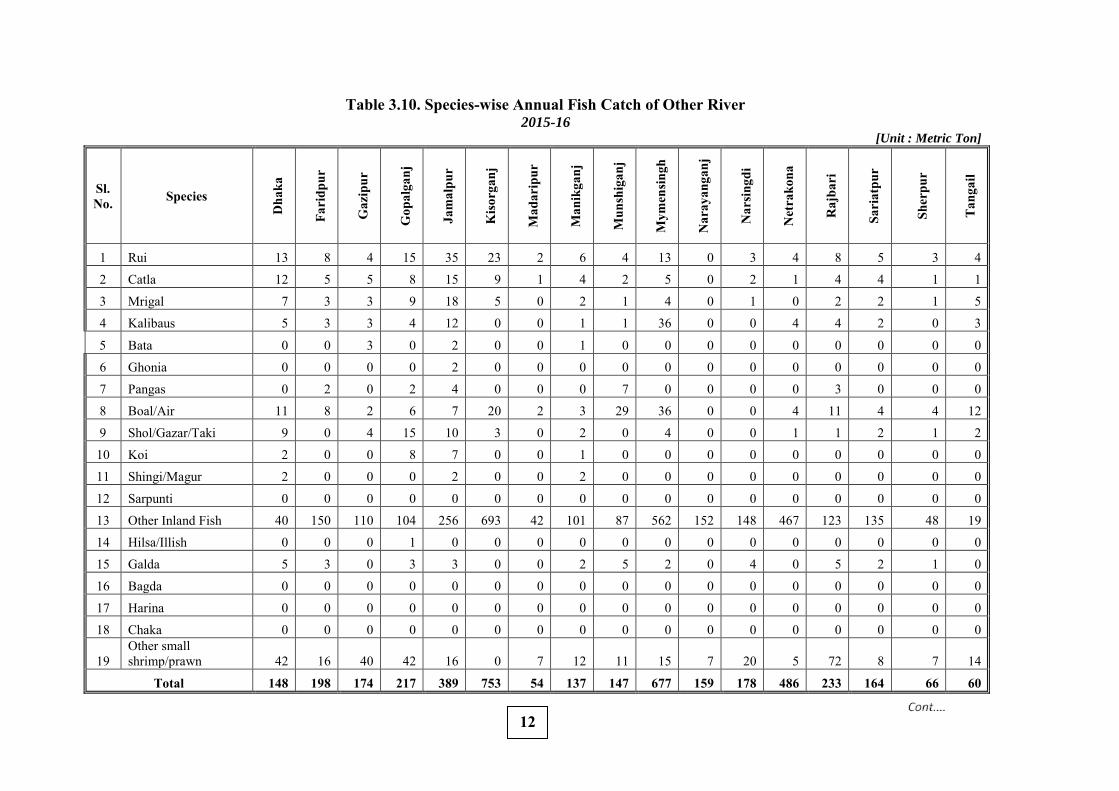
Table 3.10. Species-wise Annual Fish Catch of Other River 2015-16
[Unit : Metric Ton]
Sl. No. Species
Dha
ka
Fari
dpur
Gaz
ipur
Gop
alga
nj
Jam
alpu
r
Kis
orga
nj
Mad
arip
ur
Man
ikga
nj
Mun
shig
anj
Mym
ensi
ngh
Nar
ayan
ganj
Nar
sing
di
Net
rako
na
Raj
bari
Sari
atpu
r
Sher
pur
Tan
gail
1 Rui 13 8 4 15 35 23 2 6 4 13 0 3 4 8 5 3 4
2 Catla 12 5 5 8 15 9 1 4 2 5 0 2 1 4 4 1 1
3 Mrigal 7 3 3 9 18 5 0 2 1 4 0 1 0 2 2 1 5
4 Kalibaus 5 3 3 4 12 0 0 1 1 36 0 0 4 4 2 0 3
5 Bata 0 0 3 0 2 0 0 1 0 0 0 0 0 0 0 0 0
6 Ghonia 0 0 0 0 2 0 0 0 0 0 0 0 0 0 0 0 0
7 Pangas 0 2 0 2 4 0 0 0 7 0 0 0 0 3 0 0 0
8 Boal/Air 11 8 2 6 7 20 2 3 29 36 0 0 4 11 4 4 12
9 Shol/Gazar/Taki 9 0 4 15 10 3 0 2 0 4 0 0 1 1 2 1 2
10 Koi 2 0 0 8 7 0 0 1 0 0 0 0 0 0 0 0 0
11 Shingi/Magur 2 0 0 0 2 0 0 2 0 0 0 0 0 0 0 0 0
12 Sarpunti 0 0 0 0 0 0 0 0 0 0 0 0 0 0 0 0 0
13 Other Inland Fish 40 150 110 104 256 693 42 101 87 562 152 148 467 123 135 48 19
14 Hilsa/Illish 0 0 0 1 0 0 0 0 0 0 0 0 0 0 0 0 0
15 Galda 5 3 0 3 3 0 0 2 5 2 0 4 0 5 2 1 0
16 Bagda 0 0 0 0 0 0 0 0 0 0 0 0 0 0 0 0 0
17 Harina 0 0 0 0 0 0 0 0 0 0 0 0 0 0 0 0 0
18 Chaka 0 0 0 0 0 0 0 0 0 0 0 0 0 0 0 0 0
19 Other small shrimp/prawn 42 16 40 42 16 0 7 12 11 15 7 20 5 72 8 7 14
Total 148 198 174 217 389 753 54 137 147 677 159 178 486 233 164 66 60
12
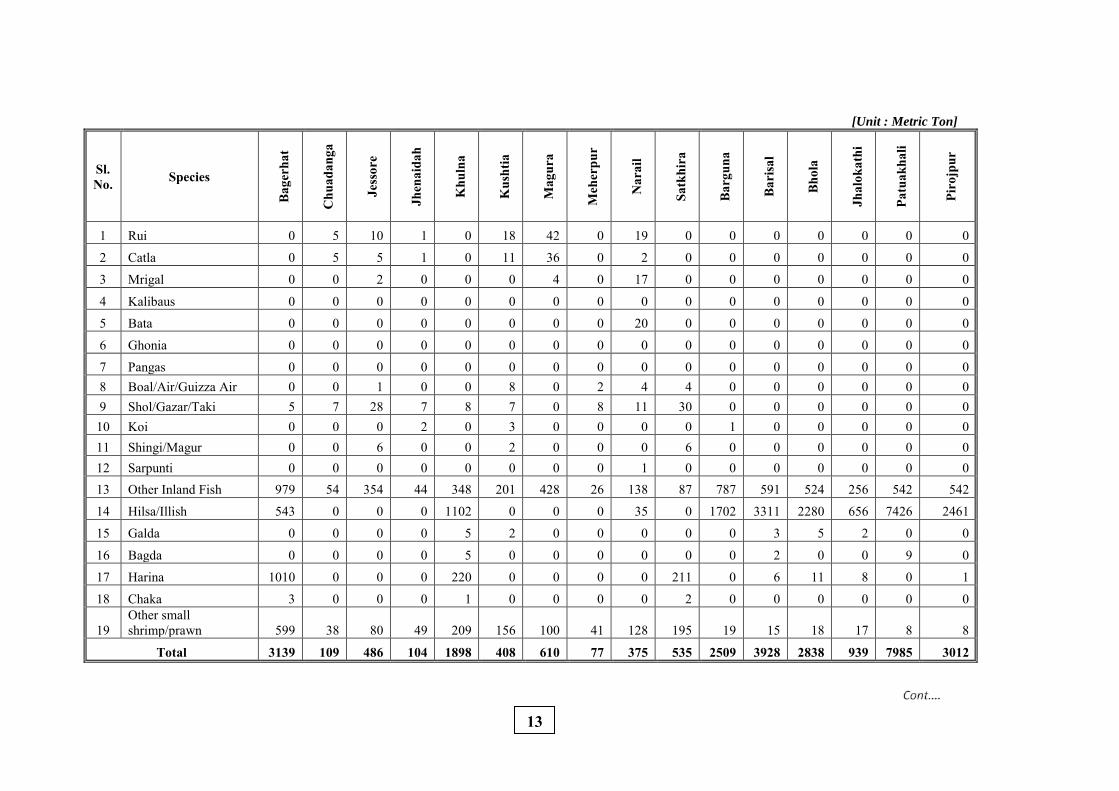
[Unit : Metric Ton]
Sl. No. Species
Bag
erha
t
Chu
adan
ga
Jess
ore
Jhen
aida
h
Khu
lna
Kus
htia
Mag
ura
Meh
erpu
r
Nar
ail
Satk
hira
Bar
guna
Bar
isal
Bho
la
Jhal
okat
hi
Patu
akha
li
Piro
jpur
1 Rui 0 5 10 1 0 18 42 0 19 0 0 0 0 0 0 0
2 Catla 0 5 5 1 0 11 36 0 2 0 0 0 0 0 0 0
3 Mrigal 0 0 2 0 0 0 4 0 17 0 0 0 0 0 0 0
4 Kalibaus 0 0 0 0 0 0 0 0 0 0 0 0 0 0 0 0
5 Bata 0 0 0 0 0 0 0 0 20 0 0 0 0 0 0 0
6 Ghonia 0 0 0 0 0 0 0 0 0 0 0 0 0 0 0 0
7 Pangas 0 0 0 0 0 0 0 0 0 0 0 0 0 0 0 0 8 Boal/Air/Guizza Air 0 0 1 0 0 8 0 2 4 4 0 0 0 0 0 0 9 Shol/Gazar/Taki 5 7 28 7 8 7 0 8 11 30 0 0 0 0 0 0 10 Koi 0 0 0 2 0 3 0 0 0 0 1 0 0 0 0 0 11 Shingi/Magur 0 0 6 0 0 2 0 0 0 6 0 0 0 0 0 0 12 Sarpunti 0 0 0 0 0 0 0 0 1 0 0 0 0 0 0 0 13 Other Inland Fish 979 54 354 44 348 201 428 26 138 87 787 591 524 256 542 542
14 Hilsa/Illish 543 0 0 0 1102 0 0 0 35 0 1702 3311 2280 656 7426 2461
15 Galda 0 0 0 0 5 2 0 0 0 0 0 3 5 2 0 0
16 Bagda 0 0 0 0 5 0 0 0 0 0 0 2 0 0 9 0
17 Harina 1010 0 0 0 220 0 0 0 0 211 0 6 11 8 0 1
18 Chaka 3 0 0 0 1 0 0 0 0 2 0 0 0 0 0 0
19 Other small shrimp/prawn 599 38 80 49 209 156 100 41 128 195 19 15 18 17 8 8
Total 3139 109 486 104 1898 408 610 77 375 535 2509 3928 2838 939 7985 3012
13
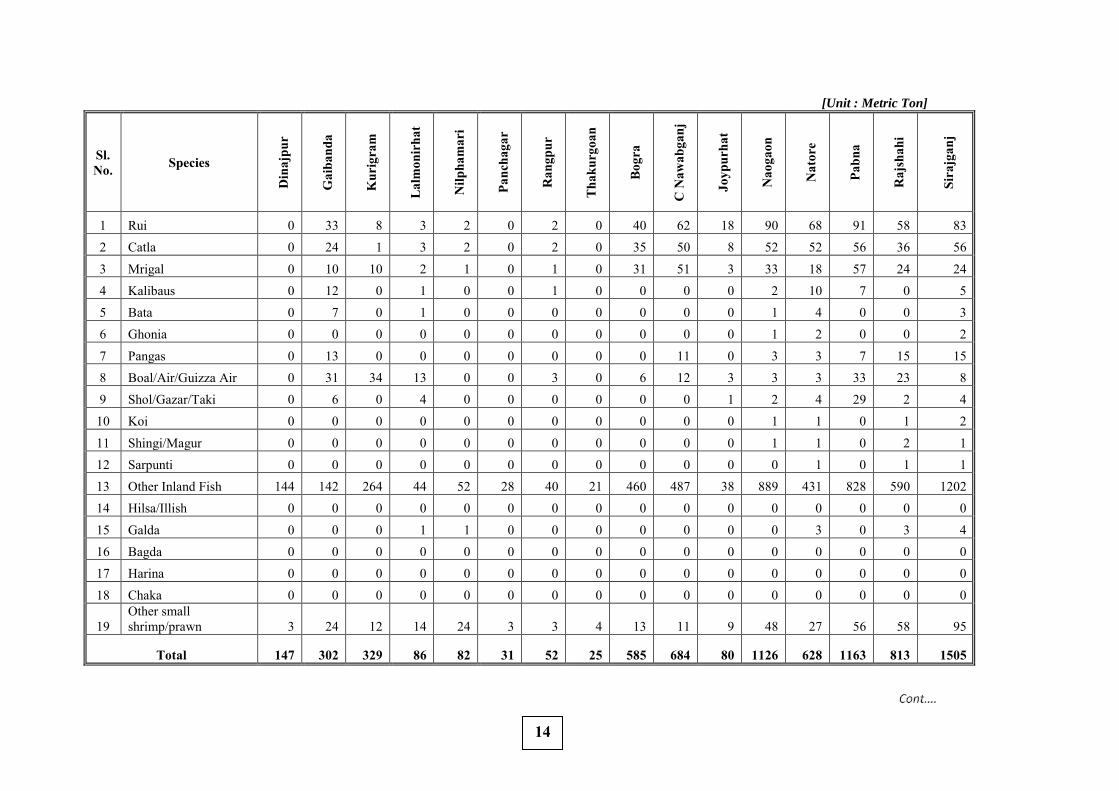
[Unit : Metric Ton]
Sl. No. Species
Din
ajpu
r
Gai
band
a
Kur
igra
m
Lal
mon
irha
t
Nilp
ham
ari
Panc
haga
r
Ran
gpur
Tha
kurg
oan
Bog
ra
C N
awab
ganj
Joyp
urha
t
Nao
gaon
Nat
ore
Pabn
a
Raj
shah
i
Sira
jgan
j
1 Rui 0 33 8 3 2 0 2 0 40 62 18 90 68 91 58 83 2 Catla 0 24 1 3 2 0 2 0 35 50 8 52 52 56 36 56
3 Mrigal 0 10 10 2 1 0 1 0 31 51 3 33 18 57 24 24 4 Kalibaus 0 12 0 1 0 0 1 0 0 0 0 2 10 7 0 5 5 Bata 0 7 0 1 0 0 0 0 0 0 0 1 4 0 0 3 6 Ghonia 0 0 0 0 0 0 0 0 0 0 0 1 2 0 0 2
7 Pangas 0 13 0 0 0 0 0 0 0 11 0 3 3 7 15 15 8 Boal/Air/Guizza Air 0 31 34 13 0 0 3 0 6 12 3 3 3 33 23 8 9 Shol/Gazar/Taki 0 6 0 4 0 0 0 0 0 0 1 2 4 29 2 4 10 Koi 0 0 0 0 0 0 0 0 0 0 0 1 1 0 1 2
11 Shingi/Magur 0 0 0 0 0 0 0 0 0 0 0 1 1 0 2 1 12 Sarpunti 0 0 0 0 0 0 0 0 0 0 0 0 1 0 1 1 13 Other Inland Fish 144 142 264 44 52 28 40 21 460 487 38 889 431 828 590 1202 14 Hilsa/Illish 0 0 0 0 0 0 0 0 0 0 0 0 0 0 0 0
15 Galda 0 0 0 1 1 0 0 0 0 0 0 0 3 0 3 4 16 Bagda 0 0 0 0 0 0 0 0 0 0 0 0 0 0 0 0 17 Harina 0 0 0 0 0 0 0 0 0 0 0 0 0 0 0 0 18 Chaka 0 0 0 0 0 0 0 0 0 0 0 0 0 0 0 0
19 Other small shrimp/prawn 3 24 12 14 24 3 3 4 13 11 9 48 27 56 58 95
Total 147 302 329 86 82 31 52 25 585 684 80 1126 628 1163 813 1505
14
[Unit : Metric Ton]
Sl. No. Species
Ban
darb
an
Bra
hman
bari
a
Cha
ndpu
r
Chi
ttag
ong
Com
illa
Cox
's B
azar
Feni
Kha
grac
hari
Lak
shm
ipur
Noa
khal
i
Ran
gam
ati
Hab
igan
j
Mou
lovi
baza
r
Suna
mga
nj
Sylh
et
Total
1 Rui 2 34 60 15 42 0 35 0 5 5 2 13 6 28 28 1077 2 Catla 2 15 5 3 7 0 32 0 4 3 2 4 3 8 0 605 3 Mrigal 1 5 1 2 3 0 60 0 3 1 1 9 2 9 0 450 4 Kalibaus 0 3 5 2 3 0 0 0 0 0 1 0 0 0 36 166 5 Bata 0 2 0 0 0 0 49 0 15 7 1 0 9 43 0 168 6 Ghonia 0 2 1 0 0 0 2 0 0 0 0 0 0 0 0 12 7 Pangas 0 5 0 0 0 0 0 0 3 2 0 0 2 6 4 109 8 Boal/Air/Guizza Air 0 62 44 0 36 0 53 0 10 6 6 0 3 38 36 644 9 Shol/Gazar/Taki 0 7 52 0 10 0 45 0 6 4 4 0 2 13 11 372 10 Koi 0 2 0 0 2 0 0 0 5 2 0 0 2 4 2 49 11 Shingi/Magur 1 3 0 0 2 0 0 0 7 2 0 0 3 3 1 48 12 Sarpunti 0 1 0 0 1 0 0 0 0 0 0 0 0 0 0 6 13 Other Inland Fish 26 256 521 70 162 36 379 89 130 77 72 336 219 368 338 17809 14 Hilsa/Illish 0 0 2033 1822 0 1390 28 0 145 59 0 0 0 39 0 24941 15 Galda 0 2 4 15 15 12 0 0 8 3 0 0 1 1 0 128 16 Bagda 0 0 0 0 0 0 0 0 0 0 0 0 0 0 0 16 17 Harina 0 0 0 0 0 0 0 0 0 0 0 0 0 0 0 1463 18 Chaka 0 0 0 0 0 0 0 0 0 0 0 0 0 0 0 6
19 Other small shrimp/prawn 17 13 19 52 42 28 223 2 37 20 2 36 20 80 72 3077
Total 49 412 2745 1981 325 1466 906 91 378 191 91 398 272 640 528 51146
15
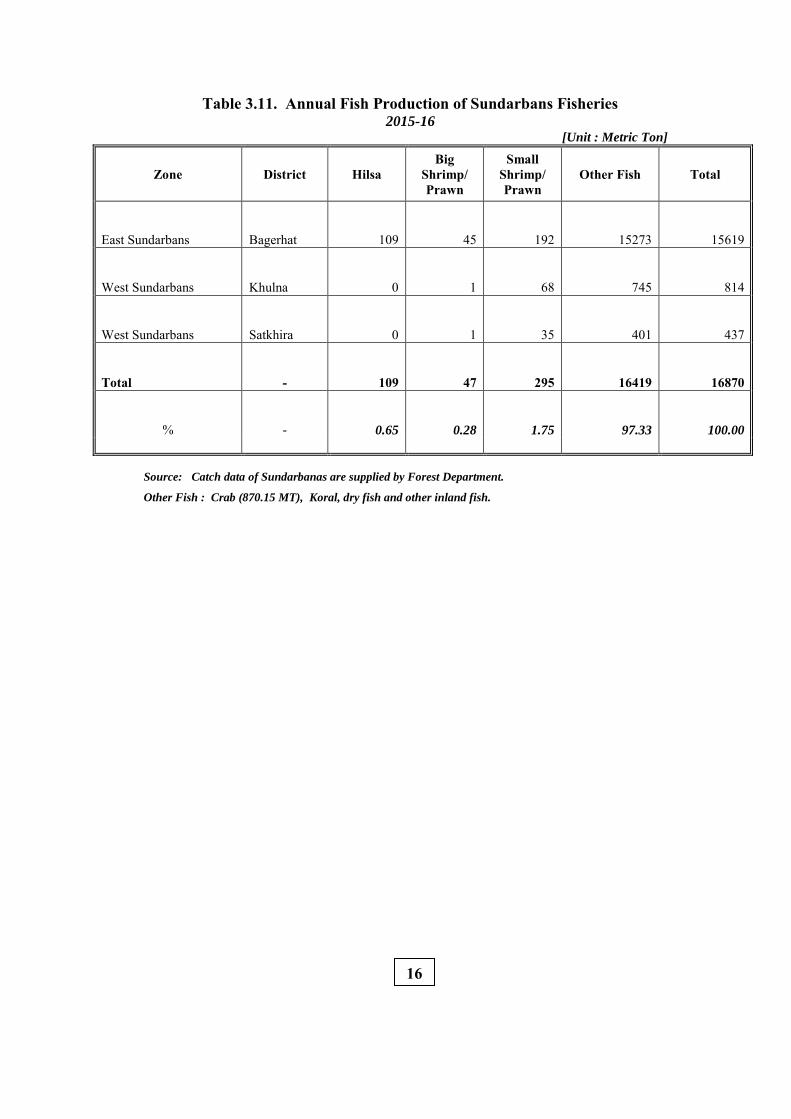
Table 3.11. Annual Fish Production of Sundarbans Fisheries 2015-16
[Unit : Metric Ton]
Zone District Hilsa Big
Shrimp/ Prawn
Small Shrimp/ Prawn
Other Fish Total
East Sundarbans Bagerhat 109 45 192 15273 15619
West Sundarbans Khulna 0 1 68 745 814
West Sundarbans Satkhira 0 1 35 401 437
Total - 109 47 295 16419 16870
% - 0.65 0.28 1.75 97.33 100.00
Source: Catch data of Sundarbanas are supplied by Forest Department. Other Fish : Crab (870.15 MT), Koral, dry fish and other inland fish.
16
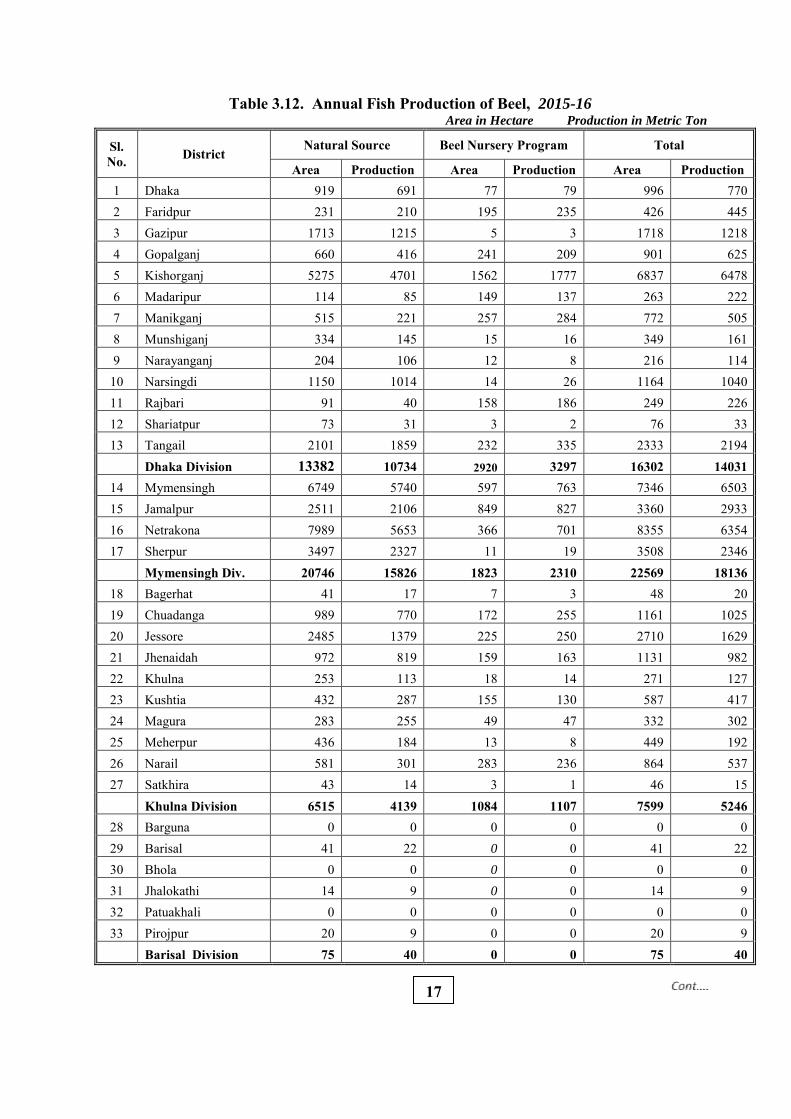
Table 3.12. Annual Fish Production of Beel, 2015-16 Area in Hectare Production in Metric Ton
Sl. No. District
Natural Source Beel Nursery Program Total
Area Production Area Production Area Production 1 Dhaka 919 691 77 79 996 770 2 Faridpur 231 210 195 235 426 445 3 Gazipur 1713 1215 5 3 1718 1218 4 Gopalganj 660 416 241 209 901 625 5 Kishorganj 5275 4701 1562 1777 6837 6478 6 Madaripur 114 85 149 137 263 222 7 Manikganj 515 221 257 284 772 505 8 Munshiganj 334 145 15 16 349 161 9 Narayanganj 204 106 12 8 216 114
10 Narsingdi 1150 1014 14 26 1164 1040 11 Rajbari 91 40 158 186 249 226 12 Shariatpur 73 31 3 2 76 33 13 Tangail 2101 1859 232 335 2333 2194 Dhaka Division 13382 10734 2920 3297 16302 14031
14 Mymensingh 6749 5740 597 763 7346 6503 15 Jamalpur 2511 2106 849 827 3360 2933 16 Netrakona 7989 5653 366 701 8355 6354 17 Sherpur 3497 2327 11 19 3508 2346
Mymensingh Div. 20746 15826 1823 2310 22569 18136 18 Bagerhat 41 17 7 3 48 20 19 Chuadanga 989 770 172 255 1161 1025 20 Jessore 2485 1379 225 250 2710 1629 21 Jhenaidah 972 819 159 163 1131 982 22 Khulna 253 113 18 14 271 127 23 Kushtia 432 287 155 130 587 417 24 Magura 283 255 49 47 332 302 25 Meherpur 436 184 13 8 449 192 26 Narail 581 301 283 236 864 537 27 Satkhira 43 14 3 1 46 15 Khulna Division 6515 4139 1084 1107 7599 5246
28 Barguna 0 0 0 0 0 0 29 Barisal 41 22 0 0 41 22 30 Bhola 0 0 0 0 0 0 31 Jhalokathi 14 9 0 0 14 9 32 Patuakhali 0 0 0 0 0 0 33 Pirojpur 20 9 0 0 20 9 Barisal Division 75 40 0 0 75 40
17
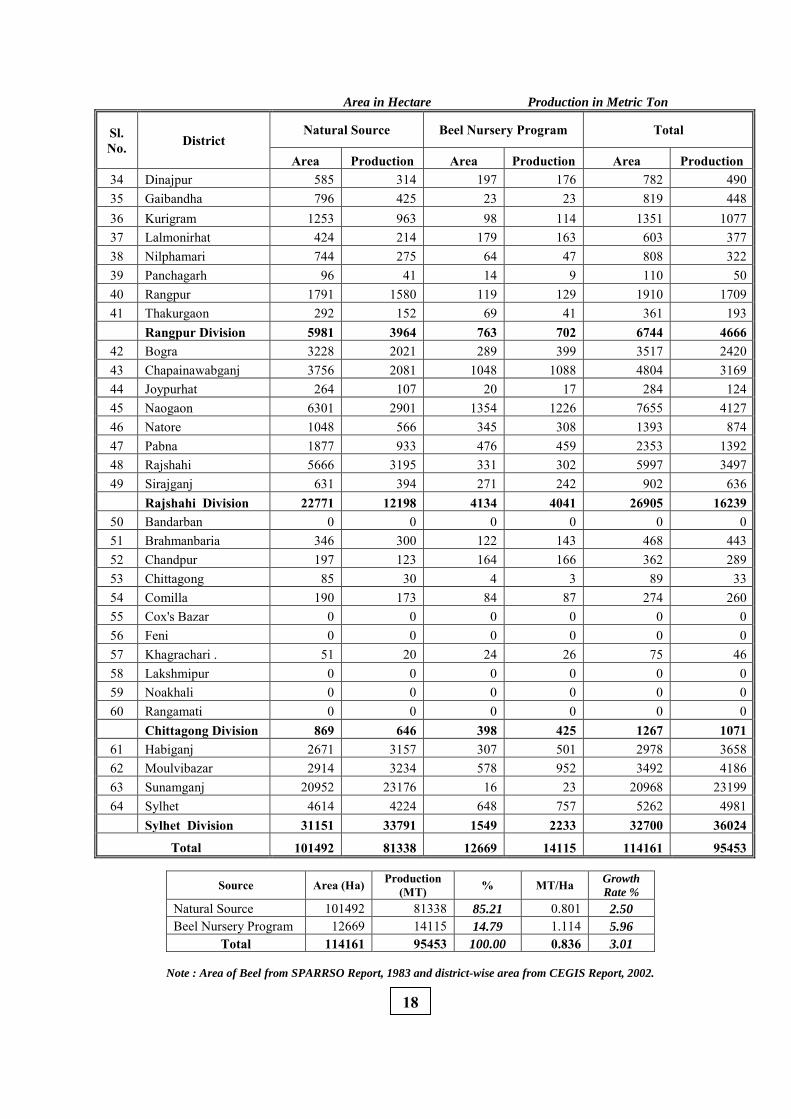
Area in Hectare Production in Metric Ton
Sl. No. District
Natural Source Beel Nursery Program Total
Area Production Area Production Area Production 34 Dinajpur 585 314 197 176 782 490 35 Gaibandha 796 425 23 23 819 448 36 Kurigram 1253 963 98 114 1351 1077 37 Lalmonirhat 424 214 179 163 603 377 38 Nilphamari 744 275 64 47 808 322 39 Panchagarh 96 41 14 9 110 50 40 Rangpur 1791 1580 119 129 1910 1709 41 Thakurgaon 292 152 69 41 361 193 Rangpur Division 5981 3964 763 702 6744 4666
42 Bogra 3228 2021 289 399 3517 2420 43 Chapainawabganj 3756 2081 1048 1088 4804 3169 44 Joypurhat 264 107 20 17 284 124 45 Naogaon 6301 2901 1354 1226 7655 4127 46 Natore 1048 566 345 308 1393 874 47 Pabna 1877 933 476 459 2353 1392 48 Rajshahi 5666 3195 331 302 5997 3497 49 Sirajganj 631 394 271 242 902 636 Rajshahi Division 22771 12198 4134 4041 26905 16239
50 Bandarban 0 0 0 0 0 0 51 Brahmanbaria 346 300 122 143 468 443 52 Chandpur 197 123 164 166 362 289 53 Chittagong 85 30 4 3 89 33 54 Comilla 190 173 84 87 274 260 55 Cox's Bazar 0 0 0 0 0 0 56 Feni 0 0 0 0 0 0 57 Khagrachari . 51 20 24 26 75 46 58 Lakshmipur 0 0 0 0 0 0 59 Noakhali 0 0 0 0 0 0 60 Rangamati 0 0 0 0 0 0 Chittagong Division 869 646 398 425 1267 1071
61 Habiganj 2671 3157 307 501 2978 3658 62 Moulvibazar 2914 3234 578 952 3492 4186 63 Sunamganj 20952 23176 16 23 20968 23199 64 Sylhet 4614 4224 648 757 5262 4981 Sylhet Division 31151 33791 1549 2233 32700 36024
Total 101492 81338 12669 14115 114161 95453
Source Area (Ha) Production (MT) % MT/Ha Growth
Rate %
Natural Source 101492 81338 85.21 0.801 2.50
Beel Nursery Program 12669 14115 14.79 1.114 5.96
Total 114161 95453 100.00 0.836 3.01
Note : Area of Beel from SPARRSO Report, 1983 and district-wise area from CEGIS Report, 2002.
18
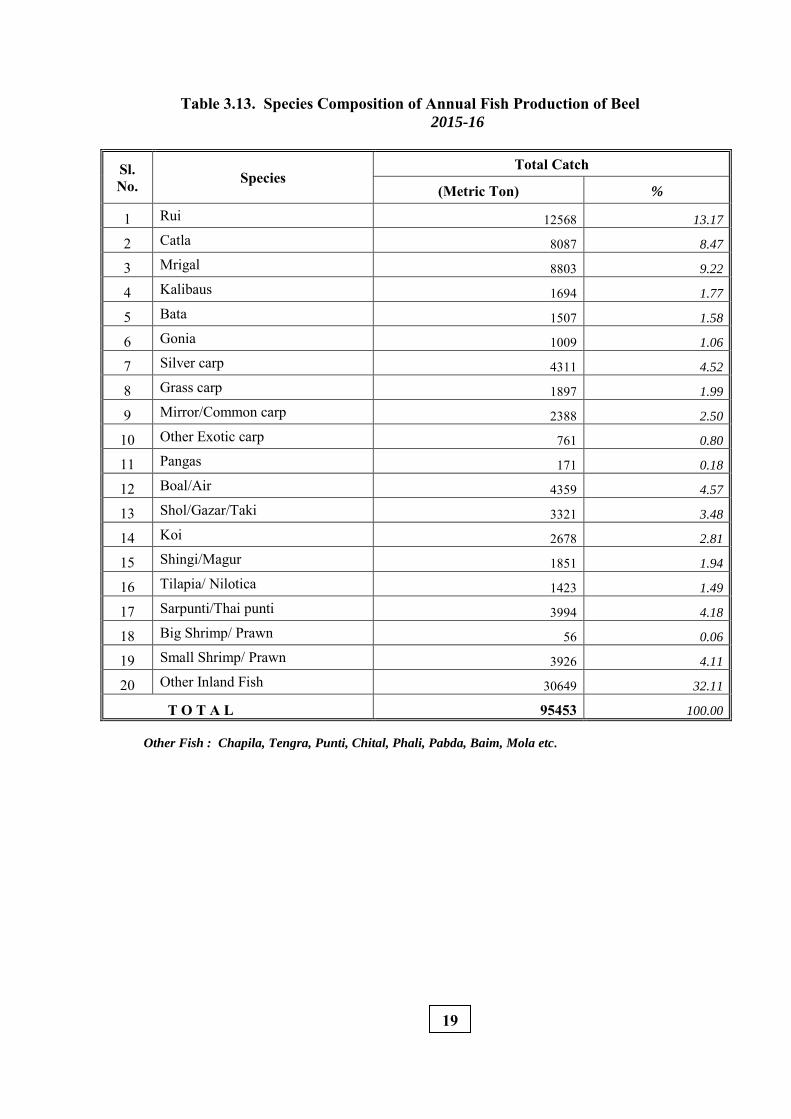
Table 3.13. Species Composition of Annual Fish Production of Beel 2015-16
Sl. No. Species
Total Catch
(Metric Ton) %
1 Rui 12568 13.17
2 Catla 8087 8.47
3 Mrigal 8803 9.22
4 Kalibaus 1694 1.77
5 Bata 1507 1.58
6 Gonia 1009 1.06
7 Silver carp 4311 4.52
8 Grass carp 1897 1.99
9 Mirror/Common carp 2388 2.50
10 Other Exotic carp 761 0.80
11 Pangas 171 0.18
12 Boal/Air 4359 4.57
13 Shol/Gazar/Taki 3321 3.48
14 Koi 2678 2.81
15 Shingi/Magur 1851 1.94
16 Tilapia/ Nilotica 1423 1.49
17 Sarpunti/Thai punti 3994 4.18
18 Big Shrimp/ Prawn 56 0.06
19 Small Shrimp/ Prawn 3926 4.11
20 Other Inland Fish 30649 32.11
T O T A L 95453 100.00
Other Fish : Chapila, Tengra, Punti, Chital, Phali, Pabda, Baim, Mola etc.
19
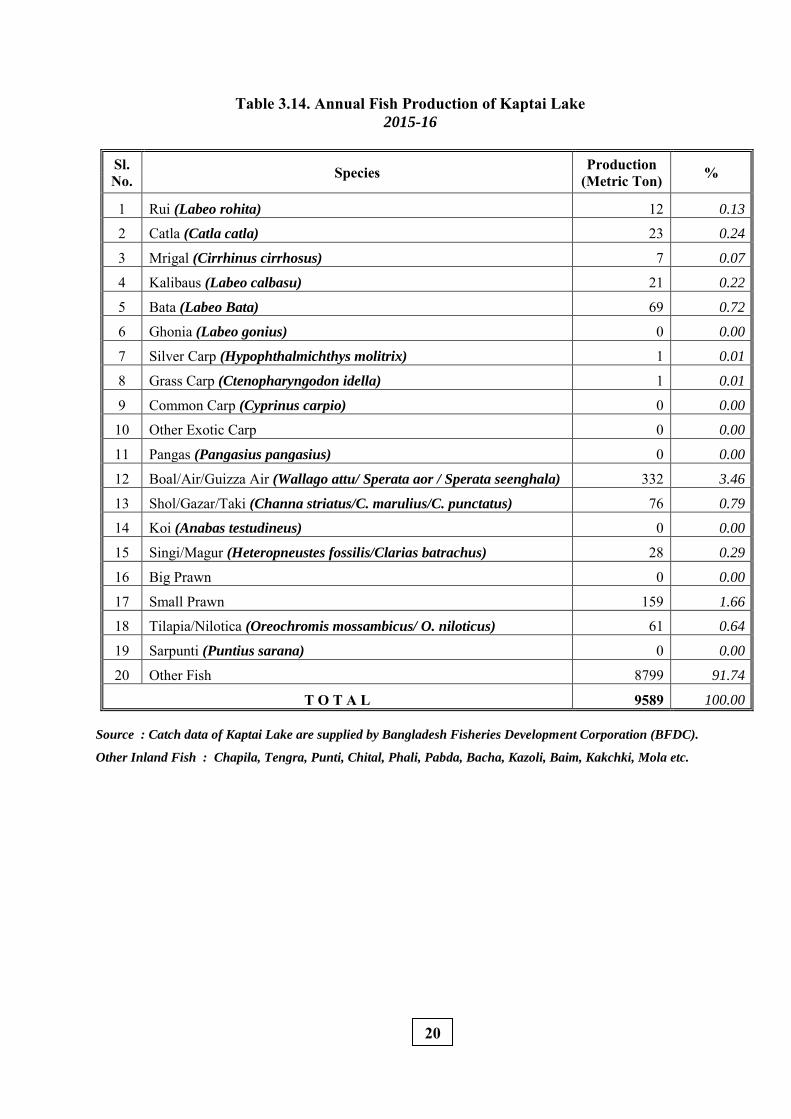
Table 3.14. Annual Fish Production of Kaptai Lake 2015-16
Sl. No. Species Production
(Metric Ton) %
1 Rui (Labeo rohita) 12 0.13
2 Catla (Catla catla) 23 0.24
3 Mrigal (Cirrhinus cirrhosus) 7 0.07
4 Kalibaus (Labeo calbasu) 21 0.22
5 Bata (Labeo Bata) 69 0.72
6 Ghonia (Labeo gonius) 0 0.00
7 Silver Carp (Hypophthalmichthys molitrix) 1 0.01
8 Grass Carp (Ctenopharyngodon idella) 1 0.01
9 Common Carp (Cyprinus carpio) 0 0.00
10 Other Exotic Carp 0 0.00
11 Pangas (Pangasius pangasius) 0 0.00
12 Boal/Air/Guizza Air (Wallago attu/ Sperata aor / Sperata seenghala) 332 3.46
13 Shol/Gazar/Taki (Channa striatus/C. marulius/C. punctatus) 76 0.79
14 Koi (Anabas testudineus) 0 0.00
15 Singi/Magur (Heteropneustes fossilis/Clarias batrachus) 28 0.29
16 Big Prawn 0 0.00
17 Small Prawn 159 1.66
18 Tilapia/Nilotica (Oreochromis mossambicus/ O. niloticus) 61 0.64
19 Sarpunti (Puntius sarana) 0 0.00
20 Other Fish 8799 91.74
T O T A L 9589 100.00
Source : Catch data of Kaptai Lake are supplied by Bangladesh Fisheries Development Corporation (BFDC).
Other Inland Fish : Chapila, Tengra, Punti, Chital, Phali, Pabda, Bacha, Kazoli, Baim, Kakchki, Mola etc.
20
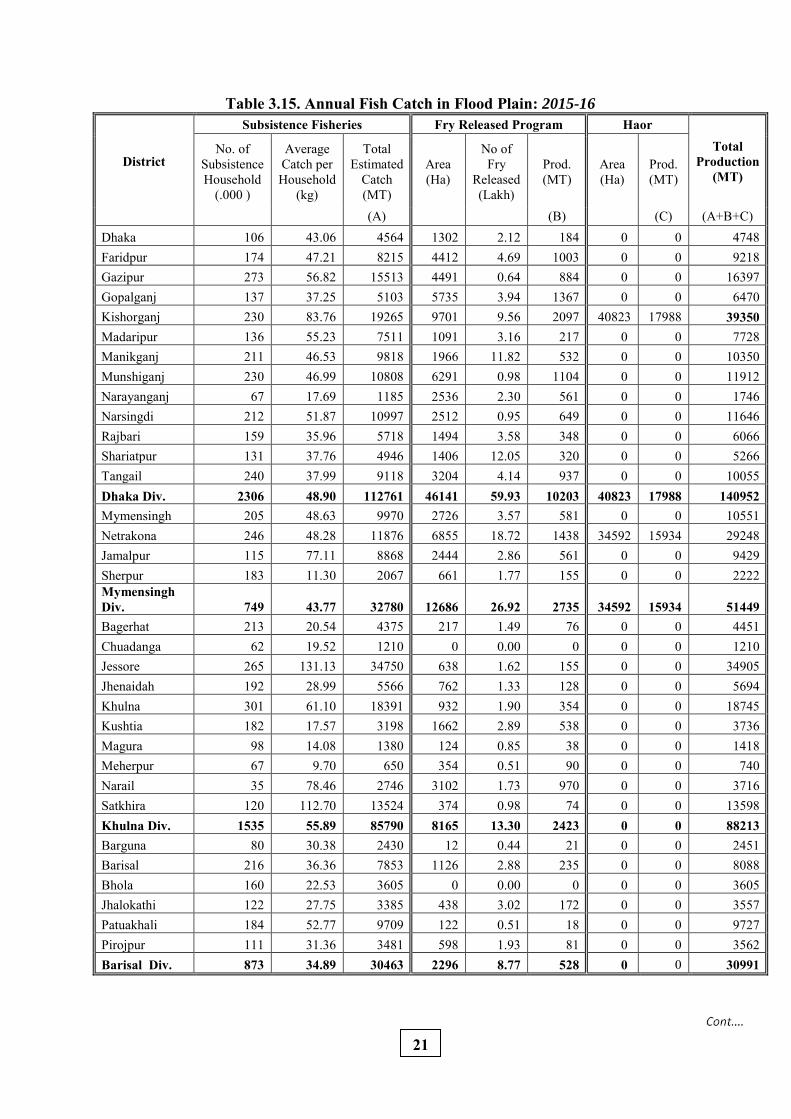
Table 3.15. Annual Fish Catch in Flood Plain: 2015-16
District
Subsistence Fisheries Fry Released Program Haor Total
Production (MT)
No. of Subsistence Household
(.000 )
Average Catch per Household
(kg)
Total Estimated
Catch (MT)
Area (Ha)
No of Fry
Released (Lakh)
Prod. (MT)
Area (Ha)
Prod. (MT)
(A) (B) (C) (A+B+C) Dhaka 106 43.06 4564 1302 2.12 184 0 0 4748 Faridpur 174 47.21 8215 4412 4.69 1003 0 0 9218 Gazipur 273 56.82 15513 4491 0.64 884 0 0 16397 Gopalganj 137 37.25 5103 5735 3.94 1367 0 0 6470 Kishorganj 230 83.76 19265 9701 9.56 2097 40823 17988 39350 Madaripur 136 55.23 7511 1091 3.16 217 0 0 7728 Manikganj 211 46.53 9818 1966 11.82 532 0 0 10350 Munshiganj 230 46.99 10808 6291 0.98 1104 0 0 11912 Narayanganj 67 17.69 1185 2536 2.30 561 0 0 1746 Narsingdi 212 51.87 10997 2512 0.95 649 0 0 11646 Rajbari 159 35.96 5718 1494 3.58 348 0 0 6066 Shariatpur 131 37.76 4946 1406 12.05 320 0 0 5266 Tangail 240 37.99 9118 3204 4.14 937 0 0 10055 Dhaka Div. 2306 48.90 112761 46141 59.93 10203 40823 17988 140952 Mymensingh 205 48.63 9970 2726 3.57 581 0 0 10551 Netrakona 246 48.28 11876 6855 18.72 1438 34592 15934 29248 Jamalpur 115 77.11 8868 2444 2.86 561 0 0 9429 Sherpur 183 11.30 2067 661 1.77 155 0 0 2222 Mymensingh Div. 749 43.77 32780 12686 26.92 2735 34592 15934 51449 Bagerhat 213 20.54 4375 217 1.49 76 0 0 4451 Chuadanga 62 19.52 1210 0 0.00 0 0 0 1210 Jessore 265 131.13 34750 638 1.62 155 0 0 34905 Jhenaidah 192 28.99 5566 762 1.33 128 0 0 5694 Khulna 301 61.10 18391 932 1.90 354 0 0 18745 Kushtia 182 17.57 3198 1662 2.89 538 0 0 3736 Magura 98 14.08 1380 124 0.85 38 0 0 1418 Meherpur 67 9.70 650 354 0.51 90 0 0 740 Narail 35 78.46 2746 3102 1.73 970 0 0 3716 Satkhira 120 112.70 13524 374 0.98 74 0 0 13598 Khulna Div. 1535 55.89 85790 8165 13.30 2423 0 0 88213 Barguna 80 30.38 2430 12 0.44 21 0 0 2451 Barisal 216 36.36 7853 1126 2.88 235 0 0 8088 Bhola 160 22.53 3605 0 0.00 0 0 0 3605 Jhalokathi 122 27.75 3385 438 3.02 172 0 0 3557 Patuakhali 184 52.77 9709 122 0.51 18 0 0 9727 Pirojpur 111 31.36 3481 598 1.93 81 0 0 3562 Barisal Div. 873 34.89 30463 2296 8.77 528 0 0 30991
21
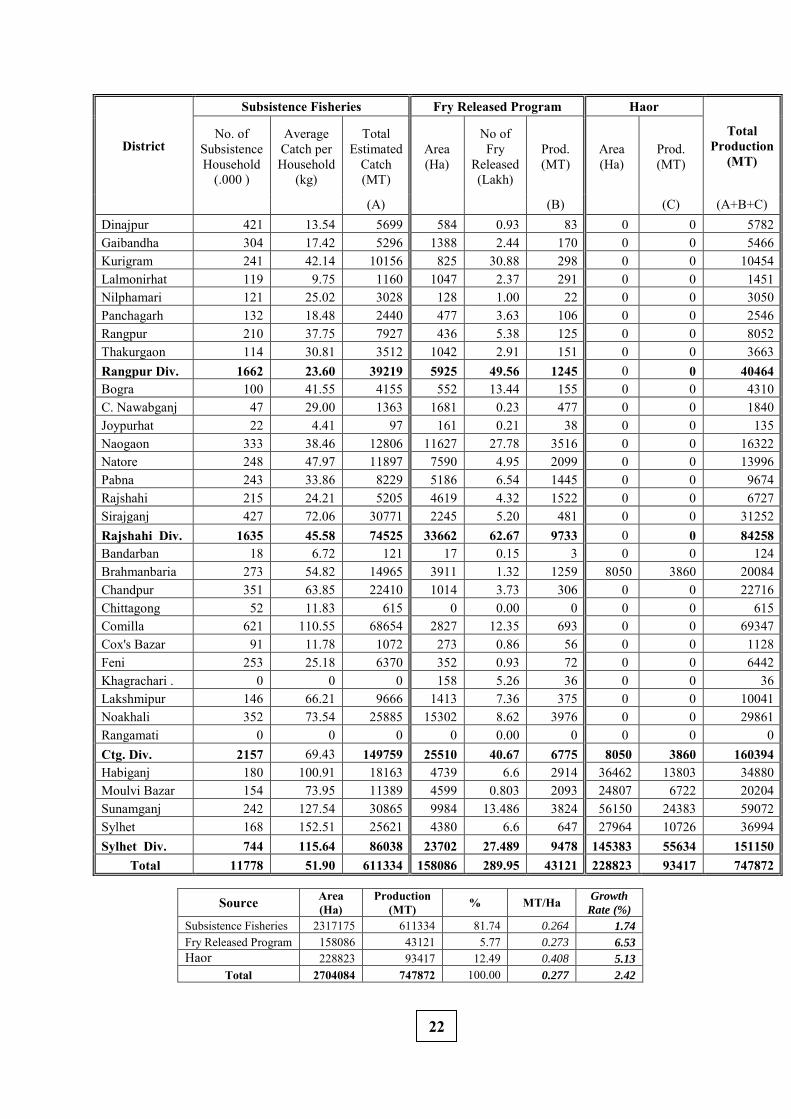
District
Subsistence Fisheries Fry Released Program Haor
Total Production
(MT)
No. of Subsistence Household
(.000 )
Average Catch per Household
(kg)
Total Estimated
Catch (MT)
Area (Ha)
No of Fry
Released (Lakh)
Prod. (MT)
Area (Ha)
Prod. (MT)
(A) (B) (C) (A+B+C) Dinajpur 421 13.54 5699 584 0.93 83 0 0 5782 Gaibandha 304 17.42 5296 1388 2.44 170 0 0 5466 Kurigram 241 42.14 10156 825 30.88 298 0 0 10454 Lalmonirhat 119 9.75 1160 1047 2.37 291 0 0 1451 Nilphamari 121 25.02 3028 128 1.00 22 0 0 3050 Panchagarh 132 18.48 2440 477 3.63 106 0 0 2546 Rangpur 210 37.75 7927 436 5.38 125 0 0 8052 Thakurgaon 114 30.81 3512 1042 2.91 151 0 0 3663 Rangpur Div. 1662 23.60 39219 5925 49.56 1245 0 0 40464 Bogra 100 41.55 4155 552 13.44 155 0 0 4310 C. Nawabganj 47 29.00 1363 1681 0.23 477 0 0 1840 Joypurhat 22 4.41 97 161 0.21 38 0 0 135 Naogaon 333 38.46 12806 11627 27.78 3516 0 0 16322 Natore 248 47.97 11897 7590 4.95 2099 0 0 13996 Pabna 243 33.86 8229 5186 6.54 1445 0 0 9674 Rajshahi 215 24.21 5205 4619 4.32 1522 0 0 6727 Sirajganj 427 72.06 30771 2245 5.20 481 0 0 31252 Rajshahi Div. 1635 45.58 74525 33662 62.67 9733 0 0 84258 Bandarban 18 6.72 121 17 0.15 3 0 0 124 Brahmanbaria 273 54.82 14965 3911 1.32 1259 8050 3860 20084 Chandpur 351 63.85 22410 1014 3.73 306 0 0 22716 Chittagong 52 11.83 615 0 0.00 0 0 0 615 Comilla 621 110.55 68654 2827 12.35 693 0 0 69347 Cox's Bazar 91 11.78 1072 273 0.86 56 0 0 1128 Feni 253 25.18 6370 352 0.93 72 0 0 6442 Khagrachari . 0 0 0 158 5.26 36 0 0 36 Lakshmipur 146 66.21 9666 1413 7.36 375 0 0 10041 Noakhali 352 73.54 25885 15302 8.62 3976 0 0 29861 Rangamati 0 0 0 0 0.00 0 0 0 0 Ctg. Div. 2157 69.43 149759 25510 40.67 6775 8050 3860 160394 Habiganj 180 100.91 18163 4739 6.6 2914 36462 13803 34880 Moulvi Bazar 154 73.95 11389 4599 0.803 2093 24807 6722 20204 Sunamganj 242 127.54 30865 9984 13.486 3824 56150 24383 59072 Sylhet 168 152.51 25621 4380 6.6 647 27964 10726 36994 Sylhet Div. 744 115.64 86038 23702 27.489 9478 145383 55634 151150
Total 11778 51.90 611334 158086 289.95 43121 228823 93417 747872
Source Area (Ha)
Production (MT) % MT/Ha Growth
Rate (%)
Subsistence Fisheries 2317175 611334 81.74 0.264 1.74
Fry Released Program 158086 43121 5.77 0.273 6.53
Haor 228823 93417 12.49 0.408 5.13
Total 2704084 747872 100.00 0.277 2.42
22
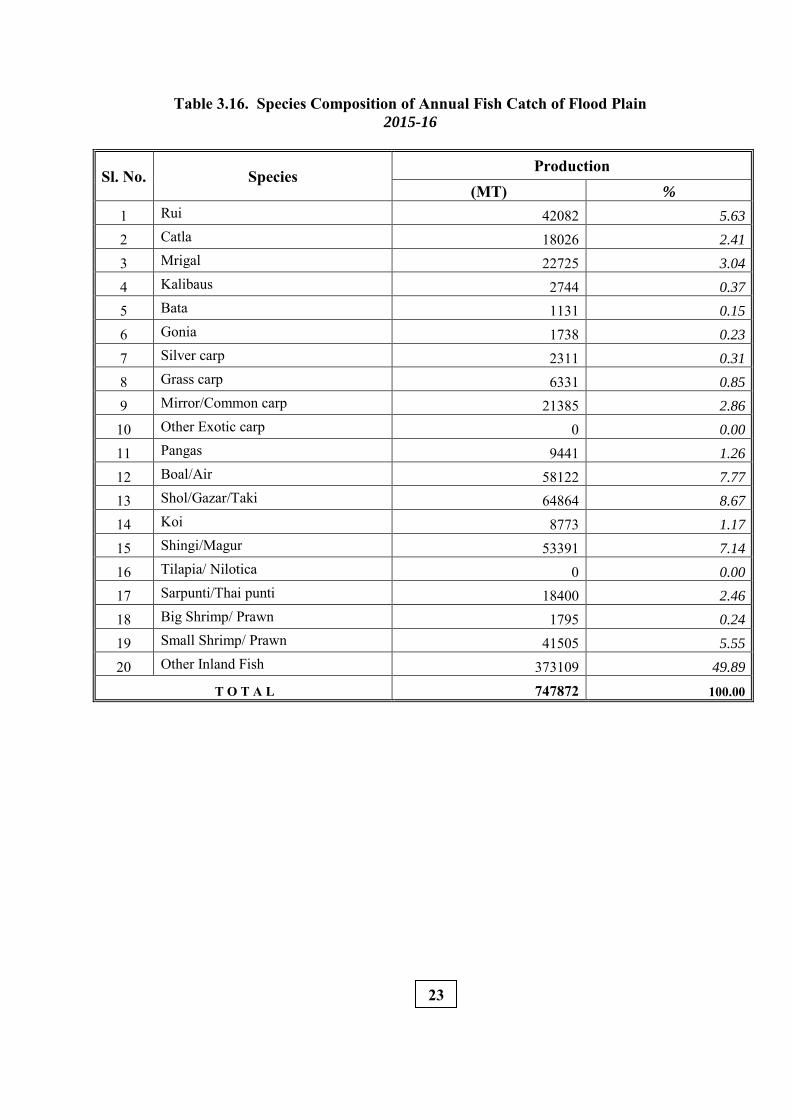
Table 3.16. Species Composition of Annual Fish Catch of Flood Plain 2015-16
Sl. No. Species Production
(MT) %
1 Rui 42082 5.63
2 Catla 18026 2.41
3 Mrigal 22725 3.04
4 Kalibaus 2744 0.37
5 Bata 1131 0.15
6 Gonia 1738 0.23
7 Silver carp 2311 0.31
8 Grass carp 6331 0.85
9 Mirror/Common carp 21385 2.86
10 Other Exotic carp 0 0.00
11 Pangas 9441 1.26
12 Boal/Air 58122 7.77
13 Shol/Gazar/Taki 64864 8.67
14 Koi 8773 1.17
15 Shingi/Magur 53391 7.14
16 Tilapia/ Nilotica 0 0.00
17 Sarpunti/Thai punti 18400 2.46
18 Big Shrimp/ Prawn 1795 0.24
19 Small Shrimp/ Prawn 41505 5.55
20 Other Inland Fish 373109 49.89
T O T A L 747872 100.00
23
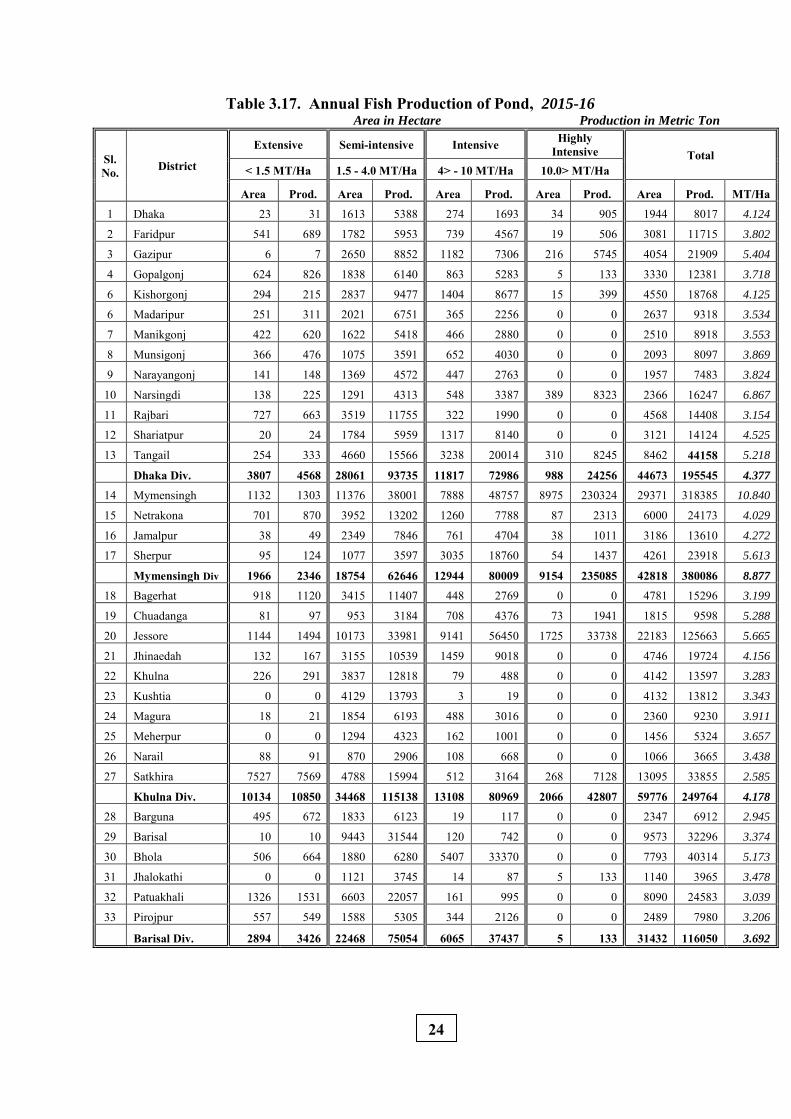
Table 3.17. Annual Fish Production of Pond, 2015-16 Area in Hectare Production in Metric Ton
Sl. No. District
Extensive Semi-intensive Intensive Highly Intensive Total
< 1.5 MT/Ha 1.5 - 4.0 MT/Ha 4> - 10 MT/Ha 10.0> MT/Ha
Area Prod. Area Prod. Area Prod. Area Prod. Area Prod. MT/Ha 1 Dhaka 23 31 1613 5388 274 1693 34 905 1944 8017 4.124
2 Faridpur 541 689 1782 5953 739 4567 19 506 3081 11715 3.802
3 Gazipur 6 7 2650 8852 1182 7306 216 5745 4054 21909 5.404
4 Gopalgonj 624 826 1838 6140 863 5283 5 133 3330 12381 3.718
6 Kishorgonj 294 215 2837 9477 1404 8677 15 399 4550 18768 4.125
6 Madaripur 251 311 2021 6751 365 2256 0 0 2637 9318 3.534
7 Manikgonj 422 620 1622 5418 466 2880 0 0 2510 8918 3.553
8 Munsigonj 366 476 1075 3591 652 4030 0 0 2093 8097 3.869
9 Narayangonj 141 148 1369 4572 447 2763 0 0 1957 7483 3.824
10 Narsingdi 138 225 1291 4313 548 3387 389 8323 2366 16247 6.867
11 Rajbari 727 663 3519 11755 322 1990 0 0 4568 14408 3.154
12 Shariatpur 20 24 1784 5959 1317 8140 0 0 3121 14124 4.525
13 Tangail 254 333 4660 15566 3238 20014 310 8245 8462 44158 5.218
Dhaka Div. 3807 4568 28061 93735 11817 72986 988 24256 44673 195545 4.377
14 Mymensingh 1132 1303 11376 38001 7888 48757 8975 230324 29371 318385 10.840
15 Netrakona 701 870 3952 13202 1260 7788 87 2313 6000 24173 4.029
16 Jamalpur 38 49 2349 7846 761 4704 38 1011 3186 13610 4.272
17 Sherpur 95 124 1077 3597 3035 18760 54 1437 4261 23918 5.613
Mymensingh Div 1966 2346 18754 62646 12944 80009 9154 235085 42818 380086 8.877
18 Bagerhat 918 1120 3415 11407 448 2769 0 0 4781 15296 3.199
19 Chuadanga 81 97 953 3184 708 4376 73 1941 1815 9598 5.288
20 Jessore 1144 1494 10173 33981 9141 56450 1725 33738 22183 125663 5.665
21 Jhinaedah 132 167 3155 10539 1459 9018 0 0 4746 19724 4.156
22 Khulna 226 291 3837 12818 79 488 0 0 4142 13597 3.283
23 Kushtia 0 0 4129 13793 3 19 0 0 4132 13812 3.343
24 Magura 18 21 1854 6193 488 3016 0 0 2360 9230 3.911
25 Meherpur 0 0 1294 4323 162 1001 0 0 1456 5324 3.657
26 Narail 88 91 870 2906 108 668 0 0 1066 3665 3.438
27 Satkhira 7527 7569 4788 15994 512 3164 268 7128 13095 33855 2.585
Khulna Div. 10134 10850 34468 115138 13108 80969 2066 42807 59776 249764 4.178
28 Barguna 495 672 1833 6123 19 117 0 0 2347 6912 2.945
29 Barisal 10 10 9443 31544 120 742 0 0 9573 32296 3.374
30 Bhola 506 664 1880 6280 5407 33370 0 0 7793 40314 5.173
31 Jhalokathi 0 0 1121 3745 14 87 5 133 1140 3965 3.478
32 Patuakhali 1326 1531 6603 22057 161 995 0 0 8090 24583 3.039
33 Pirojpur 557 549 1588 5305 344 2126 0 0 2489 7980 3.206
Barisal Div. 2894 3426 22468 75054 6065 37437 5 133 31432 116050 3.692
24
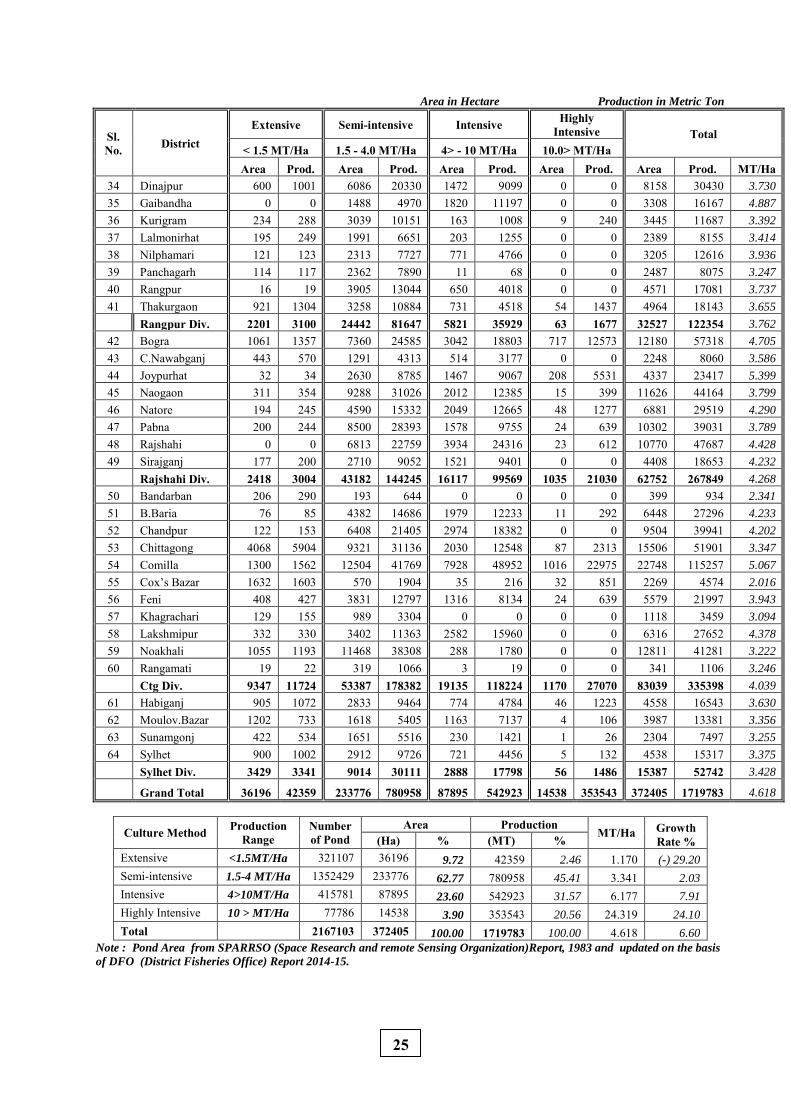
Area in Hectare Production in Metric Ton
Sl. No. District
Extensive Semi-intensive Intensive Highly Intensive Total
< 1.5 MT/Ha 1.5 - 4.0 MT/Ha 4> - 10 MT/Ha 10.0> MT/Ha Area Prod. Area Prod. Area Prod. Area Prod. Area Prod. MT/Ha
34 Dinajpur 600 1001 6086 20330 1472 9099 0 0 8158 30430 3.730
35 Gaibandha 0 0 1488 4970 1820 11197 0 0 3308 16167 4.887
36 Kurigram 234 288 3039 10151 163 1008 9 240 3445 11687 3.392
37 Lalmonirhat 195 249 1991 6651 203 1255 0 0 2389 8155 3.414
38 Nilphamari 121 123 2313 7727 771 4766 0 0 3205 12616 3.936
39 Panchagarh 114 117 2362 7890 11 68 0 0 2487 8075 3.247
40 Rangpur 16 19 3905 13044 650 4018 0 0 4571 17081 3.737
41 Thakurgaon 921 1304 3258 10884 731 4518 54 1437 4964 18143 3.655
Rangpur Div. 2201 3100 24442 81647 5821 35929 63 1677 32527 122354 3.762
42 Bogra 1061 1357 7360 24585 3042 18803 717 12573 12180 57318 4.705
43 C.Nawabganj 443 570 1291 4313 514 3177 0 0 2248 8060 3.586
44 Joypurhat 32 34 2630 8785 1467 9067 208 5531 4337 23417 5.399
45 Naogaon 311 354 9288 31026 2012 12385 15 399 11626 44164 3.799
46 Natore 194 245 4590 15332 2049 12665 48 1277 6881 29519 4.290
47 Pabna 200 244 8500 28393 1578 9755 24 639 10302 39031 3.789
48 Rajshahi 0 0 6813 22759 3934 24316 23 612 10770 47687 4.428
49 Sirajganj 177 200 2710 9052 1521 9401 0 0 4408 18653 4.232
Rajshahi Div. 2418 3004 43182 144245 16117 99569 1035 21030 62752 267849 4.268
50 Bandarban 206 290 193 644 0 0 0 0 399 934 2.341
51 B.Baria 76 85 4382 14686 1979 12233 11 292 6448 27296 4.233
52 Chandpur 122 153 6408 21405 2974 18382 0 0 9504 39941 4.202
53 Chittagong 4068 5904 9321 31136 2030 12548 87 2313 15506 51901 3.347
54 Comilla 1300 1562 12504 41769 7928 48952 1016 22975 22748 115257 5.067
55 Cox’s Bazar 1632 1603 570 1904 35 216 32 851 2269 4574 2.016
56 Feni 408 427 3831 12797 1316 8134 24 639 5579 21997 3.943
57 Khagrachari 129 155 989 3304 0 0 0 0 1118 3459 3.094
58 Lakshmipur 332 330 3402 11363 2582 15960 0 0 6316 27652 4.378
59 Noakhali 1055 1193 11468 38308 288 1780 0 0 12811 41281 3.222
60 Rangamati 19 22 319 1066 3 19 0 0 341 1106 3.246
Ctg Div. 9347 11724 53387 178382 19135 118224 1170 27070 83039 335398 4.039
61 Habiganj 905 1072 2833 9464 774 4784 46 1223 4558 16543 3.630
62 Moulov.Bazar 1202 733 1618 5405 1163 7137 4 106 3987 13381 3.356
63 Sunamgonj 422 534 1651 5516 230 1421 1 26 2304 7497 3.255
64 Sylhet 900 1002 2912 9726 721 4456 5 132 4538 15317 3.375
Sylhet Div. 3429 3341 9014 30111 2888 17798 56 1486 15387 52742 3.428
Grand Total 36196 42359 233776 780958 87895 542923 14538 353543 372405 1719783 4.618
Culture Method Production Range
Number of Pond
Area Production MT/Ha Growth
Rate % (Ha) % (MT) % Extensive <1.5MT/Ha 321107 36196 9.72 42359 2.46 1.170 (-) 29.20
Semi-intensive 1.5-4 MT/Ha 1352429 233776 62.77 780958 45.41 3.341 2.03
Intensive 4>10MT/Ha 415781 87895 23.60 542923 31.57 6.177 7.91
Highly Intensive 10 > MT/Ha 77786 14538 3.90 353543 20.56 24.319 24.10
Total 2167103 372405 100.00 1719783 100.00 4.618 6.60
Note : Pond Area from SPARRSO (Space Research and remote Sensing Organization)Report, 1983 and updated on the basis
of DFO (District Fisheries Office) Report 2014-15.
25
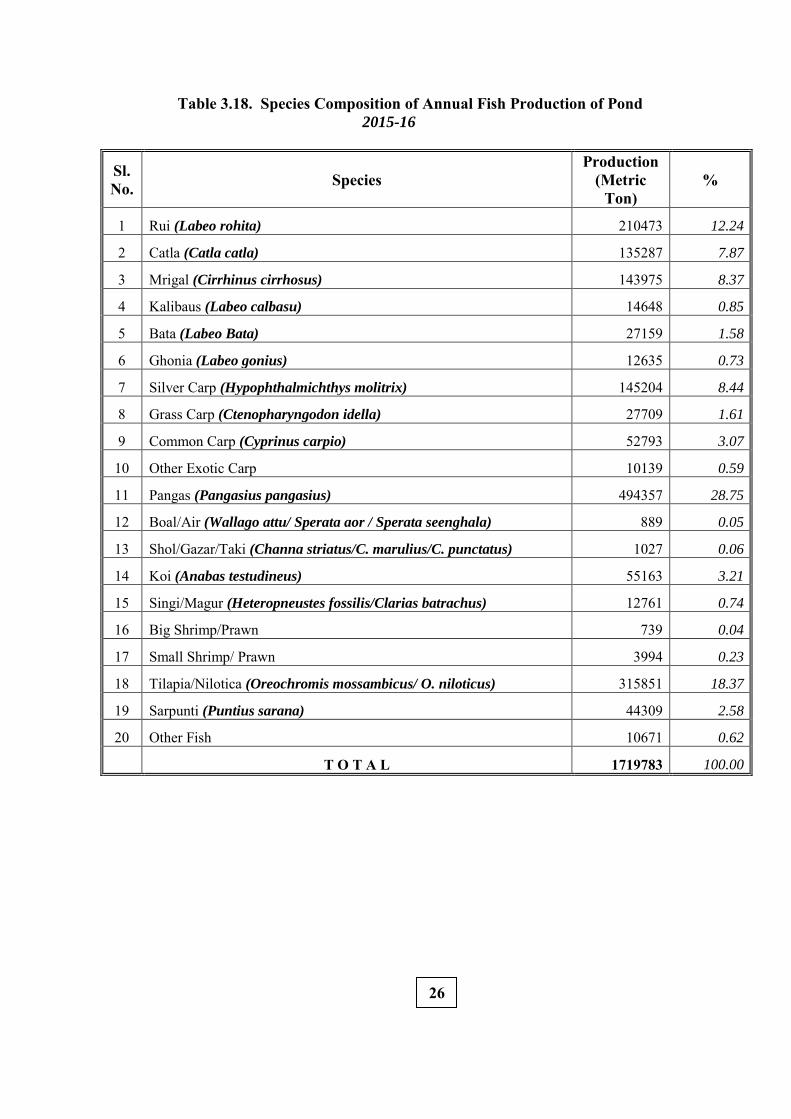
Table 3.18. Species Composition of Annual Fish Production of Pond 2015-16
Sl. No. Species
Production (Metric
Ton) %
1 Rui (Labeo rohita) 210473 12.24
2 Catla (Catla catla) 135287 7.87
3 Mrigal (Cirrhinus cirrhosus) 143975 8.37
4 Kalibaus (Labeo calbasu) 14648 0.85
5 Bata (Labeo Bata) 27159 1.58
6 Ghonia (Labeo gonius) 12635 0.73
7 Silver Carp (Hypophthalmichthys molitrix) 145204 8.44
8 Grass Carp (Ctenopharyngodon idella) 27709 1.61
9 Common Carp (Cyprinus carpio) 52793 3.07
10 Other Exotic Carp 10139 0.59
11 Pangas (Pangasius pangasius) 494357 28.75
12 Boal/Air (Wallago attu/ Sperata aor / Sperata seenghala) 889 0.05
13 Shol/Gazar/Taki (Channa striatus/C. marulius/C. punctatus) 1027 0.06
14 Koi (Anabas testudineus) 55163 3.21
15 Singi/Magur (Heteropneustes fossilis/Clarias batrachus) 12761 0.74
16 Big Shrimp/Prawn 739 0.04
17 Small Shrimp/ Prawn 3994 0.23
18 Tilapia/Nilotica (Oreochromis mossambicus/ O. niloticus) 315851 18.37
19 Sarpunti (Puntius sarana) 44309 2.58
20 Other Fish 10671 0.62
T O T A L 1719783 100.00
26
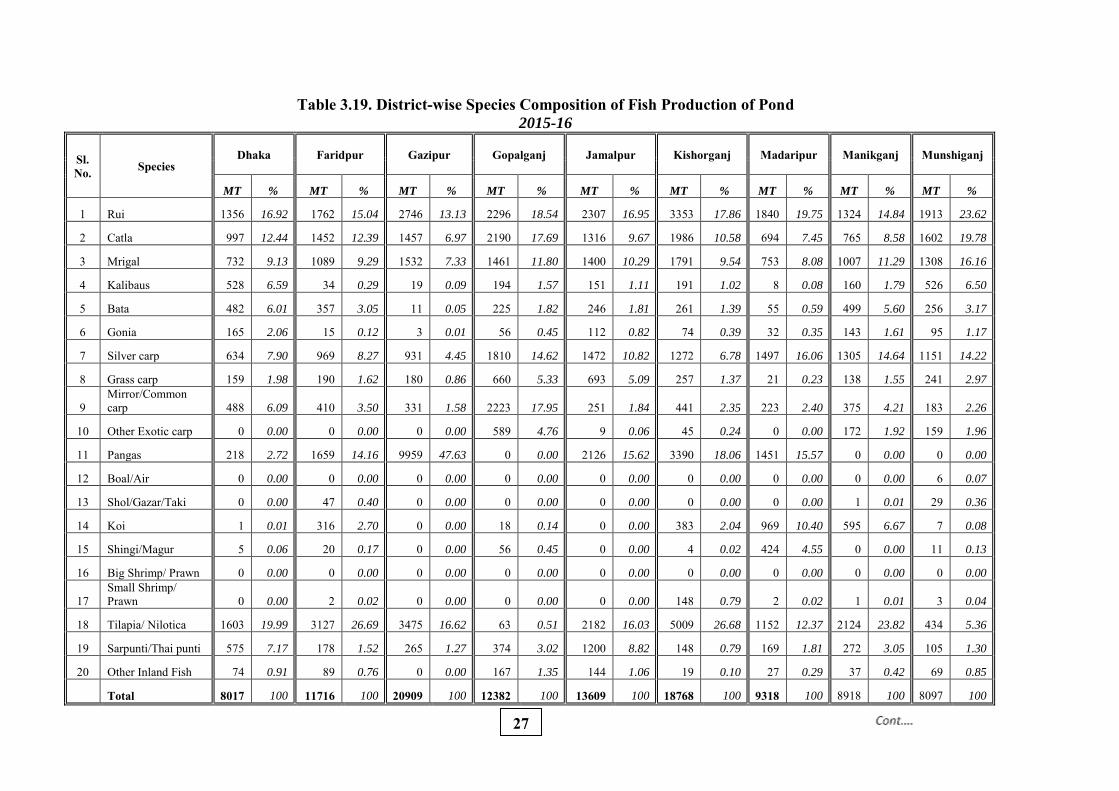
Table 3.19. District-wise Species Composition of Fish Production of Pond 2015-16
Sl. No. Species
Dhaka Faridpur Gazipur Gopalganj Jamalpur Kishorganj Madaripur Manikganj Munshiganj
MT % MT % MT % MT % MT % MT % MT % MT % MT %
1 Rui 1356 16.92 1762 15.04 2746 13.13 2296 18.54 2307 16.95 3353 17.86 1840 19.75 1324 14.84 1913 23.62
2 Catla 997 12.44 1452 12.39 1457 6.97 2190 17.69 1316 9.67 1986 10.58 694 7.45 765 8.58 1602 19.78
3 Mrigal 732 9.13 1089 9.29 1532 7.33 1461 11.80 1400 10.29 1791 9.54 753 8.08 1007 11.29 1308 16.16
4 Kalibaus 528 6.59 34 0.29 19 0.09 194 1.57 151 1.11 191 1.02 8 0.08 160 1.79 526 6.50
5 Bata 482 6.01 357 3.05 11 0.05 225 1.82 246 1.81 261 1.39 55 0.59 499 5.60 256 3.17
6 Gonia 165 2.06 15 0.12 3 0.01 56 0.45 112 0.82 74 0.39 32 0.35 143 1.61 95 1.17
7 Silver carp 634 7.90 969 8.27 931 4.45 1810 14.62 1472 10.82 1272 6.78 1497 16.06 1305 14.64 1151 14.22
8 Grass carp 159 1.98 190 1.62 180 0.86 660 5.33 693 5.09 257 1.37 21 0.23 138 1.55 241 2.97
9 Mirror/Common carp 488 6.09 410 3.50 331 1.58 2223 17.95 251 1.84 441 2.35 223 2.40 375 4.21 183 2.26
10 Other Exotic carp 0 0.00 0 0.00 0 0.00 589 4.76 9 0.06 45 0.24 0 0.00 172 1.92 159 1.96
11 Pangas 218 2.72 1659 14.16 9959 47.63 0 0.00 2126 15.62 3390 18.06 1451 15.57 0 0.00 0 0.00
12 Boal/Air 0 0.00 0 0.00 0 0.00 0 0.00 0 0.00 0 0.00 0 0.00 0 0.00 6 0.07
13 Shol/Gazar/Taki 0 0.00 47 0.40 0 0.00 0 0.00 0 0.00 0 0.00 0 0.00 1 0.01 29 0.36
14 Koi 1 0.01 316 2.70 0 0.00 18 0.14 0 0.00 383 2.04 969 10.40 595 6.67 7 0.08
15 Shingi/Magur 5 0.06 20 0.17 0 0.00 56 0.45 0 0.00 4 0.02 424 4.55 0 0.00 11 0.13
16 Big Shrimp/ Prawn 0 0.00 0 0.00 0 0.00 0 0.00 0 0.00 0 0.00 0 0.00 0 0.00 0 0.00
17 Small Shrimp/ Prawn 0 0.00 2 0.02 0 0.00 0 0.00 0 0.00 148 0.79 2 0.02 1 0.01 3 0.04
18 Tilapia/ Nilotica 1603 19.99 3127 26.69 3475 16.62 63 0.51 2182 16.03 5009 26.68 1152 12.37 2124 23.82 434 5.36
19 Sarpunti/Thai punti 575 7.17 178 1.52 265 1.27 374 3.02 1200 8.82 148 0.79 169 1.81 272 3.05 105 1.30
20 Other Inland Fish 74 0.91 89 0.76 0 0.00 167 1.35 144 1.06 19 0.10 27 0.29 37 0.42 69 0.85
Total 8017 100 11716 100 20909 100 12382 100 13609 100 18768 100 9318 100 8918 100 8097 100
27
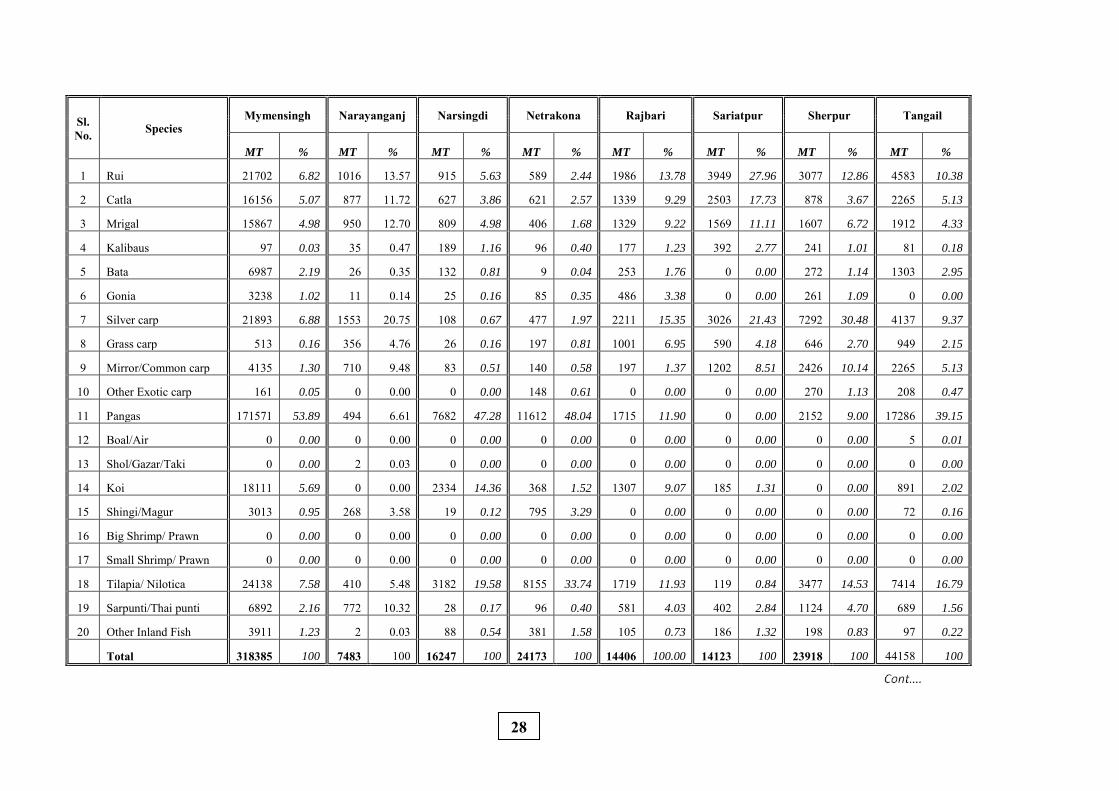
Sl. No. Species
Mymensingh Narayanganj Narsingdi Netrakona Rajbari Sariatpur Sherpur Tangail
MT % MT % MT % MT % MT % MT % MT % MT %
1 Rui 21702 6.82 1016 13.57 915 5.63 589 2.44 1986 13.78 3949 27.96 3077 12.86 4583 10.38
2 Catla 16156 5.07 877 11.72 627 3.86 621 2.57 1339 9.29 2503 17.73 878 3.67 2265 5.13
3 Mrigal 15867 4.98 950 12.70 809 4.98 406 1.68 1329 9.22 1569 11.11 1607 6.72 1912 4.33
4 Kalibaus 97 0.03 35 0.47 189 1.16 96 0.40 177 1.23 392 2.77 241 1.01 81 0.18
5 Bata 6987 2.19 26 0.35 132 0.81 9 0.04 253 1.76 0 0.00 272 1.14 1303 2.95
6 Gonia 3238 1.02 11 0.14 25 0.16 85 0.35 486 3.38 0 0.00 261 1.09 0 0.00
7 Silver carp 21893 6.88 1553 20.75 108 0.67 477 1.97 2211 15.35 3026 21.43 7292 30.48 4137 9.37
8 Grass carp 513 0.16 356 4.76 26 0.16 197 0.81 1001 6.95 590 4.18 646 2.70 949 2.15
9 Mirror/Common carp 4135 1.30 710 9.48 83 0.51 140 0.58 197 1.37 1202 8.51 2426 10.14 2265 5.13
10 Other Exotic carp 161 0.05 0 0.00 0 0.00 148 0.61 0 0.00 0 0.00 270 1.13 208 0.47
11 Pangas 171571 53.89 494 6.61 7682 47.28 11612 48.04 1715 11.90 0 0.00 2152 9.00 17286 39.15
12 Boal/Air 0 0.00 0 0.00 0 0.00 0 0.00 0 0.00 0 0.00 0 0.00 5 0.01
13 Shol/Gazar/Taki 0 0.00 2 0.03 0 0.00 0 0.00 0 0.00 0 0.00 0 0.00 0 0.00
14 Koi 18111 5.69 0 0.00 2334 14.36 368 1.52 1307 9.07 185 1.31 0 0.00 891 2.02
15 Shingi/Magur 3013 0.95 268 3.58 19 0.12 795 3.29 0 0.00 0 0.00 0 0.00 72 0.16
16 Big Shrimp/ Prawn 0 0.00 0 0.00 0 0.00 0 0.00 0 0.00 0 0.00 0 0.00 0 0.00
17 Small Shrimp/ Prawn 0 0.00 0 0.00 0 0.00 0 0.00 0 0.00 0 0.00 0 0.00 0 0.00
18 Tilapia/ Nilotica 24138 7.58 410 5.48 3182 19.58 8155 33.74 1719 11.93 119 0.84 3477 14.53 7414 16.79
19 Sarpunti/Thai punti 6892 2.16 772 10.32 28 0.17 96 0.40 581 4.03 402 2.84 1124 4.70 689 1.56
20 Other Inland Fish 3911 1.23 2 0.03 88 0.54 381 1.58 105 0.73 186 1.32 198 0.83 97 0.22
Total 318385 100 7483 100 16247 100 24173 100 14406 100.00 14123 100 23918 100 44158 100
28
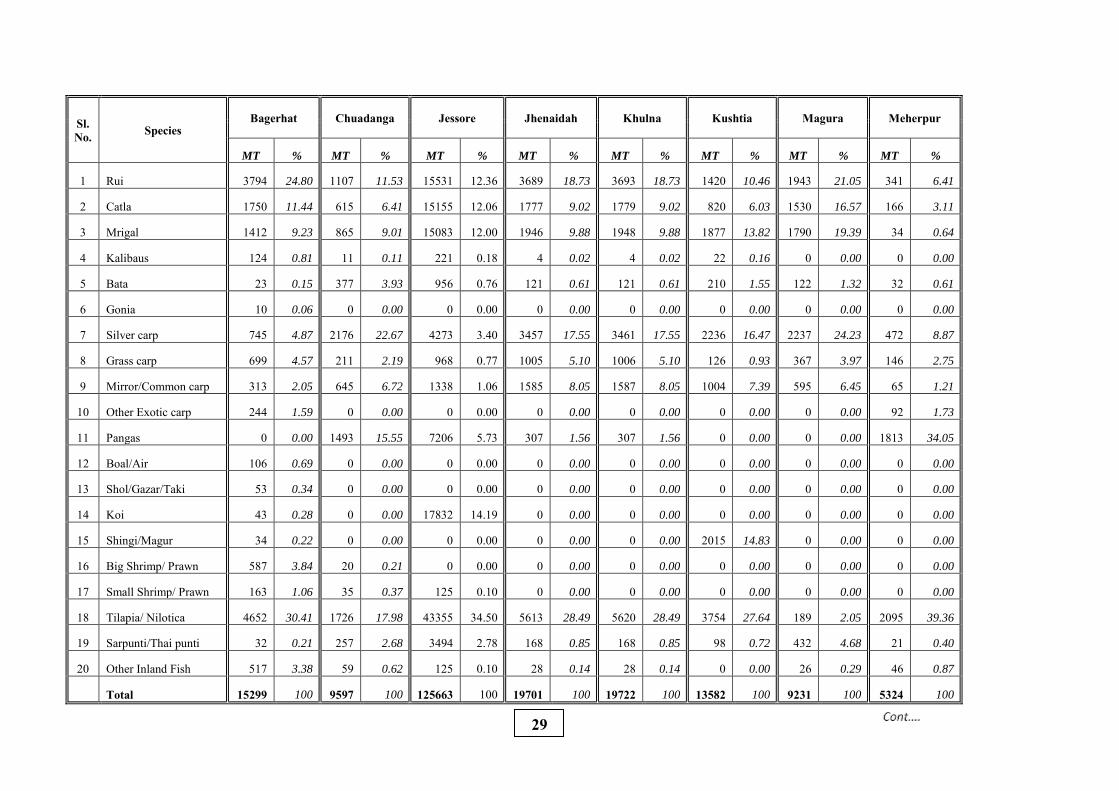
Sl. No. Species
Bagerhat Chuadanga Jessore Jhenaidah Khulna Kushtia Magura Meherpur
MT % MT % MT % MT % MT % MT % MT % MT %
1 Rui 3794 24.80 1107 11.53 15531 12.36 3689 18.73 3693 18.73 1420 10.46 1943 21.05 341 6.41
2 Catla 1750 11.44 615 6.41 15155 12.06 1777 9.02 1779 9.02 820 6.03 1530 16.57 166 3.11
3 Mrigal 1412 9.23 865 9.01 15083 12.00 1946 9.88 1948 9.88 1877 13.82 1790 19.39 34 0.64
4 Kalibaus 124 0.81 11 0.11 221 0.18 4 0.02 4 0.02 22 0.16 0 0.00 0 0.00
5 Bata 23 0.15 377 3.93 956 0.76 121 0.61 121 0.61 210 1.55 122 1.32 32 0.61
6 Gonia 10 0.06 0 0.00 0 0.00 0 0.00 0 0.00 0 0.00 0 0.00 0 0.00
7 Silver carp 745 4.87 2176 22.67 4273 3.40 3457 17.55 3461 17.55 2236 16.47 2237 24.23 472 8.87
8 Grass carp 699 4.57 211 2.19 968 0.77 1005 5.10 1006 5.10 126 0.93 367 3.97 146 2.75
9 Mirror/Common carp 313 2.05 645 6.72 1338 1.06 1585 8.05 1587 8.05 1004 7.39 595 6.45 65 1.21
10 Other Exotic carp 244 1.59 0 0.00 0 0.00 0 0.00 0 0.00 0 0.00 0 0.00 92 1.73
11 Pangas 0 0.00 1493 15.55 7206 5.73 307 1.56 307 1.56 0 0.00 0 0.00 1813 34.05
12 Boal/Air 106 0.69 0 0.00 0 0.00 0 0.00 0 0.00 0 0.00 0 0.00 0 0.00
13 Shol/Gazar/Taki 53 0.34 0 0.00 0 0.00 0 0.00 0 0.00 0 0.00 0 0.00 0 0.00
14 Koi 43 0.28 0 0.00 17832 14.19 0 0.00 0 0.00 0 0.00 0 0.00 0 0.00
15 Shingi/Magur 34 0.22 0 0.00 0 0.00 0 0.00 0 0.00 2015 14.83 0 0.00 0 0.00
16 Big Shrimp/ Prawn 587 3.84 20 0.21 0 0.00 0 0.00 0 0.00 0 0.00 0 0.00 0 0.00
17 Small Shrimp/ Prawn 163 1.06 35 0.37 125 0.10 0 0.00 0 0.00 0 0.00 0 0.00 0 0.00
18 Tilapia/ Nilotica 4652 30.41 1726 17.98 43355 34.50 5613 28.49 5620 28.49 3754 27.64 189 2.05 2095 39.36
19 Sarpunti/Thai punti 32 0.21 257 2.68 3494 2.78 168 0.85 168 0.85 98 0.72 432 4.68 21 0.40
20 Other Inland Fish 517 3.38 59 0.62 125 0.10 28 0.14 28 0.14 0 0.00 26 0.29 46 0.87
Total 15299 100 9597 100 125663 100 19701 100 19722 100 13582 100 9231 100 5324 100
29
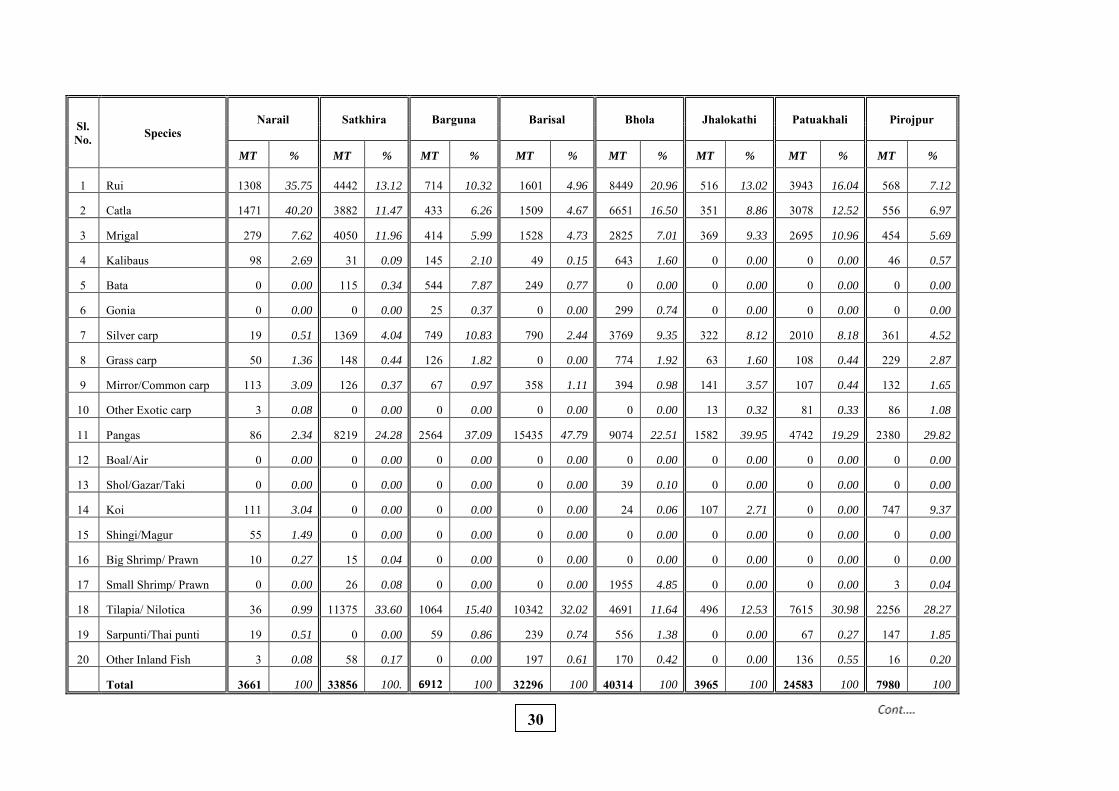
Sl. No. Species
Narail Satkhira Barguna Barisal Bhola Jhalokathi Patuakhali Pirojpur
MT % MT % MT % MT % MT % MT % MT % MT %
1 Rui 1308 35.75 4442 13.12 714 10.32 1601 4.96 8449 20.96 516 13.02 3943 16.04 568 7.12
2 Catla 1471 40.20 3882 11.47 433 6.26 1509 4.67 6651 16.50 351 8.86 3078 12.52 556 6.97
3 Mrigal 279 7.62 4050 11.96 414 5.99 1528 4.73 2825 7.01 369 9.33 2695 10.96 454 5.69
4 Kalibaus 98 2.69 31 0.09 145 2.10 49 0.15 643 1.60 0 0.00 0 0.00 46 0.57
5 Bata 0 0.00 115 0.34 544 7.87 249 0.77 0 0.00 0 0.00 0 0.00 0 0.00
6 Gonia 0 0.00 0 0.00 25 0.37 0 0.00 299 0.74 0 0.00 0 0.00 0 0.00
7 Silver carp 19 0.51 1369 4.04 749 10.83 790 2.44 3769 9.35 322 8.12 2010 8.18 361 4.52
8 Grass carp 50 1.36 148 0.44 126 1.82 0 0.00 774 1.92 63 1.60 108 0.44 229 2.87
9 Mirror/Common carp 113 3.09 126 0.37 67 0.97 358 1.11 394 0.98 141 3.57 107 0.44 132 1.65
10 Other Exotic carp 3 0.08 0 0.00 0 0.00 0 0.00 0 0.00 13 0.32 81 0.33 86 1.08
11 Pangas 86 2.34 8219 24.28 2564 37.09 15435 47.79 9074 22.51 1582 39.95 4742 19.29 2380 29.82
12 Boal/Air 0 0.00 0 0.00 0 0.00 0 0.00 0 0.00 0 0.00 0 0.00 0 0.00
13 Shol/Gazar/Taki 0 0.00 0 0.00 0 0.00 0 0.00 39 0.10 0 0.00 0 0.00 0 0.00
14 Koi 111 3.04 0 0.00 0 0.00 0 0.00 24 0.06 107 2.71 0 0.00 747 9.37
15 Shingi/Magur 55 1.49 0 0.00 0 0.00 0 0.00 0 0.00 0 0.00 0 0.00 0 0.00
16 Big Shrimp/ Prawn 10 0.27 15 0.04 0 0.00 0 0.00 0 0.00 0 0.00 0 0.00 0 0.00
17 Small Shrimp/ Prawn 0 0.00 26 0.08 0 0.00 0 0.00 1955 4.85 0 0.00 0 0.00 3 0.04
18 Tilapia/ Nilotica 36 0.99 11375 33.60 1064 15.40 10342 32.02 4691 11.64 496 12.53 7615 30.98 2256 28.27
19 Sarpunti/Thai punti 19 0.51 0 0.00 59 0.86 239 0.74 556 1.38 0 0.00 67 0.27 147 1.85
20 Other Inland Fish 3 0.08 58 0.17 0 0.00 197 0.61 170 0.42 0 0.00 136 0.55 16 0.20
Total 3661 100 33856 100. 6912 100 32296 100 40314 100 3965 100 24583 100 7980 100
30
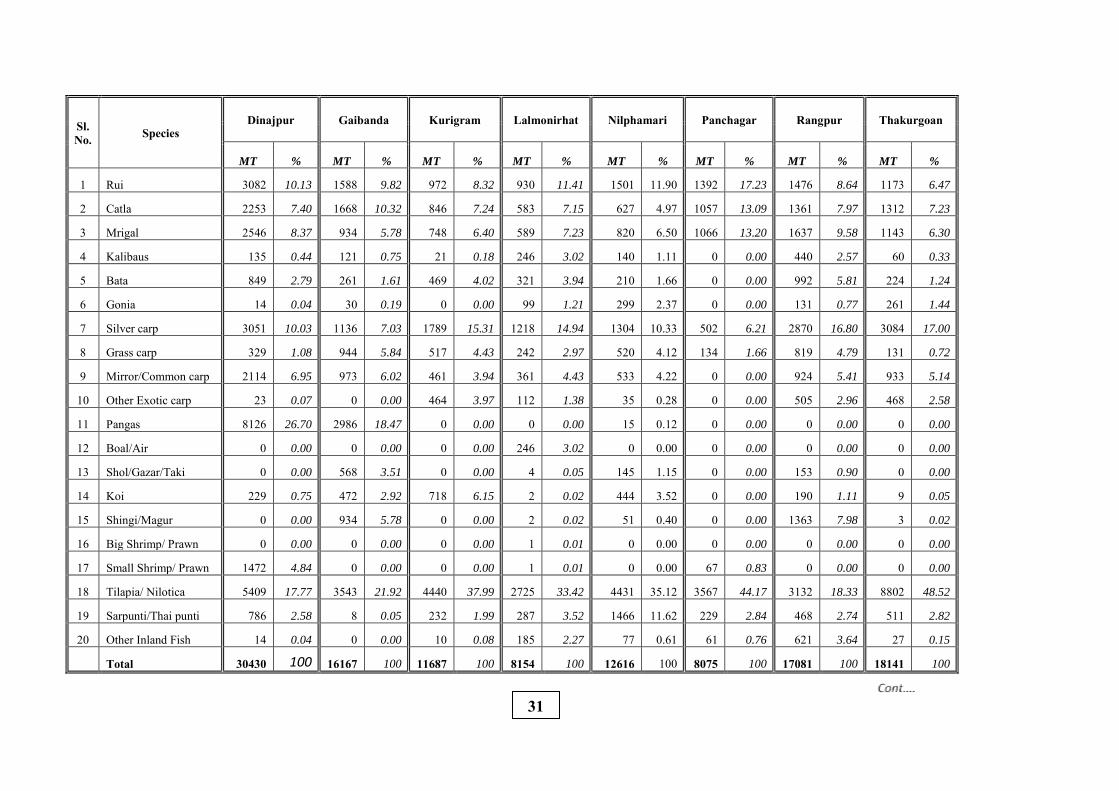
Sl. No. Species
Dinajpur Gaibanda Kurigram Lalmonirhat Nilphamari Panchagar Rangpur Thakurgoan
MT % MT % MT % MT % MT % MT % MT % MT %
1 Rui 3082 10.13 1588 9.82 972 8.32 930 11.41 1501 11.90 1392 17.23 1476 8.64 1173 6.47
2 Catla 2253 7.40 1668 10.32 846 7.24 583 7.15 627 4.97 1057 13.09 1361 7.97 1312 7.23
3 Mrigal 2546 8.37 934 5.78 748 6.40 589 7.23 820 6.50 1066 13.20 1637 9.58 1143 6.30
4 Kalibaus 135 0.44 121 0.75 21 0.18 246 3.02 140 1.11 0 0.00 440 2.57 60 0.33
5 Bata 849 2.79 261 1.61 469 4.02 321 3.94 210 1.66 0 0.00 992 5.81 224 1.24
6 Gonia 14 0.04 30 0.19 0 0.00 99 1.21 299 2.37 0 0.00 131 0.77 261 1.44
7 Silver carp 3051 10.03 1136 7.03 1789 15.31 1218 14.94 1304 10.33 502 6.21 2870 16.80 3084 17.00
8 Grass carp 329 1.08 944 5.84 517 4.43 242 2.97 520 4.12 134 1.66 819 4.79 131 0.72
9 Mirror/Common carp 2114 6.95 973 6.02 461 3.94 361 4.43 533 4.22 0 0.00 924 5.41 933 5.14
10 Other Exotic carp 23 0.07 0 0.00 464 3.97 112 1.38 35 0.28 0 0.00 505 2.96 468 2.58
11 Pangas 8126 26.70 2986 18.47 0 0.00 0 0.00 15 0.12 0 0.00 0 0.00 0 0.00
12 Boal/Air 0 0.00 0 0.00 0 0.00 246 3.02 0 0.00 0 0.00 0 0.00 0 0.00
13 Shol/Gazar/Taki 0 0.00 568 3.51 0 0.00 4 0.05 145 1.15 0 0.00 153 0.90 0 0.00
14 Koi 229 0.75 472 2.92 718 6.15 2 0.02 444 3.52 0 0.00 190 1.11 9 0.05
15 Shingi/Magur 0 0.00 934 5.78 0 0.00 2 0.02 51 0.40 0 0.00 1363 7.98 3 0.02
16 Big Shrimp/ Prawn 0 0.00 0 0.00 0 0.00 1 0.01 0 0.00 0 0.00 0 0.00 0 0.00
17 Small Shrimp/ Prawn 1472 4.84 0 0.00 0 0.00 1 0.01 0 0.00 67 0.83 0 0.00 0 0.00
18 Tilapia/ Nilotica 5409 17.77 3543 21.92 4440 37.99 2725 33.42 4431 35.12 3567 44.17 3132 18.33 8802 48.52
19 Sarpunti/Thai punti 786 2.58 8 0.05 232 1.99 287 3.52 1466 11.62 229 2.84 468 2.74 511 2.82
20 Other Inland Fish 14 0.04 0 0.00 10 0.08 185 2.27 77 0.61 61 0.76 621 3.64 27 0.15
Total 30430 100 16167 100 11687 100 8154 100 12616 100 8075 100 17081 100 18141 100
31
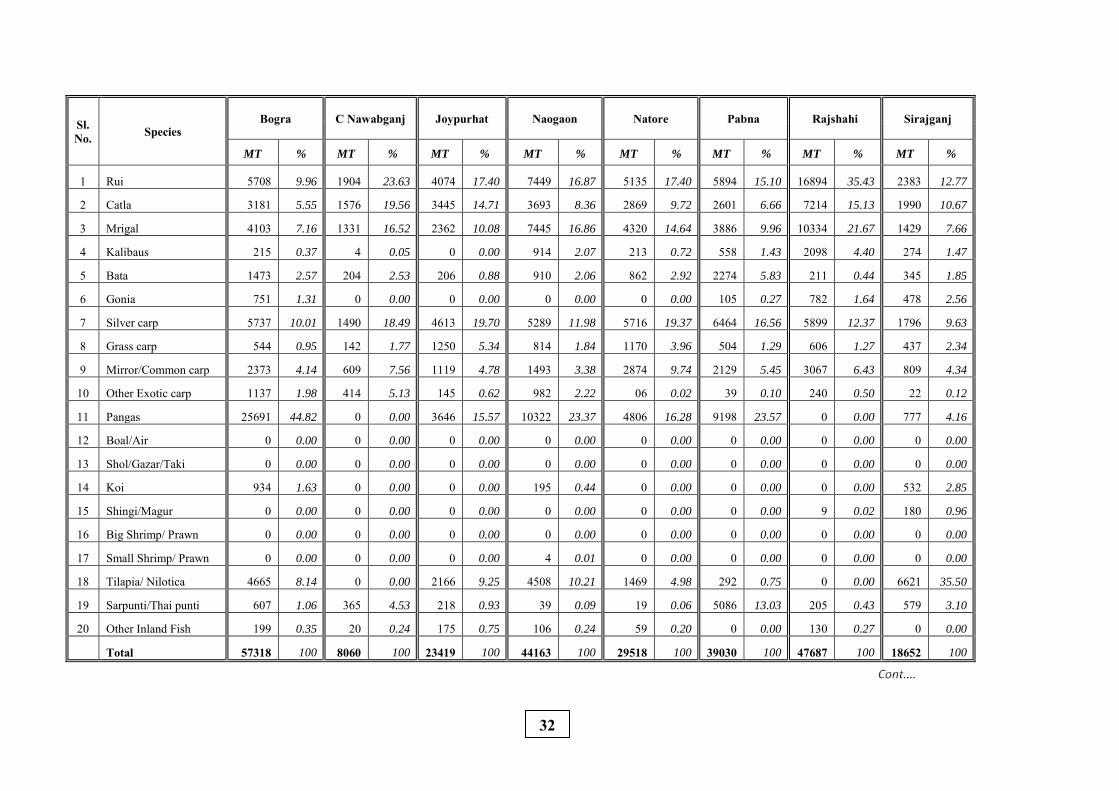
Sl. No. Species
Bogra C Nawabganj Joypurhat Naogaon Natore Pabna Rajshahi Sirajganj
MT % MT % MT % MT % MT % MT % MT % MT %
1 Rui 5708 9.96 1904 23.63 4074 17.40 7449 16.87 5135 17.40 5894 15.10 16894 35.43 2383 12.77
2 Catla 3181 5.55 1576 19.56 3445 14.71 3693 8.36 2869 9.72 2601 6.66 7214 15.13 1990 10.67
3 Mrigal 4103 7.16 1331 16.52 2362 10.08 7445 16.86 4320 14.64 3886 9.96 10334 21.67 1429 7.66
4 Kalibaus 215 0.37 4 0.05 0 0.00 914 2.07 213 0.72 558 1.43 2098 4.40 274 1.47
5 Bata 1473 2.57 204 2.53 206 0.88 910 2.06 862 2.92 2274 5.83 211 0.44 345 1.85
6 Gonia 751 1.31 0 0.00 0 0.00 0 0.00 0 0.00 105 0.27 782 1.64 478 2.56
7 Silver carp 5737 10.01 1490 18.49 4613 19.70 5289 11.98 5716 19.37 6464 16.56 5899 12.37 1796 9.63
8 Grass carp 544 0.95 142 1.77 1250 5.34 814 1.84 1170 3.96 504 1.29 606 1.27 437 2.34
9 Mirror/Common carp 2373 4.14 609 7.56 1119 4.78 1493 3.38 2874 9.74 2129 5.45 3067 6.43 809 4.34
10 Other Exotic carp 1137 1.98 414 5.13 145 0.62 982 2.22 06 0.02 39 0.10 240 0.50 22 0.12
11 Pangas 25691 44.82 0 0.00 3646 15.57 10322 23.37 4806 16.28 9198 23.57 0 0.00 777 4.16
12 Boal/Air 0 0.00 0 0.00 0 0.00 0 0.00 0 0.00 0 0.00 0 0.00 0 0.00
13 Shol/Gazar/Taki 0 0.00 0 0.00 0 0.00 0 0.00 0 0.00 0 0.00 0 0.00 0 0.00
14 Koi 934 1.63 0 0.00 0 0.00 195 0.44 0 0.00 0 0.00 0 0.00 532 2.85
15 Shingi/Magur 0 0.00 0 0.00 0 0.00 0 0.00 0 0.00 0 0.00 9 0.02 180 0.96
16 Big Shrimp/ Prawn 0 0.00 0 0.00 0 0.00 0 0.00 0 0.00 0 0.00 0 0.00 0 0.00
17 Small Shrimp/ Prawn 0 0.00 0 0.00 0 0.00 4 0.01 0 0.00 0 0.00 0 0.00 0 0.00
18 Tilapia/ Nilotica 4665 8.14 0 0.00 2166 9.25 4508 10.21 1469 4.98 292 0.75 0 0.00 6621 35.50
19 Sarpunti/Thai punti 607 1.06 365 4.53 218 0.93 39 0.09 19 0.06 5086 13.03 205 0.43 579 3.10
20 Other Inland Fish 199 0.35 20 0.24 175 0.75 106 0.24 59 0.20 0 0.00 130 0.27 0 0.00
Total 57318 100 8060 100 23419 100 44163 100 29518 100 39030 100 47687 100 18652 100
32
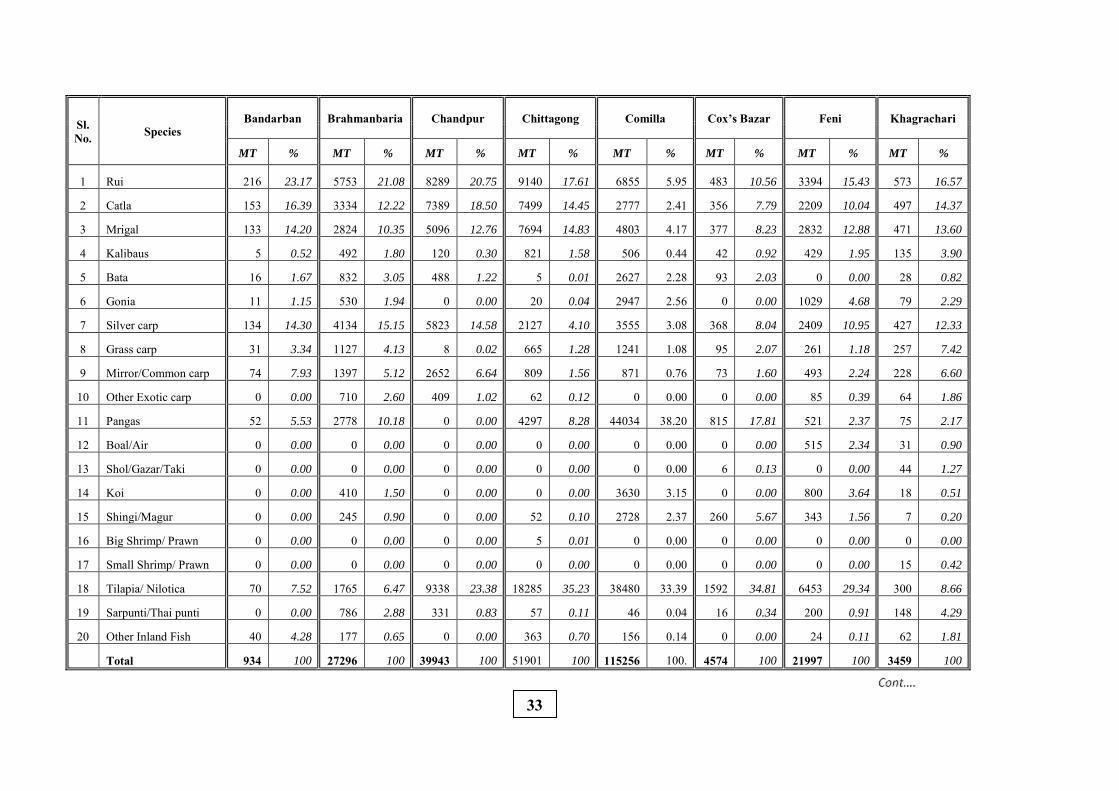
Sl. No. Species
Bandarban Brahmanbaria Chandpur Chittagong Comilla Cox’s Bazar Feni Khagrachari
MT % MT % MT % MT % MT % MT % MT % MT %
1 Rui 216 23.17 5753 21.08 8289 20.75 9140 17.61 6855 5.95 483 10.56 3394 15.43 573 16.57
2 Catla 153 16.39 3334 12.22 7389 18.50 7499 14.45 2777 2.41 356 7.79 2209 10.04 497 14.37
3 Mrigal 133 14.20 2824 10.35 5096 12.76 7694 14.83 4803 4.17 377 8.23 2832 12.88 471 13.60
4 Kalibaus 5 0.52 492 1.80 120 0.30 821 1.58 506 0.44 42 0.92 429 1.95 135 3.90
5 Bata 16 1.67 832 3.05 488 1.22 5 0.01 2627 2.28 93 2.03 0 0.00 28 0.82
6 Gonia 11 1.15 530 1.94 0 0.00 20 0.04 2947 2.56 0 0.00 1029 4.68 79 2.29
7 Silver carp 134 14.30 4134 15.15 5823 14.58 2127 4.10 3555 3.08 368 8.04 2409 10.95 427 12.33
8 Grass carp 31 3.34 1127 4.13 8 0.02 665 1.28 1241 1.08 95 2.07 261 1.18 257 7.42
9 Mirror/Common carp 74 7.93 1397 5.12 2652 6.64 809 1.56 871 0.76 73 1.60 493 2.24 228 6.60
10 Other Exotic carp 0 0.00 710 2.60 409 1.02 62 0.12 0 0.00 0 0.00 85 0.39 64 1.86
11 Pangas 52 5.53 2778 10.18 0 0.00 4297 8.28 44034 38.20 815 17.81 521 2.37 75 2.17
12 Boal/Air 0 0.00 0 0.00 0 0.00 0 0.00 0 0.00 0 0.00 515 2.34 31 0.90
13 Shol/Gazar/Taki 0 0.00 0 0.00 0 0.00 0 0.00 0 0.00 6 0.13 0 0.00 44 1.27
14 Koi 0 0.00 410 1.50 0 0.00 0 0.00 3630 3.15 0 0.00 800 3.64 18 0.51
15 Shingi/Magur 0 0.00 245 0.90 0 0.00 52 0.10 2728 2.37 260 5.67 343 1.56 7 0.20
16 Big Shrimp/ Prawn 0 0.00 0 0.00 0 0.00 5 0.01 0 0.00 0 0.00 0 0.00 0 0.00
17 Small Shrimp/ Prawn 0 0.00 0 0.00 0 0.00 0 0.00 0 0.00 0 0.00 0 0.00 15 0.42
18 Tilapia/ Nilotica 70 7.52 1765 6.47 9338 23.38 18285 35.23 38480 33.39 1592 34.81 6453 29.34 300 8.66
19 Sarpunti/Thai punti 0 0.00 786 2.88 331 0.83 57 0.11 46 0.04 16 0.34 200 0.91 148 4.29
20 Other Inland Fish 40 4.28 177 0.65 0 0.00 363 0.70 156 0.14 0 0.00 24 0.11 62 1.81
Total 934 100 27296 100 39943 100 51901 100 115256 100. 4574 100 21997 100 3459 100
33
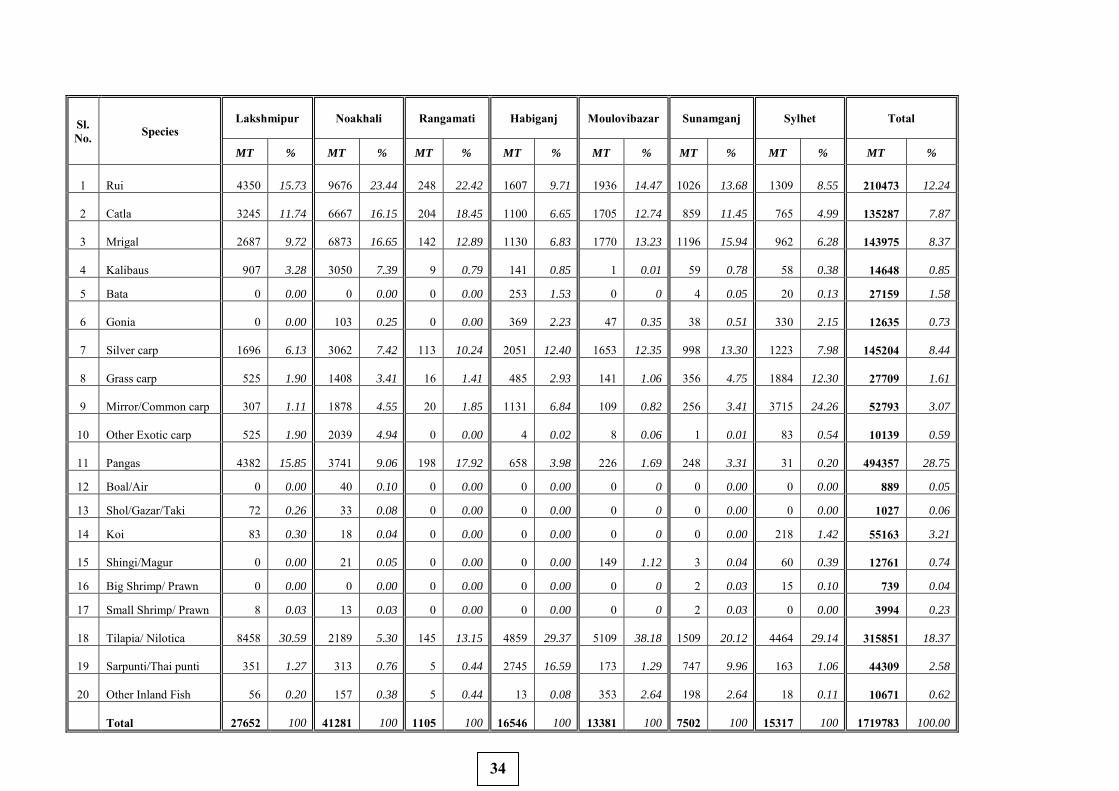
Sl. No. Species
Lakshmipur Noakhali Rangamati Habiganj Moulovibazar Sunamganj Sylhet Total
MT % MT % MT % MT % MT % MT % MT % MT %
1 Rui 4350 15.73 9676 23.44 248 22.42 1607 9.71 1936
14.47 1026 13.68 1309 8.55 210473 12.24
2 Catla 3245 11.74 6667 16.15 204 18.45 1100 6.65 1705
12.74 859 11.45 765 4.99 135287 7.87
3 Mrigal 2687 9.72 6873 16.65 142 12.89 1130 6.83 1770
13.23 1196 15.94 962 6.28 143975 8.37
4 Kalibaus 907 3.28 3050 7.39 9 0.79 141 0.85 1
0.01 59 0.78 58 0.38 14648 0.85
5 Bata 0 0.00 0 0.00 0 0.00 253 1.53 0 0 4 0.05 20 0.13 27159 1.58
6 Gonia 0 0.00 103 0.25 0 0.00 369 2.23 47
0.35 38 0.51 330 2.15 12635 0.73
7 Silver carp 1696 6.13 3062 7.42 113 10.24 2051 12.40 1653
12.35 998 13.30 1223 7.98 145204 8.44
8 Grass carp 525 1.90 1408 3.41 16 1.41 485 2.93 141
1.06 356 4.75 1884 12.30 27709 1.61
9 Mirror/Common carp 307 1.11 1878 4.55 20 1.85 1131 6.84 109
0.82 256 3.41 3715 24.26 52793 3.07
10 Other Exotic carp 525 1.90 2039 4.94 0 0.00 4 0.02 8
0.06 1 0.01 83 0.54 10139 0.59
11 Pangas 4382 15.85 3741 9.06 198 17.92 658 3.98 226
1.69 248 3.31 31 0.20 494357 28.75
12 Boal/Air 0 0.00 40 0.10 0 0.00 0 0.00 0 0 0 0.00 0 0.00 889 0.05
13 Shol/Gazar/Taki 72 0.26 33 0.08 0 0.00 0 0.00 0 0 0 0.00 0 0.00 1027 0.06
14 Koi 83 0.30 18 0.04 0 0.00 0 0.00 0 0 0 0.00 218 1.42 55163 3.21
15 Shingi/Magur 0 0.00 21 0.05 0 0.00 0 0.00 149
1.12 3 0.04 60 0.39 12761 0.74
16 Big Shrimp/ Prawn 0 0.00 0 0.00 0 0.00 0 0.00 0 0 2 0.03 15 0.10 739 0.04
17 Small Shrimp/ Prawn 8 0.03 13 0.03 0 0.00 0 0.00 0 0 2 0.03 0 0.00 3994 0.23
18 Tilapia/ Nilotica 8458 30.59 2189 5.30 145 13.15 4859 29.37 5109
38.18 1509 20.12 4464 29.14 315851 18.37
19 Sarpunti/Thai punti 351 1.27 313 0.76 5 0.44 2745 16.59 173
1.29 747 9.96 163 1.06 44309 2.58
20 Other Inland Fish 56 0.20 157 0.38 5 0.44 13 0.08 353
2.64 198 2.64 18 0.11 10671 0.62
Total 27652 100 41281 100 1105 100 16546 100 13381
100 7502 100 15317 100 1719783 100.00
34
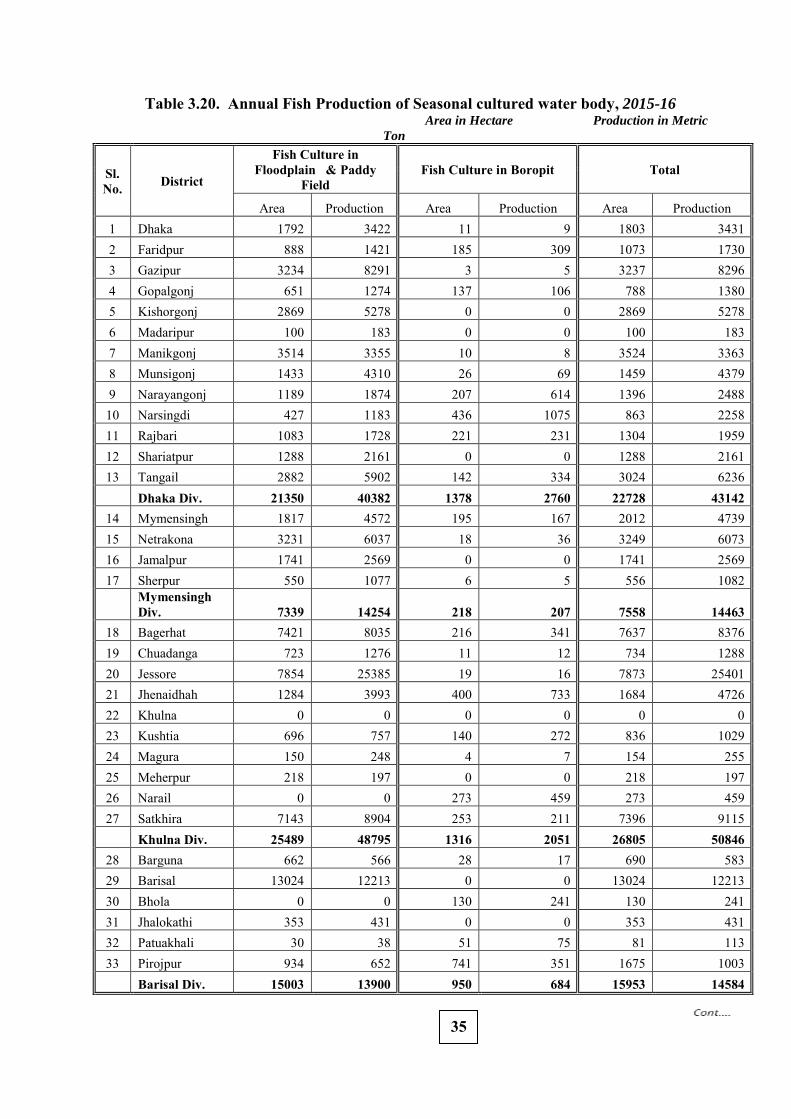
Table 3.20. Annual Fish Production of Seasonal cultured water body, 2015-16 Area in Hectare Production in Metric
Ton
Sl. No. District
Fish Culture in Floodplain & Paddy
Field Fish Culture in Boropit Total
Area Production Area Production Area Production 1 Dhaka 1792 3422 11 9 1803 3431 2 Faridpur 888 1421 185 309 1073 1730 3 Gazipur 3234 8291 3 5 3237 8296 4 Gopalgonj 651 1274 137 106 788 1380 5 Kishorgonj 2869 5278 0 0 2869 5278 6 Madaripur 100 183 0 0 100 183 7 Manikgonj 3514 3355 10 8 3524 3363 8 Munsigonj 1433 4310 26 69 1459 4379 9 Narayangonj 1189 1874 207 614 1396 2488 10 Narsingdi 427 1183 436 1075 863 2258 11 Rajbari 1083 1728 221 231 1304 1959 12 Shariatpur 1288 2161 0 0 1288 2161 13 Tangail 2882 5902 142 334 3024 6236 Dhaka Div. 21350 40382 1378 2760 22728 43142
14 Mymensingh 1817 4572 195 167 2012 4739 15 Netrakona 3231 6037 18 36 3249 6073 16 Jamalpur 1741 2569 0 0 1741 2569 17 Sherpur 550 1077 6 5 556 1082
Mymensingh Div. 7339 14254 218 207 7558 14463
18 Bagerhat 7421 8035 216 341 7637 8376 19 Chuadanga 723 1276 11 12 734 1288 20 Jessore 7854 25385 19 16 7873 25401 21 Jhenaidhah 1284 3993 400 733 1684 4726 22 Khulna 0 0 0 0 0 0 23 Kushtia 696 757 140 272 836 1029 24 Magura 150 248 4 7 154 255 25 Meherpur 218 197 0 0 218 197 26 Narail 0 0 273 459 273 459 27 Satkhira 7143 8904 253 211 7396 9115 Khulna Div. 25489 48795 1316 2051 26805 50846
28 Barguna 662 566 28 17 690 583 29 Barisal 13024 12213 0 0 13024 12213 30 Bhola 0 0 130 241 130 241 31 Jhalokathi 353 431 0 0 353 431 32 Patuakhali 30 38 51 75 81 113 33 Pirojpur 934 652 741 351 1675 1003 Barisal Div. 15003 13900 950 684 15953 14584
35
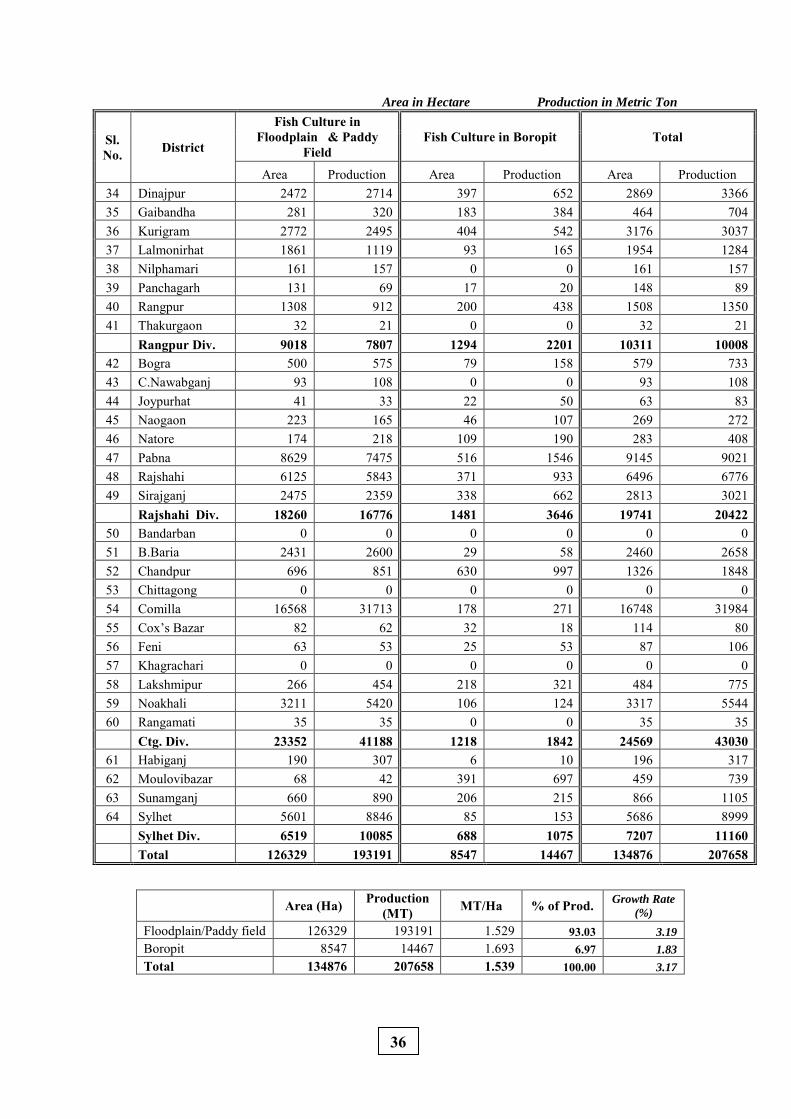
Area in Hectare Production in Metric Ton
Sl. No. District
Fish Culture in Floodplain & Paddy
Field Fish Culture in Boropit Total
Area Production Area Production Area Production 34 Dinajpur 2472 2714 397 652 2869 3366 35 Gaibandha 281 320 183 384 464 704 36 Kurigram 2772 2495 404 542 3176 3037 37 Lalmonirhat 1861 1119 93 165 1954 1284 38 Nilphamari 161 157 0 0 161 157 39 Panchagarh 131 69 17 20 148 89 40 Rangpur 1308 912 200 438 1508 1350 41 Thakurgaon 32 21 0 0 32 21 Rangpur Div. 9018 7807 1294 2201 10311 10008
42 Bogra 500 575 79 158 579 733 43 C.Nawabganj 93 108 0 0 93 108 44 Joypurhat 41 33 22 50 63 83 45 Naogaon 223 165 46 107 269 272 46 Natore 174 218 109 190 283 408 47 Pabna 8629 7475 516 1546 9145 9021 48 Rajshahi 6125 5843 371 933 6496 6776 49 Sirajganj 2475 2359 338 662 2813 3021 Rajshahi Div. 18260 16776 1481 3646 19741 20422
50 Bandarban 0 0 0 0 0 0 51 B.Baria 2431 2600 29 58 2460 2658 52 Chandpur 696 851 630 997 1326 1848 53 Chittagong 0 0 0 0 0 0 54 Comilla 16568 31713 178 271 16748 31984 55 Cox’s Bazar 82 62 32 18 114 80 56 Feni 63 53 25 53 87 106 57 Khagrachari 0 0 0 0 0 0 58 Lakshmipur 266 454 218 321 484 775 59 Noakhali 3211 5420 106 124 3317 5544 60 Rangamati 35 35 0 0 35 35 Ctg. Div. 23352 41188 1218 1842 24569 43030
61 Habiganj 190 307 6 10 196 317 62 Moulovibazar 68 42 391 697 459 739 63 Sunamganj 660 890 206 215 866 1105 64 Sylhet 5601 8846 85 153 5686 8999 Sylhet Div. 6519 10085 688 1075 7207 11160 Total 126329 193191 8547 14467 134876 207658
Area (Ha) Production
(MT) MT/Ha % of Prod. Growth Rate
(%)
Floodplain/Paddy field 126329 193191 1.529 93.03 3.19
Boropit 8547 14467 1.693 6.97 1.83
Total 134876 207658 1.539 100.00 3.17
36
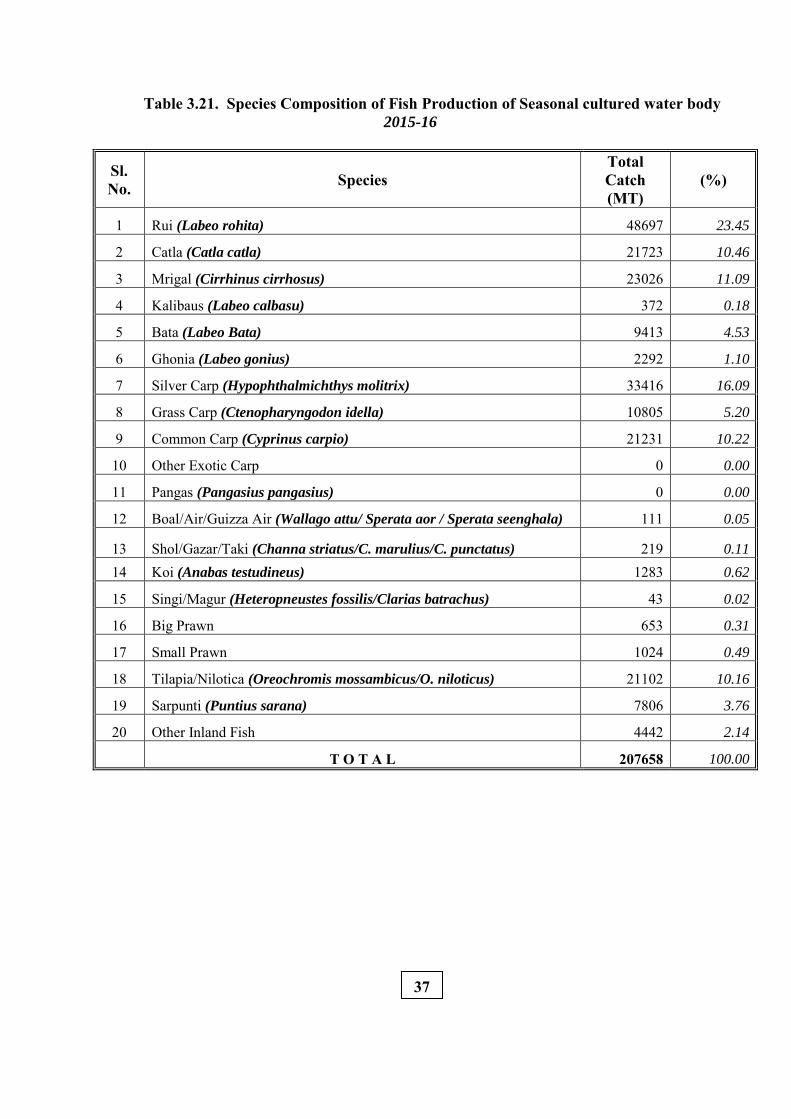
Table 3.21. Species Composition of Fish Production of Seasonal cultured water body 2015-16
Sl. No. Species
Total Catch (MT)
(%)
1 Rui (Labeo rohita) 48697 23.45
2 Catla (Catla catla) 21723 10.46
3 Mrigal (Cirrhinus cirrhosus) 23026 11.09
4 Kalibaus (Labeo calbasu) 372 0.18
5 Bata (Labeo Bata) 9413 4.53
6 Ghonia (Labeo gonius) 2292 1.10
7 Silver Carp (Hypophthalmichthys molitrix) 33416 16.09
8 Grass Carp (Ctenopharyngodon idella) 10805 5.20
9 Common Carp (Cyprinus carpio) 21231 10.22
10 Other Exotic Carp 0 0.00
11 Pangas (Pangasius pangasius) 0 0.00
12 Boal/Air/Guizza Air (Wallago attu/ Sperata aor / Sperata seenghala) 111 0.05
13 Shol/Gazar/Taki (Channa striatus/C. marulius/C. punctatus) 219 0.11
14 Koi (Anabas testudineus) 1283 0.62
15 Singi/Magur (Heteropneustes fossilis/Clarias batrachus) 43 0.02
16 Big Prawn 653 0.31
17 Small Prawn 1024 0.49
18 Tilapia/Nilotica (Oreochromis mossambicus/O. niloticus) 21102 10.16
19 Sarpunti (Puntius sarana) 7806 3.76
20 Other Inland Fish 4442 2.14
T O T A L 207658 100.00
37
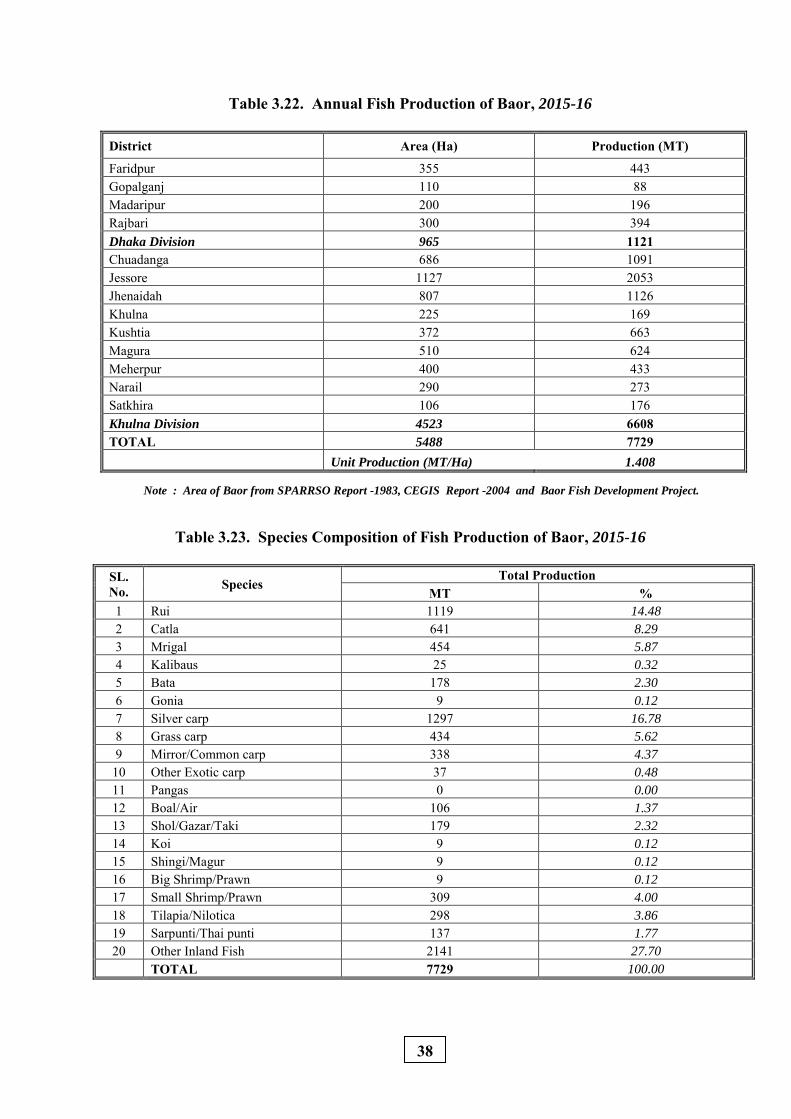
Table 3.22. Annual Fish Production of Baor, 2015-16
District Area (Ha) Production (MT)
Faridpur 355 443 Gopalganj 110 88 Madaripur 200 196 Rajbari 300 394 Dhaka Division 965 1121 Chuadanga 686 1091 Jessore 1127 2053 Jhenaidah 807 1126 Khulna 225 169 Kushtia 372 663 Magura 510 624 Meherpur 400 433 Narail 290 273 Satkhira 106 176 Khulna Division 4523 6608 TOTAL 5488 7729 Unit Production (MT/Ha) 1.408
Note : Area of Baor from SPARRSO Report -1983, CEGIS Report -2004 and Baor Fish Development Project.
Table 3.23. Species Composition of Fish Production of Baor, 2015-16
SL. No. Species
Total Production MT %
1 Rui 1119 14.48
2 Catla 641 8.29
3 Mrigal 454 5.87
4 Kalibaus 25 0.32
5 Bata 178 2.30
6 Gonia 9 0.12
7 Silver carp 1297 16.78
8 Grass carp 434 5.62
9 Mirror/Common carp 338 4.37
10 Other Exotic carp 37 0.48
11 Pangas 0 0.00
12 Boal/Air 106 1.37
13 Shol/Gazar/Taki 179 2.32
14 Koi 9 0.12
15 Shingi/Magur 9 0.12
16 Big Shrimp/Prawn 9 0.12
17 Small Shrimp/Prawn 309 4.00
18 Tilapia/Nilotica 298 3.86
19 Sarpunti/Thai punti 137 1.77
20 Other Inland Fish 2141 27.70
TOTAL 7729 100.00
38
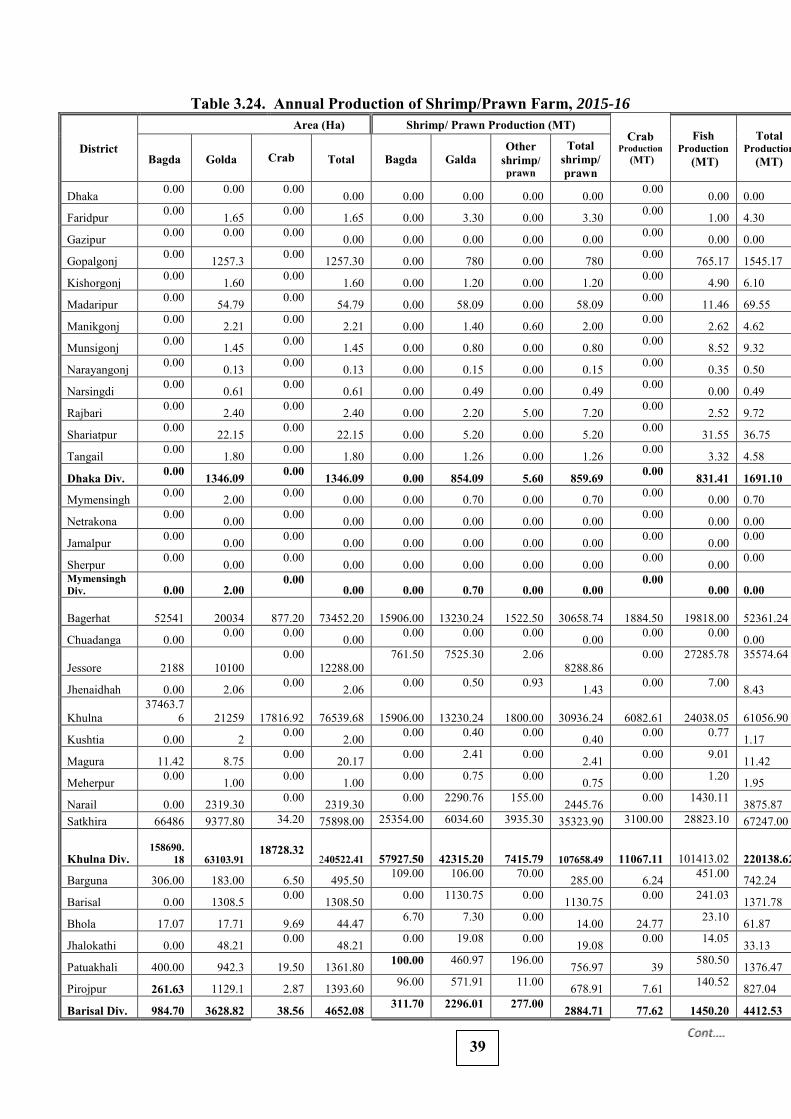
Table 3.24. Annual Production of Shrimp/Prawn Farm, 2015-16
District
Area (Ha) Shrimp/ Prawn Production (MT) Crab
Production (MT)
Fish Production
(MT)
Total Production
(MT) Bagda Golda
Crab Total Bagda Galda Other
shrimp/ prawn
Total shrimp/ prawn
Dhaka 0.00 0.00 0.00 0.00 0.00 0.00 0.00 0.00 0.00 0.00 0.00
Faridpur 0.00 1.65 0.00 1.65 0.00 3.30 0.00 3.30 0.00 1.00 4.30
Gazipur 0.00 0.00 0.00 0.00 0.00 0.00 0.00 0.00 0.00 0.00 0.00
Gopalgonj 0.00 1257.3 0.00 1257.30 0.00 780 0.00 780 0.00 765.17 1545.17
Kishorgonj 0.00 1.60 0.00 1.60 0.00 1.20 0.00 1.20 0.00 4.90 6.10
Madaripur 0.00 54.79 0.00 54.79 0.00 58.09 0.00 58.09 0.00 11.46 69.55
Manikgonj 0.00 2.21 0.00 2.21 0.00 1.40 0.60 2.00 0.00 2.62 4.62
Munsigonj 0.00 1.45 0.00 1.45 0.00 0.80 0.00 0.80 0.00 8.52 9.32
Narayangonj 0.00 0.13 0.00 0.13 0.00 0.15 0.00 0.15 0.00 0.35 0.50
Narsingdi 0.00 0.61 0.00 0.61 0.00 0.49 0.00 0.49 0.00 0.00 0.49
Rajbari 0.00 2.40 0.00 2.40 0.00 2.20 5.00 7.20 0.00 2.52 9.72
Shariatpur 0.00 22.15 0.00 22.15 0.00 5.20 0.00 5.20 0.00 31.55 36.75
Tangail 0.00 1.80 0.00 1.80 0.00 1.26 0.00 1.26 0.00 3.32 4.58
Dhaka Div. 0.00 1346.09 0.00 1346.09 0.00 854.09 5.60 859.69 0.00 831.41 1691.10
Mymensingh 0.00 2.00 0.00 0.00 0.00 0.70 0.00 0.70 0.00 0.00 0.70
Netrakona 0.00 0.00 0.00 0.00 0.00 0.00 0.00 0.00 0.00 0.00 0.00
Jamalpur 0.00 0.00 0.00 0.00 0.00 0.00 0.00 0.00 0.00 0.00 0.00
Sherpur 0.00 0.00 0.00 0.00 0.00 0.00 0.00 0.00 0.00 0.00 0.00 Mymensingh Div. 0.00 2.00
0.00 0.00 0.00 0.70 0.00 0.00
0.00 0.00 0.00
Bagerhat 52541 20034
877.20 73452.20 15906.00 13230.24 1522.50 30658.74
1884.50 19818.00 52361.24
Chuadanga 0.00 0.00 0.00 0.00 0.00 0.00 0.00 0.00 0.00 0.00 0.00
Jessore 2188 10100 0.00
12288.00 761.50 7525.30 2.06
8288.86 0.00 27285.78 35574.64
Jhenaidhah 0.00 2.06 0.00 2.06 0.00 0.50 0.93 1.43 0.00 7.00 8.43
Khulna 37463.7
6 21259
17816.92 76539.68
15906.00
13230.24
1800.00 30936.24
6082.61
24038.05 61056.90
Kushtia 0.00 2 0.00 2.00 0.00 0.40 0.00 0.40 0.00 0.77 1.17
Magura 11.42 8.75 0.00 20.17 0.00 2.41 0.00 2.41 0.00 9.01 11.42
Meherpur 0.00 1.00 0.00 1.00 0.00 0.75 0.00 0.75 0.00 1.20 1.95
Narail 0.00 2319.30 0.00 2319.30 0.00 2290.76 155.00 2445.76 0.00 1430.11 3875.87 Satkhira 66486 9377.80 34.20 75898.00 25354.00 6034.60 3935.30 35323.90 3100.00 28823.10 67247.00
Khulna Div.
158690.
18 63103.91
18728.32
240522.41 57927.50 42315.20 7415.79 107658.49 11067.11 101413.02 220138.62
Barguna 306.00 183.00 6.50 495.50 109.00 106.00 70.00 285.00 6.24 451.00 742.24
Barisal 0.00 1308.5 0.00 1308.50 0.00 1130.75 0.00 1130.75 0.00 241.03 1371.78
Bhola 17.07 17.71 9.69 44.47 6.70 7.30 0.00 14.00 24.77 23.10 61.87
Jhalokathi 0.00 48.21 0.00 48.21 0.00 19.08 0.00 19.08 0.00 14.05 33.13
Patuakhali 400.00 942.3 19.50 1361.80 100.00 460.97 196.00 756.97 39 580.50 1376.47
Pirojpur 261.63 1129.1 2.87 1393.60 96.00 571.91 11.00 678.91 7.61 140.52 827.04
Barisal Div. 984.70 3628.82 38.56 4652.08 311.70 2296.01 277.00 2884.71 77.62 1450.20 4412.53
39
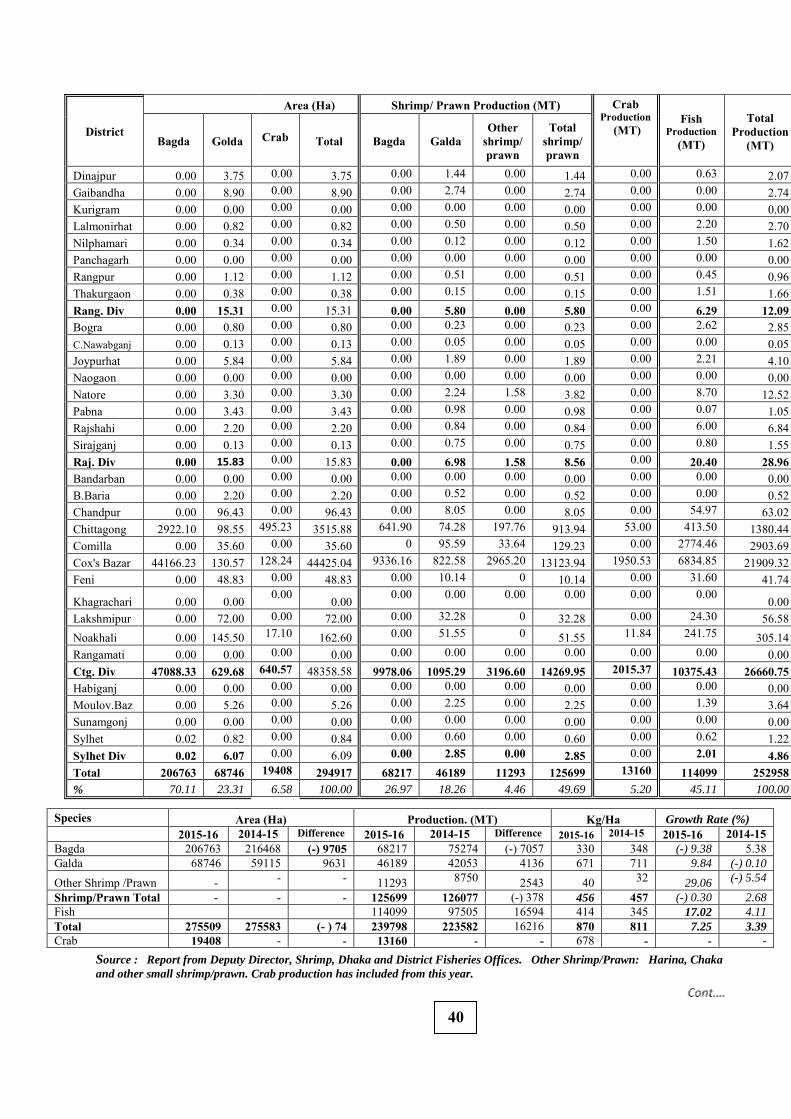
District
Area (Ha) Shrimp/ Prawn Production (MT) Crab Production
(MT) Fish
Production (MT)
Total Production
(MT) Bagda Golda
Crab Total Bagda Galda Other
shrimp/ prawn
Total shrimp/ prawn
Dinajpur 0.00 3.75 0.00 3.75 0.00 1.44 0.00 1.44 0.00 0.63 2.07 Gaibandha 0.00 8.90 0.00 8.90 0.00 2.74 0.00 2.74 0.00 0.00 2.74 Kurigram 0.00 0.00 0.00 0.00 0.00 0.00 0.00 0.00 0.00 0.00 0.00 Lalmonirhat 0.00 0.82 0.00 0.82 0.00 0.50 0.00 0.50 0.00 2.20 2.70 Nilphamari 0.00 0.34 0.00 0.34 0.00 0.12 0.00 0.12 0.00 1.50 1.62 Panchagarh 0.00 0.00 0.00 0.00 0.00 0.00 0.00 0.00 0.00 0.00 0.00 Rangpur 0.00 1.12 0.00 1.12 0.00 0.51 0.00 0.51 0.00 0.45 0.96 Thakurgaon 0.00 0.38 0.00 0.38 0.00 0.15 0.00 0.15 0.00 1.51 1.66 Rang. Div 0.00 15.31 0.00 15.31 0.00 5.80 0.00 5.80 0.00 6.29 12.09 Bogra 0.00 0.80 0.00 0.80 0.00 0.23 0.00 0.23 0.00 2.62 2.85 C.Nawabganj 0.00 0.13 0.00 0.13 0.00 0.05 0.00 0.05 0.00 0.00 0.05 Joypurhat 0.00 5.84 0.00 5.84 0.00 1.89 0.00 1.89 0.00 2.21 4.10 Naogaon 0.00 0.00 0.00 0.00 0.00 0.00 0.00 0.00 0.00 0.00 0.00 Natore 0.00 3.30 0.00 3.30 0.00 2.24 1.58 3.82 0.00 8.70 12.52 Pabna 0.00 3.43 0.00 3.43 0.00 0.98 0.00 0.98 0.00 0.07 1.05 Rajshahi 0.00 2.20 0.00 2.20 0.00 0.84 0.00 0.84 0.00 6.00 6.84 Sirajganj 0.00 0.13 0.00 0.13 0.00 0.75 0.00 0.75 0.00 0.80 1.55 Raj. Div 0.00 15.83 0.00 15.83 0.00 6.98 1.58 8.56 0.00 20.40 28.96 Bandarban 0.00 0.00 0.00 0.00 0.00 0.00 0.00 0.00 0.00 0.00 0.00 B.Baria 0.00 2.20 0.00 2.20 0.00 0.52 0.00 0.52 0.00 0.00 0.52 Chandpur 0.00 96.43 0.00 96.43 0.00 8.05 0.00 8.05 0.00 54.97 63.02 Chittagong 2922.10 98.55 495.23 3515.88 641.90 74.28 197.76 913.94 53.00 413.50 1380.44 Comilla 0.00 35.60 0.00 35.60 0 95.59 33.64 129.23 0.00 2774.46 2903.69 Cox's Bazar 44166.23 130.57 128.24 44425.04 9336.16 822.58 2965.20 13123.94 1950.53 6834.85 21909.32 Feni 0.00 48.83 0.00 48.83 0.00 10.14 0 10.14 0.00 31.60 41.74
Khagrachari 0.00 0.00 0.00 0.00 0.00 0.00 0.00 0.00 0.00 0.00 0.00 Lakshmipur 0.00 72.00 0.00 72.00 0.00 32.28 0 32.28 0.00 24.30 56.58 Noakhali 0.00 145.50 17.10 162.60 0.00 51.55 0 51.55 11.84 241.75 305.14 Rangamati 0.00 0.00 0.00 0.00 0.00 0.00 0.00 0.00 0.00 0.00 0.00 Ctg. Div 47088.33 629.68 640.57 48358.58 9978.06 1095.29 3196.60 14269.95 2015.37 10375.43 26660.75 Habiganj 0.00 0.00 0.00 0.00 0.00 0.00 0.00 0.00 0.00 0.00 0.00 Moulov.Baz 0.00 5.26 0.00 5.26 0.00 2.25 0.00 2.25 0.00 1.39 3.64 Sunamgonj 0.00 0.00 0.00 0.00 0.00 0.00 0.00 0.00 0.00 0.00 0.00 Sylhet 0.02 0.82 0.00 0.84 0.00 0.60 0.00 0.60 0.00 0.62 1.22 Sylhet Div 0.02 6.07 0.00 6.09 0.00 2.85 0.00 2.85 0.00 2.01 4.86 Total 206763 68746 19408 294917 68217 46189 11293 125699 13160 114099 252958 % 70.11 23.31 6.58 100.00 26.97 18.26 4.46 49.69 5.20 45.11 100.00
Species Area (Ha) Production. (MT) Kg/Ha Growth Rate (%)
2015-16 2014-15 Difference 2015-16 2014-15 Difference 2015-16 2014-15 2015-16 2014-15 Bagda 206763 216468 (-) 9705 68217 75274 (-) 7057 330 348 (-) 9.38 5.38 Galda 68746 59115 9631 46189 42053 4136 671 711 9.84 (-) 0.10
Other Shrimp /Prawn - - - 11293 8750 2543 40 32 29.06 (-) 5.54
Shrimp/Prawn Total - - - 125699 126077 (-) 378 456 457 (-) 0.30 2.68
Fish 114099 97505 16594 414 345 17.02 4.11
Total 275509 275583 (- ) 74 239798 223582 16216 870 811 7.25 3.39
Crab 19408 - - 13160 - - 678 - - -
Source : Report from Deputy Director, Shrimp, Dhaka and District Fisheries Offices. Other Shrimp/Prawn: Harina, Chaka
and other small shrimp/prawn. Crab production has included from this year.
40
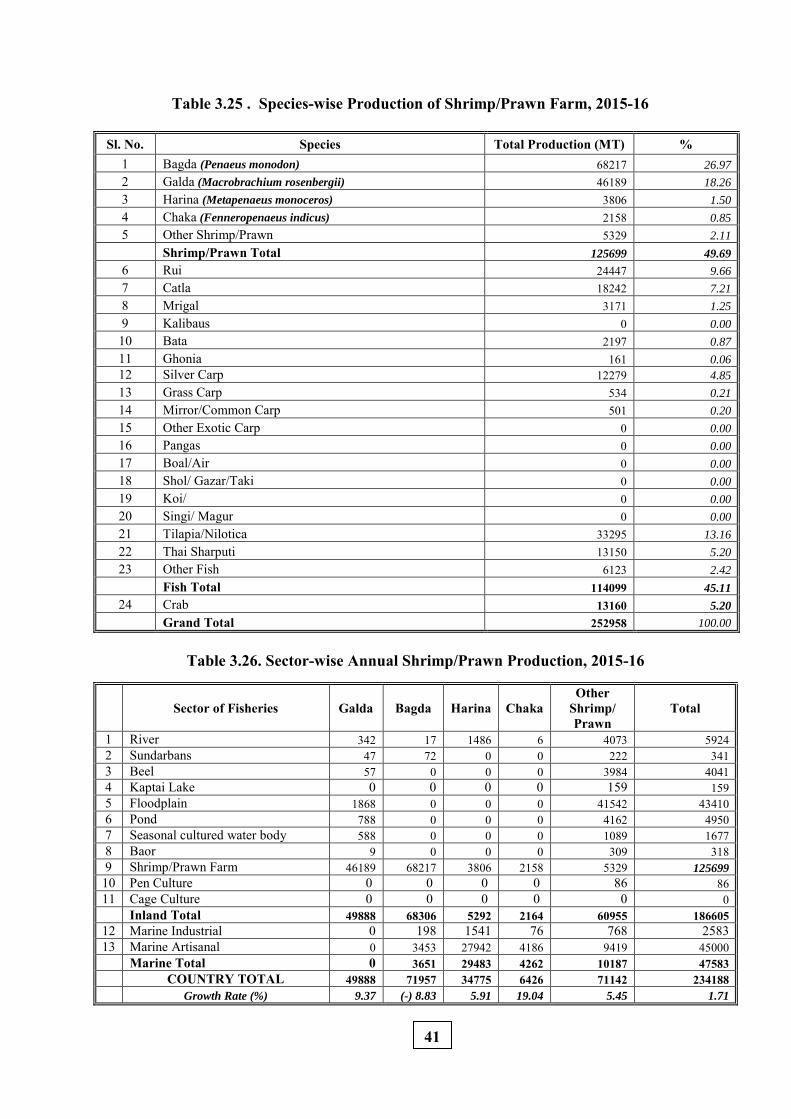
Table 3.25 . Species-wise Production of Shrimp/Prawn Farm, 2015-16
Sl. No. Species Total Production (MT) % 1 Bagda (Penaeus monodon) 68217 26.97
2 Galda (Macrobrachium rosenbergii) 46189 18.26
3 Harina (Metapenaeus monoceros) 3806 1.50
4 Chaka (Fenneropenaeus indicus) 2158 0.85
5 Other Shrimp/Prawn 5329 2.11
Shrimp/Prawn Total 125699 49.69
6 Rui 24447 9.66
7 Catla 18242 7.21
8 Mrigal 3171 1.25
9 Kalibaus 0 0.00
10 Bata 2197 0.87
11 Ghonia 161 0.06
12 Silver Carp 12279 4.85
13 Grass Carp 534 0.21
14 Mirror/Common Carp 501 0.20
15 Other Exotic Carp 0 0.00
16 Pangas 0 0.00
17 Boal/Air 0 0.00
18 Shol/ Gazar/Taki 0 0.00
19 Koi/ 0 0.00
20 Singi/ Magur 0 0.00
21 Tilapia/Nilotica 33295 13.16
22 Thai Sharputi 13150 5.20
23 Other Fish 6123 2.42
Fish Total 114099 45.11
24 Crab 13160 5.20
Grand Total 252958 100.00
Table 3.26. Sector-wise Annual Shrimp/Prawn Production, 2015-16
Sector of Fisheries Galda Bagda Harina Chaka Other
Shrimp/ Prawn
Total
1 River 342 17 1486 6 4073 5924 2 Sundarbans 47 72 0 0 222 341 3 Beel 57 0 0 0 3984 4041 4 Kaptai Lake 0 0 0 0 159 159 5 Floodplain 1868 0 0 0 41542 43410 6 Pond 788 0 0 0 4162 4950 7 Seasonal cultured water body 588 0 0 0 1089 1677 8 Baor 9 0 0 0 309 318 9 Shrimp/Prawn Farm 46189 68217 3806 2158 5329 125699 10 Pen Culture 0 0 0 0 86 86 11 Cage Culture 0 0 0 0 0 0 Inland Total 49888 68306 5292 2164 60955 186605
12 Marine Industrial 0 198 1541 76 768 2583 13 Marine Artisanal 0 3453 27942 4186 9419 45000 Marine Total 0 3651 29483 4262 10187 47583 COUNTRY TOTAL 49888 71957 34775 6426 71142 234188
Growth Rate (%) 9.37 (-) 8.83 5.91 19.04 5.45 1.71
41
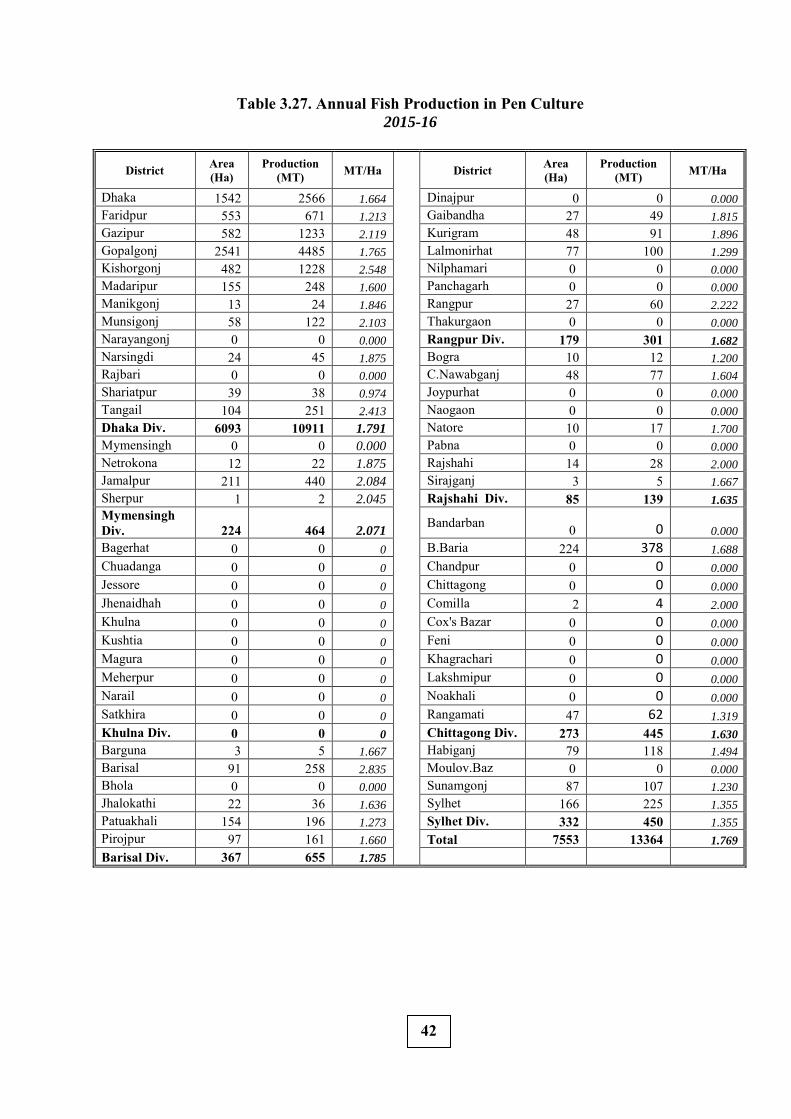
Table 3.27. Annual Fish Production in Pen Culture 2015-16
District Area (Ha)
Production (MT) MT/Ha
District Area
(Ha) Production
(MT) MT/Ha
Dhaka 1542 2566 1.664
Dinajpur 0 0 0.000
Faridpur 553 671 1.213
Gaibandha 27 49 1.815
Gazipur 582 1233 2.119
Kurigram 48 91 1.896
Gopalgonj 2541 4485 1.765
Lalmonirhat 77 100 1.299
Kishorgonj 482 1228 2.548
Nilphamari 0 0 0.000
Madaripur 155 248 1.600
Panchagarh 0 0 0.000
Manikgonj 13 24 1.846
Rangpur 27 60 2.222
Munsigonj 58 122 2.103
Thakurgaon 0 0 0.000
Narayangonj 0 0 0.000
Rangpur Div. 179 301 1.682
Narsingdi 24 45 1.875
Bogra 10 12 1.200
Rajbari 0 0 0.000
C.Nawabganj 48 77 1.604
Shariatpur 39 38 0.974
Joypurhat 0 0 0.000
Tangail 104 251 2.413
Naogaon 0 0 0.000
Dhaka Div. 6093 10911 1.791
Natore 10 17 1.700
Mymensingh 0 0 0.000
Pabna 0 0 0.000
Netrokona 12 22 1.875
Rajshahi 14 28 2.000
Jamalpur 211 440 2.084
Sirajganj 3 5 1.667
Sherpur 1 2 2.045
Rajshahi Div. 85 139 1.635
Mymensingh Div. 224 464 2.071
Bandarban 0 0 0.000
Bagerhat 0 0 0
B.Baria 224 378 1.688
Chuadanga 0 0 0
Chandpur 0 0 0.000
Jessore 0 0 0
Chittagong 0 0 0.000
Jhenaidhah 0 0 0
Comilla 2 4 2.000
Khulna 0 0 0
Cox's Bazar 0 0 0.000
Kushtia 0 0 0
Feni 0 0 0.000
Magura 0 0 0
Khagrachari 0 0 0.000
Meherpur 0 0 0
Lakshmipur 0 0 0.000
Narail 0 0 0
Noakhali 0 0 0.000
Satkhira 0 0 0
Rangamati 47 62 1.319
Khulna Div. 0 0 0
Chittagong Div. 273 445 1.630
Barguna 3 5 1.667
Habiganj 79 118 1.494
Barisal 91 258 2.835
Moulov.Baz 0 0 0.000
Bhola 0 0 0.000
Sunamgonj 87 107 1.230
Jhalokathi 22 36 1.636
Sylhet 166 225 1.355
Patuakhali 154 196 1.273
Sylhet Div. 332 450 1.355
Pirojpur 97 161 1.660
Total 7553 13364 1.769
Barisal Div. 367 655 1.785
42
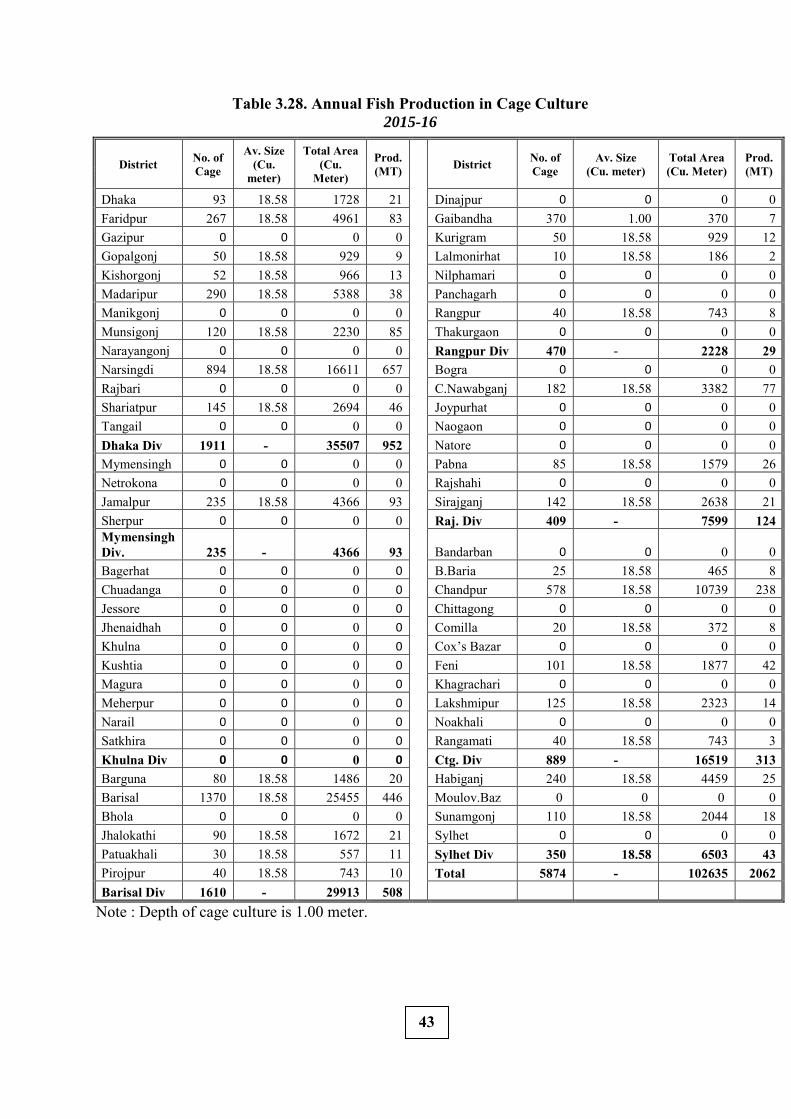
Table 3.28. Annual Fish Production in Cage Culture 2015-16
District No. of Cage
Av. Size (Cu.
meter)
Total Area (Cu.
Meter)
Prod. (MT)
District No. of Cage
Av. Size (Cu. meter)
Total Area (Cu. Meter)
Prod. (MT)
Dhaka 93 18.58 1728 21
Dinajpur 0 0 0 0 Faridpur 267 18.58 4961 83
Gaibandha 370 1.00 370 7
Gazipur 0 0 0 0
Kurigram 50 18.58 929 12 Gopalgonj 50 18.58 929 9
Lalmonirhat 10 18.58 186 2
Kishorgonj 52 18.58 966 13
Nilphamari 0 0 0 0 Madaripur 290 18.58 5388 38
Panchagarh 0 0 0 0
Manikgonj 0 0 0 0
Rangpur 40 18.58 743 8 Munsigonj 120 18.58 2230 85
Thakurgaon 0 0 0 0
Narayangonj 0 0 0 0
Rangpur Div 470 - 2228 29 Narsingdi 894 18.58 16611 657
Bogra 0 0 0 0
Rajbari 0 0 0 0
C.Nawabganj 182 18.58 3382 77 Shariatpur 145 18.58 2694 46
Joypurhat 0 0 0 0
Tangail 0 0 0 0
Naogaon 0 0 0 0 Dhaka Div 1911 - 35507 952
Natore 0 0 0 0
Mymensingh 0 0 0 0
Pabna 85 18.58 1579 26 Netrokona 0 0 0 0
Rajshahi 0 0 0 0
Jamalpur 235 18.58 4366 93
Sirajganj 142 18.58 2638 21 Sherpur 0 0 0 0
Raj. Div 409 - 7599 124
Mymensingh Div. 235 - 4366 93
Bandarban 0 0 0 0
Bagerhat 0 0 0 0
B.Baria 25 18.58 465 8
Chuadanga 0 0 0 0
Chandpur 578 18.58 10739 238
Jessore 0 0 0 0
Chittagong 0 0 0 0
Jhenaidhah 0 0 0 0
Comilla 20 18.58 372 8
Khulna 0 0 0 0
Cox’s Bazar 0 0 0 0
Kushtia 0 0 0 0
Feni 101 18.58 1877 42
Magura 0 0 0 0
Khagrachari 0 0 0 0
Meherpur 0 0 0 0
Lakshmipur 125 18.58 2323 14
Narail 0 0 0 0
Noakhali 0 0 0 0
Satkhira 0 0 0 0
Rangamati 40 18.58 743 3
Khulna Div 0 0 0 0
Ctg. Div 889 - 16519 313
Barguna 80 18.58 1486 20
Habiganj 240 18.58 4459 25 Barisal 1370 18.58 25455 446
Moulov.Baz 0 0 0 0
Bhola 0 0 0 0
Sunamgonj 110 18.58 2044 18 Jhalokathi 90 18.58 1672 21
Sylhet 0 0 0 0
Patuakhali 30 18.58 557 11
Sylhet Div 350 18.58 6503 43 Pirojpur 40 18.58 743 10
Total 5874 - 102635 2062
Barisal Div 1610 - 29913 508 Note : Depth of cage culture is 1.00 meter.
43
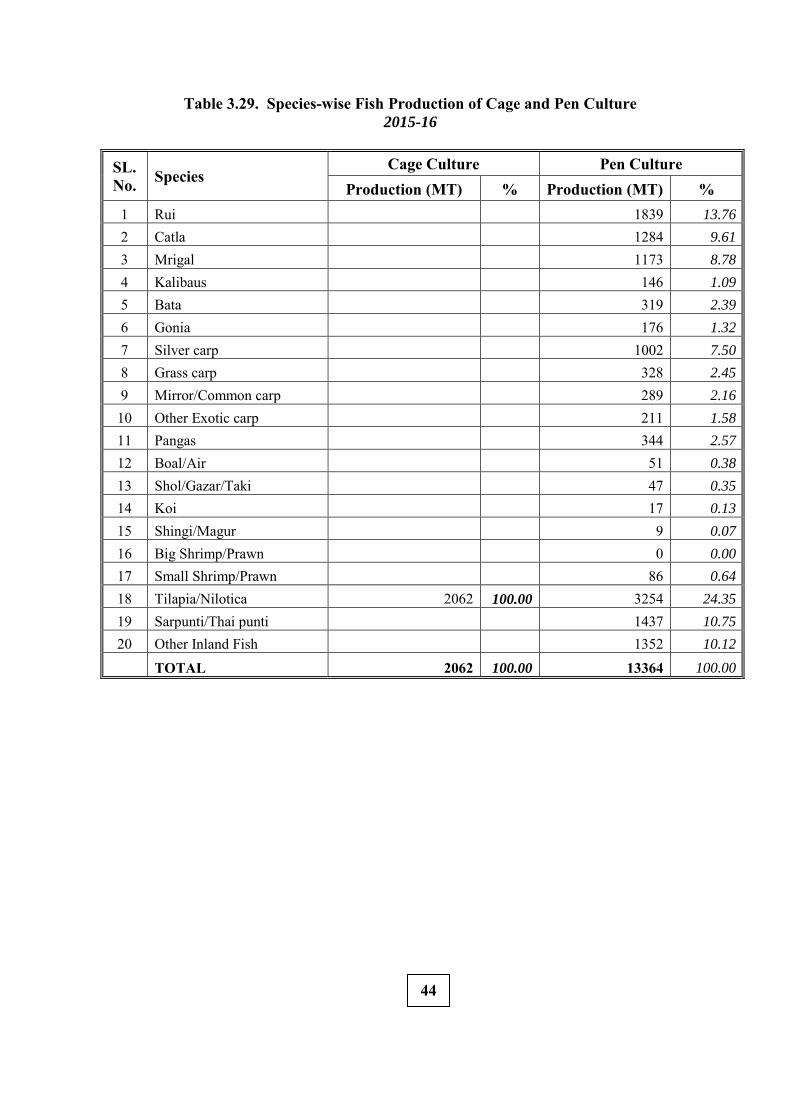
Table 3.29. Species-wise Fish Production of Cage and Pen Culture 2015-16
SL. No. Species
Cage Culture Pen Culture Production (MT) % Production (MT) %
1 Rui 1839 13.76
2 Catla 1284 9.61
3 Mrigal 1173 8.78
4 Kalibaus 146 1.09
5 Bata 319 2.39
6 Gonia 176 1.32
7 Silver carp 1002 7.50
8 Grass carp 328 2.45
9 Mirror/Common carp 289 2.16
10 Other Exotic carp 211 1.58
11 Pangas 344 2.57
12 Boal/Air 51 0.38
13 Shol/Gazar/Taki 47 0.35
14 Koi 17 0.13
15 Shingi/Magur 9 0.07
16 Big Shrimp/Prawn 0 0.00
17 Small Shrimp/Prawn 86 0.64
18 Tilapia/Nilotica 2062 100.00 3254 24.35
19 Sarpunti/Thai punti 1437 10.75
20 Other Inland Fish 1352 10.12
TOTAL 2062 100.00 13364 100.00
44
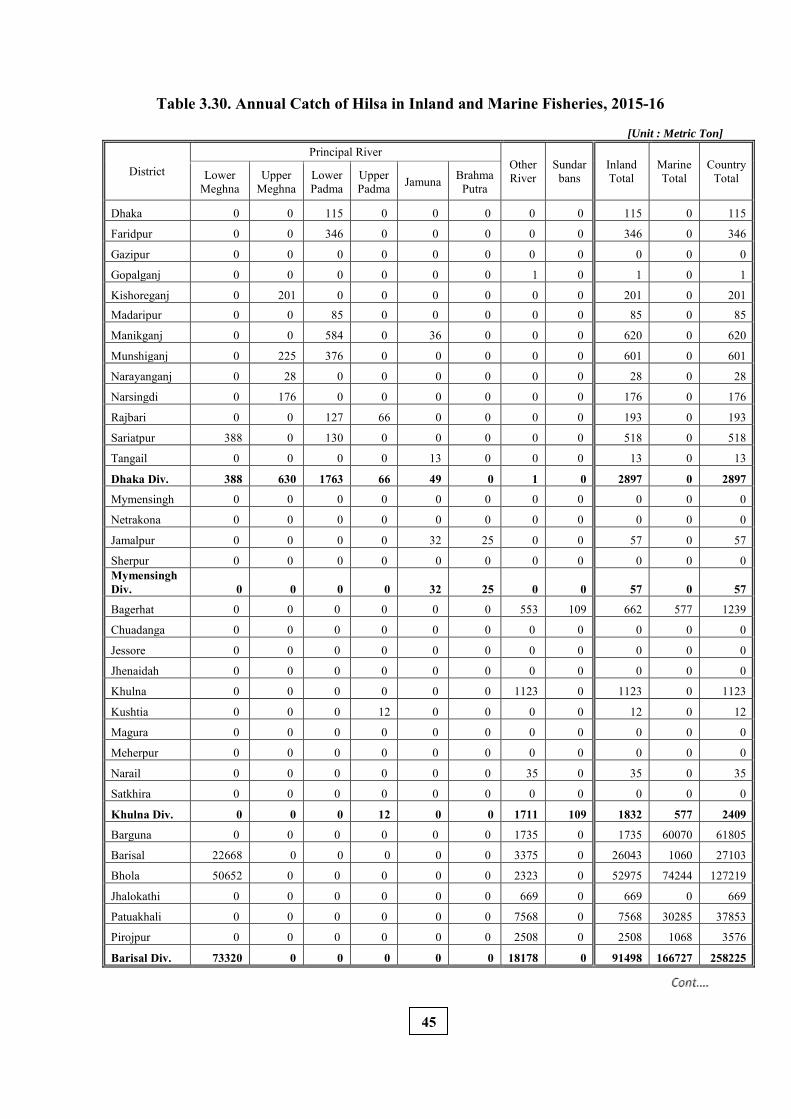
Table 3.30. Annual Catch of Hilsa in Inland and Marine Fisheries, 2015-16
[Unit : Metric Ton]
District Principal River
Other River
Sundar bans
Inland Total
Marine Total
Country Total Lower
Meghna Upper
Meghna Lower Padma
Upper Padma Jamuna Brahma
Putra
Dhaka 0 0 115 0 0 0 0 0 115 0 115
Faridpur 0 0 346 0 0 0 0 0 346 0 346
Gazipur 0 0 0 0 0 0 0 0 0 0 0
Gopalganj 0 0 0 0 0 0 1 0 1 0 1
Kishoreganj 0 201 0 0 0 0 0 0 201 0 201
Madaripur 0 0 85 0 0 0 0 0 85 0 85
Manikganj 0 0 584 0 36 0 0 0 620 0 620
Munshiganj 0 225 376 0 0 0 0 0 601 0 601
Narayanganj 0 28 0 0 0 0 0 0 28 0 28
Narsingdi 0 176 0 0 0 0 0 0 176 0 176
Rajbari 0 0 127 66 0 0 0 0 193 0 193
Sariatpur 388 0 130 0 0 0 0 0 518 0 518
Tangail 0 0 0 0 13 0 0 0 13 0 13
Dhaka Div. 388 630 1763 66 49 0 1 0 2897 0 2897
Mymensingh 0 0 0 0 0 0 0 0 0 0 0
Netrakona 0 0 0 0 0 0 0 0 0 0 0
Jamalpur 0 0 0 0 32 25 0 0 57 0 57
Sherpur 0 0 0 0 0 0 0 0 0 0 0 Mymensingh Div. 0 0 0 0 32 25 0 0 57 0 57
Bagerhat 0 0 0 0 0 0 553 109 662 577 1239
Chuadanga 0 0 0 0 0 0 0 0 0 0 0
Jessore 0 0 0 0 0 0 0 0 0 0 0
Jhenaidah 0 0 0 0 0 0 0 0 0 0 0
Khulna 0 0 0 0 0 0 1123 0 1123 0 1123
Kushtia 0 0 0 12 0 0 0 0 12 0 12
Magura 0 0 0 0 0 0 0 0 0 0 0
Meherpur 0 0 0 0 0 0 0 0 0 0 0
Narail 0 0 0 0 0 0 35 0 35 0 35
Satkhira 0 0 0 0 0 0 0 0 0 0 0
Khulna Div. 0 0 0 12 0 0 1711 109 1832 577 2409
Barguna 0 0 0 0 0 0 1735 0 1735 60070 61805
Barisal 22668 0 0 0 0 0 3375 0 26043 1060 27103
Bhola 50652 0 0 0 0 0 2323 0 52975 74244 127219
Jhalokathi 0 0 0 0 0 0 669 0 669 0 669
Patuakhali 0 0 0 0 0 0 7568 0 7568 30285 37853
Pirojpur 0 0 0 0 0 0 2508 0 2508 1068 3576
Barisal Div. 73320 0 0 0 0 0 18178 0 91498 166727 258225
45
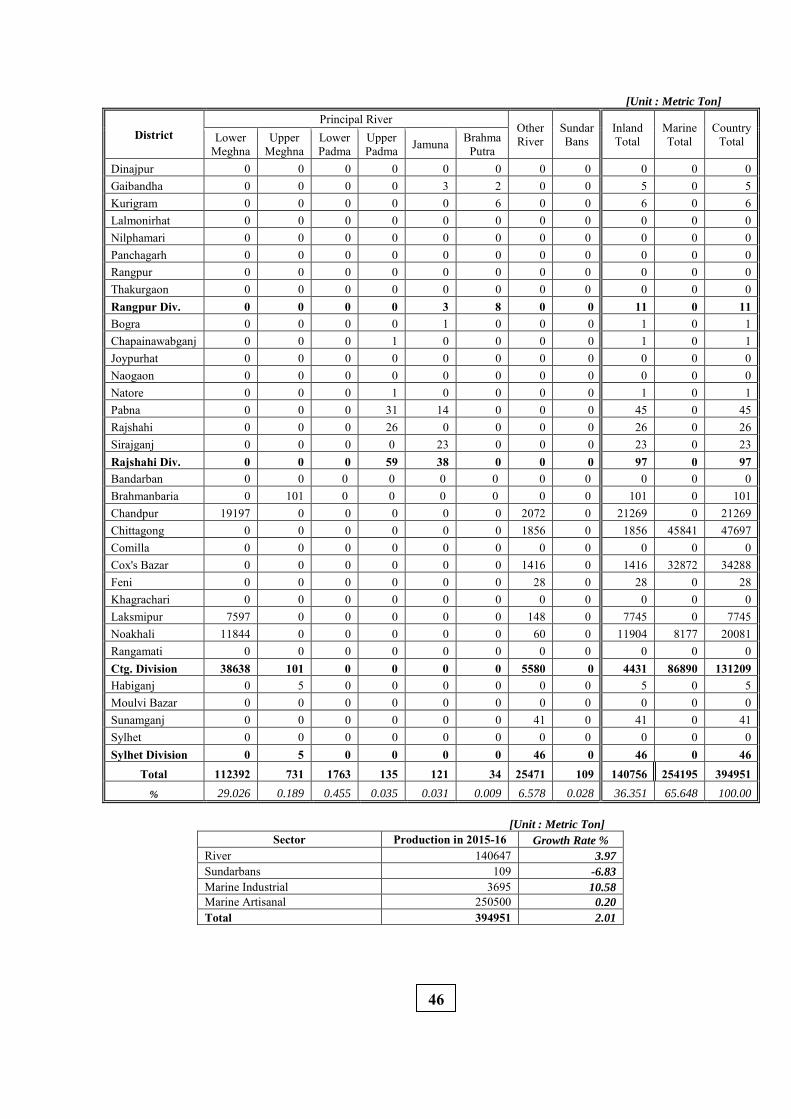
[Unit : Metric Ton]
District Principal River
Other River
Sundar Bans
Inland Total
Marine Total
Country Total Lower
Meghna Upper
Meghna Lower Padma
Upper Padma Jamuna Brahma
Putra Dinajpur 0 0 0 0 0 0 0 0 0 0 0 Gaibandha 0 0 0 0 3 2 0 0 5 0 5 Kurigram 0 0 0 0 0 6 0 0 6 0 6 Lalmonirhat 0 0 0 0 0 0 0 0 0 0 0 Nilphamari 0 0 0 0 0 0 0 0 0 0 0 Panchagarh 0 0 0 0 0 0 0 0 0 0 0 Rangpur 0 0 0 0 0 0 0 0 0 0 0 Thakurgaon 0 0 0 0 0 0 0 0 0 0 0 Rangpur Div. 0 0 0 0 3 8 0 0 11 0 11 Bogra 0 0 0 0 1 0 0 0 1 0 1 Chapainawabganj 0 0 0 1 0 0 0 0 1 0 1 Joypurhat 0 0 0 0 0 0 0 0 0 0 0 Naogaon 0 0 0 0 0 0 0 0 0 0 0 Natore 0 0 0 1 0 0 0 0 1 0 1 Pabna 0 0 0 31 14 0 0 0 45 0 45 Rajshahi 0 0 0 26 0 0 0 0 26 0 26 Sirajganj 0 0 0 0 23 0 0 0 23 0 23 Rajshahi Div. 0 0 0 59 38 0 0 0 97 0 97 Bandarban 0 0 0 0 0 0 0 0 0 0 0 Brahmanbaria 0 101 0 0 0 0 0 0 101 0 101 Chandpur 19197 0 0 0 0 0 2072 0 21269 0 21269 Chittagong 0 0 0 0 0 0 1856 0 1856 45841 47697 Comilla 0 0 0 0 0 0 0 0 0 0 0 Cox's Bazar 0 0 0 0 0 0 1416 0 1416 32872 34288 Feni 0 0 0 0 0 0 28 0 28 0 28 Khagrachari 0 0 0 0 0 0 0 0 0 0 0 Laksmipur 7597 0 0 0 0 0 148 0 7745 0 7745 Noakhali 11844 0 0 0 0 0 60 0 11904 8177 20081 Rangamati 0 0 0 0 0 0 0 0 0 0 0 Ctg. Division 38638 101 0 0 0 0 5580 0 4431 86890 131209 Habiganj 0 5 0 0 0 0 0 0 5 0 5 Moulvi Bazar 0 0 0 0 0 0 0 0 0 0 0 Sunamganj 0 0 0 0 0 0 41 0 41 0 41 Sylhet 0 0 0 0 0 0 0 0 0 0 0 Sylhet Division 0 5 0 0 0 0 46 0 46 0 46
Total 112392 731 1763 135 121 34 25471 109 140756 254195 394951 % 29.026 0.189 0.455 0.035 0.031 0.009 6.578 0.028 36.351 65.648 100.00
[Unit : Metric Ton]
Sector Production in 2015-16 Growth Rate %
River 140647 3.97
Sundarbans 109 -6.83
Marine Industrial 3695 10.58
Marine Artisanal 250500 0.20
Total 394951 2.01
46
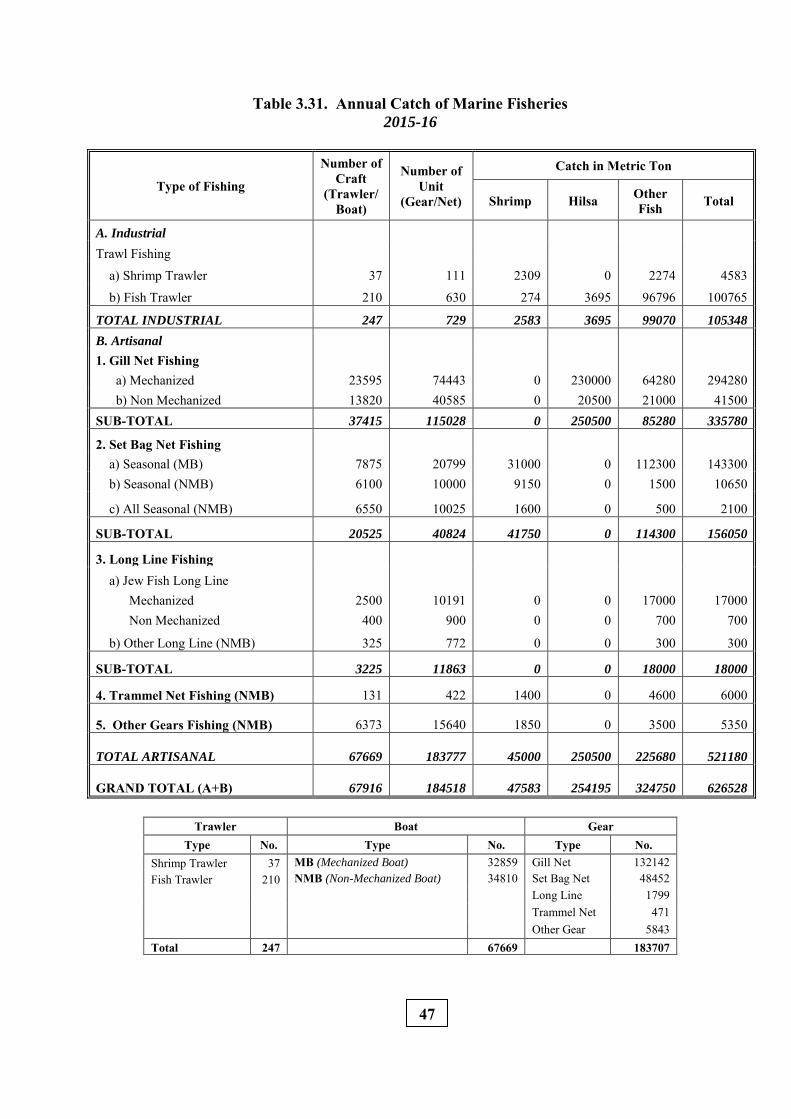
Table 3.31. Annual Catch of Marine Fisheries 2015-16
Type of Fishing
Number of Craft
(Trawler/ Boat)
Number of Unit
(Gear/Net)
Catch in Metric Ton
Shrimp Hilsa Other Fish Total
A. Industrial Trawl Fishing
a) Shrimp Trawler 37 111 2309 0 2274 4583
b) Fish Trawler 210 630 274 3695 96796 100765
TOTAL INDUSTRIAL 247 729 2583 3695 99070 105348
B. Artisanal 1. Gill Net Fishing a) Mechanized 23595 74443 0 230000 64280 294280 b) Non Mechanized 13820 40585 0 20500 21000 41500 SUB-TOTAL 37415 115028 0 250500 85280 335780
2. Set Bag Net Fishing a) Seasonal (MB) 7875 20799 31000 0 112300 143300 b) Seasonal (NMB) 6100 10000 9150 0 1500 10650
c) All Seasonal (NMB) 6550 10025 1600 0 500 2100
SUB-TOTAL 20525 40824 41750 0 114300 156050
3. Long Line Fishing
a) Jew Fish Long Line
Mechanized 2500 10191 0 0 17000 17000 Non Mechanized 400 900 0 0 700 700
b) Other Long Line (NMB) 325 772 0 0 300 300
SUB-TOTAL 3225 11863 0 0 18000 18000
4. Trammel Net Fishing (NMB) 131 422 1400 0 4600 6000
5. Other Gears Fishing (NMB) 6373 15640 1850 0 3500 5350
TOTAL ARTISANAL 67669 183777 45000 250500 225680 521180
GRAND TOTAL (A+B) 67916 184518 47583 254195 324750 626528
Trawler Boat Gear
Type No. Type No. Type No. Shrimp Trawler 37 MB (Mechanized Boat) 32859 Gill Net 132142 Fish Trawler 210 NMB (Non-Mechanized Boat) 34810 Set Bag Net 48452 Long Line 1799 Trammel Net 471 Other Gear 5843 Total 247 67669 183707
47
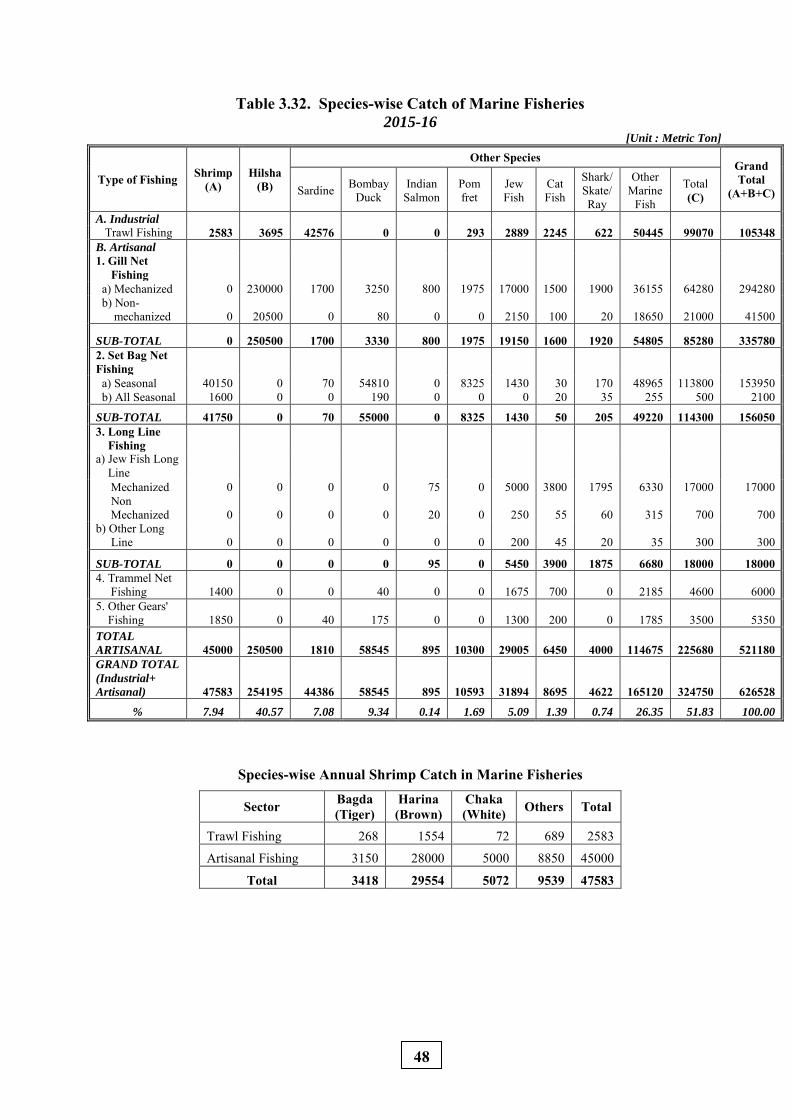
Table 3.32. Species-wise Catch of Marine Fisheries 2015-16
[Unit : Metric Ton]
Type of Fishing Shrimp (A)
Hilsha (B)
Other Species Grand Total
(A+B+C) Sardine Bombay Duck
Indian Salmon
Pom fret
Jew Fish
Cat Fish
Shark/ Skate/ Ray
Other Marine
Fish
Total (C)
A. Industrial Trawl Fishing 2583 3695 42576 0 0 293 2889 2245 622 50445 99070 105348 B. Artisanal 1. Gill Net Fishing a) Mechanized 0 230000 1700 3250 800 1975 17000 1500 1900 36155 64280 294280 b) Non- mechanized 0 20500 0 80 0 0 2150 100 20 18650 21000 41500
SUB-TOTAL 0 250500 1700 3330 800 1975 19150 1600 1920 54805 85280 335780 2. Set Bag Net Fishing a) Seasonal 40150 0 70 54810 0 8325 1430 30 170 48965 113800 153950 b) All Seasonal 1600 0 0 190 0 0 0 20 35 255 500 2100
SUB-TOTAL 41750 0 70 55000 0 8325 1430 50 205 49220 114300 156050 3. Long Line Fishing a) Jew Fish Long Line Mechanized 0 0 0 0 75 0 5000 3800 1795 6330 17000 17000 Non Mechanized 0 0 0 0 20 0 250 55 60 315 700 700 b) Other Long Line 0 0 0 0 0 0 200 45 20 35 300 300
SUB-TOTAL 0 0 0 0 95 0 5450 3900 1875 6680 18000 18000 4. Trammel Net Fishing 1400 0 0 40 0 0 1675 700 0 2185 4600 6000 5. Other Gears' Fishing 1850 0 40 175 0 0 1300 200 0 1785 3500 5350 TOTAL
ARTISANAL 45000 250500 1810 58545 895 10300 29005 6450 4000 114675 225680 521180 GRAND TOTAL
(Industrial+
Artisanal) 47583 254195 44386 58545 895 10593 31894 8695 4622 165120 324750 626528
% 7.94 40.57 7.08 9.34 0.14 1.69 5.09 1.39 0.74 26.35 51.83 100.00
Species-wise Annual Shrimp Catch in Marine Fisheries
Sector Bagda (Tiger)
Harina (Brown)
Chaka (White) Others Total
Trawl Fishing 268 1554 72 689 2583
Artisanal Fishing 3150 28000 5000 8850 45000
Total 3418 29554 5072 9539 47583
48
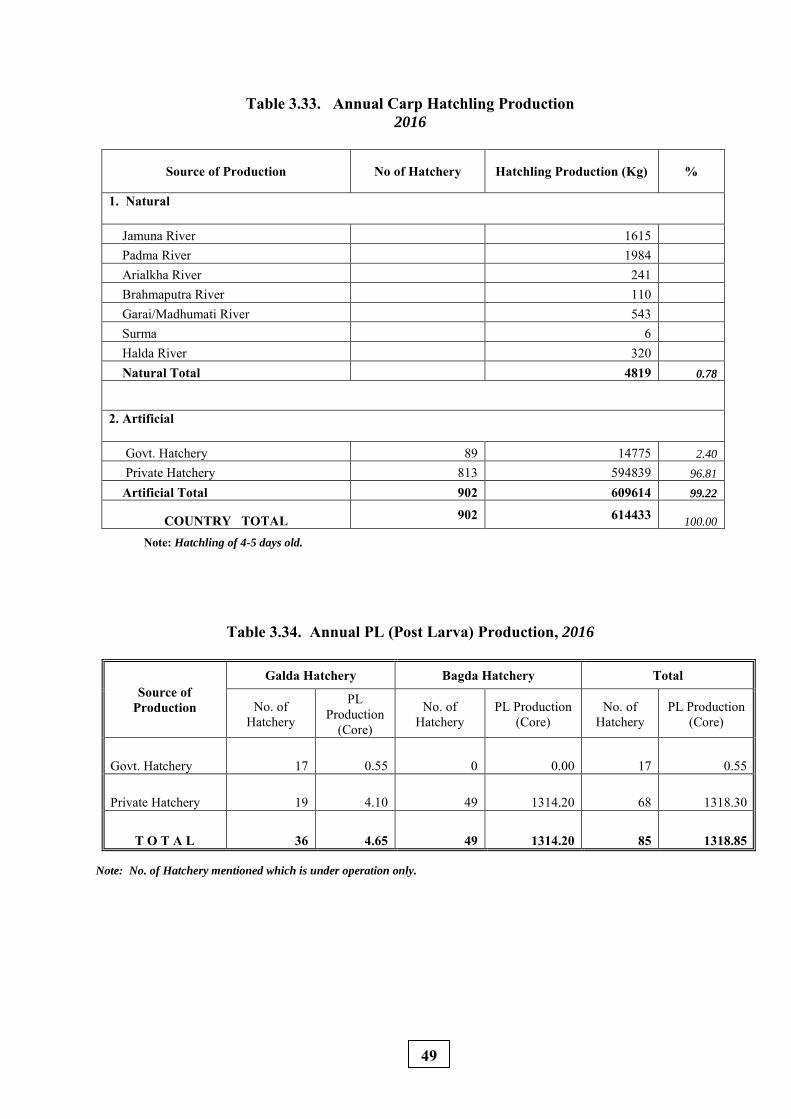
Table 3.33. Annual Carp Hatchling Production 2016
Source of Production No of Hatchery Hatchling Production (Kg) %
1. Natural
Jamuna River 1615 Padma River 1984 Arialkha River 241 Brahmaputra River 110 Garai/Madhumati River 543 Surma 6 Halda River 320 Natural Total 4819 0.78
2. Artificial Govt. Hatchery 89 14775 2.40
Private Hatchery 813 594839 96.81
Artificial Total 902 609614 99.22
COUNTRY TOTAL 902 614433 100.00
Note: Hatchling of 4-5 days old.
Table 3.34. Annual PL (Post Larva) Production, 2016
Source of Production
Galda Hatchery Bagda Hatchery Total
No. of Hatchery
PL Production
(Core)
No. of Hatchery
PL Production (Core)
No. of Hatchery
PL Production (Core)
Govt. Hatchery 17 0.55 0 0.00 17 0.55
Private Hatchery 19 4.10 49 1314.20 68 1318.30
T O T A L 36 4.65 49 1314.20 85 1318.85
Note: No. of Hatchery mentioned which is under operation only.
49
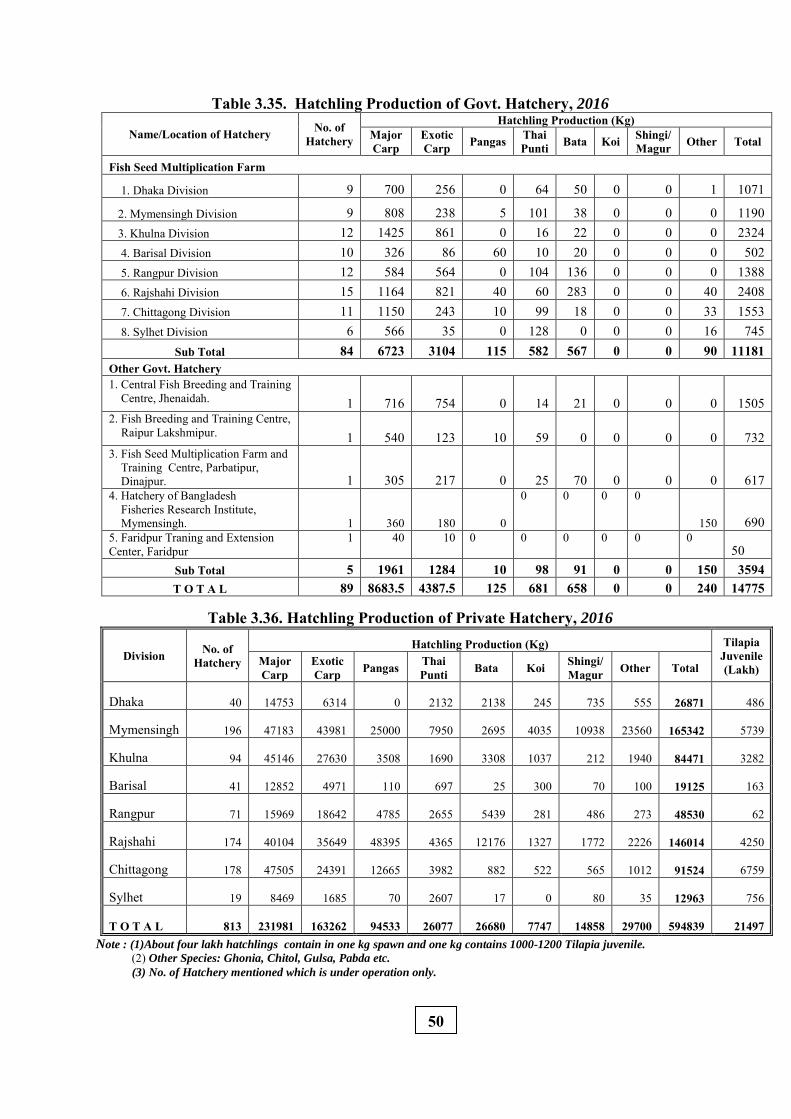
Table 3.35. Hatchling Production of Govt. Hatchery, 2016
Name/Location of Hatchery No. of Hatchery
Hatchling Production (Kg) Major Carp
Exotic Carp Pangas Thai
Punti Bata Koi Shingi/ Magur Other Total
Fish Seed Multiplication Farm
1. Dhaka Division 9 700 256 0 64 50 0 0 1 1071
2. Mymensingh Division 9 808 238 5 101 38 0 0 0 1190 3. Khulna Division 12 1425 861 0 16 22 0 0 0 2324 4. Barisal Division 10 326 86 60 10 20 0 0 0 502 5. Rangpur Division 12 584 564 0 104 136 0 0 0 1388 6. Rajshahi Division 15 1164 821 40 60 283 0 0 40 2408 7. Chittagong Division 11 1150 243 10 99 18 0 0 33 1553 8. Sylhet Division 6 566 35 0 128 0 0 0 16 745
Sub Total 84 6723 3104 115 582 567 0 0 90 11181 Other Govt. Hatchery 1. Central Fish Breeding and Training Centre, Jhenaidah. 1 716 754 0 14 21 0 0 0 1505 2. Fish Breeding and Training Centre, Raipur Lakshmipur. 1 540 123 10 59 0 0 0 0 732 3. Fish Seed Multiplication Farm and Training Centre, Parbatipur, Dinajpur. 1 305 217 0 25 70 0 0 0 617 4. Hatchery of Bangladesh Fisheries Research Institute, Mymensingh. 1 360 180 0
0 0 0 0
150 690 5. Faridpur Traning and Extension Center, Faridpur
1 40 10 0 0 0 0 0 0 50
Sub Total 5 1961 1284 10 98 91 0 0 150 3594 T O T A L 89 8683.5 4387.5 125 681 658 0 0 240 14775
Table 3.36. Hatchling Production of Private Hatchery, 2016
Division No. of Hatchery
Hatchling Production (Kg) Tilapia Juvenile (Lakh)
Major Carp
Exotic Carp Pangas Thai
Punti Bata Koi Shingi/ Magur Other Total
Dhaka 40 14753 6314 0 2132 2138 245 735 555 26871 486
Mymensingh 196 47183 43981 25000 7950 2695 4035 10938 23560 165342 5739
Khulna 94 45146 27630 3508 1690 3308 1037 212 1940 84471 3282
Barisal 41 12852 4971 110 697 25 300 70 100 19125 163
Rangpur 71 15969 18642 4785 2655 5439 281 486 273 48530 62
Rajshahi 174 40104 35649 48395 4365 12176 1327 1772 2226 146014 4250
Chittagong 178 47505 24391 12665 3982 882 522 565 1012 91524 6759
Sylhet 19 8469 1685 70 2607 17 0 80 35 12963 756
T O T A L 813 231981 163262 94533 26077 26680 7747 14858 29700 594839 21497 Note : (1)About four lakh hatchlings contain in one kg spawn and one kg contains 1000-1200 Tilapia juvenile.
(2) Other Species: Ghonia, Chitol, Gulsa, Pabda etc.
(3) No. of Hatchery mentioned which is under operation only. 50
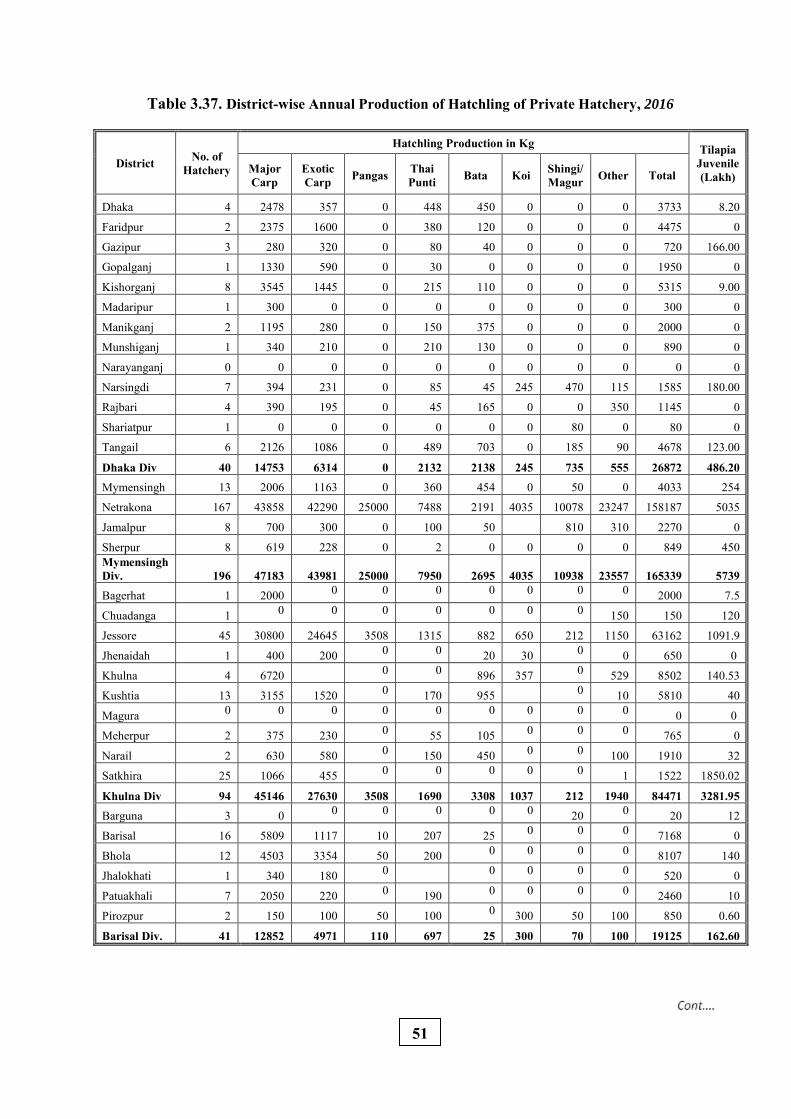
Table 3.37. District-wise Annual Production of Hatchling of Private Hatchery, 2016
District No. of Hatchery
Hatchling Production in Kg Tilapia Juvenile (Lakh)
Major Carp
Exotic Carp Pangas Thai
Punti Bata Koi Shingi/ Magur Other Total
Dhaka 4 2478 357 0 448 450 0 0 0 3733 8.20
Faridpur 2 2375 1600 0 380 120 0 0 0 4475 0
Gazipur 3 280 320 0 80 40 0 0 0 720 166.00
Gopalganj 1 1330 590 0 30 0 0 0 0 1950 0
Kishorganj 8 3545 1445 0 215 110 0 0 0 5315 9.00
Madaripur 1 300 0 0 0 0 0 0 0 300 0
Manikganj 2 1195 280 0 150 375 0 0 0 2000 0
Munshiganj 1 340 210 0 210 130 0 0 0 890 0
Narayanganj 0 0 0 0 0 0 0 0 0 0 0
Narsingdi 7 394 231 0 85 45 245 470 115 1585 180.00
Rajbari 4 390 195 0 45 165 0 0 350 1145 0
Shariatpur 1 0 0 0 0 0 0 80 0 80 0
Tangail 6 2126 1086 0 489 703 0 185 90 4678 123.00
Dhaka Div 40 14753 6314 0 2132 2138 245 735 555 26872 486.20 Mymensingh 13 2006 1163 0 360 454 0 50 0 4033 254
Netrakona 167 43858 42290 25000 7488 2191 4035 10078 23247 158187 5035
Jamalpur 8 700 300 0 100 50 810 310 2270 0
Sherpur 8 619 228 0 2 0 0 0 0 849 450 Mymensingh Div. 196 47183 43981 25000 7950 2695 4035 10938 23557 165339 5739 Bagerhat 1 2000 0 0 0 0 0 0 0 2000 7.5
Chuadanga 1 0 0 0 0 0 0 0 150 150 120
Jessore 45 30800 24645 3508 1315 882 650 212 1150 63162 1091.9
Jhenaidah 1 400 200 0 0 20 30 0 0 650 0
Khulna 4 6720 0 0 896 357 0 529 8502 140.53
Kushtia 13 3155 1520 0 170 955 0 10 5810 40
Magura 0 0 0 0 0 0 0 0 0 0 0
Meherpur 2 375 230 0 55 105 0 0 0 765 0
Narail 2 630 580 0 150 450 0 0 100 1910 32
Satkhira 25 1066 455 0 0 0 0 0 1 1522 1850.02
Khulna Div 94 45146 27630 3508 1690 3308 1037 212 1940 84471 3281.95 Barguna 3 0 0 0 0 0 0 20 0 20 12
Barisal 16 5809 1117 10 207 25 0 0 0 7168 0
Bhola 12 4503 3354 50 200 0 0 0 0 8107 140
Jhalokhati 1 340 180 0 0 0 0 0 520 0
Patuakhali 7 2050 220 0 190 0 0 0 0 2460 10
Pirozpur 2 150 100 50 100 0 300 50 100 850 0.60
Barisal Div. 41 12852 4971 110 697 25 300 70 100 19125 162.60
51
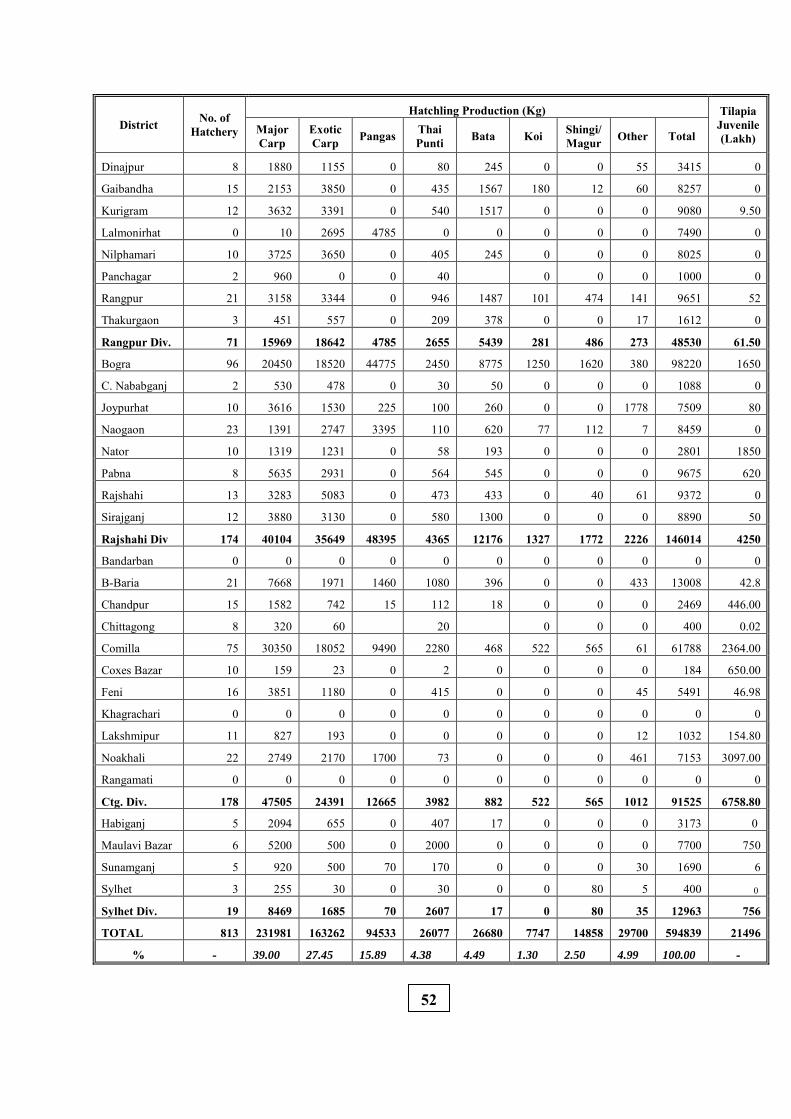
District No. of Hatchery
Hatchling Production (Kg) Tilapia Juvenile (Lakh)
Major Carp
Exotic Carp Pangas Thai
Punti Bata Koi Shingi/ Magur Other Total
Dinajpur 8 1880 1155 0 80 245 0 0 55 3415 0
Gaibandha 15 2153 3850 0 435 1567 180 12 60 8257 0
Kurigram 12 3632 3391 0 540 1517 0 0 0 9080 9.50
Lalmonirhat 0 10 2695 4785 0 0 0 0 0 7490 0
Nilphamari 10 3725 3650 0 405 245 0 0 0 8025 0
Panchagar 2 960 0 0 40 0 0 0 1000 0
Rangpur 21 3158 3344 0 946 1487 101 474 141 9651 52
Thakurgaon 3 451 557 0 209 378 0 0 17 1612 0
Rangpur Div. 71 15969 18642 4785 2655 5439 281 486 273 48530 61.50
Bogra 96 20450 18520 44775 2450 8775 1250 1620 380 98220 1650
C. Nababganj 2 530 478 0 30 50 0 0 0 1088 0
Joypurhat 10 3616 1530 225 100 260 0 0 1778 7509 80
Naogaon 23 1391 2747 3395 110 620 77 112 7 8459 0
Nator 10 1319 1231 0 58 193 0 0 0 2801 1850
Pabna 8 5635 2931 0 564 545 0 0 0 9675 620
Rajshahi 13 3283 5083 0 473 433 0 40 61 9372 0
Sirajganj 12 3880 3130 0 580 1300 0 0 0 8890 50
Rajshahi Div 174 40104 35649 48395 4365 12176 1327 1772 2226 146014 4250
Bandarban 0 0 0 0 0 0 0 0 0 0 0
B-Baria 21 7668 1971 1460 1080 396 0 0 433 13008 42.8
Chandpur 15 1582 742 15 112 18 0 0 0 2469 446.00
Chittagong 8 320 60 20 0 0 0 400 0.02
Comilla 75 30350 18052 9490 2280 468 522 565 61 61788 2364.00
Coxes Bazar 10 159 23 0 2 0 0 0 0 184 650.00
Feni 16 3851 1180 0 415 0 0 0 45 5491 46.98
Khagrachari 0 0 0 0 0 0 0 0 0 0 0
Lakshmipur 11 827 193 0 0 0 0 0 12 1032 154.80
Noakhali 22 2749 2170 1700 73 0 0 0 461 7153 3097.00
Rangamati 0 0 0 0 0 0 0 0 0 0 0
Ctg. Div. 178 47505 24391 12665 3982 882 522 565 1012 91525 6758.80
Habiganj 5 2094 655 0 407 17 0 0 0 3173 0
Maulavi Bazar 6 5200 500 0 2000 0 0 0 0 7700 750
Sunamganj 5 920 500 70 170 0 0 0 30 1690 6
Sylhet 3 255 30 0 30 0 0 80 5 400 0
Sylhet Div. 19 8469 1685 70 2607 17 0 80 35 12963 756
TOTAL 813 231981 163262 94533 26077 26680 7747 14858 29700 594839 21496
% - 39.00 27.45 15.89 4.38 4.49 1.30 2.50 4.99 100.00 -
52
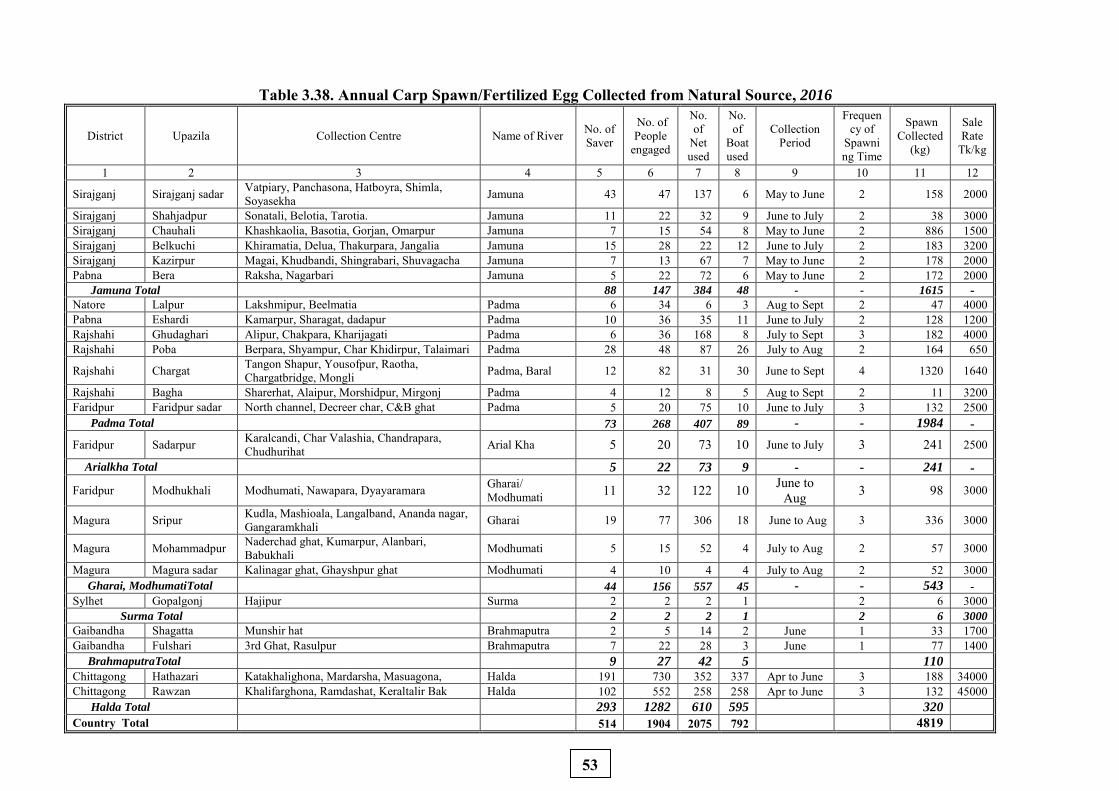
Table 3.38. Annual Carp Spawn/Fertilized Egg Collected from Natural Source, 2016
District Upazila Collection Centre Name of River No. of Saver
No. of People
engaged
No. of
Net used
No. of
Boat used
Collection Period
Frequency of
Spawning Time
Spawn Collected
(kg)
Sale Rate
Tk/kg
1 2 3 4 5 6 7 8 9 10 11 12
Sirajganj Sirajganj sadar Vatpiary, Panchasona, Hatboyra, Shimla, Soyasekha Jamuna 43 47 137 6 May to June 2 158 2000
Sirajganj Shahjadpur Sonatali, Belotia, Tarotia. Jamuna 11 22 32 9 June to July 2 38 3000 Sirajganj Chauhali Khashkaolia, Basotia, Gorjan, Omarpur Jamuna 7 15 54 8 May to June 2 886 1500 Sirajganj Belkuchi Khiramatia, Delua, Thakurpara, Jangalia Jamuna 15 28 22 12 June to July 2 183 3200 Sirajganj Kazirpur Magai, Khudbandi, Shingrabari, Shuvagacha Jamuna 7 13 67 7 May to June 2 178 2000 Pabna Bera Raksha, Nagarbari Jamuna 5 22 72 6 May to June 2 172 2000 Jamuna Total 88 147 384 48 - - 1615 - Natore Lalpur Lakshmipur, Beelmatia Padma 6 34 6 3 Aug to Sept 2 47 4000 Pabna Eshardi Kamarpur, Sharagat, dadapur Padma 10 36 35 11 June to July 2 128 1200 Rajshahi Ghudaghari Alipur, Chakpara, Kharijagati Padma 6 36 168 8 July to Sept 3 182 4000 Rajshahi Poba Berpara, Shyampur, Char Khidirpur, Talaimari Padma 28 48 87 26 July to Aug 2 164 650
Rajshahi Chargat Tangon Shapur, Yousofpur, Raotha, Chargatbridge, Mongli Padma, Baral 12 82 31 30 June to Sept 4 1320 1640
Rajshahi Bagha Sharerhat, Alaipur, Morshidpur, Mirgonj Padma 4 12 8 5 Aug to Sept 2 11 3200 Faridpur Faridpur sadar North channel, Decreer char, C&B ghat Padma 5 20 75 10 June to July 3 132 2500 Padma Total 73 268 407 89 - - 1984 -
Faridpur Sadarpur Karalcandi, Char Valashia, Chandrapara, Chudhurihat Arial Kha 5 20 73 10 June to July 3 241 2500
Arialkha Total 5 22 73 9 - - 241 -
Faridpur Modhukhali Modhumati, Nawapara, Dyayaramara Gharai/ Modhumati 11 32 122 10 June to
Aug 3 98 3000
Magura Sripur Kudla, Mashioala, Langalband, Ananda nagar, Gangaramkhali Gharai 19 77 306 18 June to Aug 3 336 3000
Magura Mohammadpur Naderchad ghat, Kumarpur, Alanbari, Babukhali Modhumati 5 15 52 4 July to Aug 2 57 3000
Magura Magura sadar Kalinagar ghat, Ghayshpur ghat Modhumati 4 10 4 4 July to Aug 2 52 3000 Gharai, ModhumatiTotal 44 156 557 45 - - 543 -
Sylhet Gopalgonj Hajipur Surma 2 2 2 1
2 6 3000 Surma Total 2 2 2 1
2 6 3000
Gaibandha Shagatta Munshir hat Brahmaputra 2 5 14 2 June 1 33 1700 Gaibandha Fulshari 3rd Ghat, Rasulpur Brahmaputra 7 22 28 3 June 1 77 1400 BrahmaputraTotal 9 27 42 5
110 Chittagong Hathazari Katakhalighona, Mardarsha, Masuagona, Halda 191 730 352 337 Apr to June 3 188 34000 Chittagong Rawzan Khalifarghona, Ramdashat, Keraltalir Bak Halda 102 552 258 258 Apr to June 3 132 45000 Halda Total 293 1282 610 595
320 Country Total 514 1904 2075 792 4819
53
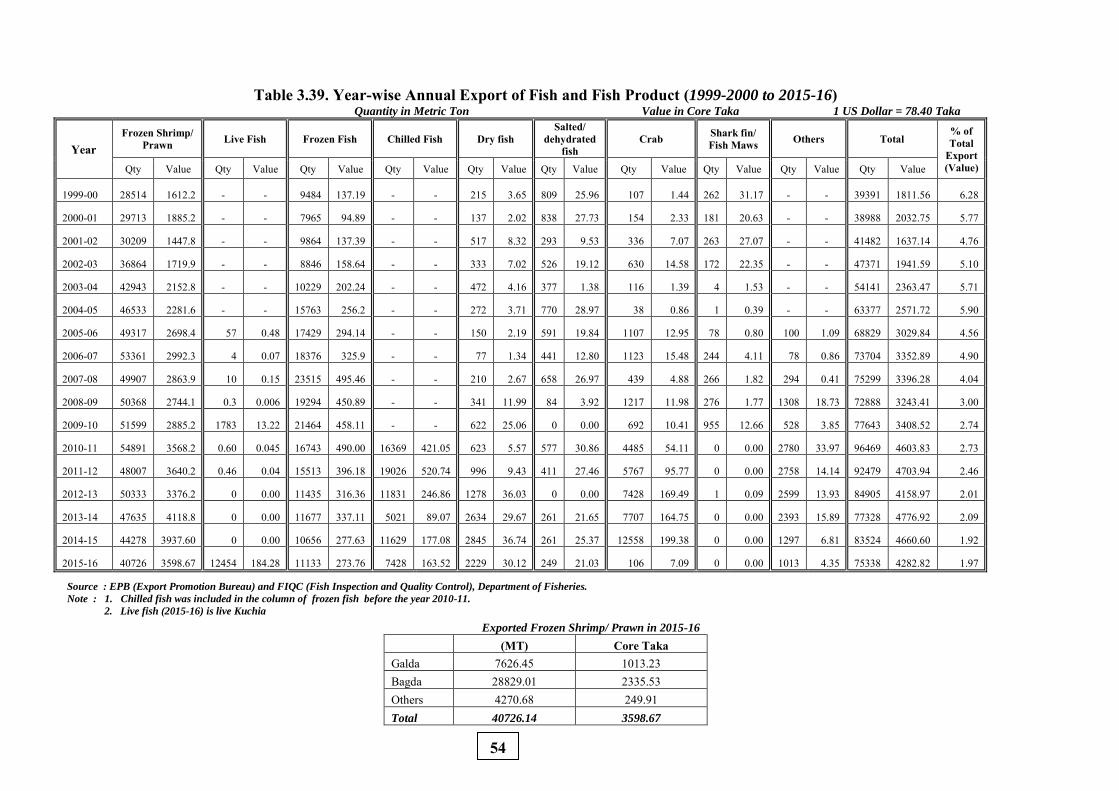
Table 3.39. Year-wise Annual Export of Fish and Fish Product (1999-2000 to 2015-16) Quantity in Metric Ton Value in Core Taka 1 US Dollar = 78.40 Taka
Year Frozen Shrimp/
Prawn Live Fish Frozen Fish Chilled Fish Dry fish Salted/
dehydrated fish
Crab Shark fin/ Fish Maws Others Total
% of Total
Export (Value) Qty Value Qty Value Qty Value Qty Value Qty Value Qty Value Qty Value Qty Value Qty Value Qty Value
1999-00 28514 1612.2 - - 9484 137.19 - - 215 3.65 809 25.96 107 1.44 262 31.17 - - 39391 1811.56 6.28
2000-01 29713 1885.2 - - 7965 94.89 - - 137 2.02 838 27.73 154 2.33 181 20.63 - - 38988 2032.75 5.77
2001-02 30209 1447.8 - - 9864 137.39 - - 517 8.32 293 9.53 336 7.07 263 27.07 - - 41482 1637.14 4.76
2002-03 36864 1719.9 - - 8846 158.64 - - 333 7.02 526 19.12 630 14.58 172 22.35 - - 47371 1941.59 5.10
2003-04 42943 2152.8 - - 10229 202.24 - - 472 4.16 377 1.38 116 1.39 4 1.53 - - 54141 2363.47 5.71
2004-05 46533 2281.6 - - 15763 256.2 - - 272 3.71 770 28.97 38 0.86 1 0.39 - - 63377 2571.72 5.90
2005-06 49317 2698.4 57 0.48 17429 294.14 - - 150 2.19 591 19.84 1107 12.95 78 0.80 100 1.09 68829 3029.84 4.56
2006-07 53361 2992.3 4 0.07 18376 325.9 - - 77 1.34 441 12.80 1123 15.48 244 4.11 78 0.86 73704 3352.89 4.90
2007-08 49907 2863.9 10 0.15 23515 495.46 - - 210 2.67 658 26.97 439 4.88 266 1.82 294 0.41 75299 3396.28 4.04
2008-09 50368 2744.1 0.3 0.006 19294 450.89 - - 341 11.99 84 3.92 1217 11.98 276 1.77 1308 18.73 72888 3243.41 3.00
2009-10 51599 2885.2 1783 13.22 21464 458.11 - - 622 25.06 0 0.00 692 10.41 955 12.66 528 3.85 77643 3408.52 2.74
2010-11 54891 3568.2 0.60 0.045 16743 490.00 16369 421.05 623 5.57 577 30.86 4485 54.11 0 0.00 2780 33.97 96469 4603.83 2.73
2011-12 48007 3640.2 0.46 0.04 15513 396.18 19026 520.74 996 9.43 411 27.46 5767 95.77 0 0.00 2758 14.14 92479 4703.94 2.46
2012-13 50333 3376.2 0 0.00 11435 316.36 11831 246.86 1278 36.03 0 0.00 7428 169.49 1 0.09 2599 13.93 84905 4158.97 2.01
2013-14 47635 4118.8 0 0.00 11677 337.11 5021 89.07 2634 29.67 261 21.65 7707 164.75 0 0.00 2393 15.89 77328 4776.92 2.09
2014-15 44278 3937.60 0 0.00 10656 277.63 11629 177.08 2845 36.74 261 25.37 12558 199.38 0 0.00 1297 6.81 83524 4660.60 1.92
2015-16 40726 3598.67 12454 184.28 11133 273.76 7428 163.52 2229 30.12 249 21.03 106 7.09 0 0.00 1013 4.35 75338 4282.82 1.97
Source : EPB (Export Promotion Bureau) and FIQC (Fish Inspection and Quality Control), Department of Fisheries.
Note : 1. Chilled fish was included in the column of frozen fish before the year 2010-11.
2. Live fish (2015-16) is live Kuchia
Exported Frozen Shrimp/ Prawn in 2015-16
(MT) Core Taka Galda 7626.45 1013.23 Bagda 28829.01 2335.53 Others 4270.68 249.91 Total 40726.14 3598.67
54
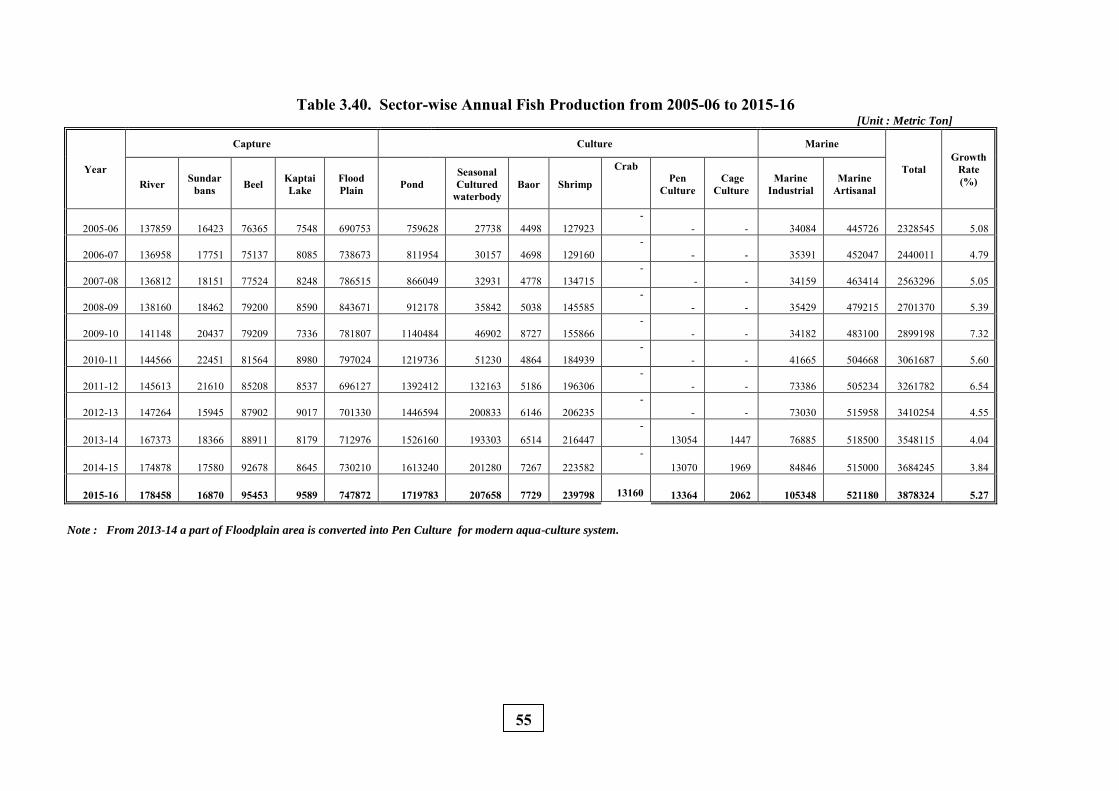
Table 3.40. Sector-wise Annual Fish Production from 2005-06 to 2015-16 [Unit : Metric Ton]
Year
Capture
Culture Marine
Total Growth
Rate (%) River Sundar
bans Beel Kaptai Lake
Flood Plain Pond
Seasonal Cultured
waterbody Baor Shrimp
Crab Pen
Culture Cage
Culture Marine
Industrial Marine
Artisanal
2005-06 137859 16423 76365 7548 690753 759628 27738 4498 127923 -
- - 34084 445726 2328545 5.08
2006-07 136958 17751 75137 8085 738673 811954 30157 4698 129160 -
- - 35391 452047 2440011 4.79
2007-08 136812 18151 77524 8248 786515 866049 32931 4778 134715 -
- - 34159 463414 2563296 5.05
2008-09 138160 18462 79200 8590 843671 912178 35842 5038 145585 -
- - 35429 479215 2701370 5.39
2009-10 141148 20437 79209 7336 781807 1140484 46902 8727 155866 -
- - 34182 483100 2899198 7.32
2010-11 144566 22451 81564 8980 797024 1219736 51230 4864 184939 -
- - 41665 504668 3061687 5.60
2011-12 145613 21610 85208 8537 696127 1392412 132163 5186 196306 -
- - 73386 505234 3261782 6.54
2012-13 147264 15945 87902 9017 701330 1446594 200833 6146 206235 -
- - 73030 515958 3410254 4.55
2013-14 167373 18366 88911 8179 712976 1526160 193303 6514 216447 -
13054 1447 76885 518500 3548115 4.04
2014-15 174878 17580 92678 8645 730210 1613240 201280 7267 223582 -
13070 1969 84846 515000 3684245 3.84
2015-16 178458 16870 95453 9589 747872 1719783 207658 7729 239798
13160 13364 2062 105348 521180 3878324 5.27
Note : From 2013-14 a part of Floodplain area is converted into Pen Culture for modern aqua-culture system.
55
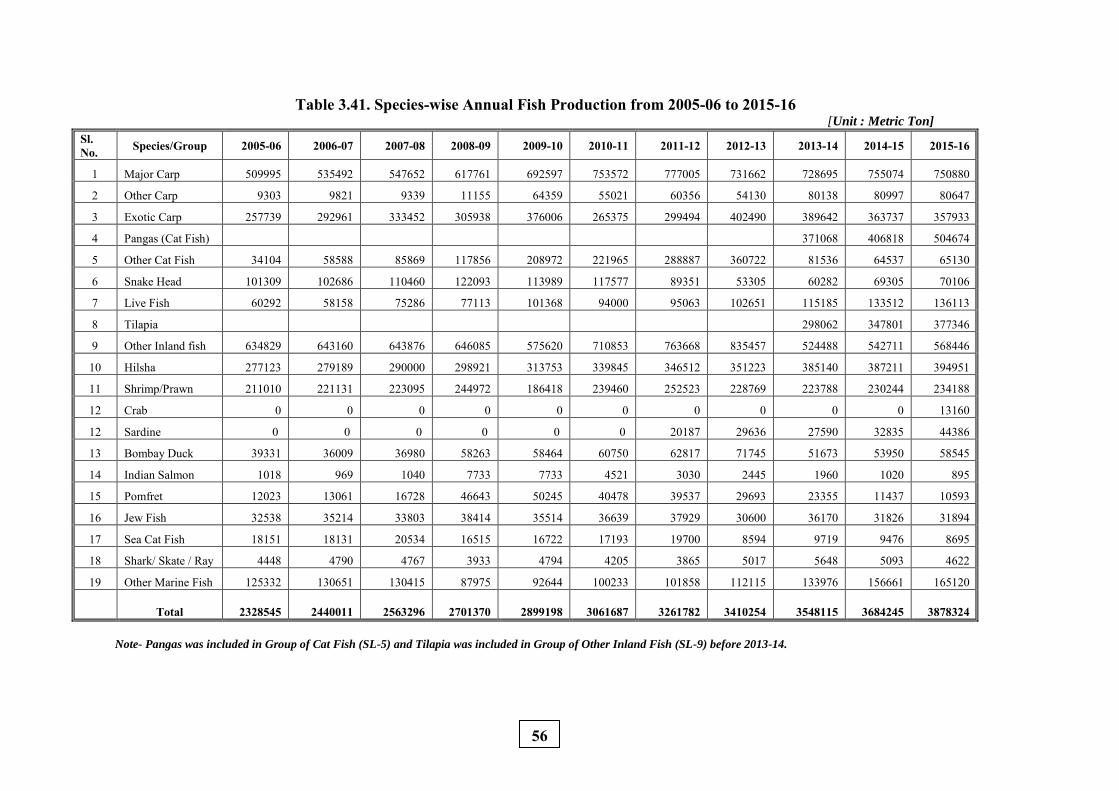
Table 3.41. Species-wise Annual Fish Production from 2005-06 to 2015-16 [Unit : Metric Ton]
Sl. No. Species/Group 2005-06 2006-07 2007-08 2008-09 2009-10 2010-11 2011-12 2012-13 2013-14 2014-15 2015-16
1 Major Carp 509995 535492 547652 617761 692597 753572 777005 731662 728695 755074 750880
2 Other Carp 9303 9821 9339 11155 64359 55021 60356 54130 80138 80997 80647
3 Exotic Carp 257739 292961 333452 305938 376006 265375 299494 402490 389642 363737 357933
4 Pangas (Cat Fish) 371068 406818 504674
5 Other Cat Fish 34104 58588 85869 117856 208972 221965 288887 360722 81536 64537 65130
6 Snake Head 101309 102686 110460 122093 113989 117577 89351 53305 60282 69305 70106
7 Live Fish 60292 58158 75286 77113 101368 94000 95063 102651 115185 133512 136113
8 Tilapia 298062 347801 377346
9 Other Inland fish 634829 643160 643876 646085 575620 710853 763668 835457 524488 542711 568446
10 Hilsha 277123 279189 290000 298921 313753 339845 346512 351223 385140 387211 394951
11 Shrimp/Prawn 211010 221131 223095 244972 186418 239460 252523 228769 223788 230244 234188
12 Crab 0 0 0 0 0 0 0 0 0 0 13160
12 Sardine 0 0 0 0 0 0 20187 29636 27590 32835 44386
13 Bombay Duck 39331 36009 36980 58263 58464 60750 62817 71745 51673 53950 58545
14 Indian Salmon 1018 969 1040 7733 7733 4521 3030 2445 1960 1020 895
15 Pomfret 12023 13061 16728 46643 50245 40478 39537 29693 23355 11437 10593
16 Jew Fish 32538 35214 33803 38414 35514 36639 37929 30600 36170 31826 31894
17 Sea Cat Fish 18151 18131 20534 16515 16722 17193 19700 8594 9719 9476 8695
18 Shark/ Skate / Ray 4448 4790 4767 3933 4794 4205 3865 5017 5648 5093 4622
19 Other Marine Fish 125332 130651 130415 87975 92644 100233 101858 112115 133976 156661 165120
Total 2328545 2440011 2563296 2701370 2899198 3061687 3261782 3410254 3548115 3684245 3878324
Note- Pangas was included in Group of Cat Fish (SL-5) and Tilapia was included in Group of Other Inland Fish (SL-9) before 2013-14.
56
Annexure - 1
Schedules of Fish Catch Assesment Survey Fisheries Resources Survey System
Department of Fisheries Bangladesh
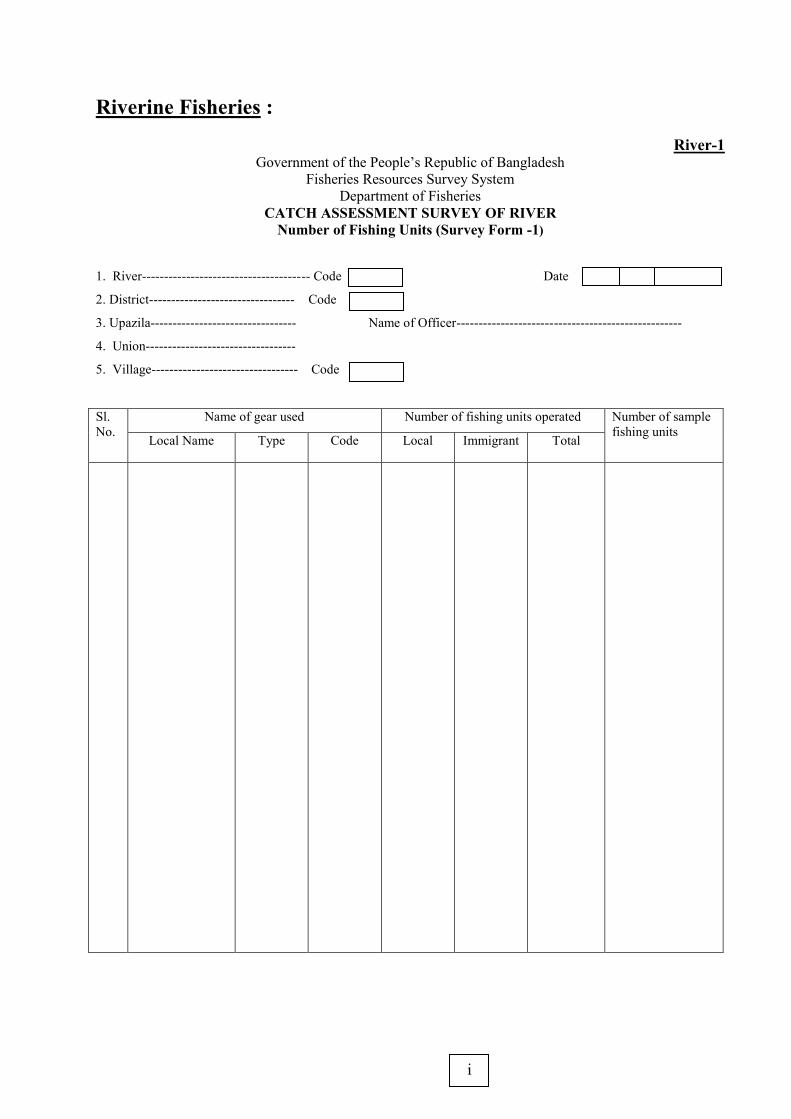
Riverine Fisheries :
River-1 Government of the People’s Republic of Bangladesh
Fisheries Resources Survey System Department of Fisheries
CATCH ASSESSMENT SURVEY OF RIVER Number of Fishing Units (Survey Form -1)
1. River-------------------------------------- Code Date Date
2. District--------------------------------- Code
3. Upazila--------------------------------- Name of Officer---------------------------------------------------
4. Union----------------------------------
5. Village--------------------------------- Code
Sl. No.
Name of gear used Number of fishing units operated Number of sample fishing units
Local Name Type Code Local Immigrant Total
i
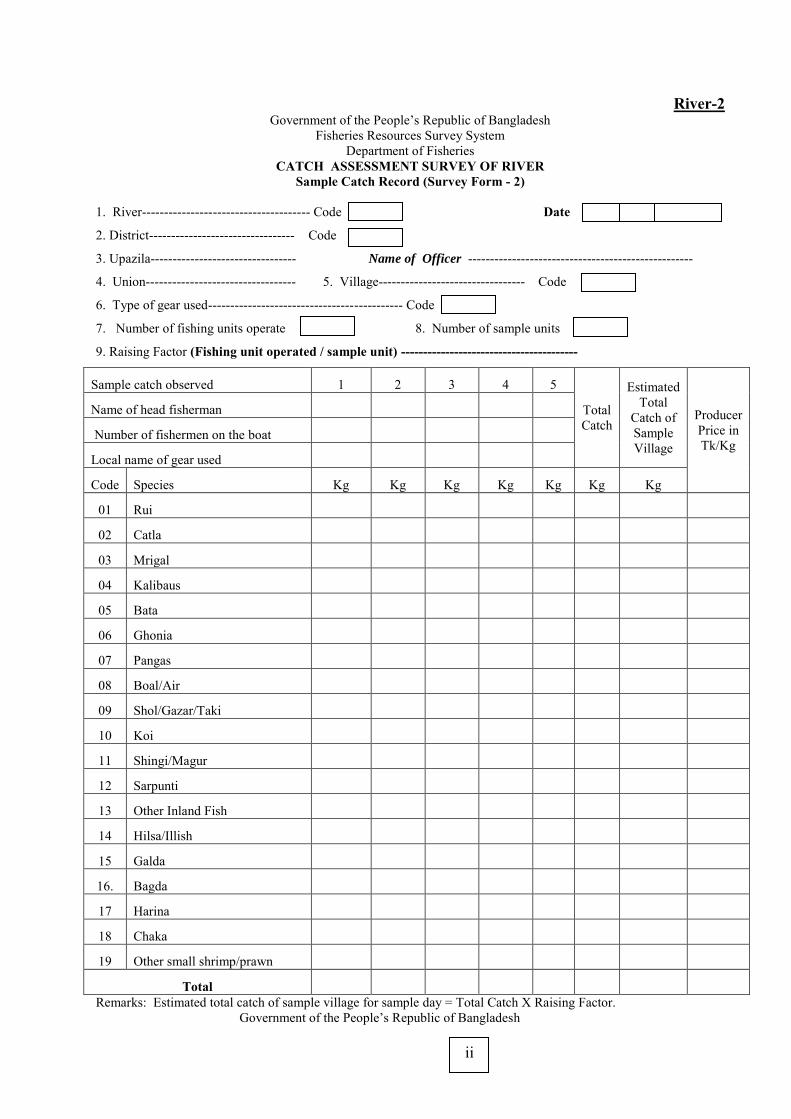
River-2 Government of the People’s Republic of Bangladesh
Fisheries Resources Survey System Department of Fisheries
CATCH ASSESSMENT SURVEY OF RIVER Sample Catch Record (Survey Form - 2)
1. River-------------------------------------- Code Date Date
2. District--------------------------------- Code
3. Upazila--------------------------------- Name of Officer ---------------------------------------------------
4. Union---------------------------------- 5. Village--------------------------------- Code
6. Type of gear used-------------------------------------------- Code
7. Number of fishing units operate 8. Number of sample units
9. Raising Factor (Fishing unit operated / sample unit) ----------------------------------------
Sample catch observed 1 2 3 4 5
Total Catch
Estimated Total
Catch of Sample Village
Producer Price in Tk/Kg
Name of head fisherman
Number of fishermen on the boat
Local name of gear used
Code Species Kg Kg Kg Kg Kg Kg Kg
01 Rui
02 Catla
03 Mrigal
04 Kalibaus
05 Bata
06 Ghonia
07 Pangas
08 Boal/Air
09 Shol/Gazar/Taki
10 Koi
11 Shingi/Magur
12 Sarpunti
13 Other Inland Fish
14 Hilsa/Illish
15 Galda
16. Bagda
17 Harina
18 Chaka
19 Other small shrimp/prawn
Total Remarks: Estimated total catch of sample village for sample day = Total Catch X Raising Factor.
Government of the People’s Republic of Bangladesh
ii
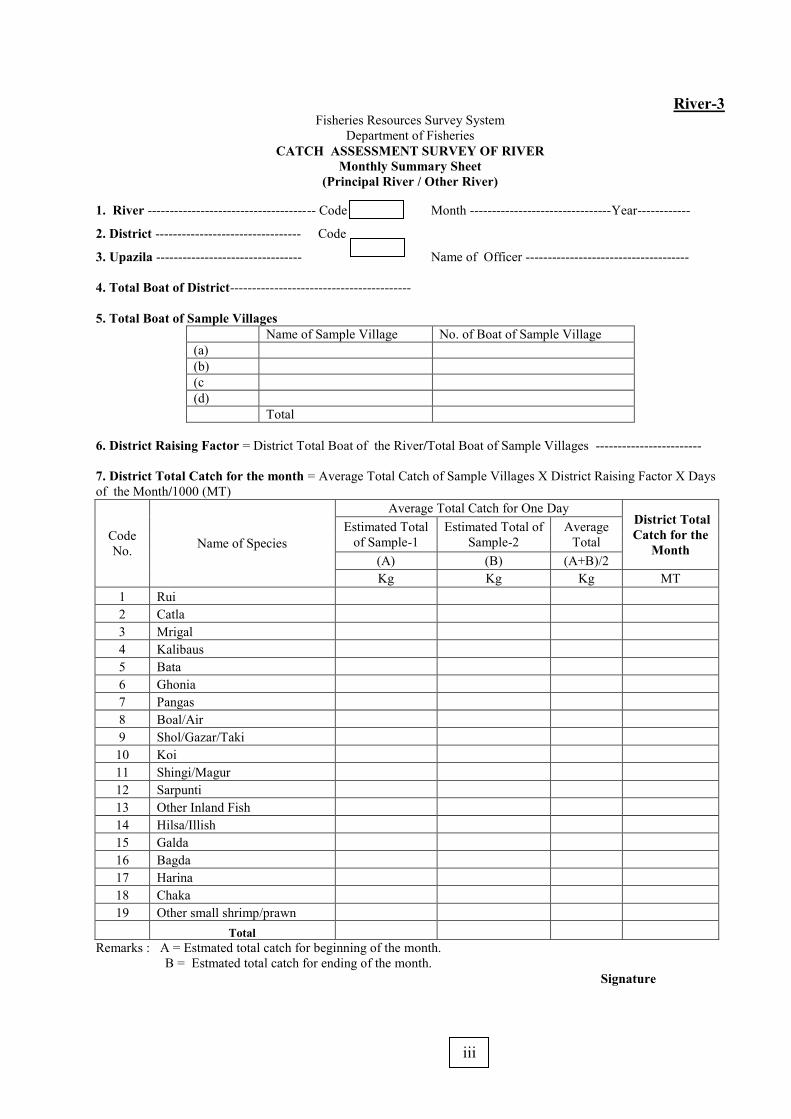
River-3 Fisheries Resources Survey System
Department of Fisheries CATCH ASSESSMENT SURVEY OF RIVER
Monthly Summary Sheet (Principal River / Other River)
1. River -------------------------------------- Code Month --------------------------------Year------------
2. District --------------------------------- Code
3. Upazila --------------------------------- Name of Officer ------------------------------------- 4. Total Boat of District----------------------------------------- 5. Total Boat of Sample Villages
Name of Sample Village No. of Boat of Sample Village (a) (b) (c (d) Total
6. District Raising Factor = District Total Boat of the River/Total Boat of Sample Villages ------------------------ 7. District Total Catch for the month = Average Total Catch of Sample Villages X District Raising Factor X Days of the Month/1000 (MT)
Code No. Name of Species
Average Total Catch for One Day District Total Catch for the
Month
Estimated Total of Sample-1
Estimated Total of Sample-2
Average Total
(A) (B) (A+B)/2 Kg Kg Kg MT
1 Rui 2 Catla 3 Mrigal 4 Kalibaus 5 Bata 6 Ghonia 7 Pangas 8 Boal/Air 9 Shol/Gazar/Taki 10 Koi 11 Shingi/Magur 12 Sarpunti 13 Other Inland Fish 14 Hilsa/Illish 15 Galda 16 Bagda 17 Harina 18 Chaka
19 Other small shrimp/prawn Total
Remarks : A = Estmated total catch for beginning of the month. B = Estmated total catch for ending of the month.
Signature
iii
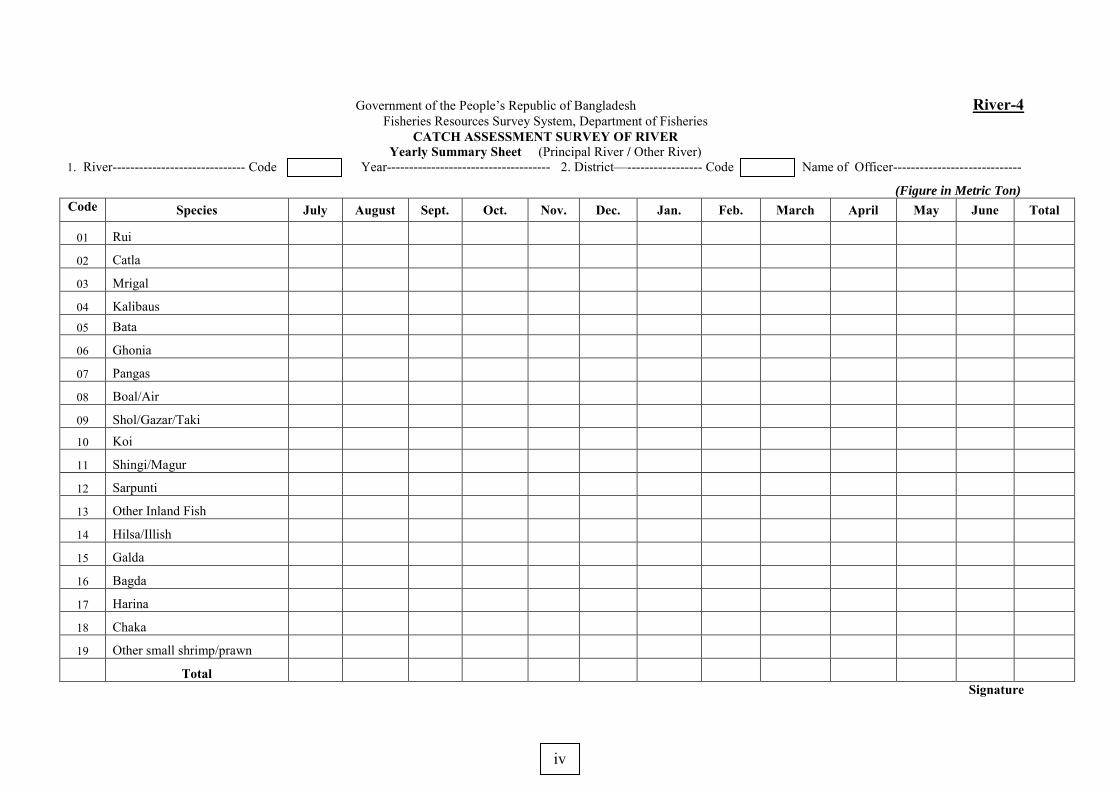
Government of the People’s Republic of Bangladesh River-4 Fisheries Resources Survey System, Department of Fisheries
CATCH ASSESSMENT SURVEY OF RIVER Yearly Summary Sheet (Principal River / Other River)
1. River------------------------------ Code Year------------------------------------- 2. District—----------------- Code Name of Officer-----------------------------
(Figure in Metric Ton)
Code Species July August Sept. Oct. Nov. Dec. Jan. Feb. March April May June Total
01 Rui
02 Catla
03 Mrigal
04 Kalibaus
05 Bata
06 Ghonia
07 Pangas
08 Boal/Air
09 Shol/Gazar/Taki
10 Koi
11 Shingi/Magur
12 Sarpunti
13 Other Inland Fish
14 Hilsa/Illish
15 Galda
16 Bagda
17 Harina
18 Chaka
19 Other small shrimp/prawn
Total
Signature
iv
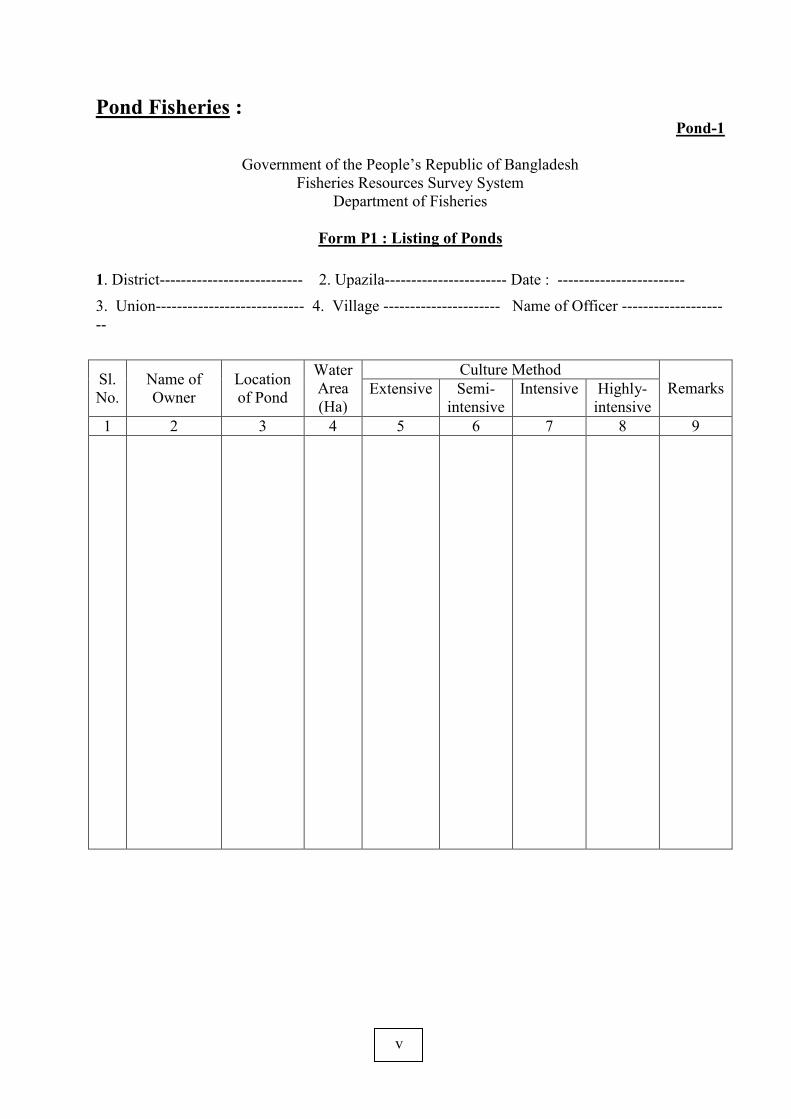
Pond Fisheries : Pond-1
Government of the People’s Republic of Bangladesh
Fisheries Resources Survey System Department of Fisheries
Form P1 : Listing of Ponds
1. District--------------------------- 2. Upazila----------------------- Date : ------------------------
3. Union---------------------------- 4. Village ---------------------- Name of Officer ---------------------
Sl. No.
Name of Owner
Location of Pond
Water Area (Ha)
Culture Method Remarks Extensive Semi-
intensive Intensive Highly-
intensive 1 2 3 4 5 6 7 8 9
v
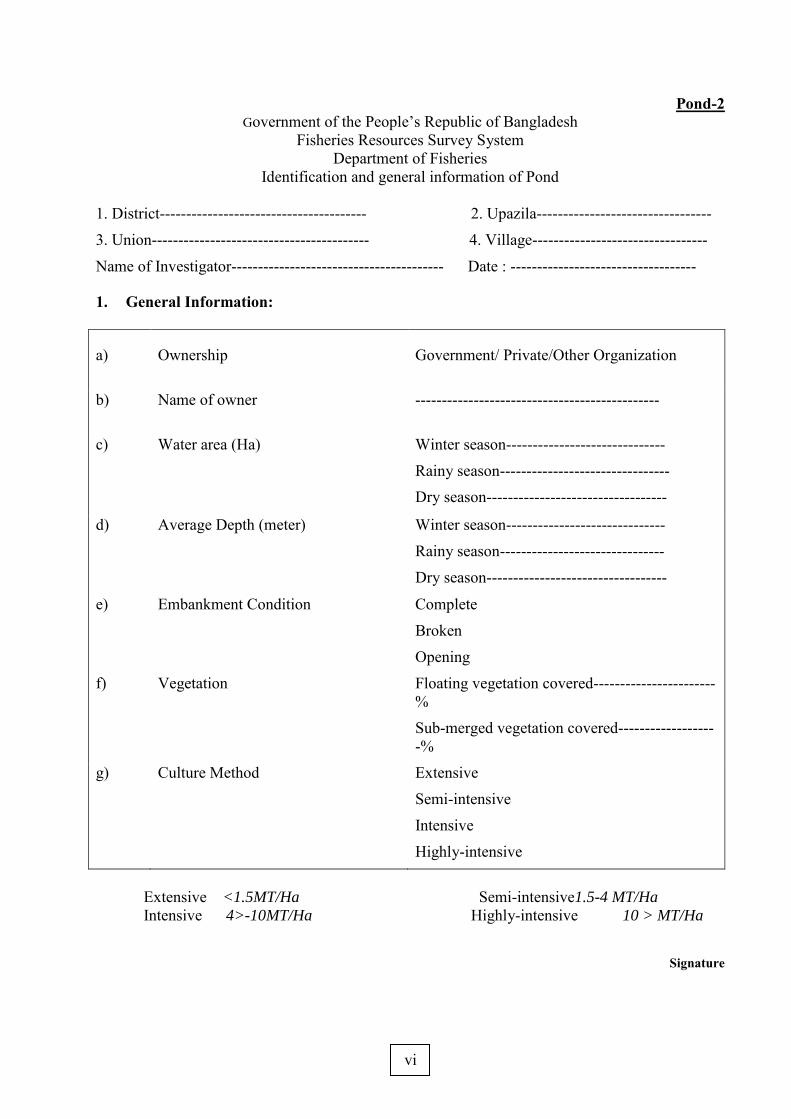
Pond-2 Government of the People’s Republic of Bangladesh
Fisheries Resources Survey System Department of Fisheries
Identification and general information of Pond
1. District--------------------------------------- 2. Upazila---------------------------------
3. Union----------------------------------------- 4. Village---------------------------------
Name of Investigator---------------------------------------- Date : -----------------------------------
1. General Information:
a) Ownership Government/ Private/Other Organization
b) Name of owner ----------------------------------------------
c) Water area (Ha) Winter season------------------------------
Rainy season-------------------------------- Dry season----------------------------------
d) Average Depth (meter) Winter season------------------------------
Rainy season-------------------------------
Dry season----------------------------------
e) Embankment Condition Complete
Broken
Opening
f) Vegetation Floating vegetation covered-----------------------%
Sub-merged vegetation covered-------------------%
g) Culture Method Extensive
Semi-intensive
Intensive
Highly-intensive
Extensive <1.5MT/Ha Semi-intensive1.5-4 MT/Ha Intensive 4>-10MT/Ha Highly-intensive 10 > MT/Ha
Signature
vi
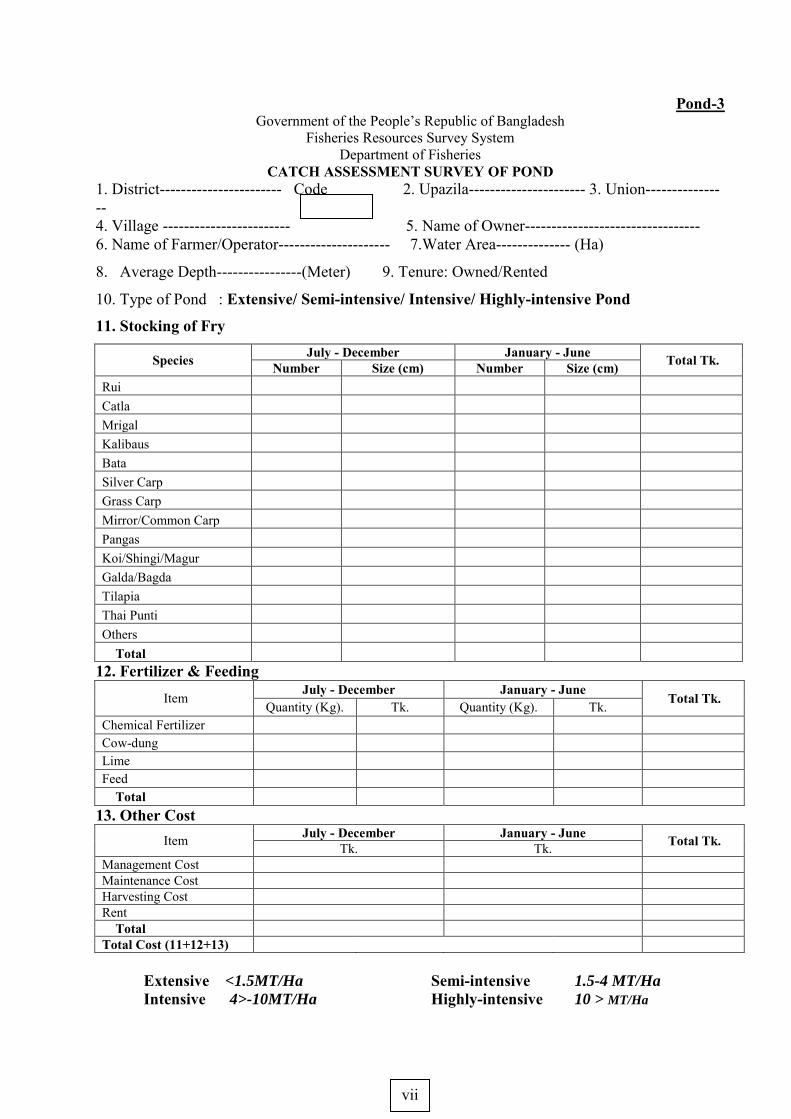
Pond-3 Government of the People’s Republic of Bangladesh
Fisheries Resources Survey System Department of Fisheries
CATCH ASSESSMENT SURVEY OF POND 1. District----------------------- Code 2. Upazila---------------------- 3. Union---------------- 4. Village ------------------------ 5. Name of Owner--------------------------------- 6. Name of Farmer/Operator--------------------- 7.Water Area-------------- (Ha)
8. Average Depth----------------(Meter) 9. Tenure: Owned/Rented
10. Type of Pond : Extensive/ Semi-intensive/ Intensive/ Highly-intensive Pond
11. Stocking of Fry
Species July - December January - June Total Tk. Number Size (cm) Number Size (cm) Rui
Catla
Mrigal
Kalibaus
Bata
Silver Carp
Grass Carp
Mirror/Common Carp
Pangas
Koi/Shingi/Magur
Galda/Bagda
Tilapia
Thai Punti
Others
Total 12. Fertilizer & Feeding
Item July - December January - June Total Tk. Quantity (Kg). Tk. Quantity (Kg). Tk.
Chemical Fertilizer Cow-dung Lime Feed Total
13. Other Cost Item July - December January - June Total Tk. Tk. Tk.
Management Cost Maintenance Cost Harvesting Cost Rent Total Total Cost (11+12+13)
Extensive <1.5MT/Ha Semi-intensive 1.5-4 MT/Ha Intensive 4>-10MT/Ha Highly-intensive 10 > MT/Ha
vii
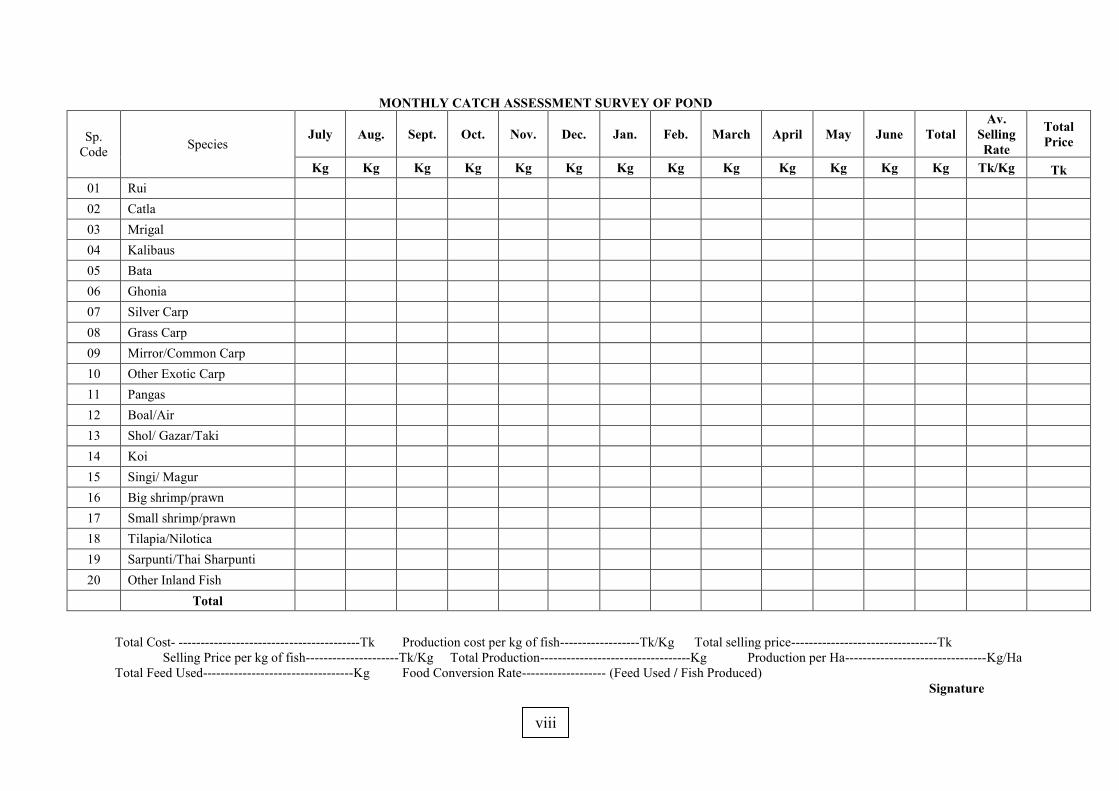
MONTHLY CATCH ASSESSMENT SURVEY OF POND
Sp. Code Species
July Aug. Sept. Oct. Nov. Dec. Jan. Feb. March April May June Total Av.
Selling Rate
Total Price
Kg Kg Kg Kg Kg Kg Kg Kg Kg Kg Kg Kg Kg Tk/Kg Tk 01 Rui 02 Catla 03 Mrigal 04 Kalibaus 05 Bata 06 Ghonia 07 Silver Carp 08 Grass Carp 09 Mirror/Common Carp 10 Other Exotic Carp 11 Pangas 12 Boal/Air 13 Shol/ Gazar/Taki 14 Koi 15 Singi/ Magur 16 Big shrimp/prawn 17 Small shrimp/prawn 18 Tilapia/Nilotica 19 Sarpunti/Thai Sharpunti 20 Other Inland Fish Total
Total Cost- -----------------------------------------Tk Production cost per kg of fish------------------Tk/Kg Total selling price---------------------------------Tk Selling Price per kg of fish---------------------Tk/Kg Total Production----------------------------------Kg Production per Ha--------------------------------Kg/Ha
Total Feed Used----------------------------------Kg Food Conversion Rate------------------- (Feed Used / Fish Produced) Signature
viii
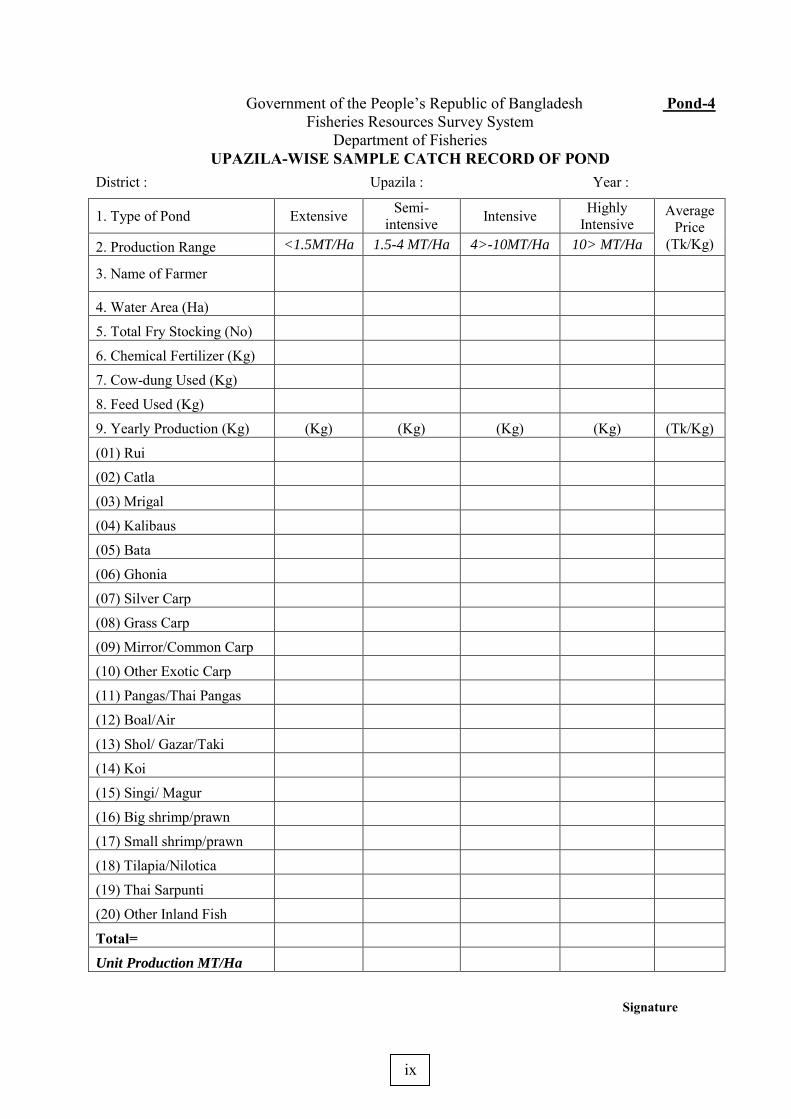
Government of the People’s Republic of Bangladesh Pond-4 Fisheries Resources Survey System
Department of Fisheries UPAZILA-WISE SAMPLE CATCH RECORD OF POND
District : Upazila : Year :
1. Type of Pond Extensive Semi-intensive Intensive Highly
Intensive Average
Price (Tk/Kg) 2. Production Range <1.5MT/Ha 1.5-4 MT/Ha 4>-10MT/Ha 10> MT/Ha
3. Name of Farmer
4. Water Area (Ha)
5. Total Fry Stocking (No)
6. Chemical Fertilizer (Kg)
7. Cow-dung Used (Kg)
8. Feed Used (Kg)
9. Yearly Production (Kg) (Kg) (Kg) (Kg) (Kg) (Tk/Kg)
(01) Rui
(02) Catla
(03) Mrigal
(04) Kalibaus
(05) Bata
(06) Ghonia
(07) Silver Carp
(08) Grass Carp
(09) Mirror/Common Carp
(10) Other Exotic Carp
(11) Pangas/Thai Pangas
(12) Boal/Air
(13) Shol/ Gazar/Taki
(14) Koi
(15) Singi/ Magur
(16) Big shrimp/prawn
(17) Small shrimp/prawn
(18) Tilapia/Nilotica
(19) Thai Sarpunti
(20) Other Inland Fish
Total=
Unit Production MT/Ha
Signature
ix
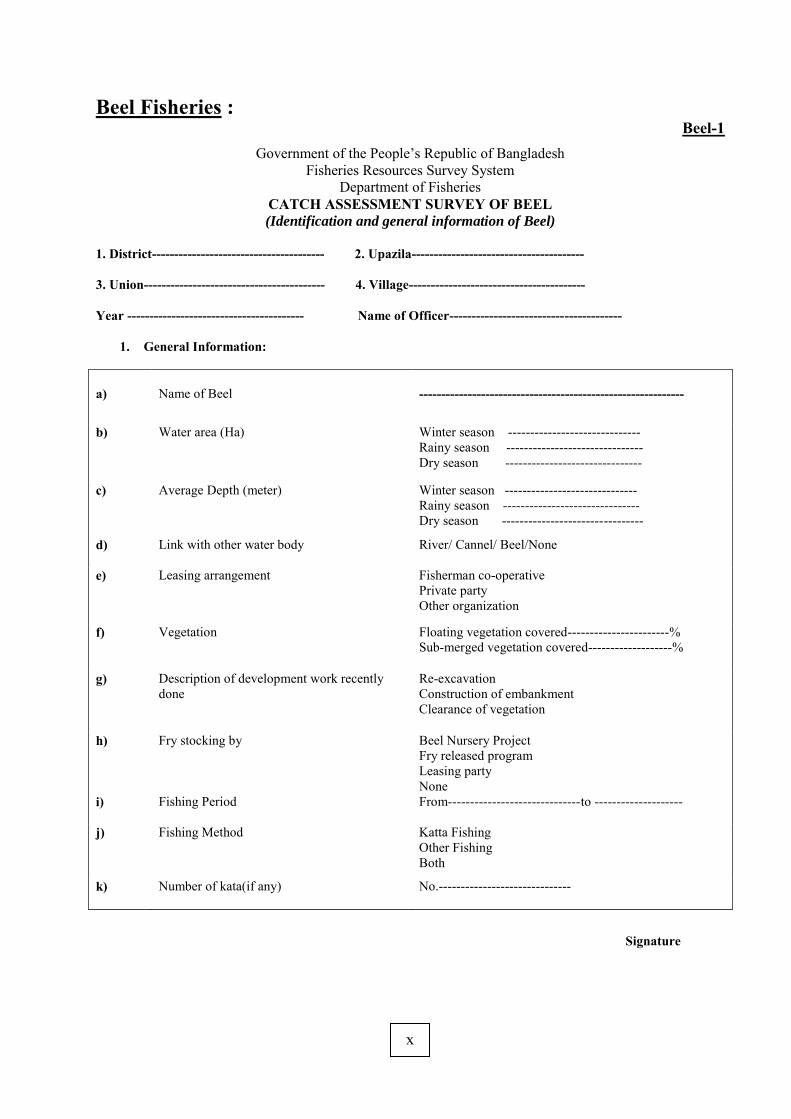
Beel Fisheries : Beel-1
Government of the People’s Republic of Bangladesh Fisheries Resources Survey System
Department of Fisheries CATCH ASSESSMENT SURVEY OF BEEL (Identification and general information of Beel)
1. District--------------------------------------- 2. Upazila---------------------------------------
3. Union----------------------------------------- 4. Village----------------------------------------
Year ---------------------------------------- Name of Officer---------------------------------------
1. General Information:
a) Name of Beel ------------------------------------------------------------
b) Water area (Ha) Winter season ------------------------------ Rainy season ------------------------------- Dry season -------------------------------
c) Average Depth (meter) Winter season ------------------------------ Rainy season ------------------------------- Dry season --------------------------------
d) Link with other water body River/ Cannel/ Beel/None
e) Leasing arrangement Fisherman co-operative Private party Other organization
f) Vegetation Floating vegetation covered-----------------------% Sub-merged vegetation covered-------------------%
g) Description of development work recently done
Re-excavation Construction of embankment Clearance of vegetation
h) Fry stocking by Beel Nursery Project Fry released program Leasing party None
i) Fishing Period From------------------------------to --------------------
j) Fishing Method Katta Fishing Other Fishing Both
k) Number of kata(if any) No.------------------------------
Signature
x
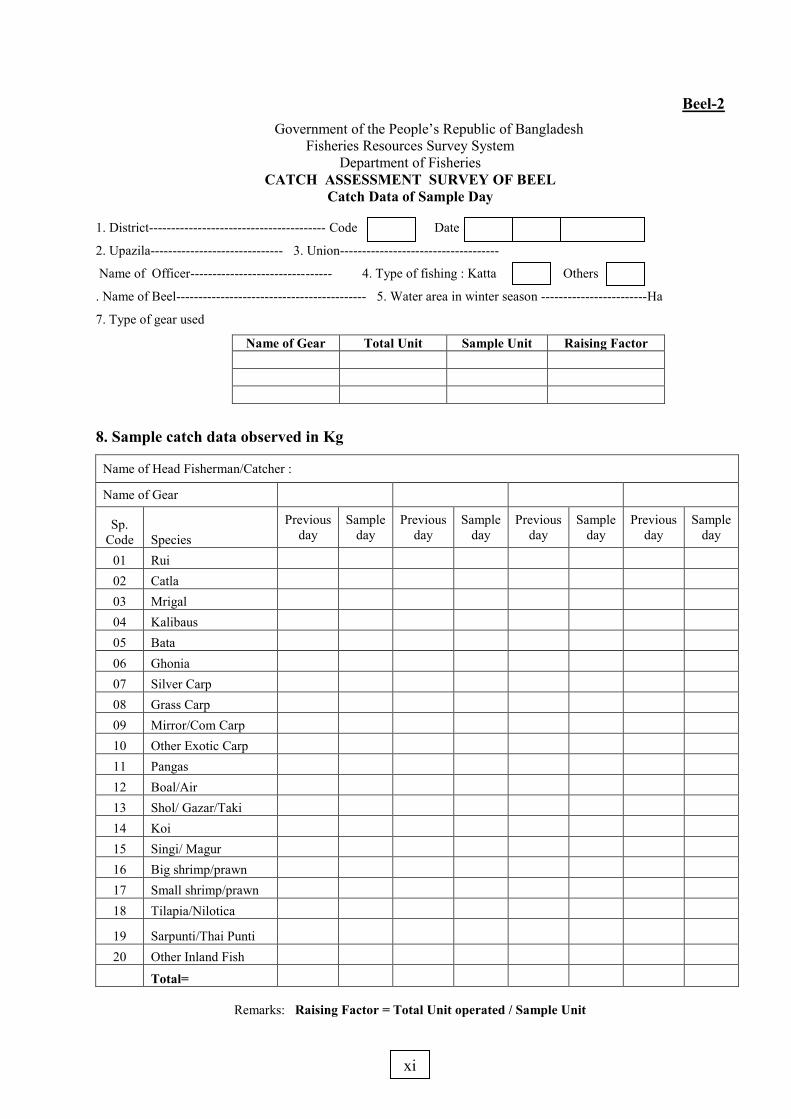
Beel-2 Government of the People’s Republic of Bangladesh
Fisheries Resources Survey System Department of Fisheries
CATCH ASSESSMENT SURVEY OF BEEL Catch Data of Sample Day
1. District---------------------------------------- Code Date
2. Upazila------------------------------ 3. Union------------------------------------
Name of Officer-------------------------------- 4. Type of fishing : Katta Others
. Name of Beel------------------------------------------- 5. Water area in winter season ------------------------Ha
7. Type of gear used
Name of Gear Total Unit Sample Unit Raising Factor
8. Sample catch data observed in Kg
Name of Head Fisherman/Catcher :
Name of Gear
Sp. Code Species
Previous day
Sample day
Previous day
Sample day
Previous day
Sample day
Previous day
Sample day
01 Rui 02 Catla 03 Mrigal 04 Kalibaus 05 Bata 06 Ghonia 07 Silver Carp 08 Grass Carp 09 Mirror/Com Carp 10 Other Exotic Carp 11 Pangas 12 Boal/Air 13 Shol/ Gazar/Taki 14 Koi 15 Singi/ Magur 16 Big shrimp/prawn 17 Small shrimp/prawn 18 Tilapia/Nilotica
19 Sarpunti/Thai Punti 20 Other Inland Fish Total=
Remarks: Raising Factor = Total Unit operated / Sample Unit
xi
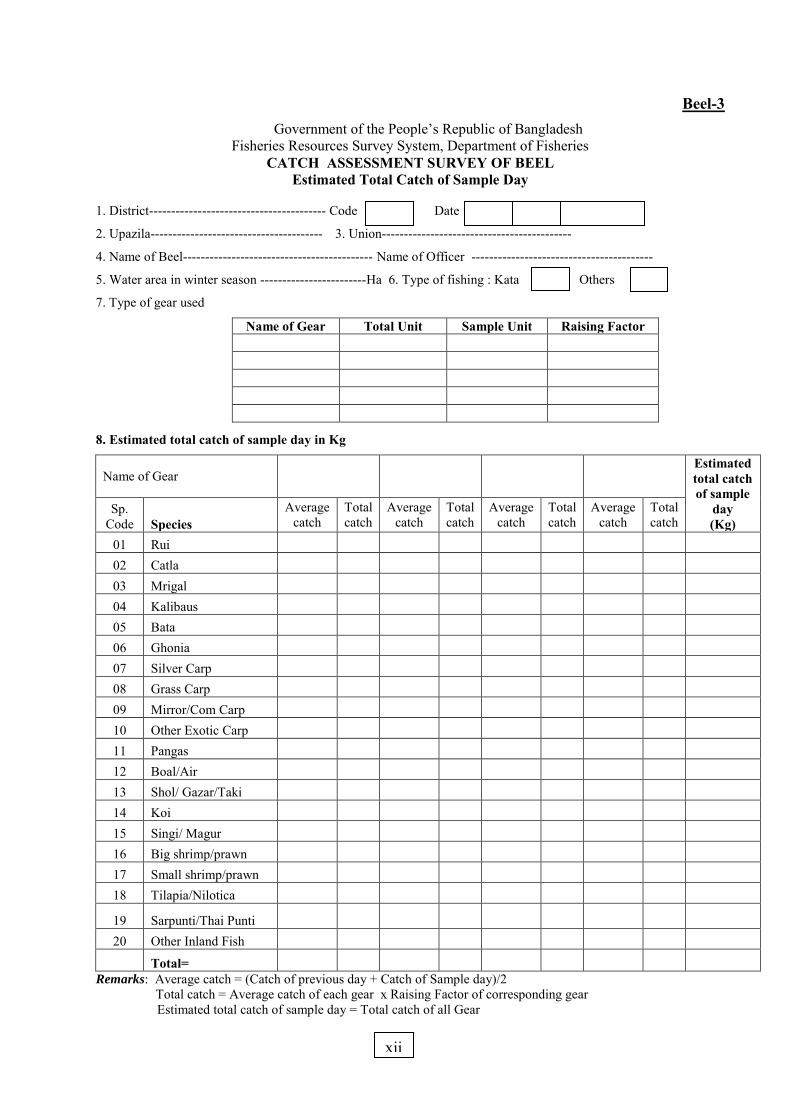
Beel-3 Government of the People’s Republic of Bangladesh
Fisheries Resources Survey System, Department of Fisheries CATCH ASSESSMENT SURVEY OF BEEL
Estimated Total Catch of Sample Day
1. District---------------------------------------- Code Date
2. Upazila--------------------------------------- 3. Union-------------------------------------------
4. Name of Beel------------------------------------------- Name of Officer -----------------------------------------
5. Water area in winter season ------------------------Ha 6. Type of fishing : Kata Others
7. Type of gear used
Name of Gear Total Unit Sample Unit Raising Factor
8. Estimated total catch of sample day in Kg
Name of Gear Estimated total catch of sample
day (Kg)
Sp. Code Species
Average catch
Total catch
Average catch
Total catch
Average catch
Total catch
Average catch
Total catch
01 Rui
02 Catla
03 Mrigal
04 Kalibaus
05 Bata
06 Ghonia
07 Silver Carp
08 Grass Carp
09 Mirror/Com Carp
10 Other Exotic Carp
11 Pangas
12 Boal/Air
13 Shol/ Gazar/Taki
14 Koi
15 Singi/ Magur
16 Big shrimp/prawn
17 Small shrimp/prawn
18 Tilapia/Nilotica
19 Sarpunti/Thai Punti
20 Other Inland Fish
Total=
Remarks: Average catch = (Catch of previous day + Catch of Sample day)/2 Total catch = Average catch of each gear x Raising Factor of corresponding gear
Estimated total catch of sample day = Total catch of all Gear
xii
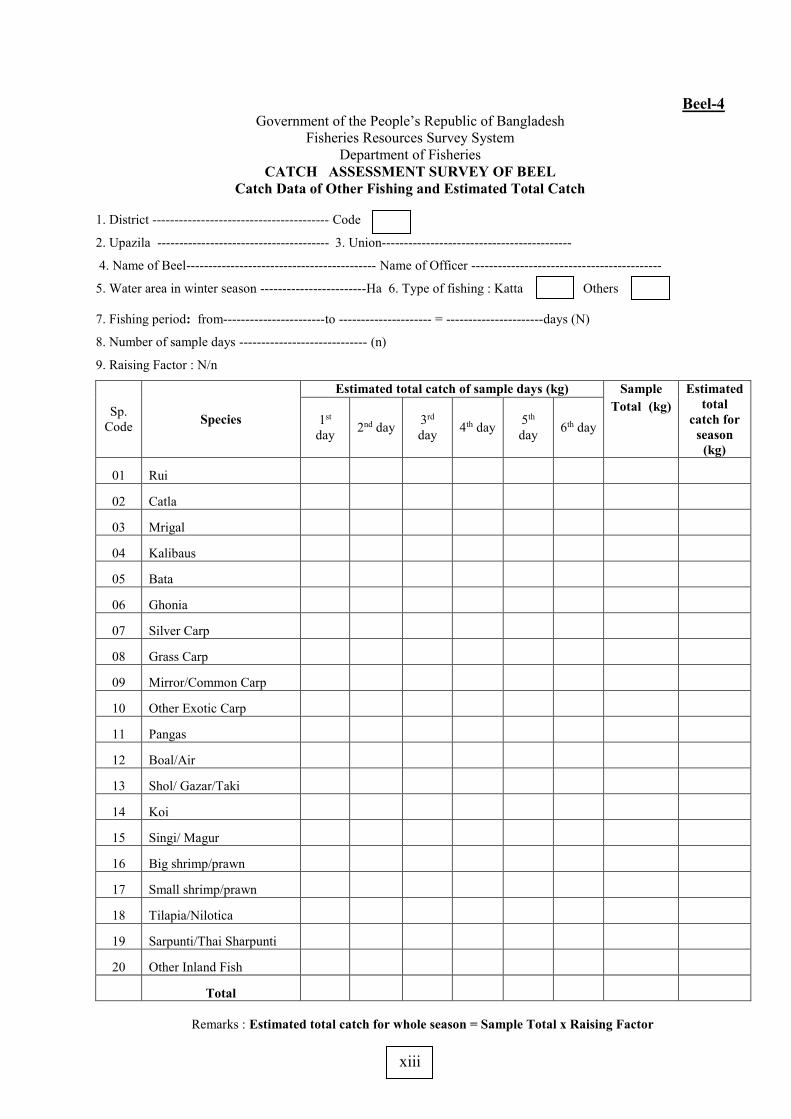
Beel-4 Government of the People’s Republic of Bangladesh
Fisheries Resources Survey System Department of Fisheries
CATCH ASSESSMENT SURVEY OF BEEL Catch Data of Other Fishing and Estimated Total Catch
1. District ---------------------------------------- Code
2. Upazila --------------------------------------- 3. Union-------------------------------------------
4. Name of Beel------------------------------------------- Name of Officer -------------------------------------------
5. Water area in winter season ------------------------Ha 6. Type of fishing : Katta Others
7. Fishing period: from-----------------------to --------------------- = ----------------------days (N)
8. Number of sample days ----------------------------- (n)
9. Raising Factor : N/n
Sp. Code
Species
Estimated total catch of sample days (kg) Sample Total (kg)
Estimated total
catch for season
(kg)
1st day 2nd day 3rd
day 4th day 5th day 6th day
01 Rui
02 Catla
03 Mrigal
04 Kalibaus
05 Bata
06 Ghonia
07 Silver Carp
08 Grass Carp
09 Mirror/Common Carp
10 Other Exotic Carp
11 Pangas
12 Boal/Air
13 Shol/ Gazar/Taki
14 Koi
15 Singi/ Magur
16 Big shrimp/prawn
17 Small shrimp/prawn
18 Tilapia/Nilotica
19 Sarpunti/Thai Sharpunti
20 Other Inland Fish
Total
Remarks : Estimated total catch for whole season = Sample Total x Raising Factor
xiii
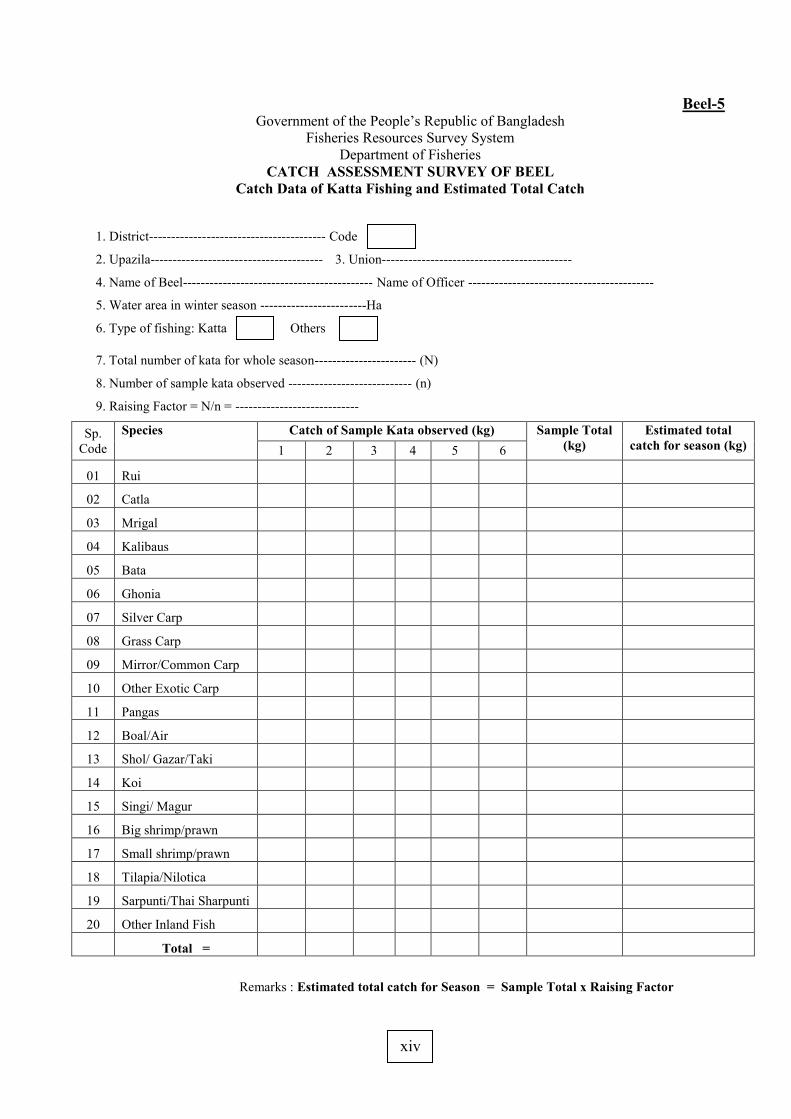
Beel-5 Government of the People’s Republic of Bangladesh
Fisheries Resources Survey System Department of Fisheries
CATCH ASSESSMENT SURVEY OF BEEL Catch Data of Katta Fishing and Estimated Total Catch
1. District---------------------------------------- Code
2. Upazila--------------------------------------- 3. Union-------------------------------------------
4. Name of Beel------------------------------------------- Name of Officer ------------------------------------------
5. Water area in winter season ------------------------Ha
6. Type of fishing: Katta Others
7. Total number of kata for whole season----------------------- (N)
8. Number of sample kata observed ---------------------------- (n)
9. Raising Factor = N/n = ----------------------------
Sp. Code
Species Catch of Sample Kata observed (kg) Sample Total (kg)
Estimated total catch for season (kg) 1 2 3 4 5 6
01 Rui
02 Catla
03 Mrigal
04 Kalibaus
05 Bata
06 Ghonia
07 Silver Carp
08 Grass Carp
09 Mirror/Common Carp
10 Other Exotic Carp
11 Pangas
12 Boal/Air
13 Shol/ Gazar/Taki
14 Koi
15 Singi/ Magur
16 Big shrimp/prawn
17 Small shrimp/prawn
18 Tilapia/Nilotica
19 Sarpunti/Thai Sharpunti
20 Other Inland Fish
Total =
Remarks : Estimated total catch for Season = Sample Total x Raising Factor
xiv
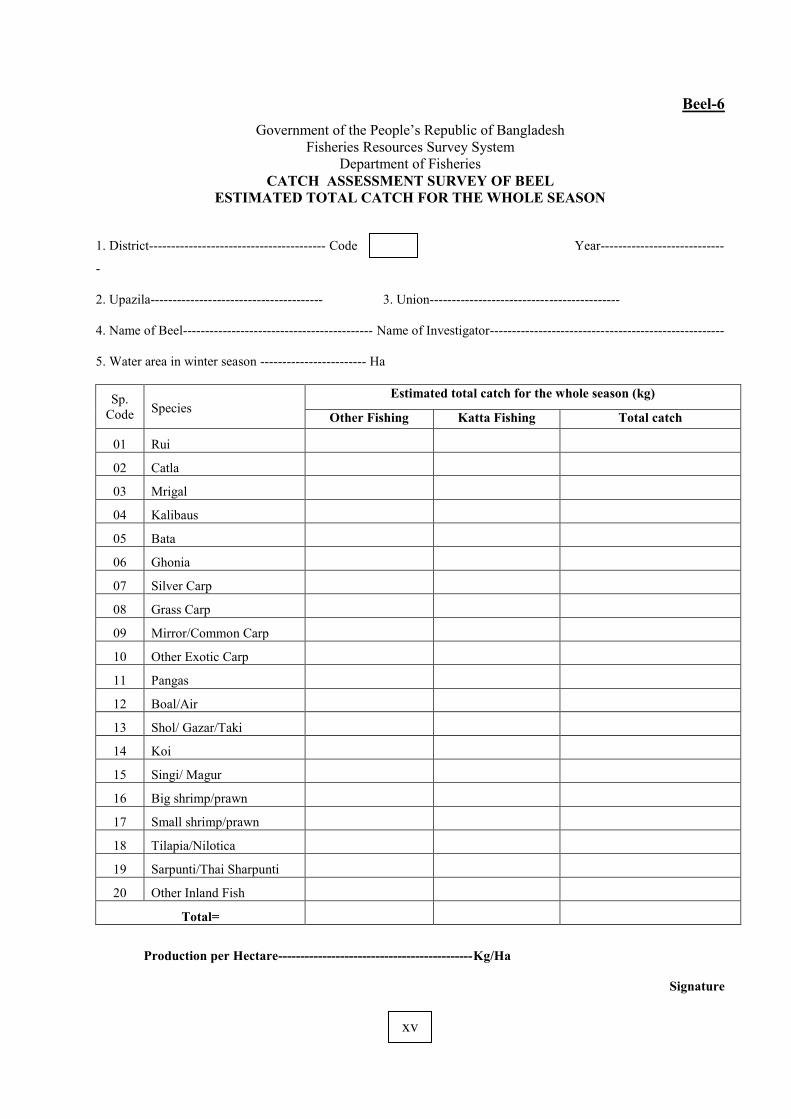
Beel-6 Government of the People’s Republic of Bangladesh
Fisheries Resources Survey System Department of Fisheries
CATCH ASSESSMENT SURVEY OF BEEL ESTIMATED TOTAL CATCH FOR THE WHOLE SEASON
1. District---------------------------------------- Code Year----------------------------
-
2. Upazila--------------------------------------- 3. Union-------------------------------------------
4. Name of Beel------------------------------------------- Name of Investigator-----------------------------------------------------
5. Water area in winter season ------------------------ Ha
Sp. Code
Species
Estimated total catch for the whole season (kg)
Other Fishing Katta Fishing Total catch
01 Rui
02 Catla
03 Mrigal
04 Kalibaus
05 Bata
06 Ghonia
07 Silver Carp
08 Grass Carp
09 Mirror/Common Carp
10 Other Exotic Carp
11 Pangas
12 Boal/Air
13 Shol/ Gazar/Taki
14 Koi
15 Singi/ Magur
16 Big shrimp/prawn
17 Small shrimp/prawn
18 Tilapia/Nilotica
19 Sarpunti/Thai Sharpunti
20 Other Inland Fish
Total=
Production per Hectare--------------------------------------------Kg/Ha
Signature
xv
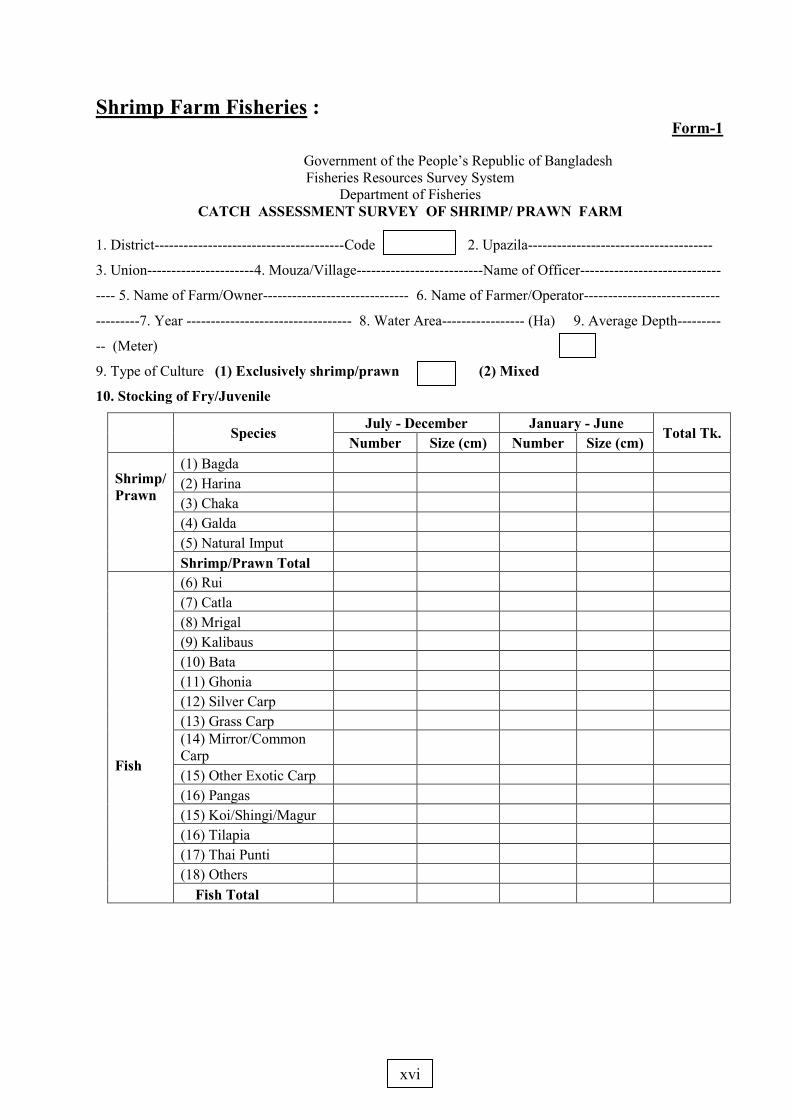
Shrimp Farm Fisheries : Form-1
Government of the People’s Republic of Bangladesh Fisheries Resources Survey System
Department of Fisheries CATCH ASSESSMENT SURVEY OF SHRIMP/ PRAWN FARM
1. District---------------------------------------Code 2. Upazila--------------------------------------
3. Union----------------------4. Mouza/Village--------------------------Name of Officer-----------------------------
---- 5. Name of Farm/Owner------------------------------ 6. Name of Farmer/Operator----------------------------
---------7. Year ---------------------------------- 8. Water Area----------------- (Ha) 9. Average Depth---------
-- (Meter)
9. Type of Culture (1) Exclusively shrimp/prawn (2) Mixed
10. Stocking of Fry/Juvenile
Species July - December January - June
Total Tk. Number Size (cm) Number Size (cm)
Shrimp/ Prawn
(1) Bagda (2) Harina (3) Chaka (4) Galda (5) Natural Imput Shrimp/Prawn Total
Fish
(6) Rui (7) Catla (8) Mrigal (9) Kalibaus (10) Bata (11) Ghonia (12) Silver Carp (13) Grass Carp (14) Mirror/Common Carp
(15) Other Exotic Carp (16) Pangas (15) Koi/Shingi/Magur (16) Tilapia (17) Thai Punti (18) Others Fish Total
xvi
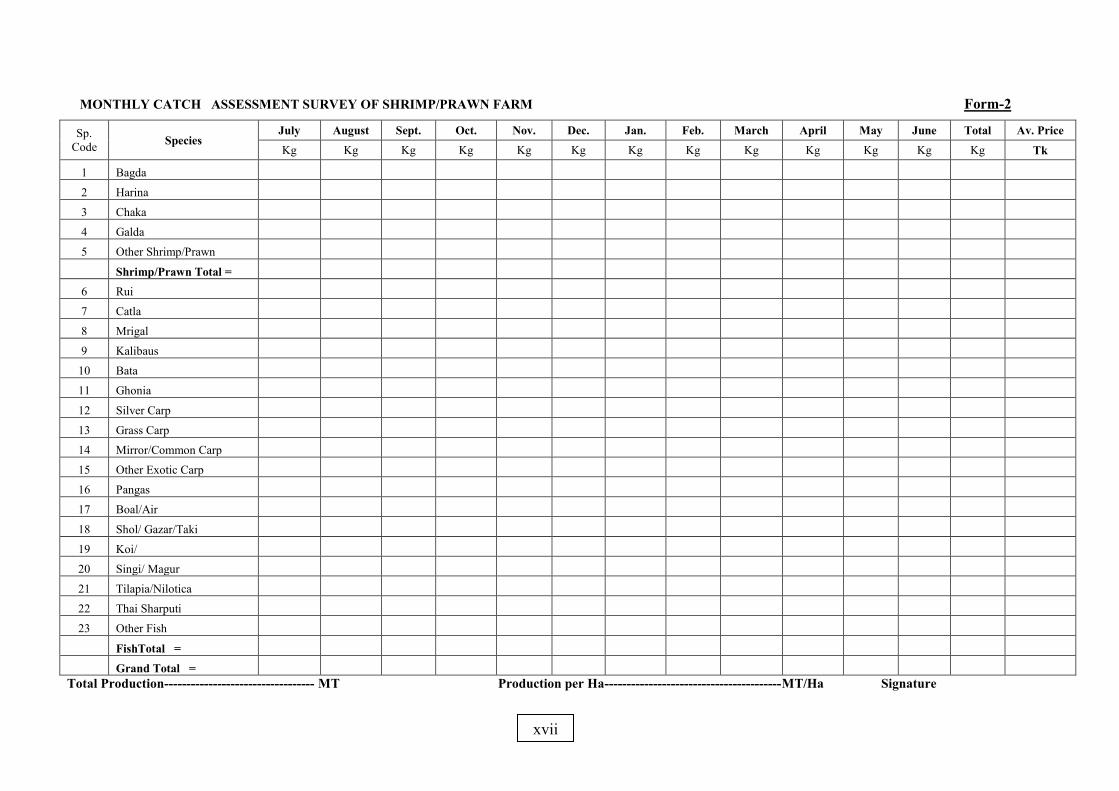
MONTHLY CATCH ASSESSMENT SURVEY OF SHRIMP/PRAWN FARM Form-2
Sp. Code Species
July August Sept. Oct. Nov. Dec. Jan. Feb. March April May June Total Av. Price Kg Kg Kg Kg Kg Kg Kg Kg Kg Kg Kg Kg Kg Tk
1 Bagda
2 Harina
3 Chaka
4 Galda
5 Other Shrimp/Prawn
Shrimp/Prawn Total =
6 Rui
7 Catla
8 Mrigal
9 Kalibaus
10 Bata
11 Ghonia
12 Silver Carp
13 Grass Carp
14 Mirror/Common Carp
15 Other Exotic Carp
16 Pangas
17 Boal/Air
18 Shol/ Gazar/Taki
19 Koi/
20 Singi/ Magur
21 Tilapia/Nilotica
22 Thai Sharputi
23 Other Fish
FishTotal =
Grand Total =
Total Production---------------------------------- MT Production per Ha----------------------------------------MT/Ha Signature
xvii
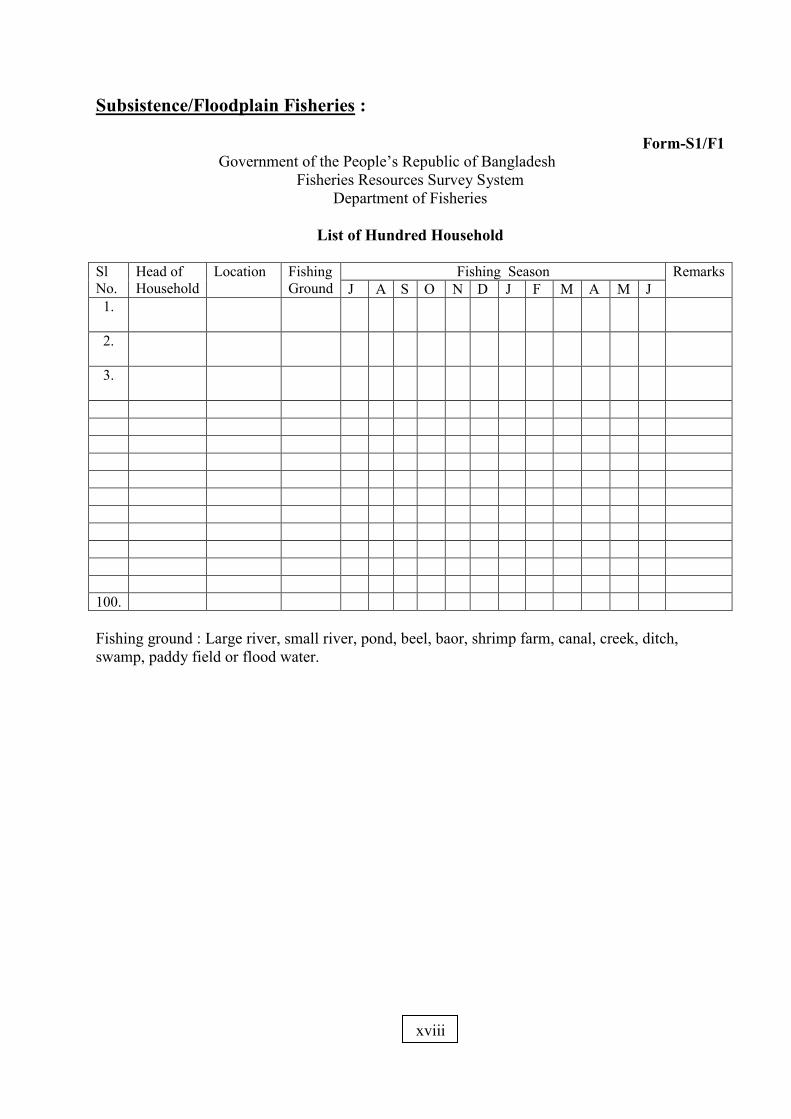
Subsistence/Floodplain Fisheries :
Form-S1/F1 Government of the People’s Republic of Bangladesh
Fisheries Resources Survey System Department of Fisheries
List of Hundred Household
Sl No.
Head of Household
Location Fishing Ground
Fishing Season Remarks J A S O N D J F M A M J
1.
2.
3.
100. Fishing ground : Large river, small river, pond, beel, baor, shrimp farm, canal, creek, ditch, swamp, paddy field or flood water.
xviii
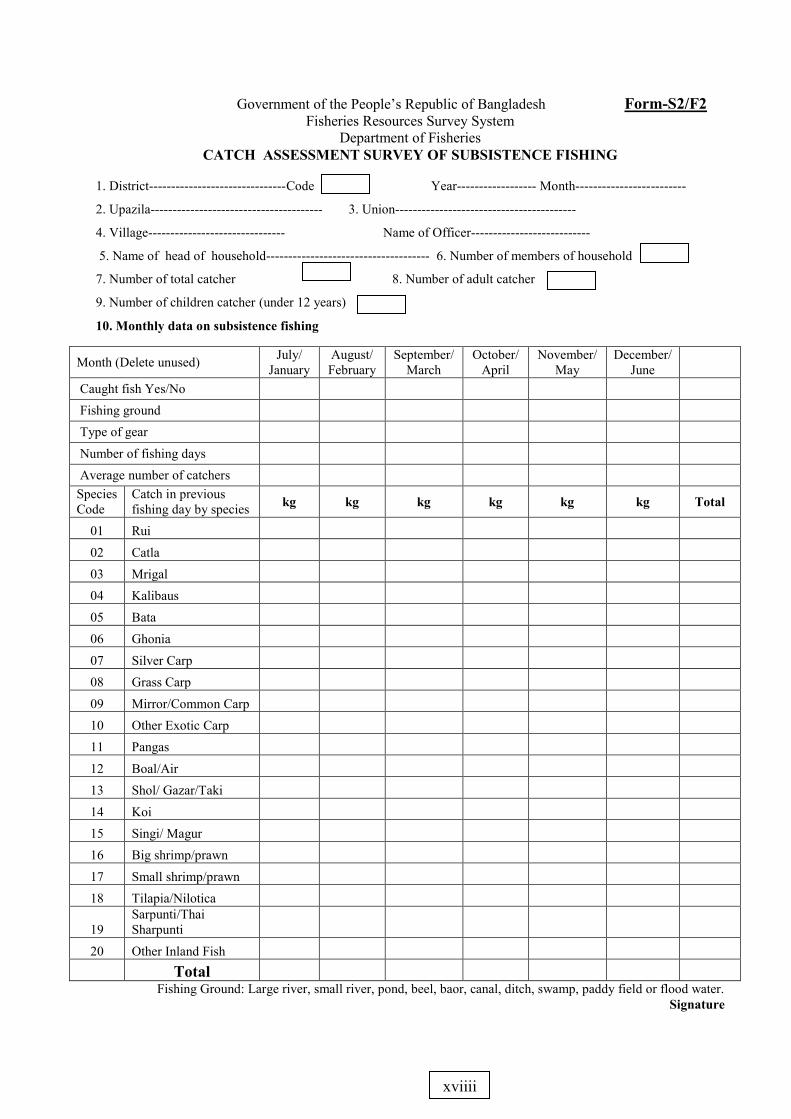
Government of the People’s Republic of Bangladesh Form-S2/F2 Fisheries Resources Survey System
Department of Fisheries CATCH ASSESSMENT SURVEY OF SUBSISTENCE FISHING
1. District-------------------------------Code Year------------------ Month-------------------------
2. Upazila--------------------------------------- 3. Union-----------------------------------------
4. Village------------------------------- Name of Officer---------------------------
5. Name of head of household------------------------------------- 6. Number of members of household
7. Number of total catcher 8. Number of adult catcher
9. Number of children catcher (under 12 years)
10. Monthly data on subsistence fishing
Fishing Ground: Large river, small river, pond, beel, baor, canal, ditch, swamp, paddy field or flood water. Signature
Month (Delete unused) July/ January
August/ February
September/ March
October/ April
November/ May
December/ June
Caught fish Yes/No
Fishing ground
Type of gear
Number of fishing days
Average number of catchers Species Code
Catch in previous fishing day by species kg kg kg kg kg kg Total
01 Rui
02 Catla
03 Mrigal
04 Kalibaus
05 Bata
06 Ghonia
07 Silver Carp
08 Grass Carp
09 Mirror/Common Carp
10 Other Exotic Carp
11 Pangas
12 Boal/Air
13 Shol/ Gazar/Taki
14 Koi
15 Singi/ Magur
16 Big shrimp/prawn
17 Small shrimp/prawn
18 Tilapia/Nilotica
19 Sarpunti/Thai Sharpunti
20 Other Inland Fish
Total
xviiii
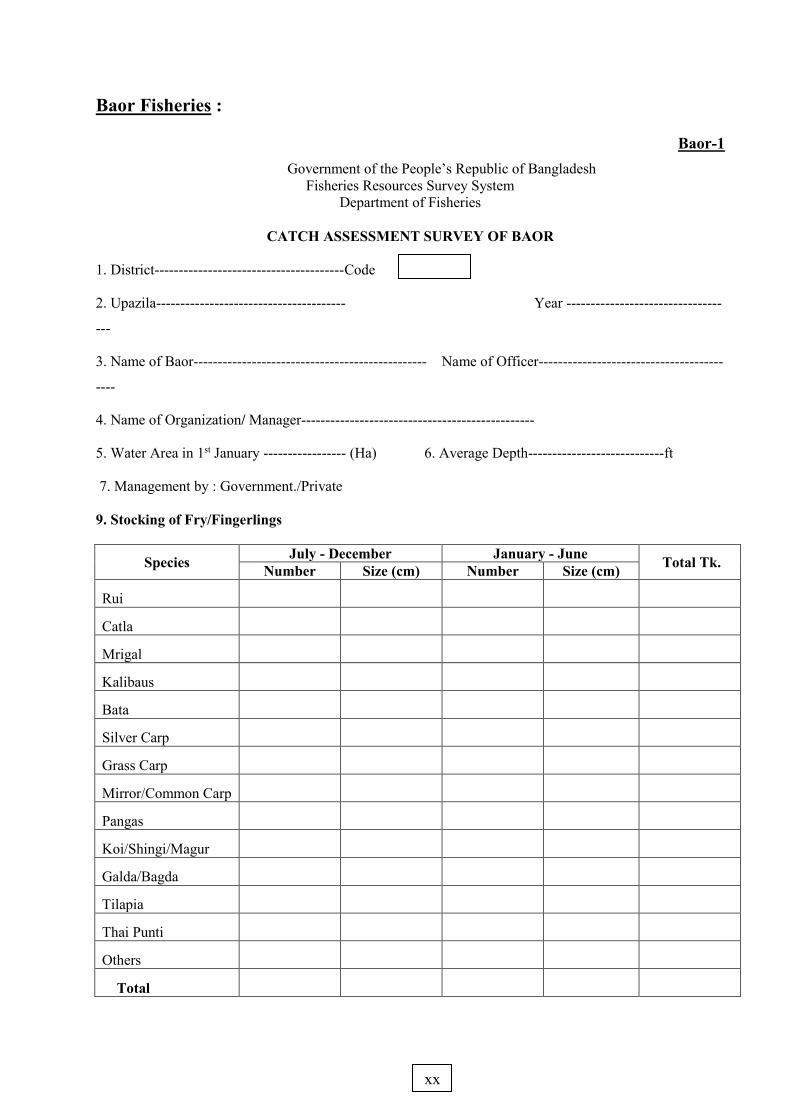
Baor Fisheries :
Baor-1 Government of the People’s Republic of Bangladesh
Fisheries Resources Survey System Department of Fisheries
CATCH ASSESSMENT SURVEY OF BAOR
1. District---------------------------------------Code
2. Upazila--------------------------------------- Year --------------------------------
---
3. Name of Baor------------------------------------------------ Name of Officer--------------------------------------
----
4. Name of Organization/ Manager------------------------------------------------
5. Water Area in 1st January ----------------- (Ha) 6. Average Depth----------------------------ft
7. Management by : Government./Private
9. Stocking of Fry/Fingerlings
Species July - December January - June Total Tk. Number Size (cm) Number Size (cm)
Rui
Catla
Mrigal
Kalibaus
Bata
Silver Carp
Grass Carp
Mirror/Common Carp
Pangas
Koi/Shingi/Magur
Galda/Bagda
Tilapia
Thai Punti
Others
Total
xx
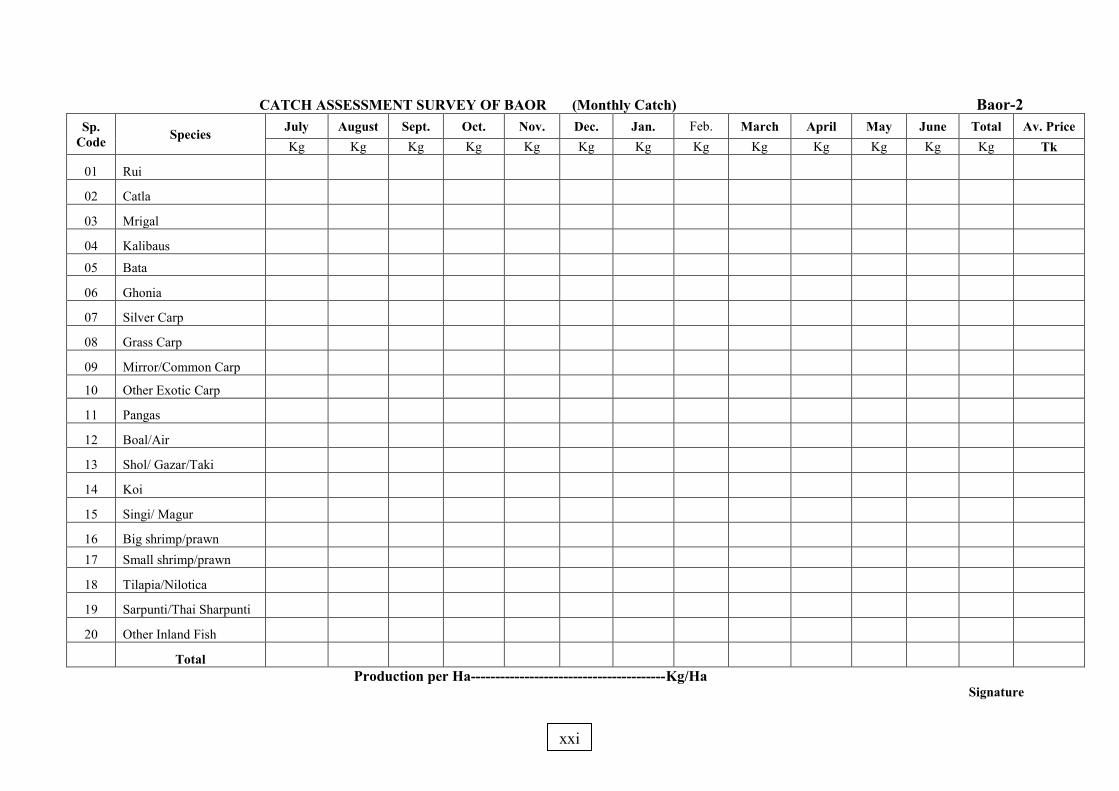
CATCH ASSESSMENT SURVEY OF BAOR (Monthly Catch) Baor-2 Sp.
Code Species July August Sept. Oct. Nov. Dec. Jan. Feb. March April May June Total Av. Price Kg Kg Kg Kg Kg Kg Kg Kg Kg Kg Kg Kg Kg Tk
01 Rui
02 Catla
03 Mrigal
04 Kalibaus
05 Bata
06 Ghonia
07 Silver Carp
08 Grass Carp
09 Mirror/Common Carp
10 Other Exotic Carp
11 Pangas
12 Boal/Air
13 Shol/ Gazar/Taki
14 Koi
15 Singi/ Magur
16 Big shrimp/prawn
17 Small shrimp/prawn
18 Tilapia/Nilotica
19 Sarpunti/Thai Sharpunti
20 Other Inland Fish
Total
Production per Ha----------------------------------------Kg/Ha Signature
xxi
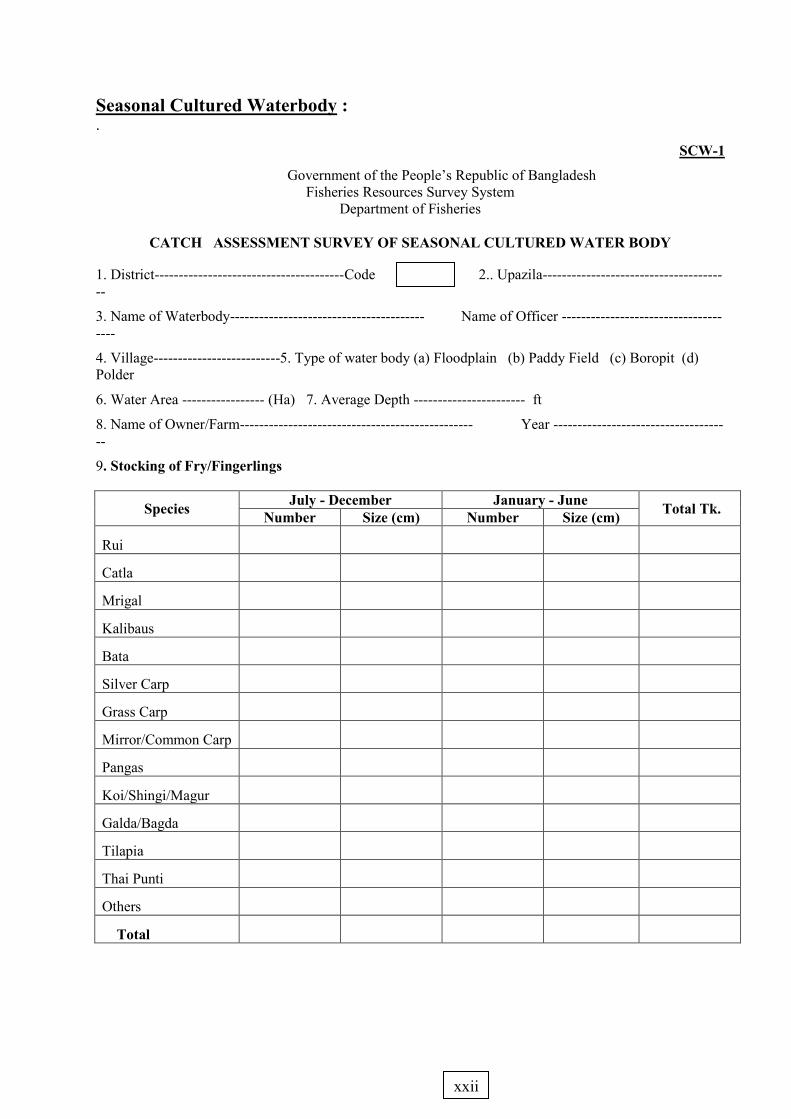
Seasonal Cultured Waterbody : .
SCW-1
Government of the People’s Republic of Bangladesh Fisheries Resources Survey System
Department of Fisheries
CATCH ASSESSMENT SURVEY OF SEASONAL CULTURED WATER BODY 1. District---------------------------------------Code 2.. Upazila---------------------------------------
3. Name of Waterbody---------------------------------------- Name of Officer -------------------------------------
4. Village--------------------------5. Type of water body (a) Floodplain (b) Paddy Field (c) Boropit (d) Polder
6. Water Area ----------------- (Ha) 7. Average Depth ----------------------- ft
8. Name of Owner/Farm------------------------------------------------ Year -------------------------------------
9. Stocking of Fry/Fingerlings
Species July - December January - June Total Tk. Number Size (cm) Number Size (cm)
Rui
Catla
Mrigal
Kalibaus
Bata
Silver Carp
Grass Carp
Mirror/Common Carp
Pangas
Koi/Shingi/Magur
Galda/Bagda
Tilapia
Thai Punti
Others
Total
xxii
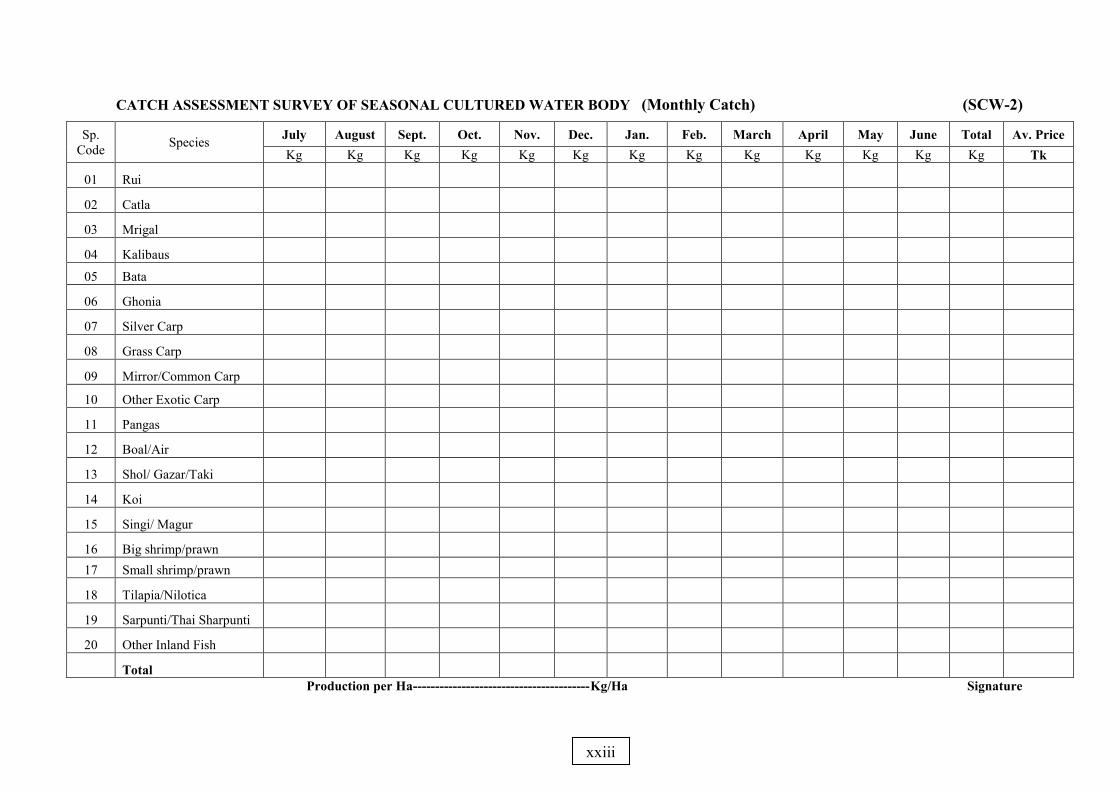
CATCH ASSESSMENT SURVEY OF SEASONAL CULTURED WATER BODY (Monthly Catch) (SCW-2)
Sp. Code Species July August Sept. Oct. Nov. Dec. Jan. Feb. March April May June Total Av. Price
Kg Kg Kg Kg Kg Kg Kg Kg Kg Kg Kg Kg Kg Tk
01 Rui
02 Catla
03 Mrigal
04 Kalibaus
05 Bata
06 Ghonia
07 Silver Carp
08 Grass Carp
09 Mirror/Common Carp
10 Other Exotic Carp
11 Pangas
12 Boal/Air
13 Shol/ Gazar/Taki
14 Koi
15 Singi/ Magur
16 Big shrimp/prawn
17 Small shrimp/prawn
18 Tilapia/Nilotica
19 Sarpunti/Thai Sharpunti
20 Other Inland Fish
Total
Production per Ha----------------------------------------Kg/Ha Signature
xxiii
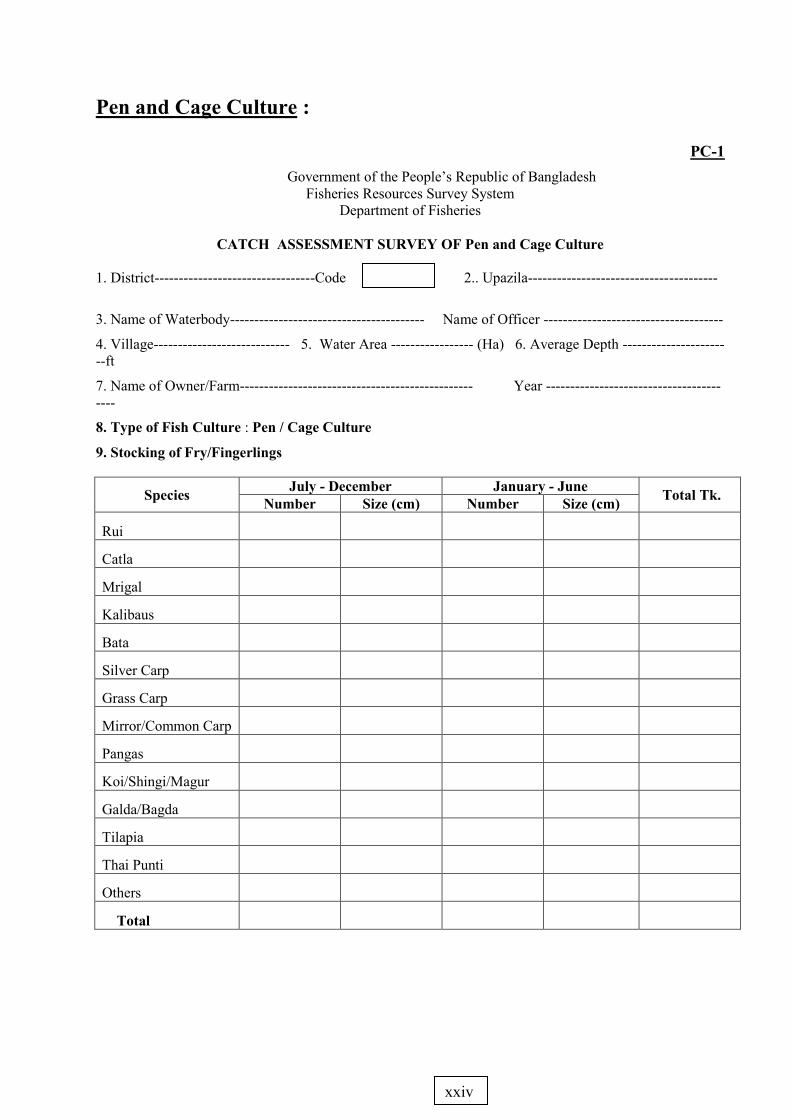
Pen and Cage Culture :
PC-1 Government of the People’s Republic of Bangladesh
Fisheries Resources Survey System Department of Fisheries
CATCH ASSESSMENT SURVEY OF Pen and Cage Culture
1. District---------------------------------Code 2.. Upazila---------------------------------------
3. Name of Waterbody---------------------------------------- Name of Officer -------------------------------------
4. Village---------------------------- 5. Water Area ----------------- (Ha) 6. Average Depth -----------------------ft
7. Name of Owner/Farm------------------------------------------------ Year ----------------------------------------
8. Type of Fish Culture : Pen / Cage Culture
9. Stocking of Fry/Fingerlings
Species July - December January - June Total Tk. Number Size (cm) Number Size (cm)
Rui
Catla
Mrigal
Kalibaus
Bata
Silver Carp
Grass Carp
Mirror/Common Carp
Pangas
Koi/Shingi/Magur
Galda/Bagda
Tilapia
Thai Punti
Others
Total
xxivi
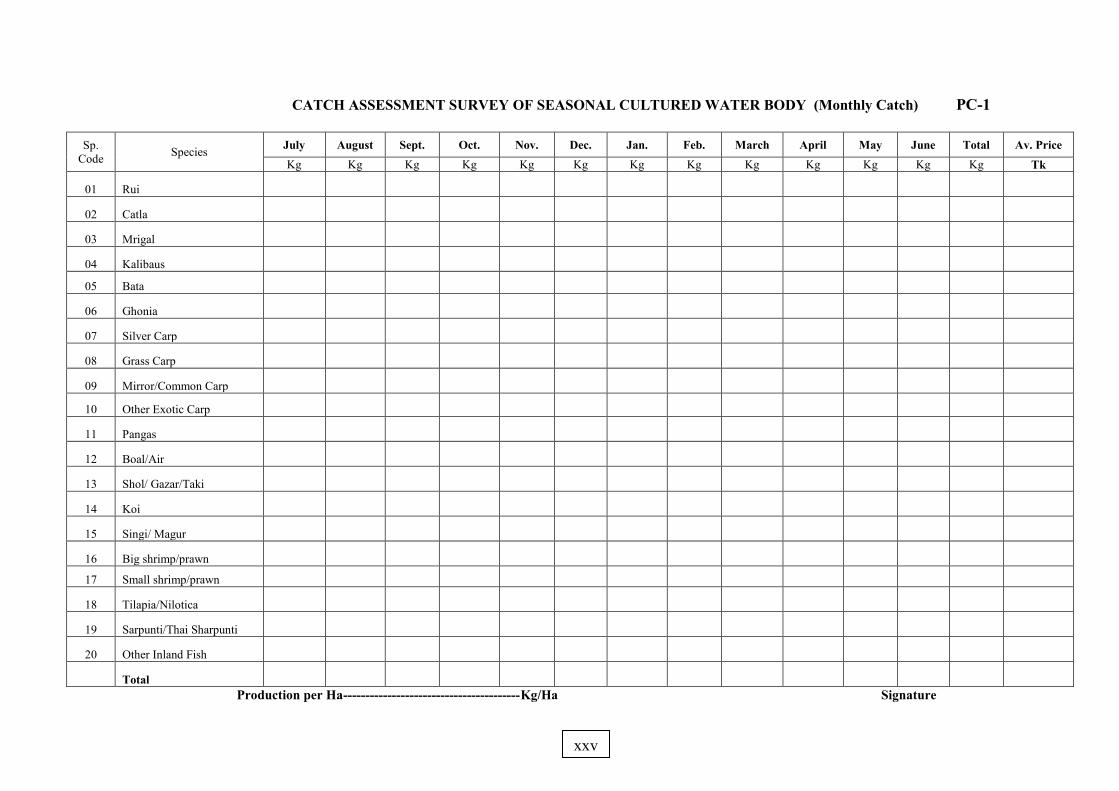
CATCH ASSESSMENT SURVEY OF SEASONAL CULTURED WATER BODY (Monthly Catch) PC-1
Sp. Code Species July August Sept. Oct. Nov. Dec. Jan. Feb. March April May June Total Av. Price
Kg Kg Kg Kg Kg Kg Kg Kg Kg Kg Kg Kg Kg Tk
01 Rui
02 Catla
03 Mrigal
04 Kalibaus
05 Bata
06 Ghonia
07 Silver Carp
08 Grass Carp
09 Mirror/Common Carp
10 Other Exotic Carp
11 Pangas
12 Boal/Air
13 Shol/ Gazar/Taki
14 Koi
15 Singi/ Magur
16 Big shrimp/prawn
17 Small shrimp/prawn
18 Tilapia/Nilotica
19 Sarpunti/Thai Sharpunti
20 Other Inland Fish
Total
Production per Ha----------------------------------------Kg/Ha Signature
xxv
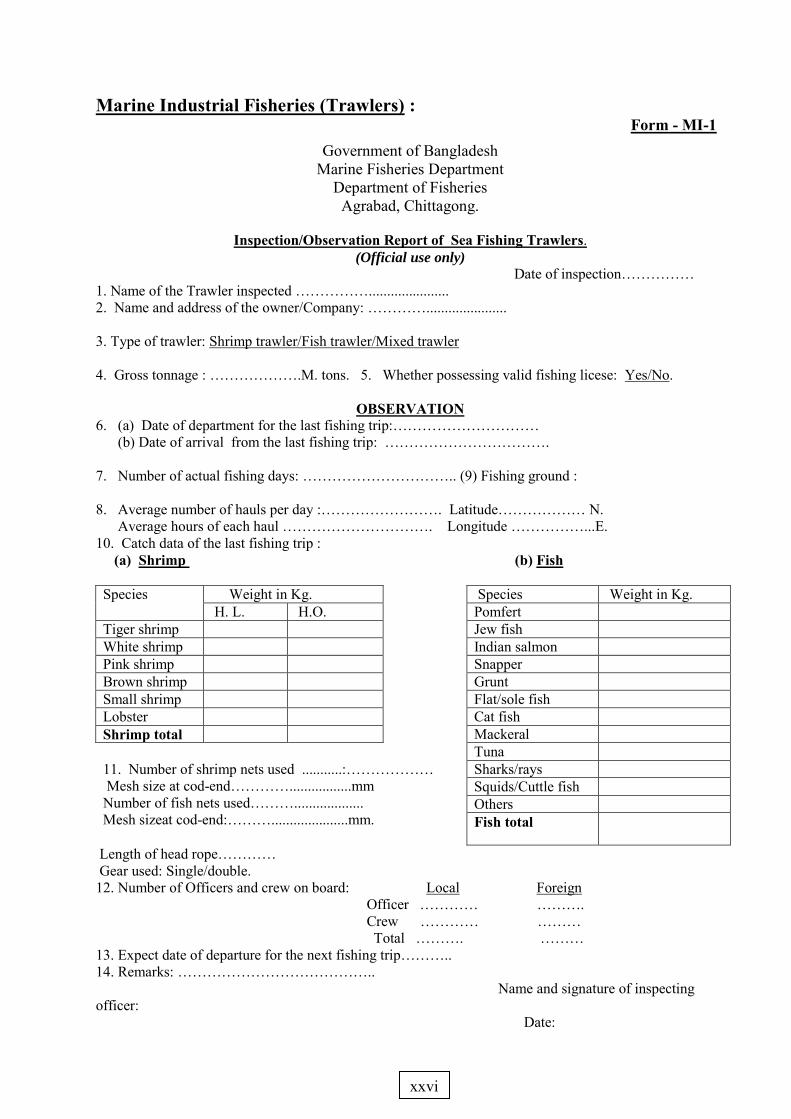
Marine Industrial Fisheries (Trawlers) : Form - MI-1
Government of Bangladesh Marine Fisheries Department
Department of Fisheries Agrabad, Chittagong.
Inspection/Observation Report of Sea Fishing Trawlers.
(Official use only)
Date of inspection…………… 1. Name of the Trawler inspected ……………...................... 2. Name and address of the owner/Company: …………...................... 3. Type of trawler: Shrimp trawler/Fish trawler/Mixed trawler 4. Gross tonnage : ……………….M. tons. 5. Whether possessing valid fishing licese: Yes/No.
OBSERVATION 6. (a) Date of department for the last fishing trip:………………………… (b) Date of arrival from the last fishing trip: ……………………………. 7. Number of actual fishing days: ………………………….. (9) Fishing ground : 8. Average number of hauls per day :……………………. Latitude……………… N. Average hours of each haul …………………………. Longitude ……………...E. 10. Catch data of the last fishing trip : (a) Shrimp (b) Fish Species Weight in Kg. Species Weight in Kg.
H. L. H.O. Pomfert Tiger shrimp Jew fish White shrimp Indian salmon Pink shrimp Snapper Brown shrimp Grunt Small shrimp Flat/sole fish Lobster Cat fish Shrimp total Mackeral Tuna 11. Number of shrimp nets used ...........:……………… Mesh size at cod-end………….................mm Number of fish nets used………................... Mesh sizeat cod-end:……….....................mm.
Sharks/rays Squids/Cuttle fish Others Fish total
Length of head rope………… Gear used: Single/double. 12. Number of Officers and crew on board: Local Foreign Officer ………… ………. Crew ………… ……… Total ………. ……… 13. Expect date of departure for the next fishing trip……….. 14. Remarks: ………………………………….. Name and signature of inspecting officer: Date:
xxvi
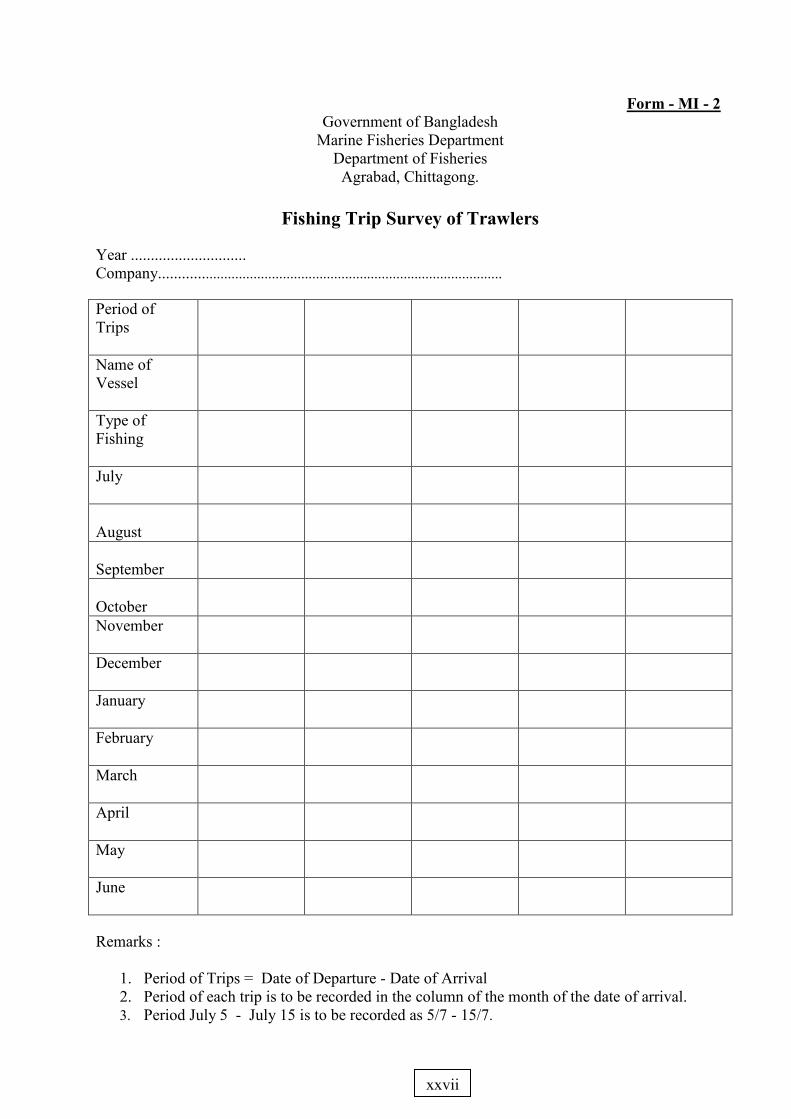
Form - MI - 2 Government of Bangladesh
Marine Fisheries Department Department of Fisheries
Agrabad, Chittagong.
Fishing Trip Survey of Trawlers
Year ............................. Company............................................................................................. Period of Trips
Name of Vessel
Type of Fishing
July
August
September
October
November
December
January
February
March
April
May
June
Remarks :
1. Period of Trips = Date of Departure - Date of Arrival 2. Period of each trip is to be recorded in the column of the month of the date of arrival. 3. Period July 5 - July 15 is to be recorded as 5/7 - 15/7.
xxviii
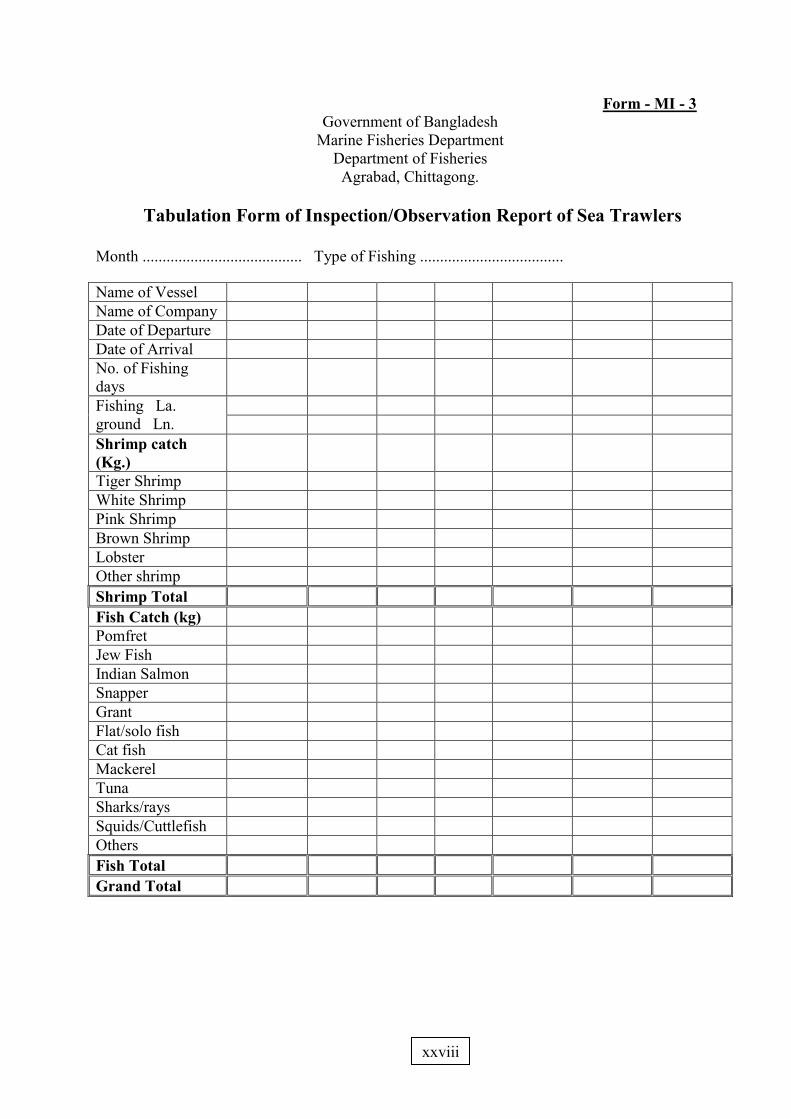
Form - MI - 3 Government of Bangladesh
Marine Fisheries Department Department of Fisheries
Agrabad, Chittagong.
Tabulation Form of Inspection/Observation Report of Sea Trawlers
Month ........................................ Type of Fishing .................................... Name of Vessel Name of Company Date of Departure Date of Arrival No. of Fishing days
Fishing La. ground Ln.
Shrimp catch (Kg.)
Tiger Shrimp White Shrimp Pink Shrimp Brown Shrimp Lobster Other shrimp Shrimp Total Fish Catch (kg) Pomfret Jew Fish Indian Salmon Snapper Grant Flat/solo fish Cat fish Mackerel Tuna Sharks/rays Squids/Cuttlefish Others Fish Total Grand Total
xxviiii
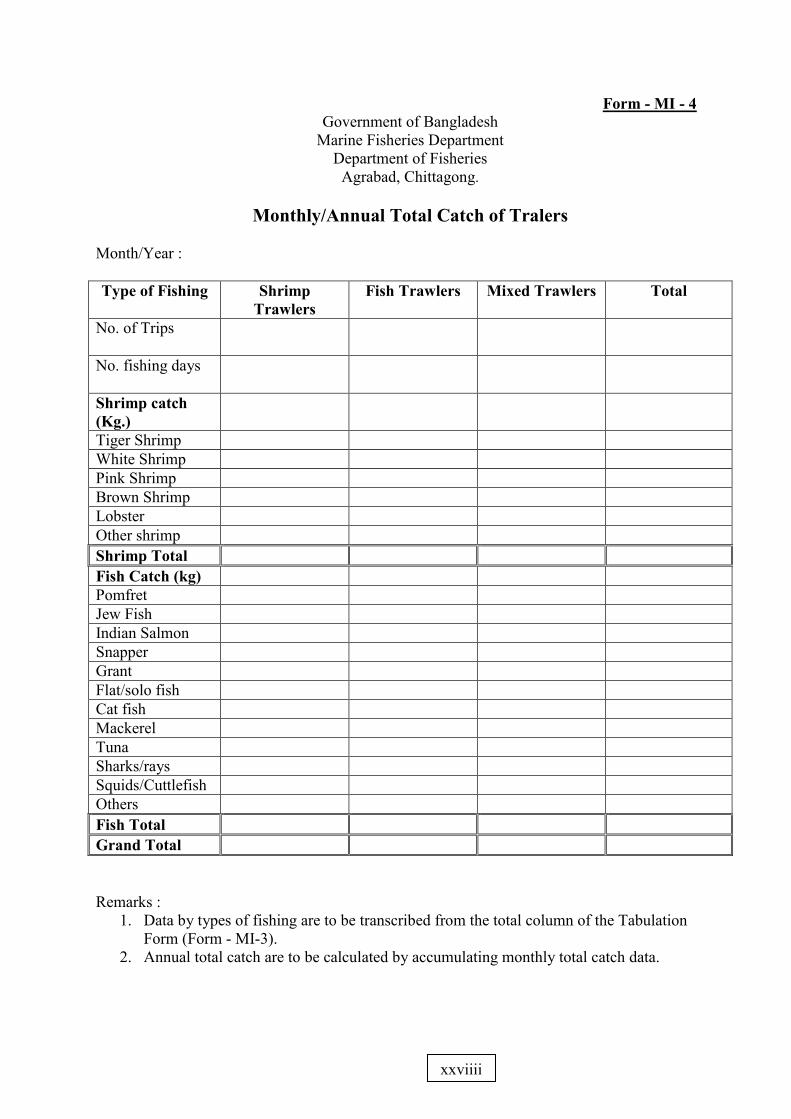
Form - MI - 4 Government of Bangladesh
Marine Fisheries Department Department of Fisheries
Agrabad, Chittagong.
Monthly/Annual Total Catch of Tralers Month/Year : Type of Fishing Shrimp
Trawlers Fish Trawlers Mixed Trawlers Total
No. of Trips
No. fishing days
Shrimp catch (Kg.)
Tiger Shrimp White Shrimp Pink Shrimp Brown Shrimp Lobster Other shrimp Shrimp Total Fish Catch (kg) Pomfret Jew Fish Indian Salmon Snapper Grant Flat/solo fish Cat fish Mackerel Tuna Sharks/rays Squids/Cuttlefish Others Fish Total Grand Total Remarks :
1. Data by types of fishing are to be transcribed from the total column of the Tabulation Form (Form - MI-3).
2. Annual total catch are to be calculated by accumulating monthly total catch data.
xxviiii
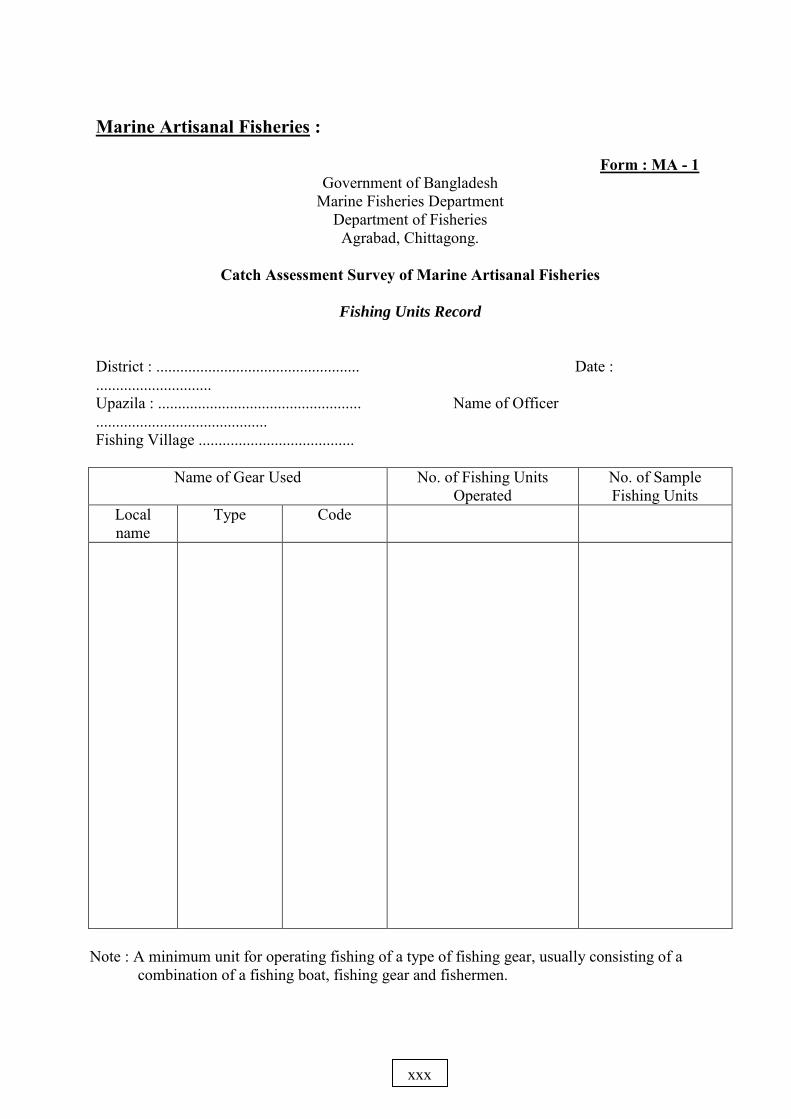
Marine Artisanal Fisheries :
Form : MA - 1 Government of Bangladesh
Marine Fisheries Department Department of Fisheries
Agrabad, Chittagong.
Catch Assessment Survey of Marine Artisanal Fisheries
Fishing Units Record
District : ................................................... Date : ............................. Upazila : ................................................... Name of Officer ........................................... Fishing Village .......................................
Name of Gear Used No. of Fishing Units Operated
No. of Sample Fishing Units
Local name
Type Code
Note : A minimum unit for operating fishing of a type of fishing gear, usually consisting of a
combination of a fishing boat, fishing gear and fishermen.
xxx
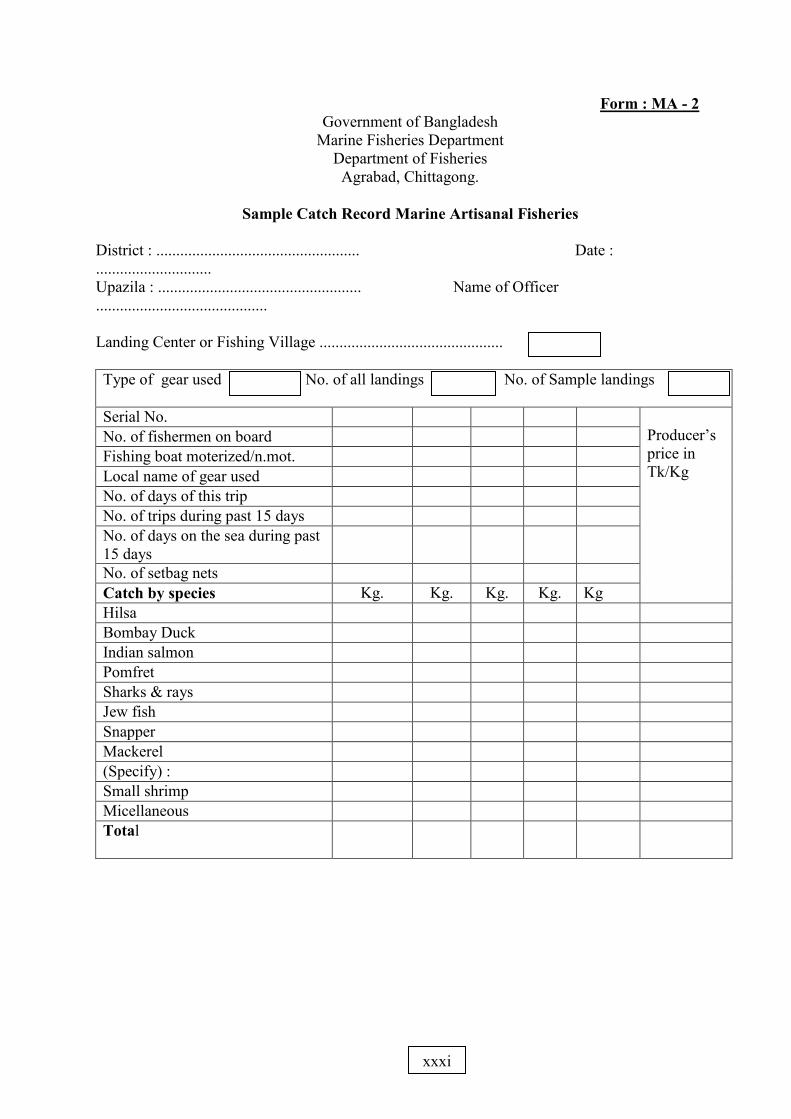
Form : MA - 2 Government of Bangladesh
Marine Fisheries Department Department of Fisheries
Agrabad, Chittagong.
Sample Catch Record Marine Artisanal Fisheries
District : ................................................... Date : ............................. Upazila : ................................................... Name of Officer ........................................... Landing Center or Fishing Village ..............................................
Type of gear used No. of all landings No. of Sample landings Serial No.
Producer’s price in Tk/Kg
No. of fishermen on board Fishing boat moterized/n.mot. Local name of gear used No. of days of this trip No. of trips during past 15 days No. of days on the sea during past 15 days
No. of setbag nets Catch by species Kg. Kg. Kg. Kg. Kg Hilsa Bombay Duck Indian salmon Pomfret Sharks & rays Jew fish Snapper Mackerel (Specify) : Small shrimp Micellaneous Total
xxxi
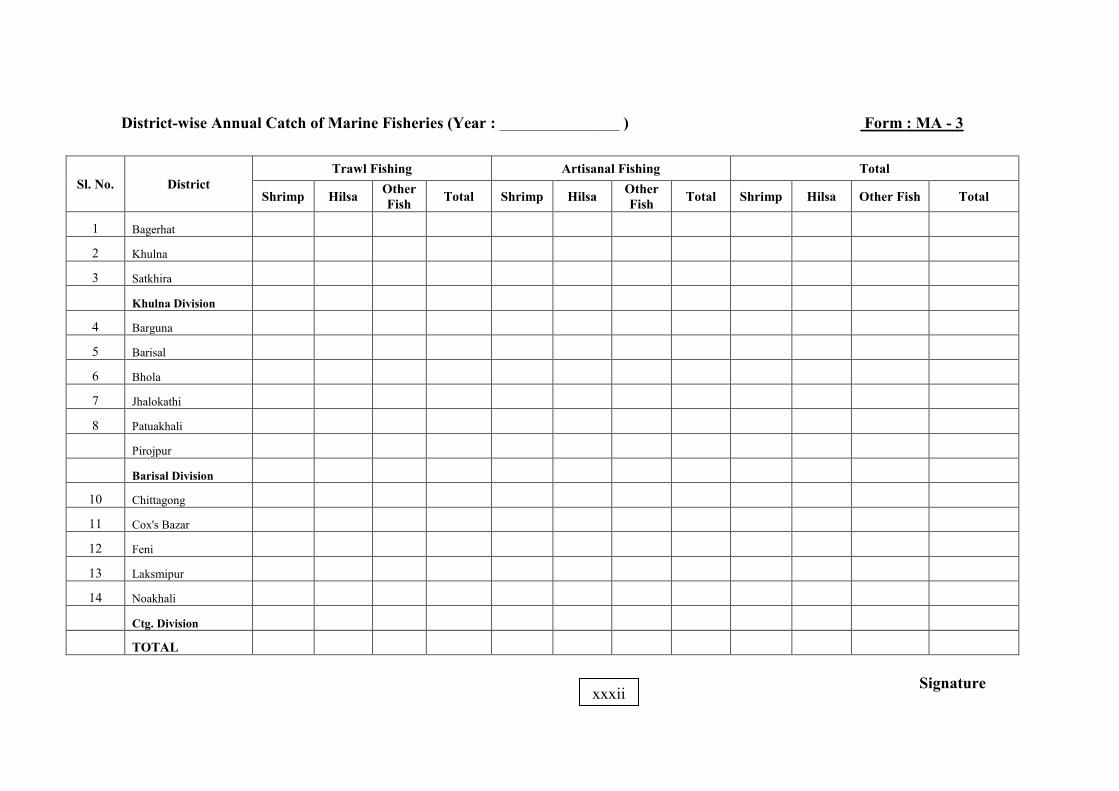
District-wise Annual Catch of Marine Fisheries (Year : _______________ ) Form : MA - 3
Sl. No. District
Trawl Fishing Artisanal Fishing Total
Shrimp Hilsa Other Fish Total Shrimp Hilsa Other
Fish Total Shrimp Hilsa Other Fish Total
1 Bagerhat
2 Khulna
3 Satkhira
Khulna Division
4 Barguna
5 Barisal
6 Bhola
7 Jhalokathi
8 Patuakhali
Pirojpur
Barisal Division
10 Chittagong
11 Cox's Bazar
12 Feni
13 Laksmipur
14 Noakhali
Ctg. Division
TOTAL
Signature xxxii
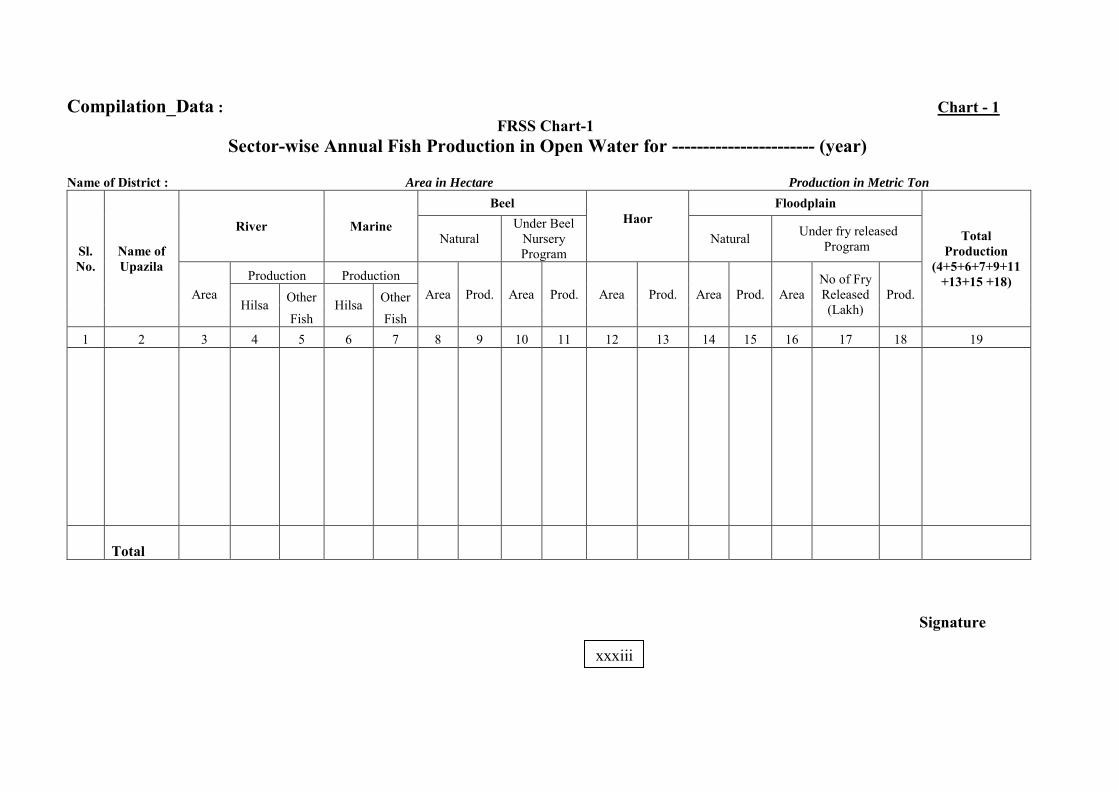
Compilation_Data : Chart - 1 FRSS Chart-1
Sector-wise Annual Fish Production in Open Water for ----------------------- (year) Name of District : Area in Hectare Production in Metric Ton
Sl. No.
Name of Upazila
River Marine
Beel Haor
Floodplain
Total Production
(4+5+6+7+9+11+13+15 +18)
Natural Under Beel
Nursery Program
Natural Under fry released Program
Area Production Production
Area Prod. Area Prod. Area Prod. Area Prod. Area No of Fry Released (Lakh)
Prod. Hilsa Other Hilsa Other
Fish Fish 1 2 3 4 5 6 7 8 9 10 11 12 13 14 15 16 17 18 19
Total
Signature
xxxiii
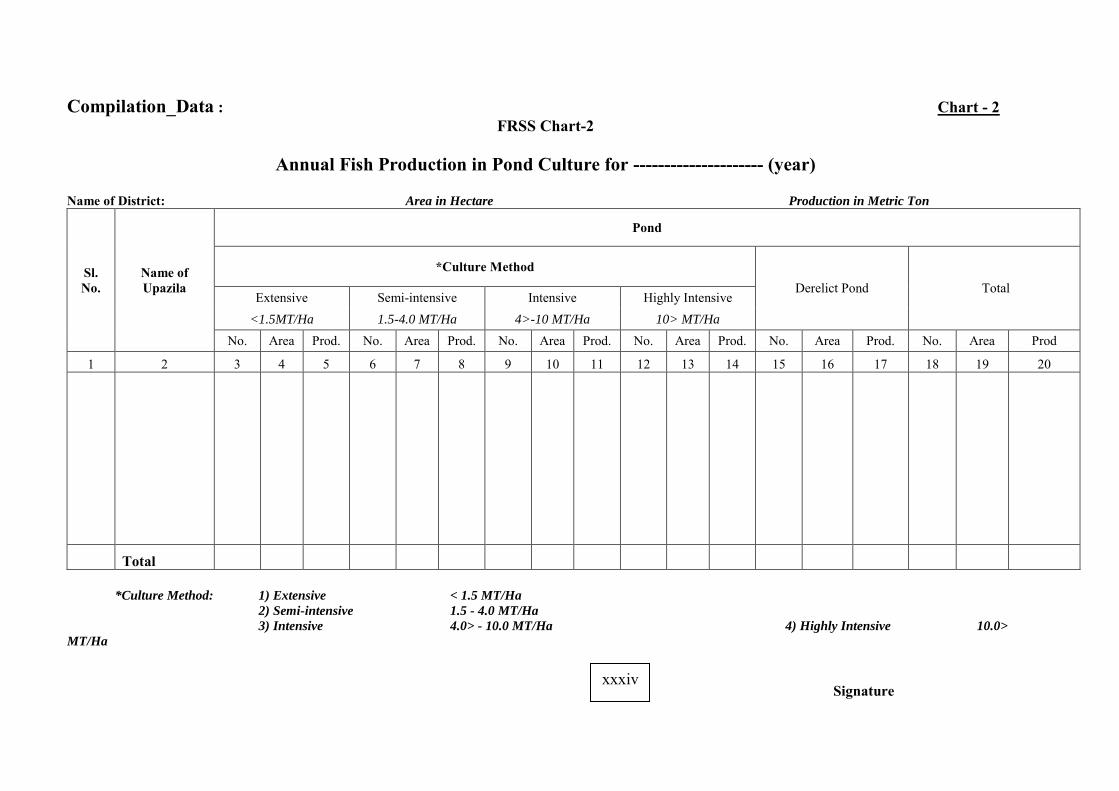
Compilation_Data : Chart - 2 FRSS Chart-2
Annual Fish Production in Pond Culture for --------------------- (year)
Name of District: Area in Hectare Production in Metric Ton
Sl. No.
Name of Upazila
Pond
*Culture Method Derelict Pond Total
Extensive Semi-intensive Intensive Highly Intensive <1.5MT/Ha 1.5-4.0 MT/Ha 4>-10 MT/Ha 10> MT/Ha
No. Area Prod. No. Area Prod. No. Area Prod. No. Area Prod. No. Area Prod. No. Area Prod
1 2 3 4 5 6 7 8 9 10 11 12 13 14 15 16 17 18 19 20
Total
*Culture Method: 1) Extensive < 1.5 MT/Ha
2) Semi-intensive 1.5 - 4.0 MT/Ha
3) Intensive 4.0> - 10.0 MT/Ha 4) Highly Intensive 10.0>
MT/Ha
Signature xxxiv
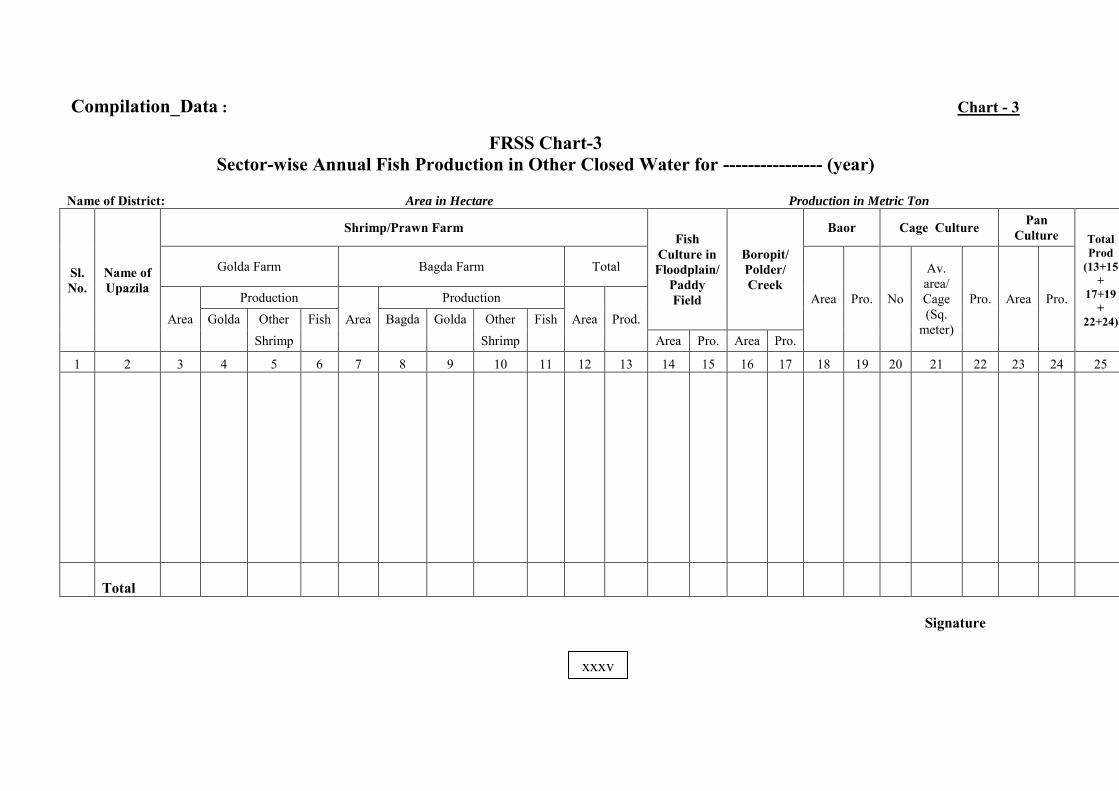
Compilation_Data : Chart - 3
FRSS Chart-3 Sector-wise Annual Fish Production in Other Closed Water for ---------------- (year)
Name of District: Area in Hectare Production in Metric Ton
Sl. No.
Name of Upazila
Shrimp/Prawn Farm Fish
Culture in Floodplain/
Paddy Field
Boropit/ Polder/ Creek
Baor Cage Culture Pan Culture Total
Prod (13+15
+ 17+19
+ 22+24)
Golda Farm Bagda Farm Total
Area Pro. No
Av. area/ Cage (Sq.
meter)
Pro. Area Pro. Area
Production Area
Production Area Prod. Golda Other Fish Bagda Golda Other Fish
Shrimp Shrimp Area Pro. Area Pro.
1 2 3 4 5 6 7 8 9 10 11 12 13 14 15 16 17 18 19 20 21 22 23 24 25
Total
Signature xxxv
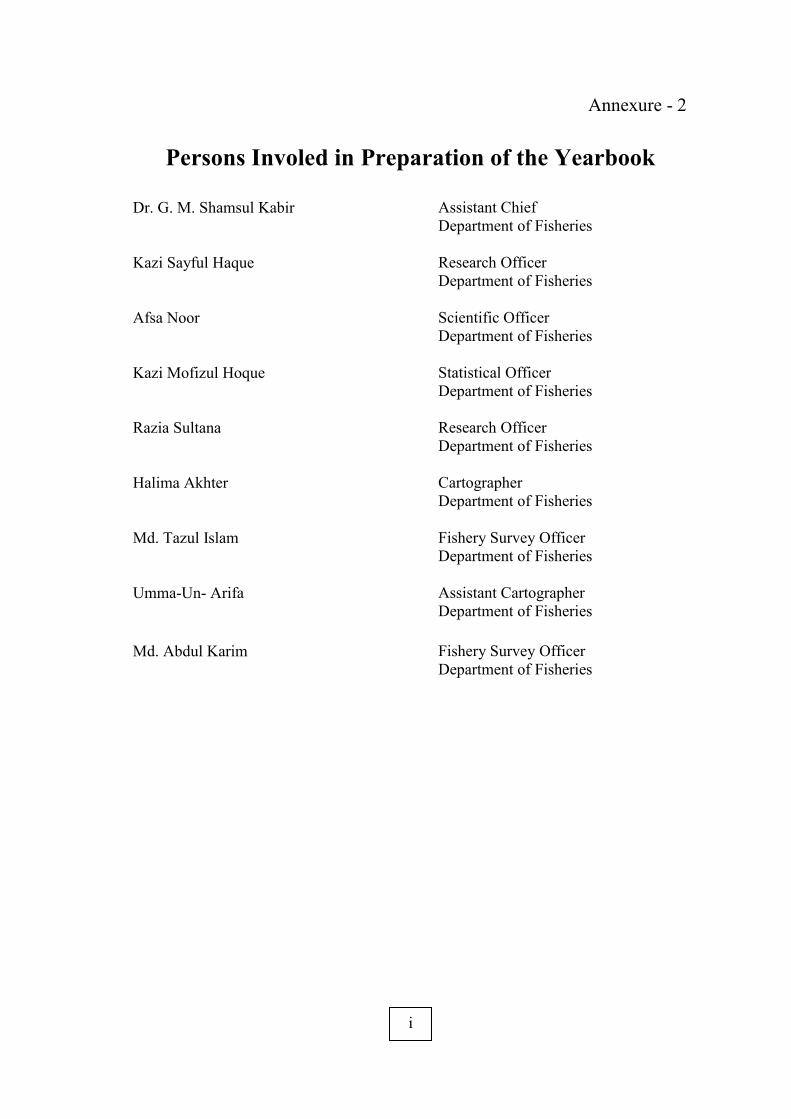
Annexure - 2
Persons Involed in Preparation of the Yearbook
Dr. G. M. Shamsul Kabir Assistant Chief Department of Fisheries
Kazi Sayful Haque Research Officer Department of Fisheries
Afsa Noor Scientific Officer Department of Fisheries
Kazi Mofizul Hoque Statistical Officer Department of Fisheries
Razia Sultana Research Officer Department of Fisheries
Halima Akhter Cartographer Department of Fisheries
Md. Tazul Islam Fishery Survey Officer Department of Fisheries
Umma-Un- Arifa Assistant Cartographer Department of Fisheries
Md. Abdul Karim Fishery Survey Officer Department of Fisheries
i
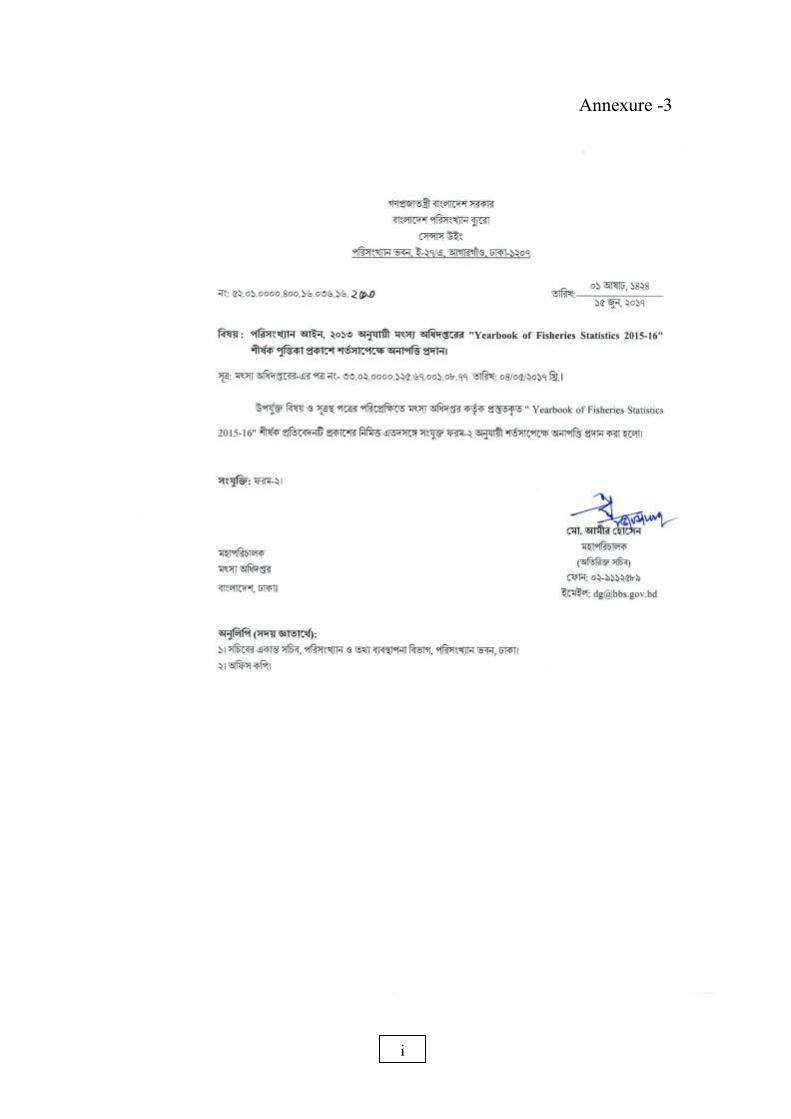
Annexure -3
i
ii
iii
iv

![YEARBOOK OF FISHERIES STATISTICS OF BANGLADESHfisheries.portal.gov.bd/sites/default/files/files/fisheries.portal.gov... · Yearbook of Fisheries Statistics of Bangladesh 2016-17 [iii]](https://img.pdfslide.us/doc/110x75/5e8d79cf75da9c52bf4e5b65/yearbook-of-fisheries-statistics-of-yearbook-of-fisheries-statistics-of-bangladesh.jpg)