Embed Size (px)
Citation preview
Demographic Change and Migration in Europe
Introduction
Demographic Change
The different populations in Europe have undergone inci-sive quantitative and structural changes in the last decades. Notwithstanding the various regional differences, the causes for the current demographic change in Europe are related to the consequences of a demographic transition. This has been ushered in by a long-term trend towards low fertility and an unprecedentedly high life expectancy. This change in population processes takes place in the con-text of historical economic growth and extensive societal modernization processes. Since population changes occur very slowly and are rooted in past population structures, all European countries will be facing similar demographic conditions in the near future: their populations are aging, and many countries are facing a negative natural popula-tion balance in the long term, that is, a population decline as a result of a deficit of births in comparison to deaths.
The consequences of demographic change have pro-found effects on all aspects of life, for instance on the employment and housing markets, the capacity and sus-tainability of the public and private infrastructure (e.g. uneconomical local public transportation, closing of schools due to low numbers of pupils), as well as the ca-pacity of social security systems. Politics, the economic market, and society are facing significant pressures to adapt to and confront these enormous challenges.
Migration Movements
European history was always characterized by far-reach-ing, international migration flows. However, the second half of the twentieth century was marked by migration patterns which were impacted by the processes of decolonization and the immigration of so-called ›guest workers‹. These migration movements have led to larger populations of im-migrants in the destination countries, bringing up questions of how to integrate these immigrants and how immigrants’ fertility patterns are affected by integration. At the same time, the self-selective emigration of mainly young people creates additional challenges with regard to an aging and shrinking population in their countries of origin as well.
While the demographic changes related to aging and, to a degree, population decline are similar in all European countries, there are large differences regarding the spe-cific migration movements to each of these countries. The past international labor migration flowing predominantly from the South to the North has been replaced recently by new migration patterns. These may be described as an in-ternal European migration, which has become increasingly significant with the end of the Cold War and with the spatial expansion of the EU in Eastern Europe. Migrants’ regions of origin and their motives for migrating are becoming in-creasingly diverse. In this context, European and national migration policies endeavor different goals. On the one hand, migration policies aim to avert an unlimited immigra-tion from less developed regions into the labor markets and social security systems of the European welfare states. On the other hand, immigration is to be coordinated such that it contributes to mitigating the repercussions of demo-graphic change. For this reason, migrants should be main-ly young, qualified, and productive people. International migration flows are currently one of the causes for global-ization. These flows not only connect the populations in the industrialized countries with the still growing populations in developing countries, but also exemplify the opposite de-mographic developments in these two groups of countries.
Regional Disparities
The demographic transition and the effects of migration are leading to considerable regional differences within Europe. Demographically young and still growing re-gions exist next to regions with already above-average aging populations, selective emigration, and population decline. Demographically and economically prosperous regions with jobs, infrastructure, and a high standard of living create additional incentives for immigrating there. Moreover, there are peripheral regions marked by diverse disadvantages, such as high unemployment or lacking opportunities for the future, which accelerate emigration. The coexistence of these two trends impedes the politi-cal attempts to hinder the diverging development of these regions and to reduce the regional social inequality of
No. 24 December 2013
Policy Brief No. 24
page 2
living standards in Europe. The following section pres-ents the causes and effects of demographic change and international migration processes in Europe, using theo-retical approaches and empirical fi ndings, while drawing special attention to the position of Germany in Europe.
First and Second Demographic Transition
First Demographic Transition
In demographic research the fi rst demographic transi-tion refers to the transition from high to low mortality and birth rates. It typically begins with the decline in a previ-ously high mortality. The causes for this decrease in-clude higher standards of living and better hygiene in the population, as well as medical progress, whereby fi rst the infant and child mortality are reduced. Since birth rates initially remain high, the population temporar-ily grows quickly, and its age distribution begins to shift such that the younger birth cohorts increase in size.
After a while, however, the birth rate begins to decrease. This can be interpreted as an adaptation to children’s higher chances of survival as well as to changing ideals regarding one’s number of children due to the infl uence of societal modernization processes and changing economic conditions. Population growth thus wanes, and the popu-lation begins to age due to, inter alia, the increased life expectancy during the demographic transition. In many European countries the phase with the highest population growth rates took place during the industrialization and slowly declined until the beginning of the second half of the twentieth century. By now also most developing countries have reached a phase in which fertility rates have begun to sink; many of these countries have already gone be-yond their phase of maxi-mum population growth.
Second Demographic Transition
The evident aging of the population was initially superimposed with a so-called ›baby boom‹ which arose with the economic recovery after the Sec-ond World War. In Ger-many the mid-1950s until the end of the 1960s was not only a ›baby boom‹ phase, but also the phase of the German ›economic wonder‹ with igh growth
rates and full employment. This period was referred to as the ›Golden Age for Marriage‹, but it also marked the begin-ning of the second demographic transition. This refers to the sudden fall in the fertility level below that which is necessary to sustain a population in the long-term, which would be an average of 2.1 children per woman. Since the 1970s, this trend has taken place to varying degrees in all European countries. One reason for this was the improved societal po-sition of women; with access to higher education and more employment opportunities, the number of children women wished to have sank. The higher availability of modern con-traceptives has also enabled an effective control of fertility.
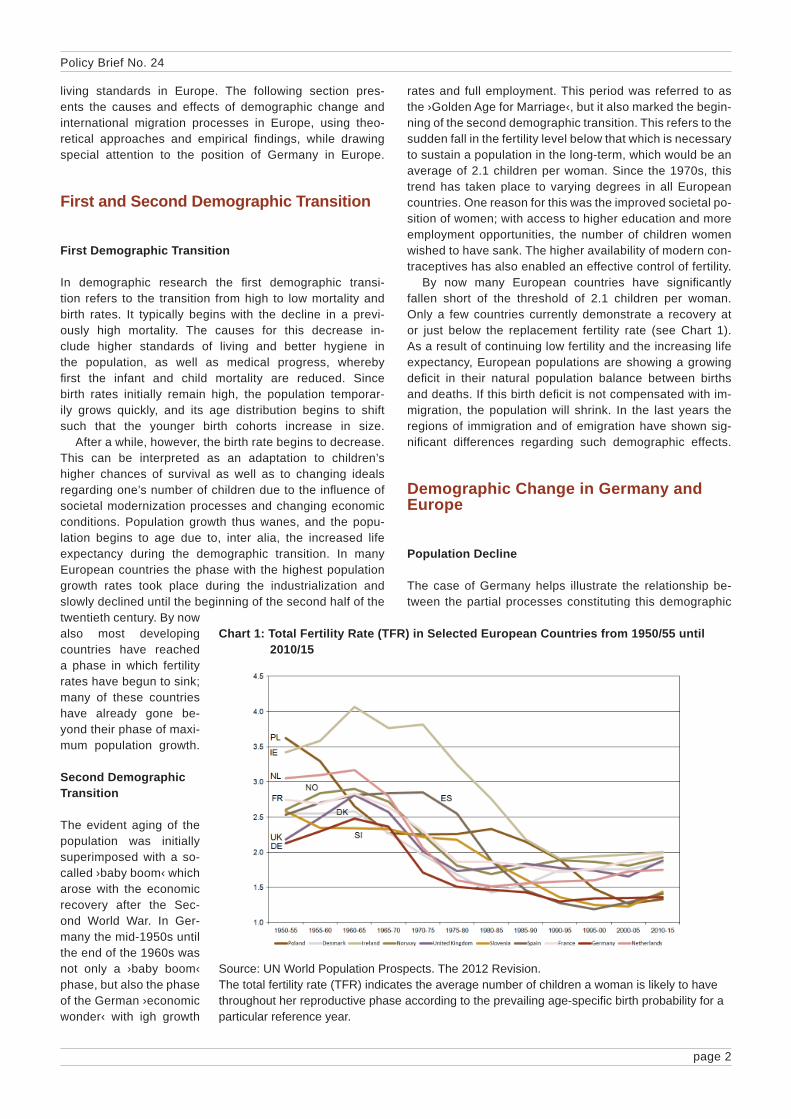
By now many European countries have signifi cantly fallen short of the threshold of 2.1 children per woman. Only a few countries currently demonstrate a recovery at or just below the replacement fertility rate (see Chart 1). As a result of continuing low fertility and the increasing life expectancy, European populations are showing a growing defi cit in their natural population balance between births and deaths. If this birth defi cit is not compensated with im-migration, the population will shrink. In the last years the regions of immigration and of emigration have shown sig-nifi cant differences regarding such demographic effects.
Demographic Change in Germany and Europe
Population Decline
The case of Germany helps illustrate the relationship be-tween the partial processes constituting this demographic
Chart 1: Total Fertility Rate (TFR) in Selected European Countries from 1950/55 until 2010/15
Source: UN World Population Prospects. The 2012 Revision.The total fertility rate (TFR) indicates the average number of children a woman is likely to have throughout her reproductive phase according to the prevailing age-specifi c birth probability for a particular reference year.
Policy Brief No. 24
page 3
change.1 At the beginning of the twentieth century, Ger-
many had a total fertility rate (TFR) of approximately 4.2 children per woman (with a replacement fertility rate of 2.9 children at that time). The life expectancy of some-one born during this time was less than 45 years. The number of births exceeded the number of deaths by an average of 10.4 per 1,000 residents; the natural bal-ance in 1900 was +760,000. By the middle of the 1950s the birth rate had decreased to the new replacement fertility rate of 2.1 children per woman. This phase was followed by the ›baby boom‹ until the end of the 1960s with peak levels of more than 2.5 children per woman.
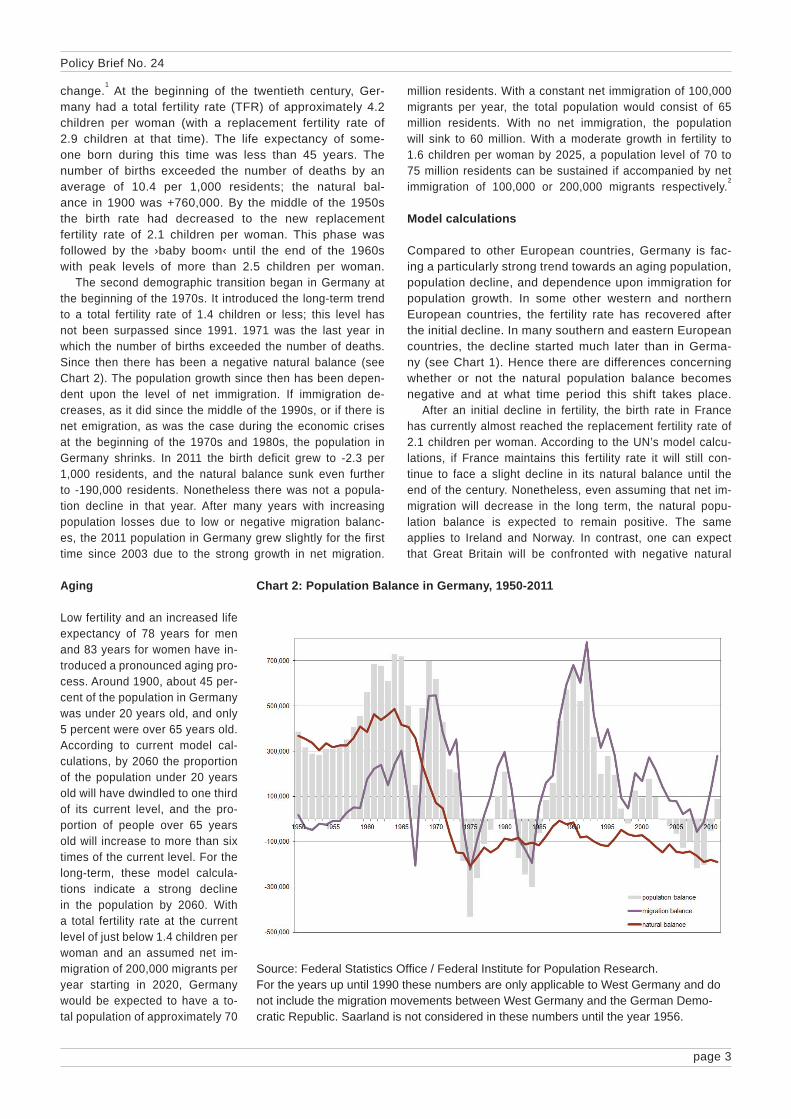
The second demographic transition began in Germany at the beginning of the 1970s. It introduced the long-term trend to a total fertility rate of 1.4 children or less; this level has not been surpassed since 1991. 1971 was the last year in which the number of births exceeded the number of deaths. Since then there has been a negative natural balance (see Chart 2). The population growth since then has been depen-dent upon the level of net immigration. If immigration de-creases, as it did since the middle of the 1990s, or if there is net emigration, as was the case during the economic crises at the beginning of the 1970s and 1980s, the population in Germany shrinks. In 2011 the birth deficit grew to -2.3 per 1,000 residents, and the natural balance sunk even further to -190,000 residents. Nonetheless there was not a popula-tion decline in that year. After many years with increasing population losses due to low or negative migration balanc-es, the 2011 population in Germany grew slightly for the first time since 2003 due to the strong growth in net migration.
Aging
Low fertility and an increased life expectancy of 78 years for men and 83 years for women have in-troduced a pronounced aging pro-cess. Around 1900, about 45 per-cent of the population in Germany was under 20 years old, and only 5 percent were over 65 years old. According to current model cal-culations, by 2060 the proportion of the population under 20 years old will have dwindled to one third of its current level, and the pro-portion of people over 65 years old will increase to more than six times of the current level. For the long-term, these model calcula-tions indicate a strong decline in the population by 2060. With a total fertility rate at the current level of just below 1.4 children per woman and an assumed net im-migration of 200,000 migrants per year starting in 2020, Germany would be expected to have a to-tal population of approximately 70
million residents. With a constant net immigration of 100,000 migrants per year, the total population would consist of 65 million residents. With no net immigration, the population will sink to 60 million. With a moderate growth in fertility to 1.6 children per woman by 2025, a population level of 70 to 75 million residents can be sustained if accompanied by net immigration of 100,000 or 200,000 migrants respectively.2
Model calculations
Compared to other European countries, Germany is fac-ing a particularly strong trend towards an aging population, population decline, and dependence upon immigration for population growth. In some other western and northern European countries, the fertility rate has recovered after the initial decline. In many southern and eastern European countries, the decline started much later than in Germa-ny (see Chart 1). Hence there are differences concerning whether or not the natural population balance becomes negative and at what time period this shift takes place.
After an initial decline in fertility, the birth rate in France has currently almost reached the replacement fertility rate of 2.1 children per woman. According to the UN’s model calcu-lations, if France maintains this fertility rate it will still con-tinue to face a slight decline in its natural balance until the end of the century. Nonetheless, even assuming that net im-migration will decrease in the long term, the natural popu-lation balance is expected to remain positive. The same applies to Ireland and Norway. In contrast, one can expect that Great Britain will be confronted with negative natural
Chart 2: Population Balance in Germany, 1950-2011
Source: Federal Statistics Offi ce / Federal Institute for Population Research.For the years up until 1990 these numbers are only applicable to West Germany and do not include the migration movements between West Germany and the German Demo-cratic Republic. Saarland is not considered in these numbers until the year 1956.
Policy Brief No. 24
page 4
balances starting in 2050/55, even though its fertility rate is only slightly lower than that in France. In the Nether-lands and Denmark, where the fertility rates have recov-ered from a strong decrease and have reached a level of 1.8 children per woman, a negative natural balance is ex-pected to be reached by 2030/35 and 2035/40 respectively.
A different situation can be observed in Spain and Slove-nia, where the decline in births began later and the fertility rate is now just over 1.4 children per woman – as well as in Po-land, which faced a decline to below 1.4 children per woman after the transformation of its socio-political system. In some of these countries the birth deficit exists already; in Slovenia this began in 1995/2000 and in Poland in 2000/2005. In other countries like Spain, a negative balance is expected to take place in the time period 2010/2015. These demographic pro-cesses are superimposed by the migration balance. In Spain the average net immigration has been high since 1990, and in Slovenia it is slightly positive. In Poland a net emigra-tion trend started in the 1950s and has intensified since the middle of the 1980s. Accordingly, Poland and Slovenia have shown negative population balances for some years now, while Spain is not expected to reach a negative population balance until the 2040s, assuming that Spain’s immigration will return to the same level it had before the economic crisis.
3
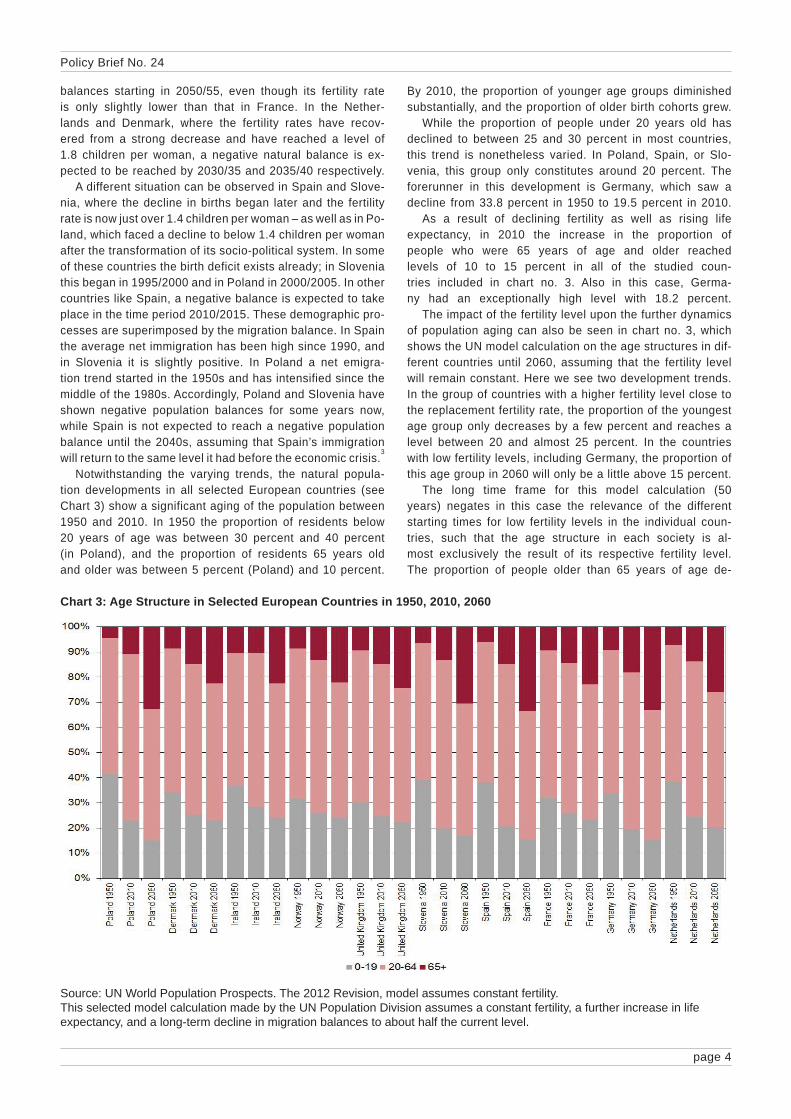
Notwithstanding the varying trends, the natural popula-tion developments in all selected European countries (see Chart 3) show a significant aging of the population between 1950 and 2010. In 1950 the proportion of residents below 20 years of age was between 30 percent and 40 percent (in Poland), and the proportion of residents 65 years old and older was between 5 percent (Poland) and 10 percent.
By 2010, the proportion of younger age groups diminished substantially, and the proportion of older birth cohorts grew.
While the proportion of people under 20 years old has declined to between 25 and 30 percent in most countries, this trend is nonetheless varied. In Poland, Spain, or Slo-venia, this group only constitutes around 20 percent. The forerunner in this development is Germany, which saw a decline from 33.8 percent in 1950 to 19.5 percent in 2010.
As a result of declining fertility as well as rising life expectancy, in 2010 the increase in the proportion of people who were 65 years of age and older reached levels of 10 to 15 percent in all of the studied coun-tries included in chart no. 3. Also in this case, Germa-ny had an exceptionally high level with 18.2 percent.
The impact of the fertility level upon the further dynamics of population aging can also be seen in chart no. 3, which shows the UN model calculation on the age structures in dif-ferent countries until 2060, assuming that the fertility level will remain constant. Here we see two development trends. In the group of countries with a higher fertility level close to the replacement fertility rate, the proportion of the youngest age group only decreases by a few percent and reaches a level between 20 and almost 25 percent. In the countries with low fertility levels, including Germany, the proportion of this age group in 2060 will only be a little above 15 percent.
The long time frame for this model calculation (50 years) negates in this case the relevance of the different starting times for low fertility levels in the individual coun-tries, such that the age structure in each society is al-most exclusively the result of its respective fertility level. The proportion of people older than 65 years of age de-
Chart 3: Age Structure in Selected European Countries in 1950, 2010, 2060
Source: UN World Population Prospects. The 2012 Revision, model assumes constant fertility.This selected model calculation made by the UN Population Division assumes a constant fertility, a further increase in life expectancy, and a long-term decline in migration balances to about half the current level.
Policy Brief No. 24
page 5
velops accordingly, growing to approximately 22 per-cent to 26 percent in the higher fertility countries and to 30 percent to 34 percent in the lower fertility countries.
International Migration and Migrants
In contrast to the long-term structures of demographic processes, as they become apparent in the current de-mographic change, international migration in Europe is subject to more pronounced variations depending on the time period and region in question; these developments can only be described in broader terms. These develop-ments are constituted by complex factors, such as the causes for migration, migrants’ motives, ages, or gender, the social structure of the migrating populations, migration distances, the permanence or periodicity of migration, as well as the resulting reciprocal effects between the popula-tions in the regions of origin and the destination regions.
Many migration flows these days react very quickly to changing conditions, for instance favorable conditions in na-tional labor markets. Also the influx of refugees and asylum seekers is based upon quick fluctuations regarding their in-tensity as well as their countries of origin. Finally, a signifi-cant share of immigration is not intended to be long-term, for instance temporary assignments of highly qualified workers or the periodic employment of seasonal workers. It is thus difficult to consider such immigration patterns in model cal-culations of the future population development. Other de-mographic effects of immigration, however, are long-term
in scope. Considering the relationship between migration and demographic change, so-called ›chain migration‹ plays an important role in Europe. To this day the former ›guest worker migration‹ is still being followed by their families, and the regions which were the main destinations for immigra-tion in the past are still demographically profiting from this.
Migration and Population Structure
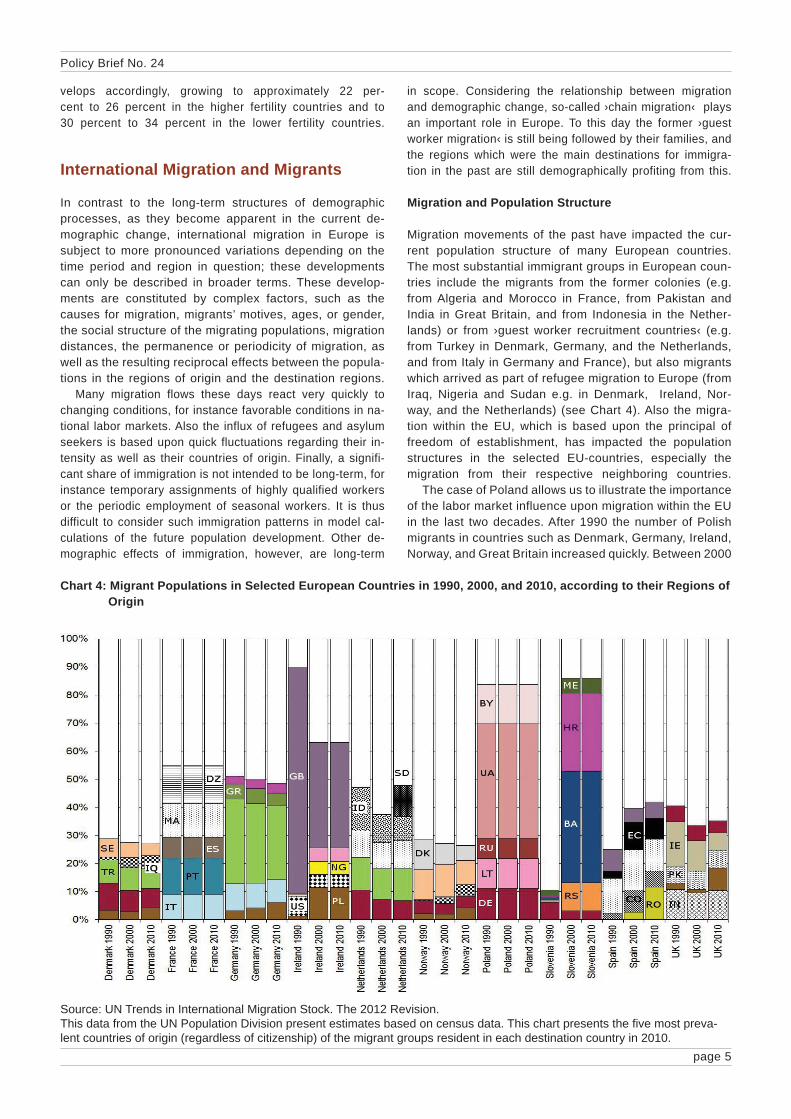
Migration movements of the past have impacted the cur-rent population structure of many European countries. The most substantial immigrant groups in European coun-tries include the migrants from the former colonies (e.g. from Algeria and Morocco in France, from Pakistan and India in Great Britain, and from Indonesia in the Nether-lands) or from ›guest worker recruitment countries‹ (e.g. from Turkey in Denmark, Germany, and the Netherlands, and from Italy in Germany and France), but also migrants which arrived as part of refugee migration to Europe (from Iraq, Nigeria and Sudan e.g. in Denmark, Ireland, Nor-way, and the Netherlands) (see Chart 4). Also the migra-tion within the EU, which is based upon the principal of freedom of establishment, has impacted the population structures in the selected EU-countries, especially the migration from their respective neighboring countries.
The case of Poland allows us to illustrate the importance of the labor market influence upon migration within the EU in the last two decades. After 1990 the number of Polish migrants in countries such as Denmark, Germany, Ireland, Norway, and Great Britain increased quickly. Between 2000
Chart 4: Migrant Populations in Selected European Countries in 1990, 2000, and 2010, according to their Regions of Origin
Source: UN Trends in International Migration Stock. The 2012 Revision.This data from the UN Population Division present estimates based on census data. This chart presents the fi ve most preva-lent countries of origin (regardless of citizenship) of the migrant groups resident in each destination country in 2010.
page 6
Policy Brief No. 24
and 2010 the emigration to other EU countries dwindled. Due to the positive economic development during this time period, Poland had even become a destination country for immigration, especially from other eastern European states. A comparable development can be seen in Spain, which had long been an emigration country (e.g. during the ›guest worker phase‹). Especially between 2000 and 2010 the immigration from Romania, but also from North Africa and Latin America, increased substantially. In the latest economic crisis these migration flows have in part changed considerably; however, the selected data sources do not yet permit scientific analysis of these newer developments.
4
Integration and Reproductive Behavior
For the German case, the relationship between interna-tional migration and population development can be ob-
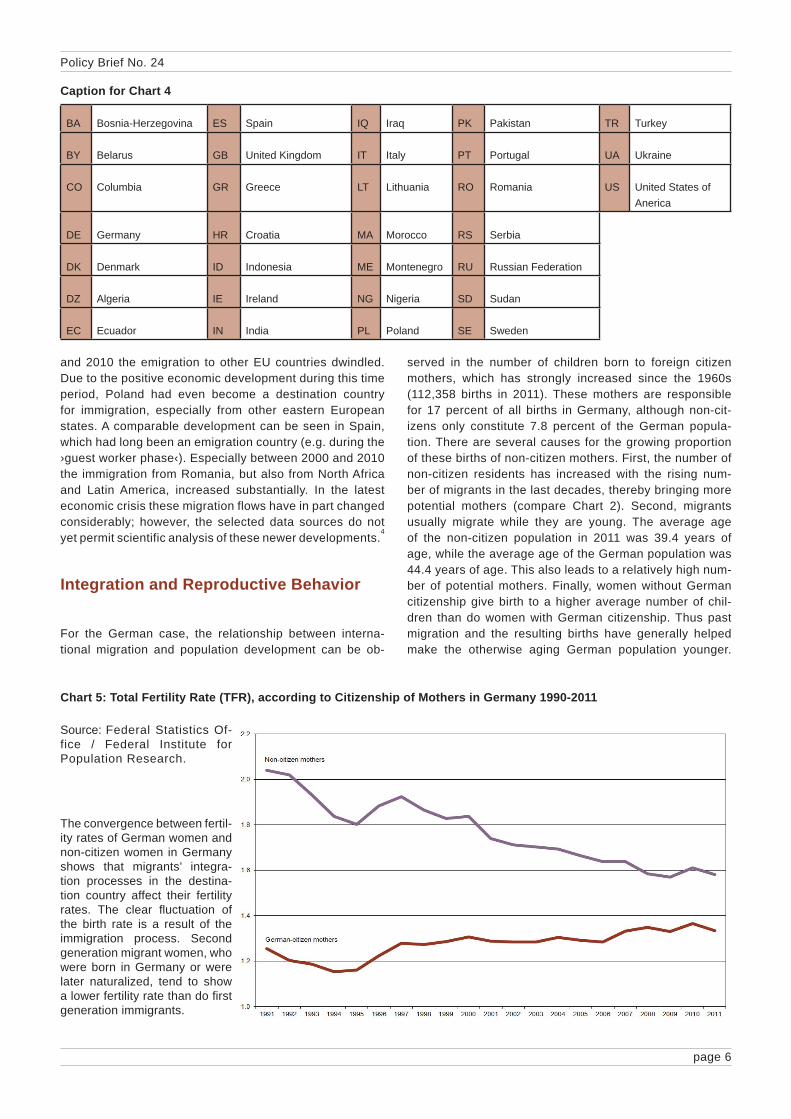
served in the number of children born to foreign citizen mothers, which has strongly increased since the 1960s (112,358 births in 2011). These mothers are responsible for 17 percent of all births in Germany, although non-cit-izens only constitute 7.8 percent of the German popula-tion. There are several causes for the growing proportion of these births of non-citizen mothers. First, the number of non-citizen residents has increased with the rising num-ber of migrants in the last decades, thereby bringing more potential mothers (compare Chart 2). Second, migrants usually migrate while they are young. The average age of the non-citizen population in 2011 was 39.4 years of age, while the average age of the German population was 44.4 years of age. This also leads to a relatively high num-ber of potential mothers. Finally, women without German citizenship give birth to a higher average number of chil-dren than do women with German citizenship. Thus past migration and the resulting births have generally helped make the otherwise aging German population younger.
Chart 5: Total Fertility Rate (TFR), according to Citizenship of Mothers in Germany 1990-2011
Source: Federal Statistics Of-fice / Federal Institute for Population Research.
The convergence between fertil-ity rates of German women and non-citizen women in Germany shows that migrants’ integra-tion processes in the destina-tion country affect their fertility rates. The clear fl uctuation of the birth rate is a result of the immigration process. Second generation migrant women, who were born in Germany or were later naturalized, tend to show a lower fertility rate than do fi rst generation immigrants.
Caption for Chart 4
BA Bosnia-Herzegovina ES Spain IQ Iraq PK Pakistan TR Turkey
BY Belarus GB United Kingdom IT Italy PT Portugal UA Ukraine
CO Columbia GR Greece LT Lithuania RO Romania US United States of Anerica
DE Germany HR Croatia MA Morocco RS Serbia
DK Denmark ID Indonesia ME Montenegro RU Russian Federation
DZ Algeria IE Ireland NG Nigeria SD Sudan
EC Ecuador IN India PL Poland SE Sweden
Policy Brief No. 24
page 7
Processes of Adaptation
However, a comparison of the total fertility rates suggests that in the course of integration processes, the fertility of non-citizen women in Germany draws nearer to that of German women. In 1990 the average fertility of women with foreign citizenship was 2.04 children, compared to 1.26 children for German women (see Chart 5). By 2011, this difference had decreased significantly: the average number of births of non-citizen mothers was 1.58, as op-posed to 1.33 births for women with a German passport. The higher birth rates among migrants are usually attrib-uted to the higher av-erage number of births in their countries of origin. It is assumed that the longer they live in Germany, the more they adapt their family planning and fertility level to fit the ideals and conditions of the host country. However, for newly immigrating women one should consid-er that also in most countries of origin the total fertility rate has dropped considerably.
A closer analysis of the causes for different fertility levels among women of different migration generations and of different re-gions of origin shows that the higher fertility of migrants often has to do with a lower socio-economic status and with less formal education. As is also the case with Ger-man women, a higher socio-economic status and a higher level of education lead to lower fertility levels. However, this research does not currently give conclusive evidence regarding the important demographic question, whether or not a longer period of residence would lead non-citizen women or their children to adapt their family planning and fertility levels to that of the German population, or whether some immigrant groups would continue to have a higher level of fertility. Nonetheless, one can generally observe that high education levels and good integration in the labor market, which is demanded of them for economic reasons, actually reduce the positive effects that immigration has in countering demographic aging and population decline.5
Migration Policy and Demographic Effects
The discussion on restricting immigration had a strong impact on political debates concerning migration in Eu-rope, especially during periods with substantial increases
in the number of refugees and asylum seekers, as was the case in the 1990s. These days, however, EU countries are talking more about immigration’s contribution in cop-ing with demographic change. An UN analysis of migra-tion policies shows that in 2011 only a few countries in Europe explicitly claim that the level of immigration is too high and needs to be reduced. This is the case in Den-mark, Great Britain, Croatia, France, and the Netherlands. Other countries – especially in Eastern Europe – favor an increase in immigration. An important role is played by highly qualified migrants; most countries would like to in-crease this immigration. This even applies to the above
Chart 6: Population Balance in Selected European Countries per 1,000 Residents in 1950, 2010, and 2060
Source: UN World Population Prospects. The 2012 Revision, model assumes constant fertility. The chosen model calculation from the UN Population Division assumes constant fertility rates, a further increase in life expectancy, and a long-term decline in migration balances to about half of the cur-rent levels.
mentioned countries which generally aim to reduce im-migration, with the exception of Great Britain. One needs to consider, however, that the countries of origin out of which most highly qualified migrants come, are usually the same countries that are interested in such immigrants.
The young populations in many threshold and devel-oping countries are facing decreased fertility levels too, which will lead to declining population growth and de-mographic aging in the future. The competition for high-ly qualified immigrants reflects the demographic future in Europe: aging and future birth deficits in almost all countries will result in the increased importance of im-migration for labor markets and social security systems.
6
Immigration and Population Development
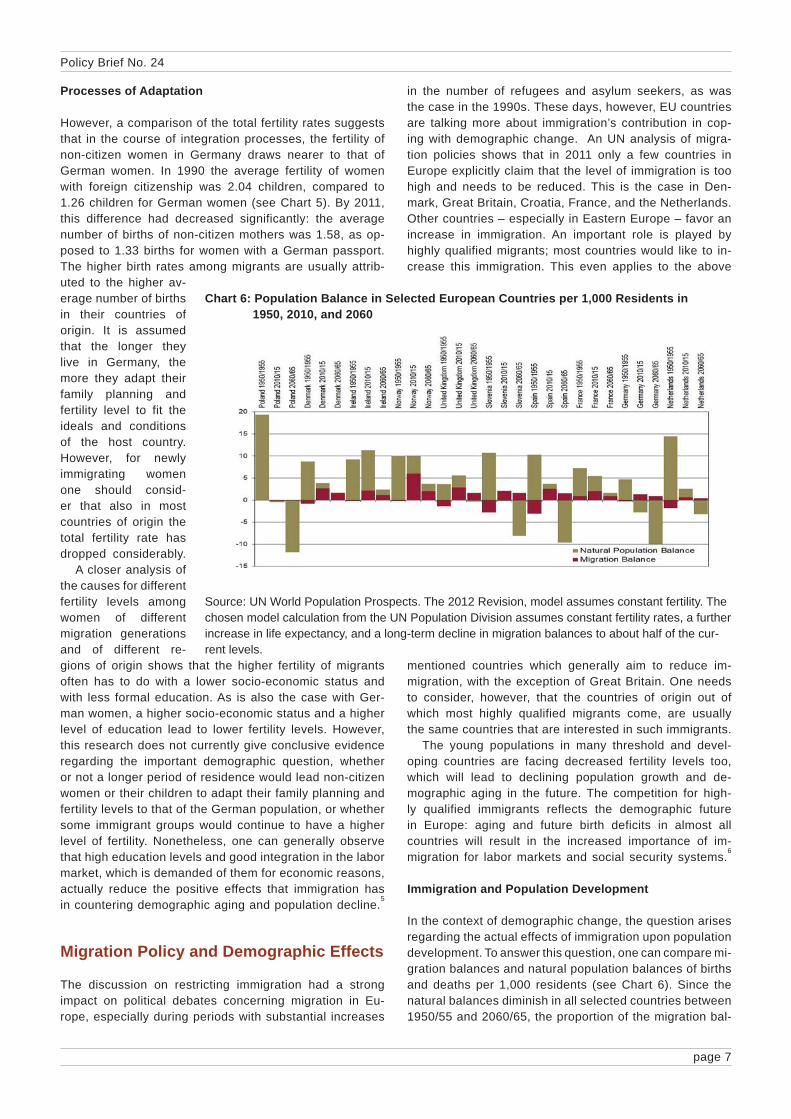
In the context of demographic change, the question arises regarding the actual effects of immigration upon population development. To answer this question, one can compare mi-gration balances and natural population balances of births and deaths per 1,000 residents (see Chart 6). Since the natural balances diminish in all selected countries between 1950/55 and 2060/65, the proportion of the migration bal-
Policy Brief No. 24
page 8
reside in the destination country, along with the fact that also immigrants get older, population losses can only be compensated if net immigration constantly increases.For Germany the necessary migration balance to maintain a constant population size would have to reach 430,000 by 2050. In order to maintain a constant size in the labor population, there would have to be at maximum of 900,000 new immigrants per year by 2025/30. For a constant ra-tio between the working population and retired persons, the migration balance would have to be four million per year by 2050 with a maximum in 2025/2030 of over five million. For France the necessary migration balance is lower; by 2015/20 the immigration would have to reach 90,000 to maintain the size of the general population and 210,000 to maintain the size of the labor population. How-ever, even in France the migration balance would have to increase dramatically in order to maintain a constant ratio between the labor population and retired persons: by 2050 it would have to reach over three million per year. The entire immigration between 1995 and 2050 would con-stitute more than 180 million in Germany and 90 million in France in order to maintain a constant ratio between the labor population and the retired population. Since the necessary migration balance to achieve this balance is so high, it is clear that these countries cannot only look to immigration to counteract the aging trend in their societies.7
ance increases relative to the entire population balance. With the exception of those countries with a relatively high fertility rate (Ireland, France, the Netherlands), in all these countries migration balance contributes more to popula-tion development than the natural balance between births and deaths does. For those countries with low fertility and a negative natural balance (Poland and Slovenia), these losses are still being compensated by immigration. One exception is Germany; UN estimates suggest that between 2010 and 2015 immigration to Germany will be lower than Germany’s negative natural balance. By 2060/65 this will also apply to Poland, Slovenia, Spain, and the Netherlands.
›Replacement Migration‹
In a model calculation from 2001 the UN analyzed how high immigration levels have to be in order to compen-sate for specific demographic changes in the population (›replacement migration‹). For Germany (with a strong birth deficit) and France (with a fertility rate almost at the replacement fertility rate) these model calculations show that immigration can indeed compensate the de-cline, e.g. of the population size, under certain condi-tions; however this is not a long-term solution to cope with the aging of the population. Due to a diminishing mother generation caused by low fertility in combination with the decreasing fertility of migrants the longer they
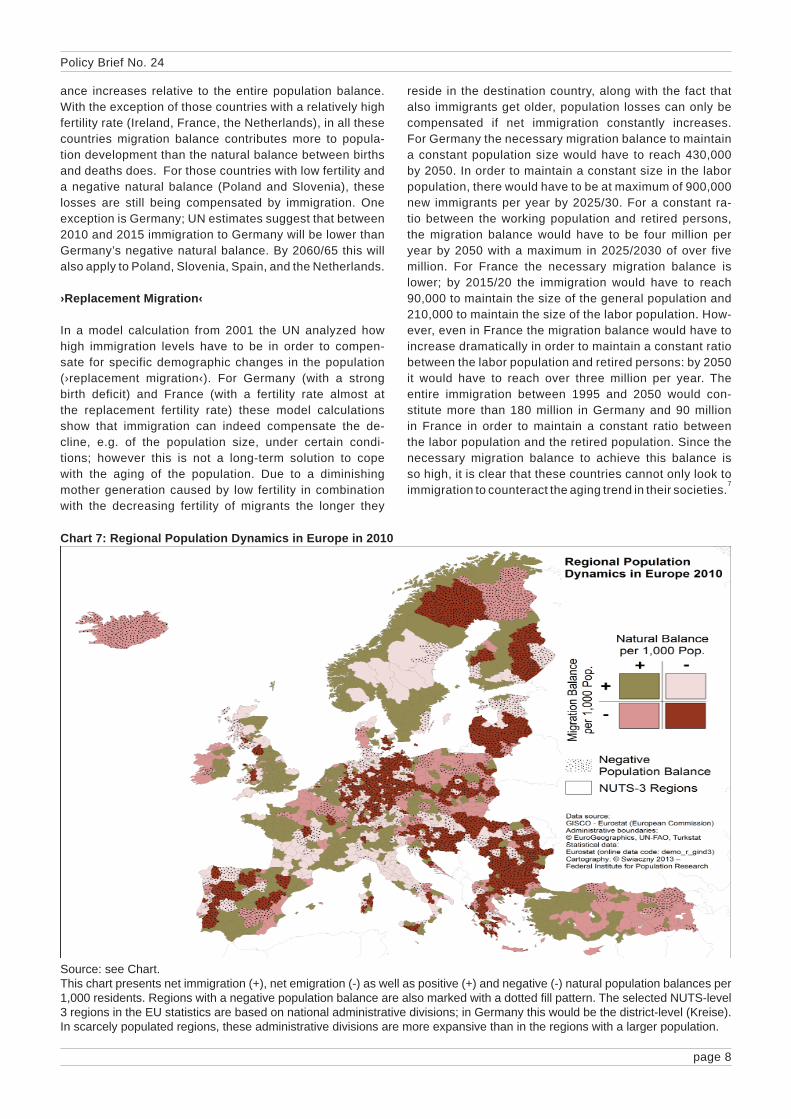
Chart 7: Regional Population Dynamics in Europe in 2010
Source: see Chart.This chart presents net immigration (+), net emigration (-) as well as positive (+) and negative (-) natural population balances per 1,000 residents. Regions with a negative population balance are also marked with a dotted fi ll pattern. The selected NUTS-level 3 regions in the EU statistics are based on national administrative divisions; in Germany this would be the district-level (Kreise). In scarcely populated regions, these administrative divisions are more expansive than in the regions with a larger population.
Regional Patterns of Demographic Change
An analysis of the demographic change and of the mi-gration balances taking place in smaller regional areas (NUTS-level 3, comparable to the districts (Kreise) in Germany) shows that even in countries which still have a positive population balance overall, the population in specific regions may already be shrinking (see Chart 7). Negative population balances (presented with a dotted fill pattern in the map) extend from Greece in the South through wide regions of Eastern Europe and the Baltic states through the peripheral regions in Finland and the north of Sweden. A population decline can also be seen in peripheral regions in southern Italy and on the Iberian Pen-insula, in some regions in central France and the Ardennes, as well as on the British west coast. Furthermore, due to low fertility levels and already pronounced demographic aging, large parts of Germany and Austria are also affected.
Winners and Losers
These regional differences are constituted by the variations in both natural population balances and migration balances, the latter including not only foreign migration, but also the often more relevant inter-regional migration within a coun-try. The map presents the combination of these indicators according to four groups: positive natural balance and posi-tive migration balance (highlighted in green), negative natu-ral balance and negative migration balance (highlighted in red), positive natural balance and negative migration bal-ance (highlighted in dark pink), and negative natural balance and positive migration balance (highlighted in light pink).
If one compares the spatial distribution of the regions with a negative natural balance (light pink and red) to the total fertility rates, the life expectancies at birth, and the age struc-tures of the populations, which could not be shown here, it becomes clear that the regional differences of fertility and life expectancy within the individual countries are relatively small (with the exception of Turkey). These alone cannot complete-ly explain the differences in natural population development. However, low or negative natural balances do correlate with an above-average proportion of older people in the general population. What also plays a role in this development is the effect of long-lasting emigration of young people in the past.
Regions with positive natural balances are usually in coun-tries where the fertility is generally relatively high or where the decline of births had started late. Also the regions which had had above average immigration of young people in the past show an especially positive natural population development.Analyzing the regional migration patterns, two general trends with positive migration balances (green and light pink) become apparent. The main areas able to profit from immigration have been the urban regions with a high pop-ulation density and the regions in their direct vicinity. One exception is France as well as some parts of Scandinavia. In France, the migrants mainly tend to move to the South and the West, and the rural areas benefit from this. In Scandinavia net immigration per 1,000 residents is mainly to be found in regions with a very low population density.
Net emigration (red and dark pink) is mostly focused in regions with low economic strength and high unemploy-ment, as is the case in almost all of Eastern Europe. In Germany, one can observe that neighboring regions can often develop very different immigration gains and losses. The map clearly shows the immigration winners (light pink) to be the urban centers and the surrounding regions (Ham-burg, Berlin, Rhine-Ruhr metropolitan region, Upper Rhine/Rhine-Main, Munich), as well as some of the mid-size cit-ies. The rural and in particular the peripheral districts, especially in eastern Germany and in the central high-lands regions in the West suffered from emigration (red).
The people who migrate to economically attractive re-gions are generally younger people with an above-average education; this also applies to foreign and domestic migra-tion. Thus, immigration not only contributes to intensify-ing economic differences. The immigration and emigration of young women also strengthens the spatial differences for the natural population development in the mid-term. If population aging and decline, together with low population density, lead to worse future prospects for employment and quality of life, then this could develop into a push-factor contributing to further emigration. In short, migration pro-cesses tend to intensify the already existing demograph-ic and economic disparities among the various regions.
Regional planning and regional development have aimed thus far to prevent further diverging trends among these regions. However, the question facing Germany in the fu-ture will be whether or not the established regional planning concepts will still be useful in dealing with the described future population processes of aging and declining popula-tions in an increasing number of regions. With its high birth deficit, Germany is a forerunner in this general European trend; this map only captures a snapshot in this process.
If the birth rates in the European regions remain low in the future, then the decline in natural population balances will lead to birth deficits in ever more regions. This means that immigration gains will be of growing importance for all regions in the long-term. While there is already an in-creasing competition among several countries for highly qualified workers, it can be expected that the competition for young and educated immigrants will also intensify among the different regions within countries. The spatial compo-nent will therefore play an especially critical role in cop-ing with the challenges of demographic change in Europe.
Notes
1 Source: The Federal Statistical Offi ce.2 Source: The Federal Statistical Offi ce (2009).3 Source: UN (2013b).4 For more information concerning this development see the short
dossier ›Does the Crisis Make People Move? EU Internal Migration and Economic Disparities in Europe‹ available at: http://www.bpb.de/gesellschaft/migration/dossier-migration/157032/eu-internal-migration (accessed on 12 September 2013).
5 Data source: The Federal Statistical Offi ce.6 Data source: UN (2013a).7 Data source: UN (2001).
Policy Brief No. 24
page 9
References and Further Readings
Bucher, Hansjörg/Mai, Ralf (2006), Bevölkerungss-chrumpfung in den Regionen Europas, Zeitschrift für Bev-ölkerungswissenschaft, Vol. 31, No. 3-4,pp. 311–344.• Castles, Stephen/Miller, Mark J. (2009), The Age of Migration,
4th edition, New York: Palgrave Macmillan.• Champion, Anthony G. (1994), International Migration and De-
mographic Change in the Developed World, Urban Studies, Vol. 31, No. 4-5,pp. 653–677 [doi:10.1080/0040989420080621].
• Cwerner, Saulo B. (2001), The Times of Migration, Journal of Ethnic and Migration Studies, Vol. 27, pp. 7-36.
• Gans, Paul/Kemper, Franz-Josef (eds.) (2001), Nationalatlas Bundesrepublik Deutschland, Vol. 4: Bevölkerung, Heidelberg, Berlin: Spektrum Akademischer Verlag.
• Goldstein, Joshua R./Sobotka, Tomas/Jasilioniene, Aiva (2009), The End of ›Lowest-Low‹ Fertility, Population and De-velopment Review, Vol. 35, No. 4, pp. 663–699.
• Haug, Sonja (2000), Klassische und neuere Theorien der Mi-gration, Arbeitspapiere - Mannheimer Zentrum für Europäische Sozialforschung, No. 30, Mannheim: MZES.
• King, Russel (2002), Towards a New Map of European Migra-tion, International Journal of Population Geography, Vol. 8, No. 2, pp. 89-106.
• King, Russell (2010), The Atlas of Human Migration, London: Earthscan.
• Marschalck, Peter (1989), Bevölkerungsgeschichte Deutsch-lands im 19. und 20. Jahrhundert, Frankfurt am Main: Suhrkamp.
• Massey, Douglas S. et al. (1993), Theories of International Mi-gration, Population and Development Review, Vol. 19, No. 3, pp. 431–466.
• Oeppen, Jim/Vaupel, James W. (2002), Broken Limits to the Life Expectancy, Science, Vol. 296, No. 5570, pp. 1029–1031.
• Preston, Samuel H./Heuveline, Patrick/Guillot, Michel (2001), Demography, Oxford: Blackwell.
• Salt, John (1989), A Comparative Overview of International Trends and Types, 1950-1980, International Migration Review, No. 23, pp. 431–456.
• Schmid, Susanne/Kohls, Martin (2011), Generatives Verhalten und Migration, BAMF Forschungsbericht No. 10. Nürnberg: BAMF.
• Statistisches Bundesamt (2009), Bevölkerung Deutschlands bis 2060. 12. Koordinierte Bevölkerungsvorausberechnung. Wiesbaden: StBA.
• Swiaczny, Frank (2006), ‘Internationale Wanderung als globales Phänomen und seine Auswirkungen auf den demographisch-en Wandel in den Industrieländern’, in Haug, Sonja/Swiaczny, Frank (eds.), Neue Zuwanderergruppen in Deutschland, Ma-terialien zur Bevölkerungswissenschaft, No. 118. Wiesbaden: Bundesinstitut für Bevölkerungsforschung, pp. 127–157.
• Swiaczny, Frank (2010), Implications of Demographic Change for Civil Society in Germany, Journal of Population Research, Vol. 27, No. 3, pp. 193–211.
• Swiaczny, Frank (2011), ‘Low Fertility in Europe - Consequenc-es of the Demographic Change as a Policy Issue’, in Cho, Lee-Jay/Kim, Yongha (eds.), Low Fertility and Aging Populations in Northeast Asia, Seoul/Honolulu: KIHASA/NAEF, pp. 105–120.
• Swiaczny, Frank/Graze, Philip/Schlömer, Claus (2008), Spatial Impacts of Demographic Change in Germany, Zeitschrift für Bevölkerungswissenschaft, Vol. 33, No. 2, pp. 181–205.
• Swiaczny, Frank/Milewski, Nadja (2012), ‘Internationalisier-ung der Migration und demographischer Wandel’, in Köppen, Bernhard et al. (eds.), Internationalsierung, Schriftenreihe der Deutschen Gesellschaft für Demographie, No. 5, Norderstedt: Books on Demand, pp. 11–41.
• Swiaczny, Frank/Sauer, Lenore/Henning, Sabine (2007), Inter-national Migration in the Mediterranean, Europa Regional, Vol. 15, No. 2, pp. 99–109.
• UN (2001), Replacement Migration, New York: UN.• UN (2012), Trends in International Migration Stock, POP/DB/
MIG/Stock/Rev.2012, New York: UN.• UN (2013a), International Migration Policies 2013, New York: UN.• UN (2013b), World Population Prospects. The 2012 Revision,
New York: UN.• van de Kaa, Dirk (1987), Europe‘s Second Demographic Tran-
sition, Population Bulletin, Vol. 42, No. 1, pp. 1–55.• Woods, Robert (1982), Theoretical Population Geography,
London, New York: Longman.
Glossary
(Demographic) Aginga shift in the population such that the older age groups grow in size relative to the younger age groups. This leads to a rise in the average age in the population.
Birth cohortsthe part of the population which was born in the same year or the same years.
Birth ratebirths per 1,000 residents. When calculating the natural population balance per 1,000 residents, the mortality rate is subtracted from the birth rate.
Demographic changecollective name for the demographic effects attributed to changes in the birth and mortality rates. For industrialized countries, this refers to the aging of the population and pos-sibly a population decline resulting from low fertility and high life expectancy.
Demographic inertiathe time lag between changing demographic processes, e.g. decreasing fertility, and the point when the effects of these processes are experienced. The effects of a decline in fertility will not be felt in the labor market until after twenty years, when the respective, smaller birth cohorts reach the employment age.
Demographic Transitiona theoretical assumption regarding a typical historical tran-sition sequence from high birth and mortality rates to low birth and mortality rates. During the transition the population growth rises initially, but then falls back to a low level. This simplified model is based on past observations made in the current industrialized countries.
Policy Brief No. 24
page 10
Policy Brief No. 24
Publishers: Institute for Migration Research and Intercultural Studies (IMIS) of the University of Osnabrück, Neuer Graben 19/21,49069 Osnabrück, Germany, Phone: +49 (0)541 969 4384, Fax: +49 (0)541 969 4380, Email: [email protected]
German Agency for Civic Education (bpb), 53113 Bonn, office in Berlin, Friedrichstraße 50, 10117 Berlin, Germany;with the collaboration of Network Migration in Europe e.V. Editorial staff: Vera Hanewinkel, Apl. Prof. Dr. Jochen Oltmer (head)Editorial assistance: Kristina Jäger
focus Migration country profiles (ISSN 1864-6220) and policy briefs (ISSN 1864-5704) are produced by the above-namedcooperation partners. The information contained in these publications does not necessarily reflect the opinions of the publishers.Partial reproduction and citation are authorized, provided the source is acknowledged.
Further online resources: www.bpb.de, www.imis.uni-osnabrueck.de, www.migration-info.de, www.network-migration.orgOur country profiles and policy briefs are available online at: www.bpb.de
ABOUT FOCUS MIGRATION
About the author
Frank Swiaczny is senior research fellow at the Federal Institute for Population Research in Wiesbaden and man-aging editor of Comparative Population Studies. From 2000 till 2012 he was head of the research group Migration-In-tegration-Minorities of the German Demographic Society (DGD). At the Federal Institute for Population Research he is responsible for research and policy advice on demogra-phy and world population issues. His focus of work also cov-ers, inter alia, population geography and migration studies.Email: [email protected]
Fertilitylevel of procreation of a population. The level of fertility can be measured, for instance, in births per 1,000 residents (birth rate) or in the number of children per woman (total fertility rate).
Life expectancy (at birth)a hypothetical measure for how long a person will probably live if born in a particular year, assuming that as this per-son ages, he or she will have the same probability of dying that people have at that age today.
Migration balancethe difference between immigration and emigration. Mortality ratethe number of deaths per 1,000 residents. When calculat-ing the natural population balance per 1,000 residents, the mortality rate is subtracted from the birth rate.
Natural population balance (or natural balance)the difference between births and deaths.
Person with an immigrant background (in Germany)all immigrants who have lived in the current German Fed-eral Republic since 1949, as well as all non-citizens born in Germany, and all Germans with at least one parent who was an immigrant or born in Germany as a non-citizen (the Federal Statistical Office’s definition in the context of mi-cro-census analysis).
Population processespopulations change according to their births and deaths as well as their immigration and emigration. These factors are interdependent and follow short-term and long-term trends in reaction to changing conditions.
Population balancesum of natural and migration balance. The basic equation for population is: population in the following year = popula-
tion in the current year plus births minus deaths plus im-migration minus emigration.
Replacement fertility ratethe number of births necessary in order to completely re-place the parent generation. A prerequisite is an average of one daughter per mother. Since not all newborns reach adulthood, the replacement fertility rate depends upon the mortality rate and actually demands more than one daugh-ter. Measured by the total fertility rate, the replacement fertility rate in modern industrialized countries is approxi-mately 2.1 births on average (boys and girls combined).
Selective migrationa higher possibility that a particular population group will migrate than others. Young and educated people tend to migrate more often.
Total fertility rate (TFR)a hypothetical measure indicating how many children a woman will have during her reproductive phase, assuming that over this timespan in each year she will have the same probability of giving birth as women have at the respective age today.