Embed Size (px)
Citation preview
DEMOGRAPHIC RESEARCHA peer-reviewed, open-access journal of population sciences
DEMOGRAPHIC RESEARCH
VOLUME 35, ARTICLE 5, PAGES 117–138PUBLISHED 20 JULY 2016http://www.demographic-research.org/Volumes/Vol35/5/DOI: 10.4054/DemRes.2016.35.5
Research Article
Spatial attraction in migrants’ settlementpatterns in the city of Catania
Angelo Mazza
Antonio Punzo
c© 2016 Angelo Mazza & Antonio Punzo.
This open-access work is published under the terms of the CreativeCommons Attribution NonCommercial License 2.0 Germany, which permitsuse, reproduction & distribution in any medium for non-commercialpurposes, provided the original author(s) and source are given credit.See http://creativecommons.org/licenses/by-nc/2.0/de/

Contents
1 Introduction 118
2 Methodology 1202.1 Spatial inhomogeneity and spatial dependence 1202.2 The inhomogeneous K-function 1202.3 Confounding between spatial inhomogeneity and spatial attraction 1212.4 Inferential framework 122
3 Foreign migration in the city of Catania 122
4 Migrant settlement patterns in the city of Catania 1254.1 Estimate of spatial intensities 1254.2 Estimate of the spatial attraction 128
5 Conclusions 132
References 134

Demographic Research: Volume 35, Article 5
Research Article
Spatial attraction in migrants’ settlement patterns in the city ofCatania
Angelo Mazza1
Antonio Punzo2
Abstract
BACKGROUNDIn broad terms, and apart from ethnic discriminatory rules enforced in some places and atsome times, residential segregation may be ascribed both to economic inhomogeneitiesin the urban space (e.g., in the cost of rents, or in occupation opportunities) and to spatialattraction among individuals sharing the same group identity and culture.
OBJECTIVETraditional indices of spatial segregation do not distinguish between these two sources ofclustering. Furthermore, they typically rely on census tracts, a scale that does not allowfor fine-grained analysis. Also, the use of alternative zoning often leads to conflictingresults. The aim of this paper is to measure spatial attraction among groups of foreignmigrants in Catania (Italy) using individual household data.
METHODSWe apply a version of Ripley’s K-function specially conceived for assessing spatial at-traction while adjusting for the effects of spatial inhomogeneity. To avoid the risk ofconfounding the two sources of clustering, spatial inhomogeneity is estimated followinga case-control approach.
RESULTSDifferent parts of the city exhibit different suitabilities for migrants of different nation-alities, with groups mainly involved in housekeeping and caregiving being more spreadthan the ones specialized in peddling and retailing. A significant spatial attraction hasbeen found for Sri Lankan, Mauritians, Senegalese, and Chinese. Conversely, the settle-ment patterns of Tunisians and Moroccans comply with random allocation. These results
1 Department of Economics and Business, University of Catania, Corso Italia, 55, 95128 Catania, Italy.Tel. (39) 0957537736, E-Mail: [email protected] Department of Economics and Business, University of Catania, Corso Italia, 55, 95128 Catania, Italy.Tel. (39) 0957537640, E-Mail: [email protected].
http://www.demographic-research.org 117
Mazza & Punzo: Spatial attraction in migrants’ settlement patterns in the city of Catania
seem consistent with the hypothesis of a relevant correlation between chain migration andspatial attraction.
1. Introduction
Residential location influences individuals’ proximity to important resources (such asschools, hospitals, child care facilities, labor markets, and employment opportunities)and to potential risks, including environmental threats and social hazards (such as ex-posure to crime and violence) (Reardon 2006). Furthermore, it impacts access to socialnetworks and other forms of social capital; overall, it shapes human interaction and thedemographic processes that originate from it, such as mortality, fertility and mobility(Almquist and Butts 2012).
A minority ethnic group is spatially clustered when the spatial arrangement of minor-ity households departs from expectations based upon a random spatial allocation (Free-man, Pilger, and Alexander 1971).
In broad terms, and apart from ethnic discriminatory rules enforced by law or tra-ditions in some places and at some times, we may distinguish between two sources ofspatial clustering. One source is spatial inhomogeneity or apparent contagion. Typically,the different parts of a city exhibit large variations in the price of residential property, inthe accessibility of low cost public infrastructures, and in the availability of certain typesof jobs; these inhomogeneities may lead to a mostly economically induced segregation.As Schelling (1971) observes, ethnicity is often correlated with income, and income withresidence; so even if residential choices were unconstrained by ethnic discrimination, thedifferent ethnic groups would not be randomly distributed among residences.
The second source is spatial attraction or true contagion. Survey data on the idealneighborhood composition for different ethnic groups in the USA, reported in Clark andFossett (2008), show that all groups prefer living in areas where their group is a majorityor near-majority. These preferences have complex origins and may reflect attachment togroup identity and culture (e.g., language, religion, customs, etc.). Newly arrived minor-ity migrants may benefit from positive spillovers in settling close to their compatriots, interms of reciprocal acceptance, common language, and support. Transnational social net-works play an important role in channeling arriving migrants into specific neighborhoodsand also into particular occupations (Gelderblom and Adams 2006).
However, regardless of what the basis of the individual preferences for coethniccontact is, they produce identical patterns of residential segregation (Clark and Fossett2008). The Schelling (1971) model provides an analysis of the implications of individualpreferences and shows that when a household enters a neighborhood, that neighborhoodbecomes more attractive to members of the household’s own group and less attractive to
118 http://www.demographic-research.org
Demographic Research: Volume 35, Article 5
members of other groups. In other words, the presence of a household in a given areaincreases the probability of others of the same group to locating nearby.
It is relevant in social research to be able to distinguish between these two sourcesof clustering. Whereas economic induced segregation might explain some initial degreeof segregation and raises questions of social equity, the Schelling model highlights theimportance of individually motivated segregation and posits that even mild preferencesfor living with similar neighbors carry the potential of being strong determinants for res-idential segregation (Clark and Fossett 2008).
The spatial distribution of households may be represented by a point pattern, i.e.,a set of points in a map. Ripley’s K-function (Ripley 1981) is widely used to detectclustering in point processes. The inhomogeneous K-function is a version of Ripley’sK-function conceived for assessing the effects of spatial attraction (or inhibition), whileadjusting for the effects of spatial inhomogeneity. In other words, this approach allows usto distinguish between the two sources of clustering, by assessing clustering above andbeyond that due to apparent contagion.
Traditional studies of segregation rely on data aggregated by areal units, typicallycensus tracts. However, analysis at the scale of the tract is unable to take into account geo-graphic proximity at the level of the individual household and social scientists have begunto recognize the importance of the individual level analysis (Kumar 2007; Almquist andButts 2012; Matthews and Parker 2013; Kumar, White, and Singh 2013). Furthermore,alternative zoning or a different scale often yields different results. This “modifiable areaunit problem” is a well-known issue (Openshaw 1984, Wong 2009). In contrast, the K-function provides an explicitly spatial approach and an egocentric measure of clusteringthat takes into account questions of proximity as well as scale.
Although information on individual locations are often not available, for reasons ofboth privacy and administrative costs, simulation techniques may be used. Almquist andButts (2012) propose point process models that can be used to effectively simulate thelocation of individual households. Also Kumar, White, and Singh (2013) use census tractdata to simulate point locations to compute segregation indexes at finer spatial resolution.
In this paper we propose the use of the inhomogeneous K-function (Baddeley,Møller, and Waagepetersen 2000) to study spatial attraction in the household locationsof some groups of foreign migrants in the city of Catania (Italy). The paper is organizedas follows. Section 2 illustrates the methodological framework and in Section 3 a shortoutline on foreign migration inflows in the city of Catania is given. In Section 4 spa-tial inhomogeneity is estimated following a case-control approach; observed explanatoryvariables related to population density and rent cost per square meter are used. Then, theinhomogeneous K-function, is computed. Conclusions are given in Section 5.
http://www.demographic-research.org 119
Mazza & Punzo: Spatial attraction in migrants’ settlement patterns in the city of Catania
2. Methodology
2.1 Spatial inhomogeneity and spatial dependence
The spatial distribution of households may be represented by a point pattern, i.e. a set ofpoints in a map, where each point corresponds to the location of a single event. The useof the term “event” has become standard in spatial analysis, as a means of distinguishingthe location of an observation (a household location in our case) from any other arbitrarylocation within the study region R.
The homogeneous Poisson process (HPP) is the simplest theoretical model of spatialpoint pattern. In this model, the number of events N(U) in any region U ⊆ R follows aPoisson distribution with mean
E[N(U)] = |U |λ
proportional to the area |U | of U , where λ denotes the intensity of the process, whichis assumed to be constant over R. Furthermore, in HPPs the number of events in non-overlapping sub-regions are independent random variables, thus there are no interactionsamong the events.
In applications, the HPP is often used as a benchmark model; the logic is that ifa point pattern is completely random, then there is nothing “interesting” happening; inother words, the HPP is used as the “null model” of a statistical analysis (Baddeley 2010).However, population and its associated socio-economic and demographic attributes varysignificantly across the geographic space and the constant intensity of the HPP is notsuitable for representing the spatial distribution of the human phenomena (Kumar, White,and Singh 2013).
The inhomogeneous point process (IPP) is a generalization of the HPP obtained byreplacing the constant intensity λ with a spatially varying intensity function λ (u); so, wehave
E[N(U)] =
∫U
λ(u)du.
An IPP typically exhibits more variation in the location of events than the HPP does;clustered patterns occur, with regions where intensities are higher, receiving a highernumber of events.
2.2 The inhomogeneous K-function
Ripley’s K-function, usually denoted with K (d), is widely used to detect clustering (orinhibition) in point processes with constant intensity; at every spatial distance d, λK(d)is the expected number of additional points of the process X located in a circle of radius
120 http://www.demographic-research.org
Demographic Research: Volume 35, Article 5
d surrounding an arbitrary event x. The K-function is commonly used in testing for HPP,and its asymptotic distributions under simple point process models are known (Heinrich1991; Ripley 1981).
Baddeley, Møller, and Waagepetersen (2000) generalized Ripley’s K-function tonon-homogeneous point processes, by weighting each event x by w = 1/λ (x). Theinhomogeneous K-function is defined as
Kinhom (d) = E
[∑x∈X
1
λ (x)1 (0 < ‖u− x‖ ≤ d)
∣∣∣∣ u ∈ X
], (1)
where ‖u− x‖ is the Euclidean distance between events u and x and 1(·) is the indicatorfunction. Note that if λ(u) is constant across space, Kinhom (d) reduces to the usual K(d)function.
For estimating Kinhom, Baddeley and Turner (2000) proposed the estimator
Kinhom(d) =1
|R|∑i
∑j 6=i
1 (‖xi − xj‖ ≤ d)λ(xi)λ(xj)
e(xi,xj ; d), (2)
where e(xi,xj ; d) is an edge correction weight (Ripley 1991, p. 22), and λ(u) is anestimate of the intensity function λ(u).
2.3 Confounding between spatial inhomogeneity and spatial attraction
In real cases, clusters are most often generated by the joint action of both spatial inhomo-geneity and spatial attraction. To distinguish between these two sources of clustering ischallenging, as many spatial processes are “equifinal” and hence unidentifiable (Harvey1966), i.e., one realization of a point process may be consistent with underlying pro-cesses involving clustering due to either spatial inhomogeneity or spatial attraction, asdemonstrated in Bartlett (1963).
The risk of confounding the two sources of clustering is a fundamental limitation onthe scope of statistical inference from a spatial point pattern, assuming we have access toonly a single realization of the underlying process (Diggle et al. 2007; Baddeley 2010;Baddeley, Rubak, and Turner 2015) .
Diggle et al. 2007 outline three possible solutions. One is to assume a parametricmodel for the intensity, as in Møller and Waagepetersen (2003). Another is to assumethat the effects of spatial inhomogeneity operate on a larger spatial scale than the effectsof spatial attraction, thus allowing separation of the two. A third solution is applicablein case-control studies. In these studies, data consist of a realization of two spatial pointprocesses, one representing cases of a condition of interest and the other representing
http://www.demographic-research.org 121
Mazza & Punzo: Spatial attraction in migrants’ settlement patterns in the city of Catania
controls drawn at random from the population at risk. Assuming that the size of the pop-ulation at risk tends to infinity and the sampling fraction to zero, the controls constitutea realization of an IPP with intensity λ∗(u); the cases form a second, independent, pointprocess – which may or may not be a Poisson process – with intensity λ(u). The ques-tion of interest is whether the cases form an IPP with intensity proportional to that of thecontrols, i.e., λ(u) = ρλ∗(u), or whether they exhibit additional spatial structure. Diggleet al. (2007) propose that the ratio between the intensity functions may be modeled todepend on a vector of m spatially referenced covariates z(u) = (z1(u), . . . , zm(u))′, i.e.
λ(u) = λ∗ (u) f (z(u);θ) , (3)
where f(·) is any nonnegative function, either nonlinear parametric with parameters θas in (3), or nonparametrically specified. Note that within this approach, the estimate ofλ(u) depends on the case locations only through the values z(u) of the covariates at thoselocations, a feature that is critical in separating heterogeneity from clustering of the casepoint process (Diggle et al. 2007).
2.4 Inferential framework
Generally, only Kinhom(d), the estimated counterpart of Kinhom(d), is known and, to testthe usual null hypothesis of absence of spatial interaction, a proper inferential frameworkneeds to be introduced.
Because the exact distribution of Kinhom is unknown, to obtain the distributionalinformation needed, in the following we will consider Monte Carlo simulations fromthe null hypothesis. Roughly speaking, given n replications of the fitted IPP, a differentvalue, say Kj
inhom (d), j = 1, . . . ,n, may be computed for each replication. Pointwiseconfidence envelopes
L(d) = K(k)inhom(d)
U(d) = K(n−k)inhom (d)
of size α = 2k/(n + 1) are obtained, where K(k)inhom(d) denotes the k-th order statistic.
Observed values of Kinhom(d) falling, for some value of d, outside the envelopes indicatea significant departure from the null hypothesis at level α.
3. Foreign migration in the city of Catania
Towards the end of the 1970s, Catania started to become the destination of migrationinflows coming from the poorest countries, with immigrants usually looking for domes-
122 http://www.demographic-research.org
Demographic Research: Volume 35, Article 5
tic work, catering, peddling and low qualification services. Migrants’ work fulfilled astructural demand for cheap, flexible, and often off-the-books unprotected labor, a typeof work that natives tend to avoid, even if unemployed.
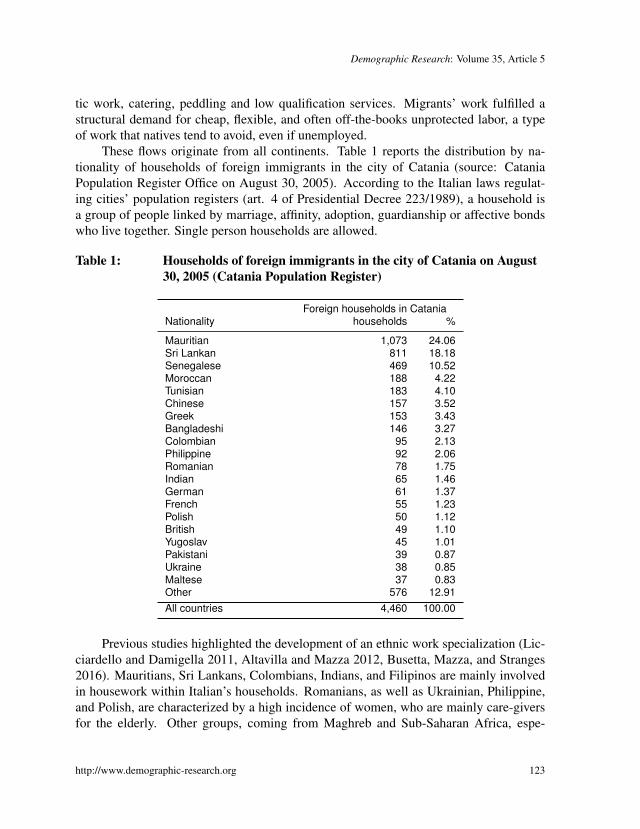
These flows originate from all continents. Table 1 reports the distribution by na-tionality of households of foreign immigrants in the city of Catania (source: CataniaPopulation Register Office on August 30, 2005). According to the Italian laws regulat-ing cities’ population registers (art. 4 of Presidential Decree 223/1989), a household isa group of people linked by marriage, affinity, adoption, guardianship or affective bondswho live together. Single person households are allowed.
Table 1: Households of foreign immigrants in the city of Catania on August30, 2005 (Catania Population Register)
Foreign households in CataniaNationality households %
Mauritian 1,073 24.06Sri Lankan 811 18.18Senegalese 469 10.52Moroccan 188 4.22Tunisian 183 4.10Chinese 157 3.52Greek 153 3.43Bangladeshi 146 3.27Colombian 95 2.13Philippine 92 2.06Romanian 78 1.75Indian 65 1.46German 61 1.37French 55 1.23Polish 50 1.12British 49 1.10Yugoslav 45 1.01Pakistani 39 0.87Ukraine 38 0.85Maltese 37 0.83Other 576 12.91All countries 4,460 100.00
Previous studies highlighted the development of an ethnic work specialization (Lic-ciardello and Damigella 2011, Altavilla and Mazza 2012, Busetta, Mazza, and Stranges2016). Mauritians, Sri Lankans, Colombians, Indians, and Filipinos are mainly involvedin housework within Italian’s households. Romanians, as well as Ukrainian, Philippine,and Polish, are characterized by a high incidence of women, who are mainly care-giversfor the elderly. Other groups, coming from Maghreb and Sub-Saharan Africa, espe-
http://www.demographic-research.org 123
Mazza & Punzo: Spatial attraction in migrants’ settlement patterns in the city of Catania
cially males from Tunisia, Morocco, and Senegal perceive housework as “female” anddegrading, and prefer to work as street vendors. They sell different types of – most of-ten fake branded – goods, such as handbags, sunglasses, jewelry, and other inexpensiveseasonal objects, along streets in the central shopping district, at open-air markets, at ma-jor road intersections and, in summer, along the nearby beaches. Finally, Chinese aremostly employed in import-export business and retailing. Such specializations, given thedifferent logistic needs related to the occupational typologies and given the different inte-gration possibilities, have favored the differentiation of the spatial distribution (Altavillaand Mazza 2012).
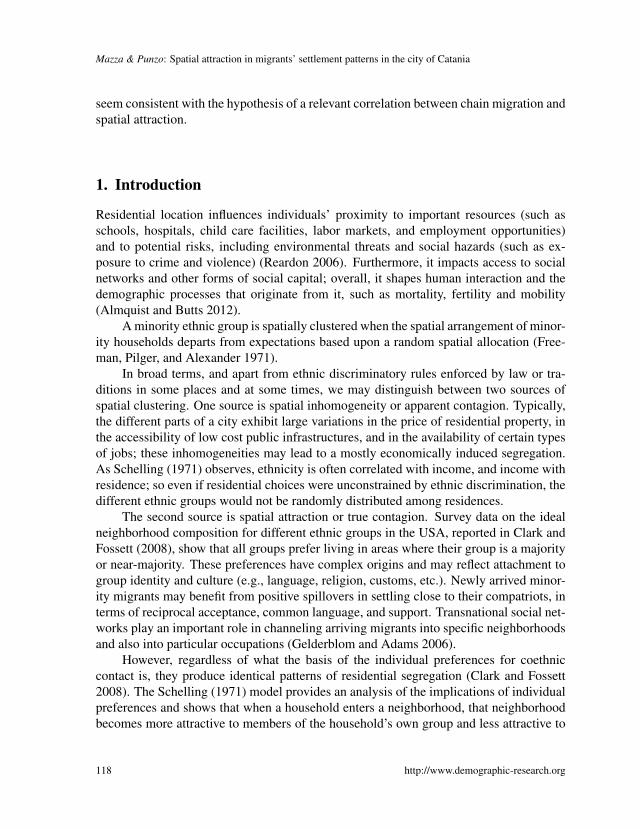
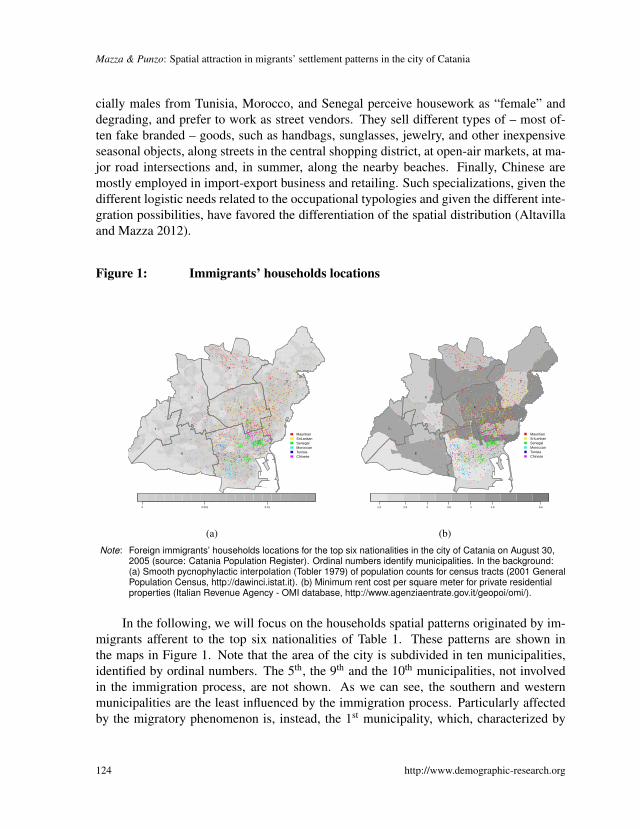
Figure 1: Immigrants’ households locations
MauritianSriLankanSenegalMoroccanTunisiaChinese
8
7
3
2
4
1
6
0 0.001 0.01
(a)
MauritianSriLankanSenegalMoroccanTunisiaChinese
8
7
3
2
4
1
6
1.9 2.5 3 3.5 4 4.5 5.6
(b)
Note: Foreign immigrants’ households locations for the top six nationalities in the city of Catania on August 30,2005 (source: Catania Population Register). Ordinal numbers identify municipalities. In the background:(a) Smooth pycnophylactic interpolation (Tobler 1979) of population counts for census tracts (2001 GeneralPopulation Census, http://dawinci.istat.it). (b) Minimum rent cost per square meter for private residentialproperties (Italian Revenue Agency - OMI database, http://www.agenziaentrate.gov.it/geopoi/omi/).
In the following, we will focus on the households spatial patterns originated by im-migrants afferent to the top six nationalities of Table 1. These patterns are shown inthe maps in Figure 1. Note that the area of the city is subdivided in ten municipalities,identified by ordinal numbers. The 5th, the 9th and the 10th municipalities, not involvedin the immigration process, are not shown. As we can see, the southern and westernmunicipalities are the least influenced by the immigration process. Particularly affectedby the migratory phenomenon is, instead, the 1st municipality, which, characterized by
124 http://www.demographic-research.org
Demographic Research: Volume 35, Article 5
a heterogeneous urban fabric, comprises the city’s historic and political-administrativecenter and hosts the central business district as well as the largest outdoor market of thecity, where native Italians and immigrants share the same space to sell their goods. Theremaining areas, in the north portion of the 1st Municipality, for the most part host themiddle or middle-high classes; they are mainly buildings erected in the 1950s and 1960s,characterized by decent multi-level apartment blocks and by higher building densities.
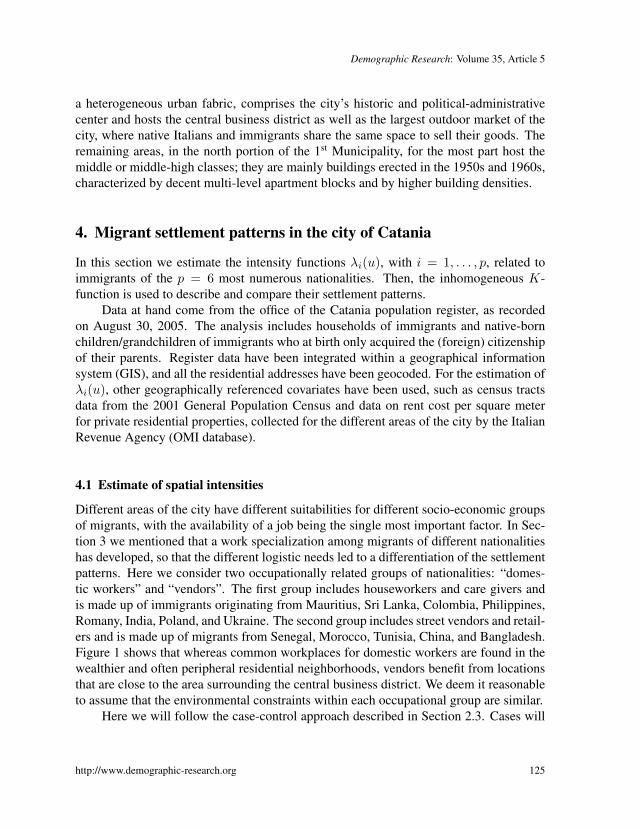
4. Migrant settlement patterns in the city of Catania
In this section we estimate the intensity functions λi(u), with i = 1, . . . , p, related toimmigrants of the p = 6 most numerous nationalities. Then, the inhomogeneous K-function is used to describe and compare their settlement patterns.
Data at hand come from the office of the Catania population register, as recordedon August 30, 2005. The analysis includes households of immigrants and native-bornchildren/grandchildren of immigrants who at birth only acquired the (foreign) citizenshipof their parents. Register data have been integrated within a geographical informationsystem (GIS), and all the residential addresses have been geocoded. For the estimation ofλi(u), other geographically referenced covariates have been used, such as census tractsdata from the 2001 General Population Census and data on rent cost per square meterfor private residential properties, collected for the different areas of the city by the ItalianRevenue Agency (OMI database).
4.1 Estimate of spatial intensities
Different areas of the city have different suitabilities for different socio-economic groupsof migrants, with the availability of a job being the single most important factor. In Sec-tion 3 we mentioned that a work specialization among migrants of different nationalitieshas developed, so that the different logistic needs led to a differentiation of the settlementpatterns. Here we consider two occupationally related groups of nationalities: “domes-tic workers” and “vendors”. The first group includes houseworkers and care givers andis made up of immigrants originating from Mauritius, Sri Lanka, Colombia, Philippines,Romany, India, Poland, and Ukraine. The second group includes street vendors and retail-ers and is made up of migrants from Senegal, Morocco, Tunisia, China, and Bangladesh.Figure 1 shows that whereas common workplaces for domestic workers are found in thewealthier and often peripheral residential neighborhoods, vendors benefit from locationsthat are close to the area surrounding the central business district. We deem it reasonableto assume that the environmental constraints within each occupational group are similar.
Here we will follow the case-control approach described in Section 2.3. Cases will
http://www.demographic-research.org 125
Mazza & Punzo: Spatial attraction in migrants’ settlement patterns in the city of Catania
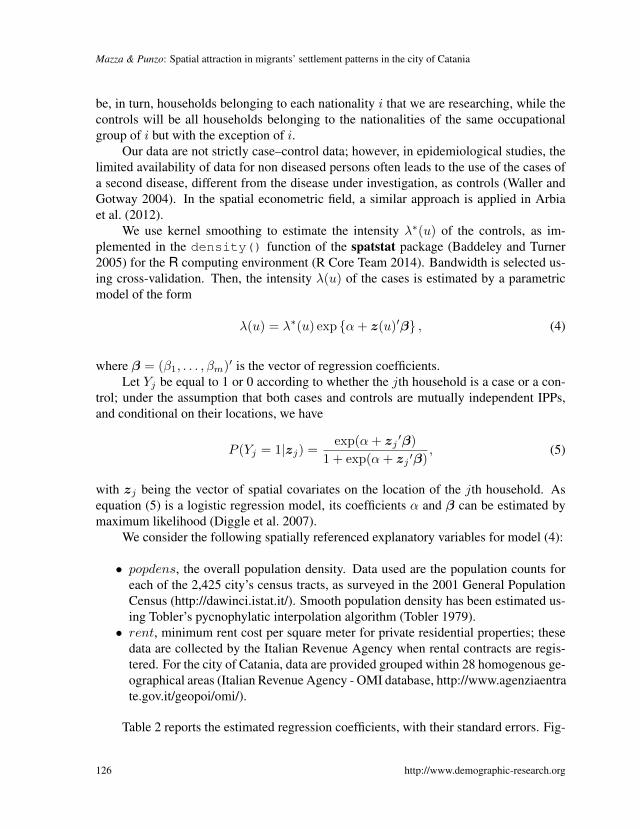
be, in turn, households belonging to each nationality i that we are researching, while thecontrols will be all households belonging to the nationalities of the same occupationalgroup of i but with the exception of i.
Our data are not strictly case–control data; however, in epidemiological studies, thelimited availability of data for non diseased persons often leads to the use of the cases ofa second disease, different from the disease under investigation, as controls (Waller andGotway 2004). In the spatial econometric field, a similar approach is applied in Arbiaet al. (2012).
We use kernel smoothing to estimate the intensity λ∗(u) of the controls, as im-plemented in the density() function of the spatstat package (Baddeley and Turner2005) for the R computing environment (R Core Team 2014). Bandwidth is selected us-ing cross-validation. Then, the intensity λ(u) of the cases is estimated by a parametricmodel of the form
λ(u) = λ∗(u) exp {α+ z(u)′β} , (4)
where β = (β1, . . . ,βm)′ is the vector of regression coefficients.Let Yj be equal to 1 or 0 according to whether the jth household is a case or a con-
trol; under the assumption that both cases and controls are mutually independent IPPs,and conditional on their locations, we have
P (Yj = 1|zj) =exp(α+ zj
′β)
1 + exp(α+ zj ′β), (5)
with zj being the vector of spatial covariates on the location of the jth household. Asequation (5) is a logistic regression model, its coefficients α and β can be estimated bymaximum likelihood (Diggle et al. 2007).
We consider the following spatially referenced explanatory variables for model (4):
• popdens, the overall population density. Data used are the population counts foreach of the 2,425 city’s census tracts, as surveyed in the 2001 General PopulationCensus (http://dawinci.istat.it/). Smooth population density has been estimated us-ing Tobler’s pycnophylatic interpolation algorithm (Tobler 1979).
• rent, minimum rent cost per square meter for private residential properties; thesedata are collected by the Italian Revenue Agency when rental contracts are regis-tered. For the city of Catania, data are provided grouped within 28 homogenous ge-ographical areas (Italian Revenue Agency - OMI database, http://www.agenziaentrate.gov.it/geopoi/omi/).
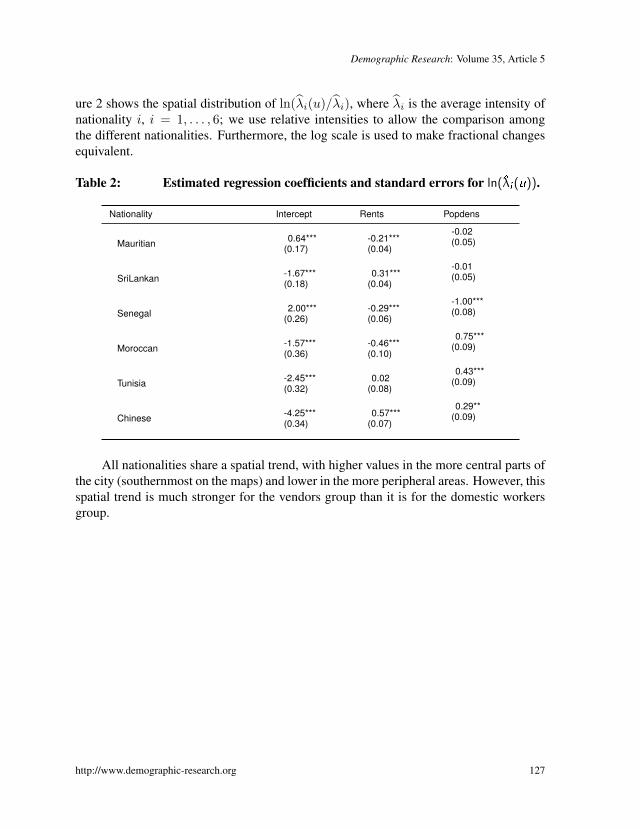
Table 2 reports the estimated regression coefficients, with their standard errors. Fig-
126 http://www.demographic-research.org
Demographic Research: Volume 35, Article 5
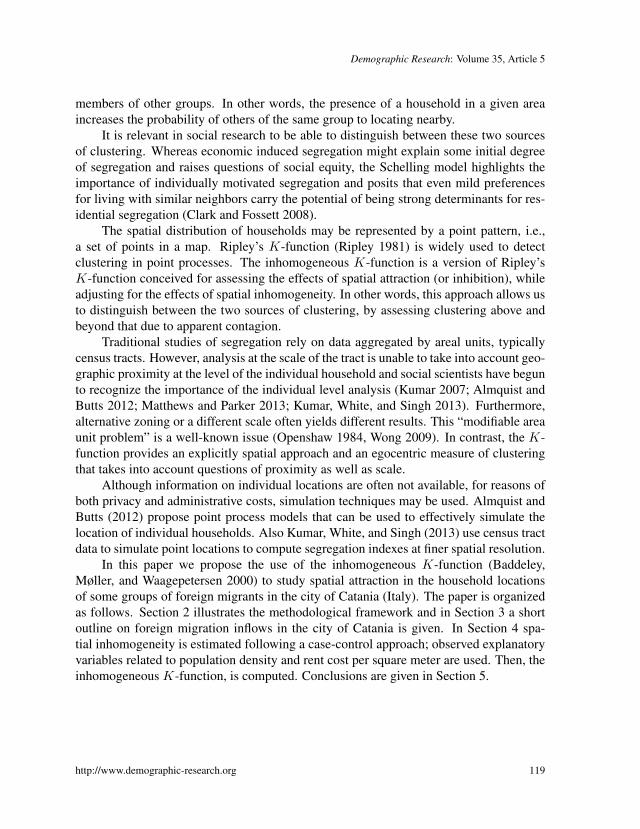
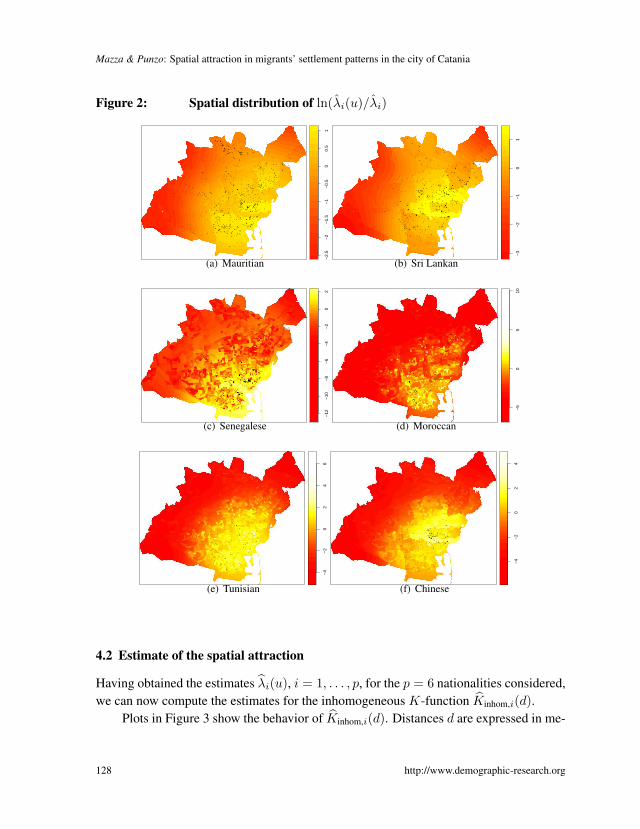
ure 2 shows the spatial distribution of ln(λi(u)/λi), where λi is the average intensity ofnationality i, i = 1, . . . , 6; we use relative intensities to allow the comparison amongthe different nationalities. Furthermore, the log scale is used to make fractional changesequivalent.
Table 2: Estimated regression coefficients and standard errors for ln(λi (u)).
Nationality Intercept Rents Popdens
Mauritian 0.64***(0.17)
-0.21***(0.04)
-0.02(0.05)
SriLankan -1.67***(0.18)
0.31***(0.04)
-0.01(0.05)
Senegal 2.00***(0.26)
-0.29***(0.06)
-1.00***(0.08)
Moroccan -1.57***(0.36)
-0.46***(0.10)
0.75***(0.09)
Tunisia -2.45***(0.32)
0.02(0.08)
0.43***(0.09)
Chinese -4.25***(0.34)
0.57***(0.07)
0.29**(0.09)
All nationalities share a spatial trend, with higher values in the more central parts ofthe city (southernmost on the maps) and lower in the more peripheral areas. However, thisspatial trend is much stronger for the vendors group than it is for the domestic workersgroup.
http://www.demographic-research.org 127
Mazza & Punzo: Spatial attraction in migrants’ settlement patterns in the city of Catania
Figure 2: Spatial distribution of ln(λi(u)/λi)
−2.
5−
2−
1.5
−1
−0.
50
0.5
1
(a) Mauritian
−3
−2
−1
01
(b) Sri Lankan
−12
−10
−8
−6
−4
−2
02
(c) Senegalese
−5
05
10
(d) Moroccan
−4
−2
02
46
(e) Tunisian
−4
−2
02
4
(f) Chinese
4.2 Estimate of the spatial attraction
Having obtained the estimates λi(u), i = 1, . . . , p, for the p = 6 nationalities considered,we can now compute the estimates for the inhomogeneous K-function Kinhom,i(d).
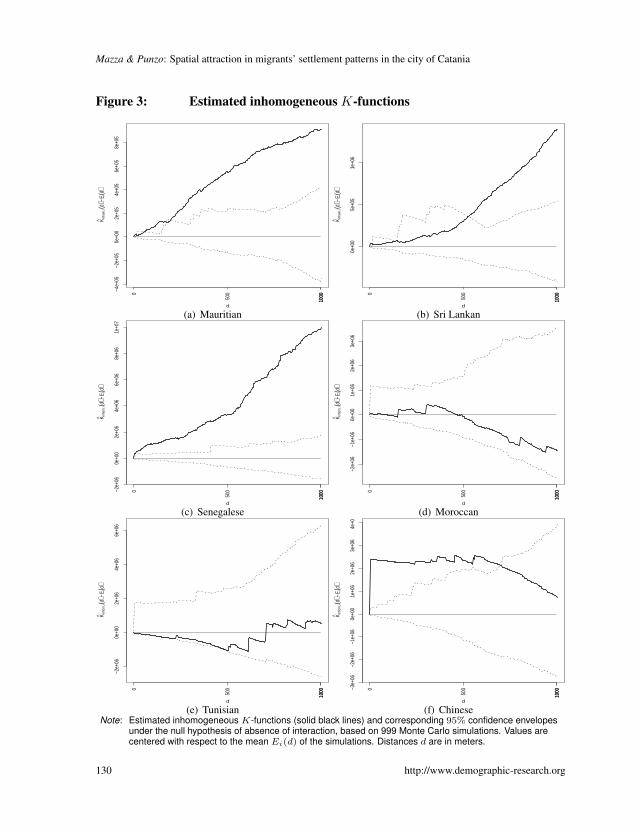
Plots in Figure 3 show the behavior of Kinhom,i(d). Distances d are expressed in me-
128 http://www.demographic-research.org

Demographic Research: Volume 35, Article 5
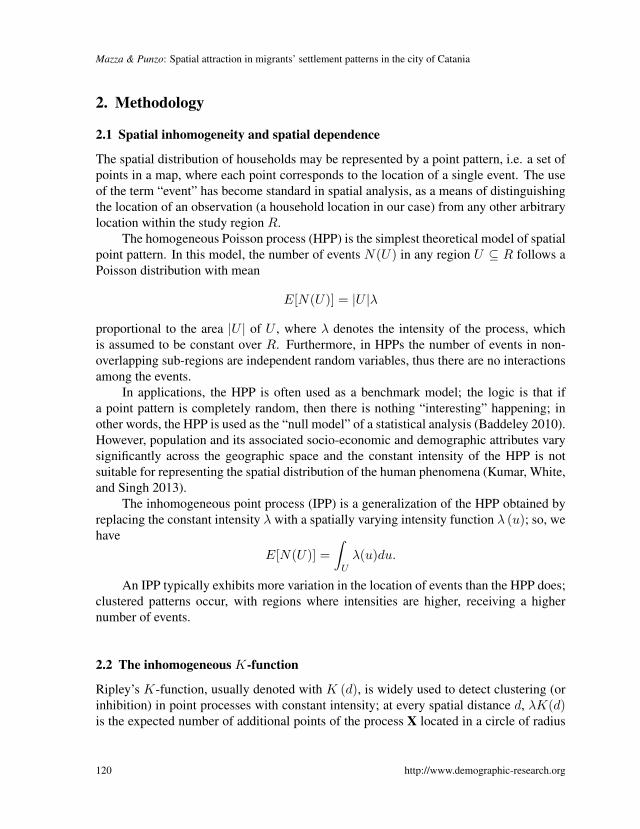
ters. Plots also report the confidence envelopes referred to the null hypothesis of absenceof interaction (see Section 2.4), at a significance level α = 0.05 and based on n = 999Monte Carlo simulations. As in Diggle et al. (2007), each simulation is obtained by ran-domly relabeling cases and controls, with spatially varying probabilities given by (5).Distances corresponding to the peaks of Kinhom,i(d) outside the envelopes are those atwhich there is significant spatial concentration or dispersion.
In Section 1 we mentioned the prominent role of social networks in attracting ar-riving migrants into specific neighborhoods and, also, channeling them into particularoccupations (Gelderblom and Adams 2006).
MacDonald and MacDonald (1964) define the process in which “prospective mi-grants learn of opportunities, are provided with transportation, and have initial accommo-dation and employment arranged by means of primary social relationships with previousmigrants” as chain migration. Chain migration subsidies the costs of migration; if thecosts of migration are low, both economically and in terms of cultural distance, we mayexpect networks to play a less important role, and hence there is more individual migra-tion. Empirical studies suggest that the willingness to help aspiring migrants is related tothe lack of assimilation of the previous migrants into the new environment and to theirdesire of reestablishing, in the new town, social ties with co-villagers and relatives; fur-thermore, the plan of moving back to their country of origin in a short time can makemigrants warier of refusing to help when approached (Banerjee 1983). So, it seems rea-sonable to expect that nationalities with stronger relational ties with the country of origin,and a more prominent intention to migrate back, may show a stronger chain migrationand higher degrees of spatial attraction.
Mauritians show a significant spatial attraction at almost all the distances considered(Figure 3). Mauritian migration in Italy is concentrated in a few southern cities, of whichCatania accounts for the highest portion, thus denoting a strong chain migration effect(King and Andall 1999). Mauritians perceive their stay in Italy as economically motivatedand temporary, with an intention to migrate back to their home country as soon as theyaccumulated enough money (Crane 2004).
Sri Lankans show a significant spatial attraction at distances greater than 500 meters.Their migration took place with the beginning of the ethnic conflict between Sinhaleseand Tamils, which started in 1983. Within Sicily, the two communities settled respec-tively in Catania and Palermo. A check in place of birth locations showed that the major-ity of Sri Lankans residing in Catania were born in the coastline region north of Colombo,in the cities of Marwila, Chilaw and Negombo, suggesting a relevant chain migration.
http://www.demographic-research.org 129
Mazza & Punzo: Spatial attraction in migrants’ settlement patterns in the city of Catania
Figure 3: Estimated inhomogeneous K-functions−4
e+05
−2e+
050e
+00
2e+0
54e
+05
6e+0
58e
+05
d
K inh
om, i(d
)−E i
(d)
0
500
1000
1000
(a) Mauritian
0e+0
05e
+05
1e+0
6
d
K inh
om, i(d
)−E i
(d)
0
500
1000
1000
(b) Sri Lankan
−2e+
060e
+00
2e+0
64e
+06
6e+0
68e
+06
1e+0
7
d
K inh
om, i(d
)−E i
(d)
0
500
1000
1000
(c) Senegalese
−2e+
06−1
e+06
0e+0
01e
+06
2e+0
63e
+06
d
K inh
om, i(d
)−E i
(d)
0
500
1000
1000
(d) Moroccan
−2e+
060e
+00
2e+0
64e
+06
6e+0
6
d
K inh
om, i(d
)−E i
(d)
0
500
1000
1000
(e) Tunisian
−3e+
06−2
e+06
−1e+
060e
+00
1e+0
62e
+06
3e+0
64e
+06
d
K inh
om, i(d
)−E i
(d)
0
500
1000
1000
(f) ChineseNote: Estimated inhomogeneous K-functions (solid black lines) and corresponding 95% confidence envelopes
under the null hypothesis of absence of interaction, based on 999 Monte Carlo simulations. Values arecentered with respect to the mean Ei(d) of the simulations. Distances d are in meters.
130 http://www.demographic-research.org
Demographic Research: Volume 35, Article 5
Senegalese show a significant interaction at any distance. Most Senegalese migrantsin Italy belong to the Mouride Sufi brotherhood, whose vertical and horizontal ties arereproduced in transnational networks, which help migrants to organize their business ac-tivities as well as their temporary settlement within the receiving contexts (Riccio 2008).Compared with other migrant communities, they show more mobility, following pathsshaped by social, kinship and religious networks (Caritas Italiana, Fondazione Migrantes,and Caritas Diocesana di Roma 2004). Proofs of these mobility paths are on the RegisterOffice database, which shows, over time, many Senegalese settling in and then leavingthe same houses.
Tunisians show a settlement pattern consistent with random allocation. They areamong the first immigrants who came to Sicily, with large communities settling in west-ern Sicily in the second half of the sixties, due to geographical proximity and maritimelinkages. Tunisians are widely distributed in Italy, with a variety of labor market rolesin different parts of Italy: mostly in the primary sector (fishing, farming) and peddlingin Sicily, in the service sector in central Italy and in factories in the north of Italy (Kingand Andall 1999). One reason for the absence of spatial attraction may be the low rele-vance of migratory chains in Tunisian migration to Sicily, which is reported to be mainlydictated by individual choice (Daly 2001, p. 193).
Moroccans’ settlement pattern is also consistent with random allocation. As Tunisians,Moroccans also are a long-established group and they are widely dispersed in Italy, withdifferent work specializations in different areas (King and Andall 1999). Moroccan mi-gration to Italy began in the mid-1970s, but levels of migration remained marginal untilthe 1980s and grew significantly in the 1990s, when Moroccans became the largest for-eign community in the country, before being overtaken by the Albanian and Romaniancommunities in recent years (Devitt 2013).
Chinese show a significant interaction at all distances less than d = 750 meters.The very high spatial attraction at lower distances might be explained with the fact thatthe most part of Chinese are settled in the buildings surrounding the open market areawhere they now run most of the stores; this area is starting being referred by the pressas a local “Chinatown”. Chang (2012, p. 181) reports Chinese migration in Italy to bea “calculated choice, made in the best interests of the family” and being characterizedby “chain migration, ethnic enclave and familial duty”. In addition to a great linguisticdistance, Chinese live rather secluded (Mazza and Punzo 2016).
More in depth studies are needed to assess the reasons of the different settlementpatterns produced by the different nationalities. However, our results seem consistentwith a relevant impact of chain migration in spatial attraction among foreign migrants.
http://www.demographic-research.org 131
Mazza & Punzo: Spatial attraction in migrants’ settlement patterns in the city of Catania
5. Conclusions
Traditional indices of spatial segregation rely on data aggregated by areal unit, typicallycensus tracts (Mazza and Punzo 2015); see Matthews and Parker (2013) for a reviewof new spatially derived techniques to analyze segregation. These indices generally suf-fer from the modifiable area unit problem and do not allow us to distinguish betweeneconomically induced segregation, typically due to spatial inhomogeneity in the cost ofliving and job availability within different parts of the city, from spatial attraction amongindividuals of the same ethnicity. Schelling (1971) pinpoints the importance of this dis-tinction, positing that even mild preferences for living with similar neighbors carry thepotential to be strong determinants for residential segregation. In the case of minoritymigrants, spatial attraction may be stronger when the cost of settling is higher, either eco-nomically or in terms of cultural distance, and social networks may play an important rolein channeling arriving migrants into specific neighborhoods and particular occupations.
We applied point-pattern analysis to analyze the settlement patterns of foreign mi-grants in the city of Catania (Italy); this approach was motivated by Almquist and Butts(2012) and Matthews and Parker (2013). We used the inhomogeneous K-function toassess spatial attraction among migrants while adjusting for spatial inhomogeneity.
To avoid the risk of confounding the two sources of clustering, spatial inhomogene-ity is estimated following a case-control approach. We considered two groups, accordingto a work specialization that has developed among nationalities: domestic workers andvendors. The first group includes nationalities devoted to house work and care giving, thesecond group nationalities committed to peddling and retailing. We deemed it reasonableto assume that the environmental constraints within each occupational group are similar.We analyzed the six nationalities with the highest number of households.
Data at hand came from the population register, as recorded on August 30, 2005,and included individual residential addresses for all foreign residents. For each of the sixnationalities analyzed, we considered the set of all the other nationalities of the same oc-cupational group as a control group. Spatial inhomogeneity has been estimated for eachnationality by means of a parametric model of the spatial intensity of the controls and twoexplanatory variables related to the overall population density and to the minimum rentcost per square meter. The spatial intensities of the controls has been estimated nonpara-metrically. All nationalities share a spatial trend, with higher values in the more centralparts of the city and in the central business district, and lower in the more peripheral ar-eas. However, this spatial trend is much stronger for the vendors group than it is for thedomestic workers group.
Finally, we computed the inhomogeneous K-function, with confidence envelopesbased on 999 Monte Carlo simulations referred to the null hypothesis of absence of in-teraction (α = 0.05). Each simulation was obtained by randomly relabeling cases andcontrols. A significant spatial attraction has been found for Sri Lankan, Mauritians, Sene-
132 http://www.demographic-research.org

Demographic Research: Volume 35, Article 5
galese, and Chinese. Conversely, the settlement patterns of Tunisians and Moroccans areconsistent with random allocation. More in depth studies are needed to assess the rea-sons of the different settlement patterns produced by the different nationalities. However,these results seem consistent with a relevant impact of chain migration in spatial attractionamong foreign migrants.
http://www.demographic-research.org 133

Mazza & Punzo: Spatial attraction in migrants’ settlement patterns in the city of Catania
References
Almquist, Z.W. and Butts, C.T. (2012). Point process models for household dis-tributions within small areal units. Demographic Research S13(22): 593–632.doi:10.4054/DemRes.2012.26.22.
Altavilla, A.M. and Mazza, A. (2012). On the analysis of immigrant settlement patternsusing quadrat counts: The case of the city of Catania (Italy). Advances and Applica-tions in Statistics 29(2): 111–123.
Arbia, G., Espa, G., Giuliani, D., and Mazzitelli, A. (2012). Clusters of firms in aninhomogeneous space: The high-tech industries in Milan. Economic Modelling 29(1):3–11. doi:10.1016/j.econmod.2011.01.012.
Baddeley, A. (2010). Analysing spatial point patterns in R. Tech. rep., CSIRO. www.csiro. au/resources/pf16h.html.
Baddeley, A.J., Møller, J., and Waagepetersen, R. (2000). Non- and semi-parametric es-timation of interaction in inhomogeneous point patterns. Statistica Neerlandica 54(3):329–350. doi:10.1111/1467-9574.00144.
Baddeley, A., Rubak, E., and Turner, R. (2015). Spatial point patterns: Method-ology and applications with R. London: Chapman and Hall/CRC Press.http://www.crcpress.com/Spatial-Point-Patterns-Methodology-and-Applications-with-R/Baddeley-Rubak-Turner/9781482210200/.
Baddeley, A. and Turner, R. (2000). Practical maximum pseudolikelihood for spa-tial point patterns. Australian and New Zealand Journal of Statistics 42: 283–322.doi:10.1111/1467-9574.00144.
Baddeley, A. and Turner, R. (2005). Spatstat: An R package for analyzing spatial pointpatterns. Journal of Statistical Software 12(6): 1–42. http://www.jstatsoft.org/v12/i06/.
Banerjee, B. (1983). Social networks in the migration process: Empirical evidence onchain migration in India. The Journal of Developing Areas 17(2): 185–196.
Bartlett, M. (1963). The spectral analysis of point processes. Journal of the Royal Statis-tical Society. Series B 25(2): 264–296.
Busetta, A., Mazza, A., and Stranges, M. (2016). Residential segregation of foreigners:an analysis of the Italian city of Palermo. Genus 71(2–3): 177–198.
Caritas Italiana, Fondazione Migrantes, and Caritas Diocesana di Roma (2004). Immi-grazione, Dossier Statistico 2004. XIV Rapporto. Rome: Idos.
Chang, A. (2012). 20th century Chinese migration to Italy: The Chinese diaspora pres-ence within European international migration. History Compass 10(2): 179–190.
134 http://www.demographic-research.org
Demographic Research: Volume 35, Article 5
doi:10.1111/j.1478-0542.2011.00833.x.
Clark, W.A. and Fossett, M. (2008). Understanding the social context of the Schellingsegregation model. Proceedings of the National Academy of Sciences 105(11): 4109–4114.
Crane, K. (2004). Governing migration: Immigrant groups’ strategies in three Italiancities – Rome, Naples and Bari. Tech. rep., Psychoanalytic Institute for Social Re-search, Rome.
Daly, F. (2001). The double passage. In: King, R. (ed.). The Mediterranean passage:Migration and new cultural encounters in Southern Europe. Liverpool: Liverpool Uni-versity Press.
Devitt, C. (2013). Circular economic migration between Italy and Morocco.In: Triandafyllidou, A. (ed.). Circular migration between Europe and itsneighbourhood: Choice or necessity? Oxford: Oxford University Press.doi:10.1093/acprof:oso/9780199674510.003.0005.
Diggle, P.J., Gomez-Rubio, V., Brown, P.E., Chetwynd, A.G., and Gooding, S. (2007).Second-order analysis of inhomogeneous spatial point processes using case-controldata. Biometrics 63(2): 550–557. doi:10.1111/j.1541-0420.2006.00683.x.
Freeman, L., Pilger, J., and Alexander, W. (1971). A measure of segregation based uponspatial arrangements. University of Hawaii.
Gelderblom, D. and Adams, W. (2006). The limits and possibilities of migrant networks.In: Kok, P., Gelderblom, D., Oucho, J.O., and Van Zyl, J. (eds.). Migration in Southand Southern Africa: Dynamics and determinants. Cape Town: HSRC Press: 227–248.
Harvey, D. (1966). Geographic processes and the analysis of point patterns: Testingmodels of diffusion by quadrat sampling. Transactions of the Institute of British Ge-ographers XL 81–95. doi:10.2307/621570.
Heinrich, L. (1991). Goodness-of-fit tests for the second moment function ofa stationary multidimensional Poisson process. Statistics 22(2): 245–268.doi:10.1080/02331889108802308.
King, R. and Andall, J. (1999). The geography and economic sociology of recent immi-gration to Italy. Modern Italy 4(2): 135–158. doi:10.1080/13532949908454826.
Kumar, N. (2007). Spatial sampling design for a demographic and health survey. Popula-tion Research and Policy Review 26(5-6): 581–599. doi:10.1007/s11113-007-9044-7.
Kumar, N., White, M.J., and Singh, G. (2013). Multi-group individual level measures ofsegregation. SSRN. http://ssrn.com/abstract=2205714.
http://www.demographic-research.org 135
Mazza & Punzo: Spatial attraction in migrants’ settlement patterns in the city of Catania
Licciardello, O. and Damigella, D. (2011). Immigrants and natives: Ways of constructingnew neighbourhoods in Catania, Sicily. In: Armbruster, H. and Meinhof, U.H. (eds.).Negotiating multicultural Europe: Borders, networks, neighbourhoods. London: Pal-grave Macmillan: 141–158. doi:10.1057/97802303464757.
MacDonald, J.S. and MacDonald, L.D. (1964). Chain migration, ethnic neighborhoodformation and social networks. The Milbank Memorial Fund Quarterly 42(1): 82–97.doi:10.2307/3348581.
Matthews, S. and Parker, D.M. (2013). Progress in spatial demography. DemographicResearch 28(10): 271–312.
Mazza, A. and Punzo, A. (2015). On the upward bias of the dissimilarity index and itscorrections. Sociological Methods and Research 44(1): 80–107.
Mazza, A. and Punzo, A. (2016). Dealing with omitted answers in a survey on socialintegration of immigrants in Italy. Mathematical Population Studies. Forthcoming.
Møller, J. and Waagepetersen, R.P. (2003). Statistical inference and simulation for spatialpoint processes. London: CRC Press.
Openshaw, S. (1984). The modifiable areal unit problem. Norwich: Geobooks.
R Core Team (2014). R: A language and environment for statistical computing. R Foun-dation for Statistical Computing, Vienna. http://www.R-project.org/.
Reardon, S.F. (2006). A conceptual framework for measuring segregation and its asso-ciation with population outcomes. In: Oakes, J. and Kaufman, J. (eds.). Methods insocial epidemiology. San Francisco: Jossey-Bass: 169–192.
Riccio, B. (2008). West African transnationalisms compared: Ghanaians andSenegalese in Italy. Journal of Ethnic and Migration Studies 34(2): 217–234.doi:10.1080/13691830701823913.
Ripley, B.D. (1981). Spatial statistics. New York: John Wiley & Sons.doi:10.1002/0471725218.
Ripley, B.D. (1991). Statistical inference for spatial processes. Cambridge: CambridgeUniversity Press.
Schelling, T.C. (1971). Dynamic models of segregation. Journal of Mathematical Soci-ology 1(2): 143–186. doi:10.1080/0022250X.1971.9989794.
Tobler, W.R. (1979). Smooth pycnophylactic interpolation for geographical re-gions. Journal of the American Statistical Association 74(367): 519–530.doi:10.1080/01621459.1979.10481647.
Waller, L.A. and Gotway, C.A. (2004). Applied spatial statistics for public health data,
136 http://www.demographic-research.org

Demographic Research: Volume 35, Article 5
vol. 368. New York: John Wiley & Sons. doi:10.1002/0471662682.
Wong, D. (2009). The modifiable areal unit problem (MAUP). In: Fotheringham, A. andRogerson, P. (eds.). The SAGE handbook of spatial analysis. London: SAGE Publica-tions: 105–123. doi:10.4135/9780857020130.n7.
http://www.demographic-research.org 137

Mazza & Punzo: Spatial attraction in migrants’ settlement patterns in the city of Catania
138 http://www.demographic-research.org