Embed Size (px)
Citation preview
Aalborg Universitet
Degradation of H3PO4/PBI High Temperature Polymer Electrolyte Membrane Fuel Cellunder Stressed Operating ConditionsZhou, Fan
Publication date:2015
Document VersionPublisher's PDF, also known as Version of record
Link to publication from Aalborg University
Citation for published version (APA):Zhou, F. (2015). Degradation of H3PO4/PBI High Temperature Polymer Electrolyte Membrane Fuel Cell underStressed Operating Conditions: Effect of Start/Stop Cycling, Impurities Poisoning and H2 Starvation. Departmentof Energy Technology, Aalborg University.
General rightsCopyright and moral rights for the publications made accessible in the public portal are retained by the authors and/or other copyright ownersand it is a condition of accessing publications that users recognise and abide by the legal requirements associated with these rights.
? Users may download and print one copy of any publication from the public portal for the purpose of private study or research. ? You may not further distribute the material or use it for any profit-making activity or commercial gain ? You may freely distribute the URL identifying the publication in the public portal ?
Take down policyIf you believe that this document breaches copyright please contact us at [email protected] providing details, and we will remove access tothe work immediately and investigate your claim.
Downloaded from vbn.aau.dk on: juni 14, 2018
DEGRADATION OF H3PO4/PBI HIGH
TEMPERATURE POLYMER ELECTROLYTE
MEMBRANE FUEL CELL UNDER STRESSED
OPERATING CONDITIONS
EFFECT OF START/STOP CYCLING, IMPURITIES POISONING AND H2 STARVATION
by
Fan Zhou
Dissertation submitted to the Faculty of Engineering and Science in partial
fulfilment of the requirements for the degree of
Philosophiae Doctor (Ph.D.)
Aalborg University
Department of Energy Technology
Aalborg, Denmark
Thesis submitted: August 5, 2015
PhD supervisor: Prof. SØREN KNUDSEN KÆR,
Aalborg University
Assistant PhD supervisor: Associate Prof. SØREN JUHL ANDREASEN,
Aalborg University
PhD committee: Professor Thomas J. Schmidt,
ETH Zürich & Paul Scherrer Institute
Professor Qingfeng Li,
Technical University of Denmark
Associate Professor Henrik Sørensen,
Aalborg University
PhD Series: Faculty of Engineering and Science, Aalborg University
ISSN: xxxx- xxxx
ISBN: xxx-xx-xxxx-xxx-x
Published by:
Department of Energy Technology
Pontoppidanstræde 101
DK – 9220 Aalborg Ø
© Copyright by Fan Zhou
Printed in Denmark by UniPrint, 2015
I
Title: Degradation of H3PO4/PBI High Temperature Polymer Electrolyte
Membrane Fuel Cell under Stressed Operating Conditions: Effect of Start/Stop
Cycling, Impurities Poisoning and H2 Starvation
Ph.D. Student: Fan Zhou
Supervisor: Søren Knudsen Kær
Co-supervisor: Søren Juhl Andreasen
List of publications:
Paper 1: Zhou F, Araya SS, Grigoras IF, Andreasen SJ, Kær SK. Performance
Degradation Tests of Phosphoric Acid Doped Polybenzimidazole Membrane Based
High Temperature Polymer Electrolyte Membrane Fuel Cells. Journal of Fuel Cell
Science and Technology. 2015;12:021002(1)-(9).
Paper 2: Zhou F, Andreasen SJ, Kær SK, Yu D. Analysis of accelerated
degradation of a HT-PEM fuel cell caused by cell reversal in fuel starvation
condition. International Journal of Hydrogen Energy. 2015;40:2833-9.
Paper 3: Zhou F, Andreasen SJ, Kær SK. Experimental study of cell reversal of a
high temperature polymer electrolyte membrane fuel cell caused by H2 starvation.
International Journal of Hydrogen Energy. 2015;40:6672-80.
Paper 4: Zhou F, Andreasen SJ, Kær SK, Park JO. Experimental investigation of
carbon monoxide poisoning effect on a PBI/H3PO4 high temperature polymer
electrolyte membrane fuel cell: influence of anode humidification and carbon
dioxide. International Journal of Hydrogen Energy. 2015;40:14932-41.
Paper 5: Simon Araya S, Grigoras IF, Zhou F, Andreasen SJ, Kær SK.
Performance and endurance of a high temperature PEM fuel cell operated on
methanol reformate. International Journal of Hydrogen Energy. 2014;39:18343-50.
This present report combined with the above listed scientific papers has been
submitted for assessment in partial fulfilment of the PhD degree. The scientific
papers are not included in this version due to copyright issues. Detailed publication
information is provided above and the interested reader is referred to the original
published papers. As part of the assessment, co-author statements have been made
available to the assessment committee and are also available at the Faculty of
Engineering and Science, Aalborg University.

II
III
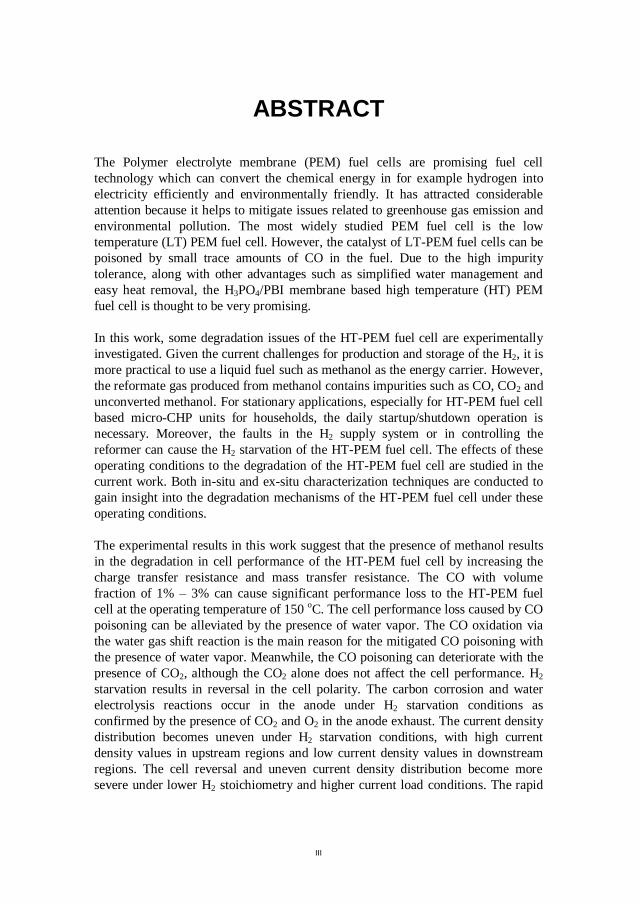
ABSTRACT
The Polymer electrolyte membrane (PEM) fuel cells are promising fuel cell
technology which can convert the chemical energy in for example hydrogen into
electricity efficiently and environmentally friendly. It has attracted considerable
attention because it helps to mitigate issues related to greenhouse gas emission and
environmental pollution. The most widely studied PEM fuel cell is the low
temperature (LT) PEM fuel cell. However, the catalyst of LT-PEM fuel cells can be
poisoned by small trace amounts of CO in the fuel. Due to the high impurity
tolerance, along with other advantages such as simplified water management and
easy heat removal, the H3PO4/PBI membrane based high temperature (HT) PEM
fuel cell is thought to be very promising.
In this work, some degradation issues of the HT-PEM fuel cell are experimentally
investigated. Given the current challenges for production and storage of the H2, it is
more practical to use a liquid fuel such as methanol as the energy carrier. However,
the reformate gas produced from methanol contains impurities such as CO, CO2 and
unconverted methanol. For stationary applications, especially for HT-PEM fuel cell
based micro-CHP units for households, the daily startup/shutdown operation is
necessary. Moreover, the faults in the H2 supply system or in controlling the
reformer can cause the H2 starvation of the HT-PEM fuel cell. The effects of these
operating conditions to the degradation of the HT-PEM fuel cell are studied in the
current work. Both in-situ and ex-situ characterization techniques are conducted to
gain insight into the degradation mechanisms of the HT-PEM fuel cell under these
operating conditions.
The experimental results in this work suggest that the presence of methanol results
in the degradation in cell performance of the HT-PEM fuel cell by increasing the
charge transfer resistance and mass transfer resistance. The CO with volume
fraction of 1% – 3% can cause significant performance loss to the HT-PEM fuel
cell at the operating temperature of 150 oC. The cell performance loss caused by CO
poisoning can be alleviated by the presence of water vapor. The CO oxidation via
the water gas shift reaction is the main reason for the mitigated CO poisoning with
the presence of water vapor. Meanwhile, the CO poisoning can deteriorate with the
presence of CO2, although the CO2 alone does not affect the cell performance. H2
starvation results in reversal in the cell polarity. The carbon corrosion and water
electrolysis reactions occur in the anode under H2 starvation conditions as
confirmed by the presence of CO2 and O2 in the anode exhaust. The current density
distribution becomes uneven under H2 starvation conditions, with high current
density values in upstream regions and low current density values in downstream
regions. The cell reversal and uneven current density distribution become more
severe under lower H2 stoichiometry and higher current load conditions. The rapid

IV
decay in cell performance during a H2 starvation degradation test reveals that the H2
starvation can cause severe damage to the HT-PEM fuel cell. The degradation
under H2 starvation conditions occur in the catalyst layer, mainly in the anode,
while the membrane is not affected. The carbon corrosion in the anode and
consequently the decrease in ECSA is the main reason for the degradation under H2
starvation conditions.
The results obtained in this work help to understand and mitigate the degradation of
HT-PEM fuel cell.
V
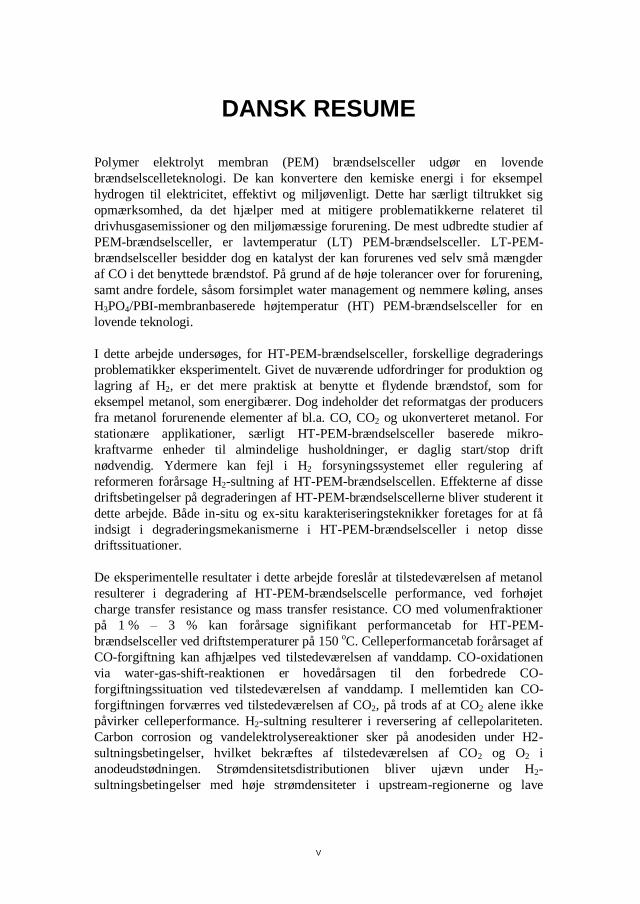
DANSK RESUME
Polymer elektrolyt membran (PEM) brændselsceller udgør en lovende
brændselscelleteknologi. De kan konvertere den kemiske energi i for eksempel
hydrogen til elektricitet, effektivt og miljøvenligt. Dette har særligt tiltrukket sig
opmærksomhed, da det hjælper med at mitigere problematikkerne relateret til
drivhusgasemissioner og den miljømæssige forurening. De mest udbredte studier af
PEM-brændselsceller, er lavtemperatur (LT) PEM-brændselsceller. LT-PEM-
brændselsceller besidder dog en katalyst der kan forurenes ved selv små mængder
af CO i det benyttede brændstof. På grund af de høje tolerancer over for forurening,
samt andre fordele, såsom forsimplet water management og nemmere køling, anses
H3PO4/PBI-membranbaserede højtemperatur (HT) PEM-brændselsceller for en
lovende teknologi.
I dette arbejde undersøges, for HT-PEM-brændselsceller, forskellige degraderings
problematikker eksperimentelt. Givet de nuværende udfordringer for produktion og
lagring af H2, er det mere praktisk at benytte et flydende brændstof, som for
eksempel metanol, som energibærer. Dog indeholder det reformatgas der producers
fra metanol forurenende elementer af bl.a. CO, CO2 og ukonverteret metanol. For
stationære applikationer, særligt HT-PEM-brændselsceller baserede mikro-
kraftvarme enheder til almindelige husholdninger, er daglig start/stop drift
nødvendig. Ydermere kan fejl i H2 forsyningssystemet eller regulering af
reformeren forårsage H2-sultning af HT-PEM-brændselscellen. Effekterne af disse
driftsbetingelser på degraderingen af HT-PEM-brændselscellerne bliver studerent it
dette arbejde. Både in-situ og ex-situ karakteriseringsteknikker foretages for at få
indsigt i degraderingsmekanismerne i HT-PEM-brændselsceller i netop disse
driftssituationer.
De eksperimentelle resultater i dette arbejde foreslår at tilstedeværelsen af metanol
resulterer i degradering af HT-PEM-brændselscelle performance, ved forhøjet
charge transfer resistance og mass transfer resistance. CO med volumenfraktioner
på 1 % – 3 % kan forårsage signifikant performancetab for HT-PEM-
brændselsceller ved driftstemperaturer på 150 oC. Celleperformancetab forårsaget af
CO-forgiftning kan afhjælpes ved tilstedeværelsen af vanddamp. CO-oxidationen
via water-gas-shift-reaktionen er hovedårsagen til den forbedrede CO-
forgiftningssituation ved tilstedeværelsen af vanddamp. I mellemtiden kan CO-
forgiftningen forværres ved tilstedeværelsen af CO2, på trods af at CO2 alene ikke
påvirker celleperformance. H2-sultning resulterer i reversering af cellepolariteten.
Carbon corrosion og vandelektrolysereaktioner sker på anodesiden under H2-
sultningsbetingelser, hvilket bekræftes af tilstedeværelsen af CO2 og O2 i
anodeudstødningen. Strømdensitetsdistributionen bliver ujævn under H2-
sultningsbetingelser med høje strømdensiteter i upstream-regionerne og lave

VI
strømdensiteter i downstream-regionerne. Cellereversering og ujævn
strømdensitetsdistribution bliver værre under lavere H2-støkiometrier og højere
strømbelastningstilstande. Den hurtige forringelse af celleperformance under H2-
sultnings-degradering, viser ved tests, at H2-sultning kan forårsage alvorlig skade på
HT-PEM-brændselscellen. Degraderingen under H2-sultning sker i katalystlaget,
primært på anodesiden, mens membranen ikke bliver påvirket. Carbon corrosion på
anoden formindsker konsekvent ECSA og er hovedårsagen til degraderingen under
H2-sultningsbetingelser.
De opnåede resultater I dette arbejde hjælper med forståelsen og forbedringen af
degradering af HT-PEM-brændselsceller.

VII
ACKNOWLEDGEMENTS
Finally, I can see the completion of my thesis. Looking back on the last three years
of studying in Department of Energy Technology, Aalborg University, I had lots of
good memories and gained a lot, both in academic and in other aspects of my life.
This three-year journey has become the most wonderful and valuable experience in
my life, and will be the helpful wealth for my future life. I would like to show my
gratitude to many people, without whom I cannot finish my PhD study for sure.
First and foremost, I would like to say thank you to my supervisors: Søren Knudsen
Kær and Søren Juhl Andreasen. Their professional guidance and suggestions guide
me forward when doing my PhD project. Søren Kær is always concerned about my
progress in research. His valuable and timely guidance helps me to prevent taking
detours in this journey. Søren Juhl’s experience in doing the experiments in the lab
really helps me a lot when I get in troubles when fighting with the experimental
instruments. Except for the guidance, their courage and the relaxing atmosphere
they build are also the key points which support me all the way through the journey.
I would also thank the colleagues in the Fuel Cell and Battery group: Xin Gao,
Xiaoti Cui, Christian Jeppesen, Simon Lennart Sahlin, Kristian Kjær Justesen,
Jakob Rabjerg Vang, Vincenzo Liso, Anders Christian Olesen and other people in
this group which I cannot list here for the consideration of the length of this part,
for their valuable discussion and kindly help. I really enjoy working with you guys.
A special thank you is sent to Samuel Simon Araya who helped me a lot in the
beginning of my PhD study and gave me many valuable suggestions in the past
three years.
Further, special thanks are sent to all my friends and all the secretaries and all the
employees in the Department of Energy Technology. Thank you for your support
all through my PhD period. I will always remember the comfort from my friend
when I am upset.
Last but not least, I would like to express the deeply appreciation to my beloved
parents, for their unconditionally love and support to me over the last twenty eight
years. I will always love you!
A special thank you is sent to China Scholarship Council (CSC) for the financial
support for my studying in Denmark.

VIII
IX
TABLE OF CONTENTS
Chapter 1. Introduction .................................................................................................. 1
1.1. The importance of fuel cells........................................................................ 1
1.2. Fuel cell types ............................................................................................ 1
1.3. PEM fuel cells ............................................................................................ 2
1.4. PEM fuel cell applications .......................................................................... 4
1.4.1. Transportation applications .................................................................. 4
1.4.2. Stationary applications ......................................................................... 5
1.4.3. Portable applications ............................................................................ 5
1.5. Summary.................................................................................................... 6
Chapter 2. Degradation on high temperature PEM fuel cell ......................................... 7
2.1. Overview of HT-PEM fuel cells ................................................................. 7
2.2. Components of the HT-PEM fuel cells ...................................................... 10
2.3. Degradation and durability issues of the HT-PEM fuel cells ...................... 11
2.3.1. Degradation mechanisms of the membranes ....................................... 12
2.3.2. Degradation mechanisms of the catalyst ............................................. 14
2.3.3. Carbon corrosion ............................................................................... 16
2.3.4. Loss of phosphoric acid ..................................................................... 17
2.4. Operational effects on degradation of HT-PEM fuel cells .......................... 18
2.4.1. Start/stop cycling ............................................................................... 18
2.4.2. Open circuit voltage ........................................................................... 20
2.4.3. Impurities in the anode gas ................................................................. 21
2.4.4. Gas starvations .................................................................................. 24
2.5. Motivations and objectives of the current project ...................................... 24
2.6. Summary.................................................................................................. 25
Chapter 3. Methodologies ............................................................................................. 27
3.1. Experimental setup ................................................................................... 27
3.1.1. MEA ................................................................................................. 27
3.1.2. Single cell setup and current density distribution measurement ........... 27
X
3.1.3. Fuel cell test station ........................................................................... 29
3.2. Characterization techniques for the HT-PEM fuel cells ............................. 30
3.2.1. Polarization curves ............................................................................ 30
3.2.2. Electrochemical impedance spectrum ................................................. 33
3.2.3. Cyclic voltammetry ........................................................................... 34
3.2.4. Scanning electron microscopy ............................................................ 35
3.2.5. X-ray diffraction ................................................................................ 35
3.2.6. Mass spectrometry ............................................................................. 36
3.3. Experimental procedures .......................................................................... 36
3.3.1. Break-in ............................................................................................ 36
3.3.2. Long-term degradation test ................................................................ 37
3.3.3. CO poisoning test .............................................................................. 39
3.3.4. H2 starvation ...................................................................................... 41
3.4. Summary ................................................................................................. 42
Chapter 4. Results and Discussion ................................................................................ 43
4.1. Long-term degradation test with the presence of methanol ........................ 43
4.1.1. Cell voltage profile ............................................................................ 43
4.1.2. Polarization curves ............................................................................ 45
4.1.3. EIS .................................................................................................... 48
4.2. CO poisoning on the HT-PEM fuel cell .................................................... 51
4.2.1. Effect of anode humidification on the CO poisoning ........................... 51
4.2.2. Effect of CO2 on cell performance and CO poisoning ......................... 57
4.2.3. Effect of humidification on CO poisoning with the presence of CO2 ... 60
4.3. H2 starvation tests on HT-PEM fuel cells .................................................. 62
4.3.1. Cell behaviors under H2 starvation conditions..................................... 62
4.3.2. Effect of H2 stoichiometry.................................................................. 66
4.3.3. Effect of current load ......................................................................... 68
4.4. Accelerated degradation test of a HT-PEM fuel cell under H2 starvation
condition......................................................................................................... 71
4.4.1. Cell voltage degradation .................................................................... 71
4.4.2. Electrochemical analysis .................................................................... 73
XI
4.4.3. Post-mortem analysis ......................................................................... 76
4.5. Summary.................................................................................................. 78
Chapter 5. Conclusion .................................................................................................. 81
5.1. Conclusions.............................................................................................. 81
5.1.1. Long-term degradation test with the presence of methanol .................. 81
5.1.2. CO poisoning on the HT-PEM fuel cell .............................................. 81
5.1.3. H2 starvation ...................................................................................... 82
5.1.4. Final remarks ..................................................................................... 82
5.2. Future work .............................................................................................. 83
Bibliography ................................................................................................................. 85
XII
LIST OF FIGURES
Fig.1.1 – The structure and the operational principle of the PEM fuel cell ............. 3 Fig. 2.1 – Diagram of a HT-PEM power system integrated with a methanol
reformer (reproduced from [44]) ........................................................................... 9 Fig. 2.2 – The components of single cell setup of the HT-PEM fuel cell (A: bipolar
plate, B: endplate, C: gasket, D: MEA) ................................................................ 10 Fig. 2.3 – Schematic of reversal current model (reproduced from [98]) ............... 19 Fig. 3.1 – The photo (a) and the schematic plot (b) single cell setup used in this
PhD project ........................................................................................................ 28 Fig. 3.2 – The scheme of segmented sensor plate (red line) and flow channel (blue
line) and configuration of gas flow in cathode (a) and anode (b). ......................... 28 Fig. 3.3 – The scheme of the experimental setup ................................................. 30 Fig. 3.4 – A typical polarization curve of the HT-PEM fuel cell ........................... 31 Fig. 3.5 – A typical Tafel plot of the HT-PEM fuel cell ....................................... 32 Fig. 3.6 – The typical impedance spectrum of the HT-PEM fuel cell ................... 33 Fig. 3.7 – The typical cyclic voltammogram of a HT-PEM fuel cell in the potential
range of 0.05 V and 1.0 V ................................................................................... 35 Fig. 4.1 – The voltage profile of the first MEA over time during the degradation test
........................................................................................................................... 44 Fig. 4.2 – The voltage profile of the second MEA over time during the degradation
test ..................................................................................................................... 45 Fig. 4.3 – Polarization curves (a) and Tafel plots (b) of the first fuel cell over time
during the H2 continuous test .............................................................................. 46 Fig. 4.4 – Polarization curves (a) and Tafel plots (b) of the first fuel cell over time
during the H2 start/stop test ................................................................................. 47 Fig. 4.5 – Polarization curves (a) and Tafel plots (b) of the second fuel cell over
time during the continuous test ............................................................................ 48 Fig. 4.6 – Polarization curves (a) and Tafel plots (b) of the second fuel cell over
time during the Reformate start/stop test.............................................................. 48 Fig. 4.7 – The EC model used to fit the measured impedance spectra .................. 49 Fig. 4.8 – Evolution of impedance spectra (a) and all the internal resistances (b) of
the first fuel cell throughout the H2 continuous test .............................................. 50 Fig. 4.9 – Evolution of impedance spectra (a) and all the internal resistances (b) of
the first fuel cell throughout the H2 start/stop test ................................................. 51 Fig. 4.10 – Evolution of impedance spectra (a) and all the internal resistances (b) of
the first fuel cell throughout the Reformate test ................................................... 51 Fig. 4.11 – The change in cell voltage and anode dew point temperature in
Experiment No. 1, 2 and 3. The CO poisoning period and performance recovery
period are indicated in each experiment. .............................................................. 52
XIII
Fig. 4.12 – The polarization curves (lines with symbols) and cell voltage loss
(lines) caused by the presence of CO under different anode gas dew point
temperatures with and without CO. ..................................................................... 53 Fig. 4.13 – The electrochemical impedance spectra of the fuel cell operated with
different anode gas dew point temperatures with and without CO in anode stream.
........................................................................................................................... 55 Fig. 4.14 – The EC model used to fit the obtained impedance spectra .................. 55 Fig. 4.15 – The corresponding fitted resistances of the fuel cell calculated from the
spectra shown in Fig. 4.12. .................................................................................. 56 Fig. 4.16 – The polarization curves of the fuel cell operated with pure H2, 20%vol
CO and 20%vol N2 contained H2, 1%vol CO contained H2 and 1%vol CO and
20%vol CO2 contained H2 ................................................................................... 57 Fig. 4.17 – The electrochemical impedance spectra of the fuel cell operated with
pure H2, 20%vol CO and 20%vol N2 contained H2, 1%vol CO contained H2 and
1%vol CO and 20%vol CO2 contained H2 ........................................................... 59 Fig. 4.18 – The corresponding fitted resistances of the fuel cell calculated from the
spectra shown in Fig. 4.17. .................................................................................. 59 Fig. 4.19 – The polarization curves of the fuel cell operated with pure H2, and
1%vol CO and 20%vol CO2 contained H2 under different anode gas dew point
temperatures ....................................................................................................... 60 Fig. 4.20 – The electrochemical impedance spectra of the fuel cell operated with
pure H2, and 1%vol CO and 20%vol CO2 contained H2 under different anode gas
dew point temperatures ....................................................................................... 61 Fig. 4.21 – The corresponding fitted resistances of the fuel cell calculated from the
spectra shown in Fig. 4.20 ................................................................................... 61 Fig. 4.22 – Dynamic response of cell voltage and local current density when H2
stoichiometry decreased from 3.0 to 0.8 with the current load of 10A................... 63 Fig. 4.23 – Gas composition of anode exhaust under different H2 starvation
conditions ........................................................................................................... 64 Fig. 4.24 – Current density distribution profiles of the fuel cell in different time ((a):
t=0s; (b): t=16s when the cell voltage decreases to 0 V; (c): t=60s when the cell
reversal occurs and the cell voltage reaches the lowest level) during the H2
starvation process under H2 stoichiometry of 0.8 and current load of 10 A. .......... 65 Fig. 4.25 – Dynamic response of the cell voltage and the local current density when
H2 stoichiometry decreased from 3.0 to 0.4 with the current load of 10A .............. 66 Fig. 4.26 – The current density distribution profile of the fuel cell when the cell
reversal occurred and the cell voltage decreased to the lowest level during the H2
starvation process under the H2 stoichiometry of 0.4 and current load of 10 A ...... 68 Fig. 4.27 – The dynamic response of the cell voltage and the local current density
when the H2 stoichiometry decreased to 0.8 (a) and 0.4 (b) with current load of 20
A ........................................................................................................................ 69 Fig. 4.28 – The current density distribution profile of the fuel cell when the cell
reversal occurred and the cell voltage decreased to the lowest level during the H2
starvation process under the H2 stoichiometry of 0.4 and current load of 10 A ...... 70
XIV
Fig. 4.29 – The cell voltage profile of the HT-PEM fuel cell during the H2
starvation degradation test ................................................................................... 71 Fig. 4.30 – The change in average cell voltage at the H2 stoichiometry of 3.0 in each
cycle ................................................................................................................... 72 Fig. 4.31 – The response in anode exhaust composition (solid line) and cell voltage
(dashed line) in cycle 9 (a) and cycle 19 (b) ......................................................... 73 Fig. 4.32 – The polarization curves of the fuel cell measured before and after the H2
starvation degradation test ................................................................................... 74 Fig. 4.33 – The electrochemical impedance spectra measured in the beginning of
the test and after the H2 starvation test with current load of 20 A .......................... 75 Fig. 4.34 – The cyclic voltammograms of the fuel cell measured in the beginning of
the test and after the H2 starvation test ................................................................. 76 Fig. 4.35 – The cross-section images of an untested MEA (a) of a tested MEA (b)
taken by a SEM .................................................................................................. 77 Fig. 4.36 – The XRD patterns of Pt particles from anode and cathode of a pristine
MEA and a tested MEA ...................................................................................... 78
XV
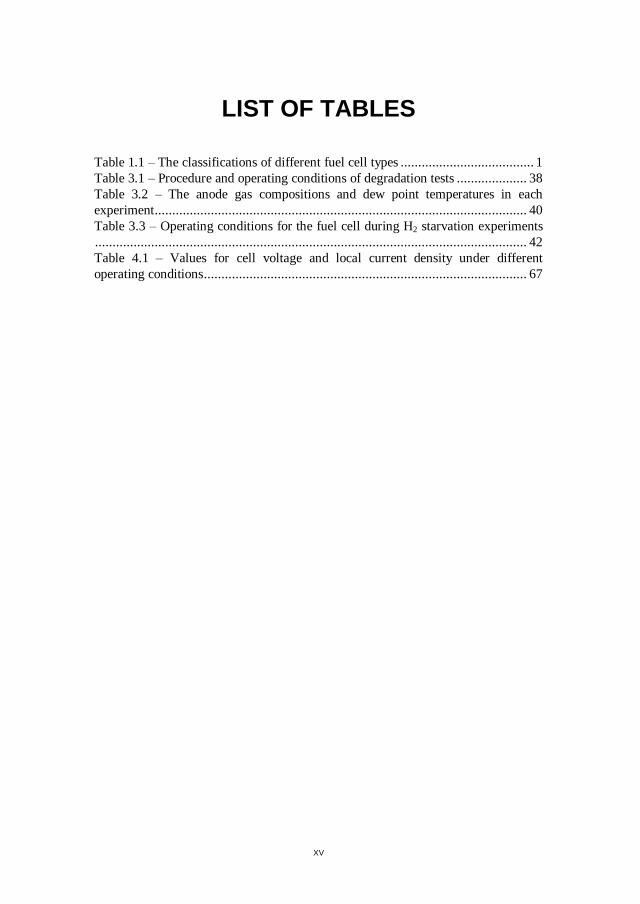
LIST OF TABLES
Table 1.1 – The classifications of different fuel cell types ...................................... 1 Table 3.1 – Procedure and operating conditions of degradation tests .................... 38 Table 3.2 – The anode gas compositions and dew point temperatures in each
experiment .......................................................................................................... 40 Table 3.3 – Operating conditions for the fuel cell during H2 starvation experiments
........................................................................................................................... 42 Table 4.1 – Values for cell voltage and local current density under different
operating conditions ............................................................................................ 67
XVI
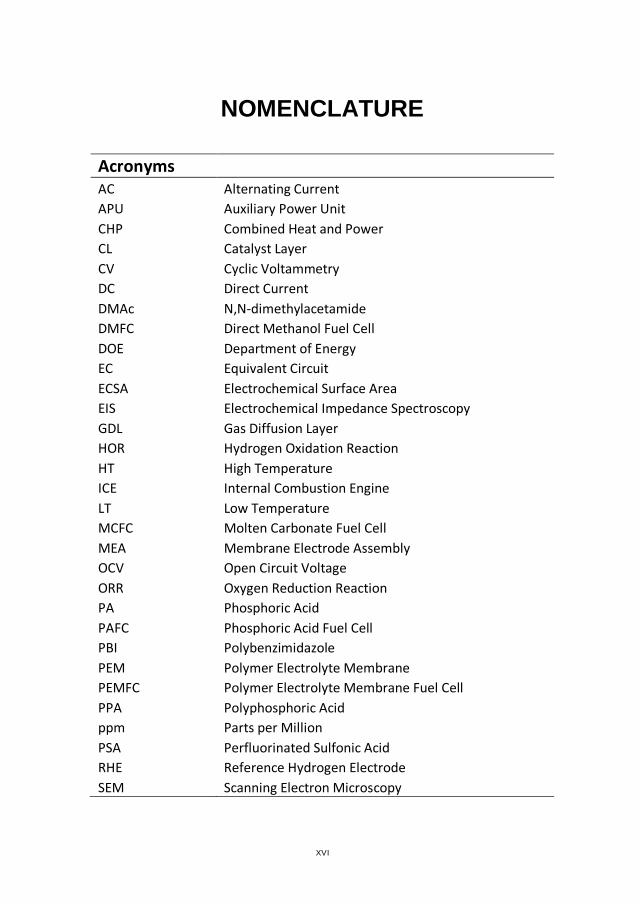
NOMENCLATURE
Acronyms
AC Alternating Current
APU Auxiliary Power Unit
CHP Combined Heat and Power
CL Catalyst Layer
CV Cyclic Voltammetry
DC Direct Current
DMAc N,N-dimethylacetamide
DMFC Direct Methanol Fuel Cell
DOE Department of Energy
EC Equivalent Circuit
ECSA Electrochemical Surface Area
EIS Electrochemical Impedance Spectroscopy
GDL Gas Diffusion Layer
HOR Hydrogen Oxidation Reaction
HT High Temperature
ICE Internal Combustion Engine
LT Low Temperature
MCFC Molten Carbonate Fuel Cell
MEA Membrane Electrode Assembly
OCV Open Circuit Voltage
ORR Oxygen Reduction Reaction
PA Phosphoric Acid
PAFC Phosphoric Acid Fuel Cell
PBI Polybenzimidazole
PEM Polymer Electrolyte Membrane
PEMFC Polymer Electrolyte Membrane Fuel Cell
PPA Polyphosphoric Acid
ppm Parts per Million
PSA Perfluorinated Sulfonic Acid
RHE Reference Hydrogen Electrode
SEM Scanning Electron Microscopy

XVII
SOFC Solid Oxide Fuel Cell
TFA Trifluoroacetic Acid
TGA Thermogravimetric Analysis
UPS Uninterrupted Power Supplies
XRD X-ray Diffraction

1
CHAPTER 1. INTRODUCTION
This section gives a brief overview of the global energy consumption and the
importance of the development of the fuel cell technology. It then introduces the
classification of fuel cells and the operational principle of the PEM fuel cell, which is
of interest in this project. Lastly, the state-of-art of the PEM fuel cell and its
application are outlined.
1.1. THE IMPORTANCE OF FUEL CELLS
Despite the recent global economic recession, the global energy consumption has
been increasing over the last several decades and is expected to increase over the
next 20 years. The global energy demand is expected to rise by 37% from 2013 to
2035 [1]. Fossil fuels, which take up more than 70% of the total energy production,
are the main sources of the CO2 emission. The IPCC predicts that the global
temperature will be increased by 4 oC by the end of the 21st century, if the global
CO2 emission continues increasing [2]. Therefore governments all over the world
have reached a consensus that the CO2 emission has to be reduced as soon as
possible, although there are still heated debates on the exact CO2 emission target
between developed countries and developing countries. Denmark, which is rather
ambitious on CO2 emission reduction, aims to reduce 40% of CO2 emission by 2020
compared with 1990 and become complete carbon neutral by 2050 [3]. With the
more and more severe conflictions between increasing energy demand and urgency
in CO2 emission reduction, the renewable energy supply should rise more rapidly
and take up higher percentage in the total energy consumption.
A fuel cell is an electrochemical device which can directly convert the chemical
energy into electric energy. Its efficiency is not limited by the Carnot Cycle because
there is no working medium cycled between high temperature and low temperature
heat sources in the fuel cell. Therefore its efficiency can be higher than the
traditional thermal engines. Moreover, if hydrogen is adopted as the fuel, water is
the only product of the operation, which makes the fuel cell very environmentally
friendly provided the hydrogen is produced from renewables [4]. The high
efficiency and low emission of the fuel cell make it a very promising solution to the
global energy crisis and environmental pollution issues.
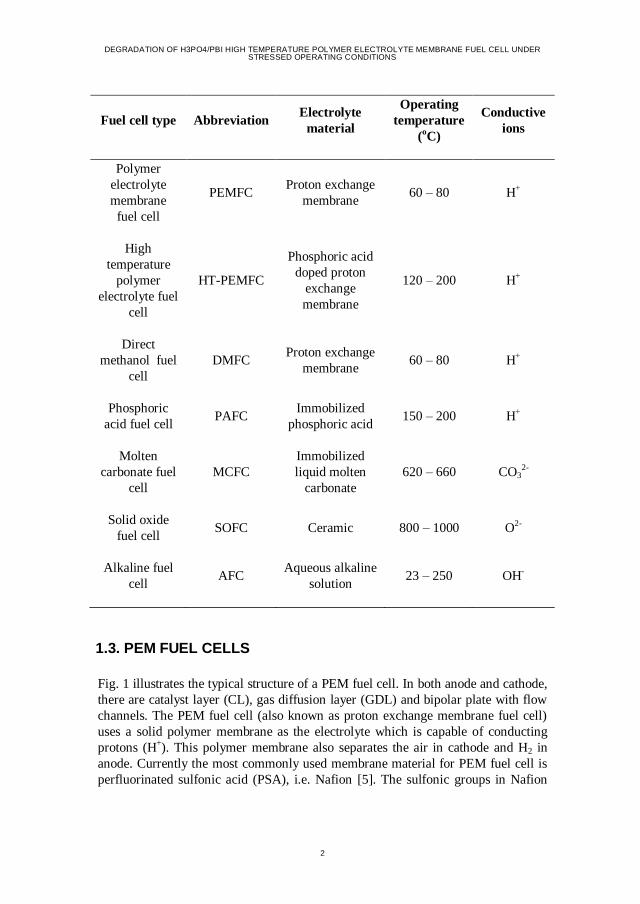
1.2. FUEL CELL TYPES
The fuel cells can be classified according to the materials of the electrolyte used. In
Table 1.1 several common types of fuel cells are listed.
Table 1.1 – The classifications of different fuel cell types
DEGRADATION OF H3PO4/PBI HIGH TEMPERATURE POLYMER ELECTROLYTE MEMBRANE FUEL CELL UNDER STRESSED OPERATING CONDITIONS
2
Fuel cell type Abbreviation Electrolyte
material
Operating
temperature
(oC)
Conductive
ions
Polymer
electrolyte
membrane
fuel cell
PEMFC Proton exchange
membrane 60 – 80 H+
High
temperature
polymer
electrolyte fuel
cell
HT-PEMFC
Phosphoric acid
doped proton
exchange
membrane
120 – 200 H+
Direct
methanol fuel
cell
DMFC Proton exchange
membrane 60 – 80 H+
Phosphoric
acid fuel cell PAFC
Immobilized
phosphoric acid 150 – 200 H+
Molten
carbonate fuel
cell
MCFC
Immobilized
liquid molten
carbonate
620 – 660 CO32-
Solid oxide
fuel cell SOFC Ceramic 800 – 1000 O2-
Alkaline fuel
cell AFC
Aqueous alkaline
solution 23 – 250 OH
-
1.3. PEM FUEL CELLS
Fig. 1 illustrates the typical structure of a PEM fuel cell. In both anode and cathode,
there are catalyst layer (CL), gas diffusion layer (GDL) and bipolar plate with flow
channels. The PEM fuel cell (also known as proton exchange membrane fuel cell)
uses a solid polymer membrane as the electrolyte which is capable of conducting
protons (H+). This polymer membrane also separates the air in cathode and H2 in
anode. Currently the most commonly used membrane material for PEM fuel cell is
perfluorinated sulfonic acid (PSA), i.e. Nafion [5]. The sulfonic groups in Nafion
CHAPTER 1. INTRODUCTION
3
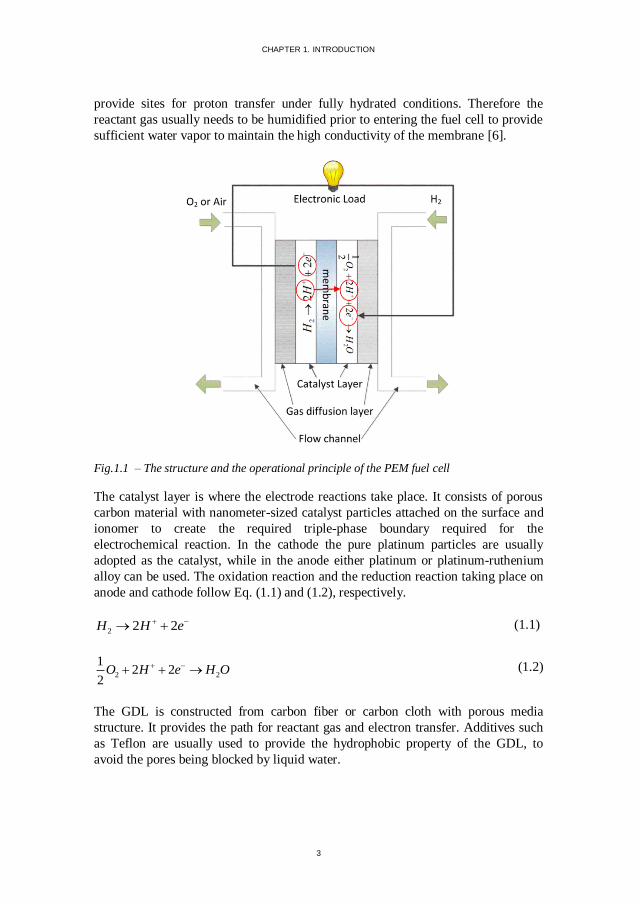
provide sites for proton transfer under fully hydrated conditions. Therefore the
reactant gas usually needs to be humidified prior to entering the fuel cell to provide
sufficient water vapor to maintain the high conductivity of the membrane [6].
Fig.1.1 – The structure and the operational principle of the PEM fuel cell
The catalyst layer is where the electrode reactions take place. It consists of porous
carbon material with nanometer-sized catalyst particles attached on the surface and
ionomer to create the required triple-phase boundary required for the
electrochemical reaction. In the cathode the pure platinum particles are usually
adopted as the catalyst, while in the anode either platinum or platinum-ruthenium
alloy can be used. The oxidation reaction and the reduction reaction taking place on
anode and cathode follow Eq. (1.1) and (1.2), respectively.
2 2 2H H e (1.1)
2 2
12 2
2O H e H O (1.2)
The GDL is constructed from carbon fiber or carbon cloth with porous media
structure. It provides the path for reactant gas and electron transfer. Additives such
as Teflon are usually used to provide the hydrophobic property of the GDL, to
avoid the pores being blocked by liquid water.
DEGRADATION OF H3PO4/PBI HIGH TEMPERATURE POLYMER ELECTROLYTE MEMBRANE FUEL CELL UNDER STRESSED OPERATING CONDITIONS
4
The membrane, catalyst layer and gas diffusion layer are usually assembled by hot
pressuring into the so-called membrane electrode assembly (MEA). The MEA is
usually sandwiched between two bipolar plates with flow channels which can
distribute the reaction gas evenly on the electrode plane.
1.4. PEM FUEL CELL APPLICATIONS
The application of PEM fuel cells focus on the following three aspects:
transportation, stationary and portable power generation. Due to the excellent
dynamic characteristics and fast startup of the PEM fuel cell, compared with other
types of fuel cell, most transportation applications of fuel cell are related to the
PEM fuel cell [7]. The output power of PEM fuel cell for transportation application
ranges from 20 kW to 200 kW. The stationary and portable generation applications
of PEM fuel cells are also very successful because of the high power density, high
energy efficiency and good output power flexibility. For portable power application,
the typical power range of the PEM fuel cell is 5 – 50 W. For stationary application,
the output power of the PEM fuel cell can either be in the low range of 100 – 1000
W, for example for backup power of the remote telecommunication station, or in the
high range of 100 kW – 1 MW, for example for distributed power generation.
1.4.1. TRANSPORTATION APPLICATIONS
Most of the conventional engines for transportation applications, such as internal
combustion engines (ICEs), rely on the fossil fuels, which give rise to many
environmental and energy issues such as global warming, air pollution and crude oil
crisis. The PEM fuel cell has the potential to solve these issues by replacing the
ICEs in the future. As reported by McNicol et al. [8], the fuel cell vehicles equipped
with carbon containing fuel processor can be superior to the conventional ICE
vehicles in all aspects except for initial cost.
Many automotive manufacturers have launched their fuel cell cars in the last
decade, for example Honda FCX Clarity [9], Toyota Mirai [10], Mercedes-Benz F-
CELL Electrical Car [11], Chevrolet Equinox [12] and Hyundai ix35 FCEV [13].
The fuel cell cars can either be powered only by the fuel cell stacks or by the fuel
cell stacks and batteries in a hybrid system. The production of automobiles powered
by fuel cells has been increasing in recent years. Besides the automotive companies,
the governments in some countries also contribute to the development of fuel cell
vehicles. The US DOE initiated the “Controlled Hydrogen Fleet and Infrastructure
Demonstration and Validation” Project in 2004 [14], aiming to demonstrate the
performance of fuel cell vehicles and the support refueling infrastructure in parallel,
under real-life conditions. The target of this project for the range of fuel cell
vehicles is above 300 miles. They have employed 152 fuel cell vehicles and 24
CHAPTER 1. INTRODUCTION
5
hydrogen-refueling stations. Japan initiated the “Japan Hydrogen Fuel Cell (JHFC)”
Project in 2002 which involved the activities related to fuel cell vehicles [15].
Fuel cell buses are another successful application of fuel cells in transportation.
There have been several government funded fuel cell bus project announced in the
past decade, such as US National Fuel Cell Bus project [16], European CUTE
(Clean Urban Transport for Europe) [17] and Australian STEP (Sustainable
Transport Energy Project) programs. All around the world, fuel cell buses are
demonstrated, including in Whistler Canada, San Francisco USA, Hamburg
Germany, Shanghai and Beijing China, London England, São Paulo Brazil as well
as several others [4].
Other applications of fuel cells in transportation can be found in the literature, such
as fuel cell bicycles [18], fuel cell scooters [19], fuel cell forklifts [20].
1.4.2. STATIONARY APPLICATIONS
Distributed power generation has shown many advantages over the centralized
power generation, including utilizing the waste heat through cogenerating heat and
power for local usage. The PEM fuel cell has been applied for small-scale
decentralized stationary power generation. The application of PEM fuel cell in
stationary power generation mainly focuses on small scale combined heat and
power (CHP) system, uninterrupted power supplies (UPS) and auxiliary power units
(APU) [21]. The GenSys Blue developed by Plug Power to be compatible with
existing home heating systems such as forced air or hot water [22]. In 2009 Plug
Power received an award from the New York State Energy Research and
Development Authority (NYSERDA) for installing and operating the CHP GenSys
fuel cell systems in New York State homes [23]. The Ballard Power System
developed the FCgen-1030 V3 stacks which can be incorporated into the residential
CHP system [24]. Ballard also works with Dantherm Power A/S of Denmark to
provide back-up power solutions to telecommunications providers. The application
of PEM fuel cell in stationary power generation faces competitions from other types
of fuel cell, mainly from SOFC and MCFC. To enhance the competitiveness of
PEM fuel cell in stationary power generation, research work aiming to improve the
durability and fuel flexibility of the PEM fuel cell should be conducted.
1.4.3. PORTABLE APPLICATIONS
Due to the unsatisfying battery technology in terms of low power density and long
charging time, there is a growing demand for portable PEM fuel cells for portable
electronic devices. The world production of portable fuel cell has been increasing
continuously [25]. The portable PEM fuel cell can be used for laptops, mobile
phones, remote control (RC) toys and emergency lights [26]. In addition, the
portable PEM fuel cell also receives attention for the military application to power
DEGRADATION OF H3PO4/PBI HIGH TEMPERATURE POLYMER ELECTROLYTE MEMBRANE FUEL CELL UNDER STRESSED OPERATING CONDITIONS
6
portable electronic devices such as radios. There are several negative opinions of
PEM fuel cell in portable application. One is related to the safety of hydrogen, and
another one is about the lower volumetric energy density of hydrogen. However the
PEM fuel cell shows some advantages and potential in this field. The PEM fuel cell
fueled with liquid methanol, namely direct methanol fuel cell (DMFC), is thought to
be a promising candidate for the portable power source.
1.5. SUMMARY
In this chapter the important role which the fuel cell will play in the future of energy
supply and environment protection has been introduced. As a very highly-efficient
and environment-friendly power source, the fuel cell is expected to play a more and
more important role in the future world, to promote the efficiency of energy
conversion and to utilize the H2 energy more efficiently. The classification of fuel
cells has been listed. And the components and the operational principle of the PEM
fuel cell are summarized. Many successful applications of the PEM fuel cell in
different aspects have been seen. However the durability and the lifetime is still a
barrier on its way to successful commercialization, which motivate the current
research work conducted in this thesis.
7
CHAPTER 2. DEGRADATION ON HIGH
TEMPERATURE PEM FUEL CELL
This section introduces a specific type of PEM fuel cell, phosphoric acid doped PBI
membrane based high temperature PEM fuel cell, which is investigated in this
project. After introducing the advantages, disadvantages and applications of this type
of PEM fuel cell, the working principle and components of the HT-PEM fuel cell is
described. Then the degradation mechanisms of each component under steady state
and some stressed operating conditions are introduced, to elicit the motivation and
the main objects for this project.
2.1. OVERVIEW OF HT-PEM FUEL CELLS
The Nafion membrane based PEM fuel cell with operating temperature in the range
of 60 – 80 oC is recognized as a very successful type of fuel cell due to its high
energy efficiency, fast startup and high power density. However it faces many
technical challenges associated with the low operating temperature. Firstly, proper
water management is needed for the Nafion based PEM fuel cell [6]. The water
content in the Nafion based PEM fuel cell should not be neither too high to avoid
the blockage of the pores in GDL and CL by liquid water nor too low to maintain
sufficient proton conductivity of the membrane. Normally humidifiers are installed
in the fuel cell system to prevent the dry-out of the polymer membrane, which
increases the complexity of the system. Although a lot of work has been conducted
to develop the fuel cell system without humidifiers, these systems still need further
improvement for better reliability and performance [27]. Another challenge for
Nafion based PEM fuel cells are that the catalyst can be easily contaminated by
impurities in the fuel stream. For example the CO with concentration of several
ppm can cause significant cell performance drop [28].The intolerance to impurities
makes a reactor for eliminating CO in the fuel stream necessary in the fuel cell
system fueled by reformate gas, which increases the complexity of the fuel cell
system. Moreover, the low operating temperature brings about the difficulties in
expelling and utilizing the waste heat generated by electrochemical reactions, since
the temperature gradient between the fuel cell and the environment is relatively low
[29].
It is recognized that elevating the operating temperature above 100 oC can
effectively solve these temperature related problems. However the Nafion
membrane only shows good chemical and mechanical properties in the temperature
range of 60 – 80 oC. Thus many researchers have devoted themselves to new
materials for polymer membranes which have good chemical and mechanical
stability and sufficient proton conductivity at higher temperature [30-35]. Among
DEGRADATION OF H3PO4/PBI HIGH TEMPERATURE POLYMER ELECTROLYTE MEMBRANE FUEL CELL UNDER STRESSED OPERATING CONDITIONS
8
different new materials, phosphoric acid (PA or H3PO4) doped polybenzimidazole
(PBI) which shows promising properties for PEM fuel cell application. The PEM
fuel cell which is based on the PA doped PBI membrane can be operated in the
temperature range of 120 – 200 oC, and therefore is normally referred to as high
temperature (HT) PEM fuel cell. And the traditional Nafion based PEM fuel cell is
often referred as low temperature (LT) PEM fuel cell. The first PBI/H3PO4 HT-
PEM fuel cell was proposed by Wainright et al [36]. Since then, many research
works on the manufacturing and characterization of the HT-PEM fuel cell have
been reported.
The proton conductivity of the H3PO4/PBI membrane does not rely on liquid water,
which makes the non-humidification operation of the fuel cell possible [37]. And
there is no liquid water in the HT-PEM fuel cell during operation because the
operational temperature is above water boiling temperature, which makes the water
management very easy. Moreover, higher operating temperature enables better
utilization of the heat in the exhaust gas of the HT-PEM fuel cell. Jensen et al. [38]
proposed a HT-PEM fuel cell system using the excess heat from the fuel cell to
vaporize the water and methanol for a fuel processor. Gao et al. [39] proposed a
method installing the thermoelectric devices in the HT-PEM fuel cell system to
utilize the exhaust heat and improve the electric efficiency of the fuel cell system.
Last but most importantly, the tolerance of the HT-PEM fuel cell to the impurities
in the fuel stream is largely enhanced by the high operating temperature. It is
reported that the performance of a HT-PEM fuel cell shows no significant loss
under an operating temperature of 180 oC with CO concentrations of 5% in the
anode stream [40]. Therefore the HT-PEM fuel cell can be easily integrated with a
reformer to utilize the traditional fossil fuels such as methanol, methane and natural
gas [41, 42]. The fuel flexibility is largely increased by integrating the reformer to
the HT-PEM fuel cell. In addition the H2 storage issues can be solved because of
the high energy density of the fossil fuels.
The first H3PO4/PBI based HT-PEM fuel cell system integrated with a fuel reformer
was developed by Holladay et al [41]. Pan et al. [43] managed to integrate a HT-
PEM fuel cell with a methanol reformer without any CO removal devices.
Efficiency of the system was improved by utilizing the water and heat from the
exhaust gas of the fuel cell. A methanol reformer for HT-PEM fuel cell was also
presented by Andreasen et al [44]. And it was managed to be integrated into a HT-
PEM fuel cell system as shown in Fig. 2.1 [44]. Karstedt et al. [45] presented a
system consisting of a methane fuel processor and a HT-PEM fuel cell unit with an
electrical output of 4.5 kW. With the system model they optimized the operating
parameters such as gas stoichiometries and steam/carbon ratio to achieve maximum
system efficiency. The HT-PEM fuel cell integrated with a glycerol reformer was
reported by Authayanun et al [46]. The optimal system parameters were found to be
dependent on the current density and operating temperature of the fuel cell.
CHAPTER 2. DEGRADATION ON HIGH TEMPERATURE PEM FUEL CELL
9
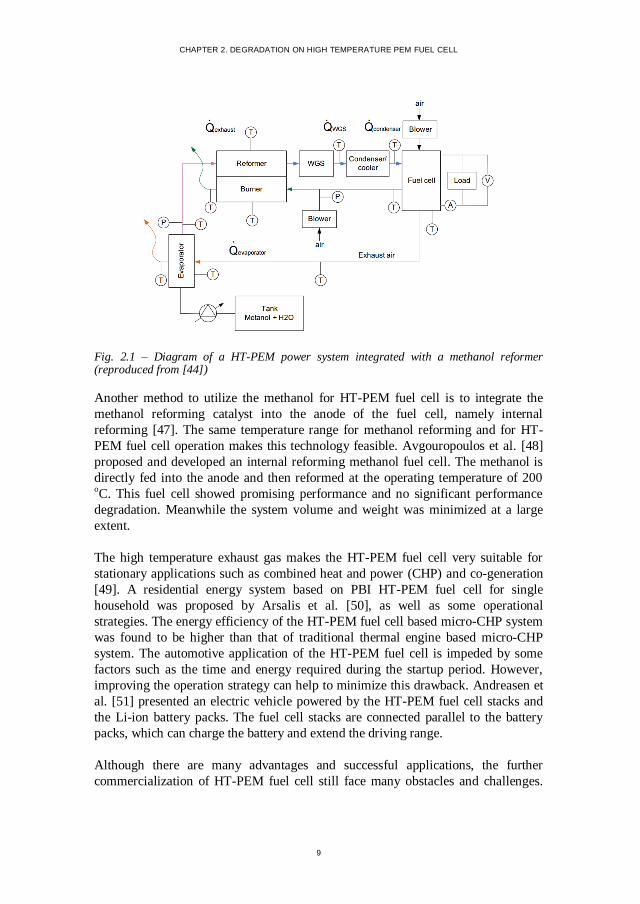
Fig. 2.1 – Diagram of a HT-PEM power system integrated with a methanol reformer (reproduced from [44])
Another method to utilize the methanol for HT-PEM fuel cell is to integrate the
methanol reforming catalyst into the anode of the fuel cell, namely internal
reforming [47]. The same temperature range for methanol reforming and for HT-
PEM fuel cell operation makes this technology feasible. Avgouropoulos et al. [48]
proposed and developed an internal reforming methanol fuel cell. The methanol is
directly fed into the anode and then reformed at the operating temperature of 200 oC. This fuel cell showed promising performance and no significant performance
degradation. Meanwhile the system volume and weight was minimized at a large
extent.
The high temperature exhaust gas makes the HT-PEM fuel cell very suitable for
stationary applications such as combined heat and power (CHP) and co-generation
[49]. A residential energy system based on PBI HT-PEM fuel cell for single
household was proposed by Arsalis et al. [50], as well as some operational
strategies. The energy efficiency of the HT-PEM fuel cell based micro-CHP system
was found to be higher than that of traditional thermal engine based micro-CHP
system. The automotive application of the HT-PEM fuel cell is impeded by some
factors such as the time and energy required during the startup period. However,
improving the operation strategy can help to minimize this drawback. Andreasen et
al. [51] presented an electric vehicle powered by the HT-PEM fuel cell stacks and
the Li-ion battery packs. The fuel cell stacks are connected parallel to the battery
packs, which can charge the battery and extend the driving range.
Although there are many advantages and successful applications, the further
commercialization of HT-PEM fuel cell still face many obstacles and challenges.
DEGRADATION OF H3PO4/PBI HIGH TEMPERATURE POLYMER ELECTROLYTE MEMBRANE FUEL CELL UNDER STRESSED OPERATING CONDITIONS
10
The using of platinum as a noble metal catalyst brings about high cost of the HT-
PEM fuel cell, although many works have been conducted to decrease the platinum
loading in the catalyst layer and figure out alternative non-noble metal catalyst [52].
Moreover, the performance and energy density of the HT-PEM fuel cell is generally
lower than that of the LT-PEM fuel cell because the catalyst is partly covered by
the PA and the oxygen diffusion coefficient is pretty low in the PA and the ionomer
[37]. These drawbacks can be compensated by the enhanced impurity tolerance and
the simplified water management of the HT-PEM fuel cell. Nowadays, the
relatively short lifetime and high performance degradation rate is the most
important barrier which needs to be solved.
2.2. COMPONENTS OF THE HT-PEM FUEL CELLS
A typical single cell setup of H3PO4/PBI membrane based HT-PEM fuel cell
usually consists of the MEA, bipolar plates with flow channels, end plates and
gaskets. All the components are illustrated in Fig. 2.2.
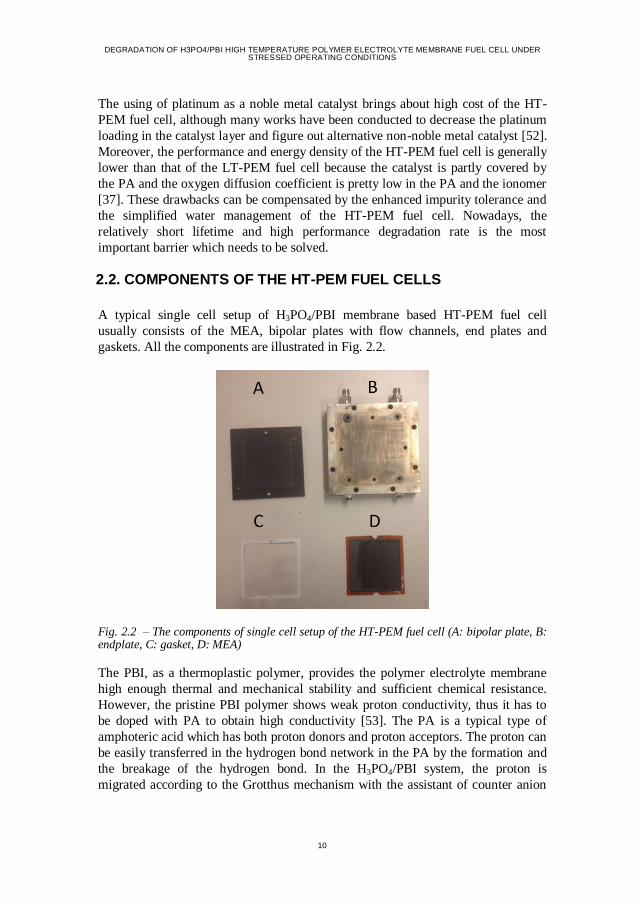
Fig. 2.2 – The components of single cell setup of the HT-PEM fuel cell (A: bipolar plate, B: endplate, C: gasket, D: MEA)
The PBI, as a thermoplastic polymer, provides the polymer electrolyte membrane
high enough thermal and mechanical stability and sufficient chemical resistance.
However, the pristine PBI polymer shows weak proton conductivity, thus it has to
be doped with PA to obtain high conductivity [53]. The PA is a typical type of
amphoteric acid which has both proton donors and proton acceptors. The proton can
be easily transferred in the hydrogen bond network in the PA by the formation and
the breakage of the hydrogen bond. In the H3PO4/PBI system, the proton is
migrated according to the Grotthus mechanism with the assistant of counter anion
CHAPTER 2. DEGRADATION ON HIGH TEMPERATURE PEM FUEL CELL
11
[54]. In addition, the good thermal stability of the PA makes its application on the
HT-PEM fuel cell feasible. Typically the H3PO4/PBI membrane is fabricated by
solution casting. There are two typical cast methods: direct casting and indirect
casting [37]. For direct casting, the acid doped PBI membrane is casted from the
PBI solution in polyphosphoric acid (PPA) or in mixture of PA and trifluoroacetic
acid (TFA). For indirect casting, the membrane is first casted from organic solution,
most commonly the N,N-dimethylacetamide (DMAc), then immersing the
membrane in the PA solution to make it proton conductive. The proton conductivity
of the PA doped PBI membrane is related to the acid doping level which is defined
by the number of acid molecules per repeating PBI unit. It is found that when the
acid doping level is higher than 2 the free acid can be observed, which contributes
to most of the proton conductivity [55]. Therefore the PA content in the membrane
should be maintained at the sufficient level to avoid the decrease in proton
conductivity. Additionally, since the proton transfer in the H3PO4/PBI membrane
does not rely on water, the electro-osmotic drag coefficient of water is almost zero.
The catalyst layer and the gas diffusion layer of the H3PO4/PBI based HT-PEM fuel
cell are similar to those of the LT-PEM fuel cell and PAFC. Noble metal catalyst
such as platinum particles is attached on the high surface area carbon material to
create enough active sites for electrochemical reactions. The ionomer such as PA
doped PBI is used as the binder in the catalyst layer to provide the hydrophobic
property and the proton transfer path. The ionomer loading in the catalyst layer
should be optimized to obtain both high levels in proton conductivity and catalyst
activity [56]. Hot pressing is the most common method to fabricate the MEA of the
HT-PEM fuel cell [30]. It is important to ensure good contact between different
components of the MEA and maintain the structure integrity.
2.3. DEGRADATION AND DURABILITY ISSUES OF THE HT-PEM
FUEL CELLS
The limited lifetime is one of the obstacles which hinder the HT-PEM fuel cell to
be successfully commercialized. Several organizations have set the durability
targets for the HT-PEM fuel cell for both stationary and automotive applications.
According to the Fuel Cell Technologies Program Multi-Year Research,
Development, and Demonstration Plan (MYRD&D Plan) released by US DOE
[57], the lifetime of a HT-PEM fuel cell should be above 5000 hours for automotive
application and 60000 hours for stationary application by the year of 2018. Many
research works about the degradation test and investigation of degradation
mechanisms have been conducted to improve the durability of the HT-PEM fuel
cell and reduce the cell performance degradation rate. In this section, degradation
mechanisms of different components of the HT-PEM fuel cell and several stressed
degradation modes are reviewed.
DEGRADATION OF H3PO4/PBI HIGH TEMPERATURE POLYMER ELECTROLYTE MEMBRANE FUEL CELL UNDER STRESSED OPERATING CONDITIONS
12
2.3.1. DEGRADATION OF THE MEMBRANES
The most typical membrane for HT-PEM fuel cell is based on polybenzimidazole
doped with phosphoric acid. Excellent thermal stability and high proton
conductivity of the PA in the temperature range of 120 – 200 oC ensure that the PA
doped PBI membrane is suitable for HT-PEM fuel cell application. The degradation
mode of the PA doped PBI membrane include the chemical oxidative degradation,
mechanical degradation and thermal stressed degradation. Loss of PA in the
membrane can result in the decrease in the proton conductivity of the membrane
and consequently the degradation in the membrane. This section will focus on the
degradation in structure of the PBI membrane. The loss of PA will be introduced in
the Section 2.2.4.
The attack of C-H bond in the polymer by hydrogen peroxide (H2O2) and its radical
(-OH or -OOH), which could be generated by oxygen reduction reaction in cathode
and by reaction of hydrogen and oxygen in anode, is believed to be The general
chemical degradation mechanism of polymer membranes under typical operating
conditions of the PEM fuel cell [58]. LaConti et al. [59] proposed a possible
mechanism for the formation of H2O2. The O2 molecules permeating through the
membrane from the cathode side are reduced at the catalyst layer of the anode,
forming H2O2 as following equations:
2 2 2H Pt Pt H (2.1)
2Pt H O OOH (2.2)
2 2OOH Pt H H O (2.3)
Most of the works about the chemical degradation of PBI membrane are conducted
through the so-called Fenton test in which the PBI membrane is exposed to ferrous
ions (Fe2+/Fe3+) containing H2O2 solutions [60]. The ferrous ions (Fe2+/Fe3+) play
the role of catalyst for H2O2 decomposition in the Fenton solution. It was reported
that the weight of the PBI membrane decreased with the increase in exposure time
on the Fenton reagent at the temperature of 68 oC [61]. After 20 hours of exposure
to the 3% H2O2, the weight loss of the PBI membrane in the range of 10% and 40%
can be observed. Liao et al. [62] studied the chemical degradation of PBI membrane
under higher temperature condition. They proposed a chemical oxidative
degradation mechanism of the PBI membrane based on the FTIR spectrum obtained
in the experiment. The H-containing end-groups, e.g. N-H bond in the imidazole
ring can be attacked by the peroxide radicals, which can lead to the opening of
imidazole ring and scission of the macromolecular chain. They investigated the
chemical degradation of the PBI membrane in acid environment in a later work
[63]. The PA was found can relieve the membrane degradation by suppressing the
CHAPTER 2. DEGRADATION ON HIGH TEMPERATURE PEM FUEL CELL
13
decomposition of H2O2. The effect of PA to the degradation of PBI membrane was
also reported in the literatures [64] and [65].
Some physical factors such as compressing and swelling can lead to the membrane
degradation. When the fuel cell is assembled, the membrane is under compressive
force from the bipolar plates. Membrane creep and microcrack fracture can be
observed after long-term deformation of the membrane caused by the compressive
stress, which can result in the increase in gas crossover through the membrane and
consequently more severe chemical degradation of membrane [59]. In addition,
mechanical stress of the membrane can be caused by the swelling and shrinking of
the PBI membrane under load cycling or relative humidity cycling operating
conditions. Improving mechanical strength of the membrane helps to reduce the
mechanical degradation [66]. The pristine PBI membrane shows very good
mechanical strength, with tensile strength of 60 – 70 MPa under dry condition and
100 – 160 MPa under saturated condition [31]. However, the mechanical strength of
the PA doped PBI membrane is much weaker because the backbones of the
polymer are separated by the free acid especially at high temperature [55]. From
proton conductivity point of view, the acid doping level should be high. However,
the doping level of the membrane cannot be too high because of the decreasing
mechanical strength of the membrane with increasing doping level. The chemical
stability and mechanical strength of the PBI membrane can be improved by
membrane modification such as cross-linking. However, the cross-linked PBI
membrane showed poorer thermal stability because the high temperature can break
the cross link.
The polymer in the PBI membrane would not experience significant thermal
degradation in the typical operating temperature range of the HT-PEM fuel cell. No
significant weight loss of the PBI membrane is observed in the temperature range of
150 – 500 oC in the thermogravimetric analysis (TGA) experiment [67]. However,
the phosphoric acid doped in the membrane can experience the evaporation and the
dehydration, resulting in a continuous decrease in proton conductivity of the
membrane under typical operating temperature of the HT-PEM fuel cell. The
evaporation and dehydration of PA in the PBI membrane was confirmed by the
weight loss peak in the temperature range of 150 – 175 oC in the TGA experiment
of the PBI membrane [68]. In the HT-PEM fuel cell, the dehydration of PA can be
alleviated by the protection of the GDL and the water vapor generated through
ORR in the cathode. However, the dehydration of PA can influence the durability
of the HT-PEM fuel cell in a long-term operation, especially at the end of the
lifetime. Modestov et al. [69] observed that the hydrogen crossover rate increased
by a factor of 14 at the end of the lifetime test of a HT-PEM fuel cell, which can be
ascribed to the local thinning or even pinhole formation of the membrane.
DEGRADATION OF H3PO4/PBI HIGH TEMPERATURE POLYMER ELECTROLYTE MEMBRANE FUEL CELL UNDER STRESSED OPERATING CONDITIONS
14
2.3.2. DEGRADATION OF THE CATALYST
The material and structure of the catalyst layer of the HT-PEM fuel cell are similar
to that of the LT-PEM fuel cell and the PAFC. The platinum particles or its alloys,
such as Pt/Ru, Pt/Co and Pt/Cr, are attached on the surface of carbon support with
high specific surface area [70]. Therefore the degradation mechanisms of the
catalyst layer of the HT-PEM fuel cell are similar that of the LT-PEM fuel cell and
PAFC.
Under the harsh operating conditions of the PEM fuel cell, especially at high
electrode potential, the platinum particles can be dissolved gradually into platinum
ions, followed by redeposition on existing platinum surface forming particles with
larger diameter or migration to other parts of the MEA where is not accessible to
reactant gas [71]. The increase in platinum particle size caused by dissolution,
migration and reprecipitation of the platinum particles is known as the Ostwald
ripening [72]. In addition, the collisions between platinum particles which are close
to each other also result in the increase in platinum particle size. This process is
called the platinum agglomeration, which mainly occurs when the particle size is
small and the Gibbs free energy is high [73]. The electrochemical catalyst surface
area (ECSA) can be reduced by the continuous increase in platinum particle size,
which results the degradation in the performance of PEM fuel cell. Except for the
increase of platinum particle size, the migration of platinum ions to other parts of
the fuel cell such as membrane and GDL also contributes the reduction of ECSA.
Ferreira et al. [74] reported that Ostwald ripening and dissolution of the platinum
particles contribute equally to the overall loss of the ECSA. The increase in
platinum particle size and the migration of platinum particle can be accelerated by
the corrosion of carbon support during the operation of PEM fuel cell. The
mechanisms of carbon corrosion will be discussed in Section 2.2.3.
With higher operating temperature and more acidic environment, the degradation in
the catalyst layer of the HT-PEM fuel cell is more severe than that of the LT-PEM
fuel cell. Many works have been conducted to investigate the stability and
degradation of platinum catalyst in the catalyst layer of the HT-PEM fuel cell under
both steady-state conditions [69, 75-85] and under dynamic conditions [79, 80, 86-
89].
The increase in average platinum particle size during long-term operation of HT-
PEM fuel cell can be measured by X-ray diffraction (XRD) analysis [78, 90, 91]
and by TEM imaging [75, 77, 82, 92]. The average particle size measured by TEM
imaging is usually larger than that measured by XRD, because with TEM imaging
the particles with diameter smaller than 1 nm can hardly be identified [93].
According to many researches, the growth rate of platinum particle in different
electrode is different. Wannek et al. [78] reported that the increase in platinum
particle size in cathode was larger than that in anode, over the same period of
CHAPTER 2. DEGRADATION ON HIGH TEMPERATURE PEM FUEL CELL
15
operation. The same phenomenon was also observed by Qi and Buelte et al [94].
Usually the cathode potential is higher than anode potential. Higher potential brings
about higher dissolution rate of platinum.
The operating parameters such as operating temperature can significantly influence
the degradation of catalyst on the HT-PEM fuel cell. High operating temperature
can accelerate the increase in platinum particle size and the decrease in ECSA.
Therefore the performance decay rate of the HT-PEM fuel cell becomes higher with
higher operating temperature as reported in the literature [76, 82, 83]. The kinetics
of processes such as platinum dissolution, migration and agglomeration as well as
the carbon corrosion, which lead to the degradation in platinum catalyst of HT-
PEM fuel cell, can be enhanced by higher temperature. Moreover, the attachment of
platinum particles on the carbon support surface can be weaken by the high
temperature, which leads to more platinum particles detached from the carbon
support surface. Except for the operating temperature, operating mode can also
affect the degradation of platinum catalyst. Dynamic operation, such as load
cycling, thermal cycling and start/stop cycling, can accelerate the degradation of
catalyst of HT-PEM fuel cell. Yu et al. [95] reported that loss in ECSA of the HT-
PEM fuel cell was much larger under load cycling condition and start/stop cycling
condition than under constant load condition. The severe carbon corrosion caused
by Load cycling and start/stop cycling operation is the main reason for the
accelerated degradation in platinum catalyst of the HT-PEM fuel cell under these
conditions.
Since the increase in platinum particle size is more severe when the particle
diameter is small, the cell performance degradation caused by degradation in
platinum catalyst mainly occurs in the initial stage of the lifetime of the HT-PEM
fuel cell. This was confirmed by Zhai et al. [84] by conducting degradation test on
HT-PEM fuel cell with different time spans. They observed that the increase in
platinum particle size mainly occurred in the first 300 hour, and remained almost
unchanged over the rest of the lifetime. At the same time, the cell performance
showed a rapid decrease trend in the first 300 hours and a much slower decrease
trend in the following time. Oono et al. [82] conducted a degradation test on a HT-
PEM fuel cell with longer time span (16000 hours). The fast degradation was
observed in the initial stage of the lifetime, which was ascribed to the increase in
platinum particle size, especially in the cathode catalyst layer. When the platinum
particle size is small in the initial stage of the lifetime, the Gibbs free energy of the
particle is high which can result in more severe agglomeration. And the Gibbs free
energy decreases with the increase in particle size, which explains the lower
increase rate when the particle size becomes higher.
The degradation in catalyst of HT-PEM fuel cell can be also influenced by the
platinum loading [96]. The usage of platinum in the catalyst layer can be minimized
through modification of traditional methods. By minimizing the average platinum
DEGRADATION OF H3PO4/PBI HIGH TEMPERATURE POLYMER ELECTROLYTE MEMBRANE FUEL CELL UNDER STRESSED OPERATING CONDITIONS
16
particle size, sufficient performance of the PEM fuel cell can be achieved with
lower platinum loading. However, the degradation in catalyst layer becomes more
severe when the MEA is optimized towards lower platinum loading, because
average platinum particle size growth is more severe with lower platinum loading.
There is a trade-off relationship between the benefits from the reduced platinum
loading and drawback from the higher degradation rate.
2.3.3. CARBON CORROSION
The porous carbon material is widely used in the PEM fuel cell as the support
material for catalyst in the catalyst layer and to provide pathway for electron
transfer and gas diffusion in the gas diffusion layer. The carbon can be corroded
under typical operating conditions of the PEM fuel cell following Eq. (2.4):
2 22 4 4C H O CO H e (2.4)
The equilibrium potential for this reaction is 0.207 V vs reference hydrogen
electrode (RHE) in the acidic environment under room temperature [97], which
means the carbon corrosion is thermodynamically feasible at the cathode potential
of PEM fuel cell during operation. The carbon corrosion can lead to severe
degradation in the catalyst layer of the PEM fuel cell. Firstly, the carbon corrosion
weakens the attachment of platinum particles to the carbon support, which leads to
the detachment of platinum particles from the carbon support surface. Thus the
agglomeration and migration of platinum particle become more severe, resulting in
severe decrease in ECSA and consequently the degradation in cell performance.
Secondly, the void volume structure can be damaged by the carbon corrosion,
leading to the blockage of pathway for gas diffusion and the increase in mass
transfer resistance [98]. Thirdly, the corrosion or oxidation of carbon can decrease
the hydrophobicity of the carbon surface, which can cause the electrode being
blocked by phosphoric acid or water vapor. Lastly, corrosion of carbon support
structure can increase the contact resistance, resulting in increasing ohmic
resistance of the fuel cell.
Under typical operating conditions of the PEM fuel cell, the carbon corrosion
proceeds very slowly. Therefore it only affects the durability of the PEM fuel cell
over a long-term time span. The carbon corrosion rate in the PEM fuel cell can be
evaluated by measuring the corrosion current, weight loss of the electrode or the
CO2 content in the exhaust gas of the PEM fuel cell. Lim et al. [99] investigated the
carbon corrosion under different operating conditions and different platinum
loading in the catalyst layer. They found that carbon corrosion rate became higher
with higher operating temperature, higher relative humidity and higher platinum
loading. Moreover, some operation modes of the PEM fuel cell which can result in
high electrode potential, such as startup/shutdown and fuel starvation, can
CHAPTER 2. DEGRADATION ON HIGH TEMPERATURE PEM FUEL CELL
17
accelerate the carbon corrosion significantly [95]. For the HT-PEM fuel cell, the
high operating temperature brings about higher carbon corrosion rate. However, the
low relative humidity can alleviate the carbon corrosion. Oh et al. [54] compared
the carbon corrosion rate of HT-PEM fuel cell with that of the LT-PEM fuel cell,
and the results revealed that carbon corrosion rate in the HT-PEM fuel cell was
higher than in the LT-PEM fuel cell.
The stability of the carbon support can be improved by graphitization of the carbon
material through high temperature treatment. The graphitized carbon material is
widely used in PAFC to achieve better stability. For the HT-PEM fuel cell, the
graphitized carbon material shows better stability under potential cycling condition.
However, the expense of lower specific surface area of the graphite carbon material
has to be paid [100].
2.3.4. LOSS OF PHOSPHORIC ACID
In the HT-PEM fuel cell, the PBI membrane has to be doped with PA to achieve
high enough proton conductivity. The PA provides proton conductivity through the
Grutthus Mechanism. In the catalyst layer of the HT-PEM fuel cell, the PA should
be loaded as the electrolyte to provide the proton transfer pathway. The change in
amount and distribution of PA in the membrane and electrodes of the HT-PEM fuel
cell can influence the cell performance and the durability.
The PA loss rates of the HT-PEM fuel cell during long-term operation and its
impact on performance degradation have been studied in the literature. By
monitoring the PA content in exhaust water using inductively coupled plasma mass
spectroscopy [101, 102] or chromatography [103], PA leaching rate is measured
during long-term operation. PA leaching rate reported in these works ranges from
10-8 to 10-5 mg·cm-2·h-1, which is quite negligible and may not be the main reason
for the performance degradation. With this leaching rate, even after 40,000 h
lifetime operation less than 5% of PA will be leached out of the MEA. Yu et al
[103] found that the PA leaching rate can be enhanced by high temperature and
high current density. Lin et al. [104] reported that the pH value of water collected
from the exhaust gas was about 5 in the first 30 h and increased to about 6 in the
last 150 h, indicating the PA leaching mainly occurs in the beginning of the test.
This can be explained by the excess PA in the MEA being squeezed into the flow
field during single cell assembling and leached out during the operation. Although
in [105] the authors believed that PA loss had a substantial influence over the entire
lifetime of the fuel cell, because the PA loss rate was in good agreement with the
cell voltage reduction rate. However this conclusion was based on the PA
evaporation rate measured in a PAFC, which can hardly be applied to the HT-PEM
fuel cell. Hartnig and Schmidt [106] reported that unstable bipolar plates exhibited
high PA uptake from the MEA during fuel cell operation, which lead to acid loss
from the catalyst layer and the membrane. This phenomenon suggests that PA loss
DEGRADATION OF H3PO4/PBI HIGH TEMPERATURE POLYMER ELECTROLYTE MEMBRANE FUEL CELL UNDER STRESSED OPERATING CONDITIONS
18
rate measured in the exhaust is lower than the actual PA loss rate because the PA
captured in the bipolar plate cannot be measure in the exhaust.
To evaluate the PA content in the electrodes and the membrane, Kwon et al [107]
proposed three techniques: CV, EIS and acid-based titration (ABT). In-situ CV and
EIS as the indirect measurement methods have limitations in precise measurement
of PA content. The change of ECSA evaluated by CV as well as the change of
internal resistance measured by EIS during the operation can be used to deduce
redistribution of PA in the electrodes. However other degradation behaviors such
carbon corrosion in MEA can also cause similar change in CV and EIS. Thus they
can only be regarded as supplementary PA distribution measurement methods. Ex-
situ ABT can supply clear PA distribution between the membrane and electrodes;
however it cannot reflect the acid distribution during operation conditions because
it is carried out under room temperature. Nevertheless, it is still a good tool for
evaluating the PA loss during long-term operation. Recently, the confocal Raman
microscopy was employed to evaluate the spatial distribution of phosphoric acid
distribution in the AB-PBI membrane for HT-PEM fuel cell [108]. With this
method, the relation between the acid distribution in the membrane and the fuel cell
performance can be investigated. However, the application of this method in the
HT-PEM MEA has not been seen in the literature. Another method to evaluate the
change in amount of PA in the HT-PEM during operation is in-situ synchrotron X-
ray radiography [109]. At the operating temperature of 160 oC and high current
load, the movement of liquid toward GDL in the HT-PEM fuel cell was visualized
by X-ray tomographic microscopy. It is indicated that the loss of PA from the MEA
is likely to be the main reason for the degradation at high current [110].
2.4. OPERATIONAL EFFECTS ON DEGRADATION OF HT-PEM
FUEL CELLS
Except for the steady state operating condition, some practical environment
operating conditions are known can accelerate the degradation of the HT-PEM fuel
cell. In this section, the degradation mechanisms of the HT-PEM fuel cell under
several stressed operating conditions including start/stop cycling, open circuit
voltage, contamination and H2 starvation are reviewed.
2.4.1. START/STOP CYCLING
The startup and shutdown operation of the HT-PEM fuel cell is believed can
accelerate the carbon corrosion in the electrode. After extended shutdown, the air
can diffuse from the atmospheric to the anode flow channel. Then in the startup
process the H2 is supplied to anode flow channel, resulting in the formation of the
H2/air interface. In the region where H2/air interface is presented, the oxygen
reduction reaction occurs in the anode, while the carbon corrosion and water
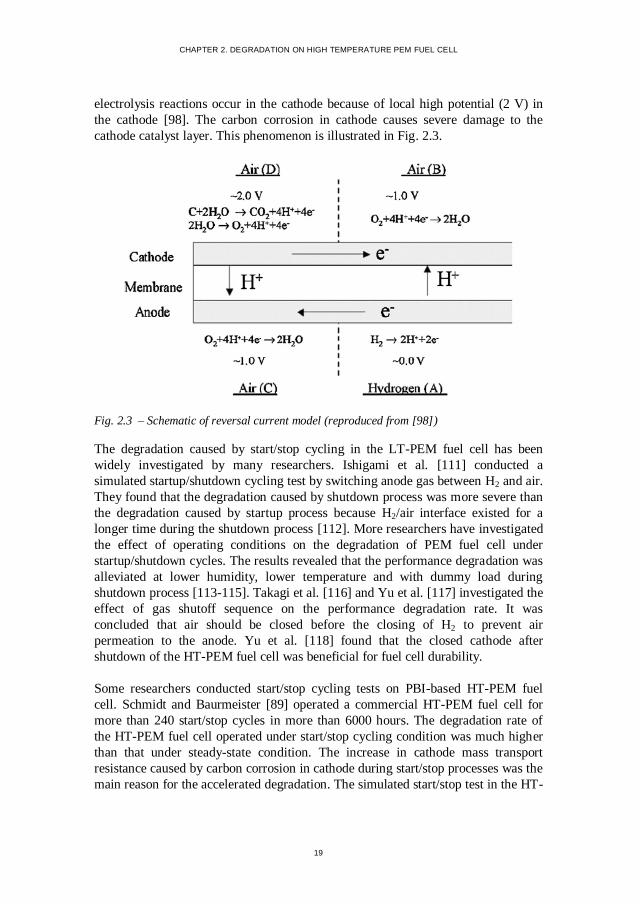
CHAPTER 2. DEGRADATION ON HIGH TEMPERATURE PEM FUEL CELL
19
electrolysis reactions occur in the cathode because of local high potential (2 V) in
the cathode [98]. The carbon corrosion in cathode causes severe damage to the
cathode catalyst layer. This phenomenon is illustrated in Fig. 2.3.
Fig. 2.3 – Schematic of reversal current model (reproduced from [98])
The degradation caused by start/stop cycling in the LT-PEM fuel cell has been
widely investigated by many researchers. Ishigami et al. [111] conducted a
simulated startup/shutdown cycling test by switching anode gas between H2 and air.
They found that the degradation caused by shutdown process was more severe than
the degradation caused by startup process because H2/air interface existed for a
longer time during the shutdown process [112]. More researchers have investigated
the effect of operating conditions on the degradation of PEM fuel cell under
startup/shutdown cycles. The results revealed that the performance degradation was
alleviated at lower humidity, lower temperature and with dummy load during
shutdown process [113-115]. Takagi et al. [116] and Yu et al. [117] investigated the
effect of gas shutoff sequence on the performance degradation rate. It was
concluded that air should be closed before the closing of H2 to prevent air
permeation to the anode. Yu et al. [118] found that the closed cathode after
shutdown of the HT-PEM fuel cell was beneficial for fuel cell durability.
Some researchers conducted start/stop cycling tests on PBI-based HT-PEM fuel
cell. Schmidt and Baurmeister [89] operated a commercial HT-PEM fuel cell for
more than 240 start/stop cycles in more than 6000 hours. The degradation rate of
the HT-PEM fuel cell operated under start/stop cycling condition was much higher
than that under steady-state condition. The increase in cathode mass transport
resistance caused by carbon corrosion in cathode during start/stop processes was the
main reason for the accelerated degradation. The simulated start/stop test in the HT-

DEGRADATION OF H3PO4/PBI HIGH TEMPERATURE POLYMER ELECTROLYTE MEMBRANE FUEL CELL UNDER STRESSED OPERATING CONDITIONS
20
PEM fuel cell was conducted by switching the anode gas between H2 and air in
intervals of 90 seconds [119]. The degradation rate of the fuel cell was similar to
the fuel cell experienced realistic start/stop test with the same number of cycles.
To mitigate the degradation caused by startup/shutdown process, the time span with
existence of H2/air interface should be minimized. The inert gas such as N2 can be
purged into the electrodes after shutdown to expel the residual H2 and air in anode
and cathode, respectively. However, this strategy requires N2 supply system which
increases the complexity of the fuel cell system. Another mitigation method is to
apply the auxiliary load (dummy load) before startup or after shutdown, as
proposed in the literature [115]. Residual H2 in anode can be consumed by the
dummy load, preventing the presence of H2/air interface.
2.4.2. OPEN CIRCUIT VOLTAGE
The open circuit voltage (OCV) is the voltage of fuel cell when it is disconnected
from the load. Operating the fuel cell under OCV condition can enhance the MEA
chemical degradation, especially for the membrane. Under OCV condition, the
hydrogen peroxide (H2O2) can be generated by the reaction of hydrogen and oxygen
at anode catalyst layer, which leads to the chemical degradation of the polymer
electrolyte membrane, as discussed in Section 2.2.1. The degradation in membrane
can result in the thinning of the membrane, increasing the gas crossover through the
membrane, which in turn accelerates the formation of H2O2. In addition, the cathode
potential is higher under OCV condition than with certain current load, therefore
the degradation in catalyst layer is more severe under OCV condition. Moreover,
the cathode potential becomes higher under OCV conditions than with current load,
which can lead to significant carbon corrosion in cathode of the fuel cell.
The degradation caused by OCV operation has been investigated in the literature. A
1200 h degradation test on a six-cell short stack was conducted under close to OCV
(10 mA/cm2) conditions by Wu et al. [120]. They found that the performance decay
rate in the first 800 hours was much lower than that in the following 400 hours. The
degradation mechanism for the first period was ascribed to catalyst degradation,
while for the second period membrane failure was assumed to be the main reason
for degradation. Teranishi et al. [121] observed the degradation under OCV
condition mainly occurred in the cathode through EIS measurement and SEM
observation. Qi and Buelte [94] investigated the effect of OCV on the performance
degradation of a PBI HT-PEM fuel cell. The OCV of the fuel cell increased in the
first 35 min and then declined thereafter. EIS result showed significant catalyst
activity loss and increase in mass transport. Moreover, the platinum particle size in
the cathode increased by 430% after the test.
CHAPTER 2. DEGRADATION ON HIGH TEMPERATURE PEM FUEL CELL
21
2.4.3. IMPURITIES IN THE ANODE GAS
To increase the fuel flexibility and overcome the difficulties in H2 storage, the H2-
rich reformate gas produced from light fossil fuels, such as ethanol, methanol and
natural gas, is often adopted as the anode gas for the HT-PEM fuel cell. The H2-rich
reformate gas contains impurities, including CO, CO2, water vapor and unconverted
light fossil fuel, which can cause degradation in cell performance of the HT-PEM
fuel cell. The contamination mechanisms of impurities to the HT-PEM fuel cell
include: (a) strong adsorption on the catalyst surface, (b) decomposition into CO
and then adsorbed on the catalyst surface and (c) dilution effect. The poisoning
mechanisms of different typical impurities on HT-PEM fuel cell are reviewed.
2.4.3.1 Carbon monoxide
The CO is the typical impurity in reformate from light fossil fuel. The poisoning
mechanism of the CO is the fast and strong adsorption on the platinum surface,
which hinders the adsorption of H2 on the catalyst surface and the following
reaction. For LT-PEM fuel cell, it is reported that the CO with concentration of 50 –
70 ppm can cause 85% of cell voltage loss [122]. The tolerance of CO can be
enhanced by higher temperature because of the exothermic nature of CO adsorption
process. Therefore the HT-PEM fuel cell shows better tolerance to CO than its low
temperature counterpart. In the temperature range of 180 – 210 oC, the HT-PEM
fuel cell can be operate with CO concentration up to 5% [40, 123]. By higher
operating temperature and lower current density, the CO poisoning effect can be
alleviated [124]. The platinum loading, fuel utilization and the flow channel
geometry can influence the CO poisoning [125]. Being diluted by N2 can deteriorate
the CO poisoning to a large extend [126]. Except for fast degradation in cell
performance, the CO can also cause heterogeneity in current density distribution. In
regions near the fuel inlet the current density increases, while in regions near the
fuel outlet the current density drops [127]. Under higher CO concentration and
higher current load conditions, the current density becomes more uneven. Engl et
al. [128, 129] reported that the CO in the reformate gas can help to alleviate the
carbon corrosion induced by startup/shutdown operation.
The CO poisoning on the HT-PEM fuel cell was widely investigated by numerical
modeling. In the CO poisoning model developed by Bergmann et al. [130], the
adsorption/desorption of CO was treated as a Frumkin isothermal process due to the
interaction of adsorbed and non-adsorbed CO molecules. While in the model
developed by Jiao et al. [131], the adsorption/desorption of CO was assumed to
follow the Langmuir kinetics. On the base of the model in [131], the effect of flow
channel configuration on the CO poisoning was studied [132]. The results
suggested that the cell voltage loss caused by CO was more severe with interdigital
and serpentine flow channel than with parallel flow channel. In the model
developed by Oh et al. [133], the H2 adsorption kinetics was treated as a function of
DEGRADATION OF H3PO4/PBI HIGH TEMPERATURE POLYMER ELECTROLYTE MEMBRANE FUEL CELL UNDER STRESSED OPERATING CONDITIONS
22
CO coverage, which can improve the simulation results. The model considering the
effect of CO to the transient behaviors of the HT-PEM fuel cell during startup
process was developed by Rasheed and Chan [134]. The results revealed the high
current load and CO concentration and low temperature increase rate should be
avoided to prevent sudden drop in cell voltage during startup process.
Several methods have been developed in order to minimize the poisoning effect of
CO to the PEM fuel cells. Generally, the higher operating temperature, employment
of CO tolerance catalyst and air bleeding are the common methods to mitigate the
CO poisoning effect. High operating temperature can effectively reduce the
performance loss of the HT-PEM fuel cell caused by CO poisoning. However, high
temperature brings about more severe degradation on all components of the HT-
PEM fuel cell, which could shorten the lifetime. Therefore the optimum operating
temperature needs further investigation to take both CO tolerance and durability
into account. Alloying the platinum with the second or even the third element to
form binary or ternary platinum alloy can improve the CO tolerance [135]. The
enhanced CO oxidation by the addition of the second or the third element is
ascribed to the mechanism for the improving CO tolerance. Modestov et al. [136]
investigated the CO oxidation on pure Pt and Pt-Ru surface in high temperature
PBI/H3PO4 MEAs. The results showed the CO oxidation rate on Pt-Ru catalyst
surface is 20 times higher on pure Pt surface at the same electrode potential.
Although the Pt alloys show better CO tolerance than pure Pt, the stability and
activity of platinum alloys are lower [137], which need to be improved in the future.
Air bleeding is a simple method to eliminate the CO poisoning effect to the PEM
fuel cell. By introducing low level of oxidant such as air or O2, the CO can be
eliminated by selective oxidation. For LT-PEM fuel cell, it was reported the cell
performance loss caused by 200 ppm CO can be recovered by 5% air bleeding. The
application of air bleeding on HT-PEM fuel cell has not been seen in the literature.
2.4.3.2 Carbon dioxide
The CO2 is a typical byproduct in the steam reforming process. Its concentration in
the reformate gas can be around 25%vol. The main poisoning mechanism of CO2 in
the PEM fuel cell is the dilution. Moreover, the CO2 can be converted to CO
through reverse water gas shift reaction.
Under the typical operating conditions of LT-PEM fuel cell, the CO concentration
formed through reverse water gas shift reaction by the gas mixture of 75% H2 and
25% CO2 can be in the range of 20 – 100 ppm, which can be harmful to the cell
performance [138]. It was reported the CO produced from reverse water gas shift
reaction can cover more than half of the catalyst surface area under the operating
temperature of 50 – 70 oC [139]. Under the operating conditions of HT-PEM fuel
cell, the CO concentration formed through reverse water gas shift reaction can be
even higher. On one hand, the operation of HT-PEM fuel cell does not rely on
CHAPTER 2. DEGRADATION ON HIGH TEMPERATURE PEM FUEL CELL
23
humidification. The absence of water in anode fuel stream can shift the equilibrium
of reverse water gas shift reaction to the formation of CO. On the other hand, higher
operating temperature favors the formation of CO through reverse water gas shift
reaction because of the endothermic nature of this reaction. However, Li et al. [124]
observed that the cell performance showed no significant change when replacing
the CO2 in the H2 by N2.
2.4.3.3 Other impurities
The unconverted fuel is usually presented in the reformate gas because the
conversion of fuel in a reformer can hardly go to 100%. Methanol is a popular fuel
used for H2 production via reformation. The influence of unconverted methanol in
the anode fuel stream has been investigated in the literatures [140, 141]. Araya et al.
[140] conducted a long-term durability test on a HT-PEM fuel cell in which the
concentrations of methanol-water vapor mixture varied in the range of between 3 %
and 8 %. The performance decay rate of the fuel cell was between -900µV/h and -
3400µV/h in this test. The poisoning mechanism of methanol can be either the
directly adsorbing on the platinum catalyst surface or the decomposing into CO
which strongly absorbing on the platinum surface. In a recent literature [141] they
characterized the performance of a high temperature PEM fuel cell at varying
temperatures and methanol concentrations in anode fuel stream. Overall negligible
effect was observed for methanol concentration below 3% in the operating
temperature range between 140 oC and 180 oC.
The effect of chloride as the contaminant in air side of a HT-PEM fuel cell on the
performance and durability was studied by Ali et al [29]. It is found that introducing
HCl into the air humidifier can decrease the fuel cell performance; however the
degradation is mostly reversible. The degradation of the fuel cell under potential
cycling condition was accelerated by the presence of chloride.
Sulfur containing species such as hydrogen sulfide and sulfur oxide are also typical
impurities presented in the fuel and air stream of the PEM fuel cell. The sulfur
poisoning mechanism for the low temperature PEM fuel cell has been widely
investigated. Like the CO, the sulfur containing species strongly adsorb on the
active sites of the catalyst, preventing hydrogen or oxygen from adsorbing on the
catalyst surface. It is suggested that the hydrogen sulfur concentration should be
below 1 ppm for low temperature PEM fuel cell [142]. For PBI based high
temperature PEM fuel cell, very limited work about the sulfur poisoning can be
found. Schmidt and Baurmeister investigated the effect of CO and hydrogen sulfur
on the cell performance and degradation of the high temperature PEM fuel cell
[143]. At the operating temperature of 180 oC, at least 10 ppm hydrogen sulfur can
be tolerated. The high temperature PEM fuel cell was operated for 3000 hours on
reformate gas containing 2% CO and 5 ppm hydrogen sulfur with similar
degradation rate to that for operated with pure hydrogen.
DEGRADATION OF H3PO4/PBI HIGH TEMPERATURE POLYMER ELECTROLYTE MEMBRANE FUEL CELL UNDER STRESSED OPERATING CONDITIONS
24
2.4.4. GAS STARVATIONS
Gas starvation of the fuel cell refers to the under supply of H2 in anode or air in
cathode. The situation which the overall gas stoichiometry is greater than 1.0 and
local region of the fuel cell is starved of gas is call ‘local gas starvation’. The
situation which the overall gas stoichiometry is less than 1.0 is called ‘overall gas
starvation’.
The local H2 starvation can be caused by gas maldistribution between different
regions of a single fuel cell and the startup operation after long-term shutdown.
Consequences and degradation mechanisms of local H2 starvation is similar to
degradation caused by startup/shutdown process, e.g. the reverse current decay
mechanism. The carbon corrosion in cathode catalyst layer can be caused by the
local H2 starvation. Inhomogeneous current density distributions are observed
during local H2 starvation and can reflect the severity of local H2 starvation [144,
145].
The overall H2 starvation can be caused by many factors [146]: uneven H2
distribution between different cells within a stack, fault in control of fuel supply
system and sudden increase in current load. The fuel starvation is detrimental to the
performance and durability of the PEM fuel cell. When the fuel cell is starved of
H2, the anode potential increases to be higher than cathode potential, which results
in the cell reversal [147]. Under this condition the fuel cell consumes energy from
other cells in the same stack, instead of generating electricity. More importantly, the
high anode potential triggers the carbon corrosion and water electrolysis reactions
in the anode catalyst layer. The occurrence of carbon corrosion and water
electrolysis reactions are proven by the existence of O2 and CO2 in anode exhaust
gas under H2 starvation condition [148]. The carbon corrosion causes loss of
platinum catalyst and the decrease in ECSA.
The air starvation is believed to be less harmful to the PEM fuel cell than the fuel
starvation [149]. Under air starvation condition, the cathode potential decreases to
be lower than the anode potential, which also results in the cell reversal [150].
Similar to the fuel starvation, air starvation causes the increase in current density in
upstream regions and decrease in downstream regions.
2.5. MOTIVATIONS AND OBJECTIVES OF THE CURRENT
PROJECT
Although the HT-PEM fuel cell shows many advantages over its low temperature
counterpart, the great challenge on the degradation brought by the high operating
temperature of the HT-PEM fuel cell is still the main obstacle which is hindering its
successful commercialization. The performance degradation of the HT-PEM fuel
CHAPTER 2. DEGRADATION ON HIGH TEMPERATURE PEM FUEL CELL
25
cell is inevitable during the operation process; however with better and more
comprehensive understanding of the degradation mechanisms, the performance
decay rate can be minimized. This project aims to gain better understanding of the
degradation mechanisms of the HT-PEM fuel cell under non-ideal operating
conditions, including start/stop cycling, impurities in anode stream and H2
starvation. These operating conditions are related to the real-life application of the
HT-PEM fuel cell. By investigating the degradation and failure modes of the HT-
PEM fuel cell under these operating conditions, this project can contribute to the
development of the HT-PEM fuel cell in terms of prolonging its lifetime.
2.6. SUMMARY
The HT-PEM fuel cell shows enhanced tolerance to the impurities such as CO in
the anode stream because of the high operating temperature. Therefore it can
directly utilize the reformate gas produced from fuel which usually contains CO
with concentration in the range of 1 – 5 %vol. However, the impurities in the anode
stream and high operating temperature bring about great challenges to the lifetime
and durability of the HT-PEM fuel cell. In this section the degradation mechanisms
of different components of the HT-PEM fuel cell are reviewed, giving the scientific
background of this project. In the following sections, the experiments about
degradation of HT-PEM fuel cell under different operating conditions are
presented, including the methodologies, the results and the conclusions of these
experiments.

DEGRADATION OF H3PO4/PBI HIGH TEMPERATURE POLYMER ELECTROLYTE MEMBRANE FUEL CELL UNDER STRESSED OPERATING CONDITIONS
26
CHAPTER 3. METHODOLOGIES
27
CHAPTER 3. METHODOLOGIES
This section first describes the experimental setup used in this project, including the
MEA, the single cell setup, the fuel cell test station and other instruments for fuel cell
characterization. Then the in-situ and ex-situ characterization techniques used in this
project are introduced. Lastly, the detailed experimental procedures of all the
experiments conducted in this project are described.
3.1. EXPERIMENTAL SETUP
3.1.1. MEA
The commercially available HT-PEM membrane electrode assembly Dapozol G77
produced by Danish Power System was used in this project. This type of MEA is
based on a 40 µm PBI membrane doped with phosphoric acid with the doping level
of around 9 per repeat PBI unit. The active cell area is 46.2 cm2 and the platinum
loading on both anode and cathode are 1.5 mg/cm2. The gas diffusion layer is
woven of carbon fiber with the thickness of 250 µm. The operating temperature of
this type of MEA is in the range of 120 – 180 oC.
3.1.2. SINGLE CELL SETUP AND CURRENT DENSITY DISTRIBUTION MEASUREMENT
The MEA was sandwiched between two graphite flow plates with double serpentine
flow channel and two stainless steel end plates to form a single cell setup. Teflon
gaskets with thickness of 250 µm and the assembly torque of 300 N·m were
adopted to ensure the gas tightness and proper compression on the MEA during
assembling. Four heaters (4×75 W) imbedded in the end plates can be used to heat
up and maintain the operating temperature of the single cell. The picture and the
schematic plot of the single cell setup are shown in Fig. 3.1.
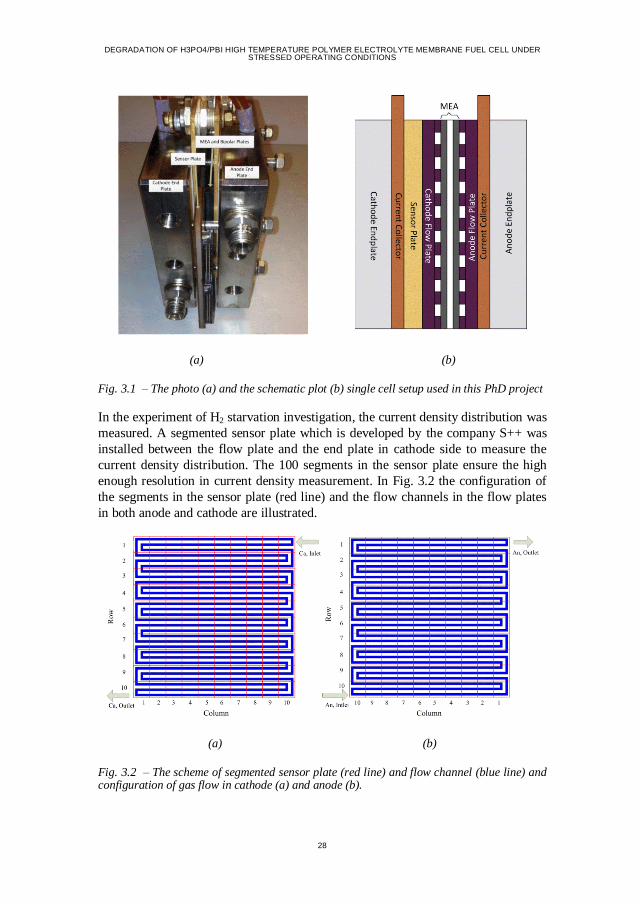
DEGRADATION OF H3PO4/PBI HIGH TEMPERATURE POLYMER ELECTROLYTE MEMBRANE FUEL CELL UNDER STRESSED OPERATING CONDITIONS
28
(a) (b)
Fig. 3.1 – The photo (a) and the schematic plot (b) single cell setup used in this PhD project
In the experiment of H2 starvation investigation, the current density distribution was
measured. A segmented sensor plate which is developed by the company S++ was
installed between the flow plate and the end plate in cathode side to measure the
current density distribution. The 100 segments in the sensor plate ensure the high
enough resolution in current density measurement. In Fig. 3.2 the configuration of
the segments in the sensor plate (red line) and the flow channels in the flow plates
in both anode and cathode are illustrated.
(a) (b)
Fig. 3.2 – The scheme of segmented sensor plate (red line) and flow channel (blue line) and configuration of gas flow in cathode (a) and anode (b).
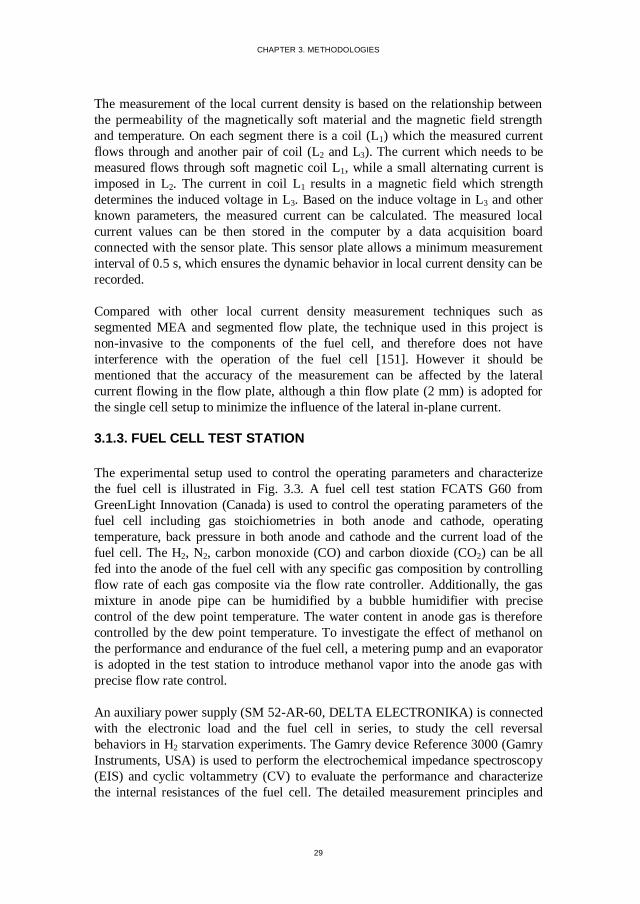
CHAPTER 3. METHODOLOGIES
29
The measurement of the local current density is based on the relationship between
the permeability of the magnetically soft material and the magnetic field strength
and temperature. On each segment there is a coil (L1) which the measured current
flows through and another pair of coil (L2 and L3). The current which needs to be
measured flows through soft magnetic coil L1, while a small alternating current is
imposed in L2. The current in coil L1 results in a magnetic field which strength
determines the induced voltage in L3. Based on the induce voltage in L3 and other
known parameters, the measured current can be calculated. The measured local
current values can be then stored in the computer by a data acquisition board
connected with the sensor plate. This sensor plate allows a minimum measurement
interval of 0.5 s, which ensures the dynamic behavior in local current density can be
recorded.
Compared with other local current density measurement techniques such as
segmented MEA and segmented flow plate, the technique used in this project is
non-invasive to the components of the fuel cell, and therefore does not have
interference with the operation of the fuel cell [151]. However it should be
mentioned that the accuracy of the measurement can be affected by the lateral
current flowing in the flow plate, although a thin flow plate (2 mm) is adopted for
the single cell setup to minimize the influence of the lateral in-plane current.
3.1.3. FUEL CELL TEST STATION
The experimental setup used to control the operating parameters and characterize
the fuel cell is illustrated in Fig. 3.3. A fuel cell test station FCATS G60 from
GreenLight Innovation (Canada) is used to control the operating parameters of the
fuel cell including gas stoichiometries in both anode and cathode, operating
temperature, back pressure in both anode and cathode and the current load of the
fuel cell. The H2, N2, carbon monoxide (CO) and carbon dioxide (CO2) can be all
fed into the anode of the fuel cell with any specific gas composition by controlling
flow rate of each gas composite via the flow rate controller. Additionally, the gas
mixture in anode pipe can be humidified by a bubble humidifier with precise
control of the dew point temperature. The water content in anode gas is therefore
controlled by the dew point temperature. To investigate the effect of methanol on
the performance and endurance of the fuel cell, a metering pump and an evaporator
is adopted in the test station to introduce methanol vapor into the anode gas with
precise flow rate control.
An auxiliary power supply (SM 52-AR-60, DELTA ELECTRONIKA) is connected
with the electronic load and the fuel cell in series, to study the cell reversal
behaviors in H2 starvation experiments. The Gamry device Reference 3000 (Gamry
Instruments, USA) is used to perform the electrochemical impedance spectroscopy
(EIS) and cyclic voltammetry (CV) to evaluate the performance and characterize
the internal resistances of the fuel cell. The detailed measurement principles and
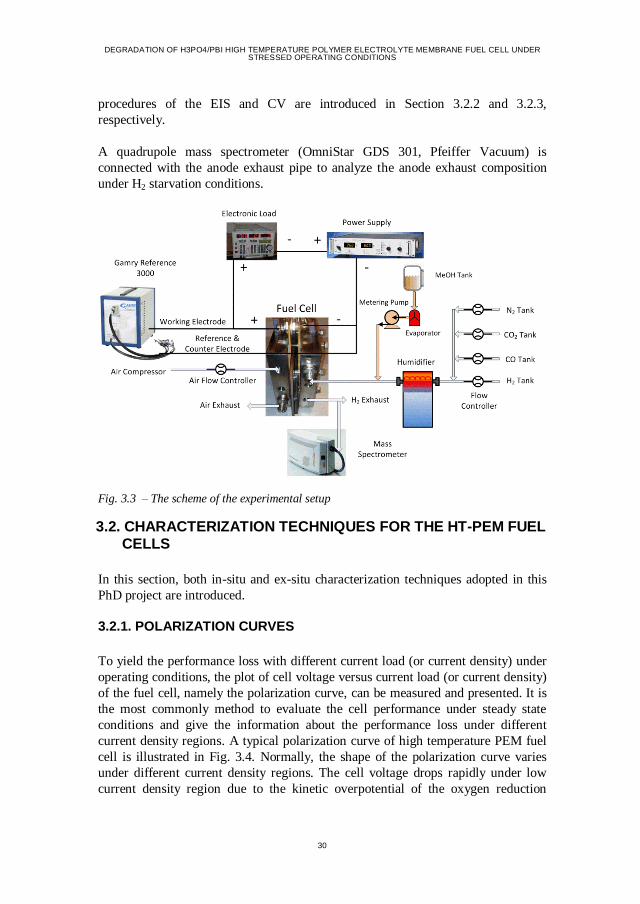
DEGRADATION OF H3PO4/PBI HIGH TEMPERATURE POLYMER ELECTROLYTE MEMBRANE FUEL CELL UNDER STRESSED OPERATING CONDITIONS
30
procedures of the EIS and CV are introduced in Section 3.2.2 and 3.2.3,
respectively.
A quadrupole mass spectrometer (OmniStar GDS 301, Pfeiffer Vacuum) is
connected with the anode exhaust pipe to analyze the anode exhaust composition
under H2 starvation conditions.
Fig. 3.3 – The scheme of the experimental setup
3.2. CHARACTERIZATION TECHNIQUES FOR THE HT-PEM FUEL
CELLS
In this section, both in-situ and ex-situ characterization techniques adopted in this
PhD project are introduced.
3.2.1. POLARIZATION CURVES
To yield the performance loss with different current load (or current density) under
operating conditions, the plot of cell voltage versus current load (or current density)
of the fuel cell, namely the polarization curve, can be measured and presented. It is
the most commonly method to evaluate the cell performance under steady state
conditions and give the information about the performance loss under different
current density regions. A typical polarization curve of high temperature PEM fuel
cell is illustrated in Fig. 3.4. Normally, the shape of the polarization curve varies
under different current density regions. The cell voltage drops rapidly under low
current density region due to the kinetic overpotential of the oxygen reduction
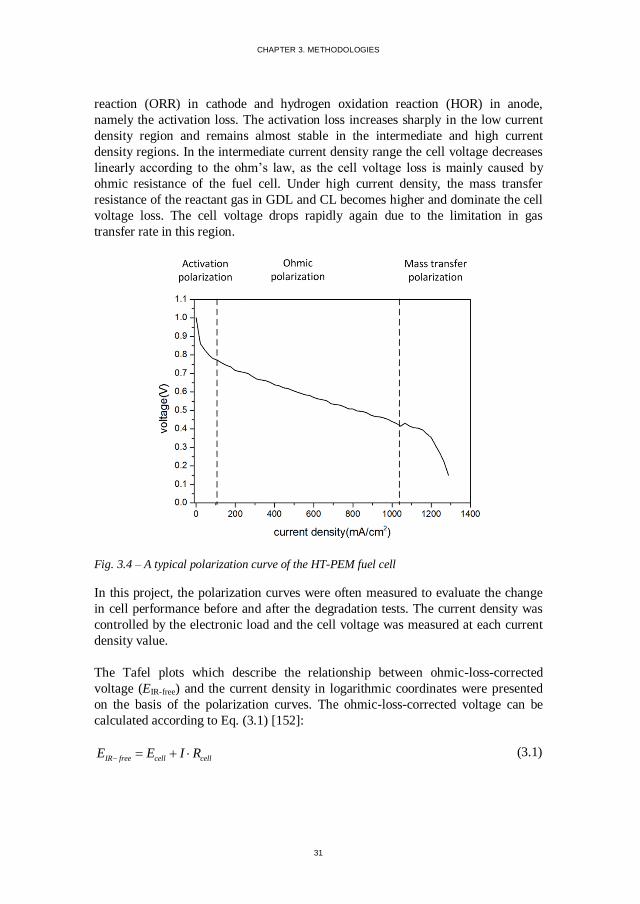
CHAPTER 3. METHODOLOGIES
31
reaction (ORR) in cathode and hydrogen oxidation reaction (HOR) in anode,
namely the activation loss. The activation loss increases sharply in the low current
density region and remains almost stable in the intermediate and high current
density regions. In the intermediate current density range the cell voltage decreases
linearly according to the ohm’s law, as the cell voltage loss is mainly caused by
ohmic resistance of the fuel cell. Under high current density, the mass transfer
resistance of the reactant gas in GDL and CL becomes higher and dominate the cell
voltage loss. The cell voltage drops rapidly again due to the limitation in gas
transfer rate in this region.
Fig. 3.4 – A typical polarization curve of the HT-PEM fuel cell
In this project, the polarization curves were often measured to evaluate the change
in cell performance before and after the degradation tests. The current density was
controlled by the electronic load and the cell voltage was measured at each current
density value.
The Tafel plots which describe the relationship between ohmic-loss-corrected
voltage (EIR-free) and the current density in logarithmic coordinates were presented
on the basis of the polarization curves. The ohmic-loss-corrected voltage can be
calculated according to Eq. (3.1) [152]:
IR free cell cellE E I R (3.1)
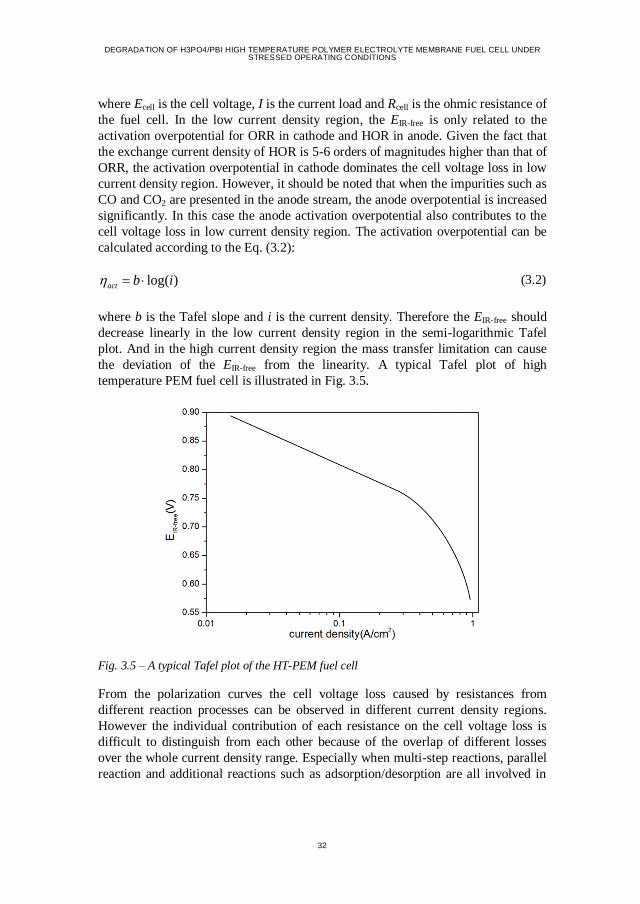
DEGRADATION OF H3PO4/PBI HIGH TEMPERATURE POLYMER ELECTROLYTE MEMBRANE FUEL CELL UNDER STRESSED OPERATING CONDITIONS
32
where Ecell is the cell voltage, I is the current load and Rcell is the ohmic resistance of
the fuel cell. In the low current density region, the EIR-free is only related to the
activation overpotential for ORR in cathode and HOR in anode. Given the fact that
the exchange current density of HOR is 5-6 orders of magnitudes higher than that of
ORR, the activation overpotential in cathode dominates the cell voltage loss in low
current density region. However, it should be noted that when the impurities such as
CO and CO2 are presented in the anode stream, the anode overpotential is increased
significantly. In this case the anode activation overpotential also contributes to the
cell voltage loss in low current density region. The activation overpotential can be
calculated according to the Eq. (3.2):
log( )act b i (3.2)
where b is the Tafel slope and i is the current density. Therefore the EIR-free should
decrease linearly in the low current density region in the semi-logarithmic Tafel
plot. And in the high current density region the mass transfer limitation can cause
the deviation of the EIR-free from the linearity. A typical Tafel plot of high
temperature PEM fuel cell is illustrated in Fig. 3.5.
Fig. 3.5 – A typical Tafel plot of the HT-PEM fuel cell
From the polarization curves the cell voltage loss caused by resistances from
different reaction processes can be observed in different current density regions.
However the individual contribution of each resistance on the cell voltage loss is
difficult to distinguish from each other because of the overlap of different losses
over the whole current density range. Especially when multi-step reactions, parallel
reaction and additional reactions such as adsorption/desorption are all involved in
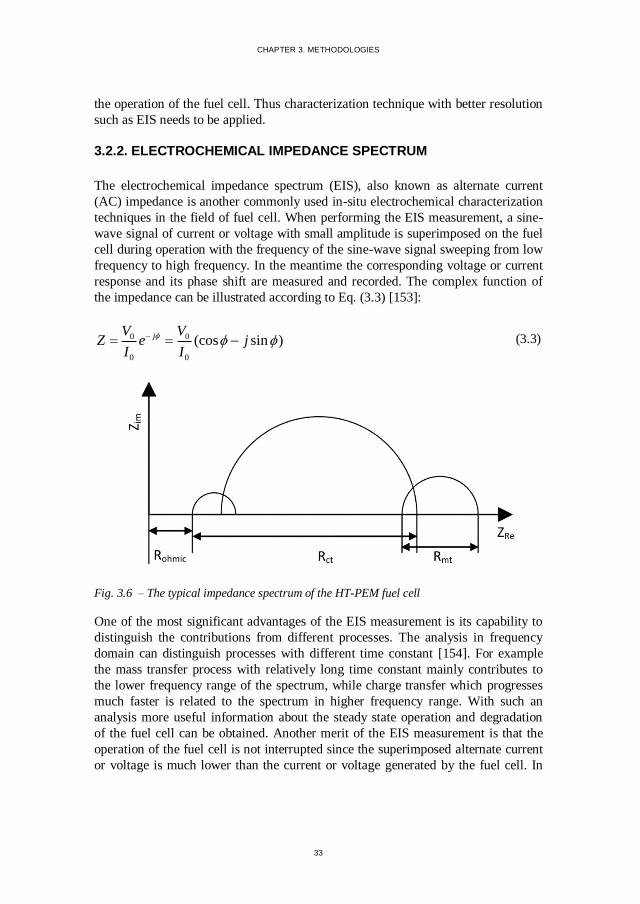
CHAPTER 3. METHODOLOGIES
33
the operation of the fuel cell. Thus characterization technique with better resolution
such as EIS needs to be applied.
3.2.2. ELECTROCHEMICAL IMPEDANCE SPECTRUM
The electrochemical impedance spectrum (EIS), also known as alternate current
(AC) impedance is another commonly used in-situ electrochemical characterization
techniques in the field of fuel cell. When performing the EIS measurement, a sine-
wave signal of current or voltage with small amplitude is superimposed on the fuel
cell during operation with the frequency of the sine-wave signal sweeping from low
frequency to high frequency. In the meantime the corresponding voltage or current
response and its phase shift are measured and recorded. The complex function of
the impedance can be illustrated according to Eq. (3.3) [153]:
0 0
0 0
(cos sin )jV VZ e j
I I
(3.3)
Fig. 3.6 – The typical impedance spectrum of the HT-PEM fuel cell
One of the most significant advantages of the EIS measurement is its capability to
distinguish the contributions from different processes. The analysis in frequency
domain can distinguish processes with different time constant [154]. For example
the mass transfer process with relatively long time constant mainly contributes to
the lower frequency range of the spectrum, while charge transfer which progresses
much faster is related to the spectrum in higher frequency range. With such an
analysis more useful information about the steady state operation and degradation
of the fuel cell can be obtained. Another merit of the EIS measurement is that the
operation of the fuel cell is not interrupted since the superimposed alternate current
or voltage is much lower than the current or voltage generated by the fuel cell. In
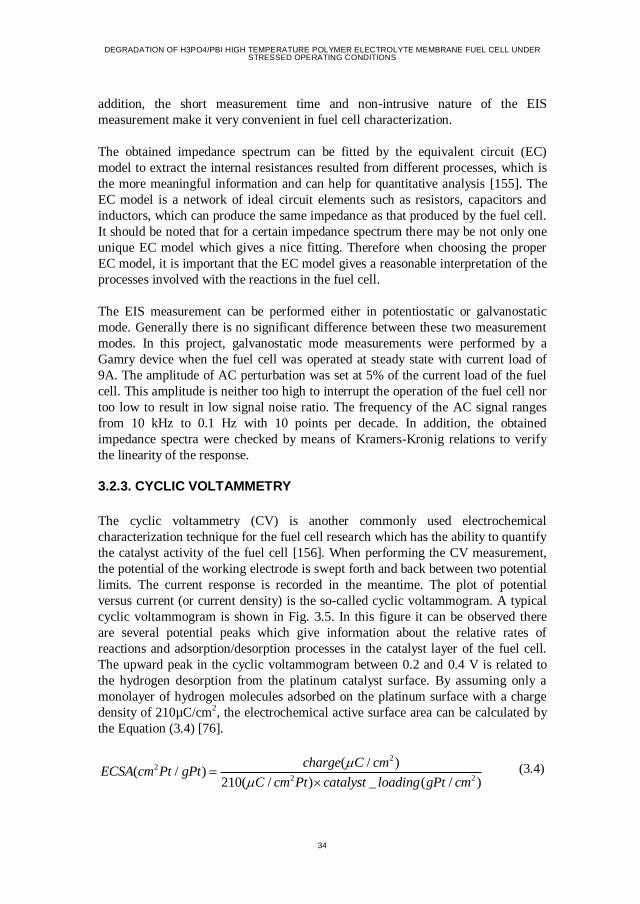
DEGRADATION OF H3PO4/PBI HIGH TEMPERATURE POLYMER ELECTROLYTE MEMBRANE FUEL CELL UNDER STRESSED OPERATING CONDITIONS
34
addition, the short measurement time and non-intrusive nature of the EIS
measurement make it very convenient in fuel cell characterization.
The obtained impedance spectrum can be fitted by the equivalent circuit (EC)
model to extract the internal resistances resulted from different processes, which is
the more meaningful information and can help for quantitative analysis [155]. The
EC model is a network of ideal circuit elements such as resistors, capacitors and
inductors, which can produce the same impedance as that produced by the fuel cell.
It should be noted that for a certain impedance spectrum there may be not only one
unique EC model which gives a nice fitting. Therefore when choosing the proper
EC model, it is important that the EC model gives a reasonable interpretation of the
processes involved with the reactions in the fuel cell.
The EIS measurement can be performed either in potentiostatic or galvanostatic
mode. Generally there is no significant difference between these two measurement
modes. In this project, galvanostatic mode measurements were performed by a
Gamry device when the fuel cell was operated at steady state with current load of
9A. The amplitude of AC perturbation was set at 5% of the current load of the fuel
cell. This amplitude is neither too high to interrupt the operation of the fuel cell nor
too low to result in low signal noise ratio. The frequency of the AC signal ranges
from 10 kHz to 0.1 Hz with 10 points per decade. In addition, the obtained
impedance spectra were checked by means of Kramers-Kronig relations to verify
the linearity of the response.
3.2.3. CYCLIC VOLTAMMETRY
The cyclic voltammetry (CV) is another commonly used electrochemical
characterization technique for the fuel cell research which has the ability to quantify
the catalyst activity of the fuel cell [156]. When performing the CV measurement,
the potential of the working electrode is swept forth and back between two potential
limits. The current response is recorded in the meantime. The plot of potential
versus current (or current density) is the so-called cyclic voltammogram. A typical
cyclic voltammogram is shown in Fig. 3.5. In this figure it can be observed there
are several potential peaks which give information about the relative rates of
reactions and adsorption/desorption processes in the catalyst layer of the fuel cell.
The upward peak in the cyclic voltammogram between 0.2 and 0.4 V is related to
the hydrogen desorption from the platinum catalyst surface. By assuming only a
monolayer of hydrogen molecules adsorbed on the platinum surface with a charge
density of 210µC/cm2, the electrochemical active surface area can be calculated by
the Equation (3.4) [76].
22
2 2
( / )( / )
210( / ) _ ( / )
charge C cmECSA cm Pt gPt
C cm Pt catalyst loading gPt cm
(3.4)
CHAPTER 3. METHODOLOGIES
35
Fig. 3.7 – The typical cyclic voltammogram of a HT-PEM fuel cell in the potential range of 0.05 V and 1.0 V
In this project, when performing the CV measurement, the cathode was treated as
the working electrode since the degradation in cathode is more severe and of more
interest. While the anode was treated as reference and counter electrode. The H2 and
N2 were fed to anode and cathode, respectively. The potential of the cathode was
swept between 0.05 V and 0.5 V with a sweep rate of 0.01 V/s.
3.2.4. SCANNING ELECTRON MICROSCOPY
The scanning electron microscopy (SEM) can be used as a post-mortem analysis,
which can characterize the microstructure of the MEA. It is believed that the
changes in microstructure of the MEA illustrate the mechanisms of the degradation
of the fuel cell, such as the thinning of the membrane and the catalyst layer, the
cracking and delamination of the membrane, and carbon corrosion in the catalyst
layer and the GDL.
In this project, the cross-section images of the MEA was characterized by the SEM
(EVO LS15, Zeiss) operated at 20 kV. The MEA sample was prepared by cutting
using a sharp knife.
3.2.5. X-RAY DIFFRACTION
The X-ray diffraction (XRD) is a common technique to study the structure of
crystalline based on the constructive interference of monochromatic X-rays and the
crystalline sample. For characterization of the fuel cell, it is widely used to estimate
DEGRADATION OF H3PO4/PBI HIGH TEMPERATURE POLYMER ELECTROLYTE MEMBRANE FUEL CELL UNDER STRESSED OPERATING CONDITIONS
36
the crystallite size of the platinum particles using Scherrer’s equation on the basis
of diffraction peaks [157]:
2 max
0.9
cosL
(3.5)
In this project the XRD analysis was performed on the catalyst samples scratched
from the catalyst layer of the fuel cell. The experiment was conducted on an X-ray
diffractometer (Empyrean, PANalytical) equipped with a Cu Kα1 (λ=1.540598 Å)
X-ray source operated at 40 kV and 25 mA. The samples were scanned between 30o
and 90o for 2θ with the scan rate of 2omin-1.
3.2.6. MASS SPECTROMETRY
The mass spectrometry is an analytical chemistry technique which can help to
identify the composition of the mixture by measuring the mass to charge ratio of the
ionized fragments of the gas molecules and corresponding abundance. In a typical
mass spectrometer, the gas molecules are first ionized by the collision with high
energy electrons and knocking out one of the electrons to give a positive ion. Then
the ionized fragments are accelerated to the same kinetic energy. With different
deflection in the electromagnetic field, the fragments with different mass to charge
ratio can be separated and detected by the detector separately. Higher strength of
signal detected at a certain mass to charge ratio indicates more fragments with this
mass to charge ratio.
In this project a quadrupole mass spectrometer (OmniStar GDS 301, Pfeiffer
Vacuum) was used to analyze the gas composition of the anode exhaust of the fuel
cell.
3.3. EXPERIMENTAL PROCEDURES
In Section 3.3, the break-in which is conducted in all the fuel cells used in this
project is introduced first, followed by the experimental procedures of all the
experiments conducted in this project.
3.3.1. BREAK-IN
The break-in (or activation/conditioning) process is needed for a HT-PEM fuel cell
to achieve its best performance. Different break-in modes are introduced in the
literature [158]. It was reported the continuous galvanostatic break-in brings about
deeper activation and higher performance for the HT-PEM fuel cell, although the
time needed for discontinuous break-in and potential cycling break-in is shorter
[159]. In this project, a galvanostatic break-in as suggested by the manufacturer of
CHAPTER 3. METHODOLOGIES
37
the MEA was performed on each single cell before the experiments. The operating
temperature was set at 160 oC, and the stoichiometries at anode and cathode are 1.5
and 4, respectively. The current load of the single cell was maintained at 9A
(200mA/cm2). The cell voltage was monitored during the break-in, and a stable
value on the cell voltage over a certain period (several hours) indicates the end of
the break-in.
3.3.2. LONG-TERM DEGRADATION TEST
To investigate the degradation of the PBI/H3PO4 HT-PEM fuel cell under steady
state and start/stop conditions and in the presence of methanol, degradation tests
were performed on two HT-PEM fuel cells.
A 24-hour break-in was performed on the first cell, followed by the 100-hour
operation under constant steady state condition with constant current load of
300mA/cm2. After that, the fuel cell was operated at the 12-hour startup/12-hour
shutdown condition for 120 hours. During the startup process, the H2 and air were
supplied after the fuel cell was first heated up to 120 oC. After the 12-hour
operation, the heaters of the fuel cell were shut off. When the cell temperature
deceased below 120 oC, the electronic load was disconnected and the gas supply
was turned off. During the shutdown period, the fuel cell was cooled down to room
temperature and exhaust was closed at anode and cathode. After the 120-h
startup/shutdown cycling, the fuel cell was operated at steady state condition with
methanol in the fuel stream to study the effect of methanol slip on the degradation
of the HT-PEM fuel cell. The gas composition in this period was similar to that of
the reformate gas produced from a methanol reformer, except that the CO2 was
eliminated to investigate the effect of methanol alone. The following reaction was
considered for the steam reforming reaction in the methanol reformer:
3 2 2 2 3 23 ( )unreactedCH OH H O H CO CH OH H O (3.6)
The steam to carbon ratio in the reformer was assumed to be 1.5, and side reactions
which bring about the formation of CO such as methanol decomposition and
reverse water gas shift were neglected. The methanol conversion rate was assumed
to be 90%. Based on the assumptions made, the simulated reformate was consist of
H2, H2O and methanol with volume fraction of 79.11%, 17.95% and 2.94%,
respectively.
After the first single cell was designated the end of life because of a series of
emergency stops of the test station, the degradation tests were performed on the
second single cell. It experienced a 110-h break-in and a continuous test. After that,
a continuous test and a reformate startup/shutdown test with simulated reformate as
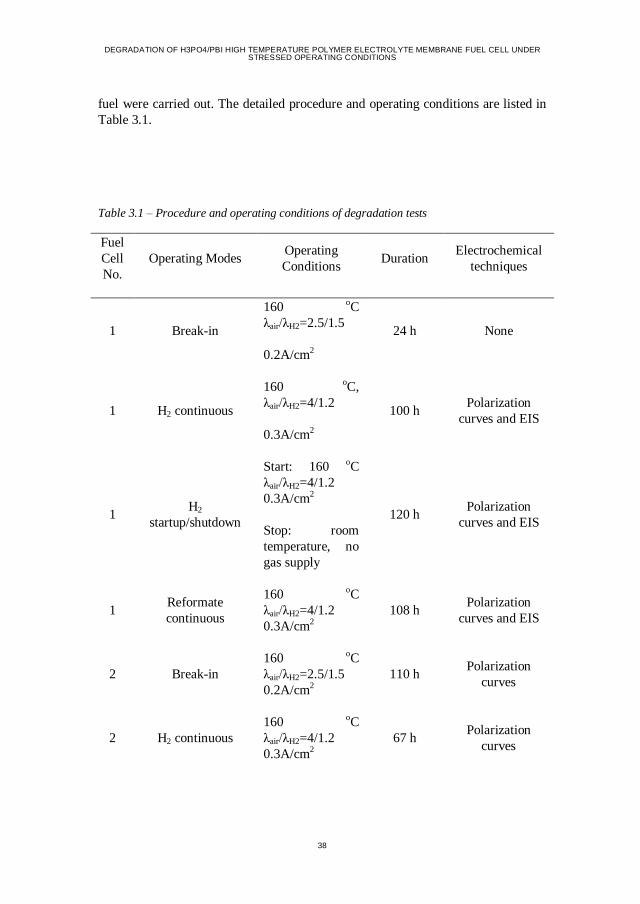
DEGRADATION OF H3PO4/PBI HIGH TEMPERATURE POLYMER ELECTROLYTE MEMBRANE FUEL CELL UNDER STRESSED OPERATING CONDITIONS
38
fuel were carried out. The detailed procedure and operating conditions are listed in
Table 3.1.
Table 3.1 – Procedure and operating conditions of degradation tests
Fuel
Cell
No.
Operating Modes Operating
Conditions Duration
Electrochemical
techniques
1 Break-in
160 oC
λair/λH2=2.5/1.5
0.2A/cm2
24 h None
1 H2 continuous
160 oC,
λair/λH2=4/1.2
0.3A/cm2
100 h Polarization
curves and EIS
1 H2
startup/shutdown
Start: 160 oC
λair/λH2=4/1.2
0.3A/cm2
120 h Polarization
curves and EIS Stop: room
temperature, no
gas supply
1 Reformate
continuous
160 oC
λair/λH2=4/1.2
0.3A/cm2
108 h Polarization
curves and EIS
2 Break-in
160 oC
λair/λH2=2.5/1.5
0.2A/cm2
110 h Polarization
curves
2 H2 continuous
160 oC
λair/λH2=4/1.2
0.3A/cm2
67 h Polarization
curves
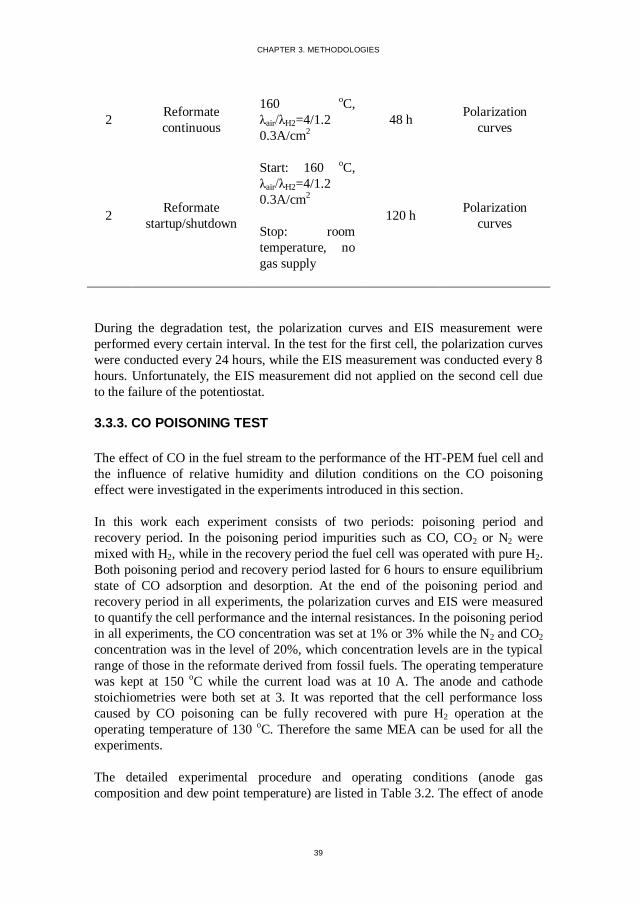
CHAPTER 3. METHODOLOGIES
39
2 Reformate
continuous
160 oC,
λair/λH2=4/1.2
0.3A/cm2
48 h Polarization
curves
2 Reformate
startup/shutdown
Start: 160 oC,
λair/λH2=4/1.2
0.3A/cm2
120 h Polarization
curves Stop: room
temperature, no
gas supply
During the degradation test, the polarization curves and EIS measurement were
performed every certain interval. In the test for the first cell, the polarization curves
were conducted every 24 hours, while the EIS measurement was conducted every 8
hours. Unfortunately, the EIS measurement did not applied on the second cell due
to the failure of the potentiostat.
3.3.3. CO POISONING TEST
The effect of CO in the fuel stream to the performance of the HT-PEM fuel cell and
the influence of relative humidity and dilution conditions on the CO poisoning
effect were investigated in the experiments introduced in this section.
In this work each experiment consists of two periods: poisoning period and
recovery period. In the poisoning period impurities such as CO, CO2 or N2 were
mixed with H2, while in the recovery period the fuel cell was operated with pure H2.
Both poisoning period and recovery period lasted for 6 hours to ensure equilibrium
state of CO adsorption and desorption. At the end of the poisoning period and
recovery period in all experiments, the polarization curves and EIS were measured
to quantify the cell performance and the internal resistances. In the poisoning period
in all experiments, the CO concentration was set at 1% or 3% while the N2 and CO2
concentration was in the level of 20%, which concentration levels are in the typical
range of those in the reformate derived from fossil fuels. The operating temperature
was kept at 150 oC while the current load was at 10 A. The anode and cathode
stoichiometries were both set at 3. It was reported that the cell performance loss
caused by CO poisoning can be fully recovered with pure H2 operation at the
operating temperature of 130 oC. Therefore the same MEA can be used for all the
experiments.
The detailed experimental procedure and operating conditions (anode gas
composition and dew point temperature) are listed in Table 3.2. The effect of anode
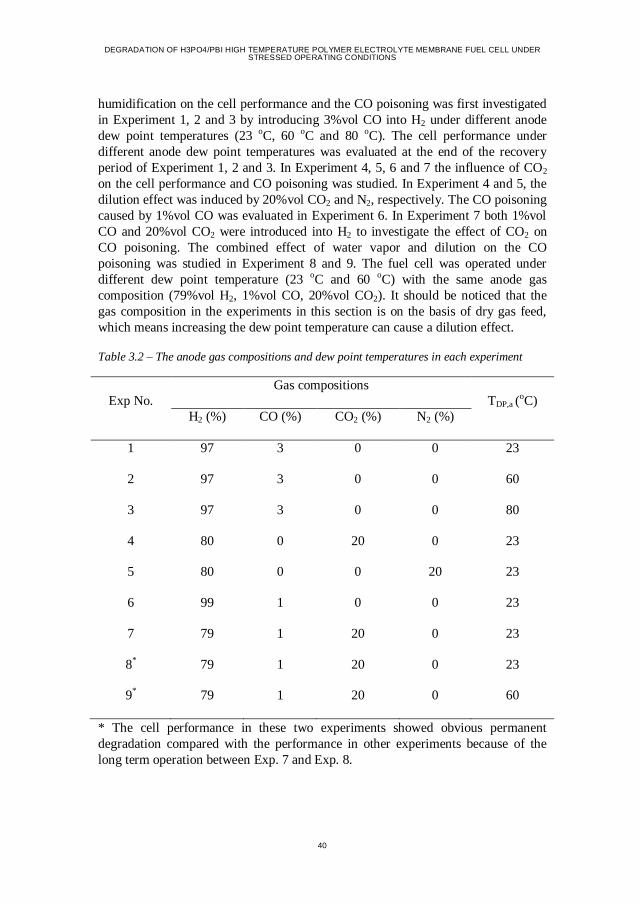
DEGRADATION OF H3PO4/PBI HIGH TEMPERATURE POLYMER ELECTROLYTE MEMBRANE FUEL CELL UNDER STRESSED OPERATING CONDITIONS
40
humidification on the cell performance and the CO poisoning was first investigated
in Experiment 1, 2 and 3 by introducing 3%vol CO into H2 under different anode
dew point temperatures (23 oC, 60 oC and 80 oC). The cell performance under
different anode dew point temperatures was evaluated at the end of the recovery
period of Experiment 1, 2 and 3. In Experiment 4, 5, 6 and 7 the influence of CO2
on the cell performance and CO poisoning was studied. In Experiment 4 and 5, the
dilution effect was induced by 20%vol CO2 and N2, respectively. The CO poisoning
caused by 1%vol CO was evaluated in Experiment 6. In Experiment 7 both 1%vol
CO and 20%vol CO2 were introduced into H2 to investigate the effect of CO2 on
CO poisoning. The combined effect of water vapor and dilution on the CO
poisoning was studied in Experiment 8 and 9. The fuel cell was operated under
different dew point temperature (23 oC and 60 oC) with the same anode gas
composition (79%vol H2, 1%vol CO, 20%vol CO2). It should be noticed that the
gas composition in the experiments in this section is on the basis of dry gas feed,
which means increasing the dew point temperature can cause a dilution effect.
Table 3.2 – The anode gas compositions and dew point temperatures in each experiment
Exp No.
Gas compositions
TDP,a (oC)
H2 (%) CO (%) CO2 (%) N2 (%)
1 97 3 0 0 23
2 97 3 0 0 60
3 97 3 0 0 80
4 80 0 20 0 23
5 80 0 0 20 23
6 99 1 0 0 23
7 79 1 20 0 23
8* 79 1 20 0 23
9* 79 1 20 0 60
* The cell performance in these two experiments showed obvious permanent
degradation compared with the performance in other experiments because of the
long term operation between Exp. 7 and Exp. 8.
CHAPTER 3. METHODOLOGIES
41
3.3.4. H2 STARVATION
The H2 starvation has been proven can cause severe damage to the catalyst layer of
the LT-PEM fuel cell. In this work, some experiments on a HT-PEM fuel cell under
H2 starvation conditions was conducted to investigate the effect of H2 starvation to
the performance and degradation of the HT-PEM fuel cell. In Section 3.3.4.1, the
dynamic response of a HT-PEM fuel cell when H2 starvation occurs is measured.
The effects of H2 starvation degree and current load to the dynamic response are
also investigated. Then in Section 3.3.4.2, the degradation of a HT-PEM fuel cell
under H2 starvation condition is thoroughly investigated, including the degradation
mechanisms.
3.3.4.1 Dynamic behaviors of the HT-PEM fuel cell under H2 starvation
conditions
After the galvanostatic break-in, the fuel cell was operated at 150 oC with anode and
cathode stoichiometry of 3.0. To simulate the condition that the fuel cell was
starved of H2, the H2 stoichiometry in anode was decreased below 1.0 (0.8 and 0.4)
in all experiments, while the air stoichiometry in cathode was remained at 3.0. It is
worth pointing out that the H2/N2 mixture (70%/30% in volume) was fed to anode.
As reported in the literature [147] the H2 can be drawn back into the anode flow
channel of a single cell from the manifold in a fuel cell stack when this single cell
was starved of H2. In this work the long exhaust pipe of anode can act as the
manifold in a fuel cell stack. Therefore employing the H2/N2 mixture can help to
avoid ‘vacuum effect’. The H2 flow rate was determined by the stoichiometry value
and the current load, while the N2 flow rate was calculated according to the volume
fraction of N2 (30%vol) in the mixture. The total anode gas flow rate was the sum
of H2 flow rate and N2 flow rate. Different starvation degree of H2 was studied by
decreasing the H2 stoichiometry to different values. Additionally, the effect of
current load to the H2 starvation of the HT-PEM fuel cell was investigated. The
detailed current load and H2 stoichiometry are listed in Table. 3.3. Cell voltage and
local current density were monitored and recorded during the H2 starvation process
in each experiment. The anode exhaust gas composition under different H2
starvation conditions was analyzed by the mass spectrometer.
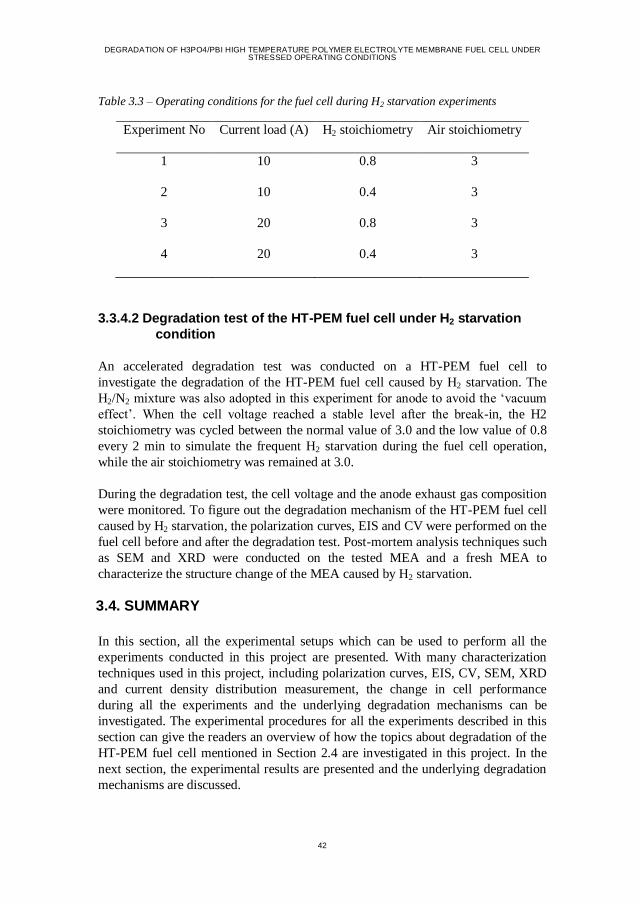
DEGRADATION OF H3PO4/PBI HIGH TEMPERATURE POLYMER ELECTROLYTE MEMBRANE FUEL CELL UNDER STRESSED OPERATING CONDITIONS
42
Table 3.3 – Operating conditions for the fuel cell during H2 starvation experiments
Experiment No Current load (A) H2 stoichiometry Air stoichiometry
1 10 0.8 3
2 10 0.4 3
3 20 0.8 3
4 20 0.4 3
3.3.4.2 Degradation test of the HT-PEM fuel cell under H2 starvation
condition
An accelerated degradation test was conducted on a HT-PEM fuel cell to
investigate the degradation of the HT-PEM fuel cell caused by H2 starvation. The
H2/N2 mixture was also adopted in this experiment for anode to avoid the ‘vacuum
effect’. When the cell voltage reached a stable level after the break-in, the H2
stoichiometry was cycled between the normal value of 3.0 and the low value of 0.8
every 2 min to simulate the frequent H2 starvation during the fuel cell operation,
while the air stoichiometry was remained at 3.0.
During the degradation test, the cell voltage and the anode exhaust gas composition
were monitored. To figure out the degradation mechanism of the HT-PEM fuel cell
caused by H2 starvation, the polarization curves, EIS and CV were performed on the
fuel cell before and after the degradation test. Post-mortem analysis techniques such
as SEM and XRD were conducted on the tested MEA and a fresh MEA to
characterize the structure change of the MEA caused by H2 starvation.
3.4. SUMMARY
In this section, all the experimental setups which can be used to perform all the
experiments conducted in this project are presented. With many characterization
techniques used in this project, including polarization curves, EIS, CV, SEM, XRD
and current density distribution measurement, the change in cell performance
during all the experiments and the underlying degradation mechanisms can be
investigated. The experimental procedures for all the experiments described in this
section can give the readers an overview of how the topics about degradation of the
HT-PEM fuel cell mentioned in Section 2.4 are investigated in this project. In the
next section, the experimental results are presented and the underlying degradation
mechanisms are discussed.
CHAPTER 4. RESULTS AND DISCUSSION
43
CHAPTER 4. RESULTS AND
DISCUSSION
This section gives the main contributions of this project. First the results of the
experiment about the long-term degradation under different operating conditions,
including the presence of methanol in the anode stream, are presented in Section
4.1. Then Section 4.2 presents the experimental results about the CO poisoning on
the HT-PEM fuel cell under different operating conditions. In Section 4.3 and 4.4,
the effects of H2 starvation to the cell performance and degradation are presented and
discussed.
4.1. LONG-TERM DEGRADATION TEST WITH THE PRESENCE
OF METHANOL
In this section, the results of the degradation tests with different operating
conditions including the presence of methanol in the anode gas performed on two
PBI/H3PO4 HT-PEM fuel cells are presented.
4.1.1. CELL VOLTAGE PROFILE
In Fig. 4.1 the voltage profile of the first fuel cell during the degradation test which
consists of a H2 continuous test, a H2 start/stop test and a reformate continuous test.
Before the degradation test, a 24-hour galvanostatic break-in was performed on the
fuel cell. As can be seen from Fig. 4.1, there was an obvious increase in the cell
voltage during the break-in in the first 24 hours. However, the cell voltage
continued to increase during the H2 continuous test, which indicates the break-in for
this type of fuel cell should be longer than 24 hours for DPS Dapozol MEAs.
According to the literature [158], the increased cell voltage during the break-in and
the H2 continuous test can be ascribed to the redistribution of phosphoric acid (PA)
between the membrane and the electrodes. During the start/stop test, the cell voltage
showed minor decreasing trend in the first two cycles, followed by a significant
drop between the second and the third cycle, and then kept stable in the last three
cycles. During the reformate continuous test, the cell voltage is significantly
reduced by the presence of methanol in the anode gas. In addition, many downward
spikes in the cell voltage profile in the reformate continuous test can be observed,
which lead to a permanent damage to the fuel cell.
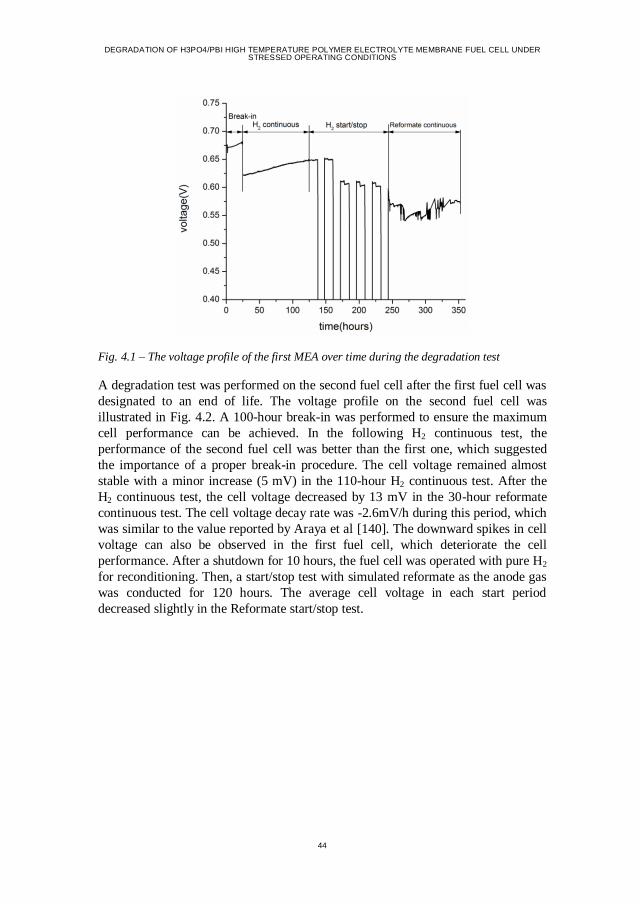
DEGRADATION OF H3PO4/PBI HIGH TEMPERATURE POLYMER ELECTROLYTE MEMBRANE FUEL CELL UNDER STRESSED OPERATING CONDITIONS
44
Fig. 4.1 – The voltage profile of the first MEA over time during the degradation test
A degradation test was performed on the second fuel cell after the first fuel cell was
designated to an end of life. The voltage profile on the second fuel cell was
illustrated in Fig. 4.2. A 100-hour break-in was performed to ensure the maximum
cell performance can be achieved. In the following H2 continuous test, the
performance of the second fuel cell was better than the first one, which suggested
the importance of a proper break-in procedure. The cell voltage remained almost
stable with a minor increase (5 mV) in the 110-hour H2 continuous test. After the
H2 continuous test, the cell voltage decreased by 13 mV in the 30-hour reformate
continuous test. The cell voltage decay rate was -2.6mV/h during this period, which
was similar to the value reported by Araya et al [140]. The downward spikes in cell
voltage can also be observed in the first fuel cell, which deteriorate the cell
performance. After a shutdown for 10 hours, the fuel cell was operated with pure H2
for reconditioning. Then, a start/stop test with simulated reformate as the anode gas
was conducted for 120 hours. The average cell voltage in each start period
decreased slightly in the Reformate start/stop test.
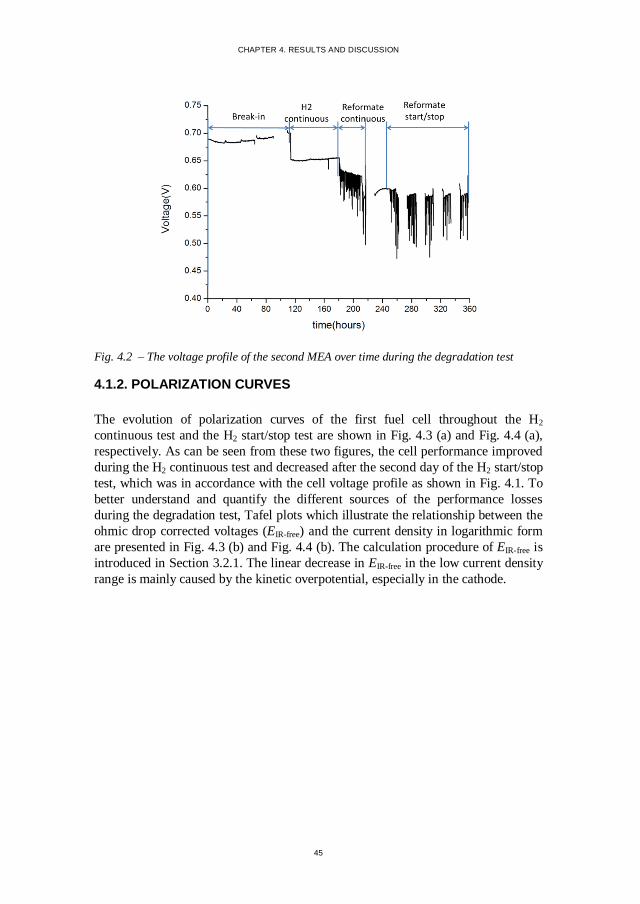
CHAPTER 4. RESULTS AND DISCUSSION
45
Fig. 4.2 – The voltage profile of the second MEA over time during the degradation test
4.1.2. POLARIZATION CURVES
The evolution of polarization curves of the first fuel cell throughout the H2
continuous test and the H2 start/stop test are shown in Fig. 4.3 (a) and Fig. 4.4 (a),
respectively. As can be seen from these two figures, the cell performance improved
during the H2 continuous test and decreased after the second day of the H2 start/stop
test, which was in accordance with the cell voltage profile as shown in Fig. 4.1. To
better understand and quantify the different sources of the performance losses
during the degradation test, Tafel plots which illustrate the relationship between the
ohmic drop corrected voltages (EIR-free) and the current density in logarithmic form
are presented in Fig. 4.3 (b) and Fig. 4.4 (b). The calculation procedure of EIR-free is
introduced in Section 3.2.1. The linear decrease in EIR-free in the low current density
range is mainly caused by the kinetic overpotential, especially in the cathode.
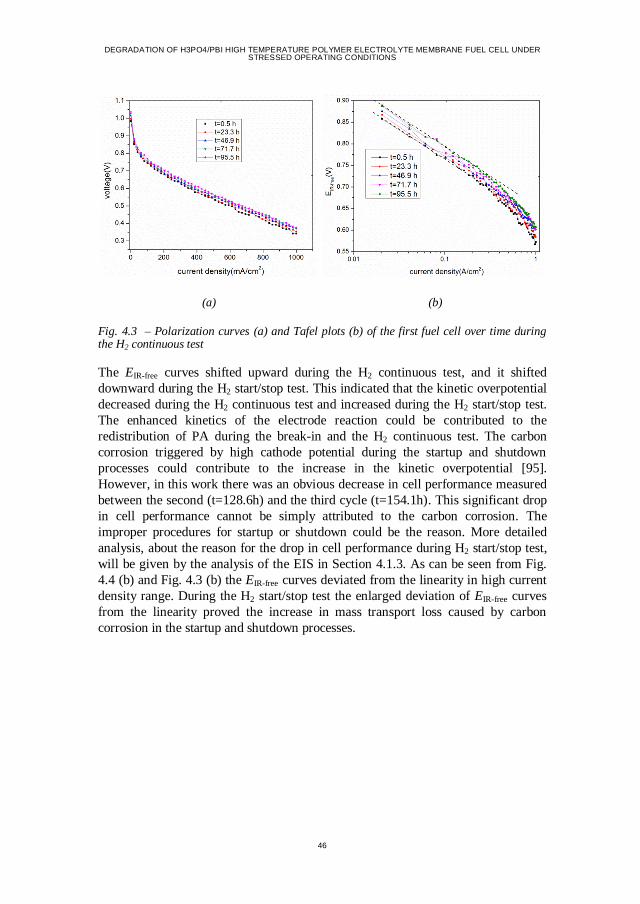
DEGRADATION OF H3PO4/PBI HIGH TEMPERATURE POLYMER ELECTROLYTE MEMBRANE FUEL CELL UNDER STRESSED OPERATING CONDITIONS
46
(a) (b)
Fig. 4.3 – Polarization curves (a) and Tafel plots (b) of the first fuel cell over time during the H2 continuous test
The EIR-free curves shifted upward during the H2 continuous test, and it shifted
downward during the H2 start/stop test. This indicated that the kinetic overpotential
decreased during the H2 continuous test and increased during the H2 start/stop test.
The enhanced kinetics of the electrode reaction could be contributed to the
redistribution of PA during the break-in and the H2 continuous test. The carbon
corrosion triggered by high cathode potential during the startup and shutdown
processes could contribute to the increase in the kinetic overpotential [95].
However, in this work there was an obvious decrease in cell performance measured
between the second (t=128.6h) and the third cycle (t=154.1h). This significant drop
in cell performance cannot be simply attributed to the carbon corrosion. The
improper procedures for startup or shutdown could be the reason. More detailed
analysis, about the reason for the drop in cell performance during H2 start/stop test,
will be given by the analysis of the EIS in Section 4.1.3. As can be seen from Fig.
4.4 (b) and Fig. 4.3 (b) the EIR-free curves deviated from the linearity in high current
density range. During the H2 start/stop test the enlarged deviation of EIR-free curves
from the linearity proved the increase in mass transport loss caused by carbon
corrosion in the startup and shutdown processes.
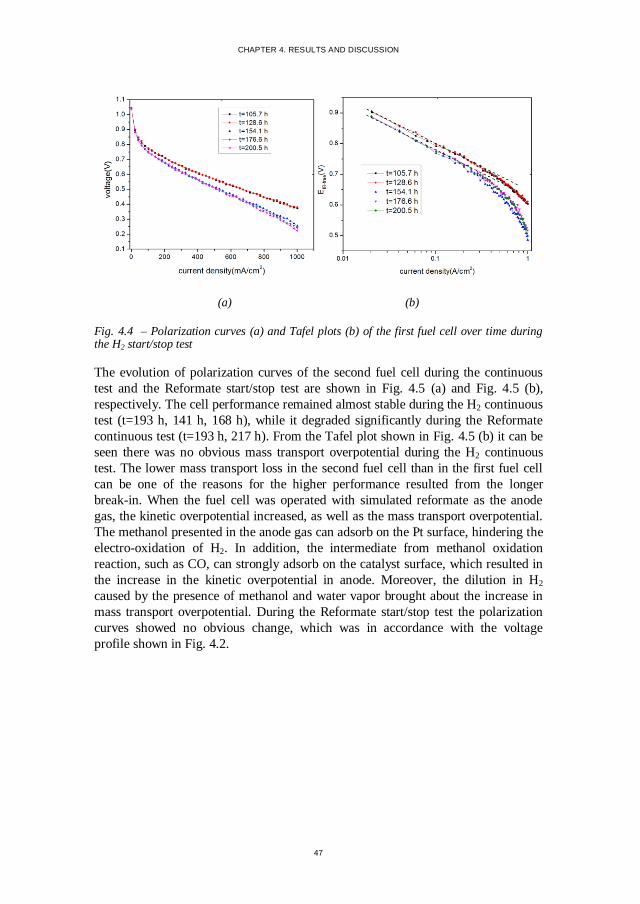
CHAPTER 4. RESULTS AND DISCUSSION
47
(a) (b)
Fig. 4.4 – Polarization curves (a) and Tafel plots (b) of the first fuel cell over time during the H2 start/stop test
The evolution of polarization curves of the second fuel cell during the continuous
test and the Reformate start/stop test are shown in Fig. 4.5 (a) and Fig. 4.5 (b),
respectively. The cell performance remained almost stable during the H2 continuous
test (t=193 h, 141 h, 168 h), while it degraded significantly during the Reformate
continuous test (t=193 h, 217 h). From the Tafel plot shown in Fig. 4.5 (b) it can be
seen there was no obvious mass transport overpotential during the H2 continuous
test. The lower mass transport loss in the second fuel cell than in the first fuel cell
can be one of the reasons for the higher performance resulted from the longer
break-in. When the fuel cell was operated with simulated reformate as the anode
gas, the kinetic overpotential increased, as well as the mass transport overpotential.
The methanol presented in the anode gas can adsorb on the Pt surface, hindering the
electro-oxidation of H2. In addition, the intermediate from methanol oxidation
reaction, such as CO, can strongly adsorb on the catalyst surface, which resulted in
the increase in the kinetic overpotential in anode. Moreover, the dilution in H2
caused by the presence of methanol and water vapor brought about the increase in
mass transport overpotential. During the Reformate start/stop test the polarization
curves showed no obvious change, which was in accordance with the voltage
profile shown in Fig. 4.2.
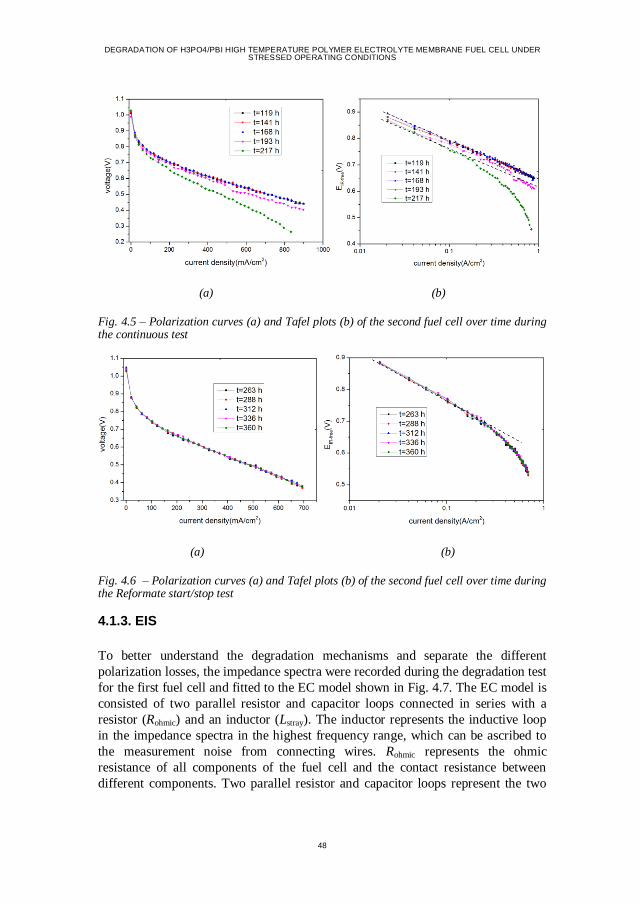
DEGRADATION OF H3PO4/PBI HIGH TEMPERATURE POLYMER ELECTROLYTE MEMBRANE FUEL CELL UNDER STRESSED OPERATING CONDITIONS
48
(a) (b)
Fig. 4.5 – Polarization curves (a) and Tafel plots (b) of the second fuel cell over time during the continuous test
(a) (b)
Fig. 4.6 – Polarization curves (a) and Tafel plots (b) of the second fuel cell over time during the Reformate start/stop test
4.1.3. EIS
To better understand the degradation mechanisms and separate the different
polarization losses, the impedance spectra were recorded during the degradation test
for the first fuel cell and fitted to the EC model shown in Fig. 4.7. The EC model is
consisted of two parallel resistor and capacitor loops connected in series with a
resistor (Rohmic) and an inductor (Lstray). The inductor represents the inductive loop
in the impedance spectra in the highest frequency range, which can be ascribed to
the measurement noise from connecting wires. Rohmic represents the ohmic
resistance of all components of the fuel cell and the contact resistance between
different components. Two parallel resistor and capacitor loops represent the two
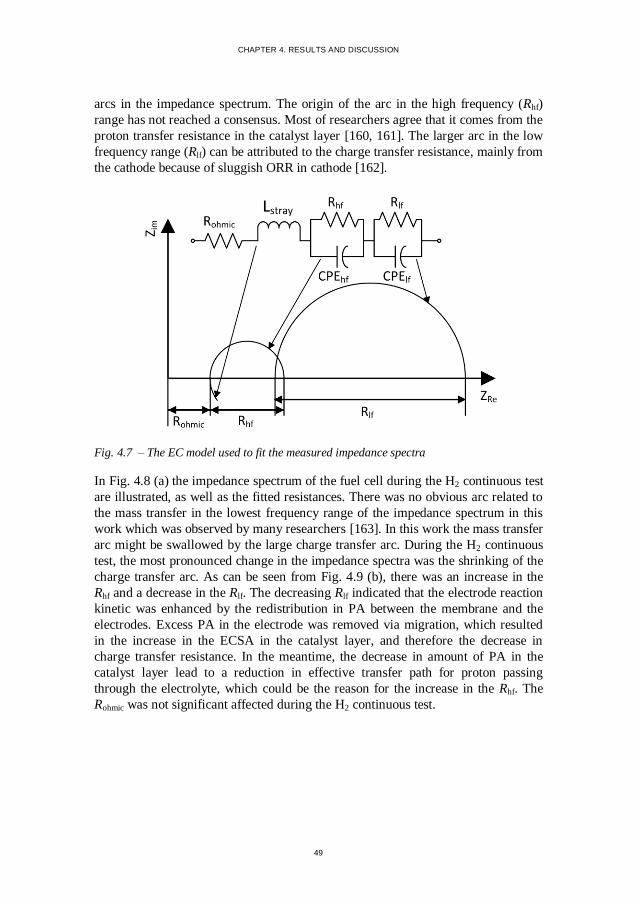
CHAPTER 4. RESULTS AND DISCUSSION
49
arcs in the impedance spectrum. The origin of the arc in the high frequency (Rhf)
range has not reached a consensus. Most of researchers agree that it comes from the
proton transfer resistance in the catalyst layer [160, 161]. The larger arc in the low
frequency range (Rlf) can be attributed to the charge transfer resistance, mainly from
the cathode because of sluggish ORR in cathode [162].
Fig. 4.7 – The EC model used to fit the measured impedance spectra
In Fig. 4.8 (a) the impedance spectrum of the fuel cell during the H2 continuous test
are illustrated, as well as the fitted resistances. There was no obvious arc related to
the mass transfer in the lowest frequency range of the impedance spectrum in this
work which was observed by many researchers [163]. In this work the mass transfer
arc might be swallowed by the large charge transfer arc. During the H2 continuous
test, the most pronounced change in the impedance spectra was the shrinking of the
charge transfer arc. As can be seen from Fig. 4.9 (b), there was an increase in the
Rhf and a decrease in the Rlf. The decreasing Rlf indicated that the electrode reaction
kinetic was enhanced by the redistribution in PA between the membrane and the
electrodes. Excess PA in the electrode was removed via migration, which resulted
in the increase in the ECSA in the catalyst layer, and therefore the decrease in
charge transfer resistance. In the meantime, the decrease in amount of PA in the
catalyst layer lead to a reduction in effective transfer path for proton passing
through the electrolyte, which could be the reason for the increase in the Rhf. The
Rohmic was not significant affected during the H2 continuous test.
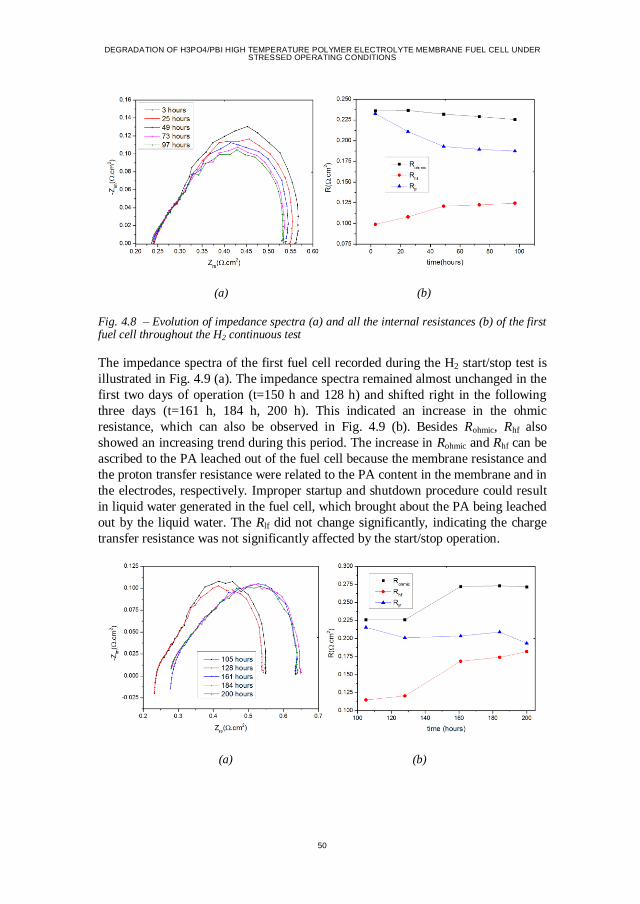
DEGRADATION OF H3PO4/PBI HIGH TEMPERATURE POLYMER ELECTROLYTE MEMBRANE FUEL CELL UNDER STRESSED OPERATING CONDITIONS
50
(a) (b)
Fig. 4.8 – Evolution of impedance spectra (a) and all the internal resistances (b) of the first fuel cell throughout the H2 continuous test
The impedance spectra of the first fuel cell recorded during the H2 start/stop test is
illustrated in Fig. 4.9 (a). The impedance spectra remained almost unchanged in the
first two days of operation (t=150 h and 128 h) and shifted right in the following
three days (t=161 h, 184 h, 200 h). This indicated an increase in the ohmic
resistance, which can also be observed in Fig. 4.9 (b). Besides Rohmic, Rhf also
showed an increasing trend during this period. The increase in Rohmic and Rhf can be
ascribed to the PA leached out of the fuel cell because the membrane resistance and
the proton transfer resistance were related to the PA content in the membrane and in
the electrodes, respectively. Improper startup and shutdown procedure could result
in liquid water generated in the fuel cell, which brought about the PA being leached
out by the liquid water. The Rlf did not change significantly, indicating the charge
transfer resistance was not significantly affected by the start/stop operation.
(a) (b)
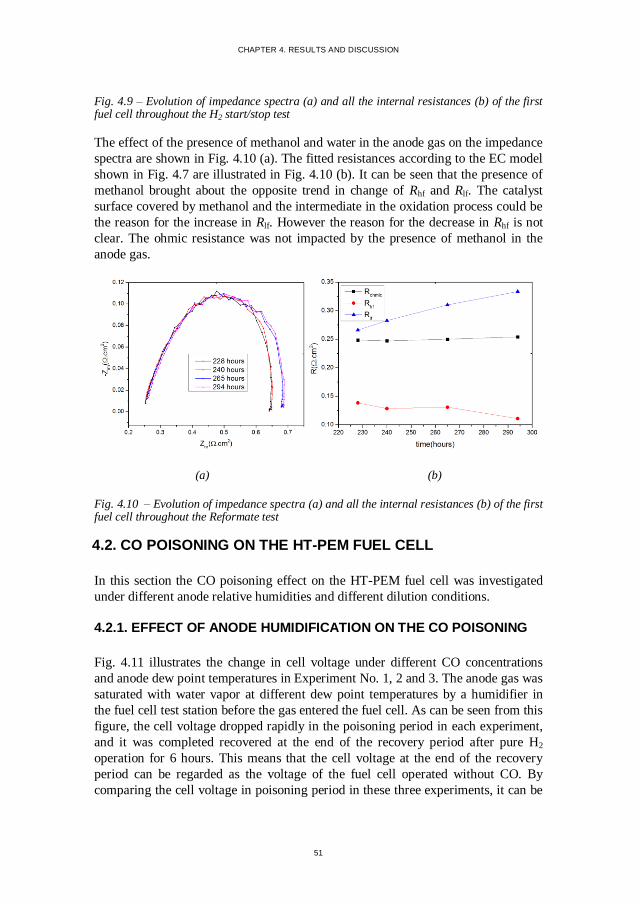
CHAPTER 4. RESULTS AND DISCUSSION
51
Fig. 4.9 – Evolution of impedance spectra (a) and all the internal resistances (b) of the first fuel cell throughout the H2 start/stop test
The effect of the presence of methanol and water in the anode gas on the impedance
spectra are shown in Fig. 4.10 (a). The fitted resistances according to the EC model
shown in Fig. 4.7 are illustrated in Fig. 4.10 (b). It can be seen that the presence of
methanol brought about the opposite trend in change of Rhf and Rlf. The catalyst
surface covered by methanol and the intermediate in the oxidation process could be
the reason for the increase in Rlf. However the reason for the decrease in Rhf is not
clear. The ohmic resistance was not impacted by the presence of methanol in the
anode gas.
(a) (b)
Fig. 4.10 – Evolution of impedance spectra (a) and all the internal resistances (b) of the first fuel cell throughout the Reformate test
4.2. CO POISONING ON THE HT-PEM FUEL CELL
In this section the CO poisoning effect on the HT-PEM fuel cell was investigated
under different anode relative humidities and different dilution conditions.
4.2.1. EFFECT OF ANODE HUMIDIFICATION ON THE CO POISONING
Fig. 4.11 illustrates the change in cell voltage under different CO concentrations
and anode dew point temperatures in Experiment No. 1, 2 and 3. The anode gas was
saturated with water vapor at different dew point temperatures by a humidifier in
the fuel cell test station before the gas entered the fuel cell. As can be seen from this
figure, the cell voltage dropped rapidly in the poisoning period in each experiment,
and it was completed recovered at the end of the recovery period after pure H2
operation for 6 hours. This means that the cell voltage at the end of the recovery
period can be regarded as the voltage of the fuel cell operated without CO. By
comparing the cell voltage in poisoning period in these three experiments, it can be
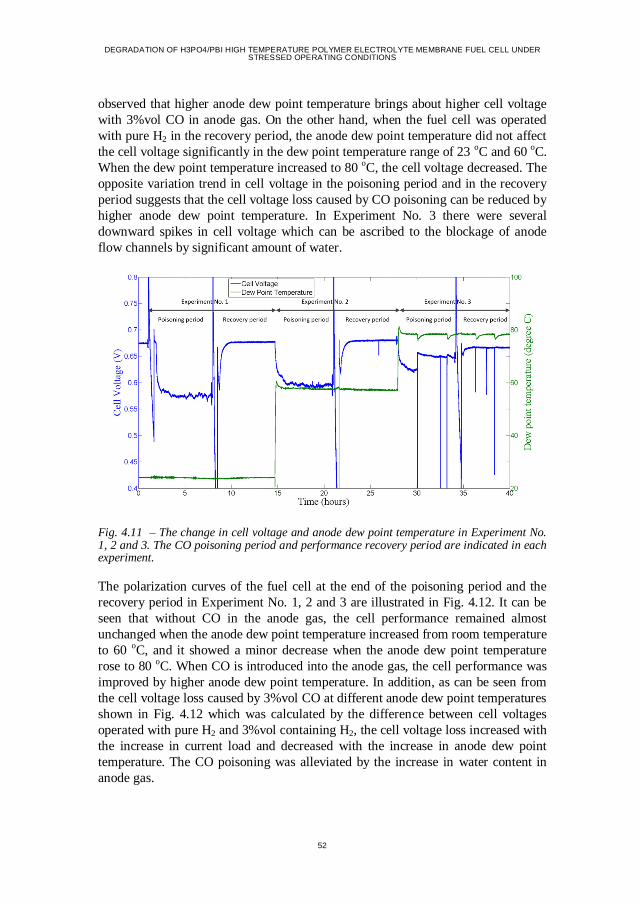
DEGRADATION OF H3PO4/PBI HIGH TEMPERATURE POLYMER ELECTROLYTE MEMBRANE FUEL CELL UNDER STRESSED OPERATING CONDITIONS
52
observed that higher anode dew point temperature brings about higher cell voltage
with 3%vol CO in anode gas. On the other hand, when the fuel cell was operated
with pure H2 in the recovery period, the anode dew point temperature did not affect
the cell voltage significantly in the dew point temperature range of 23 oC and 60 oC.
When the dew point temperature increased to 80 oC, the cell voltage decreased. The
opposite variation trend in cell voltage in the poisoning period and in the recovery
period suggests that the cell voltage loss caused by CO poisoning can be reduced by
higher anode dew point temperature. In Experiment No. 3 there were several
downward spikes in cell voltage which can be ascribed to the blockage of anode
flow channels by significant amount of water.
Fig. 4.11 – The change in cell voltage and anode dew point temperature in Experiment No. 1, 2 and 3. The CO poisoning period and performance recovery period are indicated in each experiment.
The polarization curves of the fuel cell at the end of the poisoning period and the
recovery period in Experiment No. 1, 2 and 3 are illustrated in Fig. 4.12. It can be
seen that without CO in the anode gas, the cell performance remained almost
unchanged when the anode dew point temperature increased from room temperature
to 60 oC, and it showed a minor decrease when the anode dew point temperature
rose to 80 oC. When CO is introduced into the anode gas, the cell performance was
improved by higher anode dew point temperature. In addition, as can be seen from
the cell voltage loss caused by 3%vol CO at different anode dew point temperatures
shown in Fig. 4.12 which was calculated by the difference between cell voltages
operated with pure H2 and 3%vol containing H2, the cell voltage loss increased with
the increase in current load and decreased with the increase in anode dew point
temperature. The CO poisoning was alleviated by the increase in water content in
anode gas.
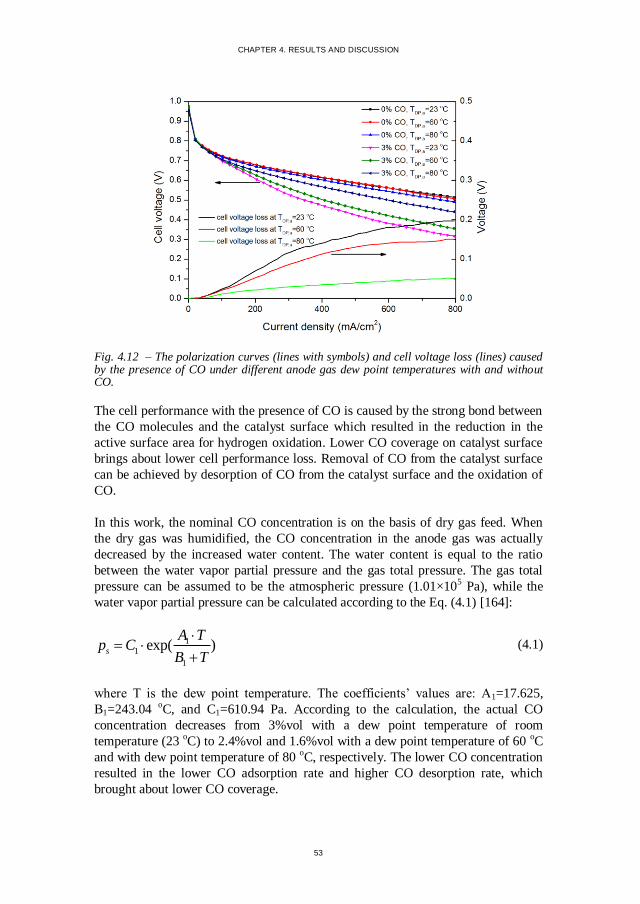
CHAPTER 4. RESULTS AND DISCUSSION
53
Fig. 4.12 – The polarization curves (lines with symbols) and cell voltage loss (lines) caused by the presence of CO under different anode gas dew point temperatures with and without CO.
The cell performance with the presence of CO is caused by the strong bond between
the CO molecules and the catalyst surface which resulted in the reduction in the
active surface area for hydrogen oxidation. Lower CO coverage on catalyst surface
brings about lower cell performance loss. Removal of CO from the catalyst surface
can be achieved by desorption of CO from the catalyst surface and the oxidation of
CO.
In this work, the nominal CO concentration is on the basis of dry gas feed. When
the dry gas was humidified, the CO concentration in the anode gas was actually
decreased by the increased water content. The water content is equal to the ratio
between the water vapor partial pressure and the gas total pressure. The gas total
pressure can be assumed to be the atmospheric pressure (1.01×10⁵ Pa), while the
water vapor partial pressure can be calculated according to the Eq. (4.1) [164]:
11
1
exp( )s
A Tp C
B T
(4.1)
where T is the dew point temperature. The coefficients’ values are: A1=17.625,
B1=243.04 oC, and C1=610.94 Pa. According to the calculation, the actual CO
concentration decreases from 3%vol with a dew point temperature of room
temperature (23 oC) to 2.4%vol and 1.6%vol with a dew point temperature of 60 oC
and with dew point temperature of 80 oC, respectively. The lower CO concentration
resulted in the lower CO adsorption rate and higher CO desorption rate, which
brought about lower CO coverage.
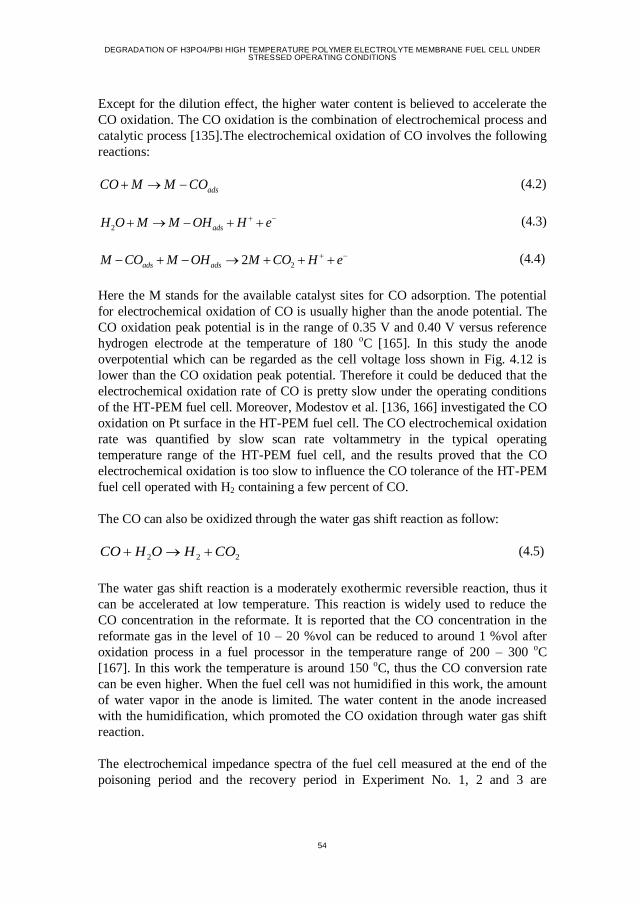
DEGRADATION OF H3PO4/PBI HIGH TEMPERATURE POLYMER ELECTROLYTE MEMBRANE FUEL CELL UNDER STRESSED OPERATING CONDITIONS
54
Except for the dilution effect, the higher water content is believed to accelerate the
CO oxidation. The CO oxidation is the combination of electrochemical process and
catalytic process [135].The electrochemical oxidation of CO involves the following
reactions:
adsCO M M CO (4.2)
2 adsH O M M OH H e (4.3)
22ads adsM CO M OH M CO H e (4.4)
Here the M stands for the available catalyst sites for CO adsorption. The potential
for electrochemical oxidation of CO is usually higher than the anode potential. The
CO oxidation peak potential is in the range of 0.35 V and 0.40 V versus reference
hydrogen electrode at the temperature of 180 oC [165]. In this study the anode
overpotential which can be regarded as the cell voltage loss shown in Fig. 4.12 is
lower than the CO oxidation peak potential. Therefore it could be deduced that the
electrochemical oxidation rate of CO is pretty slow under the operating conditions
of the HT-PEM fuel cell. Moreover, Modestov et al. [136, 166] investigated the CO
oxidation on Pt surface in the HT-PEM fuel cell. The CO electrochemical oxidation
rate was quantified by slow scan rate voltammetry in the typical operating
temperature range of the HT-PEM fuel cell, and the results proved that the CO
electrochemical oxidation is too slow to influence the CO tolerance of the HT-PEM
fuel cell operated with H2 containing a few percent of CO.
The CO can also be oxidized through the water gas shift reaction as follow:
2 2 2CO H O H CO (4.5)
The water gas shift reaction is a moderately exothermic reversible reaction, thus it
can be accelerated at low temperature. This reaction is widely used to reduce the
CO concentration in the reformate. It is reported that the CO concentration in the
reformate gas in the level of 10 – 20 %vol can be reduced to around 1 %vol after
oxidation process in a fuel processor in the temperature range of 200 – 300 oC
[167]. In this work the temperature is around 150 oC, thus the CO conversion rate
can be even higher. When the fuel cell was not humidified in this work, the amount
of water vapor in the anode is limited. The water content in the anode increased
with the humidification, which promoted the CO oxidation through water gas shift
reaction.
The electrochemical impedance spectra of the fuel cell measured at the end of the
poisoning period and the recovery period in Experiment No. 1, 2 and 3 are
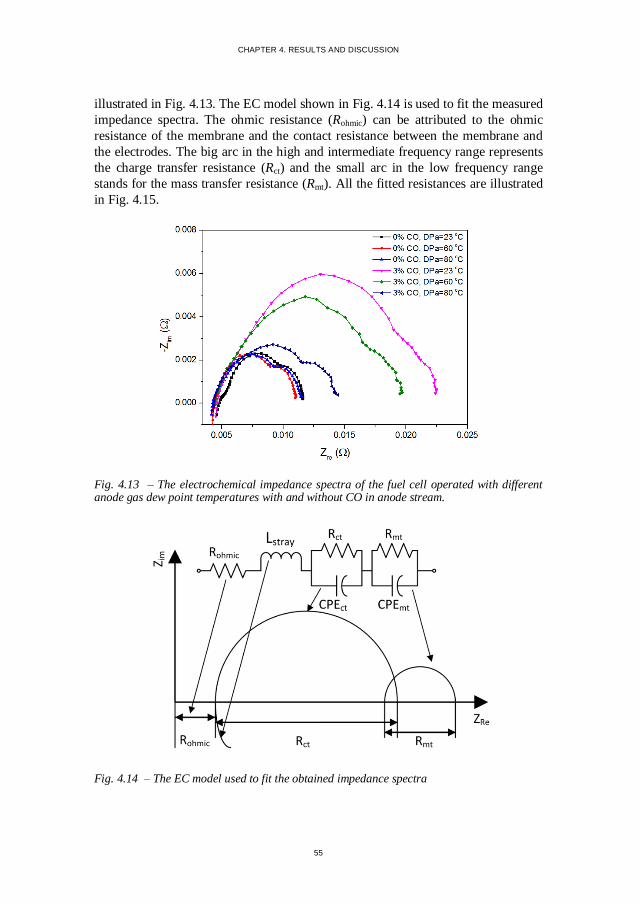
CHAPTER 4. RESULTS AND DISCUSSION
55
illustrated in Fig. 4.13. The EC model shown in Fig. 4.14 is used to fit the measured
impedance spectra. The ohmic resistance (Rohmic) can be attributed to the ohmic
resistance of the membrane and the contact resistance between the membrane and
the electrodes. The big arc in the high and intermediate frequency range represents
the charge transfer resistance (Rct) and the small arc in the low frequency range
stands for the mass transfer resistance (Rmt). All the fitted resistances are illustrated
in Fig. 4.15.
Fig. 4.13 – The electrochemical impedance spectra of the fuel cell operated with different anode gas dew point temperatures with and without CO in anode stream.
Fig. 4.14 – The EC model used to fit the obtained impedance spectra
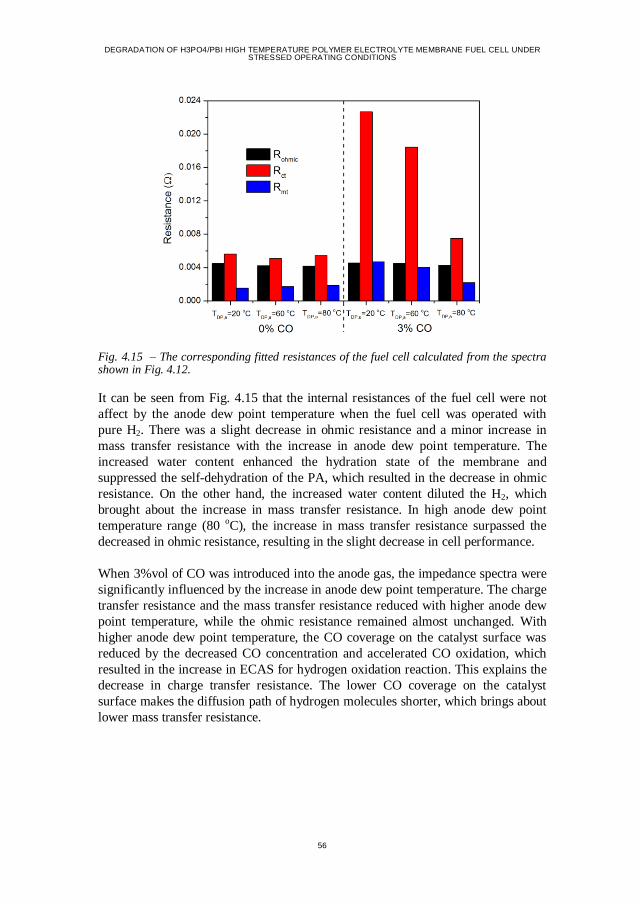
DEGRADATION OF H3PO4/PBI HIGH TEMPERATURE POLYMER ELECTROLYTE MEMBRANE FUEL CELL UNDER STRESSED OPERATING CONDITIONS
56
Fig. 4.15 – The corresponding fitted resistances of the fuel cell calculated from the spectra shown in Fig. 4.12.
It can be seen from Fig. 4.15 that the internal resistances of the fuel cell were not
affect by the anode dew point temperature when the fuel cell was operated with
pure H2. There was a slight decrease in ohmic resistance and a minor increase in
mass transfer resistance with the increase in anode dew point temperature. The
increased water content enhanced the hydration state of the membrane and
suppressed the self-dehydration of the PA, which resulted in the decrease in ohmic
resistance. On the other hand, the increased water content diluted the H2, which
brought about the increase in mass transfer resistance. In high anode dew point
temperature range (80 oC), the increase in mass transfer resistance surpassed the
decreased in ohmic resistance, resulting in the slight decrease in cell performance.
When 3%vol of CO was introduced into the anode gas, the impedance spectra were
significantly influenced by the increase in anode dew point temperature. The charge
transfer resistance and the mass transfer resistance reduced with higher anode dew
point temperature, while the ohmic resistance remained almost unchanged. With
higher anode dew point temperature, the CO coverage on the catalyst surface was
reduced by the decreased CO concentration and accelerated CO oxidation, which
resulted in the increase in ECAS for hydrogen oxidation reaction. This explains the
decrease in charge transfer resistance. The lower CO coverage on the catalyst
surface makes the diffusion path of hydrogen molecules shorter, which brings about
lower mass transfer resistance.
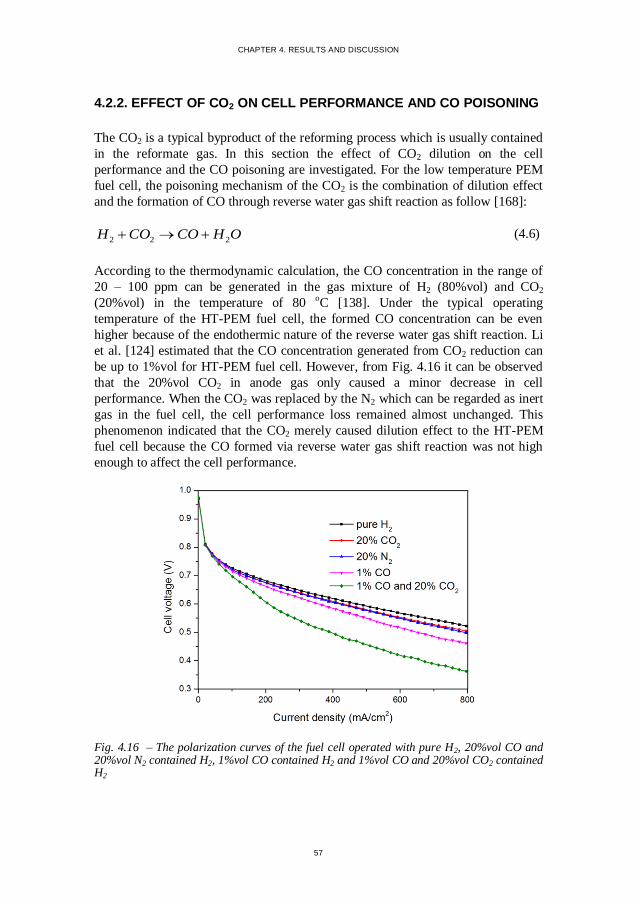
CHAPTER 4. RESULTS AND DISCUSSION
57
4.2.2. EFFECT OF CO2 ON CELL PERFORMANCE AND CO POISONING
The CO2 is a typical byproduct of the reforming process which is usually contained
in the reformate gas. In this section the effect of CO2 dilution on the cell
performance and the CO poisoning are investigated. For the low temperature PEM
fuel cell, the poisoning mechanism of the CO2 is the combination of dilution effect
and the formation of CO through reverse water gas shift reaction as follow [168]:
2 2 2H CO CO H O (4.6)
According to the thermodynamic calculation, the CO concentration in the range of
20 – 100 ppm can be generated in the gas mixture of H2 (80%vol) and CO2
(20%vol) in the temperature of 80 oC [138]. Under the typical operating
temperature of the HT-PEM fuel cell, the formed CO concentration can be even
higher because of the endothermic nature of the reverse water gas shift reaction. Li
et al. [124] estimated that the CO concentration generated from CO2 reduction can
be up to 1%vol for HT-PEM fuel cell. However, from Fig. 4.16 it can be observed
that the 20%vol CO2 in anode gas only caused a minor decrease in cell
performance. When the CO2 was replaced by the N2 which can be regarded as inert
gas in the fuel cell, the cell performance loss remained almost unchanged. This
phenomenon indicated that the CO2 merely caused dilution effect to the HT-PEM
fuel cell because the CO formed via reverse water gas shift reaction was not high
enough to affect the cell performance.
Fig. 4.16 – The polarization curves of the fuel cell operated with pure H2, 20%vol CO and 20%vol N2 contained H2, 1%vol CO contained H2 and 1%vol CO and 20%vol CO2 contained H2
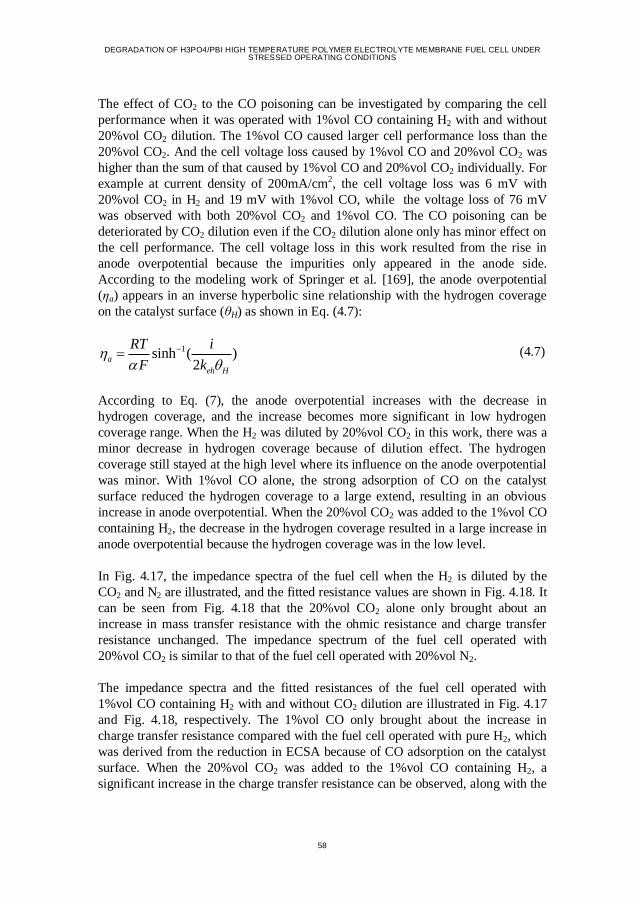
DEGRADATION OF H3PO4/PBI HIGH TEMPERATURE POLYMER ELECTROLYTE MEMBRANE FUEL CELL UNDER STRESSED OPERATING CONDITIONS
58
The effect of CO2 to the CO poisoning can be investigated by comparing the cell
performance when it was operated with 1%vol CO containing H2 with and without
20%vol CO2 dilution. The 1%vol CO caused larger cell performance loss than the
20%vol CO2. And the cell voltage loss caused by 1%vol CO and 20%vol CO2 was
higher than the sum of that caused by 1%vol CO and 20%vol CO2 individually. For
example at current density of 200mA/cm2, the cell voltage loss was 6 mV with
20%vol CO2 in H2 and 19 mV with 1%vol CO, while the voltage loss of 76 mV
was observed with both 20%vol CO2 and 1%vol CO. The CO poisoning can be
deteriorated by CO2 dilution even if the CO2 dilution alone only has minor effect on
the cell performance. The cell voltage loss in this work resulted from the rise in
anode overpotential because the impurities only appeared in the anode side.
According to the modeling work of Springer et al. [169], the anode overpotential
(ηa) appears in an inverse hyperbolic sine relationship with the hydrogen coverage
on the catalyst surface (θH) as shown in Eq. (4.7):
1sinh ( )2
a
eh H
RT i
F k
(4.7)
According to Eq. (7), the anode overpotential increases with the decrease in
hydrogen coverage, and the increase becomes more significant in low hydrogen
coverage range. When the H2 was diluted by 20%vol CO2 in this work, there was a
minor decrease in hydrogen coverage because of dilution effect. The hydrogen
coverage still stayed at the high level where its influence on the anode overpotential
was minor. With 1%vol CO alone, the strong adsorption of CO on the catalyst
surface reduced the hydrogen coverage to a large extend, resulting in an obvious
increase in anode overpotential. When the 20%vol CO2 was added to the 1%vol CO
containing H2, the decrease in the hydrogen coverage resulted in a large increase in
anode overpotential because the hydrogen coverage was in the low level.
In Fig. 4.17, the impedance spectra of the fuel cell when the H2 is diluted by the
CO2 and N2 are illustrated, and the fitted resistance values are shown in Fig. 4.18. It
can be seen from Fig. 4.18 that the 20%vol CO2 alone only brought about an
increase in mass transfer resistance with the ohmic resistance and charge transfer
resistance unchanged. The impedance spectrum of the fuel cell operated with
20%vol CO2 is similar to that of the fuel cell operated with 20%vol N2.
The impedance spectra and the fitted resistances of the fuel cell operated with
1%vol CO containing H2 with and without CO2 dilution are illustrated in Fig. 4.17
and Fig. 4.18, respectively. The 1%vol CO only brought about the increase in
charge transfer resistance compared with the fuel cell operated with pure H2, which
was derived from the reduction in ECSA because of CO adsorption on the catalyst
surface. When the 20%vol CO2 was added to the 1%vol CO containing H2, a
significant increase in the charge transfer resistance can be observed, along with the
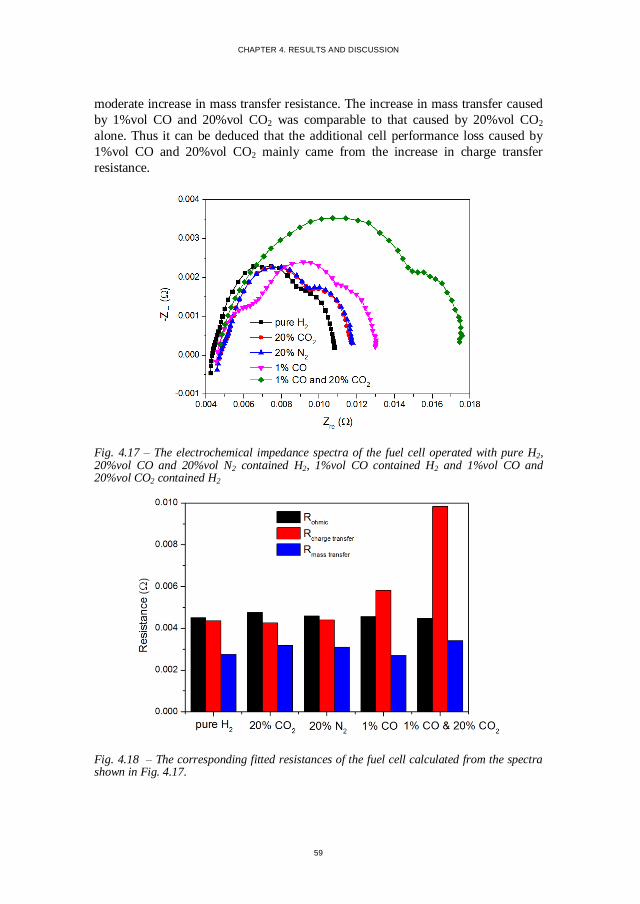
CHAPTER 4. RESULTS AND DISCUSSION
59
moderate increase in mass transfer resistance. The increase in mass transfer caused
by 1%vol CO and 20%vol CO2 was comparable to that caused by 20%vol CO2
alone. Thus it can be deduced that the additional cell performance loss caused by
1%vol CO and 20%vol CO2 mainly came from the increase in charge transfer
resistance.
Fig. 4.17 – The electrochemical impedance spectra of the fuel cell operated with pure H2, 20%vol CO and 20%vol N2 contained H2, 1%vol CO contained H2 and 1%vol CO and 20%vol CO2 contained H2
Fig. 4.18 – The corresponding fitted resistances of the fuel cell calculated from the spectra shown in Fig. 4.17.
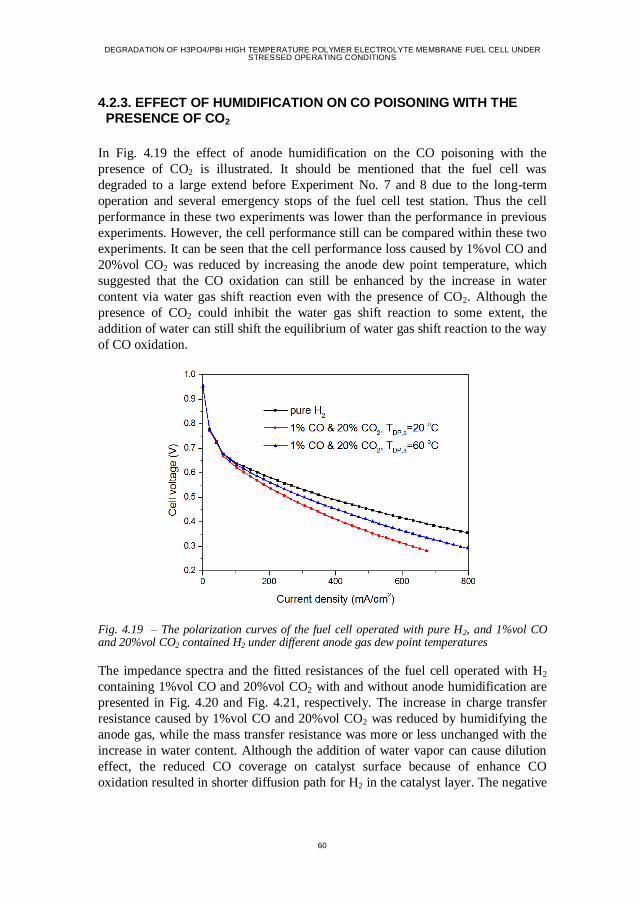
DEGRADATION OF H3PO4/PBI HIGH TEMPERATURE POLYMER ELECTROLYTE MEMBRANE FUEL CELL UNDER STRESSED OPERATING CONDITIONS
60
4.2.3. EFFECT OF HUMIDIFICATION ON CO POISONING WITH THE PRESENCE OF CO2
In Fig. 4.19 the effect of anode humidification on the CO poisoning with the
presence of CO2 is illustrated. It should be mentioned that the fuel cell was
degraded to a large extend before Experiment No. 7 and 8 due to the long-term
operation and several emergency stops of the fuel cell test station. Thus the cell
performance in these two experiments was lower than the performance in previous
experiments. However, the cell performance still can be compared within these two
experiments. It can be seen that the cell performance loss caused by 1%vol CO and
20%vol CO2 was reduced by increasing the anode dew point temperature, which
suggested that the CO oxidation can still be enhanced by the increase in water
content via water gas shift reaction even with the presence of CO2. Although the
presence of CO2 could inhibit the water gas shift reaction to some extent, the
addition of water can still shift the equilibrium of water gas shift reaction to the way
of CO oxidation.
Fig. 4.19 – The polarization curves of the fuel cell operated with pure H2, and 1%vol CO and 20%vol CO2 contained H2 under different anode gas dew point temperatures
The impedance spectra and the fitted resistances of the fuel cell operated with H2
containing 1%vol CO and 20%vol CO2 with and without anode humidification are
presented in Fig. 4.20 and Fig. 4.21, respectively. The increase in charge transfer
resistance caused by 1%vol CO and 20%vol CO2 was reduced by humidifying the
anode gas, while the mass transfer resistance was more or less unchanged with the
increase in water content. Although the addition of water vapor can cause dilution
effect, the reduced CO coverage on catalyst surface because of enhance CO
oxidation resulted in shorter diffusion path for H2 in the catalyst layer. The negative
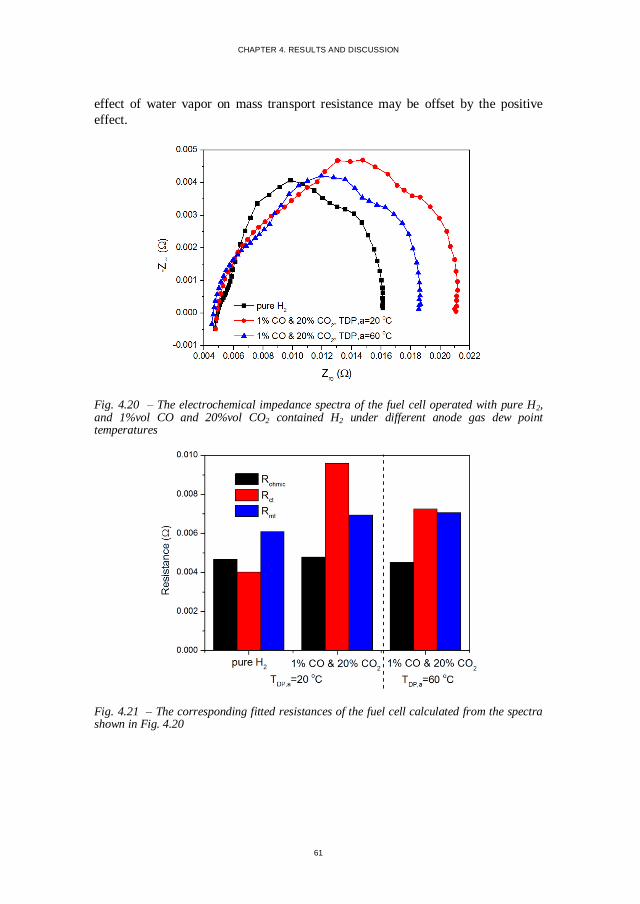
CHAPTER 4. RESULTS AND DISCUSSION
61
effect of water vapor on mass transport resistance may be offset by the positive
effect.
Fig. 4.20 – The electrochemical impedance spectra of the fuel cell operated with pure H2, and 1%vol CO and 20%vol CO2 contained H2 under different anode gas dew point temperatures
Fig. 4.21 – The corresponding fitted resistances of the fuel cell calculated from the spectra shown in Fig. 4.20
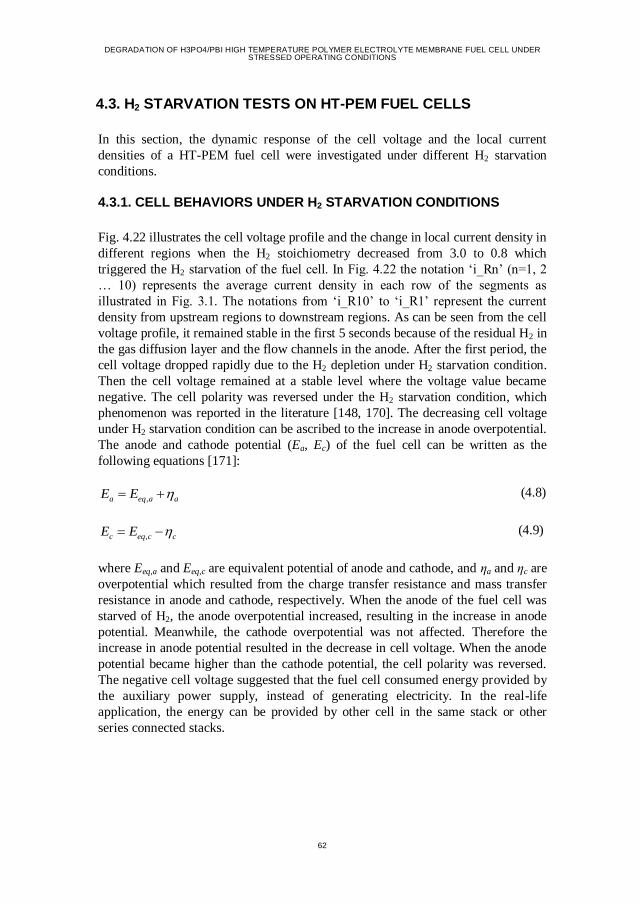
DEGRADATION OF H3PO4/PBI HIGH TEMPERATURE POLYMER ELECTROLYTE MEMBRANE FUEL CELL UNDER STRESSED OPERATING CONDITIONS
62
4.3. H2 STARVATION TESTS ON HT-PEM FUEL CELLS
In this section, the dynamic response of the cell voltage and the local current
densities of a HT-PEM fuel cell were investigated under different H2 starvation
conditions.
4.3.1. CELL BEHAVIORS UNDER H2 STARVATION CONDITIONS
Fig. 4.22 illustrates the cell voltage profile and the change in local current density in
different regions when the H2 stoichiometry decreased from 3.0 to 0.8 which
triggered the H2 starvation of the fuel cell. In Fig. 4.22 the notation ‘i_Rn’ (n=1, 2
… 10) represents the average current density in each row of the segments as
illustrated in Fig. 3.1. The notations from ‘i_R10’ to ‘i_R1’ represent the current
density from upstream regions to downstream regions. As can be seen from the cell
voltage profile, it remained stable in the first 5 seconds because of the residual H2 in
the gas diffusion layer and the flow channels in the anode. After the first period, the
cell voltage dropped rapidly due to the H2 depletion under H2 starvation condition.
Then the cell voltage remained at a stable level where the voltage value became
negative. The cell polarity was reversed under the H2 starvation condition, which
phenomenon was reported in the literature [148, 170]. The decreasing cell voltage
under H2 starvation condition can be ascribed to the increase in anode overpotential.
The anode and cathode potential (Ea, Ec) of the fuel cell can be written as the
following equations [171]:
,a eq a aE E (4.8)
,c eq c cE E (4.9)
where Eeq,a and Eeq,c are equivalent potential of anode and cathode, and ηa and ηc are
overpotential which resulted from the charge transfer resistance and mass transfer
resistance in anode and cathode, respectively. When the anode of the fuel cell was
starved of H2, the anode overpotential increased, resulting in the increase in anode
potential. Meanwhile, the cathode overpotential was not affected. Therefore the
increase in anode potential resulted in the decrease in cell voltage. When the anode
potential became higher than the cathode potential, the cell polarity was reversed.
The negative cell voltage suggested that the fuel cell consumed energy provided by
the auxiliary power supply, instead of generating electricity. In the real-life
application, the energy can be provided by other cell in the same stack or other
series connected stacks.
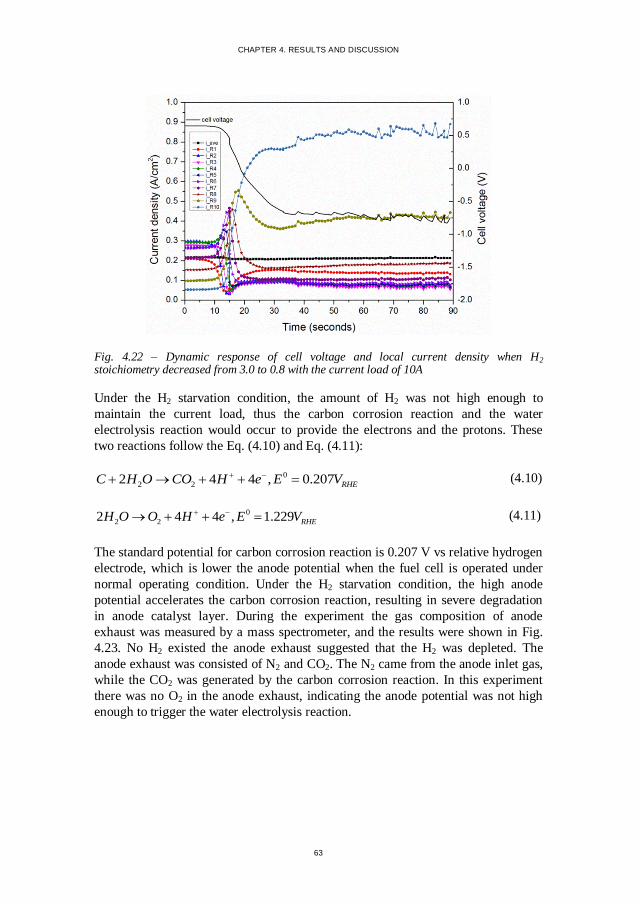
CHAPTER 4. RESULTS AND DISCUSSION
63
Fig. 4.22 – Dynamic response of cell voltage and local current density when H2 stoichiometry decreased from 3.0 to 0.8 with the current load of 10A
Under the H2 starvation condition, the amount of H2 was not high enough to
maintain the current load, thus the carbon corrosion reaction and the water
electrolysis reaction would occur to provide the electrons and the protons. These
two reactions follow the Eq. (4.10) and Eq. (4.11):
0
2 22 4 4 , 0.207 RHEC H O CO H e E V (4.10)
0
2 22 4 4 , 1.229 RHEH O O H e E V (4.11)
The standard potential for carbon corrosion reaction is 0.207 V vs relative hydrogen
electrode, which is lower the anode potential when the fuel cell is operated under
normal operating condition. Under the H2 starvation condition, the high anode
potential accelerates the carbon corrosion reaction, resulting in severe degradation
in anode catalyst layer. During the experiment the gas composition of anode
exhaust was measured by a mass spectrometer, and the results were shown in Fig.
4.23. No H2 existed the anode exhaust suggested that the H2 was depleted. The
anode exhaust was consisted of N2 and CO2. The N2 came from the anode inlet gas,
while the CO2 was generated by the carbon corrosion reaction. In this experiment
there was no O2 in the anode exhaust, indicating the anode potential was not high
enough to trigger the water electrolysis reaction.
DEGRADATION OF H3PO4/PBI HIGH TEMPERATURE POLYMER ELECTROLYTE MEMBRANE FUEL CELL UNDER STRESSED OPERATING CONDITIONS
64
Fig. 4.23 – Gas composition of anode exhaust under different H2 starvation conditions
The change in current density in this experiment followed the change in cell voltage
as shown in Fig. 4.22. In the first 5 seconds, the local current densities remained
stable. When the cell voltage started to decrease, the current density in downstream
regions decreased, while in other regions it showed the increasing trend. When the
H2 stoichiometry decreased to 0.8 in this experiment, the H2 started to deplete in
downstream regions, resulting in the increase in mass transfer resistance in these
regions. The current tended to flow through upstream regions where the mass
transfer resistance was lower, which resulted in the increase in current density in
upstream regions. With the further decrease in cell voltage, the decrease in current
density spread from downstream regions to the upstream region because in some
upstream regions the H2 depleted. When the cell voltage stayed stable in the lowest
level, the local current density in different regions stopped diverging. The current
density distributions of the fuel cell in different time during the experiment are
illustrated in Fig. 4.24. At the beginning of the experiment, the current density was
evenly distributed on the electrode surface when the fuel cell was operated with
normal H2 stoichiometry. When the cell voltage decreased to 0 V, the obvious
heterogeneity in current density distribution can be observed as can be seen from
Fig. 4.24 (b). The current density in upstream was the highest, decreasing along the
anode flow channels, and became the lowest in downstream regions. When the cell
voltage decreased to the lowest level, the heterogeneity in current density became
more severe. As in more regions the H2 was depleted, most of current flowed
through a small regions near the inlet, resulting in quite high current density in
upstream regions.
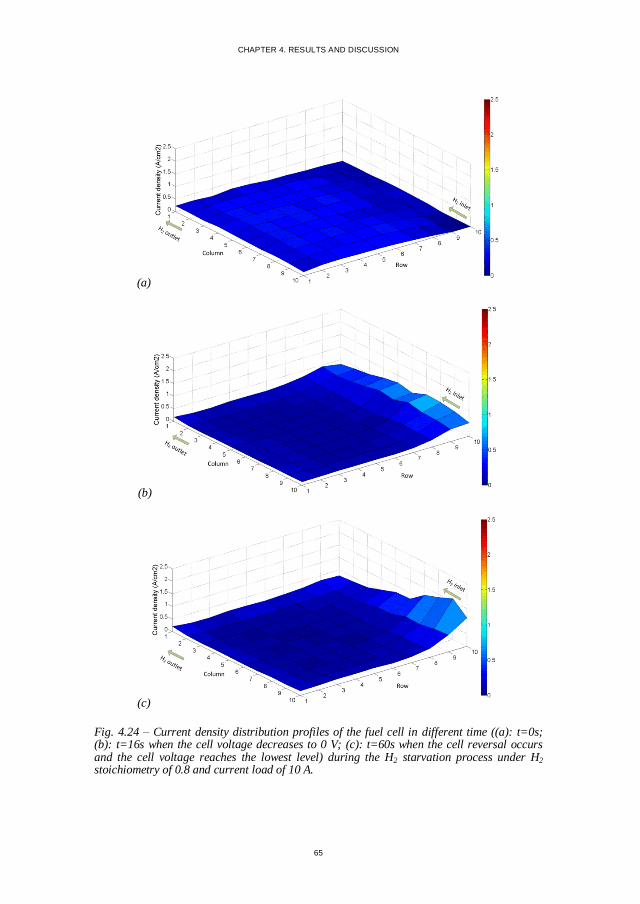
CHAPTER 4. RESULTS AND DISCUSSION
65
(a)
(b)
(c)
Fig. 4.24 – Current density distribution profiles of the fuel cell in different time ((a): t=0s; (b): t=16s when the cell voltage decreases to 0 V; (c): t=60s when the cell reversal occurs and the cell voltage reaches the lowest level) during the H2 starvation process under H2 stoichiometry of 0.8 and current load of 10 A.
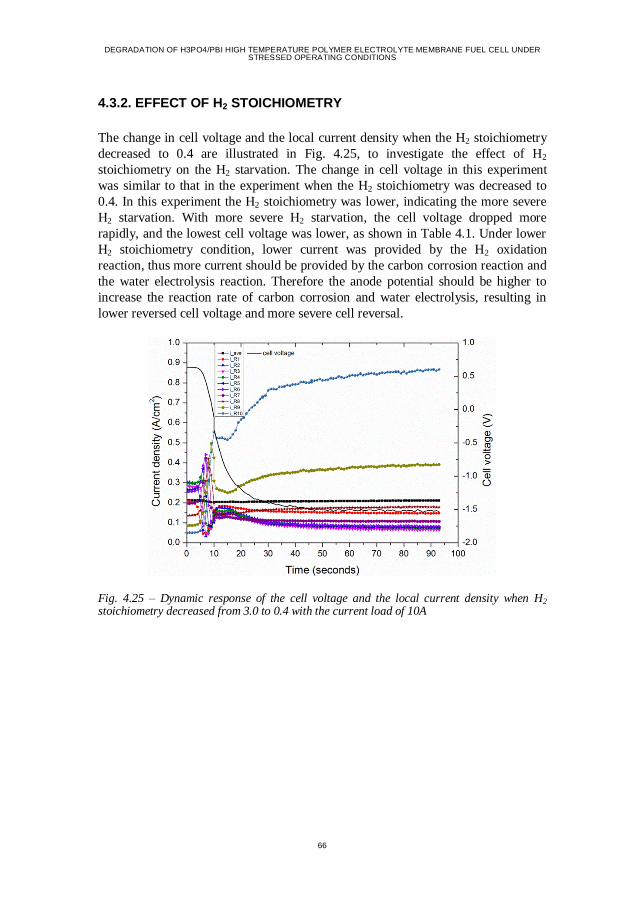
DEGRADATION OF H3PO4/PBI HIGH TEMPERATURE POLYMER ELECTROLYTE MEMBRANE FUEL CELL UNDER STRESSED OPERATING CONDITIONS
66
4.3.2. EFFECT OF H2 STOICHIOMETRY
The change in cell voltage and the local current density when the H2 stoichiometry
decreased to 0.4 are illustrated in Fig. 4.25, to investigate the effect of H2
stoichiometry on the H2 starvation. The change in cell voltage in this experiment
was similar to that in the experiment when the H2 stoichiometry was decreased to
0.4. In this experiment the H2 stoichiometry was lower, indicating the more severe
H2 starvation. With more severe H2 starvation, the cell voltage dropped more
rapidly, and the lowest cell voltage was lower, as shown in Table 4.1. Under lower
H2 stoichiometry condition, lower current was provided by the H2 oxidation
reaction, thus more current should be provided by the carbon corrosion reaction and
the water electrolysis reaction. Therefore the anode potential should be higher to
increase the reaction rate of carbon corrosion and water electrolysis, resulting in
lower reversed cell voltage and more severe cell reversal.
Fig. 4.25 – Dynamic response of the cell voltage and the local current density when H2 stoichiometry decreased from 3.0 to 0.4 with the current load of 10A
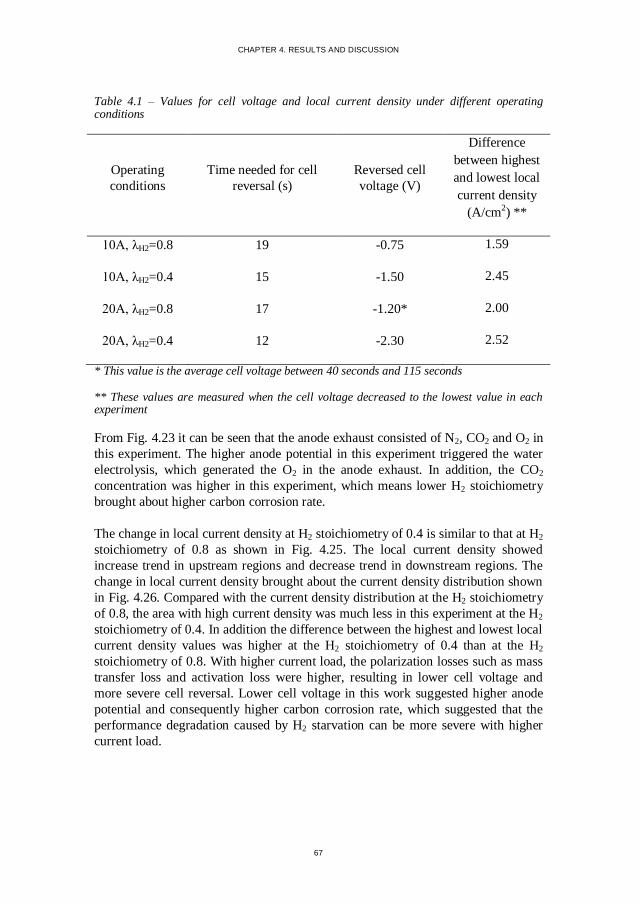
CHAPTER 4. RESULTS AND DISCUSSION
67
Table 4.1 – Values for cell voltage and local current density under different operating conditions
Operating
conditions
Time needed for cell
reversal (s)
Reversed cell
voltage (V)
Difference
between highest
and lowest local
current density
(A/cm2) **
10A, λH2=0.8 19 -0.75 1.59
10A, λH2=0.4 15 -1.50 2.45
20A, λH2=0.8 17 -1.20* 2.00
20A, λH2=0.4 12 -2.30 2.52
* This value is the average cell voltage between 40 seconds and 115 seconds
** These values are measured when the cell voltage decreased to the lowest value in each experiment
From Fig. 4.23 it can be seen that the anode exhaust consisted of N2, CO2 and O2 in
this experiment. The higher anode potential in this experiment triggered the water
electrolysis, which generated the O2 in the anode exhaust. In addition, the CO2
concentration was higher in this experiment, which means lower H2 stoichiometry
brought about higher carbon corrosion rate.
The change in local current density at H2 stoichiometry of 0.4 is similar to that at H2
stoichiometry of 0.8 as shown in Fig. 4.25. The local current density showed
increase trend in upstream regions and decrease trend in downstream regions. The
change in local current density brought about the current density distribution shown
in Fig. 4.26. Compared with the current density distribution at the H2 stoichiometry
of 0.8, the area with high current density was much less in this experiment at the H2
stoichiometry of 0.4. In addition the difference between the highest and lowest local
current density values was higher at the H2 stoichiometry of 0.4 than at the H2
stoichiometry of 0.8. With higher current load, the polarization losses such as mass
transfer loss and activation loss were higher, resulting in lower cell voltage and
more severe cell reversal. Lower cell voltage in this work suggested higher anode
potential and consequently higher carbon corrosion rate, which suggested that the
performance degradation caused by H2 starvation can be more severe with higher
current load.
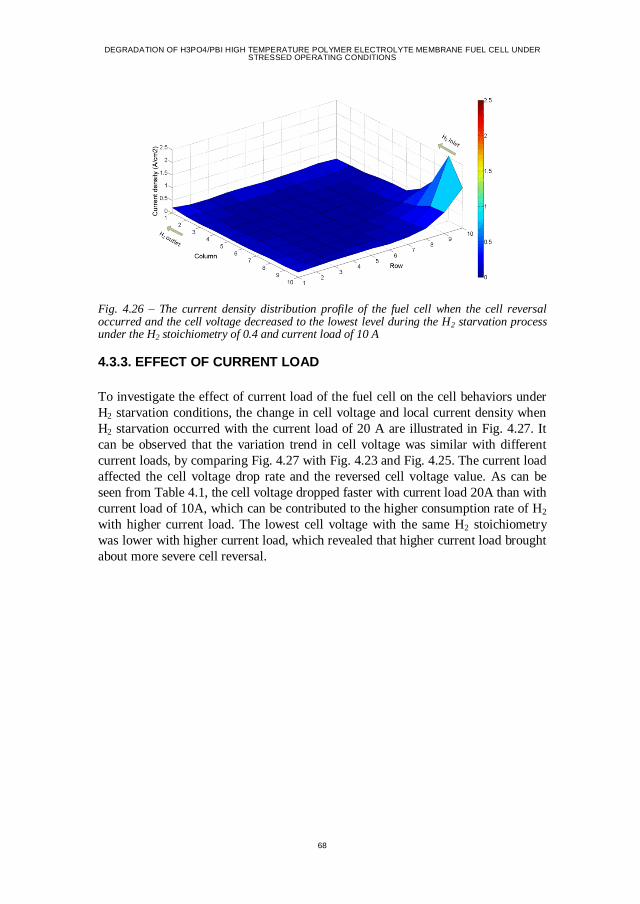
DEGRADATION OF H3PO4/PBI HIGH TEMPERATURE POLYMER ELECTROLYTE MEMBRANE FUEL CELL UNDER STRESSED OPERATING CONDITIONS
68
Fig. 4.26 – The current density distribution profile of the fuel cell when the cell reversal occurred and the cell voltage decreased to the lowest level during the H2 starvation process under the H2 stoichiometry of 0.4 and current load of 10 A
4.3.3. EFFECT OF CURRENT LOAD
To investigate the effect of current load of the fuel cell on the cell behaviors under
H2 starvation conditions, the change in cell voltage and local current density when
H2 starvation occurred with the current load of 20 A are illustrated in Fig. 4.27. It
can be observed that the variation trend in cell voltage was similar with different
current loads, by comparing Fig. 4.27 with Fig. 4.23 and Fig. 4.25. The current load
affected the cell voltage drop rate and the reversed cell voltage value. As can be
seen from Table 4.1, the cell voltage dropped faster with current load 20A than with
current load of 10A, which can be contributed to the higher consumption rate of H2
with higher current load. The lowest cell voltage with the same H2 stoichiometry
was lower with higher current load, which revealed that higher current load brought
about more severe cell reversal.
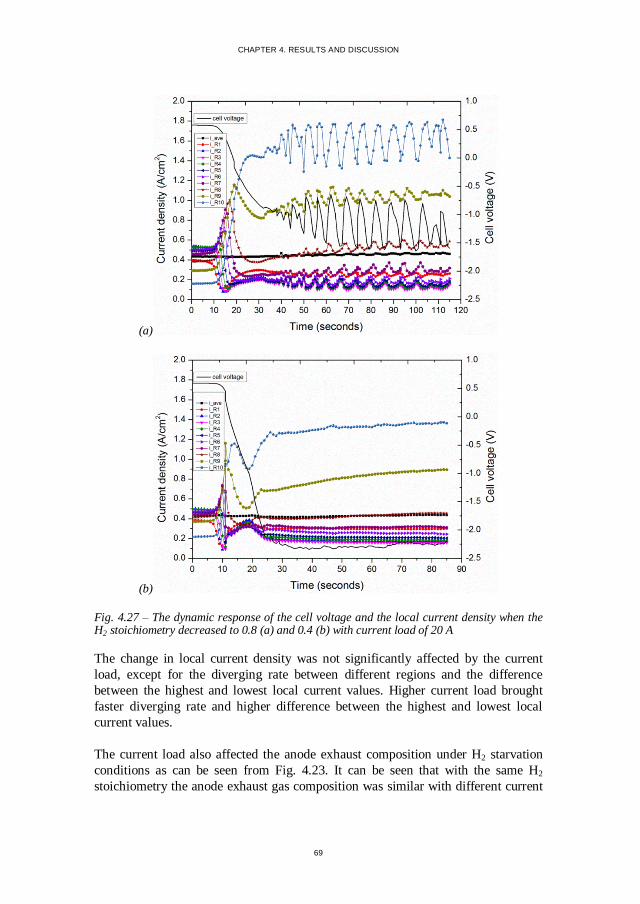
CHAPTER 4. RESULTS AND DISCUSSION
69
(a)
(b)
Fig. 4.27 – The dynamic response of the cell voltage and the local current density when the H2 stoichiometry decreased to 0.8 (a) and 0.4 (b) with current load of 20 A
The change in local current density was not significantly affected by the current
load, except for the diverging rate between different regions and the difference
between the highest and lowest local current values. Higher current load brought
faster diverging rate and higher difference between the highest and lowest local
current values.
The current load also affected the anode exhaust composition under H2 starvation
conditions as can be seen from Fig. 4.23. It can be seen that with the same H2
stoichiometry the anode exhaust gas composition was similar with different current
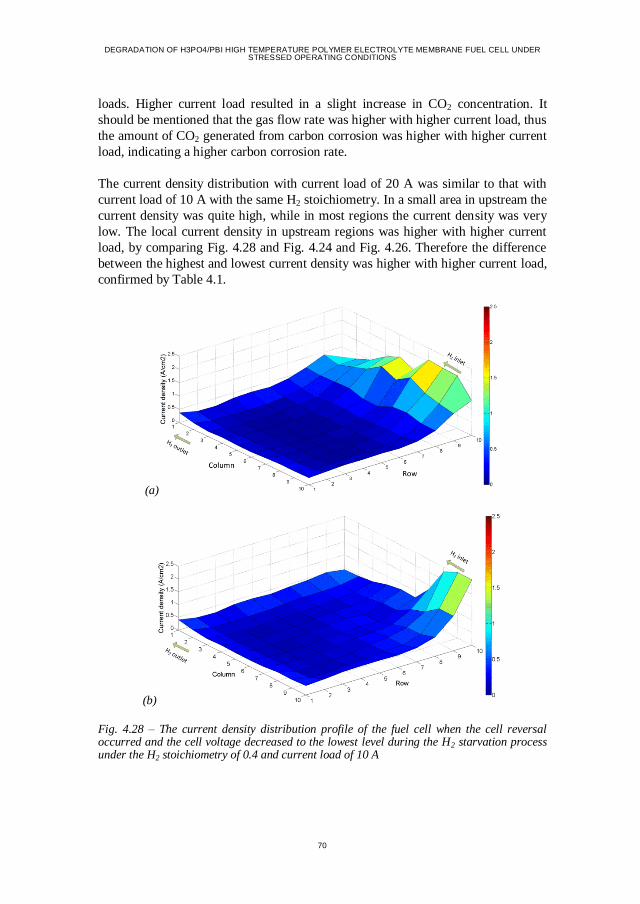
DEGRADATION OF H3PO4/PBI HIGH TEMPERATURE POLYMER ELECTROLYTE MEMBRANE FUEL CELL UNDER STRESSED OPERATING CONDITIONS
70
loads. Higher current load resulted in a slight increase in CO2 concentration. It
should be mentioned that the gas flow rate was higher with higher current load, thus
the amount of CO2 generated from carbon corrosion was higher with higher current
load, indicating a higher carbon corrosion rate.
The current density distribution with current load of 20 A was similar to that with
current load of 10 A with the same H2 stoichiometry. In a small area in upstream the
current density was quite high, while in most regions the current density was very
low. The local current density in upstream regions was higher with higher current
load, by comparing Fig. 4.28 and Fig. 4.24 and Fig. 4.26. Therefore the difference
between the highest and lowest current density was higher with higher current load,
confirmed by Table 4.1.
(a)
(b)
Fig. 4.28 – The current density distribution profile of the fuel cell when the cell reversal occurred and the cell voltage decreased to the lowest level during the H2 starvation process under the H2 stoichiometry of 0.4 and current load of 10 A
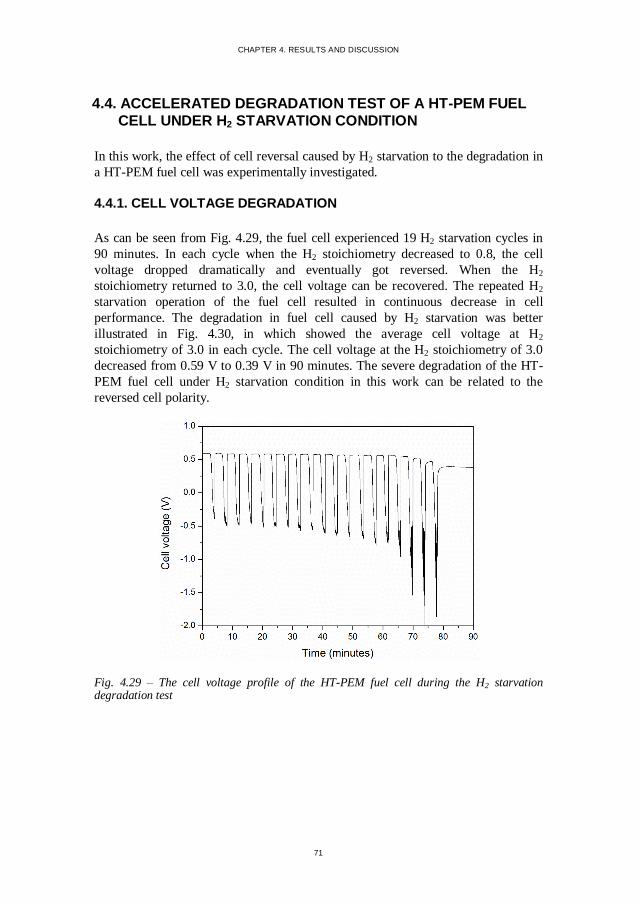
CHAPTER 4. RESULTS AND DISCUSSION
71
4.4. ACCELERATED DEGRADATION TEST OF A HT-PEM FUEL
CELL UNDER H2 STARVATION CONDITION
In this work, the effect of cell reversal caused by H2 starvation to the degradation in
a HT-PEM fuel cell was experimentally investigated.
4.4.1. CELL VOLTAGE DEGRADATION
As can be seen from Fig. 4.29, the fuel cell experienced 19 H2 starvation cycles in
90 minutes. In each cycle when the H2 stoichiometry decreased to 0.8, the cell
voltage dropped dramatically and eventually got reversed. When the H2
stoichiometry returned to 3.0, the cell voltage can be recovered. The repeated H2
starvation operation of the fuel cell resulted in continuous decrease in cell
performance. The degradation in fuel cell caused by H2 starvation was better
illustrated in Fig. 4.30, in which showed the average cell voltage at H2
stoichiometry of 3.0 in each cycle. The cell voltage at the H2 stoichiometry of 3.0
decreased from 0.59 V to 0.39 V in 90 minutes. The severe degradation of the HT-
PEM fuel cell under H2 starvation condition in this work can be related to the
reversed cell polarity.
Fig. 4.29 – The cell voltage profile of the HT-PEM fuel cell during the H2 starvation degradation test
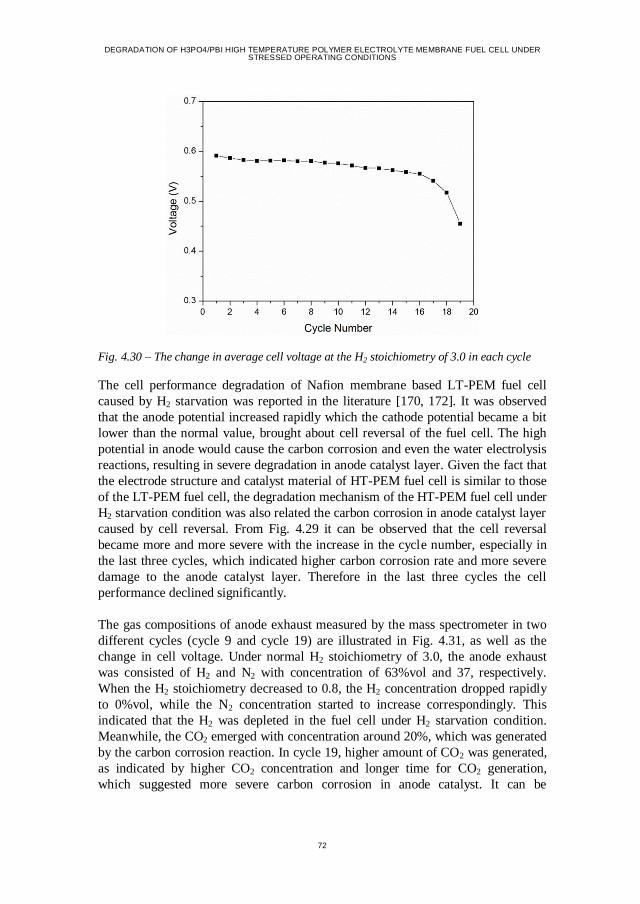
DEGRADATION OF H3PO4/PBI HIGH TEMPERATURE POLYMER ELECTROLYTE MEMBRANE FUEL CELL UNDER STRESSED OPERATING CONDITIONS
72
Fig. 4.30 – The change in average cell voltage at the H2 stoichiometry of 3.0 in each cycle
The cell performance degradation of Nafion membrane based LT-PEM fuel cell
caused by H2 starvation was reported in the literature [170, 172]. It was observed
that the anode potential increased rapidly which the cathode potential became a bit
lower than the normal value, brought about cell reversal of the fuel cell. The high
potential in anode would cause the carbon corrosion and even the water electrolysis
reactions, resulting in severe degradation in anode catalyst layer. Given the fact that
the electrode structure and catalyst material of HT-PEM fuel cell is similar to those
of the LT-PEM fuel cell, the degradation mechanism of the HT-PEM fuel cell under
H2 starvation condition was also related the carbon corrosion in anode catalyst layer
caused by cell reversal. From Fig. 4.29 it can be observed that the cell reversal
became more and more severe with the increase in the cycle number, especially in
the last three cycles, which indicated higher carbon corrosion rate and more severe
damage to the anode catalyst layer. Therefore in the last three cycles the cell
performance declined significantly.
The gas compositions of anode exhaust measured by the mass spectrometer in two
different cycles (cycle 9 and cycle 19) are illustrated in Fig. 4.31, as well as the
change in cell voltage. Under normal H2 stoichiometry of 3.0, the anode exhaust
was consisted of H2 and N2 with concentration of 63%vol and 37, respectively.
When the H2 stoichiometry decreased to 0.8, the H2 concentration dropped rapidly
to 0%vol, while the N2 concentration started to increase correspondingly. This
indicated that the H2 was depleted in the fuel cell under H2 starvation condition.
Meanwhile, the CO2 emerged with concentration around 20%, which was generated
by the carbon corrosion reaction. In cycle 19, higher amount of CO2 was generated,
as indicated by higher CO2 concentration and longer time for CO2 generation,
which suggested more severe carbon corrosion in anode catalyst. It can be
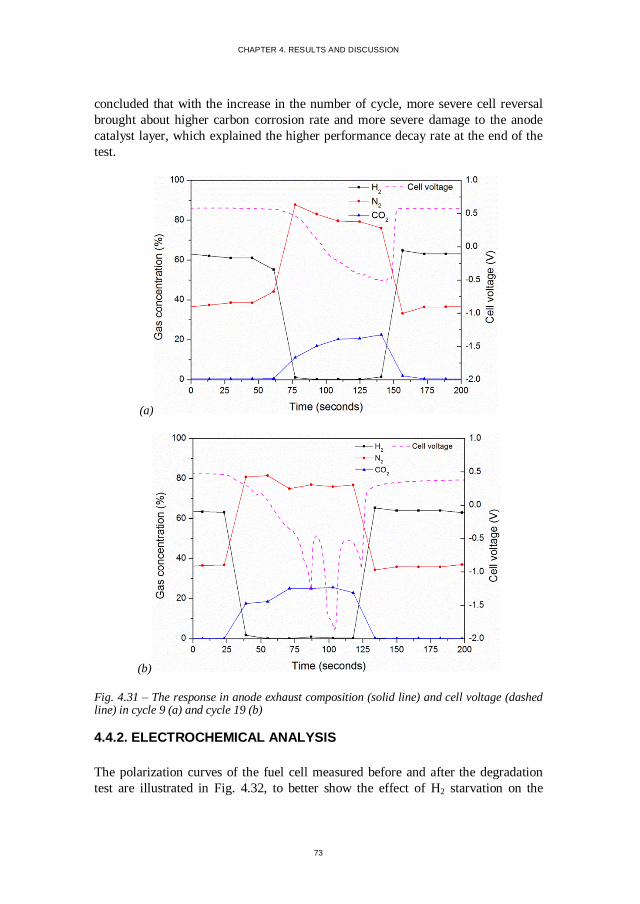
CHAPTER 4. RESULTS AND DISCUSSION
73
concluded that with the increase in the number of cycle, more severe cell reversal
brought about higher carbon corrosion rate and more severe damage to the anode
catalyst layer, which explained the higher performance decay rate at the end of the
test.
(a)
(b)
Fig. 4.31 – The response in anode exhaust composition (solid line) and cell voltage (dashed line) in cycle 9 (a) and cycle 19 (b)
4.4.2. ELECTROCHEMICAL ANALYSIS
The polarization curves of the fuel cell measured before and after the degradation
test are illustrated in Fig. 4.32, to better show the effect of H2 starvation on the
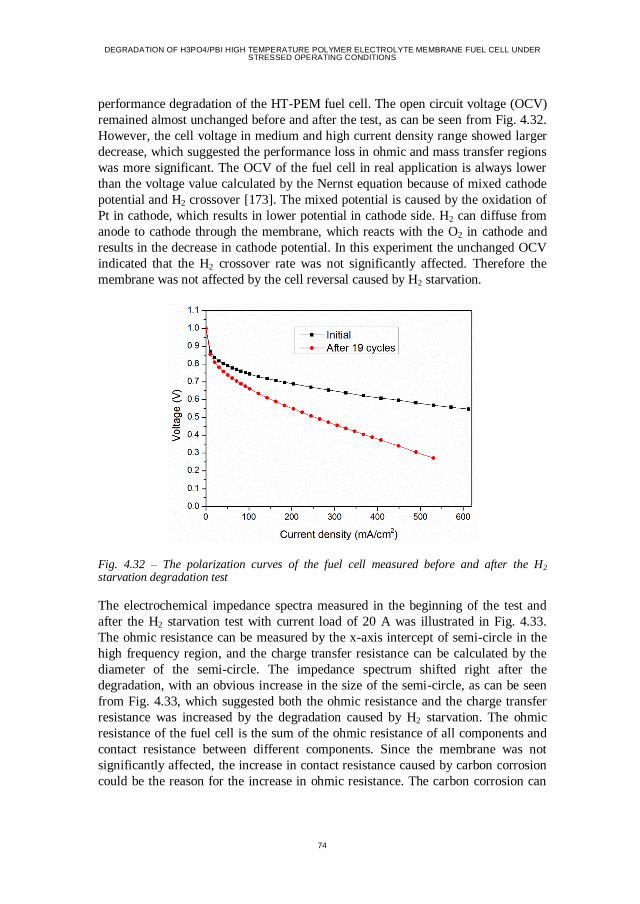
DEGRADATION OF H3PO4/PBI HIGH TEMPERATURE POLYMER ELECTROLYTE MEMBRANE FUEL CELL UNDER STRESSED OPERATING CONDITIONS
74
performance degradation of the HT-PEM fuel cell. The open circuit voltage (OCV)
remained almost unchanged before and after the test, as can be seen from Fig. 4.32.
However, the cell voltage in medium and high current density range showed larger
decrease, which suggested the performance loss in ohmic and mass transfer regions
was more significant. The OCV of the fuel cell in real application is always lower
than the voltage value calculated by the Nernst equation because of mixed cathode
potential and H2 crossover [173]. The mixed potential is caused by the oxidation of
Pt in cathode, which results in lower potential in cathode side. H2 can diffuse from
anode to cathode through the membrane, which reacts with the O2 in cathode and
results in the decrease in cathode potential. In this experiment the unchanged OCV
indicated that the H2 crossover rate was not significantly affected. Therefore the
membrane was not affected by the cell reversal caused by H2 starvation.
Fig. 4.32 – The polarization curves of the fuel cell measured before and after the H2 starvation degradation test
The electrochemical impedance spectra measured in the beginning of the test and
after the H2 starvation test with current load of 20 A was illustrated in Fig. 4.33.
The ohmic resistance can be measured by the x-axis intercept of semi-circle in the
high frequency region, and the charge transfer resistance can be calculated by the
diameter of the semi-circle. The impedance spectrum shifted right after the
degradation, with an obvious increase in the size of the semi-circle, as can be seen
from Fig. 4.33, which suggested both the ohmic resistance and the charge transfer
resistance was increased by the degradation caused by H2 starvation. The ohmic
resistance of the fuel cell is the sum of the ohmic resistance of all components and
contact resistance between different components. Since the membrane was not
significantly affected, the increase in contact resistance caused by carbon corrosion
could be the reason for the increase in ohmic resistance. The carbon corrosion can
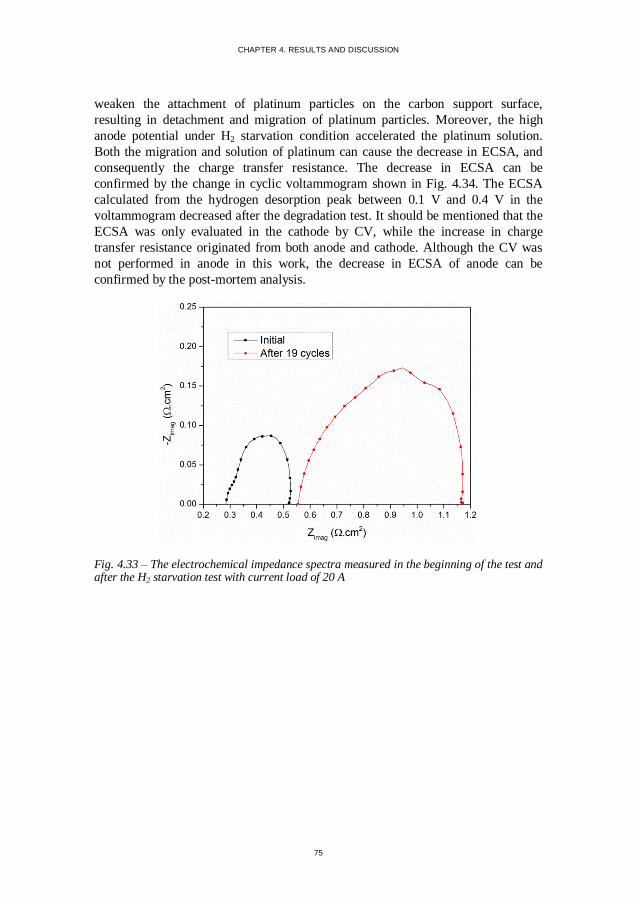
CHAPTER 4. RESULTS AND DISCUSSION
75
weaken the attachment of platinum particles on the carbon support surface,
resulting in detachment and migration of platinum particles. Moreover, the high
anode potential under H2 starvation condition accelerated the platinum solution.
Both the migration and solution of platinum can cause the decrease in ECSA, and
consequently the charge transfer resistance. The decrease in ECSA can be
confirmed by the change in cyclic voltammogram shown in Fig. 4.34. The ECSA
calculated from the hydrogen desorption peak between 0.1 V and 0.4 V in the
voltammogram decreased after the degradation test. It should be mentioned that the
ECSA was only evaluated in the cathode by CV, while the increase in charge
transfer resistance originated from both anode and cathode. Although the CV was
not performed in anode in this work, the decrease in ECSA of anode can be
confirmed by the post-mortem analysis.
Fig. 4.33 – The electrochemical impedance spectra measured in the beginning of the test and after the H2 starvation test with current load of 20 A
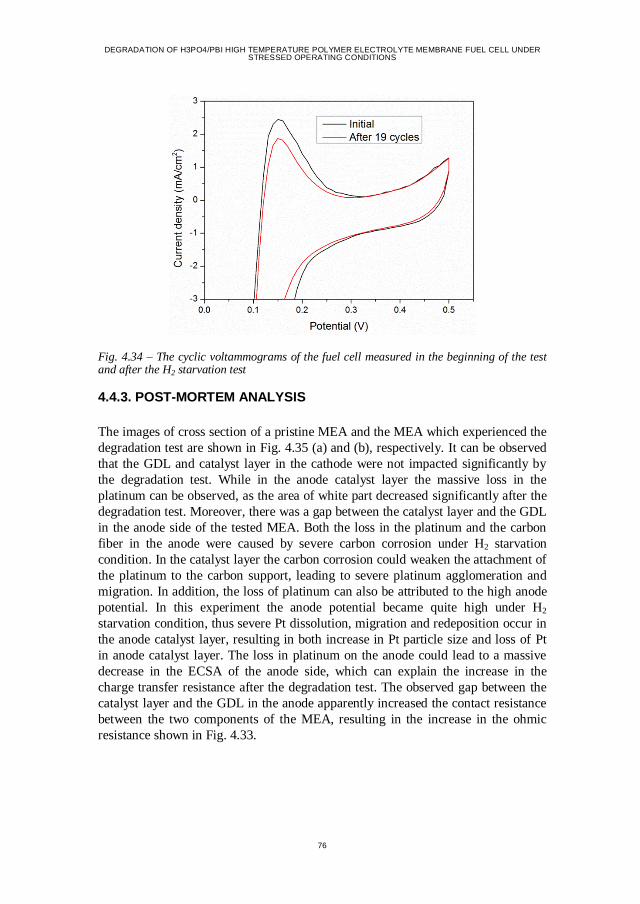
DEGRADATION OF H3PO4/PBI HIGH TEMPERATURE POLYMER ELECTROLYTE MEMBRANE FUEL CELL UNDER STRESSED OPERATING CONDITIONS
76
Fig. 4.34 – The cyclic voltammograms of the fuel cell measured in the beginning of the test and after the H2 starvation test
4.4.3. POST-MORTEM ANALYSIS
The images of cross section of a pristine MEA and the MEA which experienced the
degradation test are shown in Fig. 4.35 (a) and (b), respectively. It can be observed
that the GDL and catalyst layer in the cathode were not impacted significantly by
the degradation test. While in the anode catalyst layer the massive loss in the
platinum can be observed, as the area of white part decreased significantly after the
degradation test. Moreover, there was a gap between the catalyst layer and the GDL
in the anode side of the tested MEA. Both the loss in the platinum and the carbon
fiber in the anode were caused by severe carbon corrosion under H2 starvation
condition. In the catalyst layer the carbon corrosion could weaken the attachment of
the platinum to the carbon support, leading to severe platinum agglomeration and
migration. In addition, the loss of platinum can also be attributed to the high anode
potential. In this experiment the anode potential became quite high under H2
starvation condition, thus severe Pt dissolution, migration and redeposition occur in
the anode catalyst layer, resulting in both increase in Pt particle size and loss of Pt
in anode catalyst layer. The loss in platinum on the anode could lead to a massive
decrease in the ECSA of the anode side, which can explain the increase in the
charge transfer resistance after the degradation test. The observed gap between the
catalyst layer and the GDL in the anode apparently increased the contact resistance
between the two components of the MEA, resulting in the increase in the ohmic
resistance shown in Fig. 4.33.
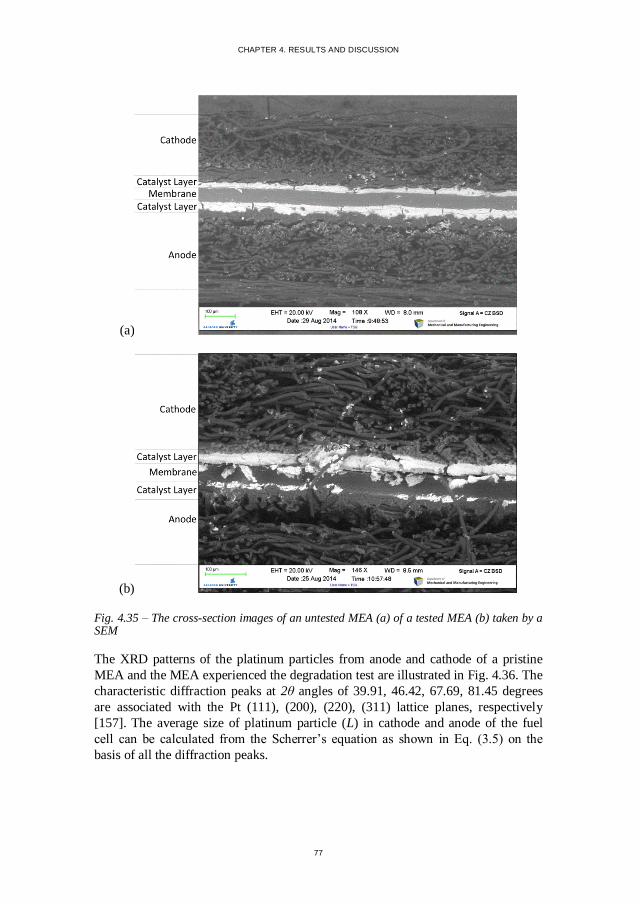
CHAPTER 4. RESULTS AND DISCUSSION
77
(a)
(b)
Fig. 4.35 – The cross-section images of an untested MEA (a) of a tested MEA (b) taken by a SEM
The XRD patterns of the platinum particles from anode and cathode of a pristine
MEA and the MEA experienced the degradation test are illustrated in Fig. 4.36. The
characteristic diffraction peaks at 2θ angles of 39.91, 46.42, 67.69, 81.45 degrees
are associated with the Pt (111), (200), (220), (311) lattice planes, respectively
[157]. The average size of platinum particle (L) in cathode and anode of the fuel
cell can be calculated from the Scherrer’s equation as shown in Eq. (3.5) on the
basis of all the diffraction peaks.
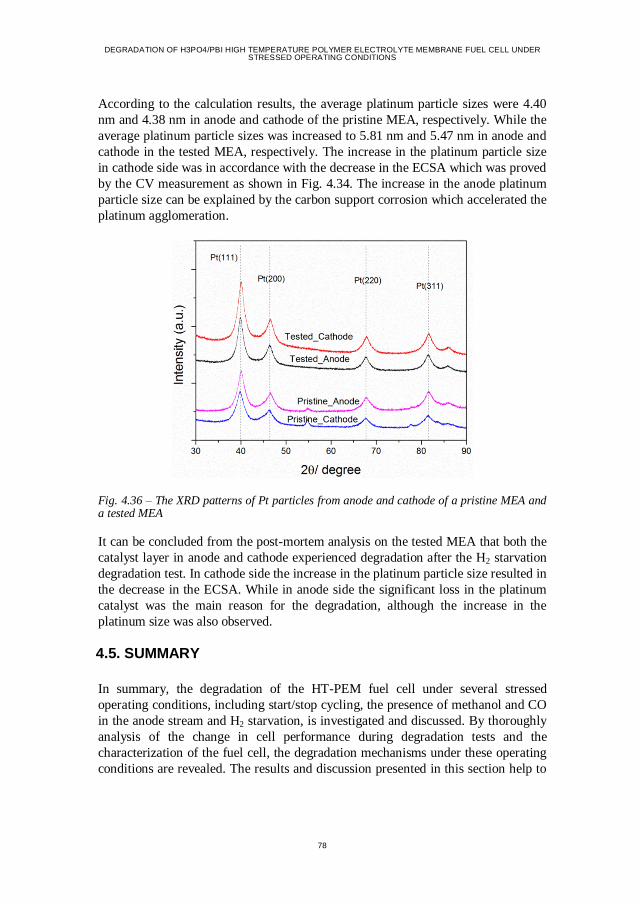
DEGRADATION OF H3PO4/PBI HIGH TEMPERATURE POLYMER ELECTROLYTE MEMBRANE FUEL CELL UNDER STRESSED OPERATING CONDITIONS
78
According to the calculation results, the average platinum particle sizes were 4.40
nm and 4.38 nm in anode and cathode of the pristine MEA, respectively. While the
average platinum particle sizes was increased to 5.81 nm and 5.47 nm in anode and
cathode in the tested MEA, respectively. The increase in the platinum particle size
in cathode side was in accordance with the decrease in the ECSA which was proved
by the CV measurement as shown in Fig. 4.34. The increase in the anode platinum
particle size can be explained by the carbon support corrosion which accelerated the
platinum agglomeration.
Fig. 4.36 – The XRD patterns of Pt particles from anode and cathode of a pristine MEA and a tested MEA
It can be concluded from the post-mortem analysis on the tested MEA that both the
catalyst layer in anode and cathode experienced degradation after the H2 starvation
degradation test. In cathode side the increase in the platinum particle size resulted in
the decrease in the ECSA. While in anode side the significant loss in the platinum
catalyst was the main reason for the degradation, although the increase in the
platinum size was also observed.
4.5. SUMMARY
In summary, the degradation of the HT-PEM fuel cell under several stressed
operating conditions, including start/stop cycling, the presence of methanol and CO
in the anode stream and H2 starvation, is investigated and discussed. By thoroughly
analysis of the change in cell performance during degradation tests and the
characterization of the fuel cell, the degradation mechanisms under these operating
conditions are revealed. The results and discussion presented in this section help to

CHAPTER 4. RESULTS AND DISCUSSION
79
improve the design and the operating strategy of the HT-PEM fuel cell system to
achieve the better cell performance and durability.

DEGRADATION OF H3PO4/PBI HIGH TEMPERATURE POLYMER ELECTROLYTE MEMBRANE FUEL CELL UNDER STRESSED OPERATING CONDITIONS
80
CHAPTER 5. CONCLUSION
81
CHAPTER 5. CONCLUSION
In this final section, the conclusions obtained from all the experiments conducted in
this project are presented. By showing all the main scientific contributions of this
project in Section 5.1, this chapter tries to give the readers a better understanding
how the HT-PEM fuel cells degrade under harsh operating conditions. The
limitations of this work are also presented in Section 5.2, showing the future work
which can be conducted for further investigation of the degradation in the HT-PEM
fuel cells.
5.1. CONCLUSIONS
In this project the experimental works performed on the H3PO4/PBI HT-PEM fuel
cells are reported to investigate the cell performance and degradation under stressed
operating conditions, including start/stop cycling, methanol poisoning, CO
poisoning and H2 starvation. The HT-PEM fuel cells employed in this project are
based on the Dapozol G77 MEAs from Danish Power System. All the experiments
are conducted on a fuel cell test station from GreenLight Innovation. In Section
5.1.1 – 5.1.3, the conclusions obtained from all the experiments are presented. In
Section 5.1.4, a brief summary about the work is given.
5.1.1. LONG-TERM DEGRADATION TEST WITH THE PRESENCE OF METHANOL
The proper procedure and duration of break-in are vital for the HT-PEM fuel cell to
reach a better performance. With the presence of methanol in the anode stream, the
performance decay rate is increased to a large extend. During the start/stop test,
there is a significant decrease in cell performance which could be caused by
improper procedure of the startup and shutdown. From the polarization curves and
impedance spectra measured during the test, some degradation mechanisms can be
revealed. The start/stop operation increases the ohmic resistance and mass transfer
resistance of the fuel cell, which can be attributed to the corrosion of carbon support
and the PA leaching caused by improper procedure of the startup and shutdown.
The presence of methanol causes the increase in charge transfer resistance and mass
transfer resistance, which is the reason for the degradation with the presence of
methanol.
5.1.2. CO POISONING ON THE HT-PEM FUEL CELL
The CO concentration in the anode stream in the range of 1%vol and 3%vol can
cause obvious cell performance decay to the Dapozol HT-PEM MEA under the
operating temperature of 150 oC. The cell performance degradation caused by CO
DEGRADATION OF H3PO4/PBI HIGH TEMPERATURE POLYMER ELECTROLYTE MEMBRANE FUEL CELL UNDER STRESSED OPERATING CONDITIONS
82
poisoning is reversible. When the anode stream is humidified, the CO poisoning can
be alleviated. With higher water content, the CO can be oxidized via water gas shift
reaction, resulting in the decrease in CO coverage on the catalyst surface and higher
cell performance. The CO2 alone with concentration of 20%vol in the anode stream
does not influence the cell performance significantly. However the addition of 20%
vol CO2 can deteriorate the poisoning effect caused by 1%vol CO, which is
attributed to the significantly increased charge transfer resistance. The cell
performance loss caused by 1%vol CO and 20%vol CO2 can be also be alleviated
by higher water content.
5.1.3. H2 STARVATION
The H2 starvation can influence the cell performance and the current density
distribution of the HT-PEM fuel cell. Under the H2 starvation conditions, the cell
polarity can be reversed. The current density distribution becomes very uneven at
the same time, with high current density values in upstream regions and low current
density values in downstream regions. The carbon corrosion and the water
electrolysis reaction occur in the anode under severe H2 starvation conditions which
can be confirmed by the existence of CO2 and O2 in the anode exhaust. The H2
starvation degree (H2 stoichiometry) and the current load affect the cell behavior
under H2 starvation conditions. With lower H2 stoichiometry and higher current
load, the cell reversal becomes more severe, and the current density distribution
becomes more uneven. Higher CO2 and O2 concentrations suggest that the damage
caused by H2 starvation is more severe under lower H2 stoichiometry and higher
current load conditions.
The decreasing cell performance during the H2 starvation degradation test confirms
that the H2 starvation can cause severe damage to the HT-PEM fuel cell. The
degradation in cell performance is related to the cell reversal under H2 starvation
condition. More severe cell reversal at the end of the degradation test brings about
higher performance decay rate. The carbon corrosion in the anode is the main
consequence of the cell reversal caused by H2 starvation and the main reason for the
cell performance degradation. The OCV of the fuel cell is not affected by the H2
starvation degradation test, indicating the H2 starvation does not cause degradation
in the membrane. From the post-mortem analysis such as SEM and XRD, the
degradation in anode catalyst layer can be observed. The carbon corrosion results in
the massive loss in platinum in anode and the increase in platinum particle size.
5.1.4. FINAL REMARKS
In this project, the degradation of the H3PO4/PBI HT-PEM fuel cell caused by
impurities in anode stream and H2 starvation is investigated. The results from this
project reveal that both the impurities in anode stream and H2 starvation cause
severe degradation in cell performance of the HT-PEM fuel cell.
CHAPTER 5. CONCLUSION
83
The results from the experiments about CO poisoning quantify the cell performance
degradation caused by CO poisoning under different operating conditions. The data
from these experiments can help to improve the operating strategy of the HT-PEM
fuel cell and the fuel cell system, to minimize the influence the CO poisoning on the
cell performance and degradation. Based on the fast performance decay under H2
starvation condition, the H2 starvation should be avoided during the operation of the
HT-PEM fuel cell, even for a short period.
5.2. FUTURE WORK
The degradation mechanisms of the HT-PEM fuel cell under harsh operating
conditions have been investigated, as a good start point for the further investigation
in mitigating the degradation under these operating conditions and improving the
operation strategy of the HT-PEM fuel cell to achieve better durability. This project
cannot cover all the aspects of the degradation of the HT-PEM fuel cell, and some
underlying degradation mechanisms are not explained by direct evidence. In the
future, further investigation is needed to extend the scope of this project.
In the degradation test described in Section 4.1, the duration of the test conducted
on each fuel cell is limited to about 300 hours because of high performance decay
rate with the presence of methanol in the anode stream. However, the unstable cell
performance with the presence of methanol, which may be caused by frequent
sudden increase in methanol flow rate, also contributes to the high cell performance
decay rate. In the future work, the methanol feeding system should be improved to
achieve a more stable methanol flow rate, for eliminating influence of fluctuated
cell voltage on the HT-PEM fuel cell degradation.
The break-in performed on all the fuel cells in this project is conducted using the
same procedure. Different break-in procedures can be performed to investigate the
effect of break-in procedure to the lifetime of the HT-PEM fuel cell in the future.
Moreover, the redistribution of PA in the MEA is thought to be the reason for the
enhanced cell performance during the break-in. The migration of PA during break-
in and the following degradation period of the HT-PEM fuel cell are worth
investigating, to understand the role of PA distribution in the performance of the
HT-PEM fuel cell.
Lastly but not least importantly, all the tests conducted in this project are performed
on a single cell setup. The operating conditions in a single cell are not exactly the
same as in a fuel cell stack. To investigate the degradation of the fuel cell under the
realistic operating conditions, the degradation test on a fuel cell stack should be
performed in the future. Moreover, the degradation test can also be extended to the
system level.

DEGRADATION OF H3PO4/PBI HIGH TEMPERATURE POLYMER ELECTROLYTE MEMBRANE FUEL CELL UNDER STRESSED OPERATING CONDITIONS
84
85
BIBLIOGRAPHY
[1] BP Energy Outlook 2035. http://wwwbpcom/content/dam/bp/pdf/Energy-
economics/energy-outlook-2015/Energy_Outlook_2035_bookletpdf. 2015.
[2] IPCC. In climate change 2014: Climate change mitigation. Contribution of
working group III to the fifth assessment report of the Intergovernment Panel on
Climate Change. 2014;pages 1-33.
[3] The Danish Government, The Ministry of Climate, Energy and Building. The
Danish Climate Policy Plan towards a Low Carbon Society. 2013.
[4] Lucia U. Overview on fuel cells. Renewable and Sustainable Energy Reviews.
2014;30:164-9.
[5] Yang C, Srinivasan S, Bocarsly AB, Tulyani S, Benziger JB. A comparison of
physical properties and fuel cell performance of Nafion and zirconium
phosphate/Nafion composite membranes. Journal of Membrane Science.
2004;237:145-61.
[6] Li H, Tang Y, Wang Z, Shi Z, Wu S, Song D, et al. A review of water flooding
issues in the proton exchange membrane fuel cell. Journal of Power Sources.
2008;178:103-17.
[7] Tangirala AK. PEM Fuel Cells: Overview.
[8] McNicol B, Rand D, Williams K. Fuel cells for road transportation purposes—
yes or no? Journal of Power Sources. 2001;100:47-59.
[9] http://automobiles.honda.com/fcx-clarity/. Honda FCX Clarity
[10] http://www.toyota.com/mirai/fcv.html. Toyota Mirai – The Turning Point.
[11] http://www.mbusa.com/mercedes/benz/green/electric_car. B-Class F-CELL
Electric Car.
[12] http://www.chevrolet.com/equinox-fuel-efficient-suv.html. Equinox: Fuel-
Efficient SUV.
[13] http://worldwide.hyundai.com/WW/Showroom/Eco/ix35-Fuel-
Cell/PIP/index.html. Hyundai ix35 Fuel Cell.
[14] Marbán G, Valdés-Solís T. Towards the hydrogen economy? International
Journal of Hydrogen Energy. 2007;32:1625-37.
[15] Kai T, Uemura Y, Takanashi H, Tsutsui T, Takahashi T, Matsumoto Y, et al. A
demonstration project of the hydrogen station located on Yakushima Island—
Operation and analysis of the station. International Journal of Hydrogen Energy.
2007;32:3519-25.
[16] http://www.fta.dot.gov/14617_15670.html. National Fuel Cell Bus Program
Projects.
[17] http://www.global-hydrogen-bus-platform.com/. Clean Urban Transport for
Europe.
[18] Hwang J, Wang D, Shih N, Lai D, Chen Co-K. Development of fuel-cell-
powered electric bicycle. Journal of Power Sources. 2004;133:223-8.
[19] Hwang JJ. Review on development and demonstration of hydrogen fuel cell
scooters. Renewable and Sustainable Energy Reviews. 2012;16:3803-15.
DEGRADATION OF H3PO4/PBI HIGH TEMPERATURE POLYMER ELECTROLYTE MEMBRANE FUEL CELL UNDER STRESSED OPERATING CONDITIONS
86
[20] Keränen T, Karimäki H, Viitakangas J, Vallet J, Ihonen J, Hyötylä P, et al.
Development of integrated fuel cell hybrid power source for electric forklift.
Journal of Power Sources. 2011;196:9058-68.
[21] Wang C, Mao Z, Bao F, Li X, Xie X. Development and performance of 5kw
proton exchange membrane fuel cell stationary power system. International Journal
of Hydrogen Energy. 2005;30:1031-4.
[22] Feitelberg AS, Stathopoulos J, Qi Z, Smith C, Elter JF. Reliability of Plug
Power GenSys™ fuel cell systems. Journal of Power Sources. 2005;147:203-7.
[23] Plug Power wins award to operate GenSys units in NY homes. Fuel Cells
Bulletin. 2009;2009:6.
[24] Ballard. PEM fuel cell product portfolio. 2009.
[25] Wang Y, Chen KS, Mishler J, Cho SC, Adroher XC. A review of polymer
electrolyte membrane fuel cells: technology, applications, and needs on
fundamental research. Applied Energy. 2011;88:981-1007.
[26] Dyer CK. Fuel cells for portable applications. Journal of Power Sources.
2002;106:31-4.
[27] Chen D, Li W, Peng H. An experimental study and model validation of a
membrane humidifier for PEM fuel cell humidification control. Journal of Power
Sources. 2008;180:461-7.
[28] Baschuk J, Li X. Modelling CO poisoning and O2 bleeding in a PEM fuel cell
anode. International Journal of Energy Research. 2003;27:1095-116.
[29] Yu X, Zhou B, Sobiesiak A. Water and thermal management for Ballard PEM
fuel cell stack. Journal of Power Sources. 2005;147:184-95.
[30] Li Q, He R, Jensen J, Bjerrum N. PBI‐Based Polymer Membranes for High
Temperature Fuel Cells – Preparation, Characterization and Fuel Cell
Demonstration. Fuel Cells. 2004;4:147-59.
[31] Li Q, Rudbeck HC, Chromik A, Jensen JO, Pan C, Steenberg T, et al.
Properties, degradation and high temperature fuel cell test of different types of PBI
and PBI blend membranes. Journal of Membrane Science. 2010;347:260-70.
[32] Lobato J, Canizares P, Rodrigo MA, Linares JJ, Manjavacas G. Synthesis and
characterisation of poly [2, 2-(m-phenylene)-5, 5-bibenzimidazole] as polymer
electrolyte membrane for high temperature PEMFCs. Journal of Membrane
Science. 2006;280:351-62.
[33] Zhang J, Xie Z, Zhang J, Tang Y, Song C, Navessin T, et al. High temperature
PEM fuel cells. Journal of Power Sources. 2006;160:872-91.
[34] Shao Y, Yin G, Wang Z, Gao Y. Proton exchange membrane fuel cell from
low temperature to high temperature: material challenges. Journal of Power
Sources. 2007;167:235-42.
[35] Chandan A, Hattenberger M, El-Kharouf A, Du S, Dhir A, Self V, et al. High
temperature (HT) polymer electrolyte membrane fuel cells (PEMFC)–A review.
Journal of Power Sources. 2013;231:264-78.
[36] Wainright J, Wang JT, Weng D, Savinell R, Litt M. Acid‐ Doped
Polybenzimidazoles: A New Polymer Electrolyte. Journal of The Electrochemical
Society. 1995;142:L121-L3.
87
[37] Li Q, Jensen JO, Savinell RF, Bjerrum NJ. High temperature proton exchange
membranes based on polybenzimidazoles for fuel cells. Progress in Polymer
Science. 2009;34:449-77.
[38] Jensen JO, Li Q, Pan C, Vestbø AP, Mortensen K, Petersen HN, et al. High
temperature PEMFC and the possible utilization of the excess heat for fuel
processing. International Journal of Hydrogen Energy. 2007;32:1567-71.
[39] Gao X, Chen M, Andreasen SJ, Kær SK. Potential usage of thermoelectric
devices in a high-temperature polymer electrolyte membrane (PEM) fuel cell
system: two case studies. Journal of electronic materials. 2012;41:1838-44.
[40] Das SK, Reis A, Berry KJ. Experimental evaluation of CO poisoning on the
performance of a high temperature proton exchange membrane fuel cell. Journal of
Power Sources. 2009;193:691-8.
[41] Holladay JD, Wainright JS, Jones EO, Gano SR. Power generation using a
mesoscale fuel cell integrated with a microscale fuel processor. Journal of Power
Sources. 2004;130:111-8.
[42] Poirier M, Sapundzhiev C. Catalytic decomposition of natural gas to hydrogen
for fuel cell applications. International Journal of Hydrogen Energy. 1997;22:429-
33.
[43] Pan C, He R, Li Q, Jensen JO, Bjerrum NJ, Hjulmand HA, et al. Integration of
high temperature PEM fuel cells with a methanol reformer. Journal of Power
Sources. 2005;145:392-8.
[44] Andreasen SJ, Kær SK, Sahlin S. Control and experimental characterization of
a methanol reformer for a 350 W high temperature polymer electrolyte membrane
fuel cell system. International Journal of Hydrogen Energy. 2013;38:1676-84.
[45] Karstedt J, Ogrzewalla J, Severin C, Pischinger S. Development and design of
experiments optimization of a high temperature proton exchange membrane fuel
cell auxiliary power unit with onboard fuel processor. Journal of Power Sources.
2011;196:9998-10009.
[46] Authayanun S, Mamlouk M, Scott K, Arpornwichanop A. Comparison of
high-temperature and low-temperature polymer electrolyte membrane fuel cell
systems with glycerol reforming process for stationary applications. Applied
Energy. 2013;109:192-201.
[47] Clarke SH, Dicks AL, Pointon K, Smith TA, Swann A. Catalytic aspects of the
steam reforming of hydrocarbons in internal reforming fuel cells. Catalysis Today.
1997;38:411-23.
[48] Avgouropoulos G, Paxinou A, Neophytides S. In situ hydrogen utilization in
an internal reforming methanol fuel cell. International Journal of Hydrogen Energy.
2014;39:18103-8.
[49] Najafi B, Haghighat Mamaghani A, Rinaldi F, Casalegno A. Long-term
performance analysis of an HT-PEM fuel cell based micro-CHP system:
Operational strategies. Applied Energy. 2015;147:582-92.
[50] Arsalis A, Kær SK, Nielsen MP. Modeling and optimization of a heat-pump-
assisted high temperature proton exchange membrane fuel cell micro-combined-
DEGRADATION OF H3PO4/PBI HIGH TEMPERATURE POLYMER ELECTROLYTE MEMBRANE FUEL CELL UNDER STRESSED OPERATING CONDITIONS
88
heat-and-power system for residential applications. Applied Energy. 2015;147:569-
81.
[51] Andreasen SJ, Ashworth L, Sahlin S, Becker Jensen H-C, Kær SK. Test of
hybrid power system for electrical vehicles using a lithium-ion battery pack and a
reformed methanol fuel cell range extender. International Journal of Hydrogen
Energy. 2014;39:1856-63.
[52] Su H, Pasupathi S, Bladergroen B, Linkov V, Pollet BG. Optimization of gas
diffusion electrode for polybenzimidazole-based high temperature proton exchange
membrane fuel cell: Evaluation of polymer binders in catalyst layer. International
Journal of Hydrogen Energy. 2013;38:11370-8.
[53] Glipa X, Bonnet B, Mula B, Jones DJ, Rozière J. Investigation of the
conduction properties of phosphoric and sulfuric acid doped polybenzimidazole.
Journal of Materials Chemistry. 1999;9:3045-9.
[54] Bouchet R, Siebert E. Proton conduction in acid doped polybenzimidazole.
Solid State Ionics. 1999;118:287-99.
[55] Litt M, Ameri R, Wang Y, Savinell R, Wainwright J.
Polybenzimidazoles/phosphoric acid solid polymer electrolytes: mechanical and
electrical properties. MRS Proceedings: Cambridge Univ Press; 1998. p. 313.
[56] Mamlouk M, Scott K. The effect of electrode parameters on performance of a
phosphoric acid-doped PBI membrane fuel cell. International Journal of Hydrogen
Energy. 2010;35:784-93.
[57] DOE. Fuel Cell Technologies Office Multi-Year Research, Development and
Demonstration Plan. http://www1eereenergygov/hydrogenandfuelcells/mypp/.
[58] Tang H, Peikang S, Jiang SP, Wang F, Pan M. A degradation study of Nafion
proton exchange membrane of PEM fuel cells. Journal of Power Sources.
2007;170:85-92.
[59] Laconti A, Liu H, Mittelsteadt C, McDonald R. Polymer electrolyte membrane
degradation mechanisms in fuel cells-findings over the past 30 years and
comparison with electrolyzers. ECS Transactions. 2006;1:199-219.
[60] Curtin DE, Lousenberg RD, Henry TJ, Tangeman PC, Tisack ME. Advanced
materials for improved PEMFC performance and life. Journal of Power Sources.
2004;131:41-8.
[61] Li Q, Pan C, Jensen JO, Noyé P, Bjerrum NJ. Cross-linked polybenzimidazole
membranes for fuel cells. Chemistry of materials. 2007;19:350-2.
[62] Liao J, Li Q, Rudbeck H, Jensen JO, Chromik A, Bjerrum N, et al. Oxidative
degradation of polybenzimidazole membranes as electrolytes for high temperature
proton exchange membrane fuel cells. Fuel Cells. 2011;11:745-55.
[63] Liao J, Yang J, Li Q, Cleemann LN, Jensen JO, Bjerrum NJ, et al. Oxidative
degradation of acid doped polybenzimidazole membranes and fuel cell durability in
the presence of ferrous ions. Journal of Power Sources. 2013;238:516-22.
[64] Chang Z, Pu H, Wan D, Jin M, Pan H. Effects of adjacent groups of
benzimidazole on antioxidation of polybenzimidazoles. Polymer Degradation and
Stability. 2010;95:2648-53.
89
[65] Pu H, Tang L. Chemical oxidation stability and anhydrous proton conductivity
of polyimides/phosphoric acid/imidazole blends. Polymer international.
2007;56:121-5.
[66] Kerres J. Blended and cross‐linked ionomer membranes for application in
membrane fuel cells. Fuel Cells. 2005;5:230-47.
[67] Samms S, Wasmus S, Savinell R. Thermal stability of proton conducting acid
doped polybenzimidazole in simulated fuel cell environments. Journal of The
Electrochemical Society. 1996;143:1225-32.
[68] Orfanidi A, Daletou M, Sygellou L, Neophytides S. The role of phosphoric
acid in the anodic electrocatalytic layer in high temperature PEM fuel cells. Journal
of applied electrochemistry. 2013;43:1101-16.
[69] Modestov AD, Tarasevich MR, Filimonov VY, Zagudaeva NM. Degradation
of high temperature MEA with PBI-H3PO4 membrane in a life test. Electrochimica
Acta. 2009;54:7121-7.
[70] Wang J-T, Savinell R, Wainright J, Litt M, Yu H. A H2O2 fuel cell using acid
doped polybenzimidazole as polymer electrolyte. Electrochimica Acta.
1996;41:193-7.
[71] Borup R, Meyers J, Pivovar B, Kim YS, Mukundan R, Garland N, et al.
Scientific aspects of polymer electrolyte fuel cell durability and degradation.
Chemical reviews. 2007;107:3904-51.
[72] Watanabe M, Tsurumi K, Mizukami T, Nakamura T, Stonehart P. Activity and
Stability of Ordered and Disordered Co‐Pt Alloys for Phosphoric Acid Fuel Cells.
Journal of The Electrochemical Society. 1994;141:2659-68.
[73] Berejnov V, Martin Z, West M, Kundu S, Bessarabov D, Stumper J, et al.
Probing platinum degradation in polymer electrolyte membrane fuel cells by
synchrotron X-ray microscopy. Physical Chemistry Chemical Physics.
2012;14:4835-43.
[74] Ferreira P, Shao-Horn Y, Morgan D, Makharia R, Kocha S, Gasteiger H.
Instability of Pt/C electrocatalysts in proton exchange membrane fuel cells a
mechanistic investigation. Journal of The Electrochemical Society.
2005;152:A2256-A71.
[75] Hu J, Zhang H, Zhai Y, Liu G, Yi B. 500 h Continuous aging life test on
PBI/H3PO4 high-temperature PEMFC. International Journal of Hydrogen Energy.
2006;31:1855-62.
[76] Galbiati S, Baricci A, Casalegno A, Marchesi R. Degradation in phosphoric
acid doped polymer fuel cells: A 6000 h parametric investigation. International
Journal of Hydrogen Energy. 2013;38:6469-80.
[77] Zhai Y, Zhang H, Liu G, Hu J, Yi B. Degradation Study on MEA in
H3PO4/PBI High-Temperature PEMFC Life Test. Journal of The Electrochemical
Society. 2007;154:B72-B6.
[78] Wannek C, Kohnen B, Oetjen HF, Lippert H, Mergel J. Durability of ABPBI-
based MEAs for High Temperature PEMFCs at Different Operating Conditions.
Fuel Cells. 2008;8:87-95.
DEGRADATION OF H3PO4/PBI HIGH TEMPERATURE POLYMER ELECTROLYTE MEMBRANE FUEL CELL UNDER STRESSED OPERATING CONDITIONS
90
[79] Marrony M, Barrera R, Quenet S, Ginocchio S, Montelatici L, Aslanides A.
Durability study and lifetime prediction of baseline proton exchange membrane fuel
cell under severe operating conditions. Journal of Power Sources. 2008;182:469-75.
[80] Krishnan L, Snelson T, Puffer R, Walczyk D. Durability studies of PBI-based
membrane electrode assemblies for high temperature PEMFCs. Automation
Science and Engineering (CASE), 2010 IEEE Conference on: IEEE; 2010. p. 21-6.
[81] Suzuki A, Oono Y, Williams MC, Miura R, Inaba K, Hatakeyama N, et al.
Evaluation for sintering of electrocatalysts and its effect on voltage drops in high-
temperature proton exchange membrane fuel cells (HT-PEMFC). International
Journal of Hydrogen Energy. 2012;37:18272-89.
[82] Oono Y, Fukuda T, Sounai A, Hori M. Influence of operating temperature on
cell performance and endurance of high temperature proton exchange membrane
fuel cells. Journal of Power Sources. 2010;195:1007-14.
[83] Lobato J, Cañizares P, Rodrigo MA, Linares JJ. PBI-based polymer electrolyte
membranes fuel cells: Temperature effects on cell performance and catalyst
stability. Electrochimica Acta. 2007;52:3910-20.
[84] Zhai Y, Zhang H, Xing D, Shao Z-G. The stability of Pt/C catalyst in
H3PO4/PBI PEMFC during high temperature life test. Journal of Power Sources.
2007;164:126-33.
[85] Oono Y, Sounai A, Hori M. Long-term cell degradation mechanism in high-
temperature proton exchange membrane fuel cells. Journal of Power Sources.
2012;210:366-73.
[86] Moçotéguy P, Ludwig B, Scholta J, Nedellec Y, Jones DJ, Rozière J. Long-
Term Testing in Dynamic Mode of HT-PEMFC H3PO4/PBI Celtec-P Based
Membrane Electrode Assemblies for Micro-CHP Applications. Fuel Cells.
2010;10:299-311.
[87] Kannan A, Kabza A, Scholta J. Long term testing of start–stop cycles on high
temperature PEM fuel cell stack. Journal of Power Sources. 2015;277:312-6.
[88] Kim J, Kim M, Lee B-G, Sohn Y-J. Durability of high temperature polymer
electrolyte membrane fuel cells in daily based start/stop operation mode using
reformed gas. International Journal of Hydrogen Energy. 2015.
[89] Schmidt TJ, Baurmeister J. Properties of high-temperature PEFC Celtec®-P
1000 MEAs in start/stop operation mode. Journal of Power Sources. 2008;176:428-
34.
[90] Borup RL, Davey JR, Garzon FH, Wood DL, Inbody MA. PEM fuel cell
electrocatalyst durability measurements. Journal of Power Sources. 2006;163:76-
81.
[91] Lobato J, Canizares P, Rodrigo MA, Linares JJ. PBI-based polymer electrolyte
membranes fuel cells: Temperature effects on cell performance and catalyst
stability. Electrochimica Acta. 2007;52:3910-20.
[92] More K, Borup R, Reeves K. Identifying contributing degradation phenomena
in PEM fuel cell membrane electride assemblies via electron microscopy. ECS
Transactions. 2006;3:717-33.
91
[93] Pozio A, De Francesco M, Cemmi A, Cardellini F, Giorgi L. Comparison of
high surface Pt/C catalysts by cyclic voltammetry. Journal of Power Sources.
2002;105:13-9.
[94] Qi Z, Buelte S. Effect of open circuit voltage on performance and degradation
of high temperature PBI–H 3 PO 4 fuel cells. Journal of Power Sources.
2006;161:1126-32.
[95] Yu Y, Li H, Wang H, Yuan X-Z, Wang G, Pan M. A review on performance
degradation of proton exchange membrane fuel cells during startup and shutdown
processes: causes, consequences, and mitigation strategies. Journal of Power
Sources. 2012;205:10-23.
[96] Cho Y-H, Lim JW, Kang YS, Cho Y-H, Kim O-H, Kwon N-H, et al. The
dependence of performance degradation of membrane electrode assembly on
platinum loading in polymer electrolyte membrane fuel cell. International Journal
of Hydrogen Energy. 2012;37:2490-7.
[97] Maass S, Finsterwalder F, Frank G, Hartmann R, Merten C. Carbon support
oxidation in PEM fuel cell cathodes. Journal of Power Sources. 2008;176:444-51.
[98] Reiser CA, Bregoli L, Patterson TW, Jung SY, Yang JD, Perry ML, et al. A
reverse-current decay mechanism for fuel cells. Electrochemical and Solid-State
Letters. 2005;8:A273-A6.
[99] Lim KH, Oh H-S, Jang S-E, Ko Y-J, Kim H-J, Kim H. Effect of operating
conditions on carbon corrosion in polymer electrolyte membrane fuel cells. Journal
of Power Sources. 2009;193:575-9.
[100] Cleemann LN, Buazar F, Li Q, Jensen JO, Pan C, Steenberg T, et al. Catalyst
degradation in high temperature proton exchange membrane fuel cells based on
acid doped polybenzimidazole membranes. Fuel Cells. 2013;13:822-31.
[101] Yuka Oono AS, Michio Hori. Influence of the phosphoric acid-doping level
in a polybenzimidazole membrane on the cell performance of high-temperature
proton exchange membrane fuel cells. Journal of Power Sources. 2009;189:949.
[102] C. Wannek BK, H. F. Oetjen, et al. Durability of ABPBI-based MEAs for
high temperature PEMFCs at different operating conditions. Fuel Cells. 2008;8:95.
[103] S. Yu LX, B. C. Benicewicz. Durability studies of PBI-based high
temperature PEMFCs. Fuel Cells. 2008;8:176.
[104] Lin H, Hsieh Y, Chiu C, Yu T, Chen L. Durability and stability test of proton
exchange membrane fuel cells prepared from polybenzimidazole/poly (tetrafluoro
ethylene) composite membrane. Journal of Power Sources. 2009;193:170-4.
[105] Yuka Oono TF, Atsuo Sounai, Michio Hori. Influence of operating
temperature on cell performance and endurance of high temperature proton
exchange membrane fuel cells. Journal of Power Sources. 2010;195:1014.
[106] Christoph Hartnig TJS. On a new degradation mode for high-temperature
polymer electrolyte fuel cells How bipolar plate degradation affects cell
performance. Electrochimica Acta. 2011;56:4242.
[107] Kyungjung Kwon JOP, Duck Young Yoo, Jung S. Yi. Phosphoric acid
distribution in the membrane electrode assembly of high temperature proton
exchange membrane fuel cells. Electrochimica Acta. 2009;54:6575.
DEGRADATION OF H3PO4/PBI HIGH TEMPERATURE POLYMER ELECTROLYTE MEMBRANE FUEL CELL UNDER STRESSED OPERATING CONDITIONS
92
[108] Mack F, Heissler S, Laukenmann R, Zeis R. Phosphoric acid distribution and
its impact on the performance of polybenzimidazole membranes. Journal of Power
Sources. 2014;270:627-33.
[109] Maier W, Arlt T, Wannek C, Manke I, Riesemeier H, Krüger P, et al. In-situ
synchrotron X-ray radiography on high temperature polymer electrolyte fuel cells.
Electrochemistry Communications. 2010;12:1436-8.
[110] Reimer U, Schumacher B, Lehnert W. Accelerated Degradation of High-
Temperature Polymer Electrolyte Fuel Cells: Discussion and Empirical Modeling.
Journal of The Electrochemical Society. 2015;162:F153-F64.
[111] Ishigami Y, Takada K, Yano H, Inukai J, Uchida M, Nagumo Y, et al.
Corrosion of carbon supports at cathode during hydrogen/air replacement at anode
studied by visualization of oxygen partial pressures in a PEFC—Start-up/shut-down
simulation. Journal of Power Sources. 2011;196:3003-8.
[112] Yuta Ishigami KT, Hiroshi Yano, et al. Corrosion of carbon supports at
cathode during hydrogen/air replacement at anode studied by visualization of
oxygen partial pressures in a PEFC—Start-up/shut-down simulation. Journal of
Power Sources. 2011;196:3008.
[113] Kim JH, Cho EA, Jang JH, Kim HJ, Lim TH, Oh IH, et al. Effects of Cathode
Inlet Relative Humidity on PEMFC Durability during Startup–Shutdown Cycling: I.
Electrochemical Study. Journal of The Electrochemical Society. 2010;157:B104-
B12.
[114] Jo YY, Cho E, Kim JH, Lim T-H, Oh I-H, Kim S-K, et al. Degradation of
polymer electrolyte membrane fuel cells repetitively exposed to reverse current
condition under different temperature. Journal of Power Sources. 2011;196:9906-
15.
[115] Kim JH, Cho EA, Jang JH, Kim HJ, Lim T-H, Oh I-H, et al. Development of
a durable PEMFC startup process by applying a dummy load I. Electrochemical
study. Journal of The Electrochemical Society. 2009;156:B955-B61.
[116] Takagi Y, Takakuwa, Y. Effect of shutoff sequence of hydrogen and air on
performance degradation in PEFC. ECS Transactions. 2006;3:855.
[117] Yi Yu GW, Zhengkai Tu, Zhigang Zhan, Mu Pan. Effect of gas shutoff
sequences on the degradation of proton exchange membrane fuel cells with dummy
load during startup and shutdown cycles. Electrochimica Acta. 2012;71:193.
[118] Yi Yu ZT, Haining Zhang, Zhigang Zhan, Mu Pan. Comparison of
degradation behaviors for open-ended and closed proton exchange membrane fuel
cells during startup and shutdown cycles. Journal of Power Sources.
2011;196:5083.
[119] Hartnig C, Schmidt TJ. Simulated start–stop as a rapid aging tool for polymer
electrolyte fuel cell electrodes. Journal of Power Sources. 2011;196:5564-72.
[120] Wu J, Yuan X-Z, Martin JJ, Wang H, Yang D, Qiao J, et al. Proton exchange
membrane fuel cell degradation under close to open-circuit conditions: part I: in situ
diagnosis. Journal of Power Sources. 2010;195:1171-6.
93
[121] Teranishi K, Kawata K, Tsushima S, Hirai S. Degradation mechanism of
PEMFC under open circuit operation. Electrochemical and Solid-State Letters.
2006;9:A475-A7.
[122] Jiménez S, Soler J, Valenzuela RX, Daza L. Assessment of the performance
of a PEMFC in the presence of CO. Journal of Power Sources. 2005;151:69-73.
[123] Krishnan P, Park J-S, Kim C-S. Performance of a poly(2,5-benzimidazole)
membrane based high temperature PEM fuel cell in the presence of carbon
monoxide. Journal of Power Sources. 2006;159:817-23.
[124] Li Q, He R, Gao J-A, Jensen JO, Bjerrum NJ. The CO poisoning effect in
PEMFCs operational at temperatures up to 200 oC. Journal of The Electrochemical
Society. 2003;150:A1599-A605.
[125] Kwon K, Yoo DY, Park JO. Experimental factors that influence carbon
monoxide tolerance of high-temperature proton-exchange membrane fuel cells.
Journal of Power Sources. 2008;185:202-6.
[126] Chen C-Y, Lai W-H, Chen Y-K, Su S-S. Characteristic studies of a
PBI/H3PO4 high temperature membrane PEMFC under simulated reformate gases.
International Journal of Hydrogen Energy. 2014;39:13757-62.
[127] Boaventura M, Sander H, Friedrich K, Mendes A. The influence of CO on the
current density distribution of high temperature polymer electrolyte membrane fuel
cells. Electrochimica Acta. 2011;56:9467-75.
[128] Engl T, Käse J, Gubler L, Schmidt TJ. On the Positive Effect of CO during
Start/Stop in High-Temperature Polymer Electrolyte Fuel Cells. ECS
Electrochemistry Letters. 2014;3:F47-F9.
[129] Engl T, Gubler L, Schmidt TJ. Think Different! Carbon Corrosion Mitigation
Strategy in High Temperature PEFC: A Rapid Aging Study. Journal of The
Electrochemical Society. 2015;162:F291-F7.
[130] Bergmann A, Gerteisen D, Kurz T. Modelling of CO poisoning and its
dynamics in HTPEM fuel cells. Fuel Cells. 2010;10:278-87.
[131] Jiao K, Alaefour IE, Li X. Three-dimensional non-isothermal modeling of
carbon monoxide poisoning in high temperature proton exchange membrane fuel
cells with phosphoric acid doped polybenzimidazole membranes. Fuel.
2011;90:568-82.
[132] Jiao K, Zhou Y, Du Q, Yin Y, Yu S, Li X. Numerical simulations of carbon
monoxide poisoning in high temperature proton exchange membrane fuel cells with
various flow channel designs. Applied Energy. 2013;104:21-41.
[133] Oh K, Jeong G, Cho E, Kim W, Ju H. A CO poisoning model for high-
temperature proton exchange membrane fuel cells comprising phosphoric acid-
doped polybenzimidazole membranes. International Journal of Hydrogen Energy.
2014;39:21915-26.
[134] Rasheed RKA, Chan SH. Transient carbon monoxide poisoning kinetics
during warm-up period of a high-temperature PEMFC–Physical model and
parametric study. Applied Energy. 2015;140:44-51.
[135] Lopes PP, Freitas KS, Ticianelli EA. CO tolerance of PEMFC anodes:
mechanisms and electrode designs. Electrocatalysis. 2010;1:200-12.
DEGRADATION OF H3PO4/PBI HIGH TEMPERATURE POLYMER ELECTROLYTE MEMBRANE FUEL CELL UNDER STRESSED OPERATING CONDITIONS
94
[136] Modestov AD, Tarasevich MR, Filimonov VY, Davydova ES. CO tolerance
and CO oxidation at Pt and Pt–Ru anode catalysts in fuel cell with
polybenzimidazole–H3PO4 membrane. Electrochimica Acta. 2010;55:6073-80.
[137] Ehteshami SMM, Chan SH. A review of electrocatalysts with enhanced CO
tolerance and stability for polymer electrolyte membarane fuel cells. Electrochimica
Acta. 2013;93:334-45.
[138] Divisek J, Oetjen HF, Peinecke V, Schmidt VM, Stimming U. Components
for PEM fuel cell systems using hydrogen and CO containing fuels. Electrochimica
Acta. 1998;43:3811-5.
[139] Gu T, Lee W-K, Van Zee J. Quantifying the ‘reverse water gas shift’reaction
inside a PEM fuel cell. Applied Catalysis B: Environmental. 2005;56:43-50.
[140] Simon Araya S, Juhl Andreasen S, Venstrup Nielsen H, Knudsen Kær S.
Investigating the effects of methanol-water vapor mixture on a PBI-based high
temperature PEM fuel cell. International Journal of Hydrogen Energy.
2012;37:18231-42.
[141] Araya SS, Grigoras IF, Zhou F, Andreasen SJ, Kær SK. Performance and
endurance of a high temperature PEM fuel cell operated on methanol reformate.
International Journal of Hydrogen Energy. 2014;39:18343-50.
[142] Sethuraman VA, Weidner JW. Analysis of sulfur poisoning on a PEM fuel
cell electrode. Electrochimica Acta. 2010;55:5683-94.
[143] Schmidt TJ, Baurmeister J. Durability and reliability in high-temperature
reformed hydrogen PEFCs. ECS Transactions. 2006;3:861-9.
[144] Yi Yu X-ZY, Hui Li, Elton Gu, Haijiang Wang, Guangjin Wang, Mu Pan.
Current mapping of a proton exchange membrane fuel cell with a segmented
current collector during the gas starvation and shutdown processes. International
Journal of Hydrogen Energy. 2012;37:15300.
[145] Guangsheng Zhang SS, Liejin Guo, Hongtan Liu. Dynamic characteristics of
local current densities and temperatures in proton exchange membrane fuel cells
during reactant starvations. International Journal of Hydrogen Energy.
2012;37:1892.
[146] Yousfi-Steiner N, Moçotéguy P, Candusso D, Hissel D. A review on polymer
electrolyte membrane fuel cell catalyst degradation and starvation issues: Causes,
consequences and diagnostic for mitigation. Journal of Power Sources.
2009;194:130-45.
[147] Liang D, Dou M, Hou M, Shen Q, Shao Z, Yi B. Behavior of a unit proton
exchange membrane fuel cell in a stack under fuel starvation. Journal of Power
Sources. 2011;196:5595-8.
[148] Liang D, Shen Q, Hou M, Shao Z, Yi B. Study of the cell reversal process of
large area proton exchange membrane fuel cells under fuel starvation. Journal of
Power Sources. 2009;194:847-53.
[149] Zhang G, Shen S, Guo L, Liu H. Dynamic characteristics of local current
densities and temperatures in proton exchange membrane fuel cells during reactant
starvations. International Journal of Hydrogen Energy. 2012;37:1884-92.
95
[150] Taniguchi A, Akita T, Yasuda K, Miyazaki Y. Analysis of degradation in
PEMFC caused by cell reversal during air starvation. International Journal of
Hydrogen Energy. 2008;33:2323-9.
[151] Pérez LC, Brandão L, Sousa JM, Mendes A. Segmented polymer electrolyte
membrane fuel cells—A review. Renewable and Sustainable Energy Reviews.
2011;15:169-85.
[152] Neyerlin KC, Gasteiger HA, Mittelsteadt CK, Jorne J, Gu W. Effect of
Relative Humidity on Oxygen Reduction Kinetics in a PEMFC. Journal of The
Electrochemical Society. 2005;152:A1073-A80.
[153] Yuan X, Wang H, Colin Sun J, Zhang J. AC impedance technique in PEM
fuel cell diagnosis—A review. International Journal of Hydrogen Energy.
2007;32:4365-80.
[154] Hu J, Zhang H, Gang L. Diffusion–convection/electrochemical model studies
on polybenzimidazole (PBI) fuel cell based on AC impedance technique. Energy
Conversion and Management. 2008;49:1019-27.
[155] Springer T, Zawodzinski T, Wilson M, Gottesfeld S. Characterization of
polymer electrolyte fuel cells using AC impedance spectroscopy. Journal of The
Electrochemical Society. 1996;143:587-99.
[156] Koponen U, Kumpulainen H, Bergelin M, Keskinen J, Peltonen T, Valkiainen
M, et al. Characterization of Pt-based catalyst materials by voltammetric
techniques. Journal of Power Sources. 2003;118:325-33.
[157] Roth C, Martz N, Fuess H. An X-ray diffraction and transmission electron
microscopy study of Pt—Ru fuel cell catalysts before and after operation. Journal
of applied electrochemistry. 2004;34:345-8.
[158] Boaventura M, Mendes A. Activation procedures characterization of MEA
based on phosphoric acid doped PBI membranes. International Journal of Hydrogen
Energy. 2010;35:11649-60.
[159] Galbiati S, Baricci A, Casalegno A, Carcassola G, Marchesi R. On the
activation of polybenzimidazole-based membrane electrode assemblies doped with
phosphoric acid. International Journal of Hydrogen Energy. 2012;37:14475-81.
[160] Andreasen SJ, Vang JR, Kær SK. High temperature PEM fuel cell
performance characterisation with CO and CO2 using electrochemical impedance
spectroscopy. International Journal of Hydrogen Energy. 2011;36:9815-30.
[161] Kim J-R, Yi JS, Song T-W. Investigation of degradation mechanisms of a
high-temperature polymer-electrolyte-membrane fuel cell stack by electrochemical
impedance spectroscopy. Journal of Power Sources. 2012;220:54-64.
[162] Mamlouk M, Scott K. Analysis of high temperature polymer electrolyte
membrane fuel cell electrodes using electrochemical impedance spectroscopy.
Electrochimica Acta. 2011;56:5493-512.
[163] Jespersen JL, Schaltz E, Kær SK. Electrochemical characterization of a
polybenzimidazole-based high temperature proton exchange membrane unit cell.
Journal of Power Sources. 2009;191:289-96.
DEGRADATION OF H3PO4/PBI HIGH TEMPERATURE POLYMER ELECTROLYTE MEMBRANE FUEL CELL UNDER STRESSED OPERATING CONDITIONS
96
[164] Lawrence MG. The relationship between relative humidity and the dewpoint
temperature in moist air: A simple conversion and applications. Bulletin of the
American Meteorological Society. 2005;86:225-33.
[165] Engl T, Waltar KE, Gubler L, Schmidt TJ. Second Cycle Is Dead: Advanced
Electrode Diagnostics for High-Temperature Polymer Electrolyte Fuel Cells.
Journal of The Electrochemical Society. 2014;161:F500-F5.
[166] Modestov AD, Tarasevich MR, Leykin AY. CO electrooxidation study on Pt
and Pt–Ru in H3PO4 using MEA with PBI–H3PO4 membrane. Journal of Power
Sources. 2011;196:2994-3002.
[167] Smith R, Loganathan M, Shantha MS. A review of the water gas shift
reaction kinetics. International Journal of Chemical Reactor Engineering. 2010;8.
[168] Cheng X, Shi Z, Glass N, Zhang L, Zhang J, Song D, et al. A review of PEM
hydrogen fuel cell contamination: Impacts, mechanisms, and mitigation. Journal of
Power Sources. 2007;165:739-56.
[169] Springer T, Rockward T, Zawodzinski T, Gottesfeld S. Model for Polymer
Electrolyte Fuel Cell Operation on Reformate Feed: Effects of CO, H2 Dilution, and
High Fuel Utilization. Journal of The Electrochemical Society. 2001;148:A11-A23.
[170] Taniguchi A, Akita T, Yasuda K, Miyazaki Y. Analysis of electrocatalyst
degradation in PEMFC caused by cell reversal during fuel starvation. Journal of
Power Sources. 2004;130:42-9.
[171] Larminie J, Dicks A, McDonald MS. Fuel cell systems explained: Wiley New
York; 2003.
[172] Kang J, Jung DW, Park S, Lee J-H, Ko J, Kim J. Accelerated test analysis of
reversal potential caused by fuel starvation during PEMFCs operation. International
Journal of Hydrogen Energy. 2010;35:3727-35.
[173] Zhang J, Tang Y, Song C, Zhang J, Wang H. PEM fuel cell open circuit
voltage (OCV) in the temperature range of 23 °C to 120 °C. Journal of Power
Sources. 2006;163:532-7.