Embed Size (px)
Citation preview
8/10/2019 Decom Insight 2014 7 Oct 2014 v6 FINAL
http://slidepdf.com/reader/full/decom-insight-2014-7-oct-2014-v6-final 1/44
DECOMMISSIONING
INSIGHT 2014

8/10/2019 Decom Insight 2014 7 Oct 2014 v6 FINAL
http://slidepdf.com/reader/full/decom-insight-2014-7-oct-2014-v6-final 2/44
DECOMMISSIONING INSIGHT 2014
2
8/10/2019 Decom Insight 2014 7 Oct 2014 v6 FINAL
http://slidepdf.com/reader/full/decom-insight-2014-7-oct-2014-v6-final 3/44 3
Contents
1. Foreword 4
2. Key Findings 6
3. Introducon 9
3.1 Survey Development and Methodology 9
3.2 Classicaon of Expenditure 10
4. Results of the 2014 Decommissioning Survey 11
4.1 Historical Comparison of Forecast Expenditure 12
4.1 Regional Analysis 13
4.3 Forecast Expenditure by Decommissioning Component 13
5. Decommissioning Acvity in 2013 17
6. Forecast Decommissioning Acvity from 2014 to 2023 18
6.1 Well Plugging and Abandonment 18
6.2 Facilies Making Safe and Topside Preparaon 23
6.3 Removal 26
6.4 Pipeline Decommissioning 33
6.5 Onshore Recycling and Disposal 36
6.6 Site Remediaon and Monitoring 39
7. Appendices 40
a. Work Break Down Structure Denions 40
b. Associaon for the Advancement of
Cost Engineering Classicaons 41
DECOMMISSIONING INSIGHT 2014
8/10/2019 Decom Insight 2014 7 Oct 2014 v6 FINAL
http://slidepdf.com/reader/full/decom-insight-2014-7-oct-2014-v6-final 4/44
DECOMMISSIONING INSIGHT 2014
4
1. Foreword
Oil & Gas UK’s Decommissioning Insight is the leading industry forecast for decommissioning acvity and expenditure on
the UK Connental Shelf (UKCS). Produced annually, the publicaon provides a ten-year forecast by region, enabling the
industry to develop its capabilies accordingly. This year the report focuses on the acvies of 28 operators on the UKCS.
The oshore oil and gas industry is the UK’s largest industrial investor, and Oil & Gas UK’s Economic Report 20141
indicates a potenally strong future for domesc oil and gas producon. The Wood Review highlights the need for
industry to focus on maximising economic recovery from the UKCS with a new spirit of cooperaon to reduce costs and
increase eciency2. The review also recommends a dedicated decommissioning strategy, arguing that with sucient
early planning and coordinaon, the UK supply chain should be able to build a compeve advantage to meet the needs
of maturing oil provinces at home and abroad. Oil & Gas UK’s 2014 Decommissioning Insight aims to facilitate this goal.
The report indicates that a handful of large decommissioning projects are well under way and will be delivered in the next
ve to seven years. Projects listed on the Department of Energy & Climate Change’s pathnder website include Brent,
Miller, Murchison, and Thames3. These agship projects will provide valuable insight for the industry as it learns how to
decommission elds in a cost eecve and ecient manner, thereby introducing new technologies and processes which,
in turn, increase the UK’s compeve capability.
Industry’s shared aim is to undertake decommissioning in a cost eecve, environmentally sound manner. However,
success will also see decommissioning dates moved back if we can aract further investment into the many mature elds
across the UKCS. Over the last three months, HM Treasury has led a consultaon into the future of the scal regime for
the UKCS. Industry has engaged construcvely with the objecve of delivering a simple, more compeve regime which
encourages late-life investment and fosters new business models for decommissioning – innovaon and investment willboth be essenal if we are to succeed in this task.
The Decommissioning Relief Deed (DRD), a contract between government and industry that guarantees certainty of future
tax relief on decommissioning costs, has been such an innovaon and has already extended the producve life of a number
of elds. The DRD enables companies to move their decommissioning liabilies to a post-tax basis, releasing addional
funds, which would otherwise be ed-up in securies for further investment in oil and gas producon. To date, 61 DRDs
have been executed, freeing up at least £2.2 billion for further investment in oil and gas producon 4.
1 Oil & Gas UK’s Economic Report 2014 is available to download at www.oilandgasuk.co.uk/economicreport 2
The Wood Report – UKCS Maximising Economic Recovery Review: Final Report – is available to download atwww.woodreview.co.uk
3 The Department of Energy & Climate Change Pathnder website can be viewed at
www.og.decc.gov.uk/pathnder/decommissioningindex.html 4 As of 21 July 2014.

8/10/2019 Decom Insight 2014 7 Oct 2014 v6 FINAL
http://slidepdf.com/reader/full/decom-insight-2014-7-oct-2014-v6-final 5/44 5
1
2
3
4
5
6
7
Total decommissioning expenditure on oshore assets over the next decade is forecast to be £14.6 billion, or just under
£1.5 billion per annum. Whilst this is a signicant sum, it should be put into context against total capital expenditure of
£14.4 billion5 last year. The challenge is to see a thriving decommissioning market emerge as part of a connued and
sustained capital investment programme; both will rely on a relentless focus on cost eciency and a desire to achieve yet
more eecve ways of working.
This document could only have been produced through support of the operators who provided data to the survey.
We would like to thank these companies for their connued support.
We trust you nd this document an informave and useful guide to decommissioning acvity on the UKCS.
Oonagh Werngren
Operaons Director
Oil & Gas UK
5 Oil & Gas UK’s Acvity Survey 2014 is available to download at www.oilandgasuk.co.uk/forecasts.cfm
8/10/2019 Decom Insight 2014 7 Oct 2014 v6 FINAL
http://slidepdf.com/reader/full/decom-insight-2014-7-oct-2014-v6-final 6/44
DECOMMISSIONING INSIGHT 2014
6
2. Key Findings
• In 2013, £470 million was spent on decommissioning.
• Total forecast expenditure on decommissioning from 2014 to 2023 is £14.6 billion6.
• Total forecast expenditure has increased since 2013 due to the following factors; £3 billion is aributed to new
respondents to the survey and £1.2 billion is aributed to higher forecasts from exisng projects.
• Twenty-eight operators responded to the call for data, which is an increase on previous years.
• Forty-three per cent of total forecast expenditure will be concentrated in the central North Sea (£6.3 billion).
Many of the projects included in the 2014 survey for the rst me are in this region.
• Relave to the 2013 Decommissioning Insight report, six projects have been deferred with their expenditure now
occurring parally outside of the survey meframe.
• Most of the decommissioning programmes captured in this survey are considered to be in the early scoping
stages. Forecasts are therefore subject to change as projects become more dened.
• The largest category of expenditure is well plugging and abandonment (P&A) at 44 per cent of the total forecast
(£6.4 billion).
• Operators forecast that decommissioning expenditure in 2014 will reach £1 billion for the rst me in a single
year and will average £1.5 billion each year over the ten years (2014 to 2023).
6 This gure excludes £520 million of expenditure data provided as lump sums and for decommissioning onshore terminals.
8/10/2019 Decom Insight 2014 7 Oct 2014 v6 FINAL
http://slidepdf.com/reader/full/decom-insight-2014-7-oct-2014-v6-final 7/44 7
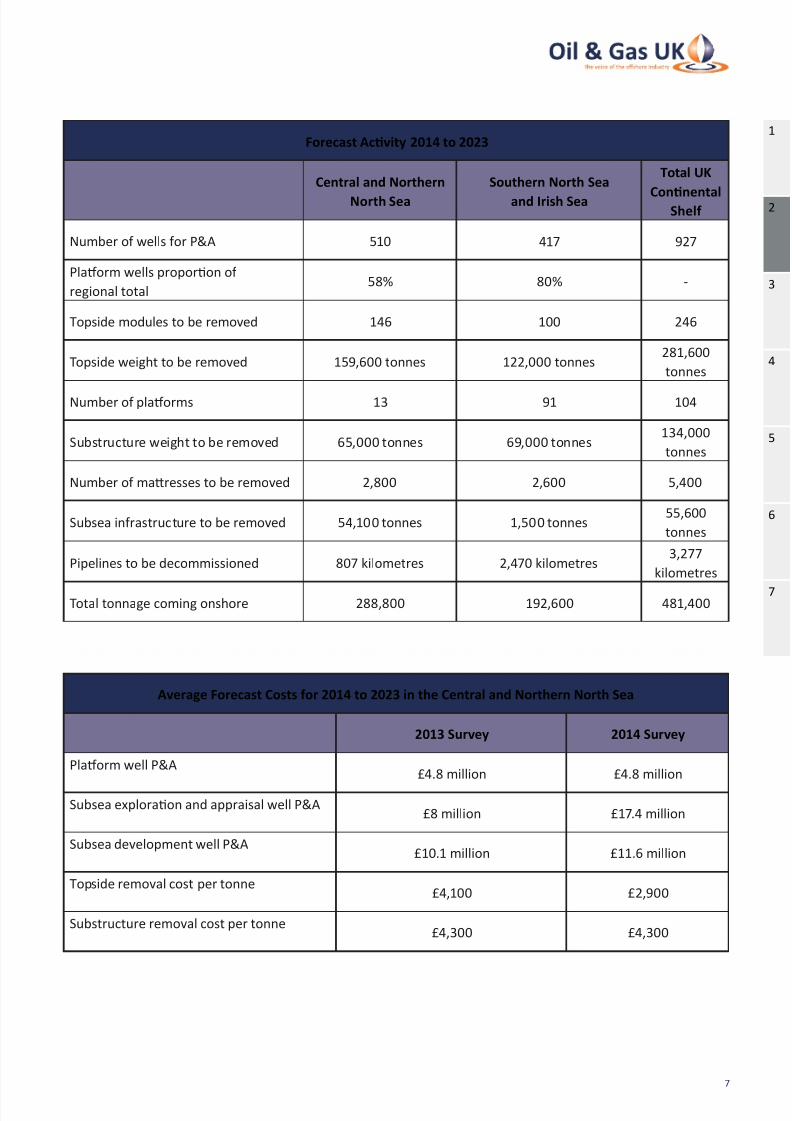
Forecast Acvity 2014 to 2023
Central and Northern
North Sea
Southern North Sea
and Irish Sea
Total UK
ConnentalShelf
Number of wells for P&A 510 417 927
Plaorm wells proporon of
regional total 58% 80% -
Topside modules to be removed 146 100 246
Topside weight to be removed 159,600 tonnes 122,000 tonnes281,600
tonnes
Number of plaorms 13 91 104
Substructure weight to be removed 65,000 tonnes 69,000 tonnes 134,000
tonnes
Number of maresses to be removed 2,800 2,600 5,400
Subsea infrastructure to be removed 54,100 tonnes 1,500 tonnes 55,600
tonnes
Pipelines to be decommissioned 807 kilometres 2,470 kilometres 3,277
kilometres
Total tonnage coming onshore 288,800 192,600 481,400
Average Forecast Costs for 2014 to 2023 in the Central and Northern North Sea
2013 Survey 2014 Survey
Plaorm well P&A£4.8 million £4.8 million
Subsea exploraon and appraisal well P&A£8 million £17.4 million
Subsea development well P&A£10.1 million £11.6 million
Topside removal cost per tonne£4,100 £2,900
Substructure removal cost per tonne£4,300 £4,300
1
2
3
4
5
6
7
8/10/2019 Decom Insight 2014 7 Oct 2014 v6 FINAL
http://slidepdf.com/reader/full/decom-insight-2014-7-oct-2014-v6-final 8/44
DECOMMISSIONING INSIGHT 2014
8
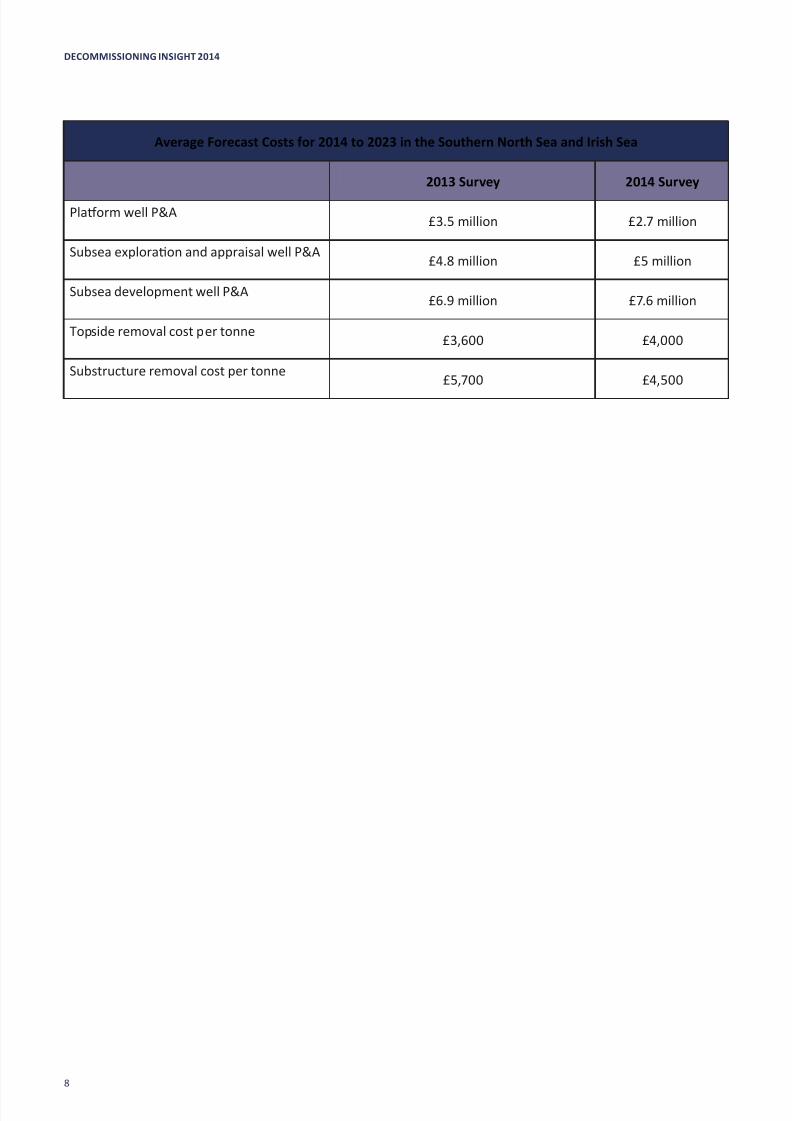
Average Forecast Costs for 2014 to 2023 in the Southern North Sea and Irish Sea
2013 Survey 2014 Survey
Plaorm well P&A£3.5 million £2.7 million
Subsea exploraon and appraisal well P&A£4.8 million £5 million
Subsea development well P&A£6.9 million £7.6 million
Topside removal cost per tonne£3,600 £4,000
Substructure removal cost per tonne£5,700 £4,500

8/10/2019 Decom Insight 2014 7 Oct 2014 v6 FINAL
http://slidepdf.com/reader/full/decom-insight-2014-7-oct-2014-v6-final 9/44 9
3. Introducon
3.1 Survey Development and Methodology
The Decommissioning Insight 2014 builds on the work of previous reports, incorporang requests from the supply
chain and the Oil & Gas UK Decommissioning Market Insight Work Group. It is compiled from operators’ responses
to an Oil & Gas UK survey carried out between June and August 2014 on their decommissioning acvity and
expenditure in 2013 and respecve forecasts for 2014 to 2023.
The survey is based on the components of the decommissioning Work Breakdown Structure (WBS) outlined in
Oil & Gas UK’s Decommissioning Cost Esmang Guidelines7 (see Appendix). Operators were asked to quanfy
physical decommissioning acvity for 20 dierent categories in the WBS, such as the tonnes of substructure
(jacket) to be removed or the length of pipeline to be made safe.
Operators were also asked to provide expenditure forecasts for these categories of acvity, broken down by year.
The categories align with those used in the 2013 survey and allow easy mapping of the data to the WBS.
Although it is possible to compare data across the 2011 to 2014 Decommissioning Insight reports, it is important
to note that the 2013 and 2014 surveys are modelled on the new WBS, while previous surveys were based on the
former WBS. Any historical analysis that Oil & Gas UK has carried out for the purposes of this report has been
conducted on comparable categories of the WBS.
The informaon presented in the following secons is solely based on the data as submied at the me ofthe survey and is presented in a non-aributable, aggregate basis. Oil & Gas UK has not applied any addional
treatment to the gures. Analysis has been carried out on a regional basis and split into two groups: the central
and northern North Sea and the southern North Sea and Irish Sea.
The 2014 report has been expanded to include:
• An analysis of how well plugging and abandonment (P&A) cost forecasts have varied historically using data from
the 2011 to 2014 reports
• A regional analysis of the rig type that will be used for well P&A
• An analysis of how the forecast cost per tonne for topside and substructure removal has varied historically using
data from the 2011 to 2014 reports
• The number of topside modules to be made safe each year
• Analyses of the actual spend and acvity carried out in 2013 compared with the forecast
1
2
3
4
5
6
7
7 The Decommissioning Cost Esmang Guidelines are available to download at
www.oilandgasuk.co.uk/publicaons/publicaons.cfm
8/10/2019 Decom Insight 2014 7 Oct 2014 v6 FINAL
http://slidepdf.com/reader/full/decom-insight-2014-7-oct-2014-v6-final 10/44
DECOMMISSIONING INSIGHT 2014
10
Decommissioning Forecasts 2014 to 2023
Forecasng decommissioning expenditure at the outset of a project is challenging due to the many uncertaines
and factors inuencing expenditure, such as the duraon of well P&A or the quanes of hazardous waste
materials. As decommissioning projects are not subject to the same me pressures as development projects,
there is more exibility in the ming of execuon, within integrity and safety constraints. Therefore, Oil & Gas UK
expects forecasts presented in this report to be subject to change, parcularly those post-2020.
Oil & Gas UK’s Acvity Survey 2014, which aggregates data over a longer mespan than this report, forecasts
that £37 billion will be spent on decommissioning exisng assets from 2014 through to 2040. New investment in
probable developments would add £3.6 billion to this total, although much of this will be incurred aer 20408.
3.2 Classicaon of Expenditure
The Associaon for the Advancement of Cost Engineering (AACE) has developed a set of guidelines9 to apply an
esmate classicaon to projected costs. Operators were asked to use these guidelines to provide an esmate
class for all projects, determined by the level of ‘project denion’ with consideraon to a set of secondary
characteriscs. The ve esmate classes in the Cost Esmate Classicaon Matrix are shown in Appendix b.
Eighty-ve per cent of the survey respondents classied their expenditure using the AACE Cost Esmaon
Classicaon Matrix. Forty-eight per cent of projects were reported as class 4, with a further 44 per cent reported
as class 5. This shows that the majority (92 per cent) of projects are in the early planning stages of outlining the
scope and carrying out feasibility studies. These will have a level of project denion from 0 to 15 per cent (where
100 per cent represents complete project denion).
Only ve per cent of projects were reported as class 1 or 2, where the level of project denion is between 30 and
100 per cent and projects are either at the contracng stage or already in execuon.
8 All references in 2013 money, Oil & Gas UK’s Acvity Survey 2014 is available to download at
www.oilandgasuk.co.uk/forecasts.cfm 9 Further informaon on the Associaon for the Advancement of Cost Engineering (AACE) classicaon
scheme is available at www.costengineering.eu/Downloads/arcles/AACE+CLASSIFICATION_SYSTEM.pdf

8/10/2019 Decom Insight 2014 7 Oct 2014 v6 FINAL
http://slidepdf.com/reader/full/decom-insight-2014-7-oct-2014-v6-final 11/44 11
4. Results of the 2014 Decommissioning Survey
The following results represent operators’ expenditure and acvity forecasts for decommissioning UK Connental
Shelf (UKCS) assets each year from 2014 to 2023. The analysis does not include the expenditure provided as lumpsums or associated with decommissioning onshore terminals10.
To put decommissioning acvity into context with the overall industry, the total decommissioning expenditure
forecast over the ten-year period 2014 to 2023 is £14.6 billion, whereas the total capital expenditure on
development projects in 2013 alone was £14.4 billion11.
The total expenditure forecast captured in the report has increased on last year. Three billion pounds of this
increase is aributed to projects in the central North Sea (CNS) and southern North Sea (SNS) included for the
rst me from new survey respondants. A further £1.2 billion is aributed to higher expenditure esmates from
the majority of projects included in the 2013 and 2014 surveys. This is a reecon of these projects becoming
more dened.
Planning for decommissioning can be a long and challenging process which operators start far ahead of cessaon
of producon (COP). The scope of each decommissioning project is rened over me and esmates are therefore
subject to change during this process. As the eld nears COP and the project scope becomes more fully dened,
expenditure forecasts become more precise.
With the focus across industry on maximising economic recovery (MER UK12) and extending the life of elds in
the basin, six projects have been deferred since the 2013 report was published, with a greater proporon of their
decommissioning expenditure now falling outside the ten-year survey meframe. An example of this is the Brae
eld – decommissioning was postponed to align the ming of Brae Alpha, Bravo and East Brae13.
The forecast expenditure to decommission elds serviced by oang, producon, storage and ooading (FPSO)
vessels is £1.6 billion, all of which will be spent in the CNS and northern North Sea (NNS) areas. The majority of
decommissioning acvity for these elds is subsea, although some expenditure is associated with disconnecng
the FPSO. FPSO weights have not been included in the removals secon as these are typically relocated or sold
for reuse.
1
2
3
4
5
6
7
10 £500 million was provided as lump sums with no yearly breakdown of expenditure.11
Oil & Gas UK’s Acvity Survey 2014 is available to download at www.oilandgasuk.co.uk/forecasts.cfm 12 The Wood Report – UKCS Maximising Economic Recovery Review: Final Report – is available to download at
www.woodreview.co.uk13 The presentaon on ‘Decommissioning Plan B: Thinking Dierently’ is available to download at
www.bit.ly/decomplanb

8/10/2019 Decom Insight 2014 7 Oct 2014 v6 FINAL
http://slidepdf.com/reader/full/decom-insight-2014-7-oct-2014-v6-final 12/44
DECOMMISSIONING INSIGHT 2014
12
4.1 Historical Comparison of Forecast Expenditure
A comparison of forecast expenditure has been carried out using data from previous Decommissioning Insight
reports (2011 to 2014)
14
. See Figure 1 below.
The paern of forecast expenditure in this report is in line with last year; however, the average yearly forecast
expenditure has increased to £1.5 billion, compared with £1 billion in the 2013 report, represenng a clear market
opportunity for the supply chain. For 2014 specically, operators forecast that expenditure will reach £1 billion
for the rst me.
In 2013, £470 million was spent on decommissioning, represenng 81 per cent of the £580 million forecasted.
The dierence between these gures is due to the mescales of some well P&As being extended. The associated
expenditure has spread into 2014.
Figure 1: Comparison of the Annual Forecast Decommissioning Expenditure
on the UK Connental Shelf (2011 to 2014 surveys)
0
500
1,000
1,500
2,000
2012 2013 2014 2015 2016 2017 2018 2019 2020 2021 2022 2023
F o r e c a s t E x p e n d i t u r e ( £ M
i l l i o n )
2011 2012 2013 2014
Increased Uncertainty
in Forecasts
Source: Oil & Gas UK
14 All expenditure in 2014 money at 01.08.2014.

8/10/2019 Decom Insight 2014 7 Oct 2014 v6 FINAL
http://slidepdf.com/reader/full/decom-insight-2014-7-oct-2014-v6-final 13/44 13
4.2 Regional Analysis
Figure 2 shows that of the £14.6 billion forecast decommissioning expenditure from 2014 to 2023, 43 per cent
(£6.3 billion) will be concentrated in the CNS, 33 per cent (£4.8 billion) in the NNS, and 24 per cent (£3.5 billion) inthe SNS and Irish Sea (IS). The higher proporon of expenditure in the CNS and NNS reects the size and degree of
complexity of projects in these regions.
Figure 2: Total Forecast Decommissioning Expenditure on the
UK Connental Shelf by Year and Region from 2014 to 2023
0
500
1,000
1,500
2,000
2,500
2014 2015 2016 2017 2018 2019 2020 2021 2022 2023
F o r e c a s t E x p e n d i t u r e ( £ M i l l i o n )
Northern North Sea Central North Sea Southern North Sea Irish Sea
Increased Uncertainty in
Forecasts
Source: Oil & Gas UK
The majority of new projects captured in the survey are in the CNS area, where the expenditure has consequently
almost doubled on last year’s forecast (£3.3 billion in 2013). Most of these are subsea projects with a focus on well
P&A, although several plaorm removals have also been included for the rst me.
4.3 Forecast Expenditure by Decommissioning Component
The WBS components that incur expenditure during decommissioning are determined by the nature of the
project. While a small subsea e-back may only involve the P&A of a single well, decommissioning large complex
projects can incur expenditure in all WBS components. These larger programmes require signicant overheads
for project management and operaonal costs, in addion to substanal engineering experse, equipment
and personnel.
Operator project management costs span the enre decommissioning process and include: project management;
preparaon of decommissioning programmes, studies and reports; and all related consultaon and
stakeholder engagement.
1
2
3
4
5
6
7

8/10/2019 Decom Insight 2014 7 Oct 2014 v6 FINAL
http://slidepdf.com/reader/full/decom-insight-2014-7-oct-2014-v6-final 14/44
DECOMMISSIONING INSIGHT 2014
14
Facility running and owners’ costs are the expenses incurred to operate the decommissioning programme
post-COP through to compleon. This involves managing the facility, both as a pre-normally unmanned installaon
(Pre-NUI) and normally unmanned installaon (NUI), with expenditure on logiscs, a decommissioning team,
the deck crew, power generaon, plaorm services, integrity management (inspecon and maintenance) and
specialist services.
Figure 3 breaks down the total yearly expenditure into three categories: operator project management/facility
running costs; well P&A; and removal and other associated acvity. The laer includes expenditure on the
following: making safe; topside preparaon; removal of topsides, substructures and subsea infrastructure; pipeline
decommissioning; and disposal, recycling, site remediaon and monitoring.
Operator project management/facility running costs are forecast to remain relavely stable, peaking in 2015 as a
number of projects gear up for decommissioning. Well P&A is highest in 2017, and removal expenditure is forecast
to be low in the near term, but relavely stable across the rest of the decade. The acvity related to each of these
WBS components is discussed in secon 6.
Figure 3: Total Forecast Decommissioning Expenditure on the
UK Connental Shelf by Work Breakdown Structure Category from 2014 to 2023
0
500
1,000
1,500
2,000
2,500
2014 2015 2016 2017 2018 2019 2020 2021 2022 2023
F o r e c a s t E x p e n d i t u r e ( £ M i l l i o n )
Operator Project Management/Facility Running Costs Well P&A Removal and Other Associated Activity
Increased Uncertainty
in Forecasts
Source: Oil & Gas UK
Expenditure 2014 to 2023
Operator project management/facility running costs £3.1 billion
Well P&A £6.4 billion
Removal and other associated acvity £5.1 billion

8/10/2019 Decom Insight 2014 7 Oct 2014 v6 FINAL
http://slidepdf.com/reader/full/decom-insight-2014-7-oct-2014-v6-final 15/44 15
Figure 4 overleaf breaks down the total forecast expenditure by proporon of WBS component for all UKCS
projects, subsea projects (including FPSOs), facility removal projects in the CNS and NNS areas, and facility removal
projects in the SNS and IS areas.
Well P&A is the largest category of expenditure, accounng for 44 per cent (£6.4 billion) of the total forecast on
the UKCS, in line with previous reports. The proporon of expenditure on wells increases signicantly for subsea
projects to 67 per cent (£1.7 billion).
Across the UKCS, 94 per cent (£2.9 billion) of all owners’ costs (including all facility running and operator
project management costs) are in the CNS and NNS areas. This is due to the size and complexity of projects in
these regions and the fact that plaorms are typically manned installaons. Owners’ costs, in turn, represent
34 per cent (£2.7 billion) of facility removal projects in the CNS and NNS areas, compared with only four per cent
(£145 million) in the SNS and IS areas.
As a proporon, expenditure on topside, substructure and subsea structure removals in the SNS and IS areas
is higher than in the CNS and NNS, despite the greater complexity of projects in the laer regions. This is a
consequence of the lower proporon of expenditure on owners’ costs in the SNS and IS areas.
Oil & Gas UK and industry are currently working on developing a beer understanding of the key decommissioning
cost drivers and how these can be reduced. Well P&A duraon, removal duraon, and vessel rates have been
idened as the key cost drivers and, as such, are the focus of this work.
1
2
3
4
5
6
7

8/10/2019 Decom Insight 2014 7 Oct 2014 v6 FINAL
http://slidepdf.com/reader/full/decom-insight-2014-7-oct-2014-v6-final 16/44
DECOMMISSIONING INSIGHT 2014
16
Figure 4: Forecast of Total Decommissioning Expenditure on the UK Connental Shelf
by Work Breakdown Structure Component and Project Type from 2014 to 2023
16%
26%
18%
10%
0%
10%
20%
30%
40%
50%
60%
70%
80%
90%
100%
P r o p o r t i o n o f T o t a l E x p e n d i t u r e f o r E a c h W o r k
B r e a k d o w n S t r u c t u r e C o m p o n e n t
Owners' Costs: 21%
Well P&A: 44%
7%
Removals:
19%*
67%
8%
11%
0%
10%
20%
30%
40%
50%
60%
70%
80%
90%
100%
P r o p o r t i o n o f T o t
a l E x p e n d i t u r e F o r E a c h W o r k
B r e a k d o w n S t r u c t u r e C o m p o n e n t
Owners' Costs: 9%
Well P&A: 67%
Removals:
8%*
26%
33%
12%
7%
0%
10%
20%
30%
40%
50%
60%
70%
80%
90%
100%
P r o
p o r t i o n o f T o t a l E x p e n d i t u r e f o r E a c h W o r k
B r e a k d o w n S t r u c t u r e C o m p o n e n t
Owners' Costs: 34%
Well P&A: 33%
Removals:
20%*
31%
18%
9%
13%
9%
0%
10%
20%
30%
40%
50%
60%
70%
80%
90%
100%
P r o
p o r t i o n o f T o t a l E x p e n d i t u r e F o r E a c h W o r k
B r e a k d o w n S t r u c t u r e C o m p o n e n t
Well P&A: 49%
Removals:
27*%
Source: Oil & Gas UK
Operator Project Management Facility Running/Owner costs
Wells (Platform and Subsea) Platform Wells
Subsea Wells Facility/Pipeline Making Safe
Topsides Preparation Topside Removal
Substructure Removal Subsea Infrastructure Removal
Pipelines Topsides and Substructure Onshore RecyclingSite Remediation Monitoring
* Indicates expenditure clearly identified as removal
ALL UKCS Projects Subsea Projects
CNS and NNS Facilies Removal Projects SNS and IS Facilies Removal Projects

8/10/2019 Decom Insight 2014 7 Oct 2014 v6 FINAL
http://slidepdf.com/reader/full/decom-insight-2014-7-oct-2014-v6-final 17/44 17
5. Decommissioning Acvity in 2013
Analysis has been carried out to assess the level of acvity forecasted for 2013 in comparison to what has
actually been executed. Operators forecasted acvity in well P&A, subsea infrastructure removal and pipelinedecommissioning, the majority of which was accomplished as planned.
Decommissioning Acvity Forecast for Acvity in 2013 2013 Actual Acvity
Subsea exploraon and appraisal
well P&A
11 8
Plaorm well P&A 13 All acvity carried out
Subsea development well P&A 2 All acvity carried out
Maresses 12 All acvity carried out
Subsea infrastructure 1,600 tonnes All acvity carried out
Pipelines 22 kilometres All acvity carried out
All the plaorm wells were safely plugged and abandoned in 2013 using an integral rig. The subsea well P&As
carried out in 2013 varied in degree of complexity. The subsea exploraon and appraisal (E&A) well P&As that
were not carried out in 2013 are scheduled to be nished in 2014 following longer P&A duraons on some wells.
1
2
3
4
5
6
7
8/10/2019 Decom Insight 2014 7 Oct 2014 v6 FINAL
http://slidepdf.com/reader/full/decom-insight-2014-7-oct-2014-v6-final 18/44
DECOMMISSIONING INSIGHT 2014
18
6. Forecast Decommissioning Acvity from 2014 to 2023
The following secons of this report focus on the specic areas of forecast acvity outlined in the WBS.
6.1 Well Plugging and Abandonment
Well P&A on the UKCS is carried out in accordance with industry guidelines15. The process of well P&A can be
challenging and may involve intervenon, the removal of downhole equipment (such as producon tubing and
casing), and well-scale decontaminaon treatment. It also requires removing the wellhead and conductor to three
metres below the seabed.
Of the current inventory of around 5,000 wells that will eventually require P&A on the UKCS16, close to 930 are
scheduled for decommissioning over the next decade at a cost of £6.4 billion. This represents nearly 19 per cent
of the total well stock.
The Central and Northern North Sea
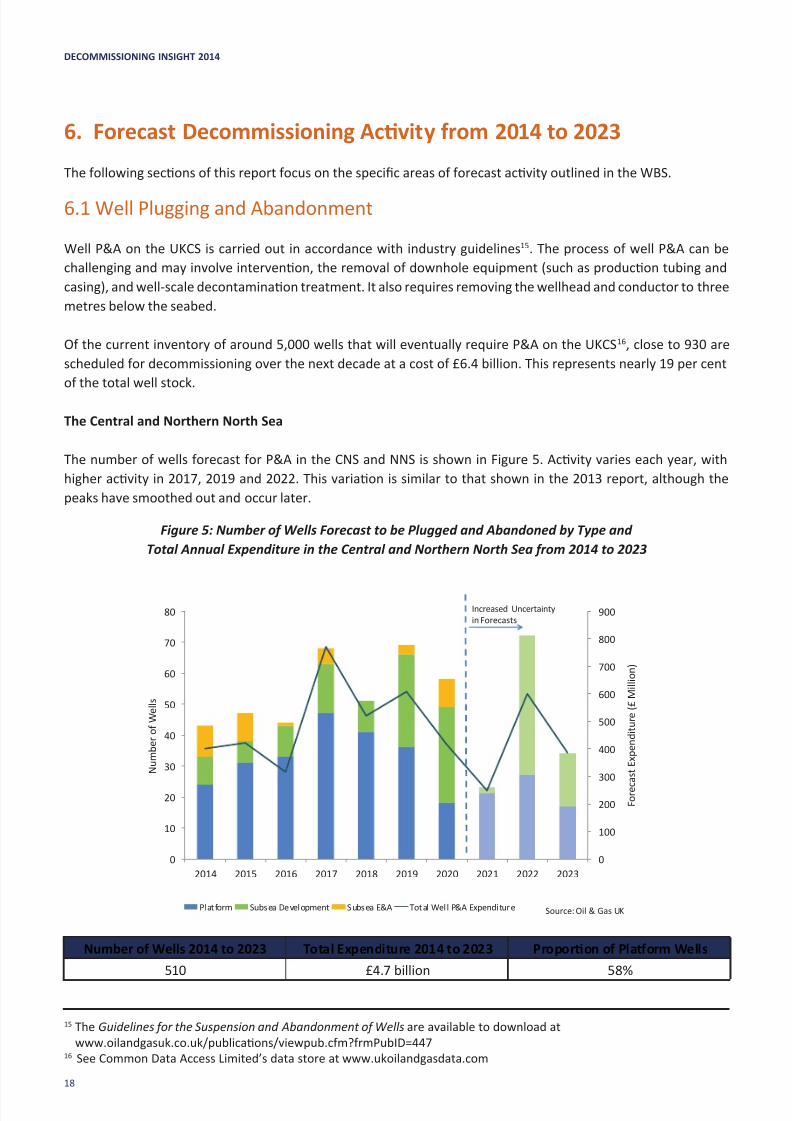
The number of wells forecast for P&A in the CNS and NNS is shown in Figure 5. Acvity varies each year, with
higher acvity in 2017, 2019 and 2022. This variaon is similar to that shown in the 2013 report, although the
peaks have smoothed out and occur later.
Figure 5: Number of Wells Forecast to be Plugged and Abandoned by Type and
Total Annual Expenditure in the Central and Northern North Sea from 2014 to 2023
0
100
200
300
400
500
600
700
800
900
0
10
20
30
40
50
60
70
80
2014 2015 2016 2017 2018 2019 2020 2021 2022 2023
F o r e c
a s t E x p e n d i t u r e ( £ M i l l i o n )
N u m b e r o f W e l l s
Platform Subsea Development Subsea E&A Total Well P&A Expenditure
Increased Uncertainty
in Forecasts
Source: Oil & Gas UK
Number of Wells 2014 to 2023 Total Expenditure 2014 to 2023 Proporon of Plaorm Wells
510 £4.7 billion 58%
15 The Guidelines for the Suspension and Abandonment of Wells are available to download at
www.oilandgasuk.co.uk/publicaons/viewpub.cfm?frmPubID=447 16 See Common Data Access Limited’s data store at www.ukoilandgasdata.com

8/10/2019 Decom Insight 2014 7 Oct 2014 v6 FINAL
http://slidepdf.com/reader/full/decom-insight-2014-7-oct-2014-v6-final 19/44 19
The years of high acvity are due to a number of projects forecasng to carry out well P&A in the same year.
In 2017, 2019, and 2022, well P&As are scheduled on ten, thirteen, and seven elds, respecvely. Oil & Gas UK
expects that as forecasts are revisited, acvity will smooth out in line with the near-term forecasts of 2014 and
2015, which show a much smaller variaon.
A number of operators plan to carry out well P&A in several phases, with each phase acng as a separate campaign.
Phase one typically uses a lower cost method such as wireline, coil tubing and a hydraulic workover unit or light
well intervenon (LWI) vessel, while phases two and three use a rig. Where this is the case, Oil & Gas UK has
counted wells at the start of the campaign to avoid duplicaon.
The total expenditure on well P&A in the CNS and NNS has increased by 52 per cent (£4.7 billion) compared to last
year’s forecast (£3.1 billion), while the total number of wells has only increased by six per cent (30 wells).
Historical variaon in Well Plugging and Abandonment Cost Forecasts in the Central and Northern North Sea
The large range in forecasts for subsea wells, as shown in Figure 6 overleaf, reects the wide variaon in the
type of well to be plugged and abandoned. Simple rig-less P&As using wireline, pumping or crane jacks account
for the low end of the cost range, while wells at the top-of-the-range are typically complex, rig-based P&As with
challenging access and cemenng. They also require retrieval of tubing and casing, milling, and cement repairs.
Older wells have the addional challenge of limited documentaon of well design and material construcon,
parcularly where well ownership has changed.
While the range in forecasts for subsea development wells has been consistently large, forecasts for subsea
E&A wells have increased signicantly since 2012. Several operators have reported that benchmarking exerciseshave inuenced their cost esmates and that forecasts for complex wells have been revised up as they gain
more experience.
Plaorm wells show the smallest variaon in cost forecasts, as they typically have all of the necessary tools and
materials to-hand and are not subject to the same weather constraints or rig requirements. These wells are also
typically carried out in batches or campaigns, enabling mobilisaon costs to be more easily shared across a number
of wells.
1
2
3
4
5
6
7

8/10/2019 Decom Insight 2014 7 Oct 2014 v6 FINAL
http://slidepdf.com/reader/full/decom-insight-2014-7-oct-2014-v6-final 20/44
DECOMMISSIONING INSIGHT 2014
20
Figure 6: Historical Variaon in Well Plugging and Abandonment Cost Forecasts
in the Central and Northern North Sea (2011 to 2014 Surveys)
0
5
10
15
20
25
30
35
40
2011 2012 2013 2014 2011 2012 2013 2014 2011 2012 2013 2014
Platform E&A Subsea Development
E s t i m a t e d C o s t ( £ M i l l i o n )
Average Forecast Cost Platform Well Average Forecast Cost Suspended E&A Well
Average Forecast Cost Subsea Development WellRange in Cost Forecasts
Source: Oil & Gas UK
Well P&A 2013 Average 2014 Average
Plaorm wells £4.8 million £4.8 million
Subsea E&A wells £8 million £17.4 million
Subsea development wells £10.1 million £11.6 million

8/10/2019 Decom Insight 2014 7 Oct 2014 v6 FINAL
http://slidepdf.com/reader/full/decom-insight-2014-7-oct-2014-v6-final 21/44 21
The Southern North Sea and Irish Sea
The number of wells scheduled for P&A in the SNS and IS areas has increased by almost 90 compared to the 2013
report. This increase is spread across the decade, although 60 more wells are forecast between 2015 and 2019.
The rise is due to the inclusion of addional oil and gas projects and higher forecasts from exisng projects.
The large number of wells forecast to undergo P&A in 2020 and 2021 is due to eight projects scheduling P&A at
the same me, and it is expected that this acvity will smooth out when forecasts are revisited. Acvity in 2014 is
lower than the forecast made for the year in the 2013 report as a number of projects have spread out their acvity.
Well P&A expenditure increases in line with acvity in the near term, tailing o towards the end of the decade. The
higher expenditure between 2015 and 2018 is due to the greater number of subsea wells. The peak in wells seen
in 2020 and 2021 is due to an increase in plaorm wells, which are less expensive.
Figure 7: Number of Wells Forecast to be Plugged and Abandoned by Type
and Total Annual Expenditure in the Southern North Sea and Irish Sea from 2014 to 2023
0
100
200
300
400
500
600
700
800
0
10
20
30
40
50
60
70
80
90
2014 2015 2016 2017 2018 2019 2020 2021 2022 2023
F o r e c a s t E x p e n d i t u r e ( £ M
i l l i o n )
N u m b e r o f W e l l s
Platform Subsea Development Subsea E&A Total Well P&A Expenditure
Increased Uncertainty in
Forecasts
Source: Oil & Gas UK
Number of Wells 2014 to 2023 Total Expenditure 2014 to 2023 Proporon of Plaorm Wells
417 £1.7 billion 80%
1
2
3
4
5
6
7
8/10/2019 Decom Insight 2014 7 Oct 2014 v6 FINAL
http://slidepdf.com/reader/full/decom-insight-2014-7-oct-2014-v6-final 22/44
DECOMMISSIONING INSIGHT 2014
22
Historical Variaon in Well Plugging and Abandonment Cost Forecasts in the Southern North Sea and Irish Sea
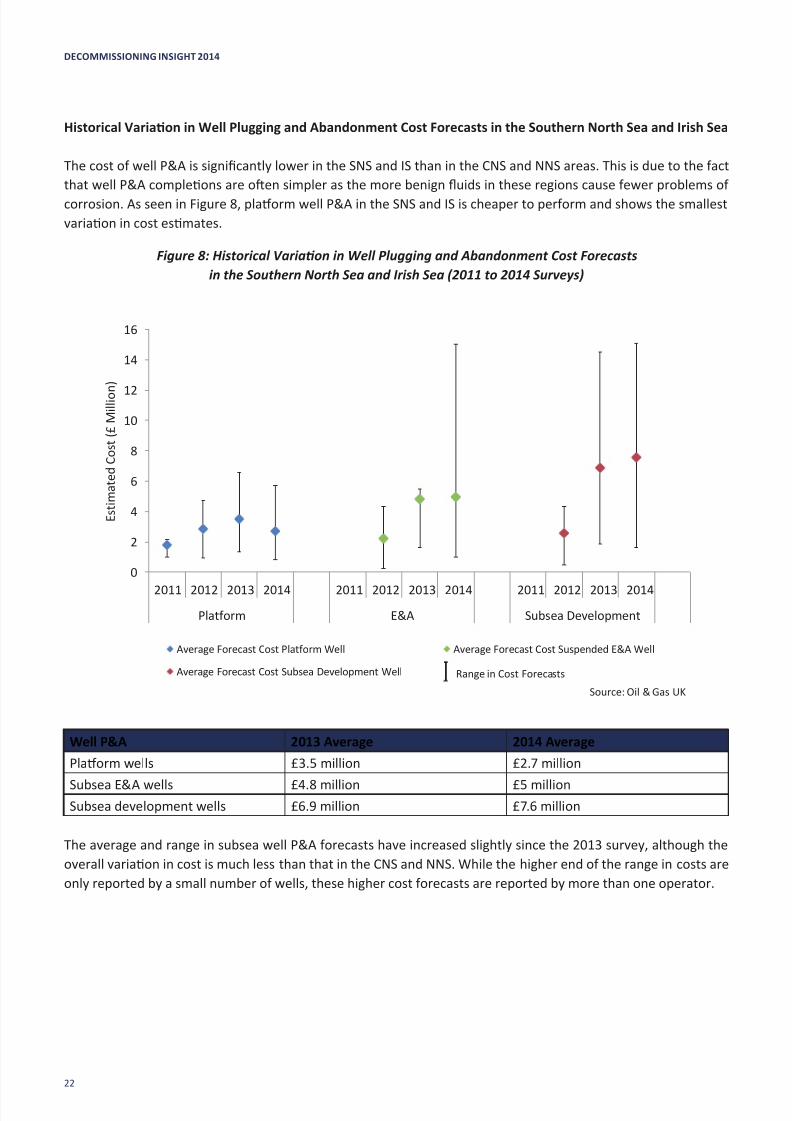
The cost of well P&A is signicantly lower in the SNS and IS than in the CNS and NNS areas. This is due to the fact
that well P&A compleons are oen simpler as the more benign uids in these regions cause fewer problems of
corrosion. As seen in Figure 8, plaorm well P&A in the SNS and IS is cheaper to perform and shows the smallest
variaon in cost esmates.
Figure 8: Historical Variaon in Well Plugging and Abandonment Cost Forecasts
in the Southern North Sea and Irish Sea (2011 to 2014 Surveys)
0
2
4
6
8
10
12
14
16
2011 2012 2013 2014 2011 2012 2013 2014 2011 2012 2013 2014
Platform E&A Subsea Development
E s t i m a t e d C o s t ( £ M i l l i o n )
Average Forecast Cost Platform Well Average Forecast Cost Suspended E&A Well
Average Forecast Cost Subsea Development Well Range in Cost Forecasts
Source: Oil & Gas UK
Well P&A 2013 Average 2014 Average
Plaorm wells £3.5 million £2.7 million
Subsea E&A wells £4.8 million £5 millionSubsea development wells £6.9 million £7.6 million
The average and range in subsea well P&A forecasts have increased slightly since the 2013 survey, although the
overall variaon in cost is much less than that in the CNS and NNS. While the higher end of the range in costs are
only reported by a small number of wells, these higher cost forecasts are reported by more than one operator.

8/10/2019 Decom Insight 2014 7 Oct 2014 v6 FINAL
http://slidepdf.com/reader/full/decom-insight-2014-7-oct-2014-v6-final 23/44 23
: l
Rig Type for Well Plugging and Abandonment
There are a number of methods that can be used for plaorm well P&A (see Figure 9). In the CNS and NNS areas, close
to 15 per cent of wells will be plugged and abandoned in phases. The rst phase is typically rig-less and uses lower cost
methods such as wireline, coil tubing, and a hydraulic workover unit or LWI vessel, while the second and third phases
will normally use a rig. The type of vessel will depend on whether the original derrick is sll in place and the water depth
where the plaorm is located. The remaining 85 per cent of wells in the CNS and NNS will be plugged and abandoned in
a single phase.
Due to shallower waters in the SNS and IS, all subsea wells in these areas plan to use a jack-up rig for P&A. This has
implicaons on cost as the semi-submersible rigs required in the CNS and NNS are more expensive.
Figure 9: Forecast Rig Type for Plaorm Well Plugging and Abandonment
on the UK Connental Shelf from 2014 to 2023
Central and Northern North Sea Southern North Seaand Irish Sea
Plaorm well P&A
Integral rig 54% 1%
Modular rig 9% -
Jack-up rig 9% 57%
Rig-less intervenon 16% 26%
Not yet known 12% 16%
Subsea well P&A
Jack-up rig 25% 100%
Semi-submersible rig 75% -
6.2 Facilies Making Safe and Topside Preparaon
Prior to removal, facilies must rst be made safe and prepared for removal in line with environmental and safety
consideraons. The ‘making safe’ of facilies includes cleaning, freeing equipment of hydrocarbons, disconnecon
and physical isolaon, and waste management.
Following this, the topsides and process and ulies modules are separated and appropriate engineering, such as
the installaon of li points, can take place to enable removal. The topside preparaon required will depend on
the removal method used.
1
2
3
4
5
6
7
Stand-alone
Jack-up
Integral Rig
Modular Rig
Other rigless
Rig Type not
yet known
CNS and NNS SNS and IS
Source: Oil & Gas UK
8/10/2019 Decom Insight 2014 7 Oct 2014 v6 FINAL
http://slidepdf.com/reader/full/decom-insight-2014-7-oct-2014-v6-final 24/44
DECOMMISSIONING INSIGHT 2014
24
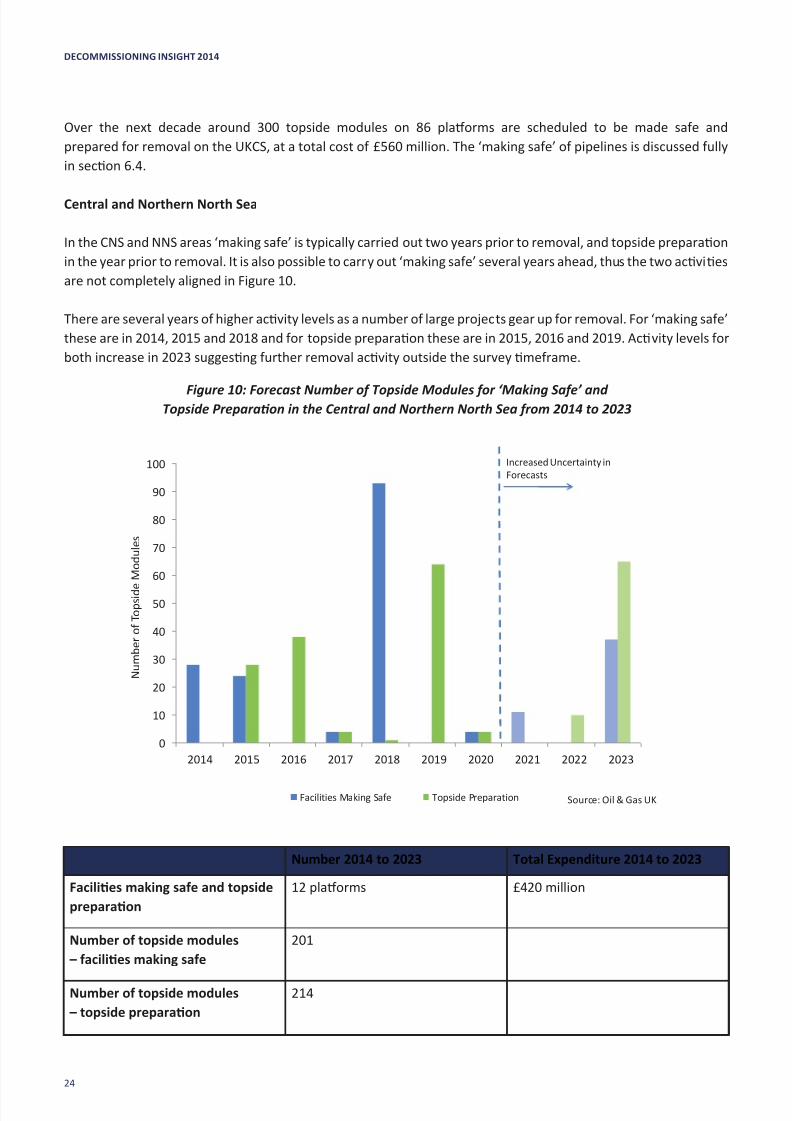
Over the next decade around 300 topside modules on 86 plaorms are scheduled to be made safe and
prepared for removal on the UKCS, at a total cost of £560 million. The ‘making safe’ of pipelines is discussed fully
in secon 6.4.
Central and Northern North Sea
In the CNS and NNS areas ‘making safe’ is typically carried out two years prior to removal, and topside preparaon
in the year prior to removal. It is also possible to carry out ‘making safe’ several years ahead, thus the two acvies
are not completely aligned in Figure 10.
There are several years of higher acvity levels as a number of large projects gear up for removal. For ‘making safe’
these are in 2014, 2015 and 2018 and for topside preparaon these are in 2015, 2016 and 2019. Acvity levels for
both increase in 2023 suggesng further removal acvity outside the survey meframe.
Figure 10: Forecast Number of Topside Modules for ‘Making Safe’ andTopside Preparaon in the Central and Northern North Sea from 2014 to 2023
0
10
20
30
40
50
60
70
80
90
100
2014 2015 2016 2017 2018 2019 2020 2021 2022 2023
N u m b e r o f T o p s i d e M o d u l e s
Facilities Making Safe Topside Preparation Source: Oil & Gas UK
Increased Uncertainty in
Forecasts
Number 2014 to 2023 Total Expenditure 2014 to 2023
Facilies making safe and topside
preparaon
12 plaorms £420 million
Number of topside modules
– facilies making safe
201
Number of topside modules
– topside preparaon
214
8/10/2019 Decom Insight 2014 7 Oct 2014 v6 FINAL
http://slidepdf.com/reader/full/decom-insight-2014-7-oct-2014-v6-final 25/44 25
Southern North Sea and Irish Sea
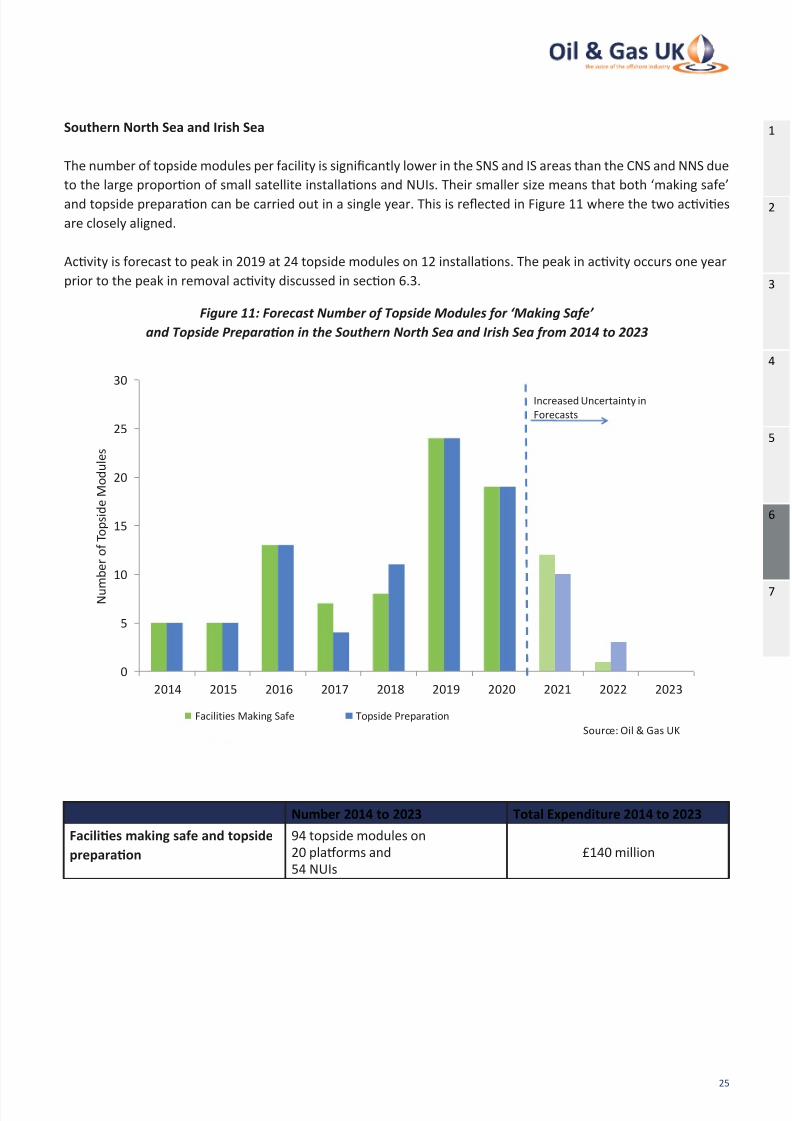
The number of topside modules per facility is signicantly lower in the SNS and IS areas than the CNS and NNS due
to the large proporon of small satellite installaons and NUIs. Their smaller size means that both ‘making safe’
and topside preparaon can be carried out in a single year. This is reected in Figure 11 where the two acvies
are closely aligned.
Acvity is forecast to peak in 2019 at 24 topside modules on 12 installaons. The peak in acvity occurs one year
prior to the peak in removal acvity discussed in secon 6.3.
Figure 11: Forecast Number of Topside Modules for ‘Making Safe’
and Topside Preparaon in the Southern North Sea and Irish Sea from 2014 to 2023
0
5
10
15
20
25
30
2014 2015 2016 2017 2018 2019 2020 2021 2022 2023
N u m b e r o f T o p s i d e M o d u l e s
Facilities Making Safe Topside Preparation
Increased Uncertainty in
Forecasts
Source: Oil & Gas UK
Number 2014 to 2023 Total Expenditure 2014 to 2023
Facilies making safe and topside
preparaon
94 topside modules on
20 plaorms and
54 NUIs
£140 million
1
2
3
4
5
6
7

8/10/2019 Decom Insight 2014 7 Oct 2014 v6 FINAL
http://slidepdf.com/reader/full/decom-insight-2014-7-oct-2014-v6-final 26/44
DECOMMISSIONING INSIGHT 2014
26
6.3 Removal
The removal of substructures, topsides and subsea infrastructure accounts for 19 per cent (£2.8 billion) of the total
decommissioning expenditure on the UKCS from 2014 to 2023. Pipeline decommissioning has been addressedseparately in secon 6.4.
Topside removal is most commonly achieved using piece-small, reverse-installaon or single-li methods which
can involve re-engineering and cung topside modules. Larger structures seen in the CNS and NNS areas oen
require seconing into manageable pieces and involve mulple removal lis. Conversely, smaller substructures,
such as those common in the SNS can be removed in a single li and transported onshore via barge or li vessel.
To date, the largest single li achieved on the UKCS using a heavy li vessel during decommissioning was in 2009
for the removal of the Frigg TCP2 module support frame at 8,500 tonnes. However, construcon of the Pieter
Schelte heavy li vessel will allow single li removal of the heavier Brent Alpha, Bravo and Delta topsides and
the Brent Alpha substructure. The topsides weigh between 18,900 and 29,600 tonnes17 each. The Brent Alpha
substructure, weighing 14,200 tonnes, will be the rst self-oater substructure removed from the UKCS18.
Topside Removal in the Central and Northern North Sea
The picture for removals has changed signicantly in recent years as a number of projects have been deferred
to extend eld life. Decommissioning of Ninian North, for example, has been postponed following receipt of the
Brown Field Allowance19, whilst Goldeneye’s decommissioning programme has been put on hold following the
decision to use the facility for a carbon capture and storage project20.
In the next decade, 80 per cent (116 modules) of topside module removal acvity in these areas is concentrated inthe NNS. Almost all topside removal is forecast between 2016 and 2020, although it is likely that acvity will level
due to the exibility in removal melines. A small number of topside modules are forecast to be removed between
2021 and 2023, coinciding with the spike in topside ‘making safe’ and preparaon acvity discussed in secon 6.2.
This reects the start of removal acvity for projects largely outside the survey meframe.
17 See Brent E-News at hp://s04.stac-shell.com/content/dam/shell-new/local/country/gbr/downloads/pdf/upstream/
brent-enews-november-2013.pdf18 Oil & Gas UK’s publicaon on The Decommissioning of Steel Piled Jackets in the North Sea Region (October 2012)
is available to download at www.oilandgasuk.co.uk/cmsles/modules/publicaons/pdfs/OP074.pdf 19 See www.cnri-northsea-decom.com/News¤t-Status.htm20 See hp://s06.stac-shell.com/content/dam/shell-new/local/country/gbr/downloads/pdf/peterhead-ccs-brochure.pdf

8/10/2019 Decom Insight 2014 7 Oct 2014 v6 FINAL
http://slidepdf.com/reader/full/decom-insight-2014-7-oct-2014-v6-final 27/44 27
Figure 12: Forecast Number of Topside Modules to be Removed
in the Central and Northern North Sea from 2014 to 2023
0
10
20
30
40
50
60
70
80
2014 2015 2016 2017 2018 2019 2020 2021 2022 2023
N u m b e
r o f T o p s i d e M o d u l e s
Increased Uncertainty inForecasts
Source: Oil & Gas UK
Weight (tonnes)
2014 to 2023
Number
2014 to 2023
Total Expenditure
2014 to 2023
Topside removal 159,600 146 modules on
13 plaorms
£1 billion
Plaorm types
Integrated plaorms 130,000
Plaorms 27,000
NUIs 2,600
1
2
3
4
5
6
7
8/10/2019 Decom Insight 2014 7 Oct 2014 v6 FINAL
http://slidepdf.com/reader/full/decom-insight-2014-7-oct-2014-v6-final 28/44
DECOMMISSIONING INSIGHT 2014
28
Topside Removal in the Southern North Sea and Irish Sea
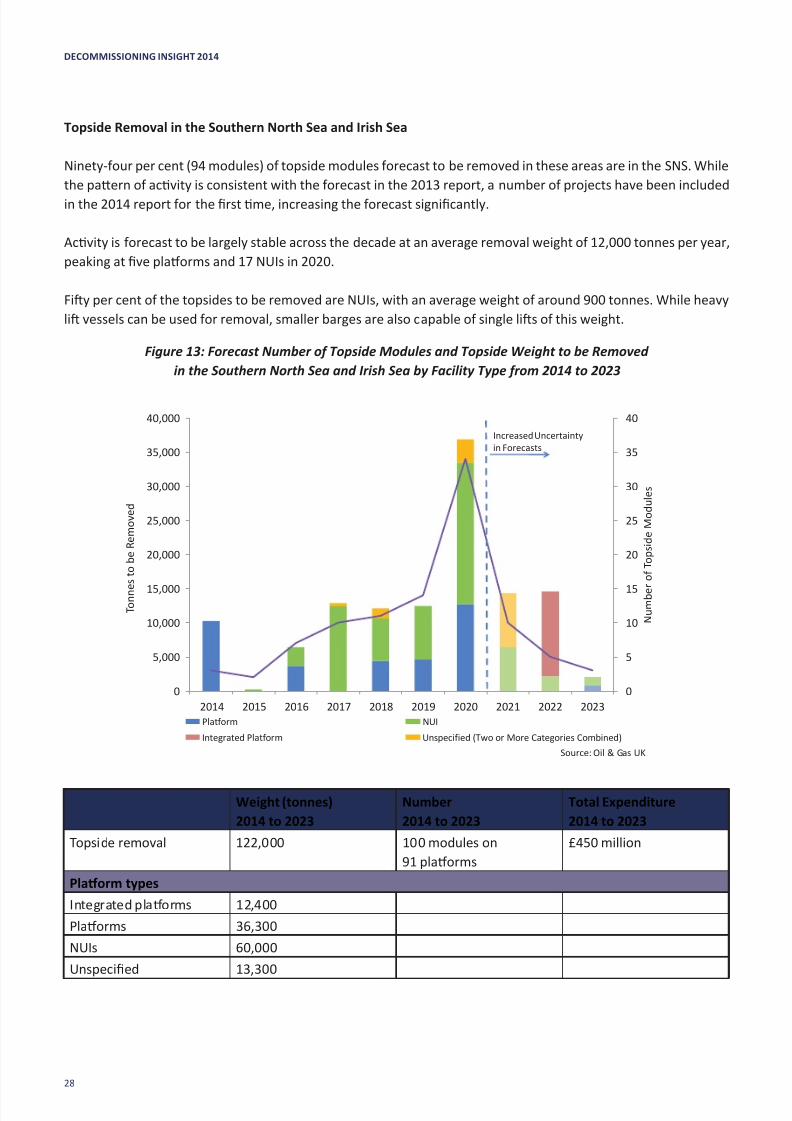
Ninety-four per cent (94 modules) of topside modules forecast to be removed in these areas are in the SNS. While
the paern of acvity is consistent with the forecast in the 2013 report, a number of projects have been included
in the 2014 report for the rst me, increasing the forecast signicantly.
Acvity is forecast to be largely stable across the decade at an average removal weight of 12,000 tonnes per year,
peaking at ve plaorms and 17 NUIs in 2020.
Fiy per cent of the topsides to be removed are NUIs, with an average weight of around 900 tonnes. While heavy
li vessels can be used for removal, smaller barges are also capable of single lis of this weight.
Figure 13: Forecast Number of Topside Modules and Topside Weight to be Removed
in the Southern North Sea and Irish Sea by Facility Type from 2014 to 2023
0
5
10
15
20
25
30
35
40
0
5,000
10,000
15,000
20,000
25,000
30,000
35,000
40,000
2014 2015 2016 2017 2018 2019 2020 2021 2022 2023
N u m b e r o f T o p s i d e M o d u l e s
T o n n e
s t o b e R e m o v e d
Platform NUI
Integrated Platform Unspecified (Two or More Categories Combined)
Increased Uncertainty
in Forecasts
Source: Oil & Gas UK
Weight (tonnes)
2014 to 2023
Number
2014 to 2023
Total Expenditure
2014 to 2023
Topside removal 122,000 100 modules on
91 plaorms
£450 million
Plaorm types
Integrated plaorms 12,400
Plaorms 36,300
NUIs 60,000
Unspecied 13,300
8/10/2019 Decom Insight 2014 7 Oct 2014 v6 FINAL
http://slidepdf.com/reader/full/decom-insight-2014-7-oct-2014-v6-final 29/44 29
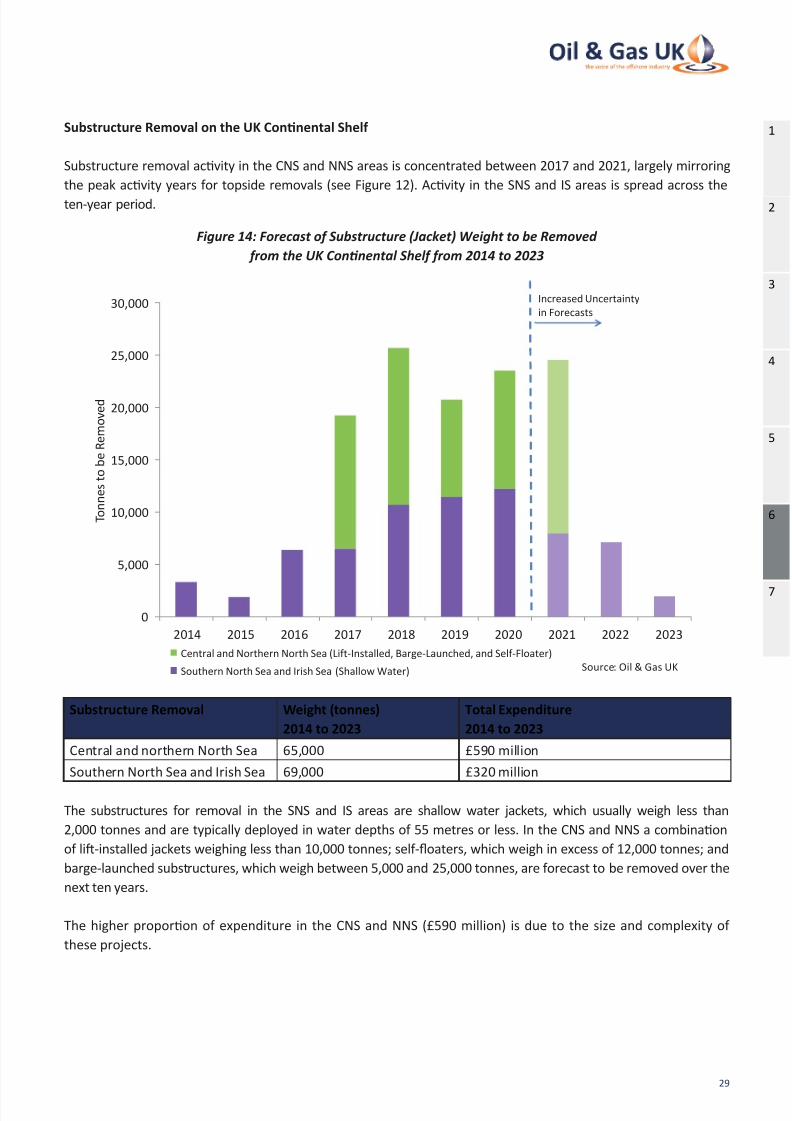
Substructure Removal on the UK Connental Shelf
Substructure removal acvity in the CNS and NNS areas is concentrated between 2017 and 2021, largely mirroring
the peak acvity years for topside removals (see Figure 12). Acvity in the SNS and IS areas is spread across the
ten-year period.
Figure 14: Forecast of Substructure (Jacket) Weight to be Removed
from the UK Connental Shelf from 2014 to 2023
0
5,000
10,000
15,000
20,000
25,000
30,000
2014 2015 2016 2017 2018 2019 2020 2021 2022 2023
T o n n e s t o b e R e m o v e d
Central and Northern North Sea (Lift-Installed, Barge-Launched, and Self-Floater)
Southern North Sea and Irish Sea (Shallow Water)
Increased Uncertainty
in Forecasts
Source: Oil & Gas UK
Substructure Removal Weight (tonnes)
2014 to 2023
Total Expenditure
2014 to 2023
Central and northern North Sea 65,000 £590 million
Southern North Sea and Irish Sea 69,000 £320 million
The substructures for removal in the SNS and IS areas are shallow water jackets, which usually weigh less than
2,000 tonnes and are typically deployed in water depths of 55 metres or less. In the CNS and NNS a combinaon
of li-installed jackets weighing less than 10,000 tonnes; self-oaters, which weigh in excess of 12,000 tonnes; and
barge-launched substructures, which weigh between 5,000 and 25,000 tonnes, are forecast to be removed over the
next ten years.
The higher proporon of expenditure in the CNS and NNS (£590 million) is due to the size and complexity of
these projects.
1
2
3
4
5
6
7
8/10/2019 Decom Insight 2014 7 Oct 2014 v6 FINAL
http://slidepdf.com/reader/full/decom-insight-2014-7-oct-2014-v6-final 30/44
DECOMMISSIONING INSIGHT 2014
30
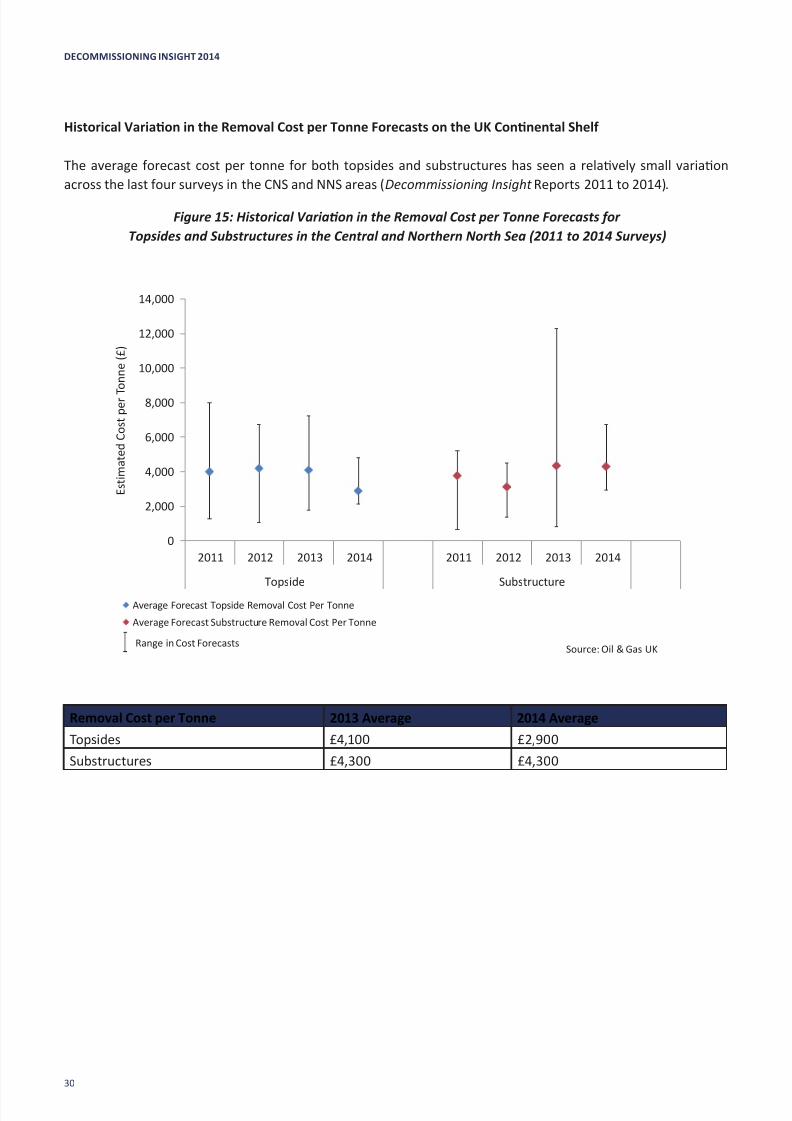
Historical Variaon in the Removal Cost per Tonne Forecasts on the UK Connental Shelf
The average forecast cost per tonne for both topsides and substructures has seen a relavely small variaon
across the last four surveys in the CNS and NNS areas (Decommissioning Insight Reports 2011 to 2014).
Figure 15: Historical Variaon in the Removal Cost per Tonne Forecasts for
Topsides and Substructures in the Central and Northern North Sea (2011 to 2014 Surveys)
0
2,000
4,000
6,000
8,000
10,000
12,000
14,000
2011 2012 2013 2014 2011 2012 2013 2014
Topside Substructure
E s t i m a t e d C o s t p e r T
o n n e ( £ )
Average Forecast Topside Removal Cost Per Tonne
Average Forecast Substructure Removal Cost Per Tonne
Range in Cost ForecastsSource: Oil & Gas UK
Removal Cost per Tonne 2013 Average 2014 Average
Topsides £4,100 £2,900
Substructures £4,300 £4,300
8/10/2019 Decom Insight 2014 7 Oct 2014 v6 FINAL
http://slidepdf.com/reader/full/decom-insight-2014-7-oct-2014-v6-final 31/44 31
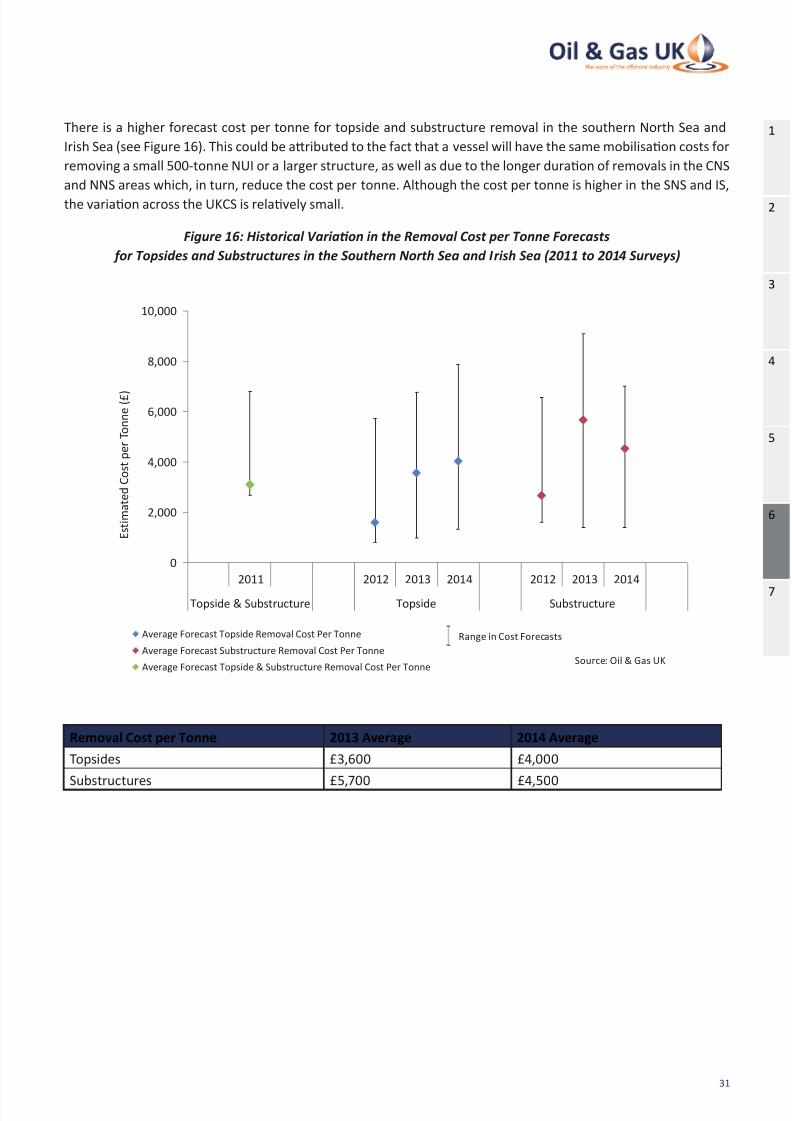
There is a higher forecast cost per tonne for topside and substructure removal in the southern North Sea and
Irish Sea (see Figure 16). This could be aributed to the fact that a vessel will have the same mobilisaon costs for
removing a small 500-tonne NUI or a larger structure, as well as due to the longer duraon of removals in the CNS
and NNS areas which, in turn, reduce the cost per tonne. Although the cost per tonne is higher in the SNS and IS,
the variaon across the UKCS is relavely small.
Figure 16: Historical Variaon in the Removal Cost per Tonne Forecasts
for Topsides and Substructures in the Southern North Sea and Irish Sea (2011 to 2014 Surveys)
0
2,000
4,000
6,000
8,000
10,000
2011 2012 2013 2014 2012 2013 2014
Topside & Substructure Topside Substructure
E s t i m a t e d C o s t p e r T o n n e ( £ )
Average Forecast Topside Removal Cost Per Tonne
Average Forecast Substructure Removal Cost Per Tonne
Average Forecast Topside & Substructure Removal Cost Per Tonne
Range in Cost Forecasts
Source: Oil & Gas UK
Removal Cost per Tonne 2013 Average 2014 Average
Topsides £3,600 £4,000
Substructures £5,700 £4,500
1
2
3
4
5
6
7

8/10/2019 Decom Insight 2014 7 Oct 2014 v6 FINAL
http://slidepdf.com/reader/full/decom-insight-2014-7-oct-2014-v6-final 32/44
DECOMMISSIONING INSIGHT 2014
32
Subsea Infrastructure Decommissioning on the UK Connental Shelf
The years of high subsea infrastructure decommissioning acvity in the CNS and NNS areas are from 2019 to 2022,
while in the SNS and IS they are from 2016 to 2020. The decommissioning of maresses and removal of other
subsea infrastructure typically occur in the same year (see gure 17 and 18). Maresses are usually removed from
the seabed at decommissioning although they can be decommissioned in situ if badly degraded and approval has
been obtained from the Department of Energy & Climate Change (DECC). Other subsea infrastructure includes
manifolds, christmas trees, risers, spools, jumpers, anchors and subsea isolaon valves (SSIVs). Pipelines are
discussed in secon 6.4.
Due to the inclusion of addional subsea projects in the CNS and NNS areas in the 2014 survey, the number of
maresses and weight of subsea infrastructure have more than trebled the forecast in the 2013 report.
Figure 17: Forecast of Maress and other Subsea Infrastructure Decommissioning
in the Central and Northern North Sea from 2014 to 2023
0
200
400
600
800
1,000
1,200
2014 2015 2016 2017 2018 2019 2020 2021 2022 2023
N u m b e r
o f M a t t r e s s e s
Increased Uncertainty in
Forecasts
Number/Weight 2014 to 2023 Total Expenditure 2014 to 2023Maresses and subsea
infrastructure
- £330 million
Maresses 2,800 -
Subsea infrastructure 54,100 tonnes -
0
5,000
10,000
15,000
20,000
25,000
30,000
2014 2015 2016 2017 2018 2019 2020 2021 2022 2023
T o n n a g e o f S u b s
e a I n f r a s t r u c t u r e t o b e
R
e m o v e d
Increased Uncertainty
in Forecasts
Source: Oil & Gas UK

8/10/2019 Decom Insight 2014 7 Oct 2014 v6 FINAL
http://slidepdf.com/reader/full/decom-insight-2014-7-oct-2014-v6-final 33/44 33
Figure 18: Forecast of Maress and other Subsea Infrastructure Decommissioning
in the Southern North Sea and Irish Sea from 2014 to 2023
0
100
200
300
400
500
600
2014 2015 2016 2017 2018 2019 2020 2021 2022 2023
N u m b e r o f M a t t r e s s e s
Increased Uncertainty inForecasts
Number/Weight 2014 to 2023 Total Expenditure 2014 to 2023
Maresses and subsea
infrastructure
- £165 million
Maresses 2,600 -
Subsea infrastructure 1,500 tonnes -
6.4 Pipeline Decommissioning
Pipelines are integral to eld life extension and future development opportunies and it is therefore of benet to the
UKCS that major pipelines are not decommissioned prematurely. The pipeline networks currently installed in the North
Sea collecvely provide the transportaon infrastructure for the region’s oil and gas producon to be delivered to host
plaorms and to shore. In many cases, the existence of nearby pipeline infrastructure has led directly to the economic
exploitaon of marginal elds, which would otherwise be considered uneconomic.
Due to the importance of certain pipelines, the deferral of pipeline decommissioning to the end of the eld life or for
possible reuse is somemes carried out under the Interim Pipeline Regime (IPR), where future reuse of the pipeline isconsidered viable. In these circumstances, DECC may request that the pipeline owner carry out pipeline ‘making safe’
acvies and maintain the condion of the pipeline for possible future reuse.
The ‘making safe’ of pipelines involves cleaning acvies such as ushing the pipelines of hydrocarbons, purging, and
removal and management of hazardous waste. The pipelines can then be decommissioned in accordance with DECC’s
Guidance Notes21 or maintained under the IPR.
The decommissioning of pipelines can involve either removal to shore, through reverse reeling or cut and li, or where
pipelines have obtained approval from DECC to be le in situ they can be trenched and buried. The Murchison export
line, for example, will be decommissioned and le in situ, with remedial rock placed over the exposed secons. The
main pipeline e-in spools at either end will be removed and returned to shore for recycling or disposal 22.
0
100
200
300
400
500
600
2014 2015 2016 2017 2018 2019 2020 2021 2022 2023
T o n n a g e o f S u b s e a I n f r a s t r u c t u r e t o b
e
R e m o v e d
Increased Uncertainty in
Forecasts
Source: Oil & Gas UK
1
2
3
4
5
6
7
21 DECC’s Guidance Notes on Decommissioning Programmes are available to download at
hp://www.og.decc.gov.uk/regulaon/guidance/decomm_guide_v6.pdf 22 See www.cnri-northsea-decom.com/Decommissioning-Programme.htm
8/10/2019 Decom Insight 2014 7 Oct 2014 v6 FINAL
http://slidepdf.com/reader/full/decom-insight-2014-7-oct-2014-v6-final 34/44
DECOMMISSIONING INSIGHT 2014
34
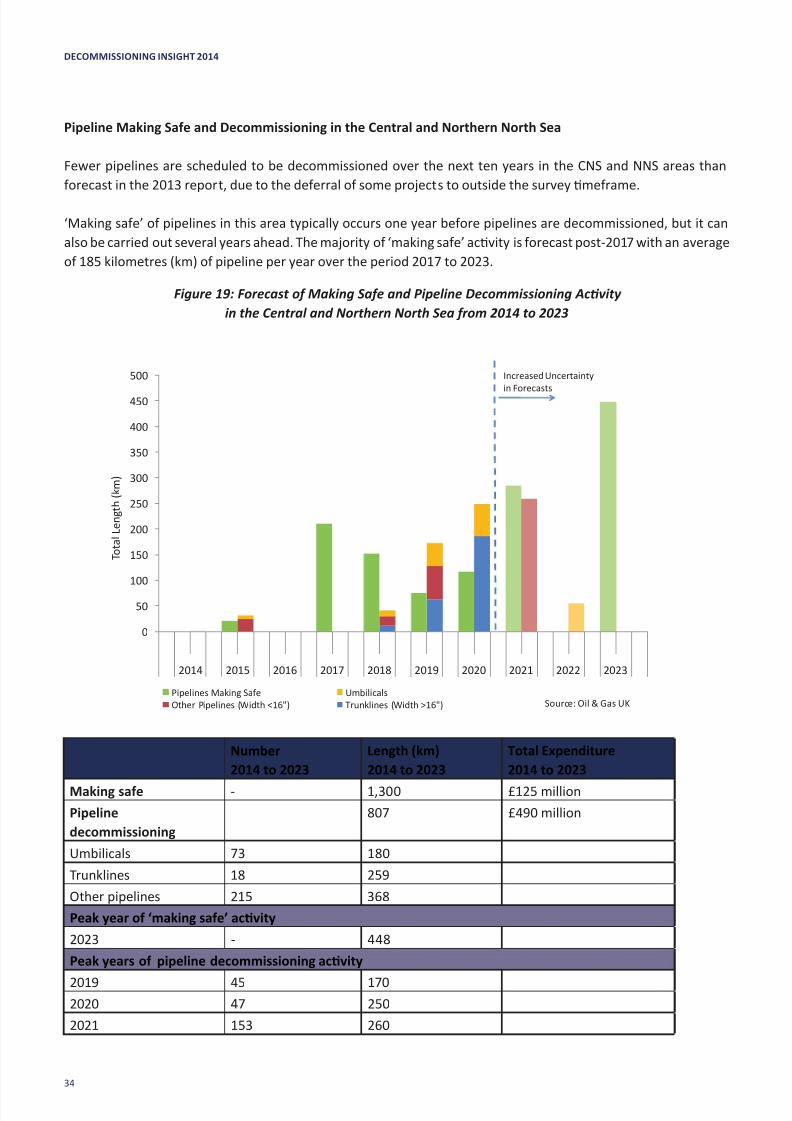
Pipeline Making Safe and Decommissioning in the Central and Northern North Sea
Fewer pipelines are scheduled to be decommissioned over the next ten years in the CNS and NNS areas than
forecast in the 2013 report, due to the deferral of some projects to outside the survey meframe.
‘Making safe’ of pipelines in this area typically occurs one year before pipelines are decommissioned, but it can
also be carried out several years ahead. The majority of ‘making safe’ acvity is forecast post-2017 with an average
of 185 kilometres (km) of pipeline per year over the period 2017 to 2023.
Figure 19: Forecast of Making Safe and Pipeline Decommissioning Acvity
in the Central and Northern North Sea from 2014 to 2023
0
50
100
150
200
250
300
350
400
450
500
2014 2015 2016 2017 2018 2019 2020 2021 2022 2023
T o t a l L e n g t h ( k m )
Pipelines Making Safe Umbilicals
Other Pipelines (Width <16") Trunklines (Width >16")
Increased Uncertainty
in Forecasts
Source: Oil & Gas UK
Number
2014 to 2023
Length (km)
2014 to 2023
Total Expenditure
2014 to 2023
Making safe - 1,300 £125 million
Pipeline
decommissioning
807 £490 million
Umbilicals 73 180
Trunklines 18 259
Other pipelines 215 368
Peak year of ‘making safe’ acvity
2023 - 448
Peak years of pipeline decommissioning acvity
2019 45 170
2020 47 250
2021 153 260

8/10/2019 Decom Insight 2014 7 Oct 2014 v6 FINAL
http://slidepdf.com/reader/full/decom-insight-2014-7-oct-2014-v6-final 35/44 35
Pipeline decommissioning acvity is higher between 2019 and 2021, correlang with the peak years of acvity in
pipeline ‘making safe’. The spike in ‘making safe’ in 2023 coincides with that of facilies ‘making safe’, suggesng
further removal acvity outside the survey meframe. However, acvity towards the end of the meframe can
be expected to level out when forecasts are revisited. All of the pipelines to be decommissioned are inter-eld
connectors, and none are considered to be crical for third party access.
Pipeline Making Safe and Decommissioning in the Southern North Sea and Irish Sea
The forecast for pipeline decommissioning in the SNS and IS areas has increased signicantly since the 2013 report. This
is due to increased acvity forecasts from exisng projects as well as the addion of new projects to the survey.
Figure 20: Forecast of Making Safe and Pipeline Decommissioning Acvity
in the Southern North Sea and Irish Sea from 2014 to 2023
0
100
200
300
400
500
600
700
2014 2015 2016 2017 2018 2019 2020 2021 2022 2023
T o
t a l L e n g t h ( k m )
Pipelines Making Safe Umbilicals Other Pipelines (Width <16'') Trunklines (Width >16'')
Source: Oil & Gas UK
Increased Uncertainty in
Forecasts
Number
2014 to 2023
Length (km)
2014 to 2023
Total Expenditure
2014 to 2023
Making safe - 2,200 £285 million
Pipeline decommissioning 2,470 £150 million
Umbilicals 32 220
Trunklines 37 1,350
Other pipelines 111 900
Peak year of ‘making safe’ acvity
2020 - 650
Peak years of pipeline decommissioning acvity
2016 37 640
2020 15 660
1
2
3
4
5
6
7

8/10/2019 Decom Insight 2014 7 Oct 2014 v6 FINAL
http://slidepdf.com/reader/full/decom-insight-2014-7-oct-2014-v6-final 36/44
DECOMMISSIONING INSIGHT 2014
36
In contrast to the CNS and NNS, several operators in the SNS and IS areas forecast to carry out pipeline ‘making
safe’ and decommissioning in the same year, although ‘making safe’ can also occur earlier.
The peaks in 2016 and 2020 reect operators’ current best esmates and not sanconed decommissioning
programmes, a complete list of which can be found on DECC’s Project Pathnder website23.
In order to meet government and industry objecves of maximising economic recovery from the UKCS, a Southern North
Sea PILOT Rejuvenaon Work Group has been established to carry out a joint industry project focused on understanding
the remaining reserves and resource base in this region and to idenfy the requirements to protect reserves and enable
maturaon into development opportunies. The work group aims to create a blueprint of what the area will look like in
ten years’ me and assess whether scal incenves are required to extend the region’s life.
6.5 Onshore Recycling and Disposal
Topside and substructure recycling includes acvity and expenditure related to onshore cleaning and handling of
hazardous waste, deconstrucon, reuse, recycle, disposal and waste management accounng.
The preferred opons to deal with disused oshore structures follow the waste hierarchy of reuse; recycling; and onshore
disposal. Once the structures are brought onshore, dismantling and processing is handled by specialist licensed sites.
Reuse is dened as any acvity that lengthens the life of an item while sll being used for its original purpose.
This can oen be confused with recycling, which is the reprocessing of an item into a new raw material. Although
more challenging, reuse oen proves to be parcularly cost ecient and can help to address the challenge of
waste disposal. The decision to reuse, recycle or dispose to landll can oen be driven by a number of commonfactors including the amount of maintenance required, or prevalence of obsolete technology and the amount of
hazardous material on an asset.
Topsides are made from a variety of materials and safe dismantling and waste management of these structures
can pose a greater challenge than the management of substructures which are predominantly made of steel and
can be processed and recycled. Recent decommissioning projects demonstrate high levels of reuse and recycling
at 95 per cent of all recovered material24. Examples of reuse and recycling of material from the UKCS include
Perenco’s reuse of topsides from their southern North Sea Welland plaorm for a new development in West Africa
and the use of North West Huon’s accommodaon module as an oce facility at a disposal yard.
Just over 481,000 tonnes are forecast to come onshore from 2014 to 2023, 60 per cent of which is concentrated
in the CNS and NNS. In addion to tonnage from topsides and substructures, this also includes tonnage from
subsea infrastructure.
The chosen oshore removal method has implicaons for onshore disposal as the size of vessel, as well as the
weight and dimensions of the material removed, will dictate where disposal can take place. The decommissioning
of the Brent A, B and D topsides and Brent A substructure will become the largest single-li to date on the UKCS,
and, as such, will require a large enough load-bearing quay to receive them. The structures will be taken to Able
Seaton Port which is currently undergoing construcon to expand the port’s capacity25.
23
See the Department of Energy & Climate Change Pathnder website at www.og.decc.gov.uk/pathnder/decommissioningindex.html
24 Oil & Gas UK’s publicaon on The Decommissioning of Steel Piled Jackets in the North Sea Region (October 2012) is
available to download at www.oilandgasuk.co.uk/cmsles/modules/publicaons/pdfs/OP074.pdf 25 See www.ableuk.com/able-lands-another-rig-recycling-contract
8/10/2019 Decom Insight 2014 7 Oct 2014 v6 FINAL
http://slidepdf.com/reader/full/decom-insight-2014-7-oct-2014-v6-final 37/44 37
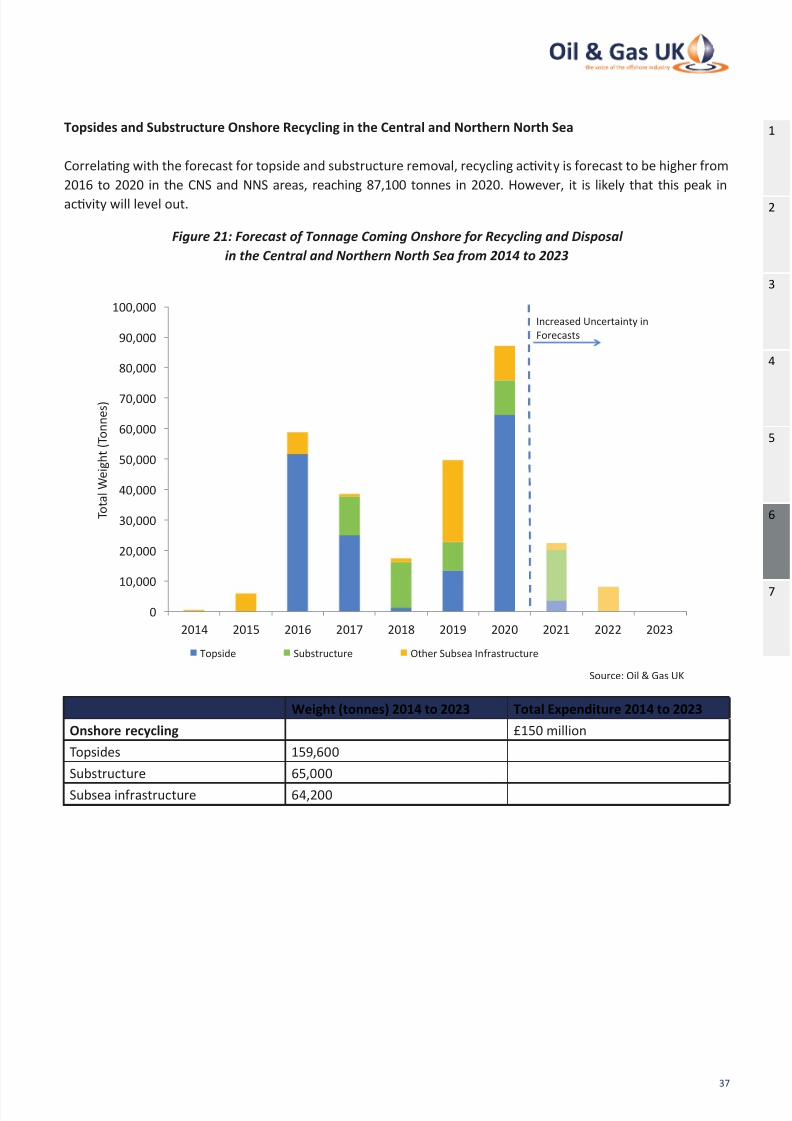
Topsides and Substructure Onshore Recycling in the Central and Northern North Sea
Correlang with the forecast for topside and substructure removal, recycling acvity is forecast to be higher from
2016 to 2020 in the CNS and NNS areas, reaching 87,100 tonnes in 2020. However, it is likely that this peak in
acvity will level out.
Figure 21: Forecast of Tonnage Coming Onshore for Recycling and Disposal
in the Central and Northern North Sea from 2014 to 2023
0
10,000
20,000
30,000
40,000
50,000
60,000
70,000
80,000
90,000
100,000
2014 2015 2016 2017 2018 2019 2020 2021 2022 2023
T o t a l W e i g h t ( T o n n e s )
Topside Substructure Other Subsea Infrastructure
Increased Uncertainty in
Forecasts
Source: Oil & Gas UK
Weight (tonnes) 2014 to 2023 Total Expenditure 2014 to 2023
Onshore recycling £150 million
Topsides 159,600
Substructure 65,000
Subsea infrastructure 64,200
1
2
3
4
5
6
7
8/10/2019 Decom Insight 2014 7 Oct 2014 v6 FINAL
http://slidepdf.com/reader/full/decom-insight-2014-7-oct-2014-v6-final 38/44
DECOMMISSIONING INSIGHT 2014
38
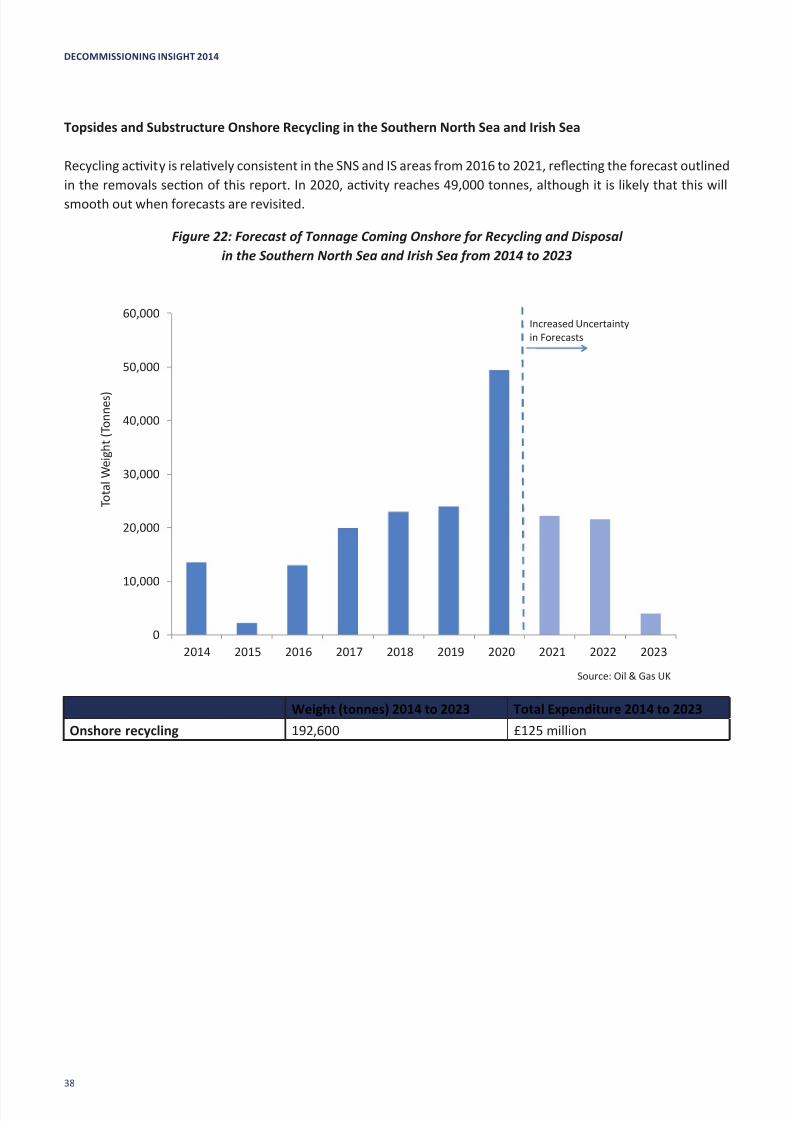
Topsides and Substructure Onshore Recycling in the Southern North Sea and Irish Sea
Recycling acvity is relavely consistent in the SNS and IS areas from 2016 to 2021, reecng the forecast outlined
in the removals secon of this report. In 2020, acvity reaches 49,000 tonnes, although it is likely that this will
smooth out when forecasts are revisited.
Figure 22: Forecast of Tonnage Coming Onshore for Recycling and Disposal
in the Southern North Sea and Irish Sea from 2014 to 2023
0
10,000
20,000
30,000
40,000
50,000
60,000
2014 2015 2016 2017 2018 2019 2020 2021 2022 2023
T o t a l W e i g h t ( T o n n e s )
Increased Uncertainty
in Forecasts
Source: Oil & Gas UK
Weight (tonnes) 2014 to 2023 Total Expenditure 2014 to 2023
Onshore recycling 192,600 £125 million
8/10/2019 Decom Insight 2014 7 Oct 2014 v6 FINAL
http://slidepdf.com/reader/full/decom-insight-2014-7-oct-2014-v6-final 39/44 39
6.6 Site Remediaon and Monitoring
Site remediaon acvies include pile management, clearing decommissioned oileld debris (with a 500-metre
zone and 200-metre pipeline corridor) and over-trawl surveys to demonstrate that the seabed is safe for shermen.
Expenditure for site remediaon is forecast at £270 million between 2014 and 2023. Almost 95 per cent of
this is forecast to be spent in the CNS and NNS areas and it is expected to peak in line with topside and
substructure removal.
Monitoring is the nal stage in the decommissioning process. Operators are required to carry out
post-decommissioning surveys and monitor the site beyond physical decommissioning. The specic details of the
programme are agreed with the regulator on a project-by-project basis.
Forecast expenditure on monitoring on the UKCS is £67 million across the ten-year period, over 80 per cent of
which is in the CNS and NNS. The expenditure forecast has more than doubled in the 2014 report compared to
2013, which reects the impact of the new projects included in the survey for the rst me, as well as increased
expenditure from exisng projects.
1
2
3
4
5
6
7
8/10/2019 Decom Insight 2014 7 Oct 2014 v6 FINAL
http://slidepdf.com/reader/full/decom-insight-2014-7-oct-2014-v6-final 40/44
DECOMMISSIONING INSIGHT 2014
40
7. Appendices
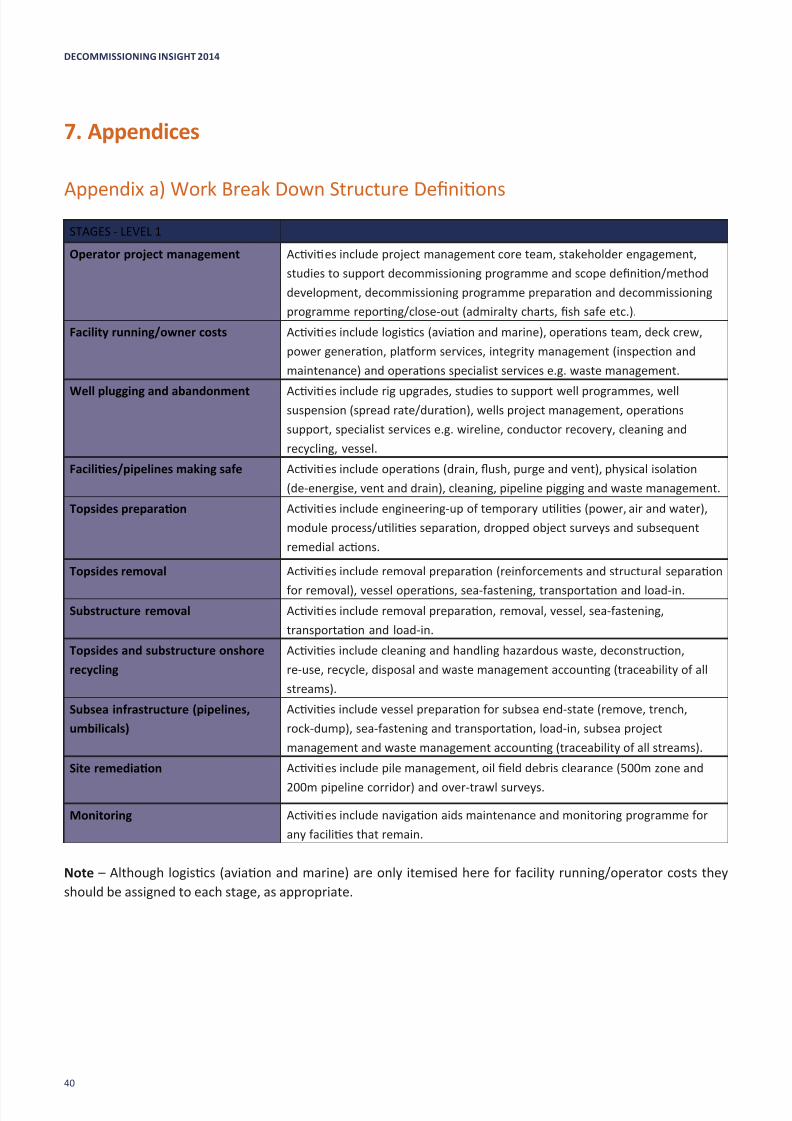
Appendix a) Work Break Down Structure Denions
STAGES - LEVEL 1
Operator project management Acvies include project management core team, stakeholder engagement,
studies to support decommissioning programme and scope denion/method
development, decommissioning programme preparaon and decommissioning
programme reporng/close-out (admiralty charts, sh safe etc.).
Facility running/owner costs Acvies include logiscs (aviaon and marine), operaons team, deck crew,
power generaon, plaorm services, integrity management (inspecon and
maintenance) and operaons specialist services e.g. waste management.
Well plugging and abandonment Acvies include rig upgrades, studies to support well programmes, wellsuspension (spread rate/duraon), wells project management, operaons
support, specialist services e.g. wireline, conductor recovery, cleaning and
recycling, vessel.
Facilies/pipelines making safe Acvies include operaons (drain, ush, purge and vent), physical isolaon
(de-energise, vent and drain), cleaning, pipeline pigging and waste management.
Topsides preparaon Acvies include engineering-up of temporary ulies (power, air and water),
module process/ulies separaon, dropped object surveys and subsequent
remedial acons.
Topsides removal Acvies include removal preparaon (reinforcements and structural separaon
for removal), vessel operaons, sea-fastening, transportaon and load-in.
Substructure removal Acvies include removal preparaon, removal, vessel, sea-fastening,
transportaon and load-in.
Topsides and substructure onshore
recycling
Acvies include cleaning and handling hazardous waste, deconstrucon,
re-use, recycle, disposal and waste management accounng (traceability of all
streams).
Subsea infrastructure (pipelines,
umbilicals)
Acvies include vessel preparaon for subsea end-state (remove, trench,
rock-dump), sea-fastening and transportaon, load-in, subsea project
management and waste management accounng (traceability of all streams).
Site remediaon Acvies include pile management, oil eld debris clearance (500m zone and
200m pipeline corridor) and over-trawl surveys.
Monitoring Acvies include navigaon aids maintenance and monitoring programme for
any facilies that remain.
Note – Although logiscs (aviaon and marine) are only itemised here for facility running/operator costs they
should be assigned to each stage, as appropriate.

8/10/2019 Decom Insight 2014 7 Oct 2014 v6 FINAL
http://slidepdf.com/reader/full/decom-insight-2014-7-oct-2014-v6-final 41/44 41
Appendix b) Associaon for the Advancement of Cost Engineering Classicaons
Primary
Characterisc
Secondary Characterisc
Esmate Class
Level of Project
Denion
(expressed as % of
complete denion)
End Usage
Typical Purpose of
Esmate
Methodology
Typical Esmang
Method
Expected Accuracy
Range Typical
Variaon in Low and
High Range
Class 5 0% to 2% Concept screening
Capacity factored,
parametric models,
judgement or
analogy
L: -20% to -50%
H: +30% to +100%
Class 4 1% to 15% Study or feasibility
Equipment factored
or parametricmodels
L: -15% to -30% H:
+20% to +50%
Class 3 10% to 40%
Budget
authorisaon or
control
Semi-detailed unit
costs with assembly
level line items
L: -10% to -20% H:
+10% to +30%
Class 2 30% to 70% Control or bid/
tender
Detailed unit costs
with forced detailed
take o
L: -5% to -15% H:
+5% to +20%
Class 1 50% to 100% Check esmate or
bid/tender
Detailed unit cost
with detailedtake o
L: -3% to -10% H:
+3% to +15%
1
2
3
4
5
6
7

8/10/2019 Decom Insight 2014 7 Oct 2014 v6 FINAL
http://slidepdf.com/reader/full/decom-insight-2014-7-oct-2014-v6-final 42/44
DECOMMISSIONING INSIGHT 2014
42
Notes

8/10/2019 Decom Insight 2014 7 Oct 2014 v6 FINAL
http://slidepdf.com/reader/full/decom-insight-2014-7-oct-2014-v6-final 43/44 43

8/10/2019 Decom Insight 2014 7 Oct 2014 v6 FINAL
http://slidepdf.com/reader/full/decom-insight-2014-7-oct-2014-v6-final 44/44
Oil & Gas UK (Aberdeen)
3rd Floor
The Exchange 2
62 Market Street
Aberdeen
AB11 5PJ
Tel: 01224 577 250
Oil & Gas UK (London)
6th Floor East
Portland House
Bressenden Place
London
SW1E 5BH
Tel: 020 7802 2400 [email protected]
www.oilandgasuk.co.uk
DE C O M M I S S
I O N I N G I N S I G H T 2 0 1 4
O I L &