Embed Size (px)
Citation preview

DDEEBBTT DDIISSCCLLOOSSUURREE OORRDDIINNAANNCCEE –– DDAATTAA PPRREESSEENNTTAATTIIOONN
CCOOOOKK CCOOUUNNTTYY TTRREEAASSUURREERR MMAARRIIAA PPAAPPPPAASS
MMAAYY 22,, 22001122

Index
i Forward Page 2
i Section 1 – Background Page 3
o Figure 1. Number of units of government in Illinois (6,994) Page 3
o Listing of Home Rule Governments in Cook County (84) Page 4
i Section 2 – Levy Process Page 5
o Figure 2. Rise in suburban property taxes/levy increases Page 8
o Palos Fire Protection District example (84.7% increase) Page 8
o County of Cook example (no increase) Page 8
i Section 3 – Property tax increases Page 9
o Figure 3. Average Property Tax Increases in Three Townships Page 9
y Townships: Riverside, Niles, Calumet
i Section 4 – Debt Disclosure Ordinance Page 10
o Figure 4. Per Household Summary (April 30, 2012) Page 12
y Chicago: $87,721
y Suburbs: $35,774
o Figure 5. DDO Comparison (figures in June 2011 and April 2012) Page 12
o Breakdown of compliant agencies by type (i.e. library, fire) Page 13
o Assumed Rate of Return on Investment section Page 14
o Figure 6. Rate of Return Page 15
y Most common rate is 7.5%, used by 279 agencies
o Rate of Salary Increases section Page 15
o Figure 7. Annual Rate of Salary Increases Page 16
y Most common rate is 4.0%, used by 249 agencies
o Figure 8. History of COLA’s in County since 1998 Page 18
o Figure 9. Compensation Increases in County since 1998 (Steps and COLAs) Page 19
i Section 5 – Online data on Cook County Property Tax Portal Page 20
o Figure 10. Portal functionality and link to Taxing District’s Financial Statements Page 20
o Figure 11. Sample Financial and Tax Information (Tax Bill) Page 21
i Section 6 – Enforcement Page 22
i Section 7 – Conclusion Page 22
i Appendix I – Debt Disclosure Ordinance Data (Alphabetically as of April 30, 2012) Page 24
i Appendix II – Non-Compliant Agencies (Alphabetically as of April 30, 2012) Page 35
i Appendix III – Instructions for accessing online Tax Bill Page 38

Foreword
The current financial condition of governments throughout the world is tenuous. From the European
Union struggling with the fragile economies of Greece, Ireland, Italy, Portugal and Spain to the United
States economy still reeling from the recession caused by the real estate collapse among other things,
governments face a myriad of challenges to maintain economic stability, protect its citizenry, and
provide general services.
According to numerous reports published by a variety of sources, the 50 states in the United States have
amassed debts totaling over $1 trillion, and the majority of individual state governments are in deep
financial straits. The State of Illinois’ perilous financial status has caused many experts to predict its
financial burden will increase in the coming years primarily due to skyrocketing pension obligations.
The media has divulged much about the conditions worldwide and domestically at the federal and state
levels. But, what about locally? What is the current financial shape of local government?
As Cook County Treasurer, my office is responsible for the collection of real estate property taxes. I have
served in government for 21 years and continually people stop me, call me, and write me with one
simple question: “Why are my taxes going up?”
The question is simple, the answer complex.
Never before has anyone attempted to study on a large scale the current financial conditions of local
government until I proposed a simple ordinance in Cook County. As Treasurer, I guided the passage of
the “Debt Disclosure Ordinance” through the Cook County Board of Commissioners. The Debt Disclosure
Ordinance, or DDO for short, requires all primary taxing agencies to report their financial data each year
to my office. I devoted resources on the office website located at cookcountytreasurer.com to house the
information and make it available to the public.
The information contained within the data that is entered directly by the agencies on a secure website
provides a true, and somewhat startling, picture of the financial condition of every agency in Cook
County. The information does not itself provide the answer to why taxes go up, but it does arm the
public with the vital data necessary to make informed decisions about their local governments. It
provides the public with resources to understand how its governments generate and spend money.
Öage Î of 38

This paper will use this data which has been made available to the public to provide a summary of the
current financial position of local government within Cook County.
1) Background
In the State of Illinois, the collection of property taxes serves as the major source of revenue for local
government taxing districts.
The State Constitution for Illinois was adopted in 1818 and specifies that the state and local taxing
districts may issue a tax in direct proportion to a property’s value. The state ceased demanding a
property tax in 1932, but local government taxing districts continue to impose and receive property tax
revenue.
Property tax bills are issued by the Treasurer’s Office according to the calculations performed by the
Assessor and Clerk. The Assessor determines the property value and the Clerk extends the tax levy, or
amount of money taxing districts annually demand from property owners. The funds collected by the
Treasurer are distributed to the local governmental agencies in order to fund schools, police and fire
departments, libraries, park districts, and local government.
Illinois has more units of local governments than any other state in the Union. As of October 2007,
6,994 units functioned in Illinois according to U.S. Census data. Illinois has over 2,000 more governments
than Pennsylvania, which ranks second with 4,871 units of government.
Figure 1. Units of Government in Illinois (by type) – 6,994 Total
Other (Special Districts) 3,249
Townships 1,432
Municipal 1,299
School Districts 912
County 102
Within Cook County, it should be noted that there are 553 primary government agencies.
Öage 3 of 38
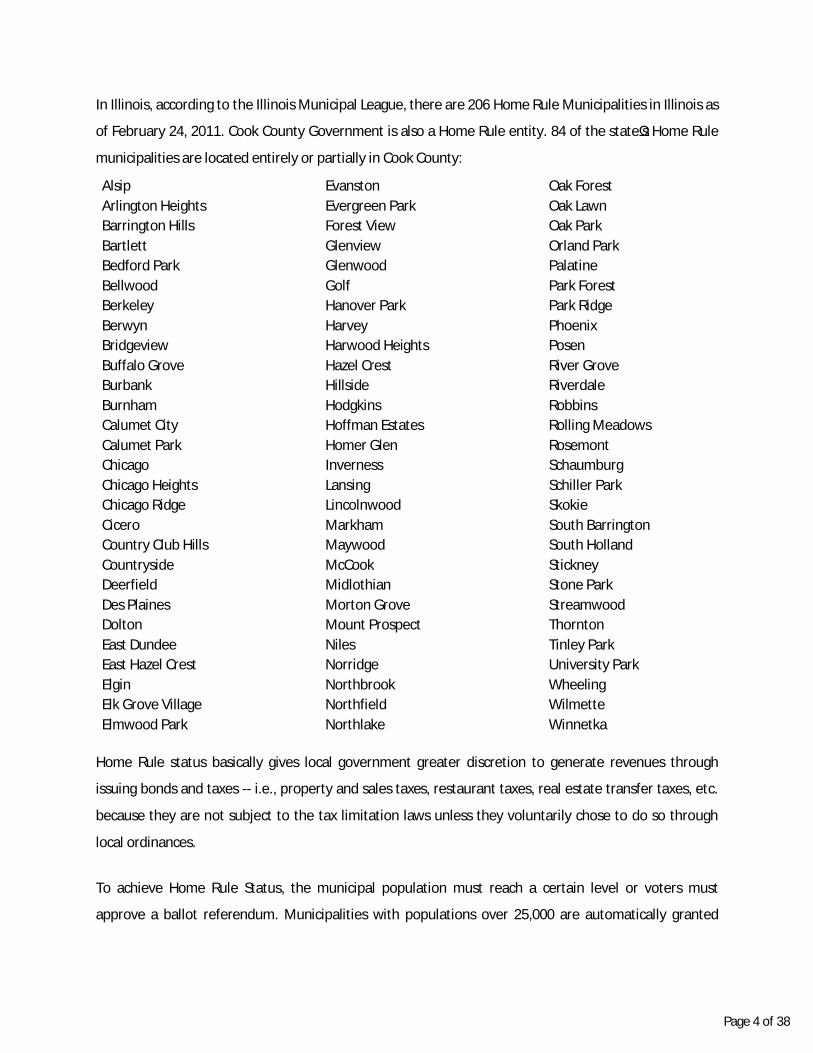
In Illinois, according to the Illinois Municipal League, there are 206 Home Rule Municipalities in Illinois as
of February 24, 2011. Cook County Government is also a Home Rule entity. 84 of the state’s Home Rule
municipalities are located entirely or partially in Cook County:
Alsip Arlington Heights Barrington Hills Bartlett Bedford Park Bellwood Berkeley Berwyn Bridgeview Buffalo Grove Burbank Burnham Calumet City Calumet Park Chicago Chicago Heights Chicago Ridge Cicero Country Club Hills Countryside Deerfield Des Plaines Dolton East Dundee East Hazel Crest Elgin Elk Grove Village Elmwood Park
Evanston Evergreen Park Forest View Glenview Glenwood Golf Hanover Park Harvey Harwood Heights Hazel Crest Hillside Hodgkins Hoffman Estates Homer Glen Inverness Lansing Lincolnwood Markham Maywood McCook Midlothian Morton Grove Mount Prospect Niles Norridge Northbrook Northfield Northlake
Oak Forest Oak Lawn Oak Park Orland Park Palatine Park Forest Park Ridge Phoenix Posen River Grove Riverdale Robbins Rolling Meadows Rosemont Schaumburg Schiller Park Skokie South Barrington South Holland Stickney Stone Park Streamwood Thornton Tinley Park University Park Wheeling Wilmette Winnetka
Home Rule status basically gives local government greater discretion to generate revenues through
issuing bonds and taxes -- i.e., property and sales taxes, restaurant taxes, real estate transfer taxes, etc.
because they are not subject to the tax limitation laws unless they voluntarily chose to do so through
local ordinances.
To achieve Home Rule Status, the municipal population must reach a certain level or voters must
approve a ballot referendum. Municipalities with populations over 25,000 are automatically granted
Öage Ï of 38

Home Rule status. Communities with a population of fewer than 25,000 can put the question on the
ballot. If the majority of voters approve, the municipality gains Home Rule status.
2) Process begins with the Levy
Each taxing district’s decision-making body, such as school boards, township boards of supervisors, and
city councils, must adopt a budget each year. While the expenditures detailed in the budget will be
allocated for a variety of items, notably personnel costs, capital equipment and general operating
expenses, the revenues will come primarily from a single source: property taxes.
Other types of revenues generated by some units of government include user fees, sales tax proceeds,
and federal and state income. The overwhelming majority of revenue, however, is distributed to the
taxing districts by the Treasurer’s Office as property taxes are paid by owners.
The amount of revenue that a taxing district demands to be raised annually from its share of property
taxes is called its levy. When a taxing district levies, it provides a separate amount necessary for each
fund it operates. For example, a Home Rule unit of government may have a general corporate fund in
addition to a street and bridge fund, bond and interest fund, and a pension fund.
Before filing its levy with the Clerk, all taxing agencies, including Home Rule governments, must follow
the provisions of the Truth-in-Taxation Law.
The Truth-in-Taxation Law established procedures that must be followed when agencies adopt their
levies. If a taxing district proposes an aggregate levy that is more than 5 percent higher than the total
amount of taxes from the previous year, it is required to publish a notice in a local newspaper and hold a
public hearing.
At the public hearing, a taxing district must disclose the reasons for its levy and proposed increase. A
district must provide any members of the public an opportunity to present testimony at the hearing.
After the hearing has been conducted, the taxing district may ultimately adopt the tax levy.
Within 15 days of its levy adoption, a taxing district is required under the law to publish a notice of its
final aggregate levy.
Öage 5 of 38
Each taxing district must certify to the County Clerk that it has complied with all Truth-in-Taxation
publication, notice, and hearing requirements when it files its levy with the Clerk.
If a taxing district does not comply with the requirements of the Truth-in-Taxation Law, the Clerk is
obligated to limit the levy increase to 5 percent from the previous year.
Likewise, the Property Tax Extension Limitation Law (PTELL) is designed to limit increases in property tax
extensions (total taxes billed) for all non-Home Rule taxing districts. Non-Home Rule agencies include
townships, municipalities which do not have Home Rule status, school districts, fire districts, libraries,
sanitary districts, and other special districts.
PTELL allows these taxing districts to receive a limited inflationary increase in tax extensions on existing
property, plus an additional amount for new construction, annexations to the district, and voter-
approved rate or limitation increases.
A partial list of reasons individual tax bills could increase more than 5 percent or the CPI increase:
i A district on the tax bill is not subject to the PTELL. i The property is in a taxing district that is able to increase its extension by more than 5% or the
CPI increase because it is a home rule municipality or an overlapping taxing district that is not subject to the PTELL.
i Voters approved an increase in tax rates or in the limitation. i Voters approved a bond issue or an increase in the debt service extension base. i New bonds were issued before the cutoff date for bonds to be exempt from the PTELL. i The property had been under-assessed in relation to other properties and is reassessed. i The property had a homestead exemption or other exemption that was removed. i The property has a greater share of the tax burden because the assessed value of other property
was decreased.
If the taxing district wishes to increase its levy more than the allowable limit (5% or CPI, whichever is
less), it must pose the question to voters and be approved by the voters on the ballot.
Citizens go to the polls to vote and often will find a series of questions on the ballot called referenda.
Many of the referenda questions are placed on the ballot by taxing agencies who seek to increase their
property tax demands or introduce a bond, which essentially helps government gain immediate revenue
now but at a higher cost to be paid over a period of time.
Öage 6 of 38

Although there are statutory guidelines regarding the language of the question on the ballot, many
voters fully do not comprehend exactly what they are considering nor understand its financial impact.
Consider the following example. The referenda question on the March 20, 2012 ballot regarding the
Palos Fire Protection District was:
“Shall the limiting rate under the Property Tax Extension Limitation Law for the Palos Fire Protection District, Cook County, Illinois, be increased by an additional amount equal to 0.25% above the limiting rate for fire protection and ambulance purposes for levy year 2010 and be equal to 0.803% of the equalized assessed value of the taxable property therein for levy year 2012? 1) The approximate amount of taxes extendable at the most recent extended limiting rate is $4,280,310, and the approximate amount of taxes extendable if the proposition is approved is $6,215,351. 2) For the 2012 levy year the approximate amount of the additional tax extendable against property containing a single family residence and having a fair market value of $100,000 is estimated to be $82.50. 3) If the proposition is approved, the aggregate extension for 2012 will be determined by the limiting rate set forth in the proposition, rather than the otherwise applicable limiting rate calculated under the provisions of the Property Tax Extension Limitation Law (commonly known as the Property Tax Cap Law).”
The ballot measure allows the fire district to increase its levy by almost $2 million dollars. The ballot
question disclosed the estimated property tax impact on a residence with a market value of $100,000.
However, homeowners will have to do the math to determine the impact of the tax increase if their
home value is not $100,000. For example, the property owner of a home with a market value of
$250,000 will see an estimated $206.25 increase on the property tax bill for that year. Finally, the
district would maintain a baseline levy of $6.2 million figure from this year to the next.
For the March 20, 2012 primary election, voters rejected 13 of 16 referenda questions pertaining to
increasing the limiting rate, issuing bonds, or become a Home Rule government.
Every taxing district must file its levy with the Clerk by the last Tuesday in December.
To raise the money demanded in levies, county clerks must calculate a tax rate for each fund for which
the taxing district levied.
A recent analysis by an independent think tank found that the tax demands of governments within the
county increased by twice the rate of inflation from 2000 to 2010. A chart displaying the suburban
increases by service type is displayed in Figure 2.
Öage 7 of 38

Figure 2. Rise in suburban property taxes/levy increases
District Type 2000 Total 2010 Total % Change
(2000-2010)
Fire $50,482,722 $93,243,256 84.7%
Municipality $755,658,278 $1,325,615,369 75.4%
Library $59,303,302 $99,945,536 68.5%
Township $92,852,995 $151,046,674 62.7%
Education $2,841,131,700 $4,500,762,145 58.4%
Park $183,854,054 $283,873,646 54.4%
Sanitary $1,939,957 $2,426,591 25.1%
Special $9,197,660 $8,211,955 -10.7%
The total levy over the period for all governments in Cook County increased by 48.3% (from $7.88 billion
in 2000 to $11.69 billion in 2010).
By district type, Fire Protection Districts had the highest aggregate increase of 84.7%.
Palos Fire Protection District
The Palos Fire Protection District, according to the Palos Park website, maintains two fire houses and serves 24,000 residents in Palos Township. The district levied $2,635,166 in 2000.
Fast forward to 2010 and the district’s levy has increased by 63.6% to $4,311,271.
On April 5, 2011, 55.7% of voters voted to reject a ballot referendum to increase the Fire District’s levy.
As mentioned earlier, on March 20, 2012, voters again considered an increase of the district’s levy. The district’s desire to increase its levy passed by a 74-vote margin (unofficial results: 1,892 to 1,818). The levy will rise to $6,215,351, or 135.9% more than the levy in 2000.
County of Cook
Cook County is the second most populous county in the nation and the 19th largest government
in the United States. The County of Cook property tax levy, however, has remained flat for 17
years.
Öage 8 of 38
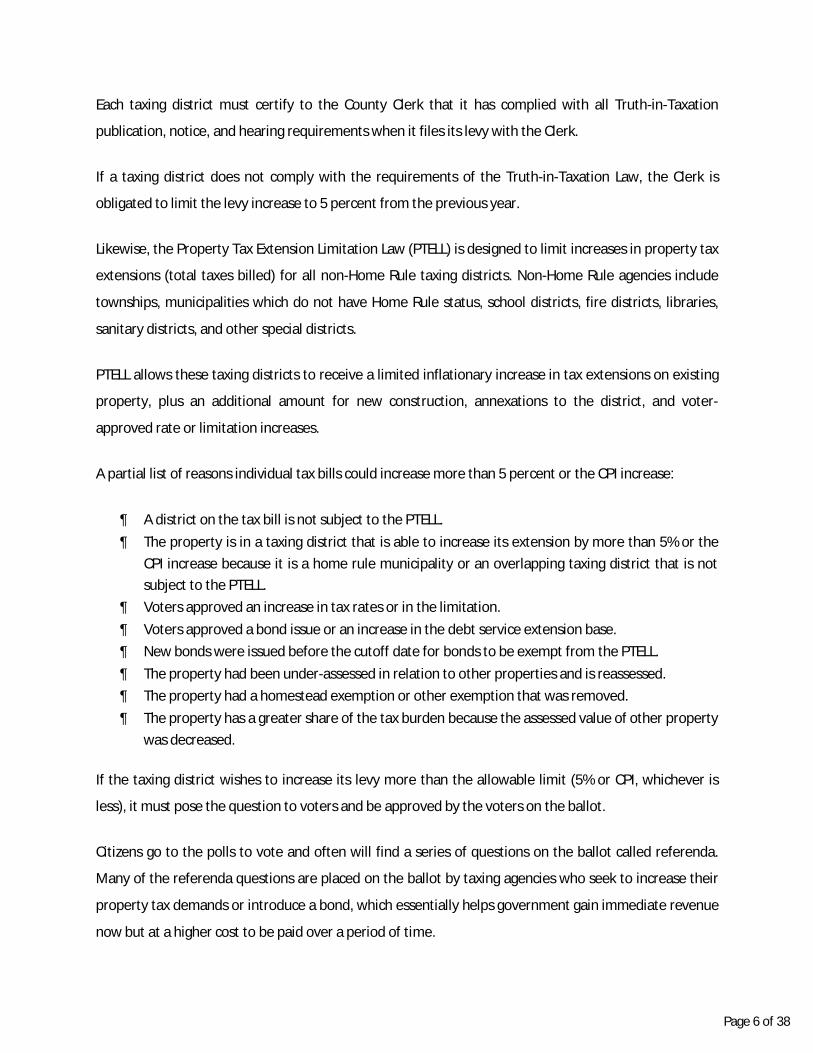
3) Property tax increases
The amount of an individual property tax bill is determined by three things — a property’s equalized
assessed value (its share of the total tax base), any property tax exemptions, and the applicable tax
rates, which depend on the levy – the amount of revenue demanded by local taxing districts from
property owners.
An analysis of the average residential property taxes in Calumet (South), Niles (North) and Riverside
(West) townships from 2000 to 2010 showed triple-digit tax increases:
Figure 3. Average Property Tax Increases in Three Townships
The study used residential properties with the following criteria:
i Homes with market value in 2010 between $245,000 and $270,000.
i Classified as 2-03, which is one story residence, any age, 1,000 to 1,800 square feet.
i Total taxes due (before exemptions).
Given that there are between 12 to 20 taxing districts listed on the 2nd installment property tax bill, an
increase in taxes likely comes from multiple sources. Increases initiated by more than one taxing agency
contribute to sizable increases in property taxes. As the market values of housing declines, however, one
would assume that property tax bills would be reduced. “My house is worth less than last year; my
property taxes should be less,” is the common sentiment of taxpayers. Taxing districts nevertheless
1,500
2,500
3,500
4,500
5,500
6,500
7,500
8,500
2000 2001 2002 2003 2004 2005 2006 2007 2008 2009 2010
Riverside Township Niles Township Calumet Township
172%
106%
116%
Öage 9 of 38

demand the same amount, or an increased amount, to fund operations. As a result, property taxes
increase.
By the time property owners receive the property tax bill in the mail, and react to the increase, the
ability to challenge the property tax demands of their agencies has passed. Taxpayers instead should
take an active role in the budgetary process of their associated taxing agencies and challenge proposed
levy increases if they are unwilling to foot the bill.
4) Debt Disclosure Ordinance
The Cook County Board of Commissioners passed the Debt Disclosure Ordinance on September 1, 2009.
The Debt Disclosure Ordinance or “DDO” specifies that the Treasurer of Cook County create an
electronic repository of all financial information regarding taxing districts. This electronic repository is
available to all taxpayers and provides a transparent view of the agencies who receive the proceeds of
property taxes.
Since the ordinance was passed, the Board of Commissioners amended the ordinance twice. On January
19, 2011 and September 20, 2011, the board adopted amendments to the Debt Disclosure Ordinance
which required taxing districts to upload additional financial data. Taxing districts now provide even
more useful information that taxpayers can use to determine the current financial conditions of the
agencies who receive their property taxes.
Many taxpayers have the common misconception that property taxes paid twice a year stay within the
Cook County government. In fact, the largest portion of the property tax bill is distributed to schools.
Cook County government currently receives roughly 6% of the property tax bill and Cook County’s levy
has remained flat for 17 years.
Consider that in 2010, all agencies demanded a total of $11.7 billion. Of that, the County Government’s
portion was $720,626,174, or merely 6.16%.
As per the Debt Disclosure Ordinance, taxing districts in Cook County must supply the following data:
i Sum total of all debts and liabilities
i Sum total of gross tax levy for the most recent tax year
Öage ÍÌ of 38
i Gross operating budget revenue for the most recent fiscal year
i Total Pension Liability
i Total Unfunded Pension Liability
i Actuarial cost method used to calculate Total Pension Liability and Total Unfunded Pension
Liability
i Asset valuation method used to calculate Total Unfunded Pension Liability
i Actuarial assumptions of Total Pension Liability and Total Unfunded Pension Liability:
o Investment rate of return
o Annual rate of salary increases
o Participant mortality rate
o Healthcare cost trend rate for OPEB benefits
i Name and contact information for the chief elected official and chief financial official
i Population (for county, city, village, or incorporated town)
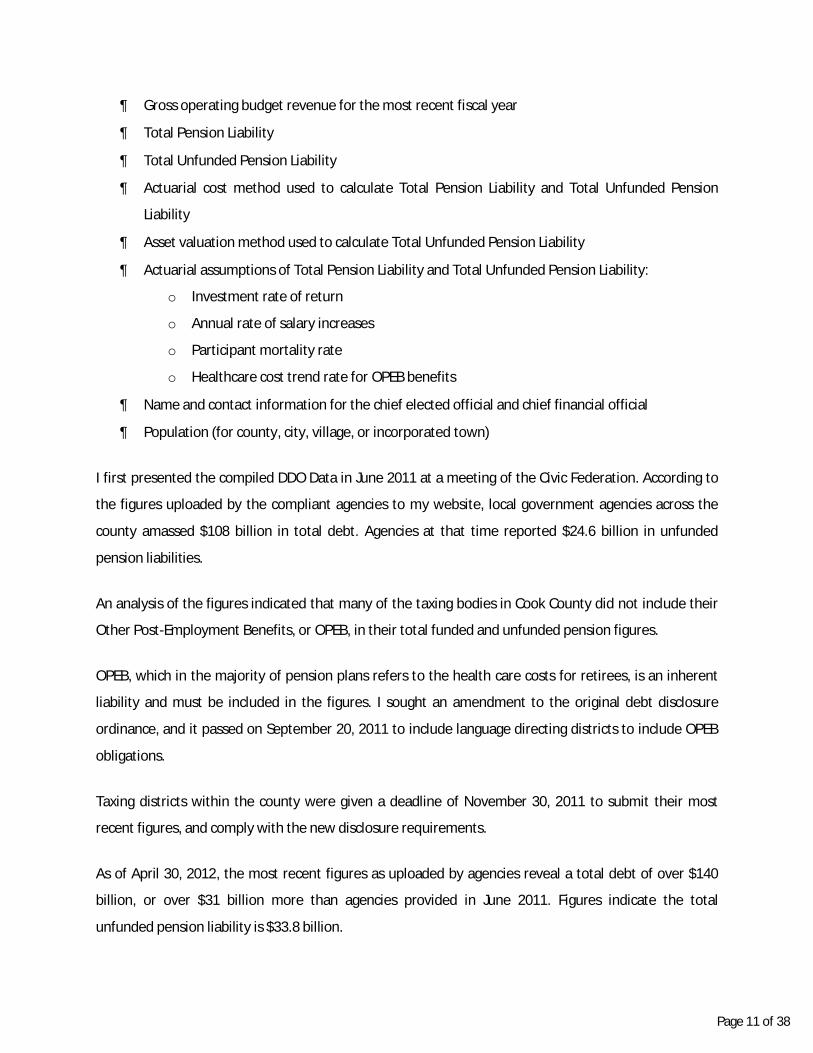
I first presented the compiled DDO Data in June 2011 at a meeting of the Civic Federation. According to
the figures uploaded by the compliant agencies to my website, local government agencies across the
county amassed $108 billion in total debt. Agencies at that time reported $24.6 billion in unfunded
pension liabilities.
An analysis of the figures indicated that many of the taxing bodies in Cook County did not include their
Other Post-Employment Benefits, or OPEB, in their total funded and unfunded pension figures.
OPEB, which in the majority of pension plans refers to the health care costs for retirees, is an inherent
liability and must be included in the figures. I sought an amendment to the original debt disclosure
ordinance, and it passed on September 20, 2011 to include language directing districts to include OPEB
obligations.
Taxing districts within the county were given a deadline of November 30, 2011 to submit their most
recent figures, and comply with the new disclosure requirements.
As of April 30, 2012, the most recent figures as uploaded by agencies reveal a total debt of over $140
billion, or over $31 billion more than agencies provided in June 2011. Figures indicate the total
unfunded pension liability is $33.8 billion.
Öage ÍÍ of 38

The $140 billion figure translates into debt per household figures of $87,721 in the City of Chicago and
$35,774 in Suburban Cook County:
Figure 4. Per Household Summary (April 30, 2012):
Area Households* Total Debt Debt Per Household
City Agencies 1,194,337 $ 91,202,873,006 $ 76,362.76
Suburbs Agencies 986,022 $ 24,075,354,977 $ 24,416.65
Countywide Agencies 2,180,359 $ 24,763,979,677 $ 11,357.75
Average City Household (City and County) $ 87,721
Average Suburban Household (Suburbs and County) $ 35,774
* According to 2010 Census data
I should note that the financial data provided in this report is that which the agencies themselves
upload. Any discrepancy or inaccuracy in the figures is the responsibility of the taxing agency and not
that of my office. The Debt Disclosure Ordinance directs my office to house the financial data from
agencies.
The chart that follows details the comparison in figures between what taxing agencies provided in June
2011 and April 2012:
Figure 5. DDO Comparison
As of June 14, 2011 As of April 30, 2012 Difference Difference (%)
Compliant Agencies 499 489 (10) Debts and Liabilities $57,939,872,627 $67,081,592,093 $9,141,719,466 15.8%
Total Pension Debt $50,372,804,314 $72,960,615,567 $22,587,811,253 44.8%
Total Unfunded Pension $24,674,402,275 $33,831,561,564 $9,157,159,289 37.1%
% Funded 51.0% 53.6% 2.6%
The original date to comply with DDO amendments was November 30, 2011 and 266 agencies failed to
comply on-time. As of April 30, 2012, 64 agencies remain non-compliant.
Note that the difference in pension figures can be attributed to two points. First, many agencies failed to
include their OPEB obligations in both the total pension debt and total unfunded pension debt.
Secondly, it was brought to my attention that the Chicago Board of Education entered an erroneous
Öage ÍÎ of 38

figure of $1.9 billion as their total pension debt for the June 2011 figures. The Board’s most recent
submission reports their total pension debt to be $19.1 billion.
As of April 30, 2012 a total of 489 out of 553 agencies have complied with the September 2011
ordinance amendments. The entire data set for each compliant agency may be found within Appendix I
at the end of this paper. Of the agencies that uploaded:
i 157 are Education Districts
i 113 are Municipalities
i 87 are Parks
i 47 are Libraries
i 30 are Fire Districts
i 29 are Townships
i 10 are Sanitary Districts
i 7 are Special Districts
i 6 are City of Chicago
i 2 are Countywide Agencies (Forest Preserve and Metropolitan Water Rec)
i 1 is the Cook County Government
Additionally:
i The sum total of all debts and liabilities is $67,081,592,093.
i The total gross operating budget revenue is $28,359,178,907.
i The total pension liability is $72,960,615,567.
i The total unfunded pension liability is $33,831,561,564.
The average pension fund percent funded is 53.6%.
Only 17% of compliant taxing agencies (83 agencies of the 489 compliant taxing bodies), reported their
pension funding level to be greater than 80%, or what the Pew Center on States and most experts deem
to be considered “healthy.”
Öage Í3 of 38

“The benchmark of 80 percent has been identified by the Government Accountability Office and other
experts as the threshold for adequate pension funding.”
– Pew Center on the States, February 2010
Other agencies, such as School District 117 (located in Palos Hills) and the Park Ridge Recreation and
Park District, reported an unfunded pension liability but failed to upload a total pension liability.
Although there are inaccuracies in the reporting of the figures, my office simply cannot verify and fact
check the data provided. It is up to the public to question the validity of the figures as uploaded and
direct any specific concern to the entity in question.
I should also note that the debt figures stated are not offset by any assets. Moody’s, Standard & Poor’s,
Fitch, and the Government Finance Officers Association (GFOA) evaluate debt without offsetting assets
which may or may not be used in the future to pay bills. In comparison, a homeowner who has a
$200,000 mortgage and $15,000 in a bank account would not consider their own personal debt to be
$185,000.
Assumed Rate of Return on Investment
Agencies are required under the DDO to enter the actuarial assumed rate of return on investment, or
basically the yield they expect from pension fund investment.
In Joshua Rauh’s testimony before Congress in February 2011, he stated, “A portfolio with an ‘expected
return’ of 8% has only about a 1/3 probability of achieving that return over the next 30 years, and has a
50% chance of achieving a return of 6% or lower.” Rauh is an Associate Professor of Finance at the
Kellogg School of Management.
Governments are under tremendous pressure to keep their rate of return high because the lower the
rate of return on investment, the greater the pension obligations appear. Basically, if the assumed rate
of return is lowered by 1%, the total liabilities are projected to increase by 25%.
Prior to the recession when the stock market was high, many governments failed to make the necessary
contributions to their pension plans. Perhaps they incorrectly were under the assumption that solid
economic trends would continue. Even today, as governments operate in a fragile economy, they have
also neglected to make appropriate contributions to those plans.
Öage ÍÏ of 38

”Just as failing to meet a monthly payment on a personal loan can result in higher payments down the
road, a [government’s] failure to pay the annual bill for retirement benefits can mean it will have to pay
more in the future,” stated the Pew Center on the States in an April 2011 report.
According to the data which taxing agencies entered as of April 30, 2012, the average assumed rate of
return on investment for the 489 compliant governments is 7%. The most common rate is 7.5%, which is
used by 279 agencies.
Figure 6. Rate of Return
Rate of Return Quantity
18.00% 1
9.28% 1
8.00% 9
7.75% 6
7.50% 279
7.35% 1
7.25% 4
7.10% 1
7.00% 62
6.95% 1
6.83% 1
6.75% 1
6.74% 1
6.50% 2
6.25% 1
6.00% 2
5.00% 29
4.50% 3
4.00% 2
3.50% 2
3.00% 1
2.50% 2
2.00% 3
1.00% 1
0.55% 1
0.50% 1
0.25% 1
0.20% 1
0.05% 1
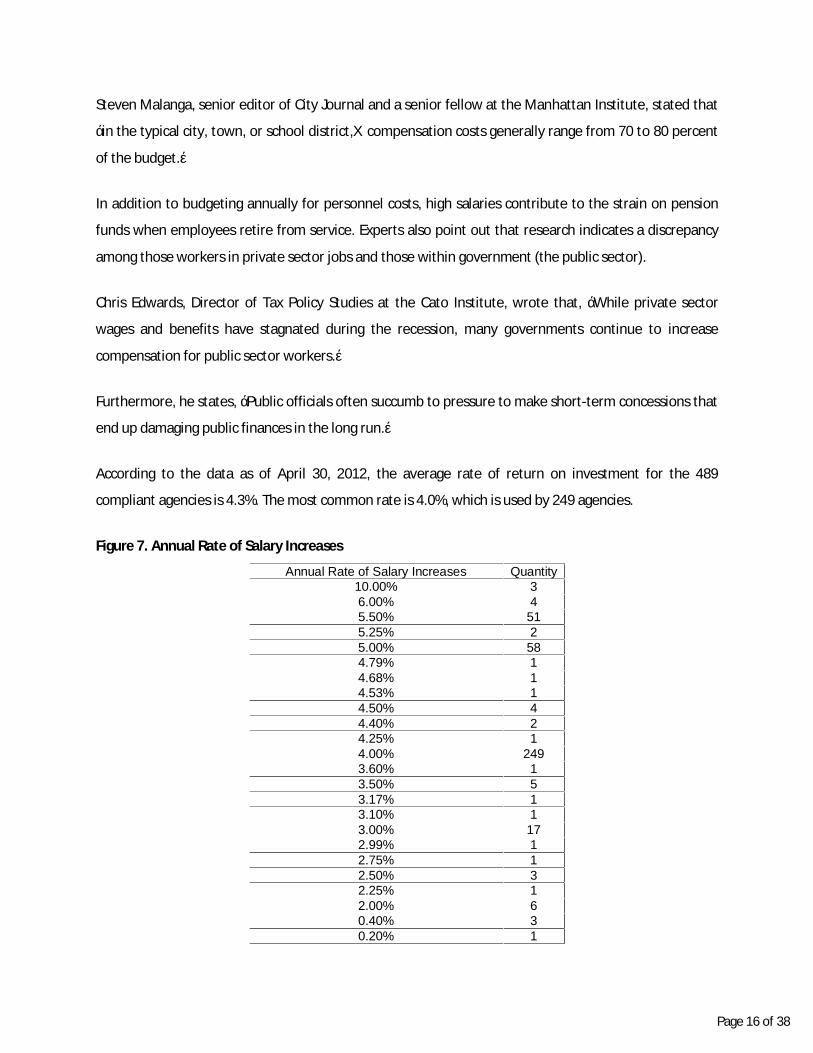
Rate of Salary Increases
Generally, personnel costs comprise the majority of spending of local governments. For certain
municipalities, personnel costs consume the majority of funds within the entire operating budget.
Öage Í5 of 38
Steven Malanga, senior editor of City Journal and a senior fellow at the Manhattan Institute, stated that
“in the typical city, town, or school district,… compensation costs generally range from 70 to 80 percent
of the budget.”
In addition to budgeting annually for personnel costs, high salaries contribute to the strain on pension
funds when employees retire from service. Experts also point out that research indicates a discrepancy
among those workers in private sector jobs and those within government (the public sector).
Chris Edwards, Director of Tax Policy Studies at the Cato Institute, wrote that, “While private sector
wages and benefits have stagnated during the recession, many governments continue to increase
compensation for public sector workers.”
Furthermore, he states, “Public officials often succumb to pressure to make short-term concessions that
end up damaging public finances in the long run.”
According to the data as of April 30, 2012, the average rate of return on investment for the 489
compliant agencies is 4.3%. The most common rate is 4.0%, which is used by 249 agencies.
Figure 7. Annual Rate of Salary Increases
Annual Rate of Salary Increases Quantity
10.00% 3
6.00% 4
5.50% 51
5.25% 2
5.00% 58
4.79% 1
4.68% 1
4.53% 1
4.50% 4
4.40% 2
4.25% 1
4.00% 249
3.60% 1
3.50% 5
3.17% 1
3.10% 1
3.00% 17
2.99% 1
2.75% 1
2.50% 3
2.25% 1
2.00% 6
0.40% 3
0.20% 1
Öage Í6 of 38
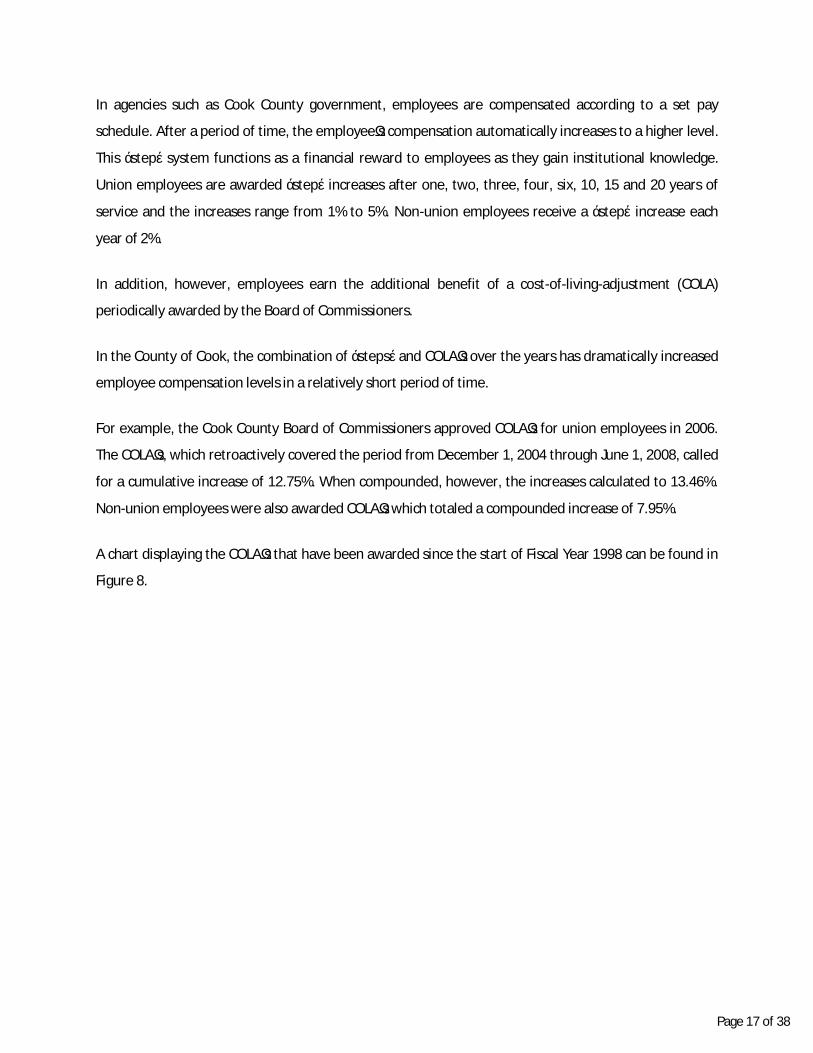
In agencies such as Cook County government, employees are compensated according to a set pay
schedule. After a period of time, the employee’s compensation automatically increases to a higher level.
This “step” system functions as a financial reward to employees as they gain institutional knowledge.
Union employees are awarded “step” increases after one, two, three, four, six, 10, 15 and 20 years of
service and the increases range from 1% to 5%. Non-union employees receive a “step” increase each
year of 2%.
In addition, however, employees earn the additional benefit of a cost-of-living-adjustment (COLA)
periodically awarded by the Board of Commissioners.
In the County of Cook, the combination of “steps” and COLA’s over the years has dramatically increased
employee compensation levels in a relatively short period of time.
For example, the Cook County Board of Commissioners approved COLA’s for union employees in 2006.
The COLA’s, which retroactively covered the period from December 1, 2004 through June 1, 2008, called
for a cumulative increase of 12.75%. When compounded, however, the increases calculated to 13.46%.
Non-union employees were also awarded COLA’s which totaled a compounded increase of 7.95%.
A chart displaying the COLA’s that have been awarded since the start of Fiscal Year 1998 can be found in
Figure 8.
Öage Í7 of 38

Figure 8. History of COLA’s in Cook County Government since 1998
As mentioned, employees in Cook County earn COLA increases on top of the “step” increases which are
based on years of service in County Government. My office maintains the chart below which displays the
salary of an employee beginning at the first step in 1998 and the salary of the same employee in 2011.
As illustrated in the chart, employee salary compensation increase by arrange from 76% to 87% from
1998 to 2012.
Implemented COLA NoteFY1998
December 1, 1997
FY1999June 1, 1999
4.0%
FY2000December 1, 1999
3.0%
FY2001 December 1, 2000
3.0% Plus $.10/hour increas e
FY2002June 1, 2002
2.5%
FY2003December 1, 2002
2.0%
FY2003June 1, 2003
1.0%
FY2004 December 1, 2003
3.0%
FY2005December 1, 2004*
1.0%
FY2006December 1, 2005*
1.0%
FY2006June 1, 2006*
2.0% Plus $500 Cas h Bonus
FY2007December 1, 2006*
1.5%
FY2007June 1, 2007
2.5% 3% for Non-Uni on Employees and $1,000 Cash Bonus
FY2008December 1, 2007
2.0%
FY2008June 1, 2008
2.75%
FY2012December 1, 2011**
2.25%
FY2012June 1, 2012**
3.75%
*COLA awarded to Union employees only. **COLA awarded to Non-Union employees only.
Öage Í8 of 38
Figure 9. Compensation Increases in Cook County since 1998 (Steps and COLAs)
As Chris Edwards stated, “Nearly all public sector defined-benefit [pension] plans calculate benefits
based on earnings during the last one to three years of work. By contrast, private sector defined benefit
plans are more likely to use a lower-cost approach, such as basing benefits on career-average earnings.”
Current employee salary increases have a detrimental impact on pension funds, and this spiking of
salaries should be a point of concern for all governments. Governments across the country should take a
hard look at employee compensation by studying technological solutions to streamline functions.
Many experts advise that the state of Illinois has too many taxing agencies. Statewide, as mentioned
earlier, there are 6,994 taxing districts. The notion that there are too many districts perhaps should be
trumped by the question, are the districts doing everything in their power to provide services in the
most efficient, cost-effective manner? Is there unnecessary “paper pushing” instead of automation?
The subject of consolidation is a hot-button issue at the present time. I believe that consolidation should
occur only when there are benefits to the citizenry.
GRADE STEPSalary of an Employee in
FY1998
Salary of same Employee in FY2012 (including STEP
and COLA increases)
INCREASE (over FY1998)
% of INCREASE (over FY1998)
11 1 $ 22,599 $ 40,023 $ 17,424 77%12 1 $ 24,215 $ 42,852 $ 18,637 77%13 1 $ 25,950 $ 46,044 $ 20,094 77%14 1 $ 27,869 $ 49,439 $ 21,570 77%15 1 $ 30,020 $ 53,154 $ 23,134 77%16 1 $ 32,240 $ 56,817 $ 24,577 76%
17* 1 $ 34,611 $ 64,267 $ 29,656 86%18* 1 $ 37,092 $ 69,260 $ 32,168 87%19* 1 $ 40,701 $ 75,391 $ 34,690 85%20* 1 $ 44,711 $ 82,472 $ 37,761 84%21* 1 $ 49,158 $ 90,668 $ 41,510 84%22* 1 $ 53,963 $ 99,682 $ 45,719 85%23* 1 $ 56,609 $ 104,260 $ 47,651 84%
*Non-Union
Öage Í9 of 38

In my office, the Cook County Treasurer’s Office, we have reduced our headcount from 250 in 1998 to
110 positions in 2012. This 56% reduction was achieved by automation and embracing technology to
provide and expand services to taxpayers. Simply put, we are doing more and reducing our need for
taxpayer funds.
5) Online data on Cook County Property Tax Portal
Numerous examples of efficiency can be found by accessing the new Cook County Property Tax Portal
located at cookcountypropertyinfo.com. The portal is a collaborative effort initiated by Cook County
Board President Toni Preckwinkle that combines information from various county offices into one
unified site, saving time and promoting efficiency. The portal allows residents access to information
such as appeal or exemption opportunities or liens on their properties.
Figure 10. Portal functionality and link to Taxing District’s Financial Statements
By clicking the “Taxing District’s Financial Statements” link on the portal, user can access brand-new
search function to view the financial information for the 12 to 20 governments to whom receive a share
of the property taxes.
Öage ÎÌ of 38
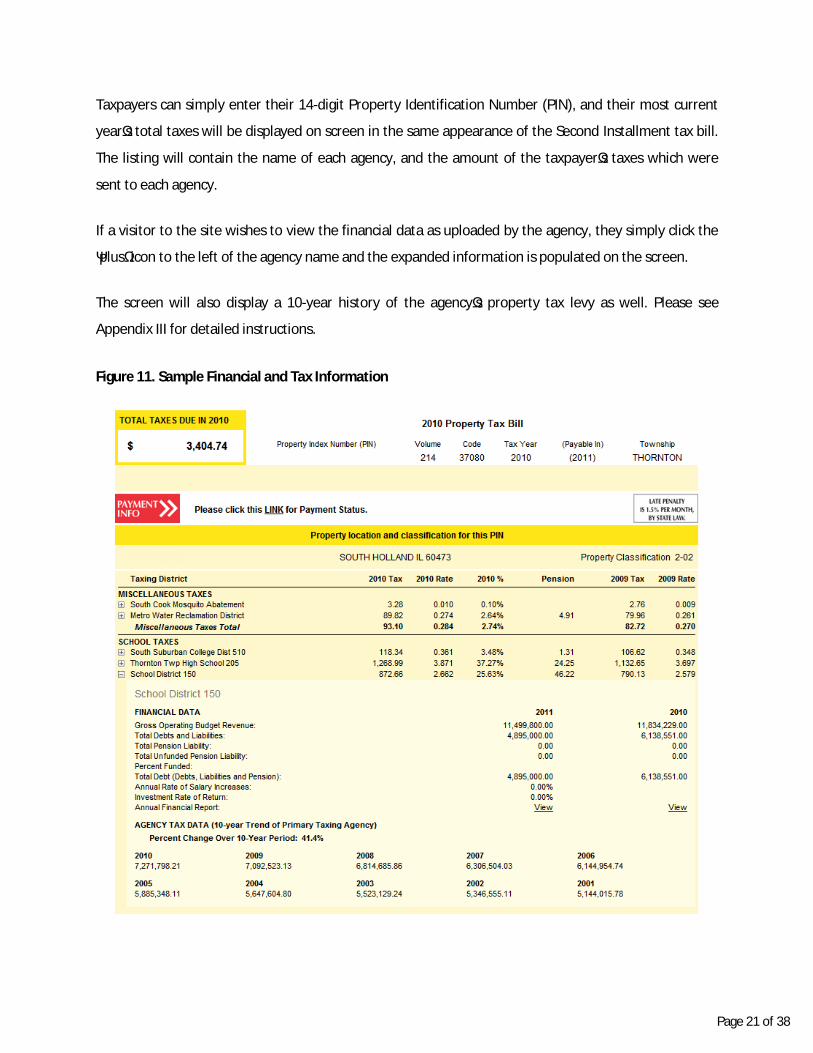
Taxpayers can simply enter their 14-digit Property Identification Number (PIN), and their most current
year’s total taxes will be displayed on screen in the same appearance of the Second Installment tax bill.
The listing will contain the name of each agency, and the amount of the taxpayer’s taxes which were
sent to each agency.
If a visitor to the site wishes to view the financial data as uploaded by the agency, they simply click the
‘plus’ icon to the left of the agency name and the expanded information is populated on the screen.
The screen will also display a 10-year history of the agency’s property tax levy as well. Please see
Appendix III for detailed instructions.
Figure 11. Sample Financial and Tax Information
Öage ÎÍ of 38
It is my hope that this transparency effort will be embraced by taxpayers as a way to educate
themselves on how local governments spend tax dollars. If an agency is listed on the property tax bill,
but has not supplied financial information in compliance with the DDO, it is my hope that taxpayers call
their government and demand the information be entered.
6) Enforcement
Although the Debt Disclosure Ordinance requires taxing agencies to comply by uploading their financial
data, the ordinance does not contain an enforcement mechanism. The most recent date to comply with
the ordinance was November 30, 2011, and at that time 266 agencies failed to comply.
On January 12, 2012, the Cook County Treasurer’s Office sent letters to taxing districts that did not
comply with the deadline. As of April 30, 2012, 64 agencies remain non-compliant. The list of non-
compliant agencies may be found within Appendix II at the end of this paper.
As a result of this inability for taxpayers to gain a true understanding of the financial condition of each
taxing district, State Representative Sara Feigenholtz introduced H.B. 4564 in Springfield that requires
agencies to upload their financial data. If the agency fails to comply, the legislation stipulates that the
Treasurer withhold distribution of tax funds until the point at which agencies comply.
7) Conclusion
In testimony before Congress, Joshua Rauh stated that, “many pension systems are approaching a day of
reckoning. Even assuming 8% returns the assets of the systems in seven states [including Illinois] …
would be insufficient to pay for today’s already-promised benefits past the year 2020.”
I wrote this paper not with the aim of trying to solve the debt and pension crisis, but instead want property
taxpayers to understand the problems that local governments are facing. The issues of Illinois, the City of
Chicago, and Cook County have been the subject of many reports and news stories. The problems,
however, permeate the small villages and towns, school districts and libraries across the country.
The public needs to propel their local leaders to act. Property owners cannot alone bear the escalating
costs of government through property tax increases.
For more information, please contact Cook County Treasurer Maria Pappas at (312) 603-6202.
Öage ÎÎ of 38
Bibliography
Edwards, Chris. “Public Sector Unions and the Rising Costs of Employee Compensation.” Cato Journal Winter 2010, volume 30, number 1.
Malanga, Steven. “The Compensation Monster Devouring Cities.” City Journal Summer 2011, volume 21, number 3.
Pew Center on the States. “The Widening Gap: The Great Recession’s Impact on State Pension and Retiree Health Care Costs.” Pew Center on the States April 2011 http://www.pewcenteronthestates.org/uploadedFiles/Pew_pensions_retiree_benefits.pdf
Pew Center on the States. “The Trillion Dollar Gap: Underfunded State Retirement Systems and the Roads to Reform.” Pew Center on the States February 2010 http://www.pewcenteronthestates.org/downloads/The_Trillion_Dollar_Gap_final.pdf
Rauh, Joshua. Congressional Testimony before the Subcommittee on Courts, Commercial, and Administrative Law. February 14, 2011, http://judiciary.house.gov/hearings/pdf/Rauh02142011.pdf
Öage Î3 of 38

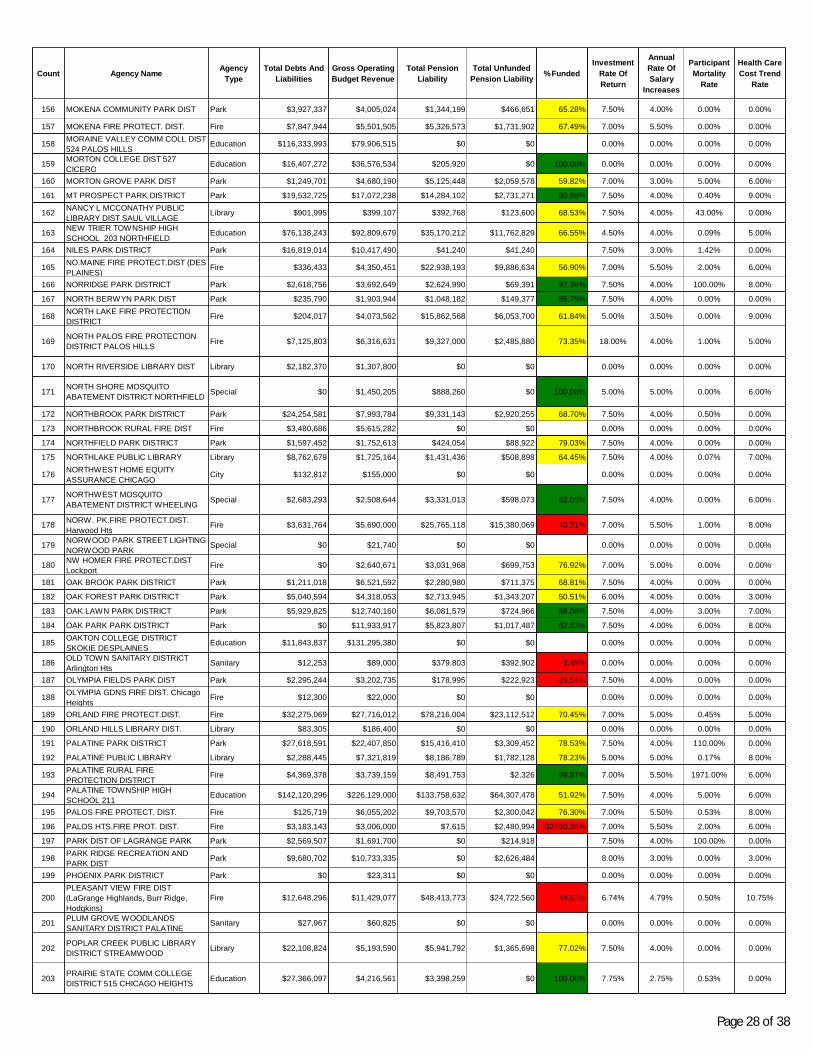
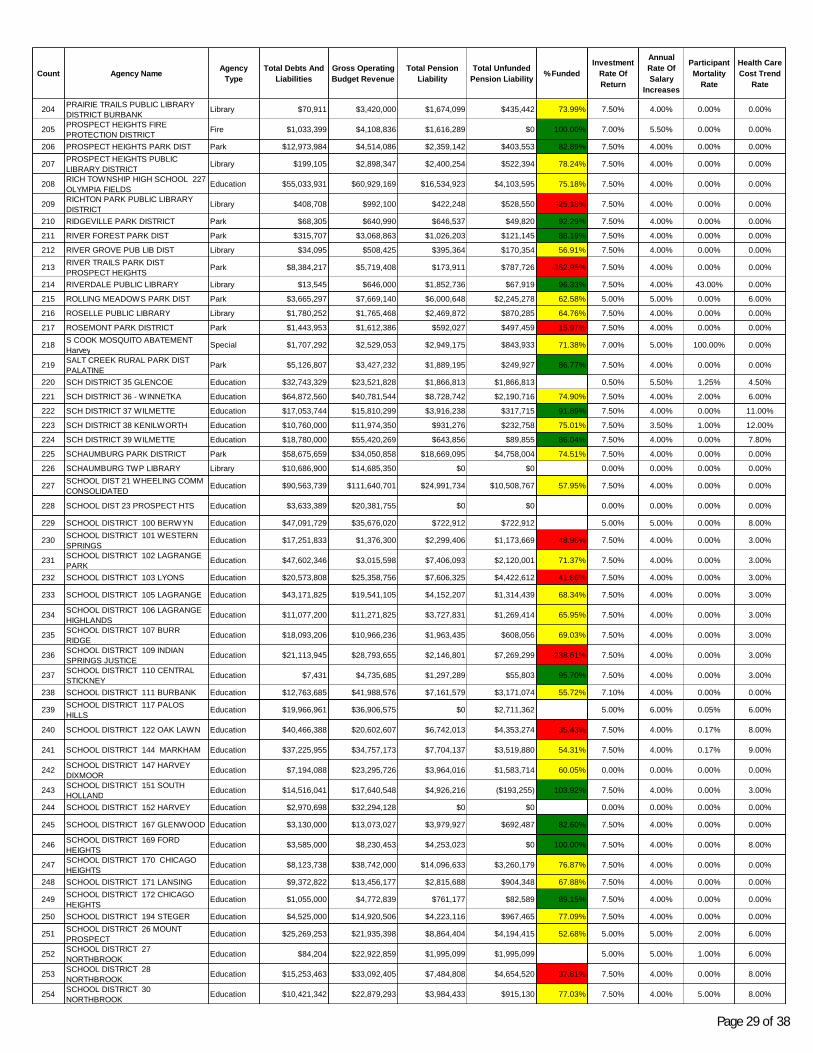
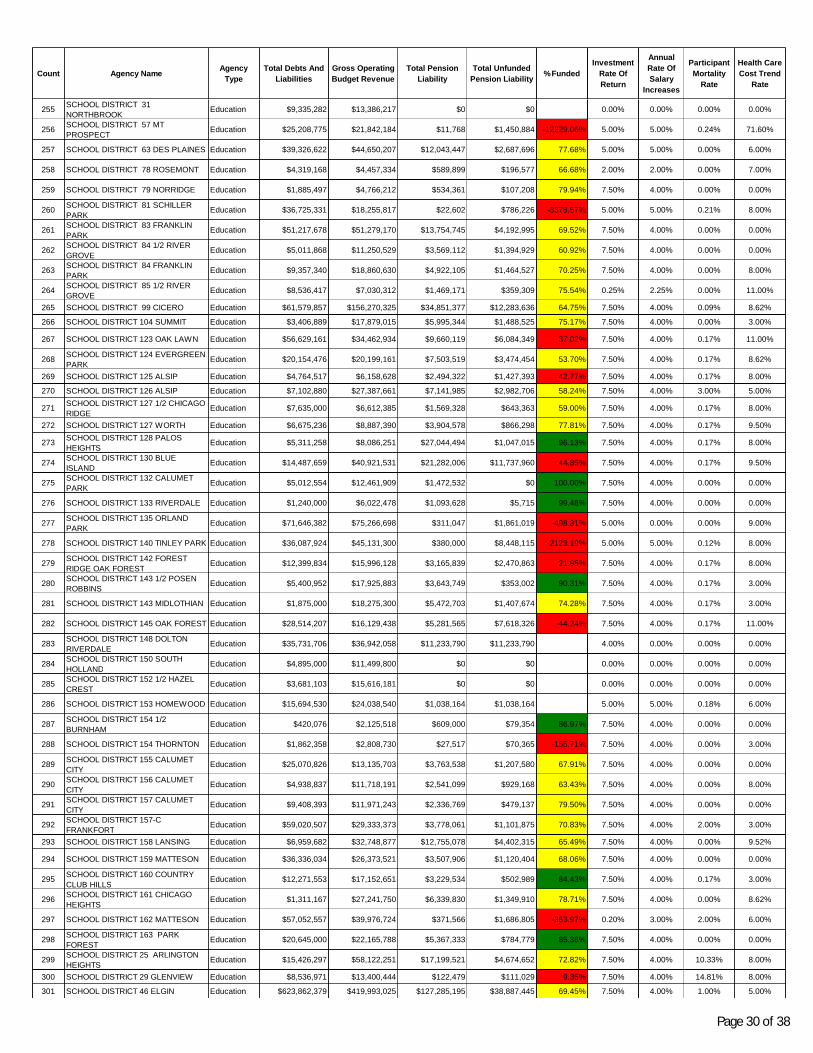
Appendix I – Debt Disclosure Ordinance Data (as of April 30, 2012)
DISCLAIMER: The Cook County Treasurer’s Office (CCTO) does not guarantee the accuracy or completeness of any
of the information contained in this report. The information contained in this report comes from many sources,
none of which are in the control of the Cook County Treasurer’s Office. As such, it is the user’s responsibility to
evaluate the content and usefulness of the information. The information is provided “as is.” CCTO makes no
warranty of any kind, express or implied, including the warranty of merchantability and fitness for a particular
purpose and freedom from contamination from computer viruses, and assumes no liability or responsibility for the
accuracy, completeness, legality, reliability or usefulness of such information or for any omissions from the
information. CCTO assumes no liability for any damages incurred, whether directly or indirectly, actual, incidental,
punitive or consequential, as a result of any errors, omissions or discrepancies in any information set forth in this
report or any use of such report. CCTO is not liable for any improper or incorrect use of the information in this
report and assumes no liability for anyone’s use of such information.
Öage ÎÏ of 38
Count Agency Name Agency Type
Total Debts And Liabilities
Gross Operating Budget Revenue
Total Pension Liability
Total Unfunded Pension Liability % Funded
Investment Rate Of Return
Annual Rate Of Salary
Increases
Participant Mortality
Rate
Health Care Cost Trend
Rate
1ACORN PUBLIC LIBRARY DIST OAK
FORESTLibrary $765,354 $1,927,100 $1,194,145 $619,602 48.11% 7.50% 4.00% 0.00% 0.00%
2ALSIP MERRIONETTE PARK PUBLIC
LIBRARY DISTLibrary $5,221,186 $7,644,000 $2,277,205 $670,328 70.56% 7.50% 4.00% 0.00% 0.00%
3 ALSIP PARK DISTRICT Park $4,819,331 $3,288,758 $2,885,574 $512,727 82.23% 7.50% 4.00% 0.00% 0.00%
4 ARLINGTON HTS PARK DIST Park $9,401,360 $24,321,339 $22,644,527 $7,619,349 66.35% 7.50% 3.00% 100.00% 8.00%
5 BARR.COUNTRYSIDE PARK DIST Park $3,789 $299,313 $0 $0 #VALUE! 0.00% 0.00% 0.00% 0.00%
6 BARRING-CTRYSIDE FIRE DIST Fire $6,168,682 $5,106,000 $0 $0 #VALUE! 0.00% 0.00% 0.00% 0.00%
7 BARRINGTON LIBRARY DIST Library $0 $6,108,441 $7,479,170 $2,422,821 67.61% 7.50% 4.00% 0.00% 0.00%
8 BARRINGTON PARK DISTRICT Park $31,629,606 $7,416,412 $2,839,761 $688,797 75.74% 7.50% 4.00% 0.40% 10.00%
9 BARTLETT FIRE DISTRICT Fire $210,320 $6,673,428 $10,498,991 $4,379,740 58.28% 7.50% 5.00% 1.59% 0.00%
10 BARTLETT PARK DISTRICT Park $42,269,272 $10,594,871 $286,402 $1,681,500 -487.11% 7.50% 2.00% 0.00% 0.00%
11 BARTLETT PUBLIC LIBRARY Library $47,014 $2,652,715 $1,070,777 $2,723,362 -154.34% 7.50% 4.00% 3.00% 0.00%
12 BEDFORD PARK PARK DISTRICT Park $4,273,120 $1,994,515 $2,348,688 $483,587 79.41% 7.50% 4.00% 0.00% 0.00%
13BEDFORD PARK PUBLIC LIBRARY
DISTLibrary $141 $1,144,100 $1,689,341 $503,157 70.22% 7.50% 4.00% 0.00% 0.00%
14BENSENVILLE COMMUNITY PUBLIC
LIBRARYLibrary $0 $1,556,655 $76,422 $620,348 -711.74% 7.50% 4.00% 0.00% 12.00%
15BENSENVILLE FIRE PROTECTION
DISTRICT #2Fire $20,615 $4,873,500 $320,000 $125,000 60.94% 7.50% 5.00% 0.00% 110.20%
16 BENSENVILLE PARK DISTRICT Park $11,345,891 $8,055,653 $7,187,485 $1,618,830 77.48% 7.50% 4.00% 0.00% 0.00%
17 BERKELEY PARK DISTRICT Park $91,173 $205,224 $0 $0 #VALUE! 0.00% 0.00% 0.00% 0.00%
18BERWYN CICERO STICKNEY HIGH
SCHOOL 201 Education $51,956,272 $90,796,104 $26,483,050 $2,004,068 92.43% 0.00% 0.00% 0.00% 0.00%
19 BERWYN PARK DISTRICT Park $1,765,902 $1,248,928 $1,054,082 $107,189 89.83% 7.50% 4.00% 0.00% 0.00%
20BLOOM TOWNSHIP HIGH SCHOOL
206 CHICAGO HEIGHTS Education $18,286,734 $48,559,280 $19,476,630 $3,903,512 79.96% 7.50% 4.00% 0.00% 0.00%
21 BLUE ISLAND PARK DISTRICT Park $698,318 $1,602,905 $894,978 $111,675 87.52% 7.50% 4.00% 0.00% 0.00%
22 BOARD OF EDUCATION CHICAGO City $11,370,824,665 $5,110,210,000 $19,111,888,101 $8,159,613,376 57.31% 8.00% 4.00% 0.34% 8.00%
23 BRIDGEVIEW PARK DISTRICT Park $9,049,685 $1,142,975 $814,622 $306,706 62.35% 7.50% 4.00% 0.00% 0.00%
24 BROADVIEW PARK DISTRICT Park $552,522 $1,173,535 $377,437 $0 100.00% 7.50% 4.00% 0.00% 0.00%
25 BROADVIEW PUBLIC LIBRARY DIST Library $1,315,752 $938,175 $730,176 $253,767 65.25% 7.50% 4.00% 0.00% 0.00%
26 BUFFALO GROVE PARK DIST Park $23,023,152 $19,780,370 $8,627,681 $3,764,023 56.37% 7.50% 4.00% 0.00% 8.00%
27 BURBANK PARK DISTRICT Park $2,627,183 $1,700,000 $798,923 $66,140 91.72% 7.50% 4.00% 0.00% 0.00%
28 BURR RIDGE PARK DISTRICT Park $3,686,250 $2,877,733 $0 $0 #VALUE! 0.00% 0.00% 0.00% 0.00%
29 CALUMET MEMORIAL PARK DIST Park $2,827,601 $2,141,000 $1,521,677 $918,828 39.62% 7.50% 4.00% 0.00% 0.00%
30 CENTRAL STICKNEY FIRE DIST Fire $394,287 $685,934 $97,294 $93,354 4.05% 7.00% 5.50% 0.00% 0.00%
31 CENTRAL STICKNEY PARK DIST Park $674,107 $469,000 $791,237 $127,730 83.86% 7.50% 4.00% 0.00% 0.00%
32CHICAGO COMMUNITY COLLEGE
DISTCity $182,688,775 $308,610,842 $0 $0 #VALUE! 4.50% 0.00% 75.00% 2.51%
33 CHICAGO PARK DISTRICT City $1,385,905,000 $397,569,544 $878,825,948 $360,243,347 59.01% 8.00% 4.50% 0.53% 9.00%
34 CHICAGO RIDGE PARK DIST Park $5,753,024 $2,424,930 $561,886 $100,345 82.14% 7.50% 6.00% 0.73% 0.00%
35 CITY OF BERWYN Municipality $143,389,452 $73,426,726 $159,765,551 $95,180,692 40.42% 7.25% 5.00% 1.59% 8.00%
36 CITY OF BLUE ISLAND Municipality $18,177,125 $24,237,000 $3,651,512 $23,985,222 -556.86% 7.50% 4.00% 1.00% 0.00%
37 CITY OF CALUMET CITY Municipality $86,410,330 $32,633,741 $169,153,203 $93,991,275 44.43% 7.50% 4.00% 0.00% 9.00%
38 CITY OF CHICAGO City $30,535,327,000 $6,152,677,000 $27,735,103,000 $15,285,240,000 44.89% 8.00% 3.00% 0.53% 12.00%
39 CITY OF CHICAGO HEIGHTS Municipality $75,798,876 $54,563,076 $128,648,897 $44,146,263 65.68% 8.00% 5.00% 2.00% 6.00%
40 CITY OF COUNTRY CLUB HILLS Municipality $5,508,000 $35,636,388 $1,668,100 $10,735,197 -543.56% 7.00% 5.50% 0.00% 0.00%
41 CITY OF COUNTRYSIDE Municipality $27,821,638 $11,767,504 $23,740,796 $9,349,899 60.62% 7.00% 5.00% 2.00% 6.00%
42 CITY OF DES PLAINES Municipality $119,397,674 $95,249,040 $243,567,883 $108,493,812 55.46% 7.75% 5.00% 2.00% 4.74%
43 CITY OF ELGIN Municipality $109,858,744 $141,600,000 $265,139,396 $127,404,139 51.95% 7.50% 5.00% 8.00% 6.00%
44 CITY OF EVANSTON Municipality $331,393,773 $73,873,482 $388,377,476 $205,683,794 47.04% 7.00% 5.00% 0.05% 8.50%
45 CITY OF HARVEY Municipality $23,253,941 $39,161,044 $58,047,427 $30,063,462 48.21% 7.00% 5.50% 0.00% 0.00%
46 CITY OF HOMETOWN Municipality $400,035 $3,400,442 $0 $0 #VALUE! 0.00% 0.00% 0.00% 0.00%
47 CITY OF MARKHAM Municipality $58,184,135 $19,229,985 $23,925,516 $6,471,158 72.95% 7.00% 5.50% 0.00% 0.00%
48 CITY OF NORTH LAKE Municipality $60,614,154 $25,473,150 $25,136,646 $8,792,210 65.02% 7.00% 5.50% 0.00% 0.00%
49 CITY OF OAK FOREST Municipality $40,302,443 $29,677,989 $60,839,925 $20,052,881 67.04% 7.50% 5.50% 2.00% 8.00%
50 CITY OF PALOS HEIGHTS Municipality $9,218,351 $16,467,835 $23,326,812 $10,578,287 54.65% 7.50% 4.00% 0.00% 0.00%
51 CITY OF PALOS HILLS Municipality $11,938,308 $11,795,148 $2,674,174 $11,827,461 -342.28% 7.00% 4.00% 5.00% 5.00%
52 CITY OF PARK RIDGE Municipality $50,165,927 $56,744,636 $133,952,135 $53,222,969 60.27% 7.00% 3.50% 0.00% 9.00%
53 CITY OF PROSPECT HEIGHTS Municipality $18,621,141 $8,587,615 $19,938,893 $10,645,627 46.61% 6.50% 4.53% 0.00% 9.00%
54 CITY OF ROLLING MEADOWS Municipality $46,606,345 $57,310,085 $131,967,346 $71,014,122 46.19% 7.00% 5.50% 5.00% 8.00%
Office of the Cook County TreasurerDebt Disclosure Compliance as of 4/30/2012
(sorted Alphabetically)
Öage Î5 of 38

Count Agency Name Agency Type
Total Debts And Liabilities
Gross Operating Budget Revenue
Total Pension Liability
Total Unfunded Pension Liability % Funded
Investment Rate Of Return
Annual Rate Of Salary
Increases
Participant Mortality
Rate
Health Care Cost Trend
Rate
55COMBINED SCHOOL DIST CC 113A
LEMONTEducation $49,205,596 $28,389,206 $389,912 $3,157,775 -709.87% 3.00% 0.00% 0.00% 6.00%
56COMMUNITY HIGH SCHOOL 212
FRANKLIN PARK Education $62,714,772 $71,786,505 $32,915,071 $16,322,757 50.41% 7.50% 4.00% 0.00% 9.30%
57COMMUNITY HIGH SCHOOL 228
MIDLOTHIANEducation $33,522,356 $82,839,345 $20,272,716 $5,152,701 74.58% 7.50% 4.00% 0.17% 8.00%
58COMMUNITY UNIT SCHOOL
DISTRICT 205 ELMHURSTEducation $89,772,913 $103,565,323 $41,632,544 $19,127,126 54.06% 2.50% 2.50% 2.80% 10.90%
59COMMUNITY UNIT SCHOOL
DISTRICT 220 BARRINGTON Education $92,460,540 $122,914,974 $28,033,690 $8,213,125 70.70% 4.50% 4.00% 1.60% 4.50%
60CONSOLIDATED HIGH SCHOOL 230
ORLAND PARKEducation $69,632,166 $121,158,441 $36,024,527 $24,612,664 31.68% 7.50% 4.00% 0.00% 9.00%
61COUNTRY CLUB HILLS PARK
DISTRICT Park $4,562,236 $1,931,166 $0 $0 #VALUE! 0.00% 0.00% 0.00% 0.00%
62 COUNTY OF COOK County $6,599,732,917 $2,942,825,481 $12,023,222,885 $4,040,854,226 66.39% 7.50% 5.00% 0.00% 8.00%
63 CRESTWOOD LIBRARY DISTRICT Library $14,228 $534,276 $421,849 $67,452 84.01% 7.50% 4.00% 0.00% 0.00%
64 DEERFIELD PARK DISTRICT Park $11,634,349 $14,245,824 $8,742,374 $1,952,637 77.66% 7.50% 4.00% 0.40% 0.00%
65 DES PLAINES PARK DISTRICT Park $14,821,655 $13,677,437 $7,704,675 $3,145,882 59.17% 7.50% 3.00% 100.00% 8.00%
66 DES.PL.VALL.MOSQUITO DIST Lyons Special $1,342,568 $1,321,538 $1,733,973 $37,818 97.82% 7.50% 0.40% 0.00% 10.00%
67 DOLTON PARK DISTRICT Park $1,380,013 $1,861,103 $561,279 $78,892 85.94% 7.50% 4.00% 0.00% 0.00%
68 DUNDEE TWN PARK DISTRICT Park $32,763,697 $29,358,085 $9,449,818 $2,258,357 76.10% 0.00% 0.00% 0.00% 0.00%
69DUPAGE COLLEGE DIST 502 GLEN
ELLYN Classes in Roselle, Burr RidgeEducation $314,955,759 $151,726,091 $48,107 $12,013,103 -24871.63% 5.00% 5.00% 2.00% 0.00%
70DUPAGE WATER COMMISSION
ElmhurstSpecial $152,313,078 $63,080,982 $5,873,738 $1,731,265 70.53% 7.50% 4.00% 3.00% 8.00%
71 E DUNDEE-CNTRYSIDE FIRE Fire $1,587,083 $1,940,164 $2,056,645 $877,787 57.32% 1.00% 2.00% 0.00% 1.00%
72 EAST HAZELCREST LIBRARY Library $0 $84,145 $0 $0 #VALUE! 0.00% 0.00% 0.00% 0.00%
73EISENHOWE PUBLIC LIBRARY DIST
HARWOOD HEIGHTS Library $9,024,258 $4,542,863 $2,754,554 $178,156 93.53% 7.50% 4.00% 0.00% 0.00%
74 ELGIN COLLEGE DISTRICT 509 Education $235,264,499 $76,126,570 $0 $0 #VALUE! 0.00% 0.00% 0.00% 0.00%
75 ELK GROVE PARK DISTRICT Park $24,994,804 $20,633,990 $11,912,954 $2,329,210 80.45% 7.50% 4.00% 0.00% 8.00%
76ELK GROVE RURAL FIRE
PROTECTION DISTRICTFire $12,753 $2,265,750 $0 $0 #VALUE! 0.00% 0.00% 0.00% 0.00%
77 ELMHURST PARK DISTRICT Park $19,188,602 $13,129,305 $10,984,902 $2,557,006 76.72% 7.50% 4.00% 0.00% 8.00%
78EVANSTON TOWNSHIP HIGH
SCHOOL 202 Education $54,968,112 $72,718,807 $27,550,967 $6,729,613 75.57% 7.50% 4.00% 0.40% 8.00%
79 FOREST PARK PARK DISTRICT Park $4,275,352 $3,601,255 $661,927 $661,927 0.00% 7.50% 10.00% 0.00% 0.00%
80 FOREST PRESERVE DISTRICT County $231,197,671 $84,757,135 $295,980,106 $111,902,590 62.19% 7.50% 5.00% 0.00% 8.00%
81FOREST RIV ST.LIGHT DIST (MT
PROSPECT)Special $627 $22,553 $0 $0 #VALUE! 0.00% 0.00% 0.00% 0.00%
82FOREST RIVER FIRE PROTECTION
DISTRICTFire $22,593 $50,058 $0 $0 #VALUE! 0.00% 0.00% 0.00% 0.00%
83 FOREST VIEW PARK DISTRICT Park $12,564 $150,803 $0 $0 #VALUE! 0.00% 0.00% 0.00% 0.00%
84FOX RIVER WATER RECLAMATION
DISTRICT ELGINSanitary $6,363,868 $8,891,472 $9,278,983 $4,973,640 46.40% 5.00% 5.00% 5.00% 6.00%
85 FRANKFORT PARK DISTRICT Park $952,049 $2,690,000 $554,792 $325,807 41.27% 7.50% 4.00% 58.00% 0.00%
86FRANKFORT PUBLIC LIBRARY
DISTRICTLibrary $589,315 $2,212,830 $1,323,865 $592,774 55.22% 7.50% 4.00% 0.00% 0.00%
87FRANKFORT SQUARE PARK
DISTRICTPark $9,365,203 $4,154,472 $0 $0 #VALUE! 0.00% 0.00% 0.00% 0.00%
88 FRANKLIN PARK PARK DIST Park $2,840,589 $4,896,531 $3,225,839 $440,084 86.36% 7.50% 4.00% 4.00% 0.00%
89GAIL BORDEN LIBRARY DIST
(ELGIN)Library $23,709,389 $13,180,834 $11,099,447 $4,327,820 61.01% 7.50% 4.00% 0.00% 0.00%
90GARDEN HOME FIRE DISTRICT
(ALSIP)Fire $293,189 $126,355 $0 $0 #VALUE! 0.00% 0.00% 0.00% 0.00%
91 GARDEN HOMES SANITARY DIST. Sanitary $1,621,102 $2,303,788 $0 $0 #VALUE! 0.00% 0.00% 0.00% 0.00%
92GLENBROOK FIRE DISTRICT
GlenviewFire $3,504,972 $2,875,472 $0 $0 #VALUE! 0.00% 0.00% 0.00% 0.00%
93GLENBROOK SANITARY DISTRICT
(Northbrook) Sanitary $27,255 $247,500 $0 $0 #VALUE! 0.00% 0.00% 0.00% 0.00%
94 GLENCOE PARK DISTRICT Park $13,673,577 $8,455,636 $5,940,296 $2,594,220 56.33% 7.50% 4.00% 0.50% 0.00%
95 GLENVIEW PARK DISTRICT Park $61,787,416 $32,114,777 $18,599,973 $4,654,026 74.98% 7.50% 4.00% 3.00% 0.00%
96 GLENWOOD LYNWOOD LIBRARY Library $7,514,298 $1,918,700 $770,268 $208,635 72.91% 7.50% 4.00% 100.00% 0.00%
97 GOLF MAINE PARK DISTRICT NILES Park $1,425,059 $1,106,800 $637,974 $399,218 37.42% 7.50% 4.00% 0.00% 0.00%
98GRANDE PRAIRIE LIBRARY (HAZEL
CREST)Library $797,795 $1,949,220 $1,351,392 $457,152 66.17% 7.50% 10.00% 3.00% 0.00%
99GREEN HILLS LIBRARY DIST (PALOS
HILLS)Library $5,534,857 $2,285,713 $1,670,953 $401,807 75.95% 7.50% 4.00% 0.07% 8.00%
100HANOVER PARK FIRE PROTECTION
DISTRICTFire $42,445,682 $65,907,386 $73,428,871 $29,368,756 60.00% 7.50% 3.00% 0.75% 8.00%
101 HANOVER PARK PARK DISTRICT Park $6,457,877 $441,471 $3,328,070 $917 99.97% 7.50% 4.00% 0.00% 0.00%
102HARPER COLLEGE DIST 512
PALATINEEducation $259,441,374 $108,902,007 $15,063,432 $15,063,432 0.00% 5.00% 5.00% 5.00% 8.00%
103 HARVEY PARK DISTRICT Park $6,687,464 $1,300,339 $81,015 $0 100.00% 0.00% 0.00% 0.00% 6.00%
104HAWTHORNE PARK DISTRICT
CICEROPark $1,315,695 $880,155 $0 $0 #VALUE! 0.00% 0.00% 0.00% 0.00%
Öage Î6 of 38

Count Agency Name Agency Type
Total Debts And Liabilities
Gross Operating Budget Revenue
Total Pension Liability
Total Unfunded Pension Liability % Funded
Investment Rate Of Return
Annual Rate Of Salary
Increases
Participant Mortality
Rate
Health Care Cost Trend
Rate
105 HAZELCREST PARK DISTRICT Park $2,876,138 $1,460,485 $1,070,496 $227,997 78.70% 7.50% 6.00% 0.73% 0.00%
106 HICKORY HILLS PARK DIST Park $3,855,569 $1,598,112 $1,411,373 $578,893 58.98% 7.50% 3.10% 0.00% 0.00%
107HIGH SCHOOL DISTRICT 200 OAK
PARKEducation $60,382,163 $74,996,762 $21,448,496 $6,653,939 68.98% 7.50% 4.00% 0.00% 5.00%
108HIGH SCHOOL DISTRICT 208
RIVERSIDEEducation $67,946,662 $19,237,246 $215,467 $587,893 -172.85% 7.50% 4.00% 3.00% 8.00%
109HIGH SCHOOL DISTRICT 214
ARLINGTON HTSEducation $64,559,184 $230,500,000 $111,984,450 $52,827,254 52.83% 5.00% 3.00% 0.10% 8.00%
110HIGH SCHOOL DISTRICT 217
SUMMITEducation $30,887,340 $28,943,056 $8,185,467 $2,051,063 74.94% 7.50% 4.00% 0.00% 3.00%
111HIGH SCHOOL DISTRICT 218 OAK
LAWNEducation $82,324,918 $93,716,610 $33,314,529 $17,025,883 48.89% 7.50% 4.00% 0.17% 6.00%
112 HIGH SCHOOL DISTRICT 219 SKOKIE Education $198,025,058 $157,984,115 $29,070,810 $12,720,308 56.24% 7.50% 4.00% 0.00% 0.00%
113HIGH SCHOOL DISTRICT 220
BURBANKEducation $14,537,575 $28,009,001 $7,729,667 $2,600,187 66.36% 7.50% 4.00% 1.00% 4.00%
114HIGH SCHOOL DISTRICT 225
GLENVIEWEducation $119,840,000 $104,102,810 $42,492,644 $19,910,234 53.14% 5.00% 5.00% 2.00% 8.00%
115HIGH SCHOOL DISTRICT 229 OAK
LAWNEducation $5,285,851 $25,160,212 $8,873,637 $3,539,429 60.11% 7.50% 4.00% 0.17% 9.00%
116HIGH SCHOOL DISTRICT 231
EVERGREEN PARKEducation $1,531,325 $13,139,984 $3,335,806 $662,880 80.13% 7.50% 4.00% 0.17% 8.00%
117HIGH SCHOOL DISTRICT 233
FLOSSMOOREducation $16,046,289 $48,262,038 $0 $0 #VALUE! 0.00% 0.00% 0.00% 0.00%
118HIGH SCHOOL DISTRICT 234
NORRIDGEEducation $42,678,132 $15,729,853 $2,875,475 $0 100.00% 7.50% 4.00% 0.00% 0.00%
119HINSDALE TOWNSHIP HIGH
SCHOOL 86Education $50,194,885 $80,656,916 $35,893,308 $23,146,716 35.51% 2.00% 2.00% 2.00% 8.00%
120 HODGKINS PARK DISTRICT Park $639,272 $1,322,339 $1,347,648 $278,066 79.37% 7.50% 4.00% 0.04% 0.00%
121HODGKINS PUBLIC LIBRARY
DISTRICTLibrary $0 $471,500 $266,339 $128,358 51.81% 7.50% 4.00% 0.04% 0.00%
122 HOFFMAN ESTATES FIRE DIST 1 Fire $0 $68,000 $0 $0 #VALUE! 0.00% 0.00% 0.00% 0.00%
123 HOFFMAN ESTATES PARK DIST Park $98,675,830 $18,410,467 $10,218,602 $1,208,418 88.17% 7.50% 4.00% 4.00% 4.00%
124HOLBROOK FIRE PROTECTION
DISTRICT CHICAGO HEIGHTSFire $10,927 $11,068 $0 $0 #VALUE! 0.00% 0.00% 0.00% 0.00%
125HOMEWOOD FLOSSMOOR PARK
DISTRICTPark $21,078,307 $13,970,423 $8,904,398 $3,983,362 55.27% 7.50% 4.00% 0.05% 5.00%
126 HOMEWOOD PUBLIC LIBRARY Library $1,266,229 $1,800,000 $2,878,371 $941,918 67.28% 7.50% 4.00% 0.00% 0.00%
127INDIAN PRAIRIE LIBRARY DISTRICT
DARIENLibrary $4,631,912 $3,818,228 $3,108,068 $1,308,956 57.89% 7.50% 4.00% 0.00% 0.00%
128INDIAN TRAILS PUBLIC LIBRARY
DIST WHEELINGLibrary $297,098 $6,040,002 $5,871,678 $1,511,724 74.25% 7.50% 4.00% 0.07% 0.00%
129 INVERNESS PARK DISTRICT Park $710,660 $542,901 $0 $0 #VALUE! 0.00% 0.00% 0.00% 0.00%
130 IVANHOE PARK DISTRICT Park $5,616 $510,947 $0 $0 #VALUE! 0.00% 0.00% 0.00% 0.00%
131JOLIET COMMUNITY COLLEGE DIST
Campus in FrankfortEducation $207,163,000 $80,431,500 $0 $0 #VALUE! 0.00% 0.00% 0.00% 0.00%
132 JUSTICE PUBLIC LIBRARY DIST Library $15,995 $319,450 $554,800 $137,317 75.25% 7.50% 4.00% 0.00% 0.00%
133 KENILWORTH LIBRARY DIST Library $130,816 $259,320 $0 $0 #VALUE! 0.00% 0.00% 0.00% 0.00%
134 KENILWORTH PARK DISTRICT Park $411,129 $555,588 $869,706 $218,657 74.86% 7.50% 4.00% 2.00% 7.00%
135KIMBERLY HEIGHTS SANITARY
DISTRICT TINLEY PARKSanitary $0 $64,637 $0 $0 #VALUE! 0.00% 0.00% 0.00% 0.00%
136LA GRANGE HIGHLANDS SANITARY
DISTRICTSanitary $1,413,130 $1,753,000 $1,249,981 $173,661 86.11% 7.50% 4.00% 0.04% 0.00%
137 LA GRANGE PARK DISTRICT Park $11,613,275 $3,948,576 $1,999,639 $414,955 79.25% 7.50% 4.00% 0.00% 0.00%
138LA GRANGE PARK PUBLIC LIBRARY
DISTLibrary $3,121,538 $1,461,498 $1,855,151 $423,183 77.19% 7.50% 4.00% 0.00% 0.00%
139 LAN OAK PARK DISTRICT Park $3,581,700 $2,552,299 $1,113,625 $177,132 84.09% 7.50% 4.00% 0.00% 0.00%
140 LEMONT FIRE PROTECT. DIST. Fire $14,856,440 $13,229,356 $16,829,661 $6,317,758 62.46% 7.00% 5.50% 2.00% 6.00%
141 LEMONT HIGH SCHOOL DIST 210 Education $48,975,498 $24,440,445 $2,195,494 $2,195,494 0.00% 3.50% 0.00% 0.00% 7.67%
142 LEMONT PARK DISTRICT Park $18,893,043 $6,769,749 $2,084,647 $1,422,505 31.76% 7.50% 2.50% 5.00% 0.00%
143 LEMONT PUBLIC LIBRARY DIST Library $3,903,362 $1,524,069 $1,085,988 $453,938 58.20% 7.50% 4.00% 0.63% 0.00%
144LEYDEN FIRE PROTECTION
DISTRICT FRANKLIN PARKFire $1,492,827 $2,741,084 $11,306,121 $5,224,835 53.79% 7.00% 5.50% 1.00% 0.00%
145 LINCOLNWOOD LIBRARY DIST Library $1,010,390 $2,354,855 $0 $0 #VALUE! 0.00% 0.00% 0.00% 0.00%
146LONG GROVE FIRE PROTECTION
DISTFire $4,318,962 $4,091,350 $3,643,620 $247,647 93.20% 9.28% 4.40% 0.53% 6.00%
147 LYONS TWN HIGH SCHOOL 204 Education $38,484,280 $58,324,985 $34,070,956 $7,494,429 78.00% 7.50% 4.00% 0.00% 3.00%
148MAINE TOWNSHIP HIGH SCHOOL
207 PARK RIDGE Education $77,538,230 $140,003,718 $43,655,474 $10,788,938 75.29% 7.50% 4.00% 30.00% 8.00%
149 MAYWOOD PUBLIC LIBRARY Library $1,608,041 $5,867,489 $1,797,558 $288,332 83.96% 7.50% 4.00% 0.00% 0.00%
150 MC COOK PARK DISTRICT Park $565,000 $497,661 $218,600 $137,196 37.24% 7.50% 4.00% 0.05% 3.00%
151 MC COOK PUBLIC LIBRARY DIS Library $1,504,140 $1,403,410 $245,415 $96,100 60.84% 7.50% 4.00% 0.00% 0.00%
152MEMORIAL PARK DISTRICT
BELLWOODPark $7,736,953 $3,630,750 $4,069,857 $902,762 77.82% 7.50% 4.00% 0.32% 0.00%
153METRO WATER RECLAMATION DIST
OF GR CHICAGOCounty $3,117,851,000 $1,040,949,849 $2,495,995,098 $1,343,601,892 46.17% 7.75% 5.00% 0.38% 8.50%
154 MIDLOTHIAN PARK DISTRICT Park $315,198 $1,601,095 $418,598 $168,606 59.72% 7.50% 4.00% 0.17% 0.00%
155MISSION BRK SANITARY DIST
(NORTHBROOK)Sanitary $671,244 $293,460 $0 $0 #VALUE! 0.00% 0.00% 0.00% 0.00%
Öage Î7 of 38
Count Agency Name Agency Type
Total Debts And Liabilities
Gross Operating Budget Revenue
Total Pension Liability
Total Unfunded Pension Liability % Funded
Investment Rate Of Return
Annual Rate Of Salary
Increases
Participant Mortality
Rate
Health Care Cost Trend
Rate
156 MOKENA COMMUNITY PARK DIST Park $3,927,337 $4,005,024 $1,344,199 $466,651 65.28% 7.50% 4.00% 0.00% 0.00%
157 MOKENA FIRE PROTECT. DIST. Fire $7,847,944 $5,501,505 $5,326,573 $1,731,902 67.49% 7.00% 5.50% 0.00% 0.00%
158MORAINE VALLEY COMM COLL DIST
524 PALOS HILLSEducation $116,333,993 $79,906,515 $0 $0 #VALUE! 0.00% 0.00% 0.00% 0.00%
159MORTON COLLEGE DIST 527
CICEROEducation $16,407,272 $36,576,534 $205,920 $0 100.00% 0.00% 0.00% 0.00% 0.00%
160 MORTON GROVE PARK DIST Park $1,249,701 $4,680,190 $5,125,448 $2,059,578 59.82% 7.00% 3.00% 5.00% 6.00%
161 MT PROSPECT PARK DISTRICT Park $19,532,725 $17,072,238 $14,284,102 $2,731,271 80.88% 7.50% 4.00% 0.40% 9.00%
162NANCY L MCCONATHY PUBLIC
LIBRARY DIST SAUL VILLAGELibrary $901,995 $399,107 $392,768 $123,600 68.53% 7.50% 4.00% 43.00% 0.00%
163NEW TRIER TOWNSHIP HIGH
SCHOOL 203 NORTHFIELD Education $76,138,243 $92,809,679 $35,170,212 $11,762,829 66.55% 4.50% 4.00% 0.09% 5.00%
164 NILES PARK DISTRICT Park $16,819,014 $10,417,490 $41,240 $41,240 0.00% 7.50% 3.00% 1.42% 0.00%
165NO.MAINE FIRE PROTECT.DIST (DES
PLAINES)Fire $336,433 $4,350,451 $22,938,193 $9,886,634 56.90% 7.00% 5.50% 2.00% 6.00%
166 NORRIDGE PARK DISTRICT Park $2,618,756 $3,692,649 $2,624,990 $69,391 97.36% 7.50% 4.00% 100.00% 8.00%
167 NORTH BERWYN PARK DIST Park $235,790 $1,903,944 $1,048,182 $149,377 85.75% 7.50% 4.00% 0.00% 0.00%
168NORTH LAKE FIRE PROTECTION
DISTRICTFire $204,017 $4,073,562 $15,862,568 $6,053,700 61.84% 5.00% 3.50% 0.00% 9.00%
169NORTH PALOS FIRE PROTECTION
DISTRICT PALOS HILLSFire $7,125,803 $6,316,631 $9,327,000 $2,485,880 73.35% 18.00% 4.00% 1.00% 5.00%
170 NORTH RIVERSIDE LIBRARY DIST Library $2,182,370 $1,307,800 $0 $0 #VALUE! 0.00% 0.00% 0.00% 0.00%
171NORTH SHORE MOSQUITO
ABATEMENT DISTRICT NORTHFIELDSpecial $0 $1,450,205 $888,260 $0 100.00% 5.00% 5.00% 0.00% 6.00%
172 NORTHBROOK PARK DISTRICT Park $24,254,581 $7,993,784 $9,331,143 $2,920,255 68.70% 7.50% 4.00% 0.50% 0.00%
173 NORTHBROOK RURAL FIRE DIST Fire $3,480,686 $5,615,282 $0 $0 #VALUE! 0.00% 0.00% 0.00% 0.00%
174 NORTHFIELD PARK DISTRICT Park $1,597,452 $1,752,613 $424,054 $88,922 79.03% 7.50% 4.00% 0.00% 0.00%
175 NORTHLAKE PUBLIC LIBRARY Library $8,762,679 $1,725,164 $1,431,436 $508,898 64.45% 7.50% 4.00% 0.07% 7.00%
176NORTHWEST HOME EQUITY
ASSURANCE CHICAGOCity $132,812 $155,000 $0 $0 #VALUE! 0.00% 0.00% 0.00% 0.00%
177NORTHWEST MOSQUITO
ABATEMENT DISTRICT WHEELINGSpecial $2,683,293 $2,508,644 $3,331,013 $598,073 82.05% 7.50% 4.00% 0.00% 6.00%
178NORW. PK.FIRE PROTECT.DIST.
Harwood HtsFire $3,631,764 $5,690,000 $25,765,118 $15,380,069 40.31% 7.00% 5.50% 1.00% 8.00%
179NORWOOD PARK STREET LIGHTING
NORWOOD PARKSpecial $0 $21,740 $0 $0 #VALUE! 0.00% 0.00% 0.00% 0.00%
180NW HOMER FIRE PROTECT.DIST
LockportFire $0 $2,640,671 $3,031,968 $699,753 76.92% 7.00% 5.00% 0.00% 0.00%
181 OAK BROOK PARK DISTRICT Park $1,211,018 $6,521,592 $2,280,980 $711,375 68.81% 7.50% 4.00% 0.00% 0.00%
182 OAK FOREST PARK DISTRICT Park $5,040,594 $4,318,053 $2,713,945 $1,343,207 50.51% 6.00% 4.00% 0.00% 3.00%
183 OAK LAWN PARK DISTRICT Park $5,929,825 $12,740,160 $6,081,579 $724,966 88.08% 7.50% 4.00% 3.00% 7.00%
184 OAK PARK PARK DISTRICT Park $0 $11,933,917 $5,823,807 $1,017,487 82.53% 7.50% 4.00% 6.00% 8.00%
185OAKTON COLLEGE DISTRICT
SKOKIE DESPLAINESEducation $11,843,837 $131,295,380 $0 $0 #VALUE! 0.00% 0.00% 0.00% 0.00%
186OLD TOWN SANITARY DISTRICT
Arlington HtsSanitary $12,253 $89,000 $379,803 $392,902 -3.45% 0.00% 0.00% 0.00% 0.00%
187 OLYMPIA FIELDS PARK DIST Park $2,295,244 $3,202,735 $178,995 $222,923 -24.54% 7.50% 4.00% 0.00% 0.00%
188OLYMPIA GDNS FIRE DIST. Chicago
HeightsFire $12,300 $22,000 $0 $0 #VALUE! 0.00% 0.00% 0.00% 0.00%
189 ORLAND FIRE PROTECT.DIST. Fire $32,275,069 $27,716,012 $78,216,004 $23,112,512 70.45% 7.00% 5.00% 0.45% 5.00%
190 ORLAND HILLS LIBRARY DIST. Library $83,305 $186,400 $0 $0 #VALUE! 0.00% 0.00% 0.00% 0.00%
191 PALATINE PARK DISTRICT Park $27,618,591 $22,407,850 $15,416,410 $3,309,452 78.53% 7.50% 4.00% 110.00% 0.00%
192 PALATINE PUBLIC LIBRARY Library $2,288,445 $7,321,819 $8,186,789 $1,782,128 78.23% 5.00% 5.00% 0.17% 8.00%
193PALATINE RURAL FIRE
PROTECTION DISTRICTFire $4,369,378 $3,739,159 $8,491,753 $2,326 99.97% 7.00% 5.50% 1971.00% 6.00%
194PALATINE TOWNSHIP HIGH
SCHOOL 211Education $142,120,296 $226,129,000 $133,758,632 $64,307,478 51.92% 7.50% 4.00% 5.00% 6.00%
195 PALOS FIRE PROTECT. DIST. Fire $125,719 $6,055,202 $9,703,570 $2,300,042 76.30% 7.00% 5.50% 0.53% 8.00%
196 PALOS HTS.FIRE PROT. DIST. Fire $3,183,143 $3,006,000 $7,615 $2,480,994 -32480.35% 7.00% 5.50% 2.00% 6.00%
197 PARK DIST OF LAGRANGE PARK Park $2,569,507 $1,691,700 $0 $214,918 #VALUE! 7.50% 4.00% 100.00% 0.00%
198PARK RIDGE RECREATION AND
PARK DISTPark $9,680,702 $10,733,335 $0 $2,626,484 #VALUE! 8.00% 3.00% 0.00% 3.00%
199 PHOENIX PARK DISTRICT Park $0 $23,311 $0 $0 #VALUE! 0.00% 0.00% 0.00% 0.00%
200
PLEASANT VIEW FIRE DIST
(LaGrange Highlands, Burr Ridge,
Hodgkins)
Fire $12,648,296 $11,429,077 $48,413,773 $24,722,560 48.93% 6.74% 4.79% 0.50% 10.75%
201PLUM GROVE WOODLANDS
SANITARY DISTRICT PALATINESanitary $27,967 $60,825 $0 $0 #VALUE! 0.00% 0.00% 0.00% 0.00%
202POPLAR CREEK PUBLIC LIBRARY
DISTRICT STREAMWOODLibrary $22,108,824 $5,193,590 $5,941,792 $1,365,698 77.02% 7.50% 4.00% 0.00% 0.00%
203PRAIRIE STATE COMM COLLEGE
DISTRICT 515 CHICAGO HEIGHTS Education $27,366,097 $4,216,561 $3,398,259 $0 100.00% 7.75% 2.75% 0.53% 0.00%
Öage Î8 of 38
Count Agency Name Agency Type
Total Debts And Liabilities
Gross Operating Budget Revenue
Total Pension Liability
Total Unfunded Pension Liability % Funded
Investment Rate Of Return
Annual Rate Of Salary
Increases
Participant Mortality
Rate
Health Care Cost Trend
Rate
204PRAIRIE TRAILS PUBLIC LIBRARY
DISTRICT BURBANKLibrary $70,911 $3,420,000 $1,674,099 $435,442 73.99% 7.50% 4.00% 0.00% 0.00%
205PROSPECT HEIGHTS FIRE
PROTECTION DISTRICTFire $1,033,399 $4,108,836 $1,616,289 $0 100.00% 7.00% 5.50% 0.00% 0.00%
206 PROSPECT HEIGHTS PARK DIST Park $12,973,984 $4,514,086 $2,359,142 $403,553 82.89% 7.50% 4.00% 0.00% 0.00%
207PROSPECT HEIGHTS PUBLIC
LIBRARY DISTRICTLibrary $199,105 $2,898,347 $2,400,254 $522,394 78.24% 7.50% 4.00% 0.00% 0.00%
208RICH TOWNSHIP HIGH SCHOOL 227
OLYMPIA FIELDS Education $55,033,931 $60,929,169 $16,534,923 $4,103,595 75.18% 7.50% 4.00% 0.00% 0.00%
209RICHTON PARK PUBLIC LIBRARY
DISTRICTLibrary $408,708 $992,100 $422,248 $528,550 -25.18% 7.50% 4.00% 0.00% 0.00%
210 RIDGEVILLE PARK DISTRICT Park $68,305 $640,990 $646,537 $49,820 92.29% 7.50% 4.00% 0.00% 0.00%
211 RIVER FOREST PARK DIST Park $315,707 $3,068,863 $1,026,203 $121,145 88.19% 7.50% 4.00% 0.00% 0.00%
212 RIVER GROVE PUB LIB DIST Library $34,095 $508,425 $395,364 $170,354 56.91% 7.50% 4.00% 0.00% 0.00%
213RIVER TRAILS PARK DIST
PROSPECT HEIGHTSPark $8,384,217 $5,719,408 $173,911 $787,726 -352.95% 7.50% 4.00% 0.00% 0.00%
214 RIVERDALE PUBLIC LIBRARY Library $13,545 $646,000 $1,852,736 $67,919 96.33% 7.50% 4.00% 43.00% 0.00%
215 ROLLING MEADOWS PARK DIST Park $3,665,297 $7,669,140 $6,000,648 $2,245,278 62.58% 5.00% 5.00% 0.00% 6.00%
216 ROSELLE PUBLIC LIBRARY Library $1,780,252 $1,765,468 $2,469,872 $870,285 64.76% 7.50% 4.00% 0.00% 0.00%
217 ROSEMONT PARK DISTRICT Park $1,443,953 $1,612,386 $592,027 $497,459 15.97% 7.50% 4.00% 0.00% 0.00%
218S COOK MOSQUITO ABATEMENT
HarveySpecial $1,707,292 $2,529,053 $2,949,175 $843,933 71.38% 7.00% 5.00% 100.00% 0.00%
219SALT CREEK RURAL PARK DIST
PALATINEPark $5,126,807 $3,427,232 $1,889,195 $249,927 86.77% 7.50% 4.00% 0.00% 0.00%
220 SCH DISTRICT 35 GLENCOE Education $32,743,329 $23,521,828 $1,866,813 $1,866,813 0.00% 0.50% 5.50% 1.25% 4.50%
221 SCH DISTRICT 36 - WINNETKA Education $64,872,560 $40,781,544 $8,728,742 $2,190,716 74.90% 7.50% 4.00% 2.00% 6.00%
222 SCH DISTRICT 37 WILMETTE Education $17,053,744 $15,810,299 $3,916,238 $317,715 91.89% 7.50% 4.00% 0.00% 11.00%
223 SCH DISTRICT 38 KENILWORTH Education $10,760,000 $11,974,350 $931,276 $232,758 75.01% 7.50% 3.50% 1.00% 12.00%
224 SCH DISTRICT 39 WILMETTE Education $18,780,000 $55,420,269 $643,856 $89,855 86.04% 7.50% 4.00% 0.00% 7.80%
225 SCHAUMBURG PARK DISTRICT Park $58,675,659 $34,050,858 $18,669,095 $4,758,004 74.51% 7.50% 4.00% 0.00% 0.00%
226 SCHAUMBURG TWP LIBRARY Library $10,686,900 $14,685,350 $0 $0 #VALUE! 0.00% 0.00% 0.00% 0.00%
227SCHOOL DIST 21 WHEELING COMM
CONSOLIDATEDEducation $90,563,739 $111,640,701 $24,991,734 $10,508,767 57.95% 7.50% 4.00% 0.00% 0.00%
228 SCHOOL DIST 23 PROSPECT HTS Education $3,633,389 $20,381,755 $0 $0 #VALUE! 0.00% 0.00% 0.00% 0.00%
229 SCHOOL DISTRICT 100 BERWYN Education $47,091,729 $35,676,020 $722,912 $722,912 0.00% 5.00% 5.00% 0.00% 8.00%
230SCHOOL DISTRICT 101 WESTERN
SPRINGSEducation $17,251,833 $1,376,300 $2,299,406 $1,173,669 48.96% 7.50% 4.00% 0.00% 3.00%
231SCHOOL DISTRICT 102 LAGRANGE
PARKEducation $47,602,346 $3,015,598 $7,406,093 $2,120,001 71.37% 7.50% 4.00% 0.00% 3.00%
232 SCHOOL DISTRICT 103 LYONS Education $20,573,808 $25,358,756 $7,606,325 $4,422,612 41.86% 7.50% 4.00% 0.00% 3.00%
233 SCHOOL DISTRICT 105 LAGRANGE Education $43,171,825 $19,541,105 $4,152,207 $1,314,439 68.34% 7.50% 4.00% 0.00% 3.00%
234SCHOOL DISTRICT 106 LAGRANGE
HIGHLANDSEducation $11,077,200 $11,271,825 $3,727,831 $1,269,414 65.95% 7.50% 4.00% 0.00% 3.00%
235SCHOOL DISTRICT 107 BURR
RIDGEEducation $18,093,206 $10,966,236 $1,963,435 $608,056 69.03% 7.50% 4.00% 0.00% 3.00%
236SCHOOL DISTRICT 109 INDIAN
SPRINGS JUSTICEEducation $21,113,945 $28,793,655 $2,146,801 $7,269,299 -238.61% 7.50% 4.00% 0.00% 3.00%
237SCHOOL DISTRICT 110 CENTRAL
STICKNEY Education $7,431 $4,735,685 $1,297,289 $55,803 95.70% 7.50% 4.00% 0.00% 3.00%
238 SCHOOL DISTRICT 111 BURBANK Education $12,763,685 $41,988,576 $7,161,579 $3,171,074 55.72% 7.10% 4.00% 0.00% 0.00%
239SCHOOL DISTRICT 117 PALOS
HILLSEducation $19,966,961 $36,906,575 $0 $2,711,362 #VALUE! 5.00% 6.00% 0.05% 6.00%
240 SCHOOL DISTRICT 122 OAK LAWN Education $40,466,388 $20,602,607 $6,742,013 $4,353,274 35.43% 7.50% 4.00% 0.17% 8.00%
241 SCHOOL DISTRICT 144 MARKHAM Education $37,225,955 $34,757,173 $7,704,137 $3,519,880 54.31% 7.50% 4.00% 0.17% 9.00%
242SCHOOL DISTRICT 147 HARVEY
DIXMOOR Education $7,194,088 $23,295,726 $3,964,016 $1,583,714 60.05% 0.00% 0.00% 0.00% 0.00%
243SCHOOL DISTRICT 151 SOUTH
HOLLANDEducation $14,516,041 $17,640,548 $4,926,216 ($193,255) 103.92% 7.50% 4.00% 0.00% 3.00%
244 SCHOOL DISTRICT 152 HARVEY Education $2,970,698 $32,294,128 $0 $0 #VALUE! 0.00% 0.00% 0.00% 0.00%
245 SCHOOL DISTRICT 167 GLENWOOD Education $3,130,000 $13,073,027 $3,979,927 $692,487 82.60% 7.50% 4.00% 0.00% 0.00%
246SCHOOL DISTRICT 169 FORD
HEIGHTS Education $3,585,000 $8,230,453 $4,253,023 $0 100.00% 7.50% 4.00% 0.00% 8.00%
247SCHOOL DISTRICT 170 CHICAGO
HEIGHTS Education $8,123,738 $38,742,000 $14,096,633 $3,260,179 76.87% 7.50% 4.00% 0.00% 0.00%
248 SCHOOL DISTRICT 171 LANSING Education $9,372,822 $13,456,177 $2,815,688 $904,348 67.88% 7.50% 4.00% 0.00% 0.00%
249SCHOOL DISTRICT 172 CHICAGO
HEIGHTSEducation $1,055,000 $4,772,839 $761,177 $82,589 89.15% 7.50% 4.00% 0.00% 0.00%
250 SCHOOL DISTRICT 194 STEGER Education $4,525,000 $14,920,506 $4,223,116 $967,465 77.09% 7.50% 4.00% 0.00% 0.00%
251SCHOOL DISTRICT 26 MOUNT
PROSPECTEducation $25,269,253 $21,935,398 $8,864,404 $4,194,415 52.68% 5.00% 5.00% 2.00% 6.00%
252SCHOOL DISTRICT 27
NORTHBROOKEducation $84,204 $22,922,859 $1,995,099 $1,995,099 0.00% 5.00% 5.00% 1.00% 6.00%
253SCHOOL DISTRICT 28
NORTHBROOKEducation $15,253,463 $33,092,405 $7,484,808 $4,654,520 37.81% 7.50% 4.00% 0.00% 8.00%
254SCHOOL DISTRICT 30
NORTHBROOKEducation $10,421,342 $22,879,293 $3,984,433 $915,130 77.03% 7.50% 4.00% 5.00% 8.00%
Öage Î9 of 38
Count Agency Name Agency Type
Total Debts And Liabilities
Gross Operating Budget Revenue
Total Pension Liability
Total Unfunded Pension Liability % Funded
Investment Rate Of Return
Annual Rate Of Salary
Increases
Participant Mortality
Rate
Health Care Cost Trend
Rate
255SCHOOL DISTRICT 31
NORTHBROOK Education $9,335,282 $13,386,217 $0 $0 #VALUE! 0.00% 0.00% 0.00% 0.00%
256SCHOOL DISTRICT 57 MT
PROSPECTEducation $25,208,775 $21,842,184 $11,768 $1,450,884 -12229.06% 5.00% 5.00% 0.24% 71.60%
257 SCHOOL DISTRICT 63 DES PLAINES Education $39,326,622 $44,650,207 $12,043,447 $2,687,696 77.68% 5.00% 5.00% 0.00% 6.00%
258 SCHOOL DISTRICT 78 ROSEMONT Education $4,319,168 $4,457,334 $589,899 $196,577 66.68% 2.00% 2.00% 0.00% 7.00%
259 SCHOOL DISTRICT 79 NORRIDGE Education $1,885,497 $4,766,212 $534,361 $107,208 79.94% 7.50% 4.00% 0.00% 0.00%
260SCHOOL DISTRICT 81 SCHILLER
PARK Education $36,725,331 $18,255,817 $22,602 $786,226 -3378.57% 5.00% 5.00% 0.21% 8.00%
261SCHOOL DISTRICT 83 FRANKLIN
PARKEducation $51,217,678 $51,279,170 $13,754,745 $4,192,995 69.52% 7.50% 4.00% 0.00% 0.00%
262SCHOOL DISTRICT 84 1/2 RIVER
GROVEEducation $5,011,868 $11,250,529 $3,569,112 $1,394,929 60.92% 7.50% 4.00% 0.00% 0.00%
263SCHOOL DISTRICT 84 FRANKLIN
PARK Education $9,357,340 $18,860,630 $4,922,105 $1,464,527 70.25% 7.50% 4.00% 0.00% 8.00%
264SCHOOL DISTRICT 85 1/2 RIVER
GROVEEducation $8,536,417 $7,030,312 $1,469,171 $359,309 75.54% 0.25% 2.25% 0.00% 11.00%
265 SCHOOL DISTRICT 99 CICERO Education $61,579,857 $156,270,325 $34,851,377 $12,283,636 64.75% 7.50% 4.00% 0.09% 8.62%
266 SCHOOL DISTRICT 104 SUMMIT Education $3,406,889 $17,879,015 $5,995,344 $1,488,525 75.17% 7.50% 4.00% 0.00% 3.00%
267 SCHOOL DISTRICT 123 OAK LAWN Education $56,629,161 $34,462,934 $9,660,119 $6,084,349 37.02% 7.50% 4.00% 0.17% 11.00%
268SCHOOL DISTRICT 124 EVERGREEN
PARKEducation $20,154,476 $20,199,161 $7,503,519 $3,474,454 53.70% 7.50% 4.00% 0.17% 8.62%
269 SCHOOL DISTRICT 125 ALSIP Education $4,764,517 $6,158,628 $2,494,322 $1,427,393 42.77% 7.50% 4.00% 0.17% 8.00%
270 SCHOOL DISTRICT 126 ALSIP Education $7,102,880 $27,387,661 $7,141,985 $2,982,706 58.24% 7.50% 4.00% 3.00% 5.00%
271SCHOOL DISTRICT 127 1/2 CHICAGO
RIDGEEducation $7,635,000 $6,612,385 $1,569,328 $643,363 59.00% 7.50% 4.00% 0.17% 8.00%
272 SCHOOL DISTRICT 127 WORTH Education $6,675,236 $8,887,390 $3,904,578 $866,298 77.81% 7.50% 4.00% 0.17% 9.50%
273SCHOOL DISTRICT 128 PALOS
HEIGHTSEducation $5,311,258 $8,086,251 $27,044,494 $1,047,015 96.13% 7.50% 4.00% 0.17% 8.00%
274SCHOOL DISTRICT 130 BLUE
ISLANDEducation $14,487,659 $40,921,531 $21,282,006 $11,737,960 44.85% 7.50% 4.00% 0.17% 9.50%
275SCHOOL DISTRICT 132 CALUMET
PARKEducation $5,012,554 $12,461,909 $1,472,532 $0 100.00% 7.50% 4.00% 0.00% 0.00%
276 SCHOOL DISTRICT 133 RIVERDALE Education $1,240,000 $6,022,478 $1,093,628 $5,715 99.48% 7.50% 4.00% 0.00% 0.00%
277SCHOOL DISTRICT 135 ORLAND
PARKEducation $71,646,382 $75,266,698 $311,047 $1,861,019 -498.31% 5.00% 0.00% 0.00% 9.00%
278 SCHOOL DISTRICT 140 TINLEY PARK Education $36,087,924 $45,131,300 $380,000 $8,448,115 -2123.19% 5.00% 5.00% 0.12% 8.00%
279SCHOOL DISTRICT 142 FOREST
RIDGE OAK FORESTEducation $12,399,834 $15,996,128 $3,165,839 $2,470,863 21.95% 7.50% 4.00% 0.17% 8.00%
280SCHOOL DISTRICT 143 1/2 POSEN
ROBBINSEducation $5,400,952 $17,925,883 $3,643,749 $353,002 90.31% 7.50% 4.00% 0.17% 3.00%
281 SCHOOL DISTRICT 143 MIDLOTHIAN Education $1,875,000 $18,275,300 $5,472,703 $1,407,674 74.28% 7.50% 4.00% 0.17% 3.00%
282 SCHOOL DISTRICT 145 OAK FOREST Education $28,514,207 $16,129,438 $5,281,565 $7,618,326 -44.24% 7.50% 4.00% 0.17% 11.00%
283SCHOOL DISTRICT 148 DOLTON
RIVERDALEEducation $35,731,706 $36,942,058 $11,233,790 $11,233,790 0.00% 4.00% 0.00% 0.00% 0.00%
284SCHOOL DISTRICT 150 SOUTH
HOLLANDEducation $4,895,000 $11,499,800 $0 $0 #VALUE! 0.00% 0.00% 0.00% 0.00%
285SCHOOL DISTRICT 152 1/2 HAZEL
CRESTEducation $3,681,103 $15,616,181 $0 $0 #VALUE! 0.00% 0.00% 0.00% 0.00%
286 SCHOOL DISTRICT 153 HOMEWOOD Education $15,694,530 $24,038,540 $1,038,164 $1,038,164 0.00% 5.00% 5.00% 0.18% 6.00%
287SCHOOL DISTRICT 154 1/2
BURNHAMEducation $420,076 $2,125,518 $609,000 $79,354 86.97% 7.50% 4.00% 0.00% 0.00%
288 SCHOOL DISTRICT 154 THORNTON Education $1,862,358 $2,808,730 $27,517 $70,365 -155.71% 7.50% 4.00% 0.00% 3.00%
289SCHOOL DISTRICT 155 CALUMET
CITYEducation $25,070,826 $13,135,703 $3,763,538 $1,207,580 67.91% 7.50% 4.00% 0.00% 0.00%
290SCHOOL DISTRICT 156 CALUMET
CITYEducation $4,938,837 $11,718,191 $2,541,099 $929,168 63.43% 7.50% 4.00% 0.00% 8.00%
291SCHOOL DISTRICT 157 CALUMET
CITYEducation $9,408,393 $11,971,243 $2,336,769 $479,137 79.50% 7.50% 4.00% 0.00% 0.00%
292SCHOOL DISTRICT 157-C
FRANKFORTEducation $59,020,507 $29,333,373 $3,778,061 $1,101,875 70.83% 7.50% 4.00% 2.00% 3.00%
293 SCHOOL DISTRICT 158 LANSING Education $6,959,682 $32,748,877 $12,755,078 $4,402,315 65.49% 7.50% 4.00% 0.00% 9.52%
294 SCHOOL DISTRICT 159 MATTESON Education $36,336,034 $26,373,521 $3,507,906 $1,120,404 68.06% 7.50% 4.00% 0.00% 0.00%
295SCHOOL DISTRICT 160 COUNTRY
CLUB HILLSEducation $12,271,553 $17,152,651 $3,229,534 $502,989 84.43% 7.50% 4.00% 0.17% 3.00%
296SCHOOL DISTRICT 161 CHICAGO
HEIGHTSEducation $1,311,167 $27,241,750 $6,339,830 $1,349,910 78.71% 7.50% 4.00% 0.00% 8.62%
297 SCHOOL DISTRICT 162 MATTESON Education $57,052,557 $39,976,724 $371,566 $1,686,805 -353.97% 0.20% 3.00% 2.00% 6.00%
298SCHOOL DISTRICT 163 PARK
FOREST Education $20,645,000 $22,165,788 $5,367,333 $784,779 85.38% 7.50% 4.00% 0.00% 0.00%
299SCHOOL DISTRICT 25 ARLINGTON
HEIGHTS Education $15,426,297 $58,122,251 $17,199,521 $4,674,652 72.82% 7.50% 4.00% 10.33% 8.00%
300 SCHOOL DISTRICT 29 GLENVIEW Education $8,536,971 $13,400,444 $122,479 $111,029 9.35% 7.50% 4.00% 14.81% 8.00%
301 SCHOOL DISTRICT 46 ELGIN Education $623,862,379 $419,993,025 $127,285,195 $38,887,445 69.45% 7.50% 4.00% 1.00% 5.00%
Öage 3Ì of 38

Count Agency Name Agency Type
Total Debts And Liabilities
Gross Operating Budget Revenue
Total Pension Liability
Total Unfunded Pension Liability % Funded
Investment Rate Of Return
Annual Rate Of Salary
Increases
Participant Mortality
Rate
Health Care Cost Trend
Rate
302SCHOOL DISTRICT 67 MORTON
GROVE Education $6,378,169 $9,731,241 $2,387,016 $501,196 79.00% 7.50% 4.00% 0.00% 0.00%
303 SCHOOL DISTRICT 68 SKOKIE Education $14,783,883 $33,965,913 $11,262,081 $2,484,662 77.94% 7.50% 4.00% 0.02% 6.00%
304 SCHOOL DISTRICT 69 SKOKIE Education $16,645,000 $25,990,902 $3,292,431 $427,089 87.03% 0.00% 0.00% 0.00% 0.00%
305 SCHOOL DISTRICT 70 Morton Grove Education $5,020,000 $11,800,922 $1,649,003 $72,124 95.63% 0.00% 0.00% 0.00% 0.00%
306 SCHOOL DISTRICT 71 NILES Education $475,000 $9,062,723 $1,114,299 $522,686 53.09% 0.00% 0.00% 0.00% 0.00%
307 SCHOOL DISTRICT 72 SKOKIE Education $7,410,000 $11,301,784 $2,015,922 $620,846 69.20% 7.50% 4.00% 0.00% 0.00%
308 SCHOOL DISTRICT 73 1/2 SKOKIE Education $9,118,470 $17,538,848 $4,237,421 $1,380,923 67.41% 0.00% 0.00% 0.00% 0.00%
309 SCHOOL DISTRICT 73 SKOKIE Education $2,089,079 $7,774,632 $1,138,857 $263,616 76.85% 7.50% 4.00% 0.00% 3.00%
310SCHOOL DISTRICT 74
LINCOLNWOODEducation $13,758,000 $22,794,327 $5,028,437 $1,552,069 69.13% 7.50% 4.00% 0.00% 0.00%
311 SCHOOL DISTRICT 80 NORRIDGE Education $5,744,779 $10,658,323 $2,316,718 $611,723 73.60% 7.50% 4.00% 0.00% 0.00%
312SCHOOL DISTRICT 86 HARWOOD
HEIGHTSEducation $4,840,509 $6,528,908 $2,117,940 $903,963 57.32% 7.50% 4.00% 0.00% 3.25%
313 SCHOOL DISTRICT 87 BERKELEY Education $28,242,642 $26,681,230 $8,295,596 $2,280,676 72.51% 7.50% 4.00% 0.00% 3.00%
314SCHOOL DISTRICT 89 MAYWOOD
MELROSE PARK BROADVIEWEducation $35,300,740 $65,280,456 $5,256,050 $1,406,594 73.24% 5.00% 5.00% 2.00% 8.00%
315SCHOOL DISTRICT 90 RIVER
FORESTEducation $15,430,422 $19,500,600 $4,215,470 $1,390,796 67.01% 5.00% 5.00% 0.49% 5.00%
316SCHOOL DISTRICT 91 FOREST
PARKEducation $3,333,062 $16,600,000 $5,851,344 $1,539,756 73.69% 2.50% 4.00% 0.00% 5.00%
317SCHOOL DISTRICT 92 1/2
WESTCHESTEREducation $14,430,650 $15,216,575 $3,075,846 $598,382 80.55% 7.50% 4.00% 0.00% 0.00%
318 SCHOOL DISTRICT 92 BROADVIEW Education $6,927,956 $6,597,979 $1,241,674 $368,479 70.32% 0.00% 0.00% 0.00% 0.00%
319 SCHOOL DISTRICT 93 HILLSIDE Education $6,598,994 $8,344,393 $1,089,595 $623,887 42.74% 5.00% 5.00% 2.00% 6.00%
320SCHOOL DISTRICT 94 NORTH
RIVERSIDEEducation $5,235,771 $5,293,810 $1,242,180 $312,692 74.83% 7.50% 4.00% 2.00% 3.00%
321SCHOOL DISTRICT 95 BROOKFIELD
LAGRANGEEducation $14,471,351 $10,134,853 $4,502,954 $3,044,562 32.39% 7.50% 4.00% 0.00% 11.00%
322 SCHOOL DISTRICT 96 RIVERSIDE Education $325,257 $23,149,200 $3,589,550 $1,157,448 67.76% 2.00% 2.00% 0.00% 2.00%
323 SCHOOL DISTRICT 97 OAK PARK Education $60,952,533 $60,102,782 $24,088,751 $13,877,923 42.39% 7.50% 4.00% 7.00% 7.00%
324 SCHOOL DISTRICT 98 BERWYN Education $10,818,784 $40,102,741 $6,008,501 $454,774 92.43% 0.05% 3.00% 1.00% 29.00%
325SCHOOL DISTRICT C C 108
WILLOW SPRINGSEducation $7,146,789 $4,250,950 $923,060 $203,527 77.95% 7.50% 4.00% 0.00% 3.00%
326SCHOOL DISTRICT C C 146 TINLEY
PARK Education $43,688,704 $37,205,050 $294,580 $5,090,983 -1628.22% 8.00% 4.00% 2.68% 8.00%
327SCHOOL DISTRICT C C 15
PALATINEEducation $116,761,148 $143,736,049 $79,060,625 $40,379,583 48.93% 5.00% 5.00% 2.00% 6.00%
328SCHOOL DISTRICT C C 168 SAUK
VILLAGE Education $0 $18,083,636 $3,836,324 $456,198 88.11% 7.50% 4.00% 0.00% 0.00%
329SCHOOL DISTRICT C C 181
HINSDALE WESTMONT Education $84,655,296 $59,386,015 $14,441,316 $7,578,702 47.52% 7.50% 4.00% 0.00% 3.00%
330SCHOOL DISTRICT C C 54
SCHAUMBURGEducation $122,023,627 $212,763,930 $62,778,772 $24,631,163 60.77% 7.50% 4.00% 0.00% 6.00%
331SCHOOL DISTRICT C C 59
ARLINGTON HEIGHTSEducation $69,862,683 $101,325,207 $32,742,249 $10,724,689 67.25% 7.50% 4.00% 0.00% 8.00%
332SCHOOL DISTRICT C C 62 DES
PLAINESEducation $120,521,541 $85,588,319 $19,339,447 $7,378,664 61.85% 7.50% 4.00% 0.00% 10.00%
333SCHOOL DISTRICT C C 64 PARK
RIDGE NILESEducation $51,478,444 $78,606,705 $22,845,353 $10,771,184 52.85% 5.00% 3.50% 0.00% 9.00%
334SCHOOL DISTRICT C C 65
EVANSTONEducation $53,751,469 $105,549,270 $30,741,621 $4,658,199 84.85% 5.00% 5.00% 2.00% 6.00%
335SCHOOL DISTRICT C C 180 BURR
RIDGEEducation $25,446 $11,368,636 $101,792 $376,822 -270.19% 7.50% 0.40% 0.00% 105.00%
336SCHOOL DISTRICT CC 118 PALOS
PARKEducation $15,025,669 $22,345,620 $9,957,919 $3,068,591 69.18% 7.50% 4.00% 90.00% 7.50%
337SCHOOL DISTRICT CC 34 DES
PLAINESEducation $47,798,108 $71,946,595 $12,434,234 $4,544,282 63.45% 7.50% 4.00% 0.00% 8.00%
338SCHOOL DISTRICT UNIT 300
CARPENTERSVILLE Education $459,689,148 $183,384,075 $50,111,721 $11,367,522 77.32% 7.50% 4.00% 0.00% 3.00%
339SCHOOL DISTRICT UNIT 401
ELMWOOD PARKEducation $37,962,002 $34,173,657 $8,963,283 $4,179,909 53.37% 7.50% 4.00% 0.00% 8.00%
340 SKOKIE PARK DISTRICT Park $16,875,390 $32,231,160 $12,117,302 $3,166,145 73.87% 7.50% 4.00% 0.16% 9.00%
341 SOUTH BARRINGTON PARK DIST Park $10,123,983 $3,351,149 $0 $0 #VALUE! 0.00% 0.00% 0.00% 0.00%
342SOUTH LYONS TOWNSHIP
SANITARY DISTRICT COUNTRYSIDESanitary $4,268,989 $296,441 $944,681 $917,020 2.93% 7.50% 4.00% 50.00% 5.00%
343SOUTH SUBURBAN COLLEGE DIST
SOUTH HOLLANDEducation $43,156,349 $34,439,514 $0 $0 #VALUE! 0.55% 2.00% 0.00% 0.00%
344 STEGER-S.CHIC.HTS. LIBRARY Library $602,552 $604,351 $682,735 $241,080 64.69% 7.50% 4.00% 100.00% 0.00%
345STICKNEY FOREST VIEW PUB
LIBRARY DISTLibrary $1,843,229 $1,261,805 $459,795 $385,572 16.14% 7.50% 4.00% 0.00% 0.00%
346 STREAMWOOD PARK DISTRICT Park $11,596,055 $6,049,821 $3,109,879 $1,073,936 65.47% 7.50% 4.00% 0.00% 0.00%
347 SUMMIT PARK DISTRICT Park $255,859 $1,234,965 $614,518 $261,663 57.42% 7.50% 4.00% 0.00% 0.00%
348 SUMMIT PUBLIC LIBRARY DISTRICT Library $5,519,920 $318,000 $138,581 $86,451 37.62% 7.50% 4.00% 0.00% 0.00%
349SW HOME EQUITY ASSURANCE
ChicagoCity $2,177,705 $1,120,000 $0 $0 #VALUE! 0.00% 0.00% 0.00% 0.00%
Öage 3Í of 38

Count Agency Name Agency Type
Total Debts And Liabilities
Gross Operating Budget Revenue
Total Pension Liability
Total Unfunded Pension Liability % Funded
Investment Rate Of Return
Annual Rate Of Salary
Increases
Participant Mortality
Rate
Health Care Cost Trend
Rate
350THORN CREEK BASIN SANITARY
DISTRICT CHICAGO HEIGHTSSanitary $6,935,524 $5,988,789 $5,099,723 $1,446,621 71.63% 7.50% 4.00% 0.10% 6.00%
351THORNT.FR.HIGH SCHOOL 215
CALUMET CITYEducation $17,066,379 $47,971,939 $11,235,358 $3,219,815 71.34% 0.00% 4.00% 0.00% 9.52%
352 TINLEY PARK PARK DISTRICT Park $12,699,372 $8,157,000 $3,563,954 $1,190,502 66.60% 7.50% 4.00% 0.00% 0.00%
353 TOWN NOTHFIELD Township $3,168,813 $4,100,700 $2,246,121 $239,914 89.32% 7.50% 4.00% 0.00% 0.00%
354 TOWN OF BARRINGTON Township $0 $360,000 $226,341 $0 100.00% 7.50% 4.00% 0.00% 0.00%
355 TOWN OF BERWYN Township $12,576 $311,650 $354,015 $529,842 -49.67% 7.50% 4.00% 2.00% 10.00%
356 TOWN OF BLOOM Township $1,937,721 $2,811,400 $0 $0 #VALUE! 0.00% 0.00% 0.00% 0.00%
357 TOWN OF BREMEN Township $1,920,722 $1,640,200 $493,612 $0 100.00% 7.50% 4.00% 0.00% 0.00%
358 TOWN OF CALUMET Township $579,005 $1,338,416 $828,424 $836,150 -0.93% 7.50% 4.00% 0.00% 0.00%
359 TOWN OF CICERO Township $166,622,936 $120,660,492 $254,230,637 $167,735,495 34.02% 7.00% 5.50% 2.00% 6.00%
360 TOWN OF ELK GROVE Township $66,466 $2,286,506 $22,981 $0 100.00% 7.50% 4.00% 0.00% 0.00%
361 TOWN OF EVANSTON Township $140,735 $1,902,546 $305,956 ($25,092) 108.20% 7.50% 4.00% 0.00% 0.00%
362 TOWN OF HANOVER Township $147,586 $4,693,085 $2,791,697 $1,097,354 60.69% 7.50% 6.00% 0.73% 0.00%
363 TOWN OF LEMONT Township $7,849,826 $2,537,106 $0 $351,617 #VALUE! 7.50% 4.00% 0.00% 0.00%
364 TOWN OF LEYDEN Township $4,468,513 $13,340,310 $6,186,495 $2,287,227 63.03% 0.00% 0.00% 0.00% 9.00%
365 TOWN OF LYONS Township $14,543,760 $928,031 $2,443,692 $625,543 74.40% 7.50% 4.00% 0.00% 0.00%
366 TOWN OF MAINE Township $4,554,161 $3,440,000 $17,956 $0 100.00% 3.50% 4.00% 0.00% 0.00%
367 TOWN OF NILES Township $35,085 $2,154,720 $0 $0 #VALUE! 0.00% 0.00% 0.00% 0.00%
368 TOWN OF NORWOOD PARK Township $5,502 $603,000 $425,033 $4,008 99.06% 7.50% 4.00% 0.25% 0.00%
369 TOWN OF OAK PARK Township $2,241,663 $3,665,536 $3,450,147 $450,443 86.94% 7.50% 4.00% 0.00% 3.00%
370 TOWN OF ORLAND Township $960,470 $2,419,745 $0 $0 #VALUE! 0.00% 0.00% 0.00% 0.00%
371 TOWN OF PALATINE Township $1,629,588 $1,806,458 $3,260,186 $1,046,664 67.90% 7.50% 4.00% 0.00% 9.00%
372 TOWN OF PALOS Township $714,891 $2,045,437 $678,521 $432,328 36.28% 7.50% 4.00% 0.00% 0.00%
373 TOWN OF PROVISO Township $3,367,771 $4,472,495 $3,490,485 $305,342 91.25% 7.50% 4.00% 0.00% 0.00%
374 TOWN OF SCHAUMBURG Township $660,745 $5,786,415 $4,329,329 $950,557 78.04% 7.00% 3.50% 0.93% 0.00%
375 TOWN OF STICKNEY Township $2,337,510 $6,444,372 $5,943,716 $893,920 84.96% 7.50% 4.00% 0.00% 0.00%
376 TOWN OF THORNTON Township $10,037,969 $10,198,944 $7,859,183 $2,233,072 71.59% 5.00% 5.00% 0.00% 10.00%
377 TOWN OF WHEELING Township $2,352,352 $2,672,759 $1,710,279 $362,744 78.79% 7.50% 4.00% 0.05% 7.00%
378 TOWN OF WORTH Township $4,459,278 $2,393,757 $3,262,508 $375,071 88.50% 7.50% 4.00% 0.00% 0.00%
379 TOWN RICH Township $694,860 $4,561,789 $4,739,813 $1,305,317 72.46% 7.50% 4.00% 0.00% 0.00%
380 TOWN RIVER FOREST Township $368,549 $518,674 $459,853 $44,099 90.41% 7.50% 4.00% 0.10% 3.00%
381 TOWN RIVERSIDE Township $17,673 $1,065,600 $314,748 ($32,782) 110.42% 7.50% 4.00% 0.00% 0.00%
382TRITON COMM COLL DISTR 504
RIVER GROVE Education $22,319,396 $55,307,248 $1,950,792 $1,950,792 0.00% 5.00% 5.00% 6.00% 8.00%
383 UNIV PARK PUBLIC LIBRARY Library $512,909 $718,780 $397,899 $210,749 47.03% 7.50% 10.00% 3.00% 0.00%
384VETERANS PARK DISTRICT
MELROSE PARKPark $11,194,842 $6,129,452 $3,493,378 $306,381 91.23% 0.00% 0.00% 0.00% 0.00%
385 VIL OF ARLINGTON HEIGHTS Municipality $108,446,609 $135,589,864 $284,378,967 $97,748,291 65.63% 7.50% 5.50% 0.47% 9.00%
386 VILL. OF INDIAN HEAD PARK Municipality $1,992,353 $3,701,140 $4,049,733 $805,494 80.11% 7.50% 4.40% 0.31% 0.00%
387 VILL. OF SOUTH BARRINGTON Municipality $4,706,268 $5,866,225 $10,100,154 $5,375,590 46.78% 7.00% 5.50% 2.00% 6.00%
388 VILLAGE BELLWOOD Municipality $95,761,097 $37,350,121 $78,069,358 $27,888,750 64.28% 7.25% 5.00% 75.00% 8.00%
389 VILLAGE OF ALSIP Municipality $21,930,550 $15,726,835 $73,703,981 $38,721,467 47.46% 7.00% 5.50% 1.30% 9.00%
390 VILLAGE OF BARRINGTON Municipality $36,527,999 $24,641,274 $36,913,430 $14,770,257 59.99% 7.50% 5.50% 1.87% 8.00%
391 VILLAGE OF BARTLETT Municipality $57,171,235 $37,508,577 $58,409,342 $18,602,219 68.15% 7.50% 5.50% 0.47% 8.00%
392 VILLAGE OF BEDFORD PARK Municipality $116,849,272 $50,342,121 $53,402,457 $32,447,881 39.24% 4.00% 4.00% 25.87% 13.60%
393 VILLAGE OF BENSENVILLE Municipality $59,918,890 $68,427,143 $39,551,109 $15,130,747 61.74% 7.50% 4.00% 0.74% 9.00%
394 VILLAGE OF BERKELEY Municipality $2,511,833 $4,506,075 $8,892,605 $2,956,301 66.76% 7.50% 4.00% 0.05% 0.00%
395 VILLAGE OF BRIDGEVIEW Municipality $216,788,388 $52,179,119 $8,610,348 $33,254,267 -286.21% 7.00% 5.50% 65.00% 8.00%
396 VILLAGE OF BROADVIEW Municipality $38,169,231 $21,143,284 $62,887,961 $21,893,258 65.19% 7.00% 3.00% 125.00% 8.00%
397 VILLAGE OF BROOKFIELD Municipality $29,781,998 $14,634,248 $42,319,695 $14,968,864 64.63% 7.00% 5.00% 3.00% 8.00%
398 VILLAGE OF BUFFALO GROVE Municipality $31,030,223 $33,361,192 $137,720,196 $51,589,455 62.54% 7.00% 5.00% 0.90% 8.00%
399 VILLAGE OF BURR RIDGE Municipality $14,583,419 $15,597,135 $22,113,173 $6,253,840 71.72% 7.50% 5.50% 0.00% 9.00%
400 VILLAGE OF CHICAGO RIDGE Municipality $19,260,626 $19,422,525 $51,124,772 $29,467,488 42.36% 6.83% 5.25% 0.14% 6.00%
401 VILLAGE OF CRESTWOOD Municipality $47,145,748 $12,332,500 $819,731 $588,592 28.20% 7.00% 5.50% 0.00% 0.00%
402 VILLAGE OF DEER PARK Municipality $463,195 $3,300,275 $0 $0 #VALUE! 0.00% 0.00% 0.00% 0.00%
403 VILLAGE OF DEERFIELD Municipality $29,022,214 $30,524,127 $57,700,390 $19,373,610 66.42% 7.50% 5.00% 0.10% 9.00%
404 VILLAGE OF DOLTON Municipality $30,629 $25,624 $2,181,315 $416,297 80.92% 0.00% 3.00% 1.50% 0.00%
405 VILLAGE OF EAST DUNDEE Municipality $13,456,919 $8,102,313 $10,103,755 $3,594,381 64.43% 7.50% 4.00% 5.00% 8.00%
406 VILLAGE OF ELK GROVE Municipality $93,586,312 $77,355,774 $227,095,944 $100,887,599 55.57% 7.25% 5.00% 2.00% 6.00%
407 VILLAGE OF ELMWOOD PARK Municipality $12,337,632 $45,490,095 $75,053,638 $38,532,469 48.66% 7.00% 5.50% 1.59% 6.00%
408 VILLAGE OF FLOSSMOOR Municipality $13,557,653 $14,840,155 $25,727,409 $9,209,346 64.20% 7.00% 5.50% 2.00% 6.00%
409 VILLAGE OF FOREST PARK Municipality $23,456,850 $22,029,561 $62,484,903 $21,106,077 66.22% 7.50% 5.00% 1971.00% 8.00%
410 VILLAGE OF FORESTVIEW Municipality $2,464,411 $5,598,400 $1,403,787 $24,401 98.26% 7.50% 4.00% 0.00% 0.00%
Öage 3Î of 38
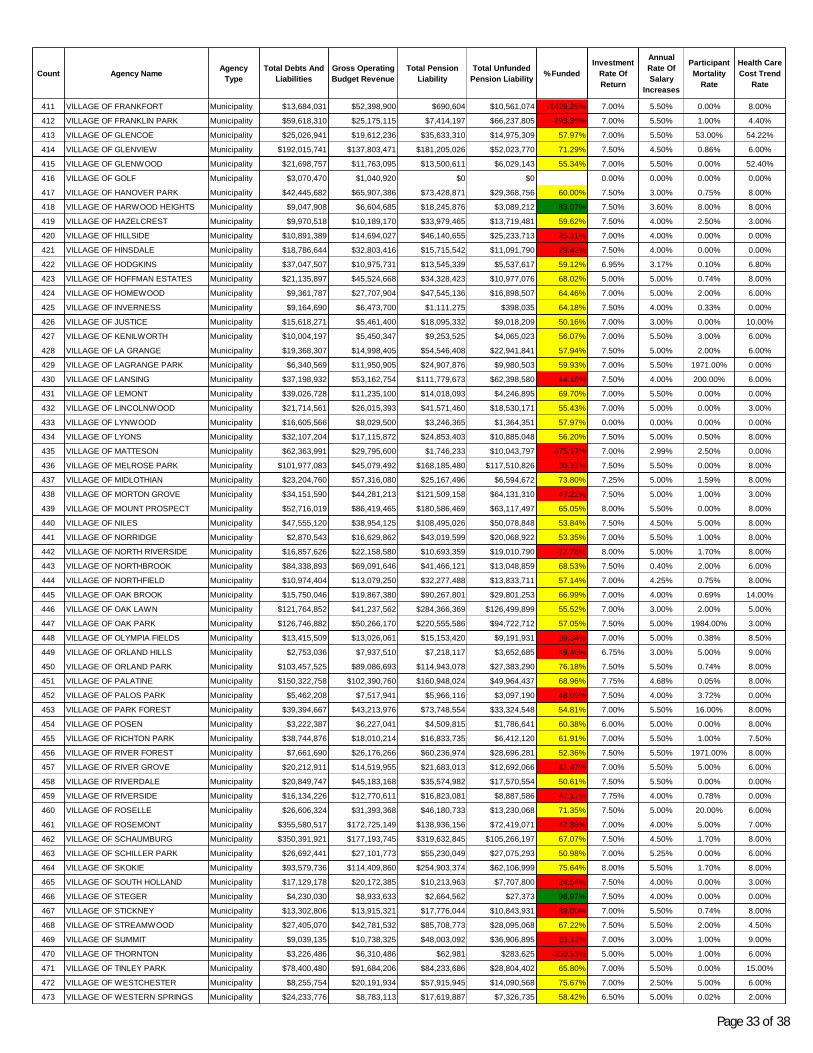
Count Agency Name Agency Type
Total Debts And Liabilities
Gross Operating Budget Revenue
Total Pension Liability
Total Unfunded Pension Liability % Funded
Investment Rate Of Return
Annual Rate Of Salary
Increases
Participant Mortality
Rate
Health Care Cost Trend
Rate
411 VILLAGE OF FRANKFORT Municipality $13,684,031 $52,398,900 $690,604 $10,561,074 -1429.25% 7.00% 5.50% 0.00% 8.00%
412 VILLAGE OF FRANKLIN PARK Municipality $59,618,310 $25,175,115 $7,414,197 $66,237,805 -793.39% 7.00% 5.50% 1.00% 4.40%
413 VILLAGE OF GLENCOE Municipality $25,026,941 $19,612,236 $35,633,310 $14,975,309 57.97% 7.00% 5.50% 53.00% 54.22%
414 VILLAGE OF GLENVIEW Municipality $192,015,741 $137,803,471 $181,205,026 $52,023,770 71.29% 7.50% 4.50% 0.86% 6.00%
415 VILLAGE OF GLENWOOD Municipality $21,698,757 $11,763,095 $13,500,611 $6,029,143 55.34% 7.00% 5.50% 0.00% 52.40%
416 VILLAGE OF GOLF Municipality $3,070,470 $1,040,920 $0 $0 #VALUE! 0.00% 0.00% 0.00% 0.00%
417 VILLAGE OF HANOVER PARK Municipality $42,445,682 $65,907,386 $73,428,871 $29,368,756 60.00% 7.50% 3.00% 0.75% 8.00%
418 VILLAGE OF HARWOOD HEIGHTS Municipality $9,047,908 $6,604,685 $18,245,876 $3,089,212 83.07% 7.50% 3.60% 8.00% 8.00%
419 VILLAGE OF HAZELCREST Municipality $9,970,518 $10,189,170 $33,979,465 $13,719,481 59.62% 7.50% 4.00% 2.50% 3.00%
420 VILLAGE OF HILLSIDE Municipality $10,891,389 $14,694,027 $46,140,655 $25,233,713 45.31% 7.00% 4.00% 0.00% 0.00%
421 VILLAGE OF HINSDALE Municipality $18,786,644 $32,803,416 $15,715,542 $11,091,790 29.42% 7.50% 4.00% 0.00% 0.00%
422 VILLAGE OF HODGKINS Municipality $37,047,507 $10,975,731 $13,545,339 $5,537,617 59.12% 6.95% 3.17% 0.10% 6.80%
423 VILLAGE OF HOFFMAN ESTATES Municipality $21,135,897 $45,524,668 $34,328,423 $10,977,076 68.02% 5.00% 5.00% 0.74% 8.00%
424 VILLAGE OF HOMEWOOD Municipality $9,361,787 $27,707,904 $47,545,136 $16,898,507 64.46% 7.00% 5.00% 2.00% 6.00%
425 VILLAGE OF INVERNESS Municipality $9,164,690 $6,473,700 $1,111,275 $398,035 64.18% 7.50% 4.00% 0.33% 0.00%
426 VILLAGE OF JUSTICE Municipality $15,618,271 $5,461,400 $18,095,332 $9,018,209 50.16% 7.00% 3.00% 0.00% 10.00%
427 VILLAGE OF KENILWORTH Municipality $10,004,197 $5,450,347 $9,253,525 $4,065,023 56.07% 7.00% 5.50% 3.00% 6.00%
428 VILLAGE OF LA GRANGE Municipality $19,368,307 $14,998,405 $54,546,408 $22,941,841 57.94% 7.50% 5.00% 2.00% 6.00%
429 VILLAGE OF LAGRANGE PARK Municipality $6,340,569 $11,950,905 $24,907,876 $9,980,503 59.93% 7.00% 5.50% 1971.00% 0.00%
430 VILLAGE OF LANSING Municipality $37,198,932 $53,162,754 $111,779,673 $62,398,580 44.18% 7.50% 4.00% 200.00% 6.00%
431 VILLAGE OF LEMONT Municipality $39,026,728 $11,235,100 $14,018,093 $4,246,895 69.70% 7.00% 5.50% 0.00% 0.00%
432 VILLAGE OF LINCOLNWOOD Municipality $21,714,561 $26,015,393 $41,571,460 $18,530,171 55.43% 7.00% 5.00% 0.00% 3.00%
433 VILLAGE OF LYNWOOD Municipality $16,605,566 $8,029,500 $3,246,365 $1,364,351 57.97% 0.00% 0.00% 0.00% 0.00%
434 VILLAGE OF LYONS Municipality $32,107,204 $17,115,872 $24,853,403 $10,885,048 56.20% 7.50% 5.00% 0.50% 8.00%
435 VILLAGE OF MATTESON Municipality $62,363,991 $29,795,600 $1,746,233 $10,043,797 -475.17% 7.00% 2.99% 2.50% 0.00%
436 VILLAGE OF MELROSE PARK Municipality $101,977,083 $45,079,492 $168,185,480 $117,510,826 30.13% 7.50% 5.50% 0.00% 8.00%
437 VILLAGE OF MIDLOTHIAN Municipality $23,204,760 $57,316,080 $25,167,496 $6,594,672 73.80% 7.25% 5.00% 1.59% 8.00%
438 VILLAGE OF MORTON GROVE Municipality $34,151,590 $44,281,213 $121,509,158 $64,131,310 47.22% 7.50% 5.00% 1.00% 3.00%
439 VILLAGE OF MOUNT PROSPECT Municipality $52,716,019 $86,419,465 $180,586,469 $63,117,497 65.05% 8.00% 5.50% 0.00% 8.00%
440 VILLAGE OF NILES Municipality $47,555,120 $38,954,125 $108,495,026 $50,078,848 53.84% 7.50% 4.50% 5.00% 8.00%
441 VILLAGE OF NORRIDGE Municipality $2,870,543 $16,629,862 $43,019,599 $20,068,922 53.35% 7.00% 5.50% 1.00% 8.00%
442 VILLAGE OF NORTH RIVERSIDE Municipality $16,857,626 $22,158,580 $10,693,359 $19,010,790 -77.78% 8.00% 5.00% 1.70% 8.00%
443 VILLAGE OF NORTHBROOK Municipality $84,338,893 $69,091,646 $41,466,121 $13,048,859 68.53% 7.50% 0.40% 2.00% 6.00%
444 VILLAGE OF NORTHFIELD Municipality $10,974,404 $13,079,250 $32,277,488 $13,833,711 57.14% 7.00% 4.25% 0.75% 8.00%
445 VILLAGE OF OAK BROOK Municipality $15,750,046 $19,867,380 $90,267,801 $29,801,253 66.99% 7.00% 4.00% 0.69% 14.00%
446 VILLAGE OF OAK LAWN Municipality $121,764,852 $41,237,562 $284,366,369 $126,499,899 55.52% 7.00% 3.00% 2.00% 5.00%
447 VILLAGE OF OAK PARK Municipality $126,746,882 $50,266,170 $220,555,586 $94,722,712 57.05% 7.50% 5.00% 1984.00% 3.00%
448 VILLAGE OF OLYMPIA FIELDS Municipality $13,415,509 $13,026,061 $15,153,420 $9,191,931 39.34% 7.00% 5.00% 0.38% 8.50%
449 VILLAGE OF ORLAND HILLS Municipality $2,753,036 $7,937,510 $7,218,117 $3,652,685 49.40% 6.75% 3.00% 5.00% 9.00%
450 VILLAGE OF ORLAND PARK Municipality $103,457,525 $89,086,693 $114,943,078 $27,383,290 76.18% 7.50% 5.50% 0.74% 8.00%
451 VILLAGE OF PALATINE Municipality $150,322,758 $102,390,760 $160,948,024 $49,964,437 68.96% 7.75% 4.68% 0.05% 8.00%
452 VILLAGE OF PALOS PARK Municipality $5,462,208 $7,517,941 $5,966,116 $3,097,190 48.09% 7.50% 4.00% 3.72% 0.00%
453 VILLAGE OF PARK FOREST Municipality $39,394,667 $43,213,976 $73,748,554 $33,324,548 54.81% 7.00% 5.50% 16.00% 8.00%
454 VILLAGE OF POSEN Municipality $3,222,387 $6,227,041 $4,509,815 $1,786,641 60.38% 6.00% 5.00% 0.00% 8.00%
455 VILLAGE OF RICHTON PARK Municipality $38,744,876 $18,010,214 $16,833,735 $6,412,120 61.91% 7.00% 5.50% 1.00% 7.50%
456 VILLAGE OF RIVER FOREST Municipality $7,661,690 $26,176,266 $60,236,974 $28,696,281 52.36% 7.50% 5.50% 1971.00% 8.00%
457 VILLAGE OF RIVER GROVE Municipality $20,212,911 $14,519,955 $21,683,013 $12,692,066 41.47% 7.00% 5.50% 5.00% 6.00%
458 VILLAGE OF RIVERDALE Municipality $20,849,747 $45,183,168 $35,574,982 $17,570,554 50.61% 7.50% 5.50% 0.00% 0.00%
459 VILLAGE OF RIVERSIDE Municipality $16,134,226 $12,770,611 $16,823,081 $8,887,586 47.17% 7.75% 4.00% 0.78% 0.00%
460 VILLAGE OF ROSELLE Municipality $26,606,324 $31,393,368 $46,180,733 $13,230,068 71.35% 7.50% 5.00% 20.00% 6.00%
461 VILLAGE OF ROSEMONT Municipality $355,580,517 $172,725,149 $138,936,156 $72,419,071 47.88% 7.00% 4.00% 5.00% 7.00%
462 VILLAGE OF SCHAUMBURG Municipality $350,391,921 $177,193,745 $319,632,845 $105,266,197 67.07% 7.50% 4.50% 1.70% 8.00%
463 VILLAGE OF SCHILLER PARK Municipality $26,692,441 $27,101,773 $55,230,049 $27,075,293 50.98% 7.00% 5.25% 0.00% 6.00%
464 VILLAGE OF SKOKIE Municipality $93,579,736 $114,409,860 $254,903,374 $62,106,999 75.64% 8.00% 5.50% 1.70% 8.00%
465 VILLAGE OF SOUTH HOLLAND Municipality $17,129,178 $20,172,385 $10,213,963 $7,707,800 24.54% 7.50% 4.00% 0.00% 3.00%
466 VILLAGE OF STEGER Municipality $4,230,030 $8,933,633 $2,664,562 $27,373 98.97% 7.50% 4.00% 0.00% 0.00%
467 VILLAGE OF STICKNEY Municipality $13,302,806 $13,915,321 $17,776,044 $10,843,931 39.00% 7.00% 5.50% 0.74% 8.00%
468 VILLAGE OF STREAMWOOD Municipality $27,405,070 $42,781,532 $85,708,773 $28,095,068 67.22% 7.50% 5.50% 2.00% 4.50%
469 VILLAGE OF SUMMIT Municipality $9,039,135 $10,738,325 $48,003,092 $36,906,895 23.12% 7.00% 3.00% 1.00% 9.00%
470 VILLAGE OF THORNTON Municipality $3,226,486 $6,310,486 $62,981 $283,625 -350.33% 5.00% 5.00% 1.00% 6.00%
471 VILLAGE OF TINLEY PARK Municipality $78,400,480 $91,684,206 $84,233,686 $28,804,402 65.80% 7.00% 5.50% 0.00% 15.00%
472 VILLAGE OF WESTCHESTER Municipality $8,255,754 $20,191,934 $57,915,945 $14,090,568 75.67% 7.00% 2.50% 5.00% 6.00%
473 VILLAGE OF WESTERN SPRINGS Municipality $24,233,776 $8,783,113 $17,619,887 $7,326,735 58.42% 6.50% 5.00% 0.02% 2.00%
Öage 33 of 38

Count Agency Name Agency Type
Total Debts And Liabilities
Gross Operating Budget Revenue
Total Pension Liability
Total Unfunded Pension Liability % Funded
Investment Rate Of Return
Annual Rate Of Salary
Increases
Participant Mortality
Rate
Health Care Cost Trend
Rate
474 VILLAGE OF WHEELING Municipality $95,989,433 $28,514,036 $107,598,350 $30,338,578 71.80% 7.75% 5.00% 1.00% 10.00%
475 VILLAGE OF WILLOW SPRINGS Municipality $26,686,333 $5,220,222 $1,807,142 $5,096,257 -182.01% 7.00% 5.50% 20.00% 6.00%
476 VILLAGE OF WILMETTE Municipality $102,256,784 $55,677,967 $134,214,299 $43,355,867 67.70% 7.35% 5.50% 0.00% 0.00%
477 VILLAGE OF WINNETKA Municipality $18,696,798 $49,762,818 $99,216,132 $41,710,695 57.96% 6.25% 5.50% 0.74% 8.00%
478 VILLAGE OF WORTH Municipality $11,730,280 $12,686,875 $24,264,609 $8,052,586 66.81% 7.00% 5.00% 0.00% 0.00%
479 WESTCHESTER PARK DISTRICT Park $3,025,239 $2,981,677 $11,533 $634,941 -5405.43% 7.50% 4.00% 0.00% 0.00%
480 WESTERN SPRINGS PARK DISTRICT Park $2,229,161 $2,154,675 $539,128 $66,262 87.71% 7.50% 4.00% 0.00% 0.00%
481 WHEELING PARK DISTRICT Park $22,172,646 $16,438,814 $7,753,089 $1,130,245 85.42% 7.50% 4.00% 0.00% 8.00%
482WILLIAM LEONARD LIBRARY
(ROBBINS)Library $175,217 $307,977 $235,178 $22,862 90.28% 7.50% 4.00% 10.00% 0.00%
483 WILMETTE PARK DISTRICT Park $8,952,503 $23,304,737 $18,217,480 $6,140,146 66.30% 7.50% 4.00% 1.55% 0.00%
484 WILMETTE PUBL LIBRARY DIST Library $0 $5,372,586 $4,896,949 $1,334,167 72.76% 7.50% 0.20% 0.08% 0.00%
485 WINNETKA LIBRARY DISTRICT Library $1,800,040 $4,004,711 $3,960,648 $615,475 84.46% 7.50% 4.00% 0.00% 3.00%
486 WINNETKA PARK DISTRICT Park $3,864,167 $10,866,273 $8,703,718 $1,840,163 78.86% 7.50% 4.00% 3.00% 0.05%
487 WORTH PARK DISTRICT Park $324,844 $1,053,157 $387,422 $24,767 93.61% 7.50% 4.00% 0.00% 0.00%
488 WORTH PUBLIC LIBRARY DIST Library $48,189 $1,519,155 $691,070 $163,465 76.35% 7.50% 4.00% 0.11% 0.00%
489YORKFIELD FIRE PROTECTION
DISTRICT ELMHURSTFire $0 $148,072 $0 $0 #VALUE! 0.00% 0.00% 0.00% 0.00%
$67,081,592,093 $28,359,178,907 $72,960,615,567 $33,831,561,564
Funded between 50% and 80%Funded over 80%
Funded below 50%
DISCLAIMER: The Cook County Treasurer’s Office (CCTO) does not guarantee the accuracy or completeness of any of the information contained in this report. The information
contained in this report comes from many sources, none of which are in the control of the Cook County Treasurer’s Office. As such, it is the user’s responsibility to evaluate the
content and usefulness of the information. The information is provided “as is.” CCTO makes no warranty of any kind, express or implied, including the warranty of merchantability and
fitness for a particular purpose and freedom from contamination from computer viruses, and assumes no liability or responsibility for the accuracy, completeness, legality, reliability or
usefulness of such information or for any omissions from the information. CCTO assumes no liability for any damages incurred, whether directly or indirectly, actual, incidental,
punitive or consequential, as a result of any errors, omissions or discrepancies in any information set forth in this report or any use of such report. CCTO is not liable for any improper
or incorrect use of the information in this report and assumes no liability for anyone’s use of such information.
Öage 3Ï of 38

Appendix II – Debt Disclosure Ordinance – Non-Compliant Agencies (as of April 30, 2012)
Öage 35 of 38

Count Agency Number Agency Name1 13-0040-000 ADDISON CREEK RIVER CONSERVANCY DISTRICT NORTHLAKE
2 08-0030-000 CENTRAL STICKNEY SANITARY DISTRICT CHICAGO
3 05-0190-000 CHICAGO HEIGHTS PARK DIST
4 03-0160-000 CITY OF BURBANK
5 03-0540-000 CITY OF HICKORY HILLS
6 05-0220-000 CLYDE PARK DISTRICT CICERO
7 08-0050-000 CRAWFORD COUNTRYSIDE SANITARY DISTRICT MATTESON
8 06-0100-000 DIXMOOR PUBLIC LIBRARY DISTRICT
9 06-0110-000 DOLTON PUBLIC LIBRARY DISTRICT
10 06-0140-000 FORD HEIGHTS PUBLIC LIBRARY DIST
11 08-0070-000 FOREST RIVER SANITARY DISTRICT MT PROSPECT
12 07-0120-000 FOREST VIEW FIRE PROTECTION DIST
13 06-0160-000 FRANKLIN PARK LIBRARY DIST
14 06-0210-000 HARVEY PUBLIC LIBRARY DIST
15 04-2110-000 HIGH SCHOOL DISTRICT 209 MAYWOOD
16 07-0210-000 HOMETOWN FIRE PROTECTION DISTRICT
17 05-0520-000 JUSTICE PARK DISTRICT
18 08-0140-000 KIMBER TRAIL SANITARY DISTRICT PALOS PARK
19 05-0570-000 LIGHTHOUSE PARK DISTRICT OF EVANSTON
20 04-2125-000 LINCOLNWAY HIGH SCHOOL 210
21 05-0580-000 MARKHAM PARK DISTRICT
22 05-0600-000 MAYWOOD PARK DISTRICT
23 07-0250-000 MILLER WOODS FIRE PROTECTION DISTRICT STEGER
24 06-0330-000 NILES PUBLIC LIBRARY DIST
25 08-0200-000 NORTHFIELD WOODS SANITARY DISTRICT GLENVIEW
26 08-0220-000 OAK MEADOW SANITARY DISTRICT DES PLAINES
27 06-0380-000 PHOENIX PUBLIC LIBRARY DISTRICT
28 05-0830-000 PLEASANTDALE PARK DISTRICT BURR RIDGE
29 05-0840-000 PLUM GROVE COUNTRYSIDE PARK DIST PALATINE
30 08-0260-000 PLUM GROVE ESTATES SANITARY DISTRICT ROLLING MEADOWS
31 05-0850-000 POSEN PARK DISTRICT
32 06-0400-000 POSEN PUBLIC LIBRARY DISTRICT
33 05-0910-000 RIVERDALE PARK DISTRICT
34 07-0470-000 RIVERSIDE LAWN FIRE DIST.
35 05-0920-000 ROBBINS PARK DISTRICT
36 07-0480-000 ROBERTS PARK FIRE PROTECTION DISTRICT (HICKORY HILLS/JUSTICE)
37 07-0500-000 ROSELLE FIRE PROTECTION DISTRICT
38 04-1010-000 SCHOOL DISTRICT 149 DOLTON / CALUMET CITY
39 04-0480-000 SCHOOL DISTRICT 88 BELLWOOD
40 08-0330-000 SOUTH PALOS TOWNSHIP SANITARY DISTRICT PALOS PARK
41 08-0340-000 SOUTH STICKNEY SANITARY DISTRICT BURBANK
42 11-0040-000 SOUTHWEST HOME EQUITY ASSURANCE 1 CHICAGO
43 07-0520-000 SUNNYCREST FIRE PROTECTION DISTRICT FLOSSMOOR
44 04-2070-000 THORNTON TOWNSHIP HIGH SCHOOL 205
45 02-0140-000 TOWN OF NEW TRIER
46 13-0030-000 UNION DRAINAGE DISTRICT NO. 1 DEERFIELD
47 03-0040-000 VILL. OF BARRINGTON HILLS
48 03-0170-000 VILLAGE OF BURNHAM
49 03-0200-000 VILLAGE OF CALUMET PARK
50 03-0300-000 VILLAGE OF DIXMOOR
51 03-0330-000 VILLAGE OF EAST HAZELCREST
52 03-0390-000 VILLAGE OF EVERGREEN PARK
53 03-0410-000 VILLAGE OF FORD HEIGHTS
Office of the Cook County Treasurer
Debt Disclosure Non Compliance as of 4/30/2012
Primary Governments
Öage 36 of 38

Count Agency Number Agency Name54 03-0780-000 VILLAGE OF MARRIONETTE PARK
55 03-0750-000 VILLAGE OF MAYWOOD
56 03-0760-000 VILLAGE OF MC COOK
57 03-1020-000 VILLAGE OF PHOENIX
58 03-1100-000 VILLAGE OF ROBBINS
59 03-1140-000 VILLAGE OF SAUL VILLAGE
60 03-1190-000 VILLAGE OF SOUTH CHICAGO HEIGHTS
61 03-1230-000 VILLAGE OF STONE PARK
62 03-1280-000 VILLAGE OF UNIVERSITY PARK
63 05-1060-000 WESTDALE PARK DIST MELROSE PARK
64 08-0390-000 WOODLEY ROAD SANITARY DISTRICT WINNETKA
NOTE: The due date for the taxing districts to comply with the DDO Amendments was 11/30/2011.
DISCLAIMER: The Cook County Treasurer’s Office (CCTO) does not guarantee the accuracy or completeness of any of the information
contained in this report. This report may include references to taxing agencies that are currently inactive, may not have levied property taxes for a
particular year or whose financial information is consolidated in the financial statements of another taxing agency. The user of this report is advised
and cautioned that information contained herein is derived from public records which may or may not be accurate and from sources that are
outside the control of the CCTO. The information referenced herein may change from time to time and such changes may not be reflected in this
report. As such, it is the user’s responsibility to evaluate the content and usefulness of the information contained herein. All information herein
contained is provided “as is.” CCTO makes no warranty of any kind, express or implied, including the warranty of merchantability and fitness for a
particular purpose and freedom from contamination from computer viruses, and assumes no liability or responsibility for the accuracy,
completeness, legality, reliability or usefulness of such information or for any omissions there from. CCTO assumes no liability for any damages
incurred, whether directly or indirectly, actual, incidental, punitive or consequential, as a result of any errors, omissions or discrepancies in any
information set forth in this report or any use thereof. CCTO shall not be liable for any improper or incorrect use of the information contained herein
and assumes no liability for any person’s use of such information.
Öage 37 of 38
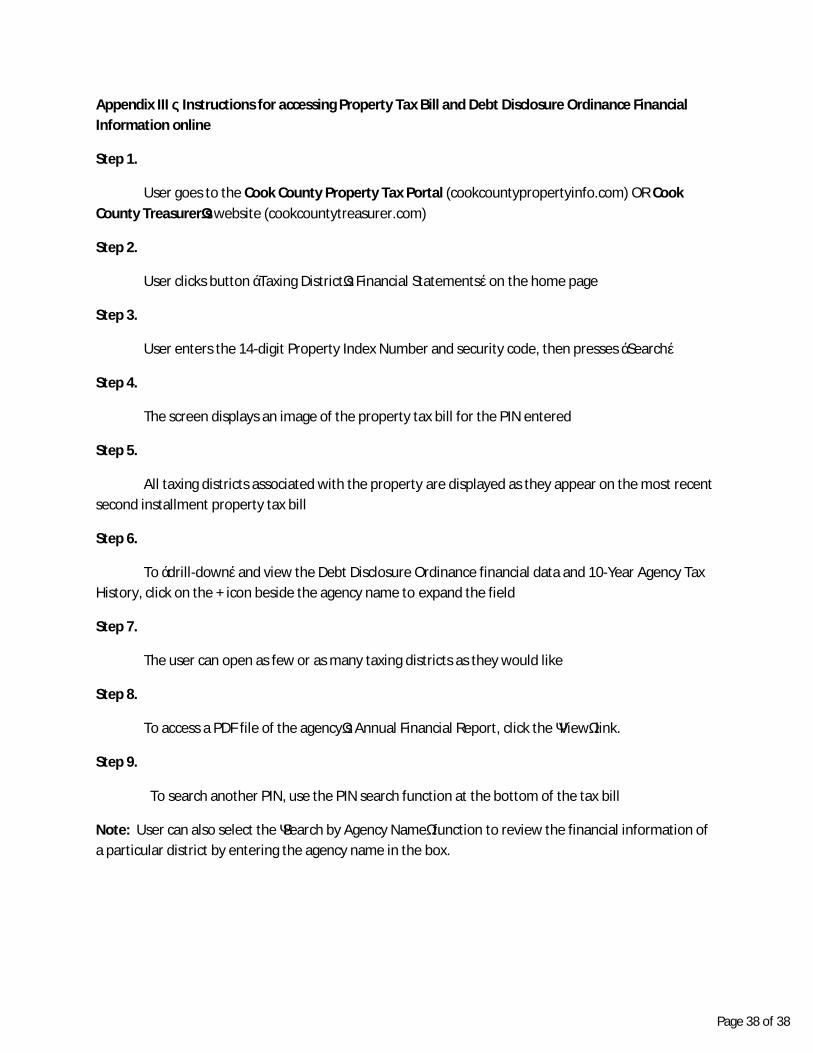
Appendix III – Instructions for accessing Property Tax Bill and Debt Disclosure Ordinance Financial Information online
Step 1.
User goes to the Cook County Property Tax Portal (cookcountypropertyinfo.com) OR Cook County Treasurer’s website (cookcountytreasurer.com)
Step 2.
User clicks button “Taxing District’s Financial Statements” on the home page
Step 3.
User enters the 14-digit Property Index Number and security code, then presses “Search”
Step 4.
The screen displays an image of the property tax bill for the PIN entered
Step 5.
All taxing districts associated with the property are displayed as they appear on the most recent second installment property tax bill
Step 6.
To “drill-down” and view the Debt Disclosure Ordinance financial data and 10-Year Agency Tax History, click on the + icon beside the agency name to expand the field
Step 7.
The user can open as few or as many taxing districts as they would like
Step 8.
To access a PDF file of the agency’s Annual Financial Report, click the ‘View’ link.
Step 9.
To search another PIN, use the PIN search function at the bottom of the tax bill
Note: User can also select the ‘Search by Agency Name’ function to review the financial information of a particular district by entering the agency name in the box.
Öage 38 of 38