Embed Size (px)
Citation preview
Data Analysis - 1
DATA ANALYSIS
(1) Biological Databases
(a) Research 3 biological databases of your choice to find specific information (graphics and/or text) relevant to a lesson you might teach in a secondary school biology class. Include screen captures of relevant data. Document the sources and indicate how you would use such data in class.
Data Analysis - 2
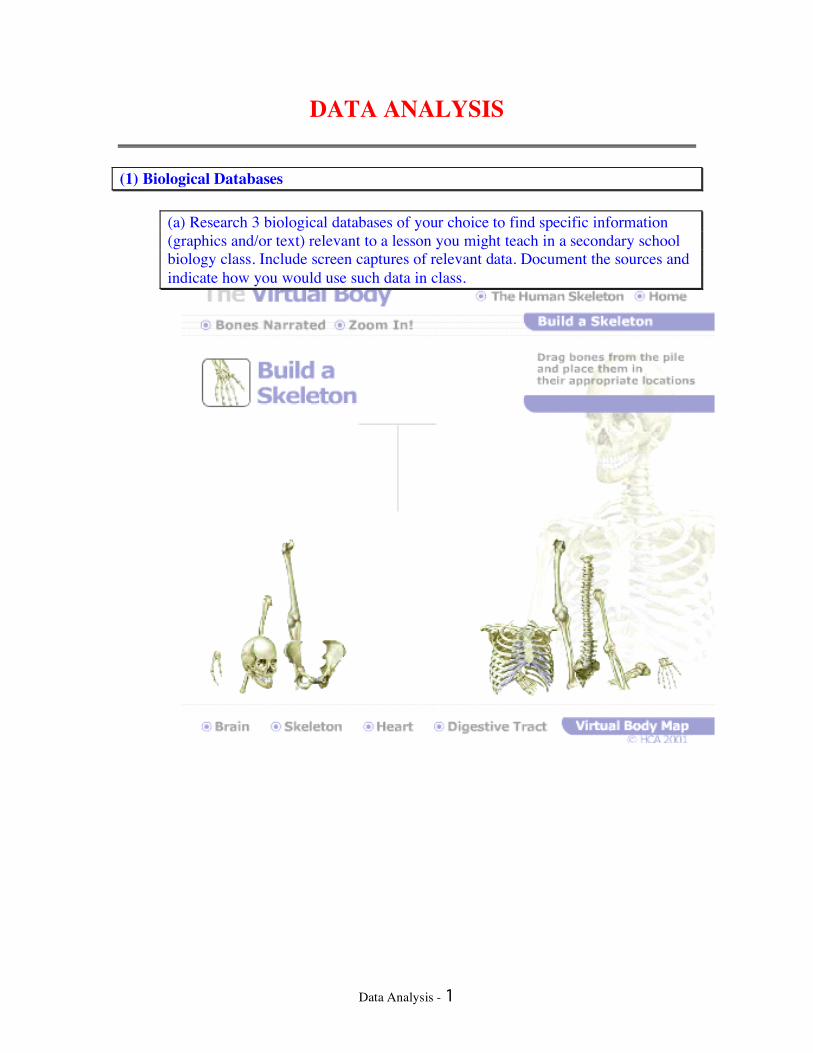
This virtual body site would be very helpful in checking my students on their knowledge of bones and skeletal structure. After teaching them the names and uses of the bones, they can check their retained knowledge by building the skeleton.
Data Analysis - 3
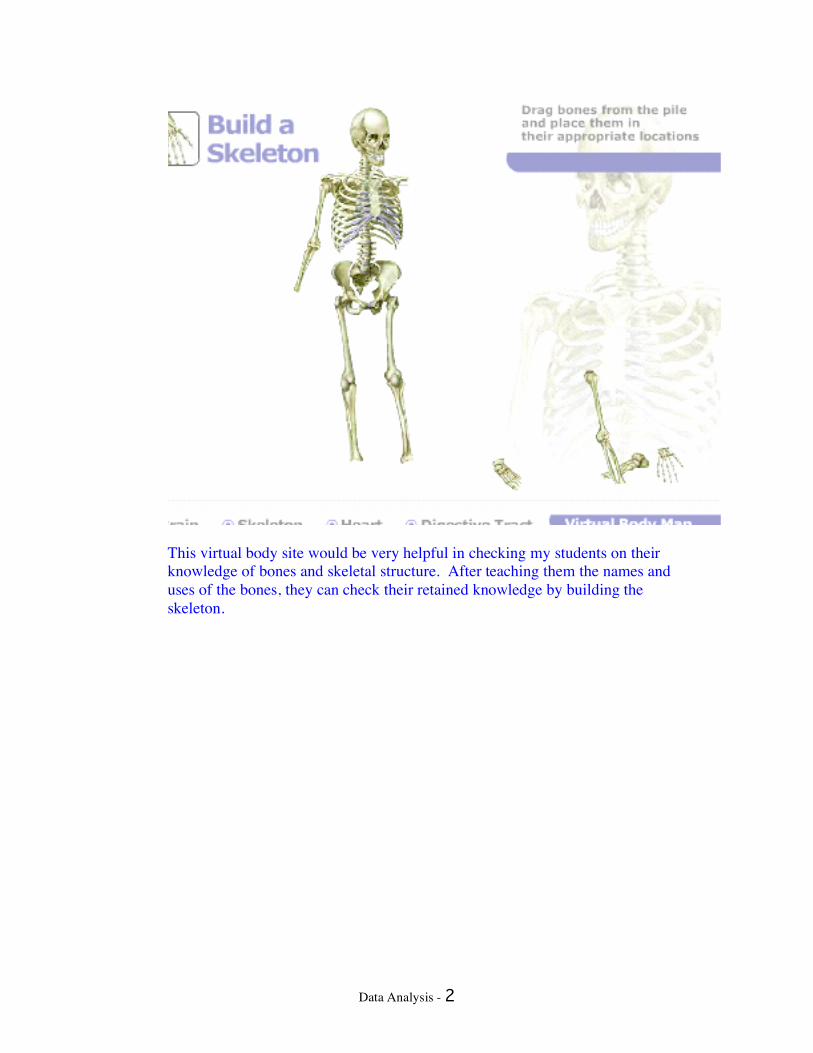
I can imagine sending students to the Descanso Gardens to track down and photo different species of plants as a research project during a Botany unit. This way the students can get a chance to see real life plants rather than just photos in a book.
Data Analysis - 4
Doegenomes.org is a great site to find resources to illustrate the human genome project, DNA, and how humans get their genes. Each image comes with additional information to explain what is being illustrated. (b) Give a specific example of how you could use online biological databases to enhance your instruction in a biology or physiology classroom. I would use the Doegenomes.org site to help me teach about genetics. The site has downloadable images and information that can help me better explain how genetics works. For example, I could use the diagrams of DNA strands to better explain what they are composed of. Furthermore, I could have my students go to this site to explore and learn more on their own. (c) Write a higher-order question that would require students to analyze data from one of the following databases.
How does a human get their hair color? What determines whether a person will have black, brown, blonde, or red hair?
(d) Use Inspiration and MS Organizational Chart to develop a visual taxonomic scheme for the materials presented in class. �
*FREE
Data Analysis - 5
(2) Chemical Databases (a) Discuss three specific advantages of an interactive periodic table compared to a traditional periodic table.
(a) There are several advantages of an interactive periodic table compared to a traditional periodic table. First, students can get a better idea of what kind of a matter the elements are. For example, the java script periodic table is color coded to illustrate which element is a solid, liquid, gas, etc. Second, interactive periodic tables such as the webelements periodic table are easier to understand. For instance, if you click on an element, all of this information will come up about the particular element. Last, the interactive periodic tables are much better because they even give pictures of what the elements look like and how reactive they are. These interactive tables are much more interesting than the traditional ones which is key to engage students in their learning. (b) Write a question that could be answered more effectively using an interactive periodic table than with a traditional periodic table. (b) Why are the elements placed in certain spaces in the periodic table?
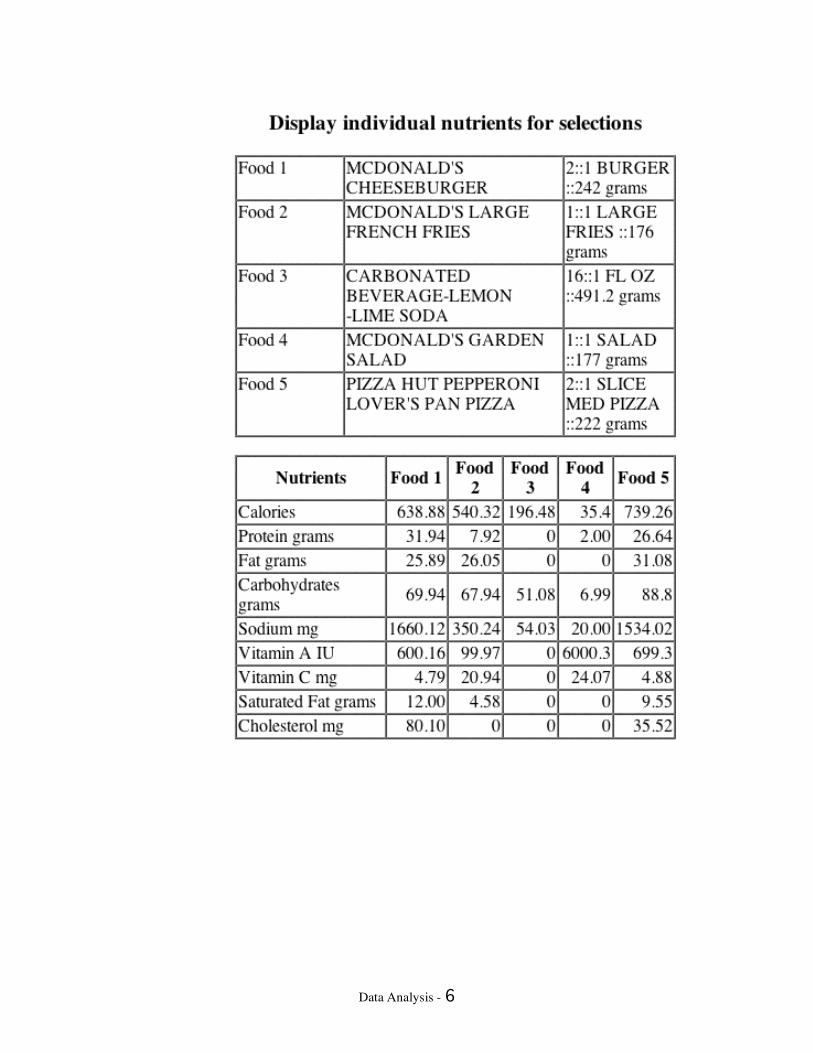
(3) Nutrition Analysis Using Online databases (a) Attach a printout of the analysis of your daily diet.
Data Analysis - 6
Data Analysis - 7
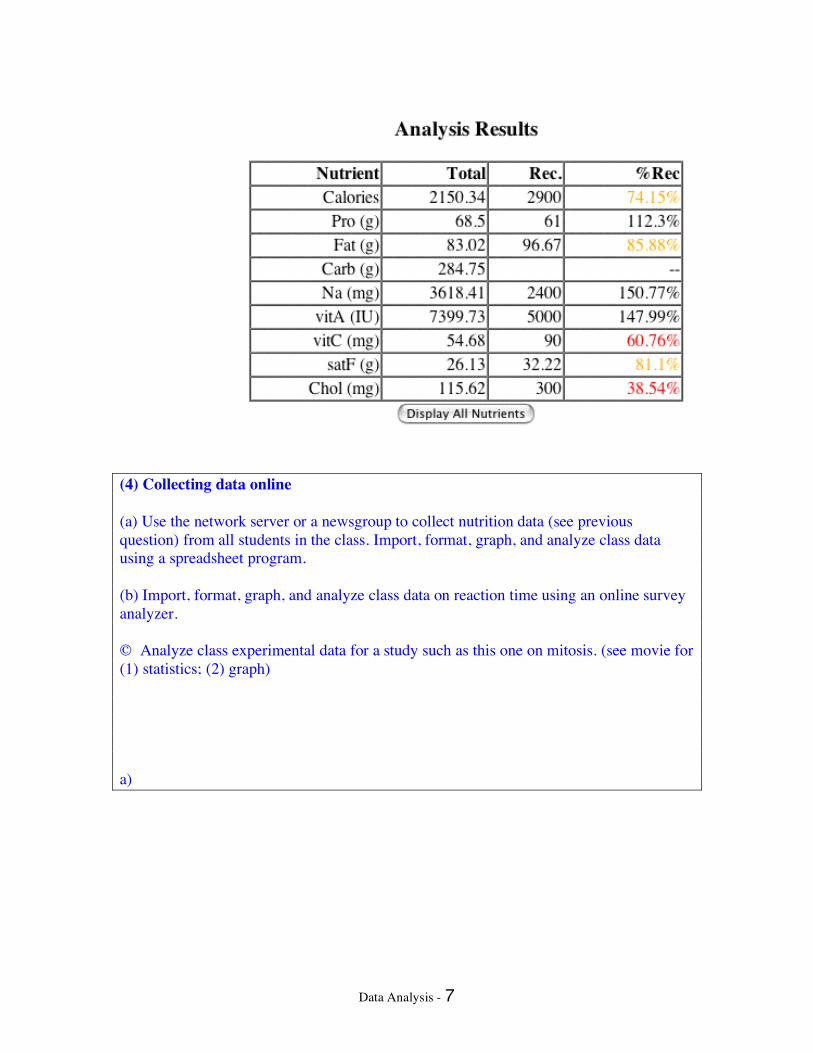
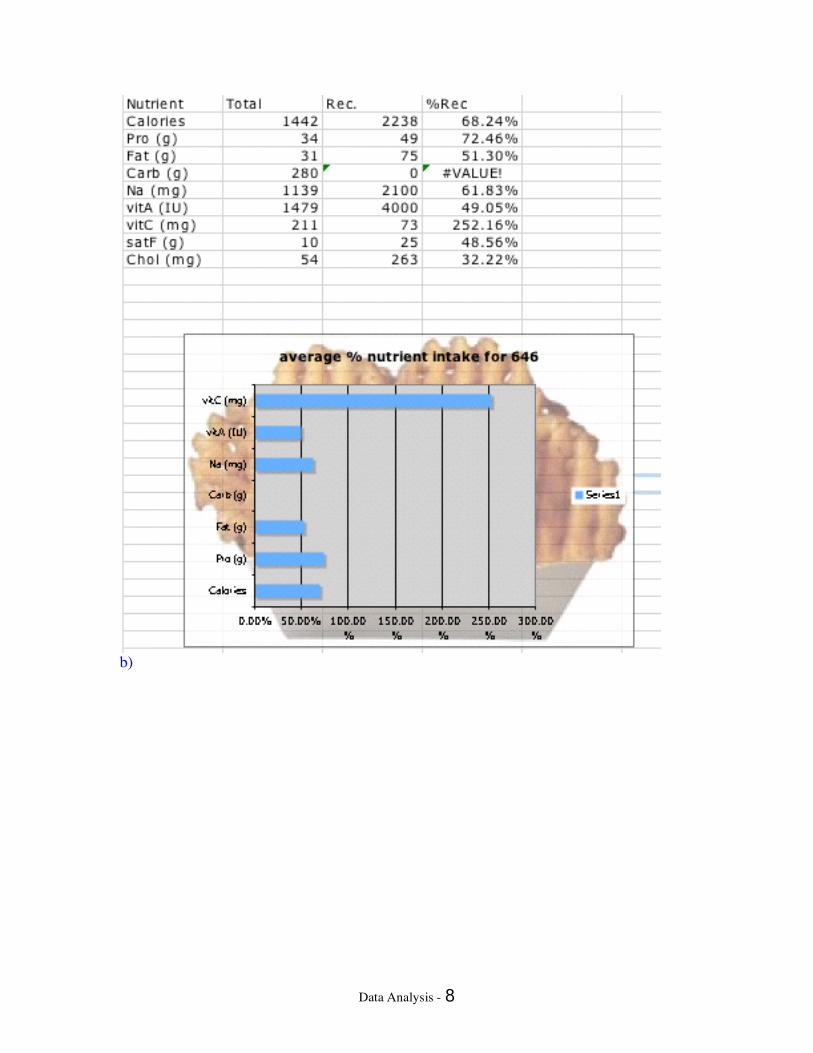
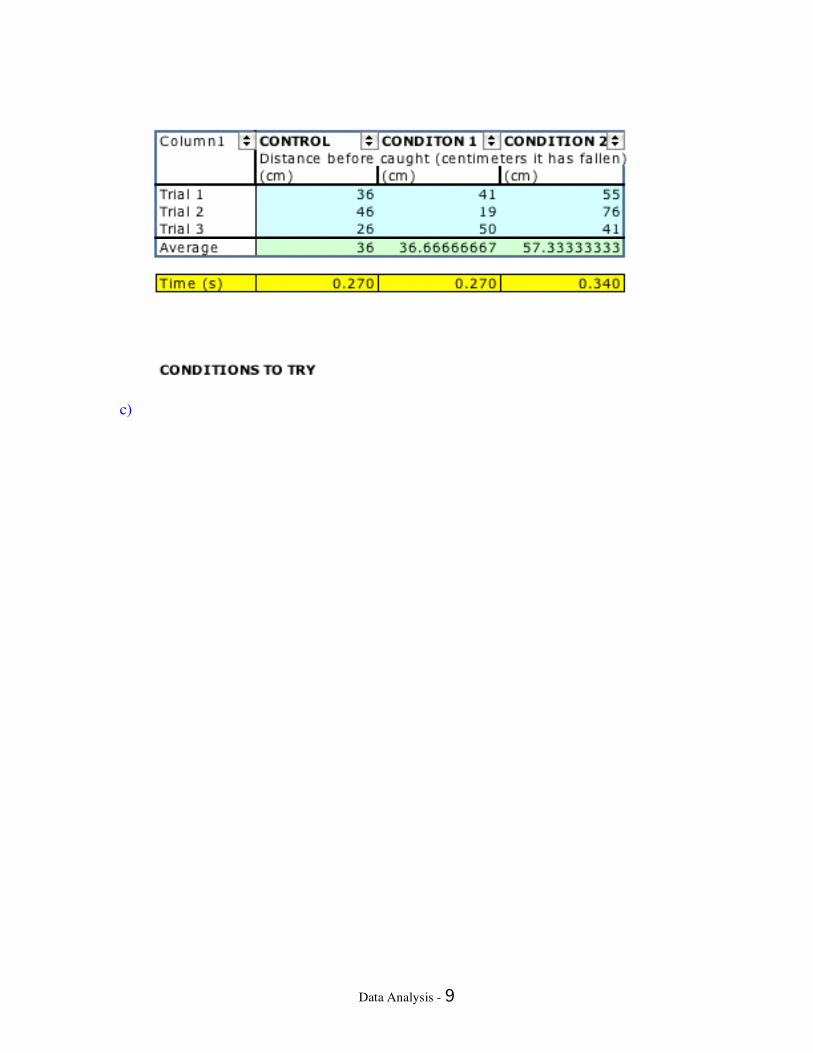
(4) Collecting data online (a) Use the network server or a newsgroup to collect nutrition data (see previous question) from all students in the class. Import, format, graph, and analyze class data using a spreadsheet program. (b) Import, format, graph, and analyze class data on reaction time using an online survey analyzer. © Analyze class experimental data for a study such as this one on mitosis. (see movie for (1) statistics; (2) graph) a)
Data Analysis - 8
b)
Data Analysis - 9
c)
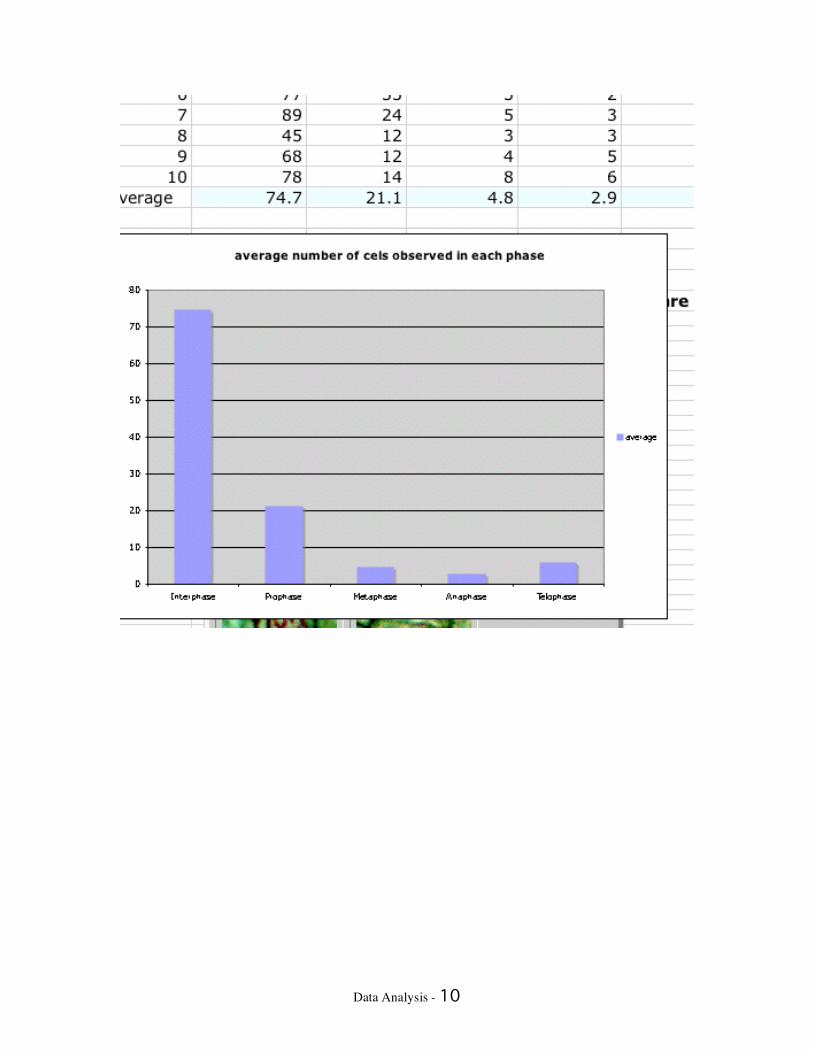
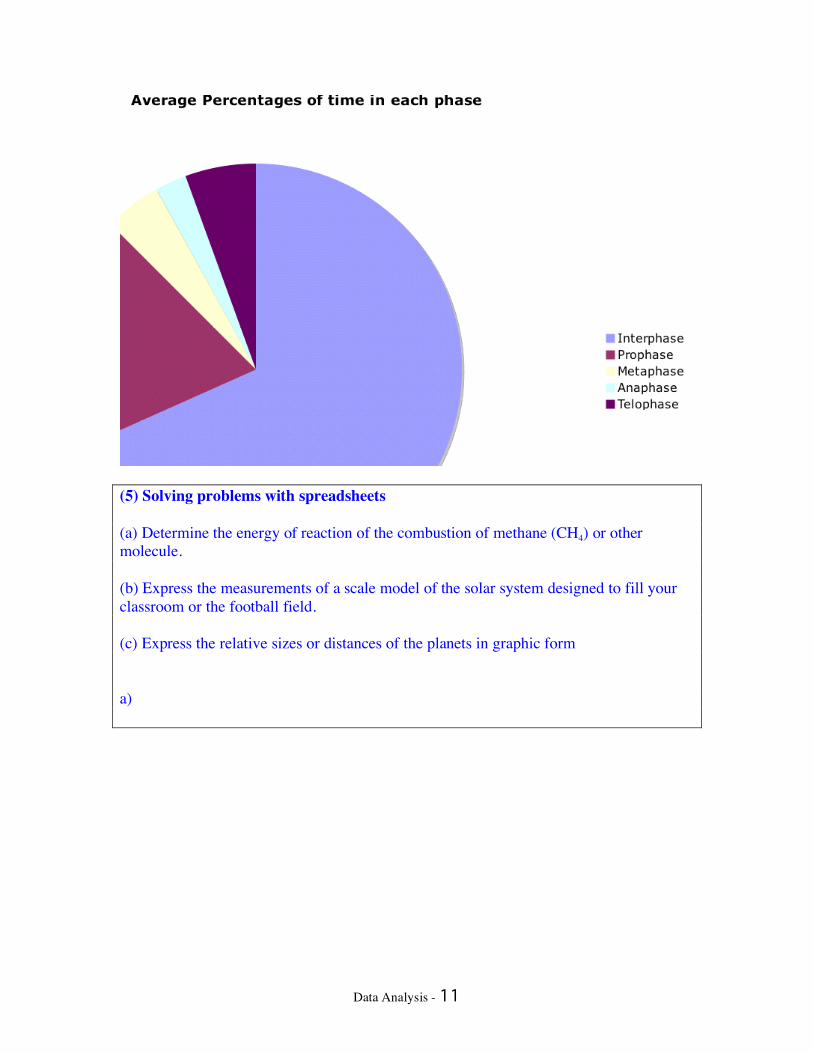
Data Analysis - 10
Data Analysis - 11
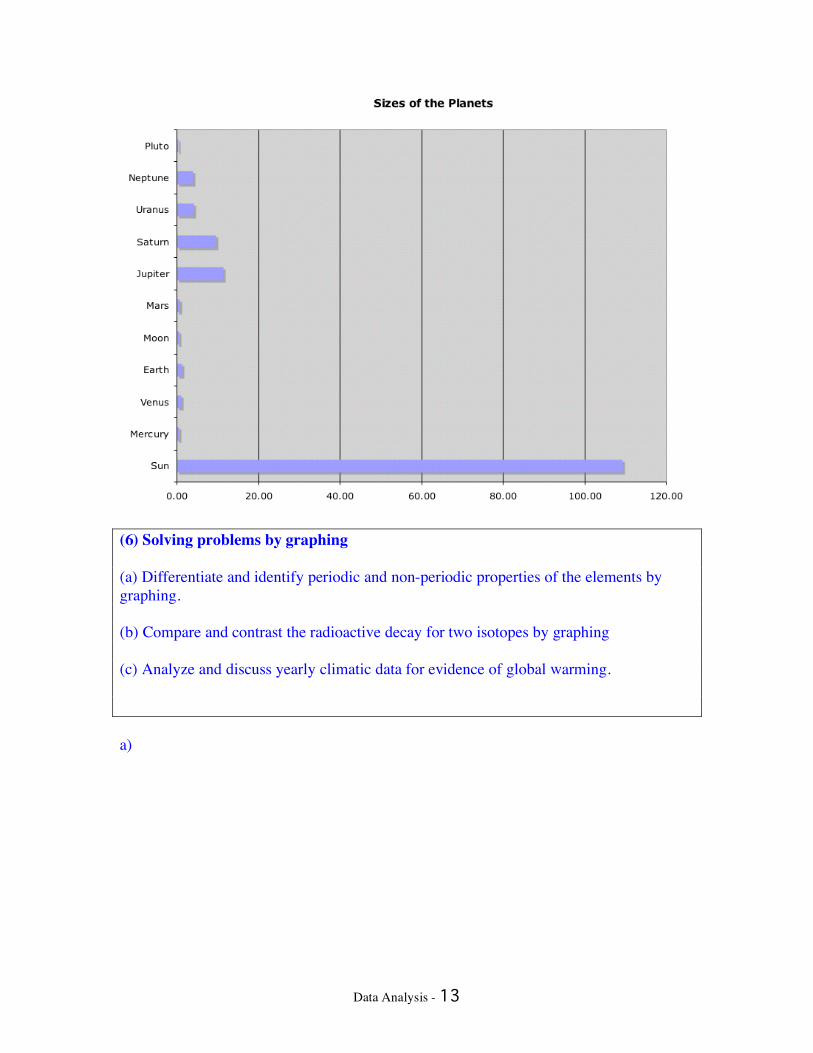
(5) Solving problems with spreadsheets (a) Determine the energy of reaction of the combustion of methane (CH4) or other molecule. (b) Express the measurements of a scale model of the solar system designed to fill your classroom or the football field. (c) Express the relative sizes or distances of the planets in graphic form a)
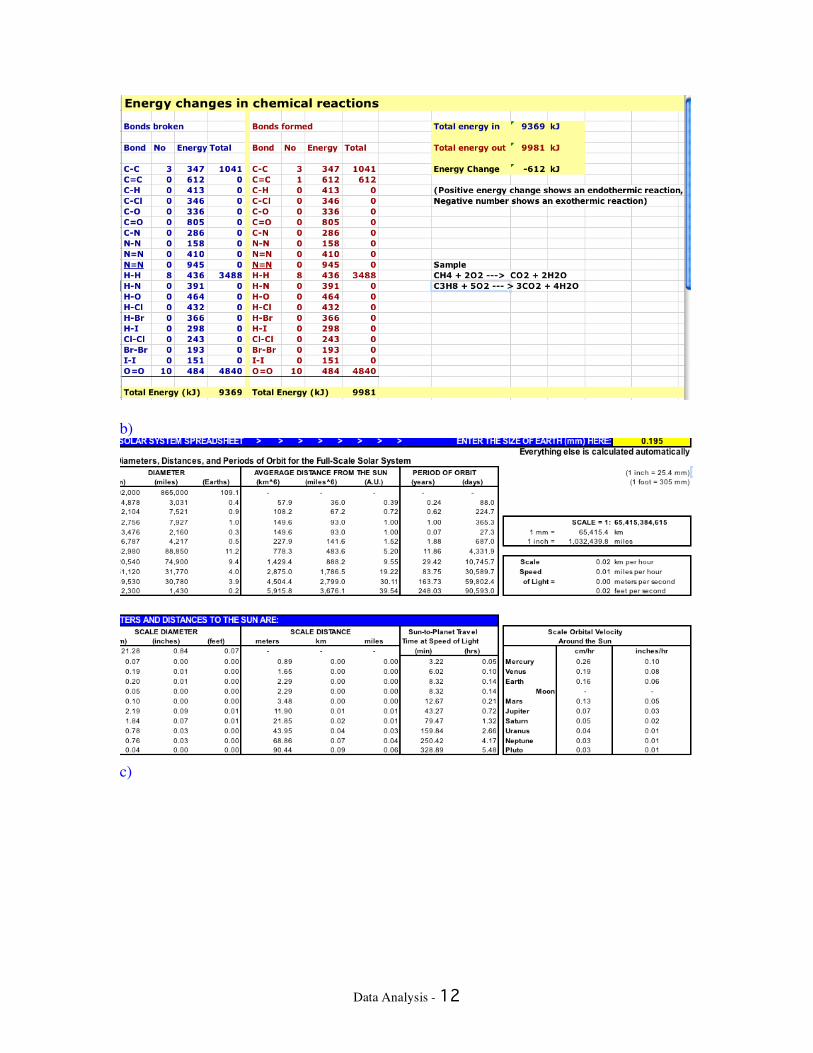
Data Analysis - 12
b)
c)
Data Analysis - 13
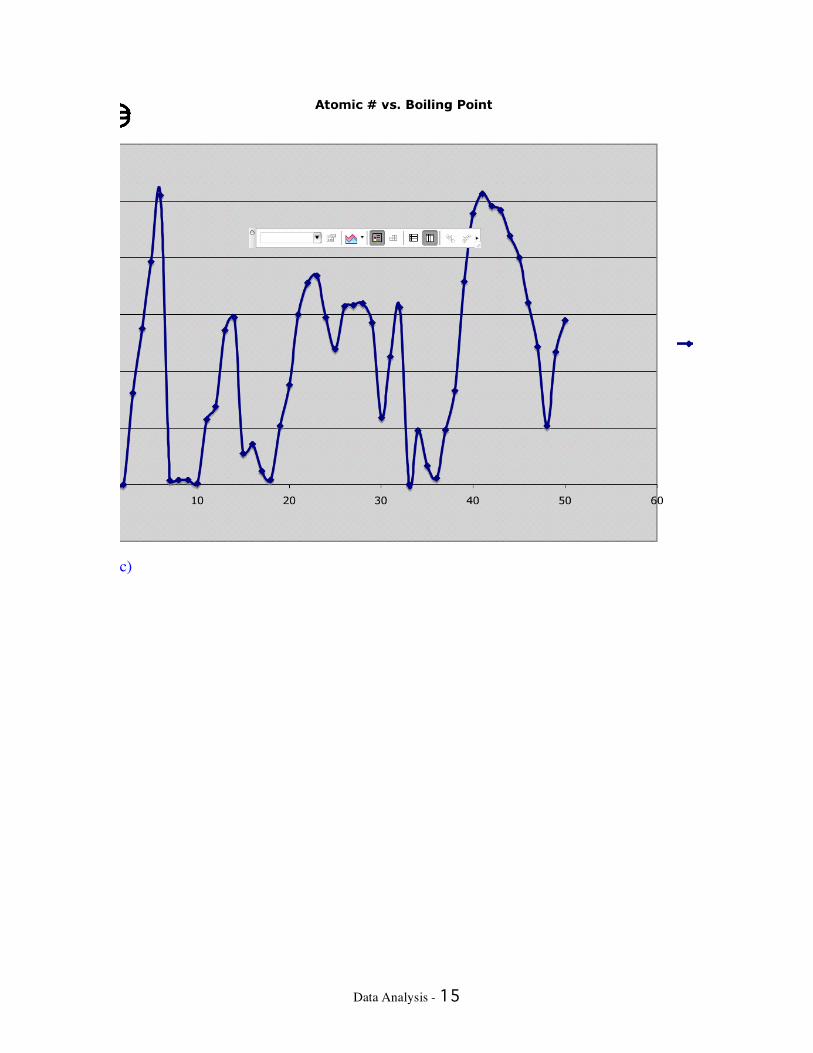
(6) Solving problems by graphing (a) Differentiate and identify periodic and non-periodic properties of the elements by graphing. (b) Compare and contrast the radioactive decay for two isotopes by graphing (c) Analyze and discuss yearly climatic data for evidence of global warming. a)
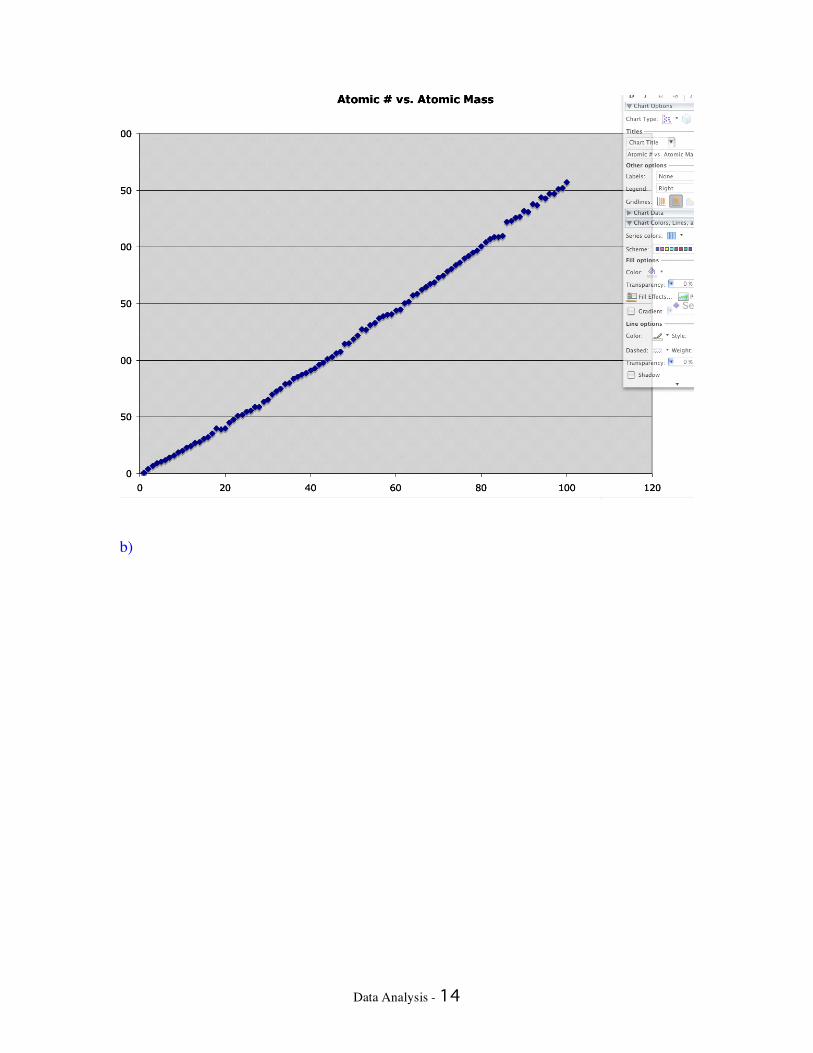
Data Analysis - 14
b)
Data Analysis - 15
c)
Data Analysis - 16
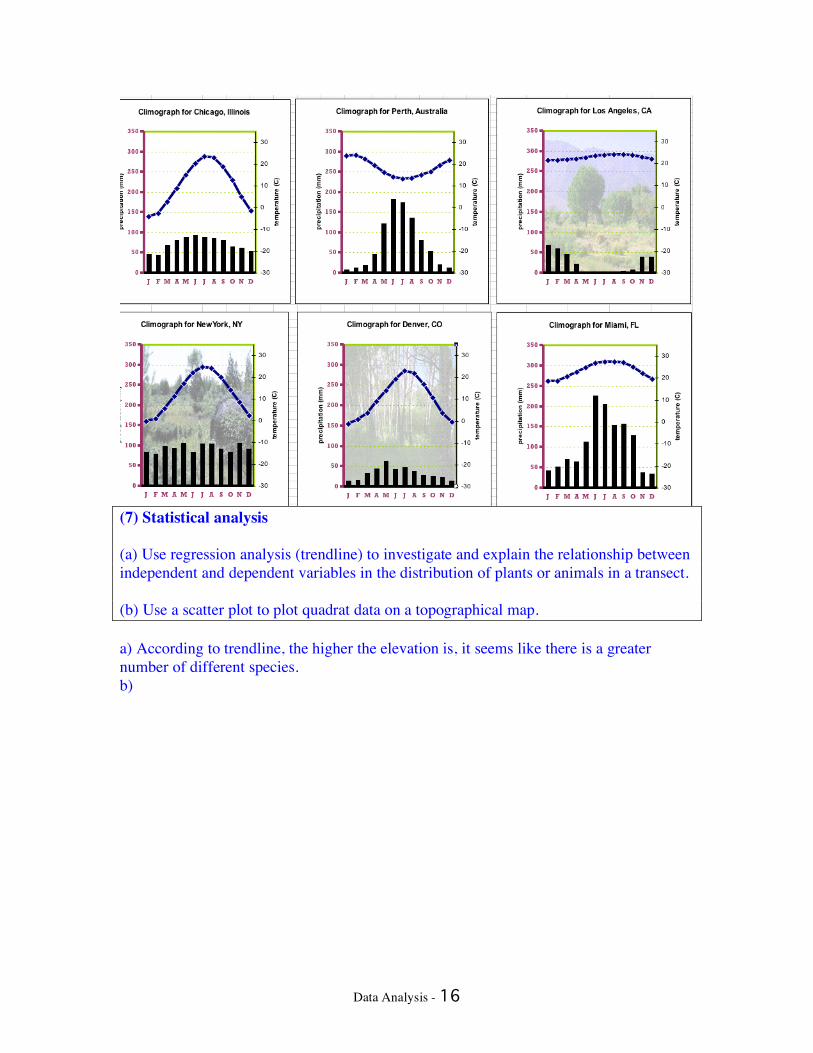
(7) Statistical analysis (a) Use regression analysis (trendline) to investigate and explain the relationship between independent and dependent variables in the distribution of plants or animals in a transect. (b) Use a scatter plot to plot quadrat data on a topographical map. a) According to trendline, the higher the elevation is, it seems like there is a greater number of different species. b)
Data Analysis - 17
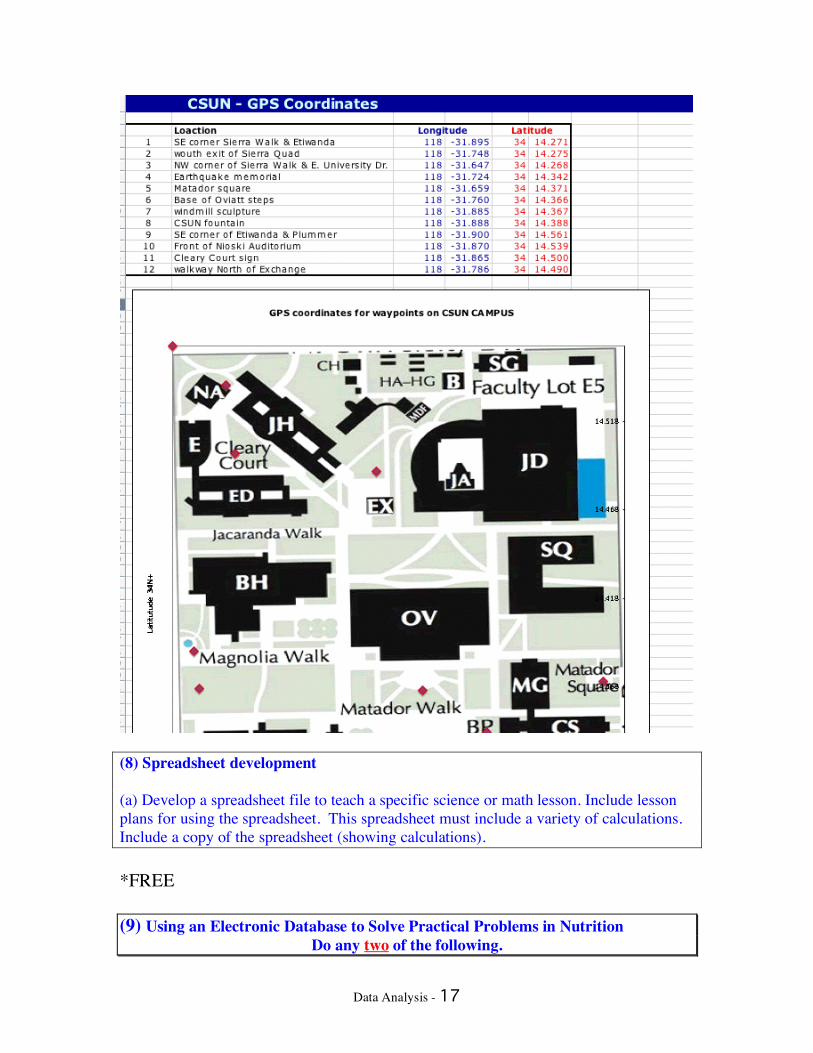
(8) Spreadsheet development (a) Develop a spreadsheet file to teach a specific science or math lesson. Include lesson plans for using the spreadsheet. This spreadsheet must include a variety of calculations. Include a copy of the spreadsheet (showing calculations). *FREE (9) Using an Electronic Database to Solve Practical Problems in Nutrition
Do any two of the following.
Data Analysis - 18
The explosion of human knowledge is one of the most profound phenomena of our time. As our knowledge base continues to expand at an exponential rate, it becomes progressively more important that our students develop skills which enable them to access and analyze this information. Since computerized data bases are the most efficient mechanism of categorizing and retrieving data, it is important that we train our students to use such systems efficiently. This exercise suggests ways in which a data base program may be used to solve practical nutritional problems in the context of a biology, health, or general science class. To solve the problems that follow, you will need to use the data base file entitled "FOODS" that provides extensive nutritional information on 180 common foods. This file has been prepared using data provided courtesy of the ESHA corporation of Salem, Oregon. (PO Box 13028; (503) 585-6242) and is based primarily upon United States Department of Agriculture studies.
(a)WHICH FOODS HELP REDUCE THE RISK OF OSTEOPOROSIS? Osteoporosis is a metabolic bone disease in which the density of bones decrease as they become increasingly porous. Approximately 10 million Americans suffer from some form of this debilitating disease whose symptoms include curvature of the spine as well as fractures of the hip, spine and forearm. Although osteoporosis is generally considered to be a disease of the elderly, steps to prevent it should be taken throughout one's life. Medical researchers have shown that osteoporosis results from an insufficiency of calcium both during the growing years as well as later in life. Calcium is an integral component of the skeletal system, being found in the two major inorganic components of bone, namely calcium carbonate and calcium phosphate. Besides its structural responsibilities, calcium is also used to regulate the flow of ions across membranes, facilitate the transmission of nerve impulses, enable muscle contraction, and govern the secretion of blood pressure regulators. Because calcium is critically important for these and other vital processes, blood calcium concentrations must be kept at a constant, optimal level. Bones may serve as reservoirs to deliver calcium to the blood in time of need, but if their own calcium is not replenished, they may become porous and weak. Because the level of calcium in the blood is kept constant, blood tests will not reveal if an individual is suffering from calcium deficiency. It is therefore quite important to maintain an adequate supply of calcium throughout one's life. Nutrition experts agree that the best way to prevent nutrient deficiencies is to eat a balanced diet. If, however, an individual is showing symptoms of calcium deficiency, it may be advisable to increase his or her dietary intake of calcium. To do this, however, it is important to realize that many factors influence the way in which calcium is absorbed and used by the body. For example, calcium is best absorbed when ingested in foods that contain approximately equivalent amount of phosphorous. Vitamin D is known to aid in calcium absorption, but excessive dietary protein actually reduces the amount of calcium in the body by increasing the amount that is excreted in urine. The nutritional data base accompanying this exercise provides information about the composition of various foods. Your goal is to determine those foods that you might recommend to an individual showing the symptoms of calcium
Data Analysis - 19
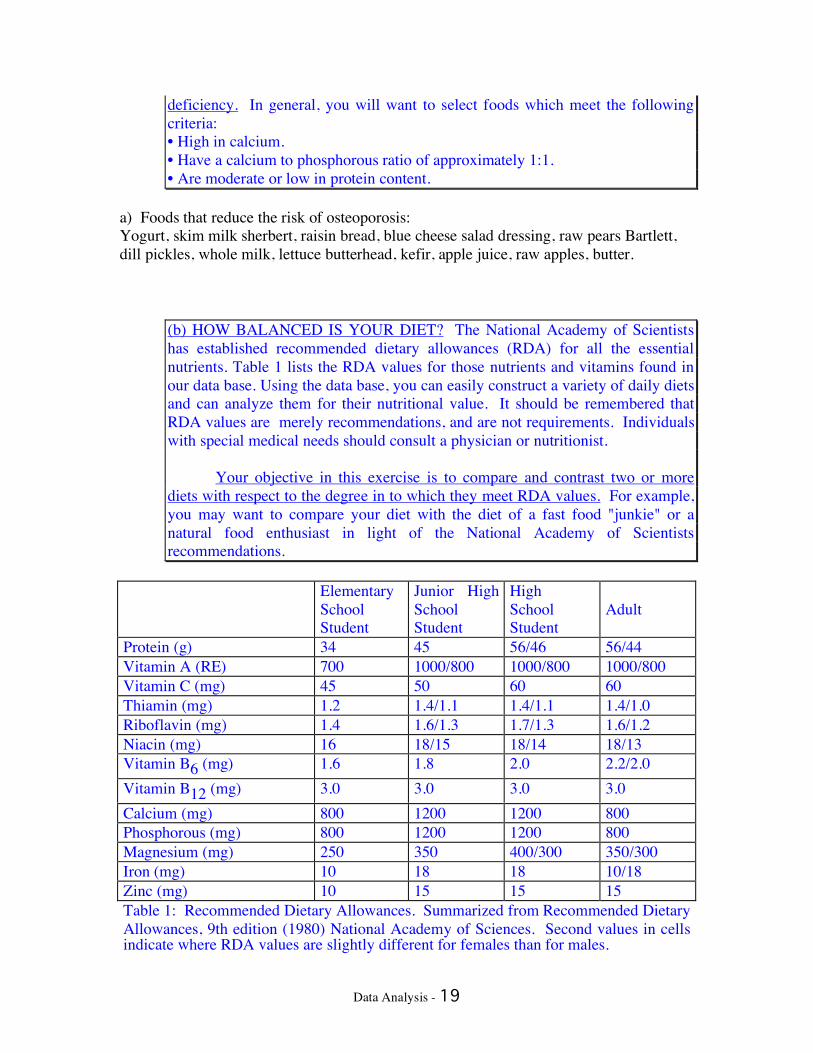
deficiency. In general, you will want to select foods which meet the following criteria: • High in calcium. • Have a calcium to phosphorous ratio of approximately 1:1. • Are moderate or low in protein content.
a) Foods that reduce the risk of osteoporosis: Yogurt, skim milk sherbert, raisin bread, blue cheese salad dressing, raw pears Bartlett, dill pickles, whole milk, lettuce butterhead, kefir, apple juice, raw apples, butter.
(b) HOW BALANCED IS YOUR DIET? The National Academy of Scientists has established recommended dietary allowances (RDA) for all the essential nutrients. Table 1 lists the RDA values for those nutrients and vitamins found in our data base. Using the data base, you can easily construct a variety of daily diets and can analyze them for their nutritional value. It should be remembered that RDA values are merely recommendations, and are not requirements. Individuals with special medical needs should consult a physician or nutritionist. Your objective in this exercise is to compare and contrast two or more diets with respect to the degree in to which they meet RDA values. For example, you may want to compare your diet with the diet of a fast food "junkie" or a natural food enthusiast in light of the National Academy of Scientists recommendations.
Elementary
School Student
Junior High School Student
High School Student
Adult
Protein (g) 34 45 56/46 56/44 Vitamin A (RE) 700 1000/800 1000/800 1000/800 Vitamin C (mg) 45 50 60 60 Thiamin (mg) 1.2 1.4/1.1 1.4/1.1 1.4/1.0 Riboflavin (mg) 1.4 1.6/1.3 1.7/1.3 1.6/1.2 Niacin (mg) 16 18/15 18/14 18/13 Vitamin B6 (mg) 1.6 1.8 2.0 2.2/2.0 Vitamin B12 (mg) 3.0 3.0 3.0 3.0 Calcium (mg) 800 1200 1200 800 Phosphorous (mg) 800 1200 1200 800 Magnesium (mg) 250 350 400/300 350/300 Iron (mg) 10 18 18 10/18 Zinc (mg) 10 15 15 15 Table 1: Recommended Dietary Allowances. Summarized from Recommended Dietary Allowances, 9th edition (1980) National Academy of Sciences. Second values in cells indicate where RDA values are slightly different for females than for males.
Data Analysis - 20
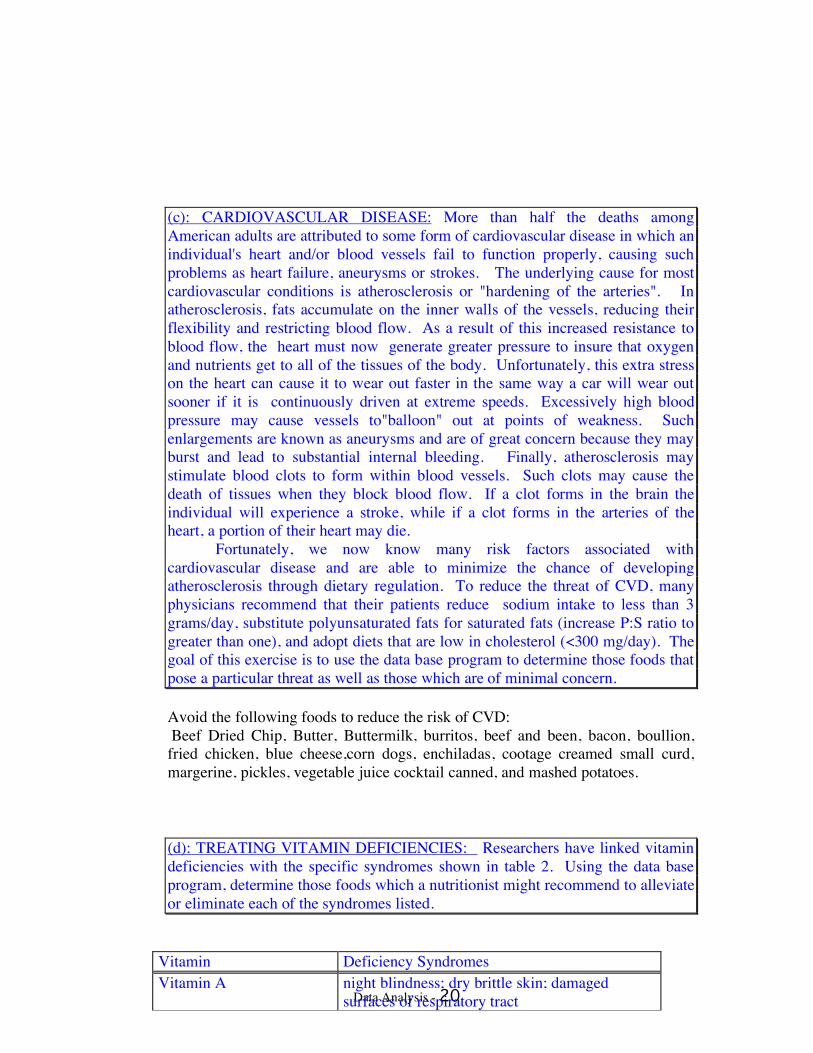
(c): CARDIOVASCULAR DISEASE: More than half the deaths among American adults are attributed to some form of cardiovascular disease in which an individual's heart and/or blood vessels fail to function properly, causing such problems as heart failure, aneurysms or strokes. The underlying cause for most cardiovascular conditions is atherosclerosis or "hardening of the arteries". In atherosclerosis, fats accumulate on the inner walls of the vessels, reducing their flexibility and restricting blood flow. As a result of this increased resistance to blood flow, the heart must now generate greater pressure to insure that oxygen and nutrients get to all of the tissues of the body. Unfortunately, this extra stress on the heart can cause it to wear out faster in the same way a car will wear out sooner if it is continuously driven at extreme speeds. Excessively high blood pressure may cause vessels to"balloon" out at points of weakness. Such enlargements are known as aneurysms and are of great concern because they may burst and lead to substantial internal bleeding. Finally, atherosclerosis may stimulate blood clots to form within blood vessels. Such clots may cause the death of tissues when they block blood flow. If a clot forms in the brain the individual will experience a stroke, while if a clot forms in the arteries of the heart, a portion of their heart may die. Fortunately, we now know many risk factors associated with cardiovascular disease and are able to minimize the chance of developing atherosclerosis through dietary regulation. To reduce the threat of CVD, many physicians recommend that their patients reduce sodium intake to less than 3 grams/day, substitute polyunsaturated fats for saturated fats (increase P:S ratio to greater than one), and adopt diets that are low in cholesterol (<300 mg/day). The goal of this exercise is to use the data base program to determine those foods that pose a particular threat as well as those which are of minimal concern. Avoid the following foods to reduce the risk of CVD: Beef Dried Chip, Butter, Buttermilk, burritos, beef and been, bacon, boullion, fried chicken, blue cheese,corn dogs, enchiladas, cootage creamed small curd, margerine, pickles, vegetable juice cocktail canned, and mashed potatoes. (d): TREATING VITAMIN DEFICIENCIES: Researchers have linked vitamin deficiencies with the specific syndromes shown in table 2. Using the data base program, determine those foods which a nutritionist might recommend to alleviate or eliminate each of the syndromes listed.
Vitamin Deficiency Syndromes Vitamin A night blindness; dry brittle skin; damaged
surfaces of respiratory tract Thiamin (B1) beriberi (muscle atrophy, paralysis, congestive
heart failure, mental confusion) Riboflavin (B2) ariboflavinosis (dermatitis, hypersensitivity to
light, reddening of the cornea) Niacin pellagra (dermatitis, diarrhea, mental confusion,
Data Analysis - 21
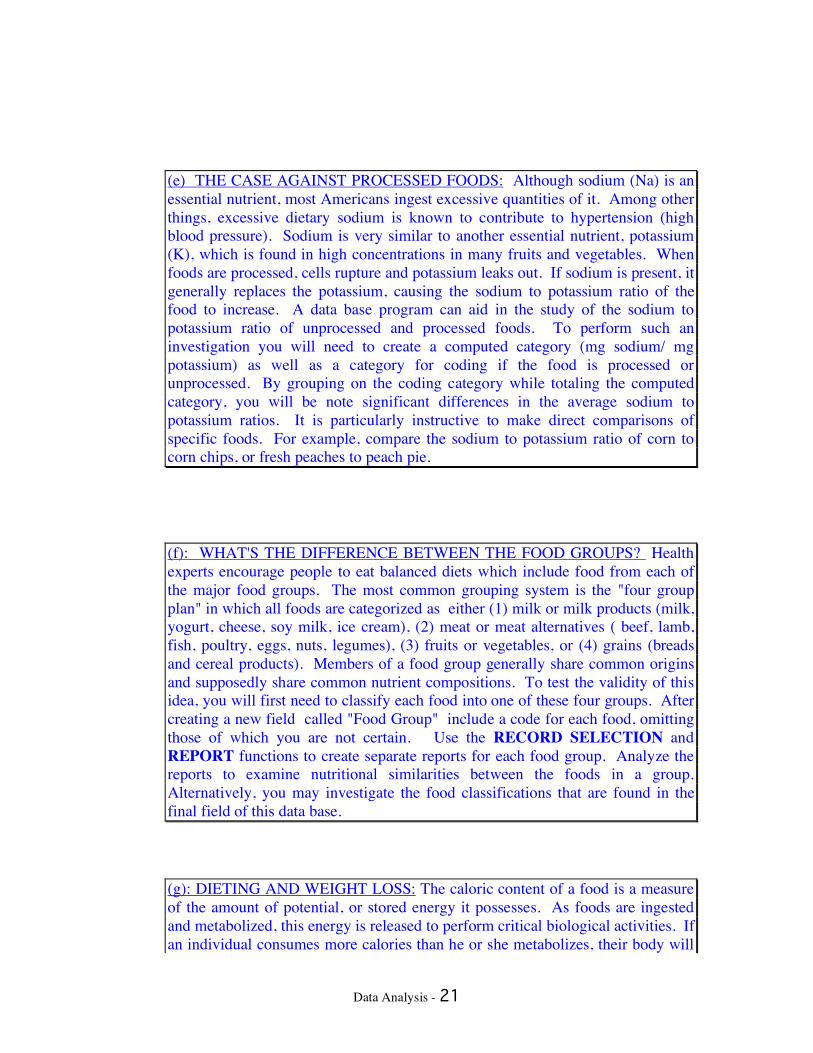
(e) THE CASE AGAINST PROCESSED FOODS: Although sodium (Na) is an essential nutrient, most Americans ingest excessive quantities of it. Among other things, excessive dietary sodium is known to contribute to hypertension (high blood pressure). Sodium is very similar to another essential nutrient, potassium (K), which is found in high concentrations in many fruits and vegetables. When foods are processed, cells rupture and potassium leaks out. If sodium is present, it generally replaces the potassium, causing the sodium to potassium ratio of the food to increase. A data base program can aid in the study of the sodium to potassium ratio of unprocessed and processed foods. To perform such an investigation you will need to create a computed category (mg sodium/ mg potassium) as well as a category for coding if the food is processed or unprocessed. By grouping on the coding category while totaling the computed category, you will be note significant differences in the average sodium to potassium ratios. It is particularly instructive to make direct comparisons of specific foods. For example, compare the sodium to potassium ratio of corn to corn chips, or fresh peaches to peach pie. (f): WHAT'S THE DIFFERENCE BETWEEN THE FOOD GROUPS? Health experts encourage people to eat balanced diets which include food from each of the major food groups. The most common grouping system is the "four group plan" in which all foods are categorized as either (1) milk or milk products (milk, yogurt, cheese, soy milk, ice cream), (2) meat or meat alternatives ( beef, lamb, fish, poultry, eggs, nuts, legumes), (3) fruits or vegetables, or (4) grains (breads and cereal products). Members of a food group generally share common origins and supposedly share common nutrient compositions. To test the validity of this idea, you will first need to classify each food into one of these four groups. After creating a new field called "Food Group" include a code for each food, omitting those of which you are not certain. Use the RECORD SELECTION and REPORT functions to create separate reports for each food group. Analyze the reports to examine nutritional similarities between the foods in a group. Alternatively, you may investigate the food classifications that are found in the final field of this data base. (g): DIETING AND WEIGHT LOSS: The caloric content of a food is a measure of the amount of potential, or stored energy it possesses. As foods are ingested and metabolized, this energy is released to perform critical biological activities. If an individual consumes more calories than he or she metabolizes, their body will

Data Analysis - 22
generally respond by storing this excess energy as fat. Although a certain amount of fat is essential, excessive quantities may contribute to a variety of physical problems. People who have difficulty maintaining their weight within recommended limits should consider reducing their caloric intake. Using the data base, determine those foods that should be avoided by those who are battling to reduce their weight. Also construct a list of those foods that have high nutritional value while offering a minimum of calories. (Note that 1 kcal = 1 Cal).