Embed Size (px)
Citation preview

Supplier KPI Project MeetingHalliburton - Feb 27th 2013
Daryl Fullerton, PIDX International / Pervasive
Mike Washington, ConocoPhillips
© PIDX, Inc. 2012
Supplier KPI Meeting Feb 27th 2013
© PIDX, Inc. 2011
1. HSE / PIDX Antitrust / Safety Moment (5 Mins)
2. Project Overview (30 Mins)• Problem / Project Aims & Objectives
• Project ROI To Industry
3. Attendee Introductions / Round the Room (1 hour )
4. Apples with Apples – The need for Standards (20 Mins)
5. Coffee Break (20 Mins)
6. Presentation - ConocoPhillips SPM Initiative (30 Mins)
7. Project status (50 Mins)– Status Project plan
– Roadmap – Short / Long term
– Outcomes from Last Meeting
– Involvement / Responsibilities
8. Lunch / Networking
9. Review Current KPI Data Dictionary (30 Mins)– KPI Data Dictionary ( Overview of Current State)
– KPI Supplier Performance areas/categories
10. Wrap Up / Actions / Next meeting (30 Mins)– Actions bullets – Individual To do’s
– Rough- cut agenda discussions for Next Meeting
HSE Briefing
Dan Collins(Halliburton)
PIDX Anti Trust
Participant Forms
© PIDX, Inc. 2012
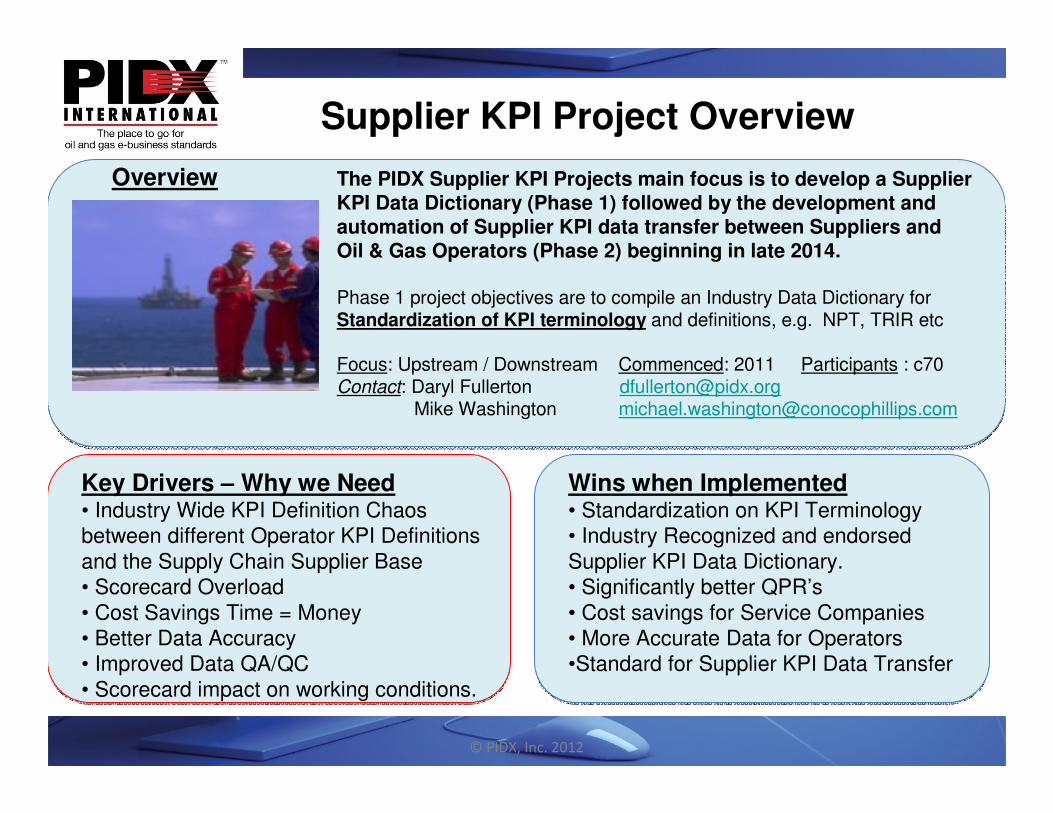
Supplier KPI Project Overview
Overview The PIDX Supplier KPI Projects main focus is to develop a Supplier KPI Data Dictionary (Phase 1) followed by the development and automation of Supplier KPI data transfer between Suppliers and Oil & Gas Operators (Phase 2) beginning in late 2014.
Phase 1 project objectives are to compile an Industry Data Dictionary for Standardization of KPI terminology and definitions, e.g. NPT, TRIR etc
Focus: Upstream / Downstream Commenced: 2011 Participants : c70 Contact: Daryl Fullerton [email protected]
Mike Washington [email protected]
Wins when Implemented• Standardization on KPI Terminology• Industry Recognized and endorsed Supplier KPI Data Dictionary.• Significantly better QPR’s• Cost savings for Service Companies• More Accurate Data for Operators •Standard for Supplier KPI Data Transfer
Key Drivers – Why we Need• Industry Wide KPI Definition Chaos between different Operator KPI Definitions and the Supply Chain Supplier Base• Scorecard Overload• Cost Savings Time = Money• Better Data Accuracy• Improved Data QA/QC• Scorecard impact on working conditions.

Key Performance Indicators and Role in SPM
• What are Supplier KPI’s – Target Driven Metric Indicators that help you maximise savings, improve quality and reduce incidents with your organisations supplier base.
• Common KPI Categories in SPM may Include:
Cost / P2P - Spend Overruns, Non Productive Time, DSOs, DPO’s, Payment to Net Terms Compliance Ratio
Delivery- Service Delivery, Product Delivery, On Time Logistics
HSE - Safety Record, Accidents, Spills, Near Misses
Quality - Job Quality, Product Quality
Risk - Late Delivery, Management, Staff Turnarounds, DIO.
Efficiency - Days 10k, NPT, Right First Time
Behavior / Innovation - New Ideas, Creativity, Value Add
Right First Time Invoices, Invoice Error Ratio

Performance KPI and Targets Examples
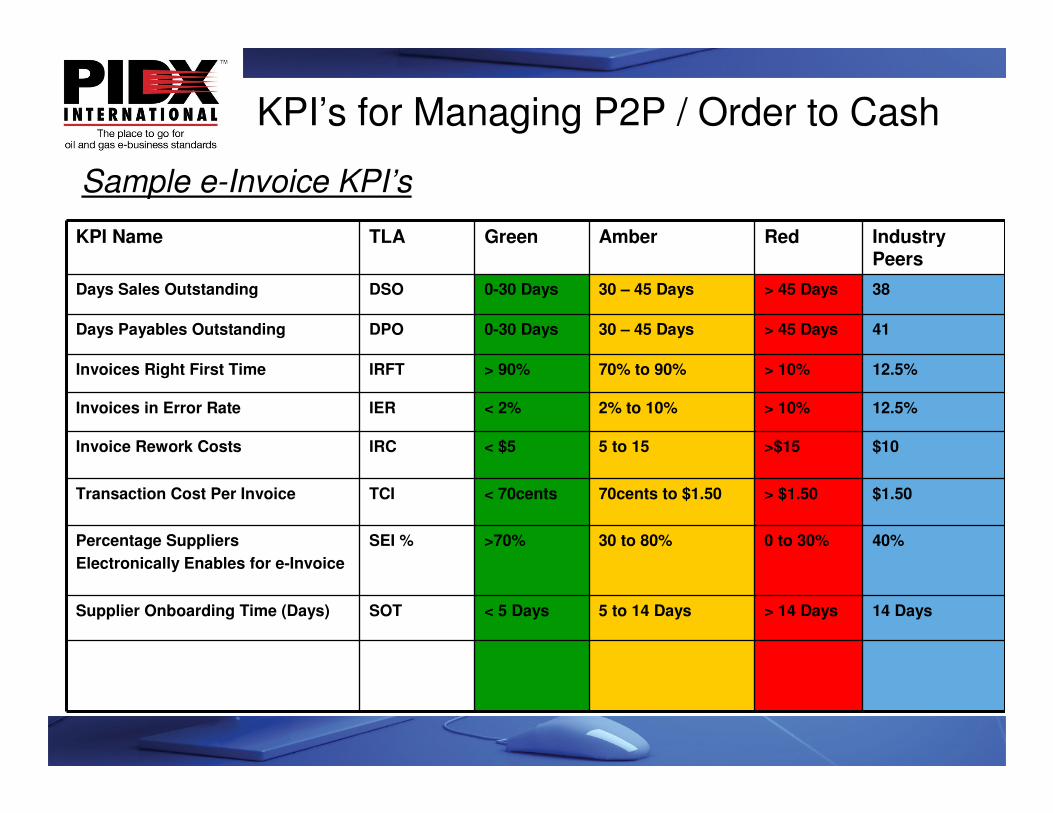
KPI’s for Managing P2P / Order to Cash
Sample e-Invoice KPI’s
KPI Name TLA Green Amber Red Industry Peers
Days Sales Outstanding DSO 0-30 Days 30 – 45 Days > 45 Days 38
Days Payables Outstanding DPO 0-30 Days 30 – 45 Days > 45 Days 41
Invoices Right First Time IRFT > 90% 70% to 90% > 10% 12.5%
Invoices in Error Rate IER < 2% 2% to 10% > 10% 12.5%
Invoice Rework Costs IRC < $5 5 to 15 >$15 $10
Transaction Cost Per Invoice TCI < 70cents 70cents to $1.50 > $1.50 $1.50
Percentage Suppliers
Electronically Enables for e-Invoice
SEI % >70% 30 to 80% 0 to 30% 40%
Supplier Onboarding Time (Days) SOT < 5 Days 5 to 14 Days > 14 Days 14 Days
© PIDX, Inc. 2012
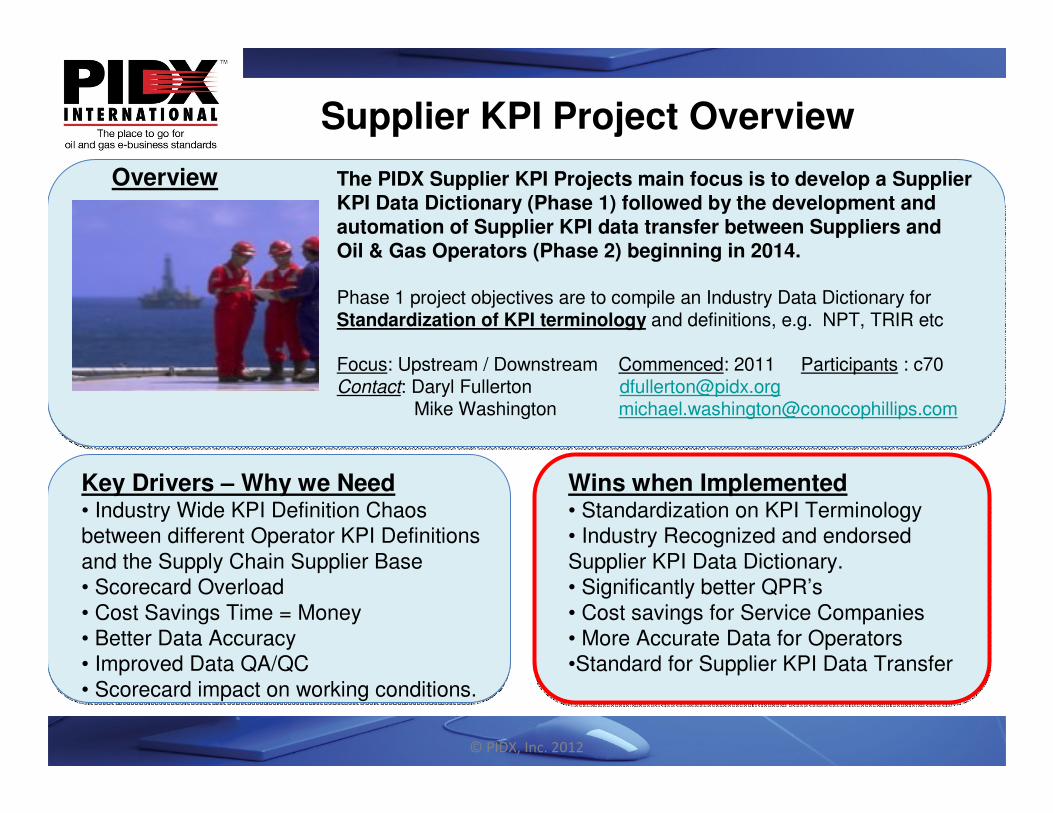
Supplier KPI Project Overview
Overview The PIDX Supplier KPI Projects main focus is to develop a Supplier KPI Data Dictionary (Phase 1) followed by the development and automation of Supplier KPI data transfer between Suppliers and Oil & Gas Operators (Phase 2) beginning in 2014.
Phase 1 project objectives are to compile an Industry Data Dictionary for Standardization of KPI terminology and definitions, e.g. NPT, TRIR etc
Focus: Upstream / Downstream Commenced: 2011 Participants : c70 Contact: Daryl Fullerton [email protected]
Mike Washington [email protected]
Wins when Implemented• Standardization on KPI Terminology• Industry Recognized and endorsed Supplier KPI Data Dictionary.• Significantly better QPR’s• Cost savings for Service Companies• More Accurate Data for Operators •Standard for Supplier KPI Data Transfer
Key Drivers – Why we Need• Industry Wide KPI Definition Chaos between different Operator KPI Definitions and the Supply Chain Supplier Base• Scorecard Overload• Cost Savings Time = Money• Better Data Accuracy• Improved Data QA/QC• Scorecard impact on working conditions.

© PIDX, Inc. 2012
Project ContactsProject Chair: Daryl Fullerton Email : [email protected] has been working within the Oil & Gas Industry for the last 12 years. His area of specialism is Supply Chain & Procurement Management Solutions including Supplier Performance Management Systems, Supplier Risk Management, HSE Performance Management, Drilling Performance Management, P2P, B2B integration, and eInvoicing. Clients he has worked for include BP, BG-Group, ConocoPhillips, Chevron, Noble Energy, Origin Energy, Oxy, Respol, Shell and TNK-BP. Daryl now works with Pervasive Software as Oil & Gas Industry Principal.
Daryl is Chair of the PIDX Supplier KPI Standard Workgroup and is actively working with Operators and Service Companies to better define Supplier KPI Terminology and to automate this data gathering process. He is also a Member of the Aberdeen Group Global Supply Chain Research Council.Daryl studied Accountancy at University College Galway and went on to complete a MA in Advanced Accounting and MSc in Computing and Information Systems, Daryl is a member of SPE, IADC, ISM and a frequent speaker at Oil & Gas Supply Chain Conferences.
Project ViceChair : Michael Washington Email : [email protected], has been working within the Oil & Gas Industry for the last 8 years and is currently in the role of Integrated Performance Lead at Conoco Phillips. His area of specialism is Global Supplier Performance Management, KPI development and Quality Performance reviews, Software Implementation, Performance Management tools, Metrics, Economic modeling & analysis, Supplier Risk Management, Business Planning, Production scheduling, Procurement, Supply Chain, Material Planning, HSE Performance Management, Drilling & Completions Performance Management, Strategic Sourcing, and Process and Quality Management
Michael is Vice Chair of the PIDX Supplier KPI Standard Workgroup and is actively working with Operators and Service Companies to better define Supplier KPI Terminology and to automate this data gathering process and has participated in several Oil & Gas Supply Chain ConferencesHe acquired his BBA at Sam Houston State University, Michael is a member of ISM, SPE, APICS, and has a Six Sigma Green belt Certification, and APICS certification courses

PIDX Supplier KPI
ROI for The Oil & Gas Industry

$What is the cost of Not developing a
PIDX Supplier KPI Standard ?
What is the estimated saving to both Operator and Service Companies if we do ?

Estimating the Cost of Scorecarding and PIDX Standard Savings
MS Excel Approach
MS Excel Scorecards & Reports
Data Input Approval Reports QPR Total
1 Scorecard 1 0.5 0.25 1
Cost per hour $100 $100 $100 $100
$100 $50 $25 $100
No of Catagory Lines 15 15 15 15
$1,500 $750 $375 $1,500 $4,125
No of Jobs Per Region 15 15 15 15
$22,500.00 $11,250.00 $5,625.00 $22,500.00 $61,875
No of Regions 20.00 20.00 20.00 20.00
$450,000.00 $225,000.00 $112,500.00 $450,000.00 $1,237,500
Frequency (Mthly) 12 12 12 4
Cost Per Company $5,400,000.00 $2,700,000.00 $1,350,000.00 $1,800,000.00 $11,250,000.00
Number of Service Cos 20 20 20 20
Total Industry Cost $108,000,000.00 $54,000,000.00 $27,000,000.00 $36,000,000.00 $225,000,000.00
Assumptions = 20 Operstors and 20 Service Cos

Web Based Scorecards & Reports & PIDX Standard
Data Input Approval Reports QPR Total
1 Scorecard 1 0.5 0.25 1Cost per hour $100 $100 $100 $100
$100 $50 $25 $100
No of Catagory Lines 15 15 15 15
$1,500 $750 $375 $1,500 $4,125No of Jobs Per Region 15 15 15 15
$22,500.00 $11,250.00 $5,625.00 $22,500.00 $61,875
No of Regions 20.00 20.00 20.00 20.00
$450,000.00 $225,000.00 $112,500.00 $450,000.00 $1,237,500Frequency (Mthly) 12 12 12 4
Cost Per Company $5,400,000.00 $2,700,000.00 $1,350,000.00 $1,800,000.00 $11,250,000.00
Number of Service Cos 20 20 20 20
Total Industry Cost $108,000,000.00 $54,000,000.00 $27,000,000.00 $36,000,000.00 $225,000,000.00
60% Efficiency Savings $64,800,000.00 $32,400,000.00 $16,200,000.00 $21,600,000.00 $135,000,000.00
Total Cost Year $43,200,000.00 $21,600,000.00 $10,800,000.00 $14,400,000.00 $90,000,000.00
Assumptions = 20 Operstors and 20 Service Cos
Estimating the Cost of Scorecarding and PIDX Standard Savings
PIDX Standard Data Automation

Success – PIDX Standard for AutomatedTransmission of KPI Data between Suppliers and
Operators
SPM
140 Data Inputs
SPM
26 Data Inputs
KPI Data Inputs
Operator 1
Service Co 1
Service Co 2
Service Co 3
Operator 2
Service Co 1
Service Co 2
Service Co 3
Clients
70 KPI Data Inputs
Service Co 3 CRM

ERROR: stackunderflow
OFFENDING COMMAND: ~
STACK: