Embed Size (px)
Citation preview
Coastal Engineering 83 (2014) 24–35
Contents lists available at ScienceDirect
Coastal Engineering
j ourna l homepage: www.e lsev ie r .com/ locate /coasta leng
Damage pattern and damage progression on breakwater roundheadsunder multidirectional waves
F. Comola a,c,⁎, T. Lykke Andersen b, L. Martinelli a, H.F. Burcharth b, P. Ruol a
a Dept. of Civil, Environmental and Architectural Engineering, Università di Padova, Italyb Dept. of Civil Engineering, Aalborg University, Denmarkc CRYOS, School of Architecture, Civil and Environmental Engineering, École Polytechnique Fédérale de Lausanne, Switzerland
⁎ Corresponding author at: EPFL ENAC IIE CRYOS, GLausanne.
0378-3839/$ – see front matter © 2013 Elsevier B.V. All rihttp://dx.doi.org/10.1016/j.coastaleng.2013.09.004
a b s t r a c t
a r t i c l e i n f oArticle history:Received 19 November 2012Received in revised form 25 June 2013Accepted 18 September 2013Available online 17 October 2013
Keywords:Damage patternPhysical modelRubble mound breakwaterBreakwater roundheadStability number
An experimental model test study is carried out to investigate damage pattern and progression on a rockarmoured breakwater roundhead subjected to multidirectional waves. Concerning damage pattern, the mostcritical sector is observed to shift leeward with increasing wave period. Taking angles relative to mean wave di-rection, the critical sector is observed in the sector 10°–55° for short waves and in the sector 100°–145° for longwaves. A probabilistic approach is developed to predict for one typical roundhead geometry the damage distri-bution depending on the incomingwaves and structural characteristics. The damage progression is observed de-pendent on significant wave height and peak wave period, but not on the directional spreading and the spectralwidth of the incident waves. Combining the results of both damage pattern and damage progression, a stabilityformula for the distribution of damage over the roundhead is developed. Thus the formula also considers theshifting of the critical sector due to increasing wave period which existing formulae do not include. Finally,analysing the damage produced by double peaked spectra, it is shown that the armour may be designed by theformula when using the total significant wave height and an equivalent peak period.
© 2013 Elsevier B.V. All rights reserved.
1. Introduction
The roundhead is a critical section of a rubble-mound breakwater interms of armour unit stability. In fact the roundhead requires armourunits that are significantly larger than on the trunk. This is due to anenergy concentration at the roundhead caused by the combination ofrefraction, diffraction and shoaling butmainly due to the lack of supportfrom neighbour armour units, and the large overflow velocities. More-over, the stones are less interlocked and, if displaced, they are movedtowards the rear side, failing to provide any residual stability to thesection.
Over the last decades, many experimental studies have provided adeeper knowledge on roundhead stability, investigating the effect ofthe main hydraulic and structural parameters. Vidal et al. (1989,1991), carrying out experiments using concrete cubes, observed thatwave steepness has no effect on the occurrence of the start of damage,but has a noteworthy influence on damage progression. The sameinfluence was observed by Madrigal and Lozano (1992) and byBerenguer and Baonza (1999). Carver and Heimbaugh (1989) observedthat, for rock and dolos units, the minimum of stability occurs for aspecific value of Iribarren number. The results obtained by Matsumiet al. (1996) evidenced that the spatial correlation of velocity
R B0 421, Station 2, CH–1015
ghts reserved.
magnitudes around the roundhead is much stronger under longwaves than under short waves. Burcharth et al. (2003) identified a suit-able parameter, given by a combination of Hs, Tm and Dn, to characterizethe threshold for damage initiation. A large number of authors,e.g. Jensen (1984), Vidal et al. (1991), Madrigal and Lozano (1992),Berenguer and Baonza (1999), Matsumi et al. (2000), and Burcharthet al. (2003), identified the effect of incident wave angle by observingthat the most critical part of the roundhead is always in a sectorbetween 90° and 150° from the wave mean direction. Maciñeira andBurcharth (2008) also observed for a cube armoured roundhead thecritical sector to be from 90 to 135° in most of the tests. However,they observed the same damage in the sectors 45–90° and 90–135°for waves with peak wave steepness above 0.04. For head radius lessthan 12 Dn the difference in damage between sectors also was reduced.Systematic investigations performed by Matsumi et al. (1994, 1996,1998, 2000) evidenced that the load applied to armour units increasedwith the directional spreading of the waves. No significant differencesin roundhead stability between different types of armour units can beseen for roundhead stability in the investigations by Madrigal andLozano (1992), who compared Accropodes and parallelepipedic blocks,and Berenguer and Baonza (1999), who compared antifer blocks andhollowed cubes. Jensen (1984), instead, found that interlocked unitsare more stable than massive units of the same mass but suggested,like Burcharth and Thompson (1983) and Burcharth et al. (2003), thatincreasing mass density is a much more efficient way to improvestability. Finally, the effect of roundhead radius at sea water level R
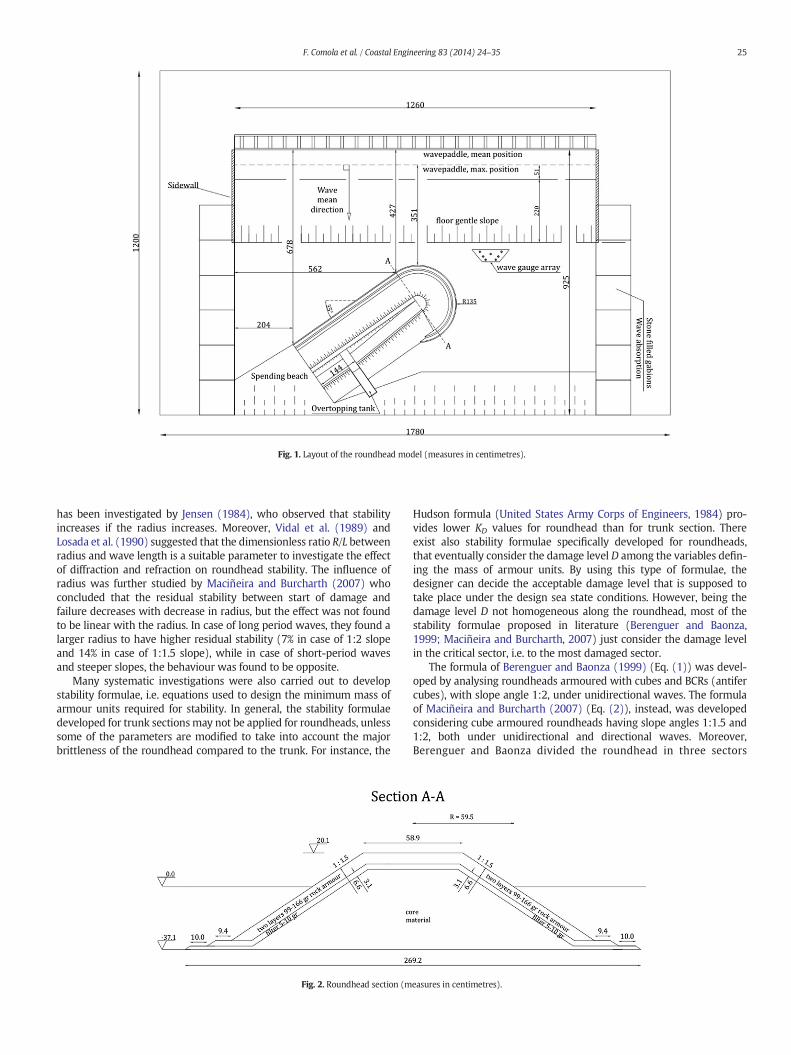
Fig. 1. Layout of the roundhead model (measures in centimetres).
25F. Comola et al. / Coastal Engineering 83 (2014) 24–35
has been investigated by Jensen (1984), who observed that stabilityincreases if the radius increases. Moreover, Vidal et al. (1989) andLosada et al. (1990) suggested that the dimensionless ratio R/L betweenradius and wave length is a suitable parameter to investigate the effectof diffraction and refraction on roundhead stability. The influence ofradius was further studied by Maciñeira and Burcharth (2007) whoconcluded that the residual stability between start of damage andfailure decreases with decrease in radius, but the effect was not foundto be linear with the radius. In case of long period waves, they found alarger radius to have higher residual stability (7% in case of 1:2 slopeand 14% in case of 1:1.5 slope), while in case of short-period wavesand steeper slopes, the behaviour was found to be opposite.
Many systematic investigations were also carried out to developstability formulae, i.e. equations used to design the minimum mass ofarmour units required for stability. In general, the stability formulaedeveloped for trunk sectionsmay not be applied for roundheads, unlesssome of the parameters are modified to take into account the majorbrittleness of the roundhead compared to the trunk. For instance, the
Fig. 2. Roundhead section (m
Hudson formula (United States Army Corps of Engineers, 1984) pro-vides lower KD values for roundhead than for trunk section. Thereexist also stability formulae specifically developed for roundheads,that eventually consider the damage level D among the variables defin-ing the mass of armour units. By using this type of formulae, thedesigner can decide the acceptable damage level that is supposed totake place under the design sea state conditions. However, being thedamage level D not homogeneous along the roundhead, most of thestability formulae proposed in literature (Berenguer and Baonza,1999; Maciñeira and Burcharth, 2007) just consider the damage levelin the critical sector, i.e. to the most damaged sector.
The formula of Berenguer and Baonza (1999) (Eq. (1)) was devel-oped by analysing roundheads armoured with cubes and BCRs (antifercubes), with slope angle 1:2, under unidirectional waves. The formulaof Maciñeira and Burcharth (2007) (Eq. (2)), instead, was developedconsidering cube armoured roundheads having slope angles 1:1.5 and1:2, both under unidirectional and directional waves. Moreover,Berenguer and Baonza divided the roundhead in three sectors
easures in centimetres).
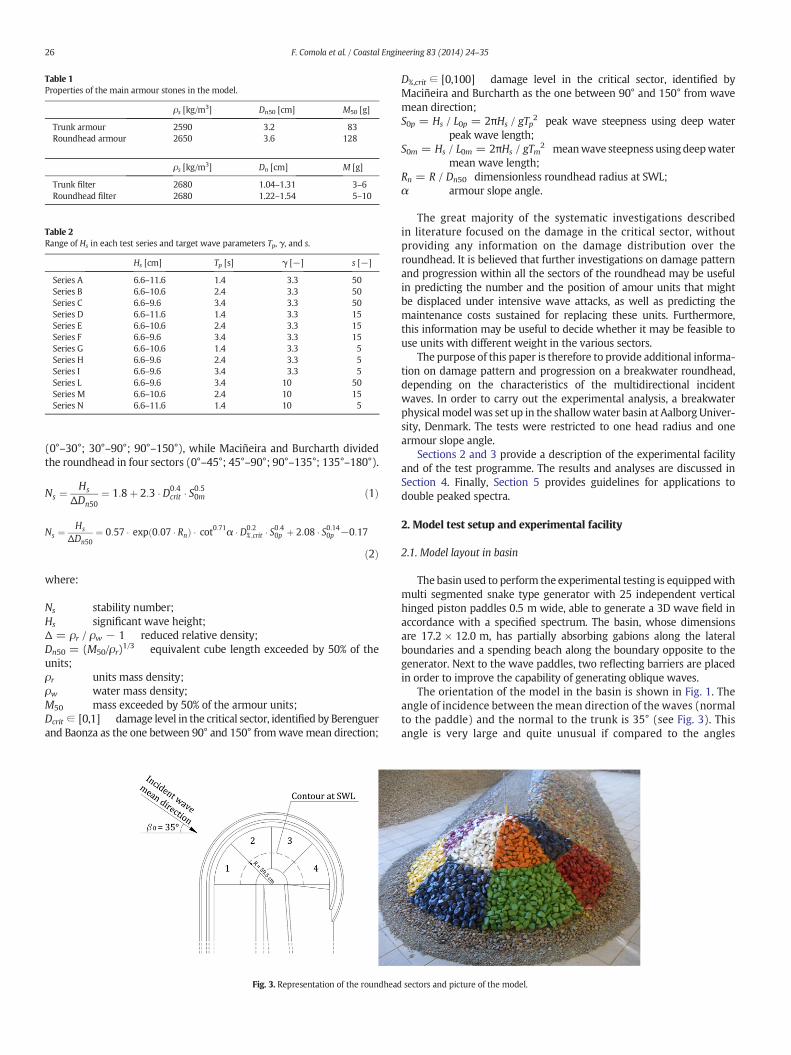
Table 1Properties of the main armour stones in the model.
ρs [kg/m3] Dn50 [cm] M50 [g]
Trunk armour 2590 3.2 83Roundhead armour 2650 3.6 128
ρs [kg/m3] Dn [cm] M [g]
Trunk filter 2680 1.04–1.31 3–6Roundhead filter 2680 1.22–1.54 5–10
Table 2Range of Hs in each test series and target wave parameters Tp, γ, and s.
Hs [cm] Tp [s] γ [−] s [−]
Series A 6.6–11.6 1.4 3.3 50Series B 6.6–10.6 2.4 3.3 50Series C 6.6–9.6 3.4 3.3 50Series D 6.6–11.6 1.4 3.3 15Series E 6.6–10.6 2.4 3.3 15Series F 6.6–9.6 3.4 3.3 15Series G 6.6–10.6 1.4 3.3 5Series H 6.6–9.6 2.4 3.3 5Series I 6.6–9.6 3.4 3.3 5Series L 6.6–9.6 3.4 10 50Series M 6.6–10.6 2.4 10 15Series N 6.6–11.6 1.4 10 5
26 F. Comola et al. / Coastal Engineering 83 (2014) 24–35
(0°–30°; 30°–90°; 90°–150°), while Maciñeira and Burcharth dividedthe roundhead in four sectors (0°–45°; 45°–90°; 90°–135°; 135°–180°).
Ns ¼Hs
ΔDn50¼ 1:8þ 2:3 � D0:4
crit � S0:50m ð1Þ
Ns ¼Hs
ΔDn50¼ 0:57 � exp 0:07 � Rnð Þ � cot0:71α � D0:2
% ;crit � S0:40p þ 2:08 � S0:140p −0:17
ð2Þ
where:
Ns stability number;Hs significant wave height;Δ = ρr / ρw − 1 reduced relative density;Dn50 = (M50/ρr)1/3 equivalent cube length exceeded by 50% of theunits;ρr units mass density;ρw water mass density;M50 mass exceeded by 50% of the armour units;Dcrit ∈ [0,1] damage level in the critical sector, identified by Berenguerand Baonza as the one between 90° and 150° fromwavemean direction;
Fig. 3. Representation of the roundhead
D%,crit ∈ [0,100] damage level in the critical sector, identified byMaciñeira and Burcharth as the one between 90° and 150° from wavemean direction;S0p = Hs / L0p = 2πHs / gTp2 peak wave steepness using deep water
peak wave length;S0m = Hs / L0m = 2πHs / gTm2 meanwave steepness usingdeepwater
mean wave length;Rn = R / Dn50 dimensionless roundhead radius at SWL;α armour slope angle.
The great majority of the systematic investigations describedin literature focused on the damage in the critical sector, withoutproviding any information on the damage distribution over theroundhead. It is believed that further investigations on damage patternand progression within all the sectors of the roundhead may be usefulin predicting the number and the position of amour units that mightbe displaced under intensive wave attacks, as well as predicting themaintenance costs sustained for replacing these units. Furthermore,this information may be useful to decide whether it may be feasible touse units with different weight in the various sectors.
The purpose of this paper is therefore to provide additional informa-tion on damage pattern and progression on a breakwater roundhead,depending on the characteristics of the multidirectional incidentwaves. In order to carry out the experimental analysis, a breakwaterphysicalmodel was set up in the shallowwater basin at Aalborg Univer-sity, Denmark. The tests were restricted to one head radius and onearmour slope angle.
Sections 2 and 3 provide a description of the experimental facilityand of the test programme. The results and analyses are discussed inSection 4. Finally, Section 5 provides guidelines for applications todouble peaked spectra.
2. Model test setup and experimental facility
2.1. Model layout in basin
The basin used to perform the experimental testing is equippedwithmulti segmented snake type generator with 25 independent verticalhinged piston paddles 0.5 m wide, able to generate a 3D wave field inaccordance with a specified spectrum. The basin, whose dimensionsare 17.2 × 12.0 m, has partially absorbing gabions along the lateralboundaries and a spending beach along the boundary opposite to thegenerator. Next to the wave paddles, two reflecting barriers are placedin order to improve the capability of generating oblique waves.
The orientation of the model in the basin is shown in Fig. 1. Theangle of incidence between the mean direction of the waves (normalto the paddle) and the normal to the trunk is 35° (see Fig. 3). Thisangle is very large and quite unusual if compared to the angles
sectors and picture of the model.
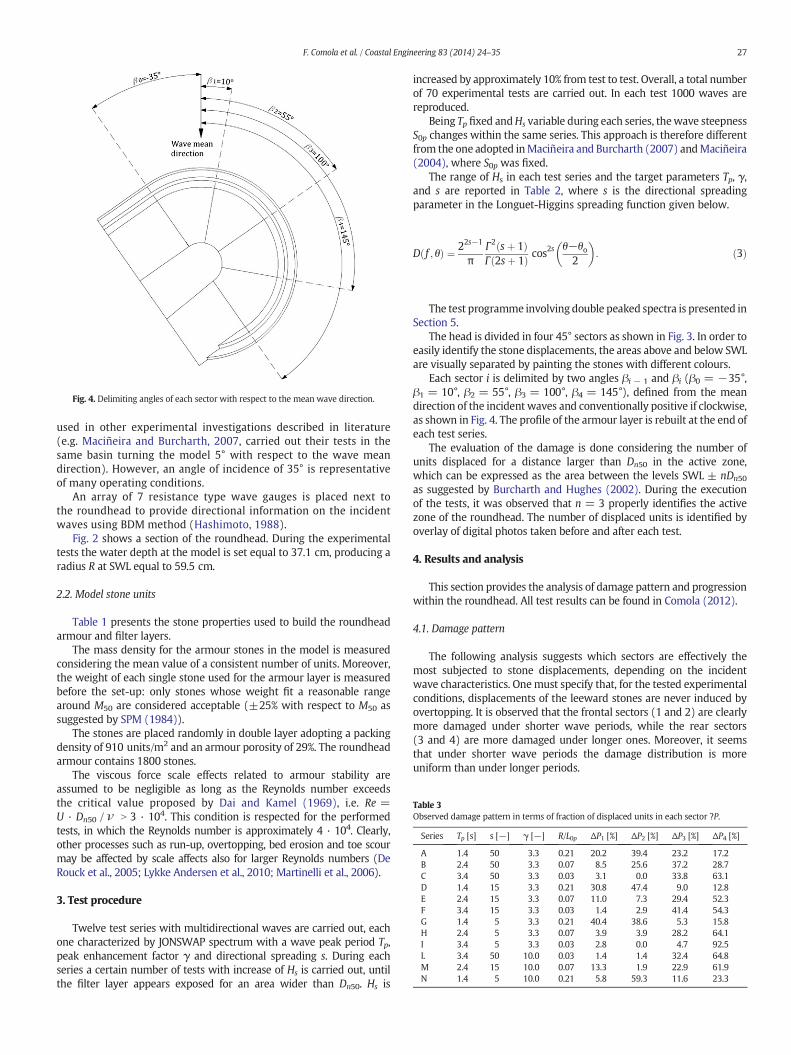
Fig. 4. Delimiting angles of each sector with respect to the mean wave direction.
Table 3Observed damage pattern in terms of fraction of displaced units in each sector ?P.
Series Tp [s] s [−] γ [−] R/L0p ΔP1 [%] ΔP2 [%] ΔP3 [%] ΔP4 [%]
A 1.4 50 3.3 0.21 20.2 39.4 23.2 17.2B 2.4 50 3.3 0.07 8.5 25.6 37.2 28.7C 3.4 50 3.3 0.03 3.1 0.0 33.8 63.1D 1.4 15 3.3 0.21 30.8 47.4 9.0 12.8E 2.4 15 3.3 0.07 11.0 7.3 29.4 52.3F 3.4 15 3.3 0.03 1.4 2.9 41.4 54.3G 1.4 5 3.3 0.21 40.4 38.6 5.3 15.8H 2.4 5 3.3 0.07 3.9 3.9 28.2 64.1I 3.4 5 3.3 0.03 2.8 0.0 4.7 92.5L 3.4 50 10.0 0.03 1.4 1.4 32.4 64.8M 2.4 15 10.0 0.07 13.3 1.9 22.9 61.9N 1.4 5 10.0 0.21 5.8 59.3 11.6 23.3
27F. Comola et al. / Coastal Engineering 83 (2014) 24–35
used in other experimental investigations described in literature(e.g. Maciñeira and Burcharth, 2007, carried out their tests in thesame basin turning the model 5° with respect to the wave meandirection). However, an angle of incidence of 35° is representativeof many operating conditions.
An array of 7 resistance type wave gauges is placed next tothe roundhead to provide directional information on the incidentwaves using BDM method (Hashimoto, 1988).
Fig. 2 shows a section of the roundhead. During the experimentaltests the water depth at the model is set equal to 37.1 cm, producing aradius R at SWL equal to 59.5 cm.
2.2. Model stone units
Table 1 presents the stone properties used to build the roundheadarmour and filter layers.
The mass density for the armour stones in the model is measuredconsidering the mean value of a consistent number of units. Moreover,the weight of each single stone used for the armour layer is measuredbefore the set-up: only stones whose weight fit a reasonable rangearound M50 are considered acceptable (±25% with respect to M50 assuggested by SPM (1984)).
The stones are placed randomly in double layer adopting a packingdensity of 910 units/m2 and an armour porosity of 29%. The roundheadarmour contains 1800 stones.
The viscous force scale effects related to armour stability areassumed to be negligible as long as the Reynolds number exceedsthe critical value proposed by Dai and Kamel (1969), i.e. Re =U · Dn50 / ν N 3 · 104. This condition is respected for the performedtests, in which the Reynolds number is approximately 4 · 104. Clearly,other processes such as run-up, overtopping, bed erosion and toe scourmay be affected by scale affects also for larger Reynolds numbers (DeRouck et al., 2005; Lykke Andersen et al., 2010; Martinelli et al., 2006).
3. Test procedure
Twelve test series with multidirectional waves are carried out, eachone characterized by JONSWAP spectrum with a wave peak period Tp,peak enhancement factor γ and directional spreading s. During eachseries a certain number of tests with increase of Hs is carried out, untilthe filter layer appears exposed for an area wider than Dn50. Hs is
increased by approximately 10% from test to test. Overall, a total numberof 70 experimental tests are carried out. In each test 1000 waves arereproduced.
Being Tp fixed andHs variable during each series, thewave steepnessS0p changes within the same series. This approach is therefore differentfrom the one adopted inMaciñeira and Burcharth (2007) andMaciñeira(2004), where S0p was fixed.
The range of Hs in each test series and the target parameters Tp, γ,and s are reported in Table 2, where s is the directional spreadingparameter in the Longuet-Higgins spreading function given below.
D f ; θð Þ ¼ 22s−1
πΓ2 sþ 1ð ÞΓ 2sþ 1ð Þ cos
2s θ−θo2
� �: ð3Þ
The test programme involving double peaked spectra is presented inSection 5.
The head is divided in four 45° sectors as shown in Fig. 3. In order toeasily identify the stone displacements, the areas above and below SWLare visually separated by painting the stones with different colours.
Each sector i is delimited by two angles βi − 1 and βi (β0 = −35°,β1 = 10°, β2 = 55°, β3 = 100°, β4 = 145°), defined from the meandirection of the incident waves and conventionally positive if clockwise,as shown in Fig. 4. The profile of the armour layer is rebuilt at the end ofeach test series.
The evaluation of the damage is done considering the number ofunits displaced for a distance larger than Dn50 in the active zone,which can be expressed as the area between the levels SWL ± nDn50
as suggested by Burcharth and Hughes (2002). During the executionof the tests, it was observed that n = 3 properly identifies the activezone of the roundhead. The number of displaced units is identified byoverlay of digital photos taken before and after each test.
4. Results and analysis
This section provides the analysis of damage pattern and progressionwithin the roundhead. All test results can be found in Comola (2012).
4.1. Damage pattern
The following analysis suggests which sectors are effectively themost subjected to stone displacements, depending on the incidentwave characteristics. Onemust specify that, for the tested experimentalconditions, displacements of the leeward stones are never induced byovertopping. It is observed that the frontal sectors (1 and 2) are clearlymore damaged under shorter wave periods, while the rear sectors(3 and 4) are more damaged under longer ones. Moreover, it seemsthat under shorter wave periods the damage distribution is moreuniform than under longer periods.
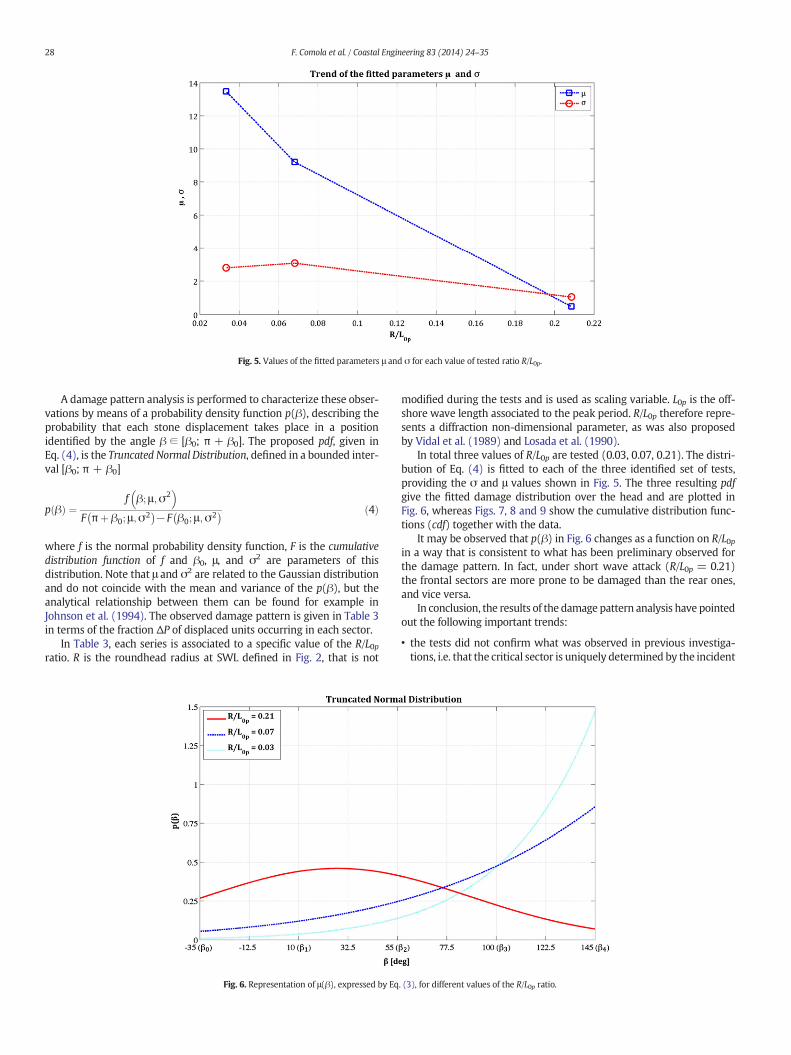
Fig. 5. Values of the fitted parameters μ and σ for each value of tested ratio R/L0p.
28 F. Comola et al. / Coastal Engineering 83 (2014) 24–35
A damage pattern analysis is performed to characterize these obser-vations by means of a probability density function p(β), describing theprobability that each stone displacement takes place in a positionidentified by the angle β ∈ [β0; π + β0]. The proposed pdf, given inEq. (4), is the Truncated Normal Distribution, defined in a bounded inter-val [β0; π + β0]
p βð Þ ¼f β; μ;σ2� �
F πþ β0; μ ;σ2
� �−F β0; μ ;σ
2� � ð4Þ
where f is the normal probability density function, F is the cumulativedistribution function of f and β0, μ, and σ2 are parameters of thisdistribution. Note that μ and σ2 are related to the Gaussian distributionand do not coincide with the mean and variance of the p(β), but theanalytical relationship between them can be found for example inJohnson et al. (1994). The observed damage pattern is given in Table 3in terms of the fraction ΔP of displaced units occurring in each sector.
In Table 3, each series is associated to a specific value of the R/L0pratio. R is the roundhead radius at SWL defined in Fig. 2, that is not
Fig. 6. Representation of μ(β), expressed by Eq
modified during the tests and is used as scaling variable. L0p is the off-shore wave length associated to the peak period. R/L0p therefore repre-sents a diffraction non-dimensional parameter, as was also proposedby Vidal et al. (1989) and Losada et al. (1990).
In total three values of R/L0p are tested (0.03, 0.07, 0.21). The distri-bution of Eq. (4) is fitted to each of the three identified set of tests,providing the σ and μ values shown in Fig. 5. The three resulting pdfgive the fitted damage distribution over the head and are plotted inFig. 6, whereas Figs. 7, 8 and 9 show the cumulative distribution func-tions (cdf) together with the data.
It may be observed that p(β) in Fig. 6 changes as a function on R/L0pin a way that is consistent to what has been preliminary observed forthe damage pattern. In fact, under short wave attack (R/L0p = 0.21)the frontal sectors are more prone to be damaged than the rear ones,and vice versa.
In conclusion, the results of the damage pattern analysis have pointedout the following important trends:
• the tests did not confirm what was observed in previous investiga-tions, i.e. that the critical sector is uniquely determined by the incident
. (3), for different values of the R/L0p ratio.
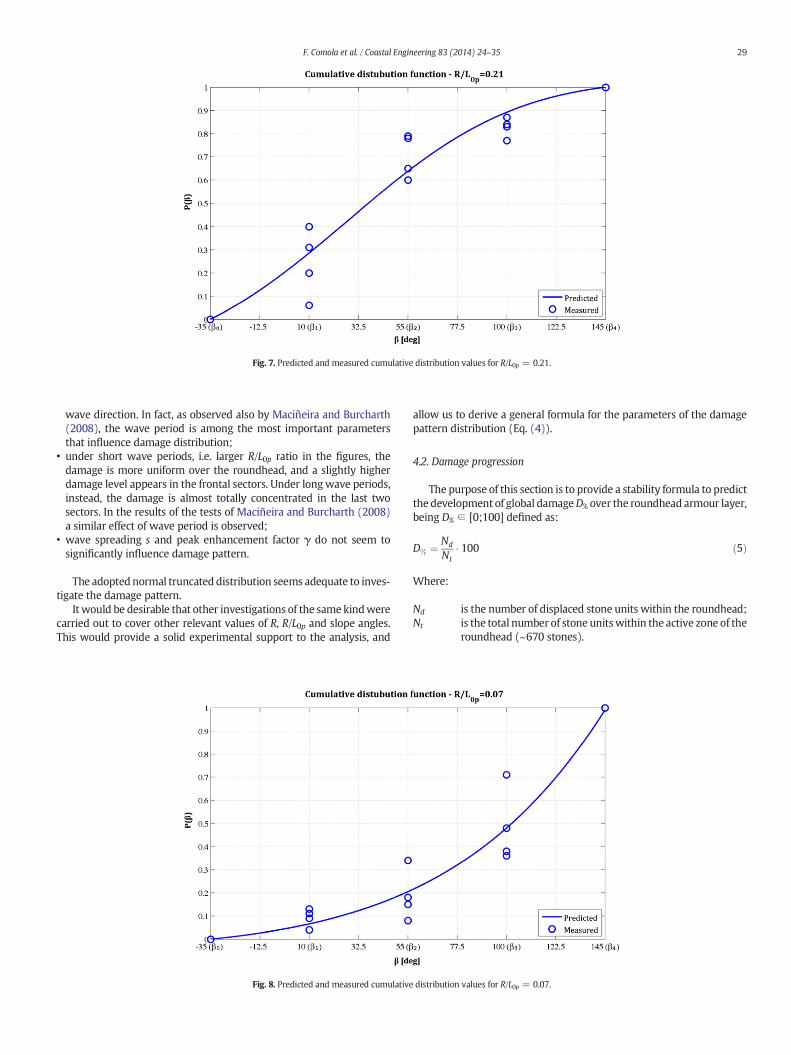
Fig. 7. Predicted and measured cumulative distribution values for R/L0p = 0.21.
29F. Comola et al. / Coastal Engineering 83 (2014) 24–35
wave direction. In fact, as observed also by Maciñeira and Burcharth(2008), the wave period is among the most important parametersthat influence damage distribution;
• under short wave periods, i.e. larger R/L0p ratio in the figures, thedamage is more uniform over the roundhead, and a slightly higherdamage level appears in the frontal sectors. Under longwave periods,instead, the damage is almost totally concentrated in the last twosectors. In the results of the tests of Maciñeira and Burcharth (2008)a similar effect of wave period is observed;
• wave spreading s and peak enhancement factor γ do not seem tosignificantly influence damage pattern.
The adopted normal truncated distribution seems adequate to inves-tigate the damage pattern.
It would be desirable that other investigations of the samekindwerecarried out to cover other relevant values of R, R/L0p and slope angles.This would provide a solid experimental support to the analysis, and
Fig. 8. Predicted and measured cumulative
allow us to derive a general formula for the parameters of the damagepattern distribution (Eq. (4)).
4.2. Damage progression
The purpose of this section is to provide a stability formula to predictthe development of global damageD% over the roundhead armour layer,being D% ∈ [0;100] defined as:
D% ¼ Nd
Nt� 100 ð5Þ
Where:
Nd is the number of displaced stone units within the roundhead;Nt is the total number of stone unitswithin the active zone of the
roundhead (~670 stones).
distribution values for R/L0p = 0.07.
Fig. 9. Predicted and measured cumulative distribution values for R/L0p = 0.03.
30 F. Comola et al. / Coastal Engineering 83 (2014) 24–35
Fig. 10 shows the trend of the experimental results in the planeNs–D%, marking with different symbols (and colours) for differentR/L0p values.
The experimental trends lead to the following main conclusions,based on Fig. (10):
• Initial damage (D% = 1 ÷ 2) seems to take place under the samestability number, regardless of the wave peak period. This confirmsthat initial damage is not influenced by wave steepness, as observedby Berenguer and Baonza (1999), Vidal et al. (1989, 1991) andMadrigal and Lozano (1992);
• Damage progression is much faster under long wave periods (R/L0p =0.03). This is consistent with the result of Maciñeira and Burcharth(2007), who observed a larger residual stability under short wavesthan under long waves;
• Damage progression is not significantly influenced by peak enhance-ment factor γ and directional spreading s (i.e. dots with same R/L0phave similar D%);
Fig. 10. Progression of global damage wit
• The failure condition is reached for a global damage level D% in range15–20, as was also observed by Berenguer and Baonza (1999), usingcubes and BCRs.
In the following analysis the structure of the formula of Berenguerand Baonza (Eq. (1)) is adopted as model, since the variables involvedin such expression are the same as considered in this study (i.e. stabilitynumber, damage level and wave steepness). The resulting stabilityformula is therefore validated for an armour slope 1:1.5 and a radiusR = 16.35Dn50. The coefficients of the formula are calibrated to fitthe trend of experimental points (Ns, D%), leading to the followingexpression:
N̂s ¼ 0:94þ 0:74 � D0:42% � S0:230p : ð6Þ
Figs. 11, 12 and 13 show the fitting of the proposed stability formula(Eq. (6)) to the experimental points, for different values of R/L0p.
h increasing significant wave height.
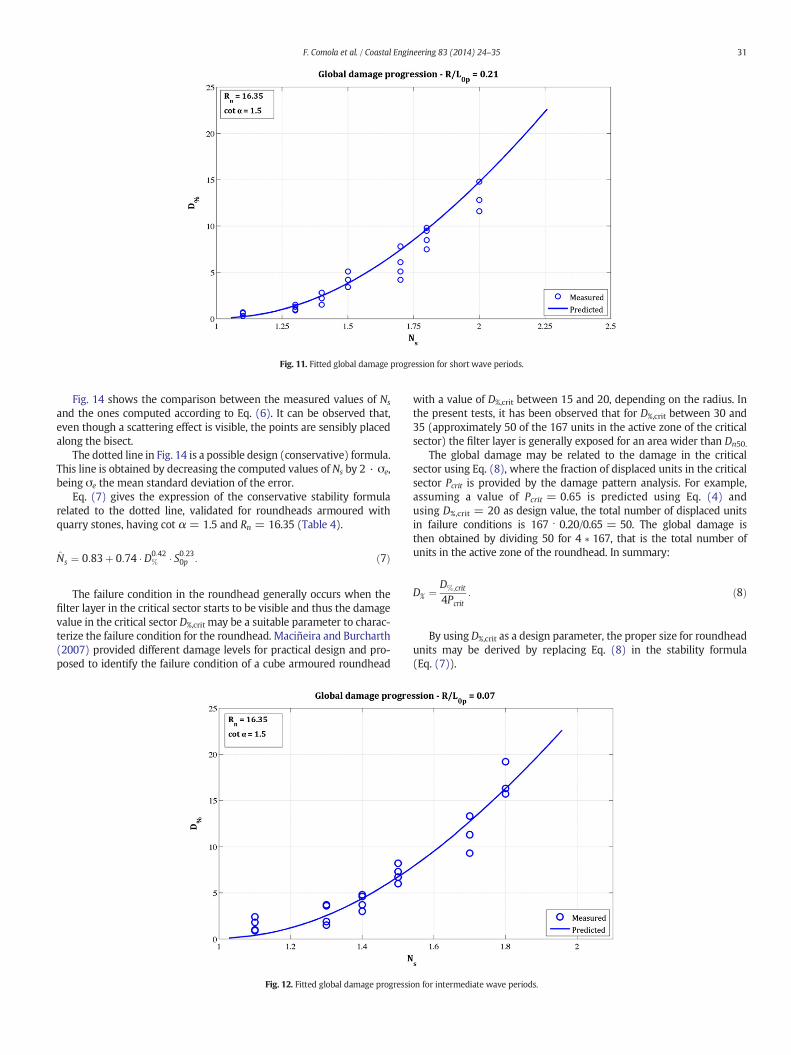
Fig. 11. Fitted global damage progression for short wave periods.
31F. Comola et al. / Coastal Engineering 83 (2014) 24–35
Fig. 14 shows the comparison between the measured values of Ns
and the ones computed according to Eq. (6). It can be observed that,even though a scattering effect is visible, the points are sensibly placedalong the bisect.
The dotted line in Fig. 14 is a possible design (conservative) formula.This line is obtained by decreasing the computed values of Ns by 2 · σe,being σe the mean standard deviation of the error.
Eq. (7) gives the expression of the conservative stability formularelated to the dotted line, validated for roundheads armoured withquarry stones, having cot α = 1.5 and Rn = 16.35 (Table 4).
N̂s ¼ 0:83þ 0:74 � D0:42% � S0:230p : ð7Þ
The failure condition in the roundhead generally occurs when thefilter layer in the critical sector starts to be visible and thus the damagevalue in the critical sector D%,crit may be a suitable parameter to charac-terize the failure condition for the roundhead. Maciñeira and Burcharth(2007) provided different damage levels for practical design and pro-posed to identify the failure condition of a cube armoured roundhead
Fig. 12. Fitted global damage progressi
with a value of D%,crit between 15 and 20, depending on the radius. Inthe present tests, it has been observed that for D%,crit between 30 and35 (approximately 50 of the 167 units in the active zone of the criticalsector) the filter layer is generally exposed for an area wider than Dn50.
The global damage may be related to the damage in the criticalsector using Eq. (8), where the fraction of displaced units in the criticalsector Pcrit is provided by the damage pattern analysis. For example,assuming a value of Pcrit = 0.65 is predicted using Eq. (4) andusing D%,crit = 20 as design value, the total number of displaced unitsin failure conditions is 167 ⋅ 0.20/0.65 = 50. The global damage isthen obtained by dividing 50 for 4 ∗ 167, that is the total number ofunits in the active zone of the roundhead. In summary:
D% ¼ D%;crit
4Pcrit: ð8Þ
By using D%,crit as a design parameter, the proper size for roundheadunits may be derived by replacing Eq. (8) in the stability formula(Eq. (7)).
on for intermediate wave periods.
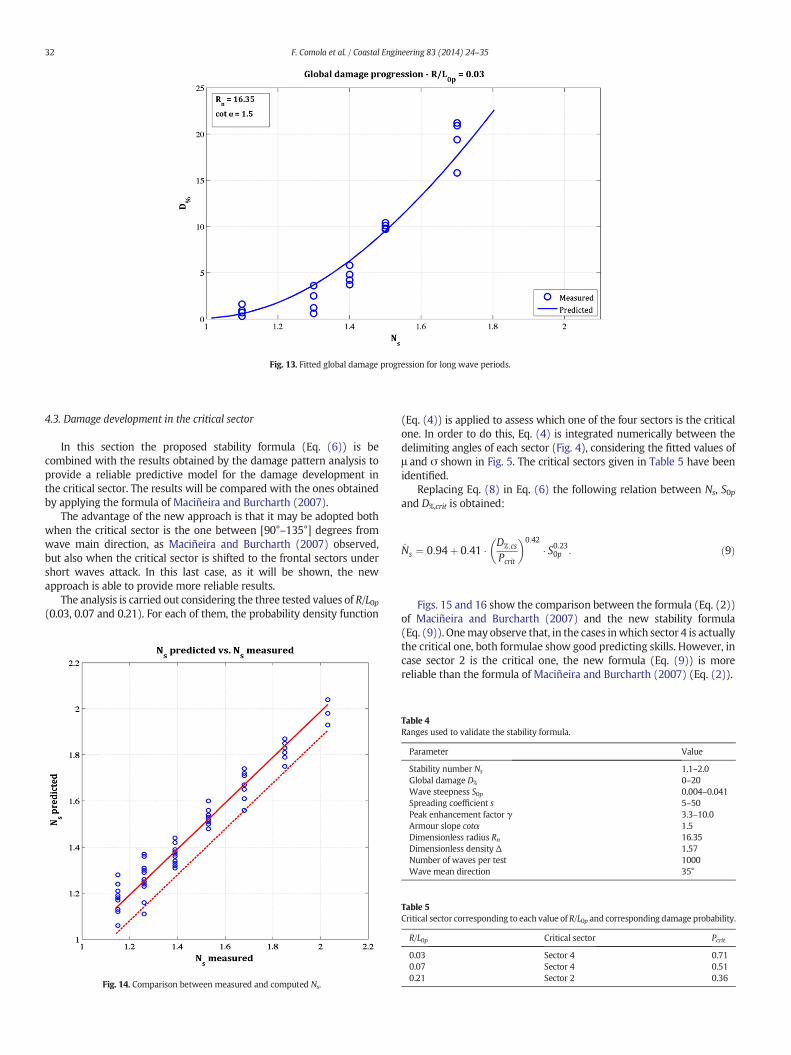
Fig. 13. Fitted global damage progression for long wave periods.
32 F. Comola et al. / Coastal Engineering 83 (2014) 24–35
4.3. Damage development in the critical sector
In this section the proposed stability formula (Eq. (6)) is becombined with the results obtained by the damage pattern analysis toprovide a reliable predictive model for the damage development inthe critical sector. The results will be compared with the ones obtainedby applying the formula of Maciñeira and Burcharth (2007).
The advantage of the new approach is that it may be adopted bothwhen the critical sector is the one between [90°–135°] degrees fromwave main direction, as Maciñeira and Burcharth (2007) observed,but also when the critical sector is shifted to the frontal sectors undershort waves attack. In this last case, as it will be shown, the newapproach is able to provide more reliable results.
The analysis is carried out considering the three tested values of R/L0p(0.03, 0.07 and 0.21). For each of them, the probability density function
Fig. 14. Comparison between measured and computed Ns.
(Eq. (4)) is applied to assess which one of the four sectors is the criticalone. In order to do this, Eq. (4) is integrated numerically between thedelimiting angles of each sector (Fig. 4), considering the fitted values ofμ and σ shown in Fig. 5. The critical sectors given in Table 5 have beenidentified.
Replacing Eq. (8) in Eq. (6) the following relation between Ns, S0pand D%,crit is obtained:
N̂s ¼ 0:94þ 0:41 � D%;cs
Pcrit
� �0:42
� S0:230p : ð9Þ
Figs. 15 and 16 show the comparison between the formula (Eq. (2))of Maciñeira and Burcharth (2007) and the new stability formula(Eq. (9)). Onemay observe that, in the cases inwhich sector 4 is actuallythe critical one, both formulae show good predicting skills. However, incase sector 2 is the critical one, the new formula (Eq. (9)) is morereliable than the formula of Maciñeira and Burcharth (2007) (Eq. (2)).
Table 4Ranges used to validate the stability formula.
Parameter Value
Stability number Ns 1.1–2.0Global damage D% 0–20Wave steepness S0p 0.004–0.041Spreading coefficient s 5–50Peak enhancement factor γ 3.3–10.0Armour slope cotα 1.5Dimensionless radius Rn 16.35Dimensionless density Δ 1.57Number of waves per test 1000Wave mean direction 35°
Table 5Critical sector corresponding to each value of R/L0p and corresponding damage probability.
R/L0p Critical sector Pcrit
0.03 Sector 4 0.710.07 Sector 4 0.510.21 Sector 2 0.36
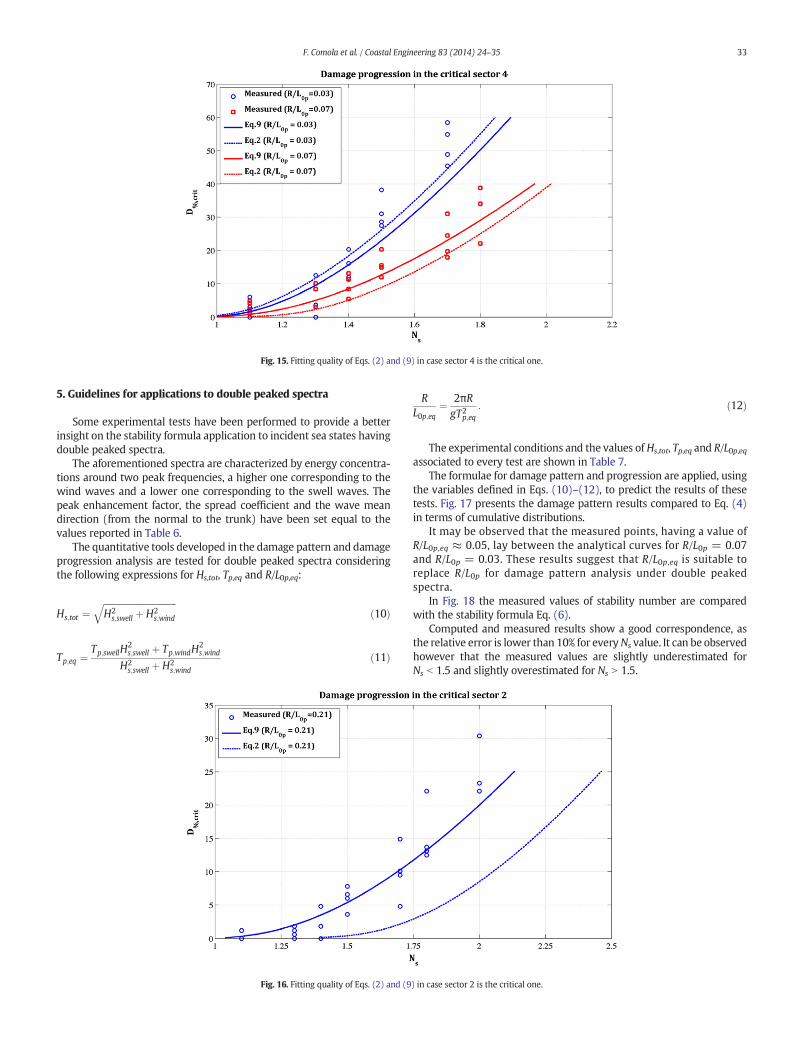
Fig. 15. Fitting quality of Eqs. (2) and (9) in case sector 4 is the critical one.
33F. Comola et al. / Coastal Engineering 83 (2014) 24–35
5. Guidelines for applications to double peaked spectra
Some experimental tests have been performed to provide a betterinsight on the stability formula application to incident sea states havingdouble peaked spectra.
The aforementioned spectra are characterized by energy concentra-tions around two peak frequencies, a higher one corresponding to thewind waves and a lower one corresponding to the swell waves. Thepeak enhancement factor, the spread coefficient and the wave meandirection (from the normal to the trunk) have been set equal to thevalues reported in Table 6.
The quantitative tools developed in the damage pattern and damageprogression analysis are tested for double peaked spectra consideringthe following expressions for Hs,tot, Tp,eq and R/L0p,eq:
Hs;tot ¼ffiffiffiffiffiffiffiffiffiffiffiffiffiffiffiffiffiffiffiffiffiffiffiffiffiffiffiffiffiffiffiffiffiH2
s;swell þ H2s;wind
qð10Þ
Tp;eq ¼Tp;swellH
2s;swell þ Tp;windH
2s;wind
H2s;swell þ H2
s;wind
ð11Þ
Fig. 16. Fitting quality of Eqs. (2) and (9
RL0p;eq
¼ 2πRgT2
p;eq: ð12Þ
The experimental conditions and the values of Hs,tot, Tp,eq and R/L0p,eqassociated to every test are shown in Table 7.
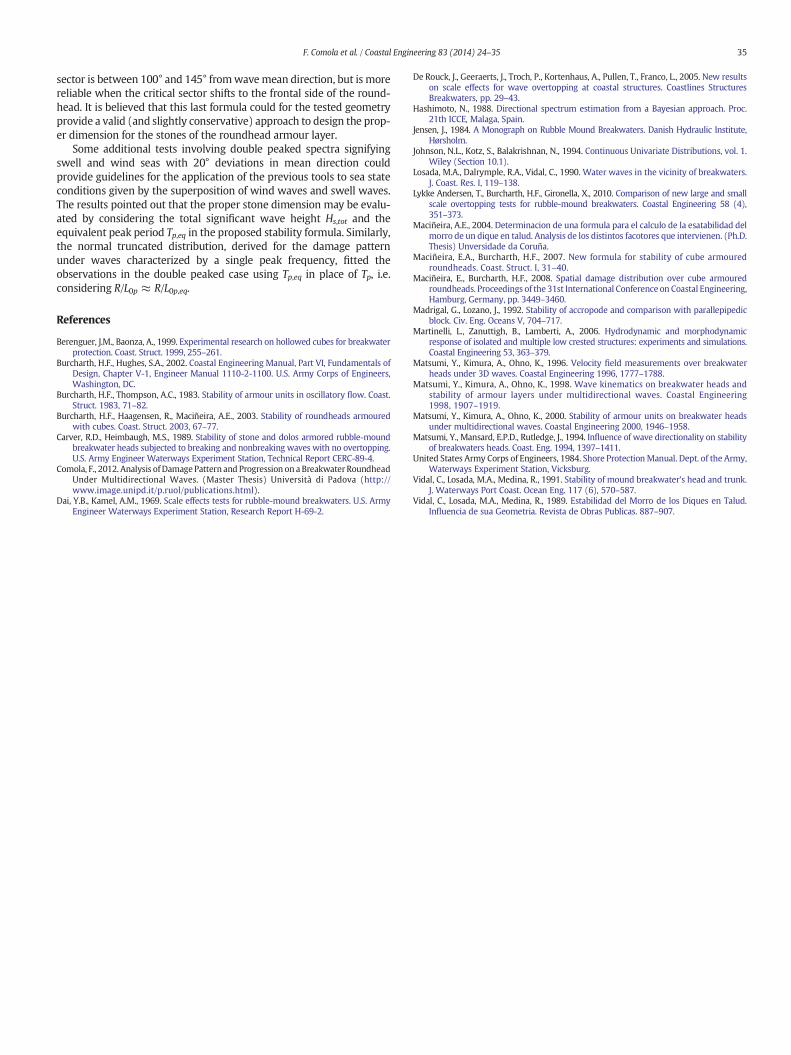
The formulae for damage pattern and progression are applied, usingthe variables defined in Eqs. (10)–(12), to predict the results of thesetests. Fig. 17 presents the damage pattern results compared to Eq. (4)in terms of cumulative distributions.
It may be observed that the measured points, having a value ofR/L0p,eq ≈ 0.05, lay between the analytical curves for R/L0p = 0.07and R/L0p = 0.03. These results suggest that R/L0p,eq is suitable toreplace R/L0p for damage pattern analysis under double peakedspectra.
In Fig. 18 the measured values of stability number are comparedwith the stability formula Eq. (6).
Computed and measured results show a good correspondence, asthe relative error is lower than 10% for everyNs value. It can be observedhowever that the measured values are slightly underestimated forNs b 1.5 and slightly overestimated for Ns N 1.5.
) in case sector 2 is the critical one.
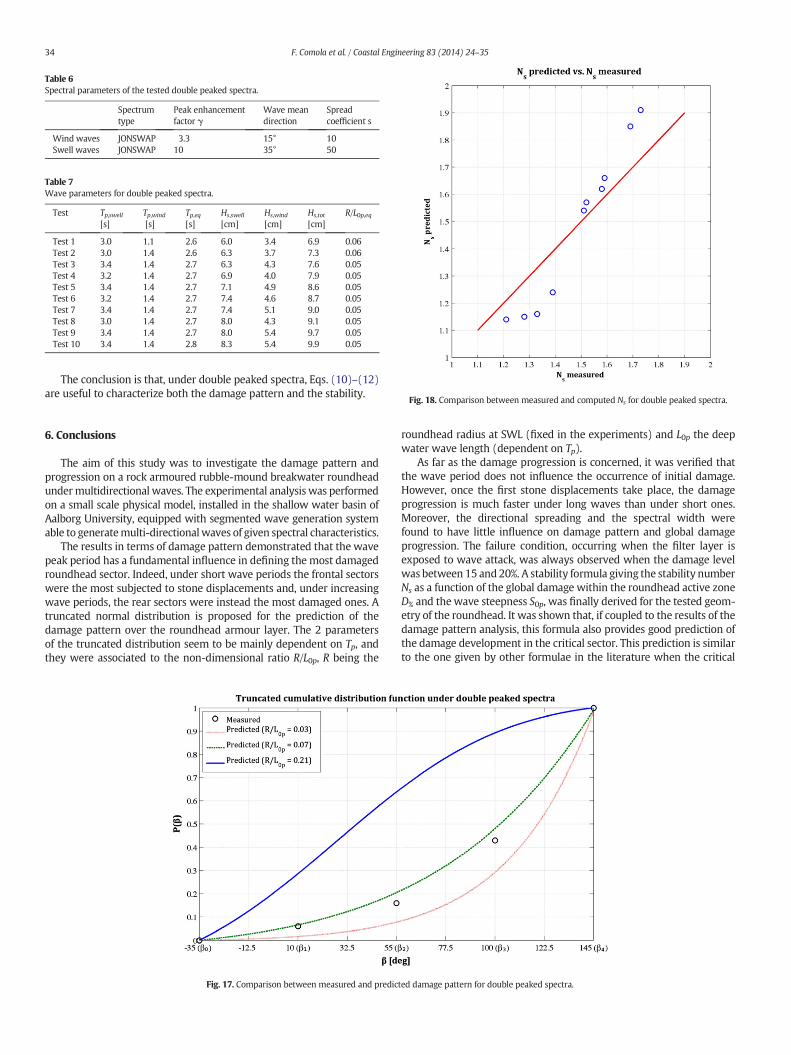
Table 6Spectral parameters of the tested double peaked spectra.
Spectrumtype
Peak enhancementfactor γ
Wave meandirection
Spreadcoefficient s
Wind waves JONSWAP 3.3 15° 10Swell waves JONSWAP 10 35° 50
Table 7Wave parameters for double peaked spectra.
Test Tp,swell
[s]Tp,wind
[s]Tp,eq[s]
Hs,swell
[cm]Hs,wind
[cm]Hs,tot
[cm]R/L0p,eq
Test 1 3.0 1.1 2.6 6.0 3.4 6.9 0.06Test 2 3.0 1.4 2.6 6.3 3.7 7.3 0.06Test 3 3.4 1.4 2.7 6.3 4.3 7.6 0.05Test 4 3.2 1.4 2.7 6.9 4.0 7.9 0.05Test 5 3.4 1.4 2.7 7.1 4.9 8.6 0.05Test 6 3.2 1.4 2.7 7.4 4.6 8.7 0.05Test 7 3.4 1.4 2.7 7.4 5.1 9.0 0.05Test 8 3.0 1.4 2.7 8.0 4.3 9.1 0.05Test 9 3.4 1.4 2.7 8.0 5.4 9.7 0.05Test 10 3.4 1.4 2.8 8.3 5.4 9.9 0.05
Fig. 18. Comparison between measured and computed N for double peaked spectra.
34 F. Comola et al. / Coastal Engineering 83 (2014) 24–35
The conclusion is that, under double peaked spectra, Eqs. (10)–(12)are useful to characterize both the damage pattern and the stability.
s
6. Conclusions
The aim of this study was to investigate the damage pattern andprogression on a rock armoured rubble-mound breakwater roundheadundermultidirectional waves. The experimental analysis was performedon a small scale physical model, installed in the shallow water basin ofAalborg University, equipped with segmented wave generation systemable to generatemulti-directionalwaves of given spectral characteristics.
The results in terms of damage pattern demonstrated that the wavepeak period has a fundamental influence in defining the most damagedroundhead sector. Indeed, under short wave periods the frontal sectorswere the most subjected to stone displacements and, under increasingwave periods, the rear sectors were instead the most damaged ones. Atruncated normal distribution is proposed for the prediction of thedamage pattern over the roundhead armour layer. The 2 parametersof the truncated distribution seem to be mainly dependent on Tp, andthey were associated to the non-dimensional ratio R/L0p, R being the
Fig. 17. Comparison between measured and predic
roundhead radius at SWL (fixed in the experiments) and L0p the deepwater wave length (dependent on Tp).
As far as the damage progression is concerned, it was verified thatthe wave period does not influence the occurrence of initial damage.However, once the first stone displacements take place, the damageprogression is much faster under long waves than under short ones.Moreover, the directional spreading and the spectral width werefound to have little influence on damage pattern and global damageprogression. The failure condition, occurring when the filter layer isexposed to wave attack, was always observed when the damage levelwas between 15 and 20%. A stability formula giving the stability numberNs as a function of the global damage within the roundhead active zoneD% and the wave steepness S0p, was finally derived for the tested geom-etry of the roundhead. It was shown that, if coupled to the results of thedamage pattern analysis, this formula also provides good prediction ofthe damage development in the critical sector. This prediction is similarto the one given by other formulae in the literature when the critical
ted damage pattern for double peaked spectra.
35F. Comola et al. / Coastal Engineering 83 (2014) 24–35
sector is between 100° and 145° fromwavemean direction, but is morereliable when the critical sector shifts to the frontal side of the round-head. It is believed that this last formula could for the tested geometryprovide a valid (and slightly conservative) approach to design the prop-er dimension for the stones of the roundhead armour layer.
Some additional tests involving double peaked spectra signifyingswell and wind seas with 20° deviations in mean direction couldprovide guidelines for the application of the previous tools to sea stateconditions given by the superposition of wind waves and swell waves.The results pointed out that the proper stone dimension may be evalu-ated by considering the total significant wave height Hs,tot and theequivalent peak period Tp,eq in the proposed stability formula. Similarly,the normal truncated distribution, derived for the damage patternunder waves characterized by a single peak frequency, fitted theobservations in the double peaked case using Tp,eq in place of Tp, i.e.considering R/L0p ≈ R/L0p,eq.
References
Berenguer, J.M., Baonza, A., 1999. Experimental research on hollowed cubes for breakwaterprotection. Coast. Struct. 1999, 255–261.
Burcharth, H.F., Hughes, S.A., 2002. Coastal Engineering Manual, Part VI, Fundamentals ofDesign, Chapter V-1, Engineer Manual 1110-2-1100. U.S. Army Corps of Engineers,Washington, DC.
Burcharth, H.F., Thompson, A.C., 1983. Stability of armour units in oscillatory flow. Coast.Struct. 1983, 71–82.
Burcharth, H.F., Haagensen, R., Maciñeira, A.E., 2003. Stability of roundheads armouredwith cubes. Coast. Struct. 2003, 67–77.
Carver, R.D., Heimbaugh, M.S., 1989. Stability of stone and dolos armored rubble-moundbreakwater heads subjected to breaking and nonbreaking waves with no overtopping.U.S. Army Engineer Waterways Experiment Station, Technical Report CERC-89-4.
Comola, F., 2012. Analysis ofDamagePattern and Progression on a BreakwaterRoundheadUnder Multidirectional Waves. (Master Thesis) Università di Padova (http://www.image.unipd.it/p.ruol/publications.html).
Dai, Y.B., Kamel, A.M., 1969. Scale effects tests for rubble-mound breakwaters. U.S. ArmyEngineer Waterways Experiment Station, Research Report H-69-2.
De Rouck, J., Geeraerts, J., Troch, P., Kortenhaus, A., Pullen, T., Franco, L., 2005. New resultson scale effects for wave overtopping at coastal structures. Coastlines StructuresBreakwaters, pp. 29–43.
Hashimoto, N., 1988. Directional spectrum estimation from a Bayesian approach. Proc.21th ICCE, Malaga, Spain.
Jensen, J., 1984. A Monograph on Rubble Mound Breakwaters. Danish Hydraulic Institute,Hørsholm.
Johnson, N.L., Kotz, S., Balakrishnan, N., 1994. Continuous Univariate Distributions, vol. 1.Wiley (Section 10.1).
Losada, M.A., Dalrymple, R.A., Vidal, C., 1990. Water waves in the vicinity of breakwaters.J. Coast. Res. I, 119–138.
Lykke Andersen, T., Burcharth, H.F., Gironella, X., 2010. Comparison of new large and smallscale overtopping tests for rubble-mound breakwaters. Coastal Engineering 58 (4),351–373.
Maciñeira, A.E., 2004. Determinacion de una formula para el calculo de la esatabilidad delmorro de un dique en talud. Analysis de los distintos facotores que intervienen. (Ph.D.Thesis) Unversidade da Coruña.
Maciñeira, E.A., Burcharth, H.F., 2007. New formula for stability of cube armouredroundheads. Coast. Struct. I, 31–40.
Maciñeira, E., Burcharth, H.F., 2008. Spatial damage distribution over cube armouredroundheads. Proceedings of the 31st International Conference on Coastal Engineering,Hamburg, Germany, pp. 3449–3460.
Madrigal, G., Lozano, J., 1992. Stability of accropode and comparison with parallepipedicblock. Civ. Eng. Oceans V, 704–717.
Martinelli, L., Zanuttigh, B., Lamberti, A., 2006. Hydrodynamic and morphodynamicresponse of isolated and multiple low crested structures: experiments and simulations.Coastal Engineering 53, 363–379.
Matsumi, Y., Kimura, A., Ohno, K., 1996. Velocity field measurements over breakwaterheads under 3D waves. Coastal Engineering 1996, 1777–1788.
Matsumi, Y., Kimura, A., Ohno, K., 1998. Wave kinematics on breakwater heads andstability of armour layers under multidirectional waves. Coastal Engineering1998, 1907–1919.
Matsumi, Y., Kimura, A., Ohno, K., 2000. Stability of armour units on breakwater headsunder multidirectional waves. Coastal Engineering 2000, 1946–1958.
Matsumi, Y., Mansard, E.P.D., Rutledge, J., 1994. Influence of wave directionality on stabilityof breakwaters heads. Coast. Eng. 1994, 1397–1411.
United States Army Corps of Engineers, 1984. Shore ProtectionManual. Dept. of the Army,Waterways Experiment Station, Vicksburg.
Vidal, C., Losada, M.A., Medina, R., 1991. Stability of mound breakwater's head and trunk.J. Waterways Port Coast. Ocean Eng. 117 (6), 570–587.
Vidal, C., Losada, M.A., Medina, R., 1989. Estabilidad del Morro de los Diques en Talud.Influencia de sua Geometria. Revista de Obras Publicas. 887–907.