Embed Size (px)
Citation preview
Dairying on the Darling Downs, 1890-1914 A Study of Agricultural Success
J. C. R. Camm, M.Sc, Ph.D.
INTRODUCTION^ At the end of the 1880s Queensland's export economy was
based on the products of the miner and pastoralist (Table I ) . With the exception of sugar the export of agricultural products had not commenced. The need for a more diversified rural base was evident and contemporary agricultural land settlement schemes had as one of their fundamental tenets the achievement of a greater agricultural output '. By the first decade of the twentieth century, although it was still a small percentage of total export value, agricultural produce had increased in importance. In the expansion of agriciUtural production and export the dairy industry of south-east Queensland and in particular of the 'Settled District' of the Darling Downs was significant. The dairy industry, above aU other agricultural enterprises, had the most impact on the regional landscapes, economy and spatial organization of the south-eastern sector of the Colony and State in the period 1890 to 1914.
The traditional view of export wheat-farming as the foundation for famUy farms and closer settlement was at an early date shown to be deficient within the environment of the Downs 2. The practical realities of agricultural settlement on the Darling Downs made it apparent that wheat farming pure and simple was an unsatisfactory use of its potential 3. New farm enterprises and combinations of activities gradually evolved. Expanding markets and reliable returns made dairying appear a sound and stable enterprise for agricultural selectors on the Downs. A strong dairy component developed on smaU selections (generally under 260 hectares or 640 acres), such as the ones estabUshed on repurchase estates, and on which selectors generally had a limited equity " and were therefore eager to obtain quick returns to pay their way. Dairying offered quick returns for the selector and greatly helped him pay his way in the initial year of selection.
EXPANSION OF DAIRYING Technological and legislative developments after 1880 assisted
the expansion of dairy farming in Queensland. Dairy farmers on the Downs, in common with their contemporaries in the Colony, profited from the introduction of refrigeration in 1883, mechanical cream separation in the late 1880s and quaUty testing (the Bab-cock Test) in 1892, and legislative measures such as the Meat and Dairy Produce Encouragement Act of 1893 {51 Vic. No. 11) =. These developments, together with tariff protection of dairy produce, which had been imposed in 1870, were significant in the growth of dairying in Queensland. In 1870 a twopence per one pound duty was placed on cheese and a similar duty was fixed on butter in 1874. In 1888 the duty was raised to threepence per one pound on both commodities and in 1892 the cheese duty was raised to fourpence per pound. The main developments of dairying on the Downs and in Queensland during the period 1893 to 1914 are summarised in Table 2. Commercial dairy farming on the Downs did not expand untU after 1890. Estimates for 1893 put the number of dairy cows in commercial production on the Downs at 10,126 or approximately 22 per cent of the Colony's total*. In the next decade a rise of approximately 23,000 dairy cattle occurred. By 1910, when more reliable figures are available, the total number of dairy cows in the 3,353 commercial dairies on the Downs was 85,098 or 23 per cent of the State's dairy herd. In 1914 dairy cattle on the Downs numbered 85,588 (Table 2) .
The first small dairy factory buUt on the Downs was opened at Hampton near Crows Nest in 1887 7. A second factory, the Puslinch Butter Factory at Pittsworth, commenced operations in 1889 8. It was not untU 1893 that the first manufacturing plants
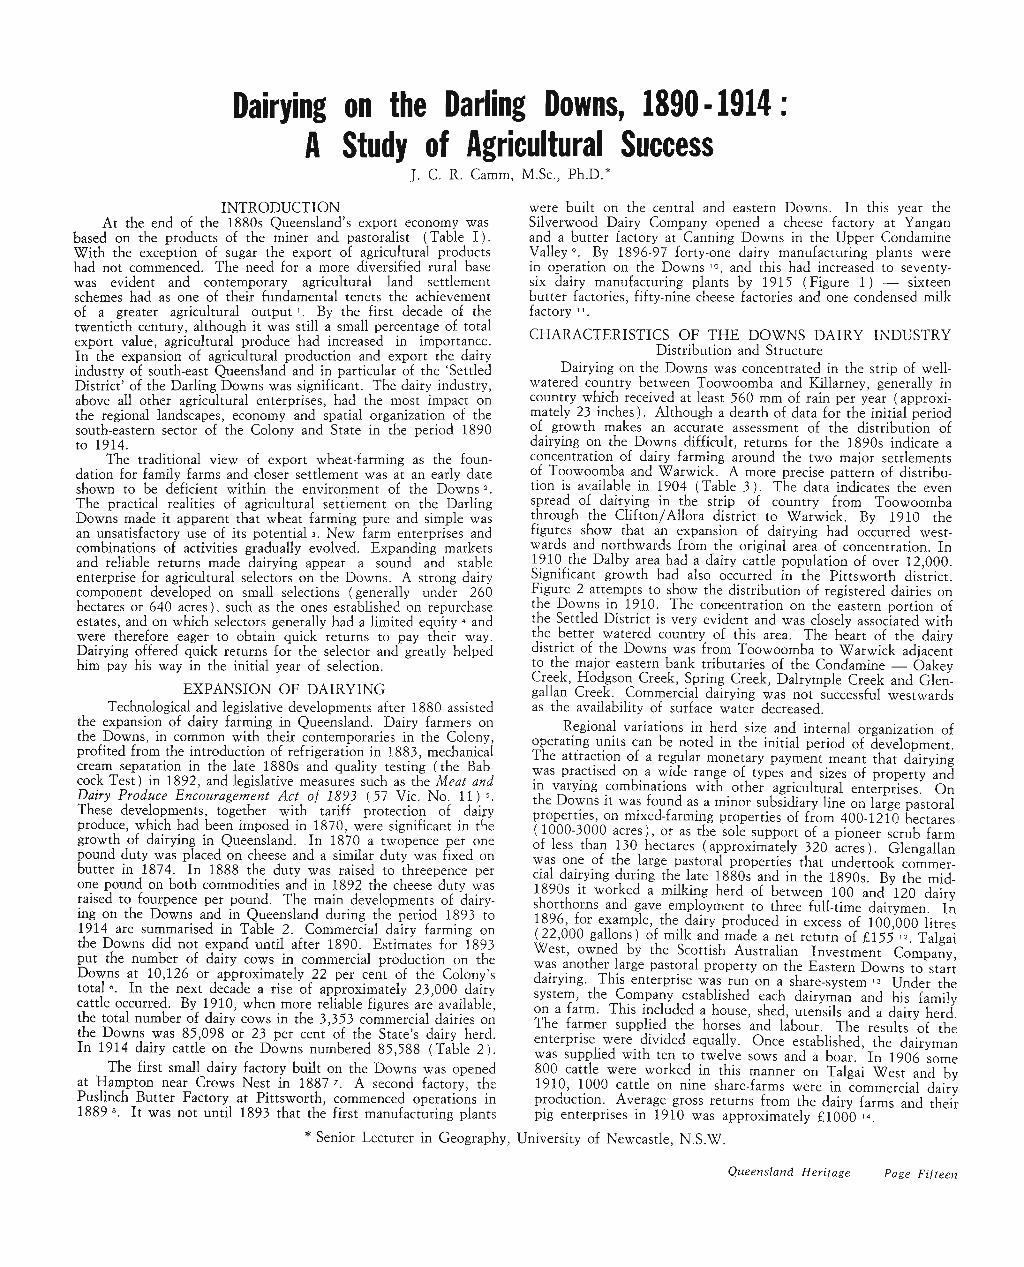
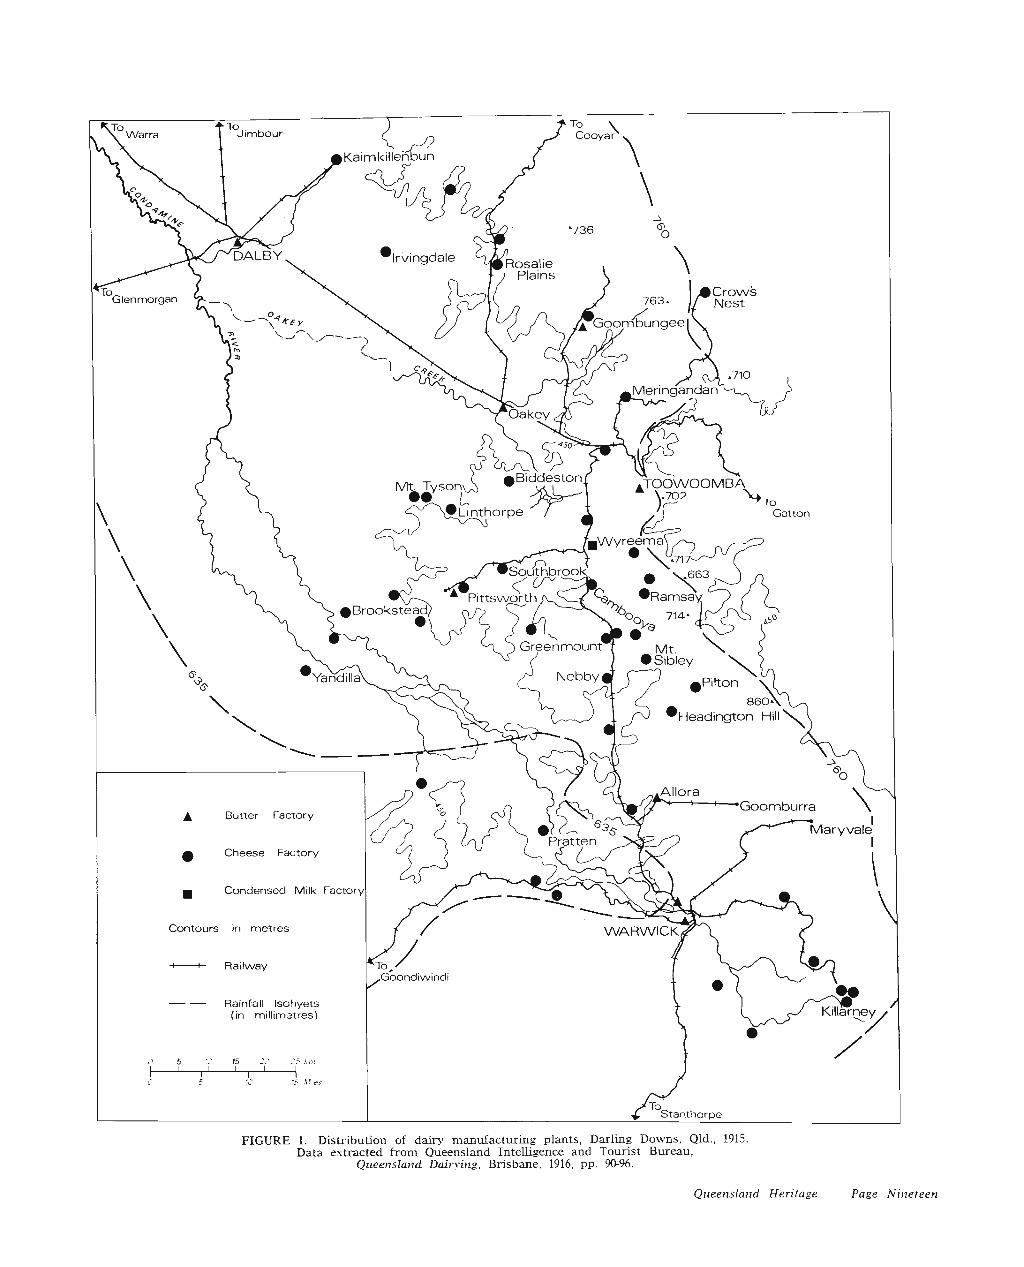
were buUt on the central and eastern Downs. In this year the Silverwood Dairy Company opened a cheese factory at Yangan and a butter factory at Carming Downs in the Upper Condamine VaUey '. By 1896-97 forty-one dairy manufacturing plants were in operation on the Downs 'o, and this had increased to seventy-six dairy manufacturing plants by 1915 (Figure 1) — sixteen butter factories, fifty-nine cheese factories and one condensed milk factory ' ' .
CHARACTERISTICS OF THE DOWNS DAIRY INDUSTRY Distribution and Structure
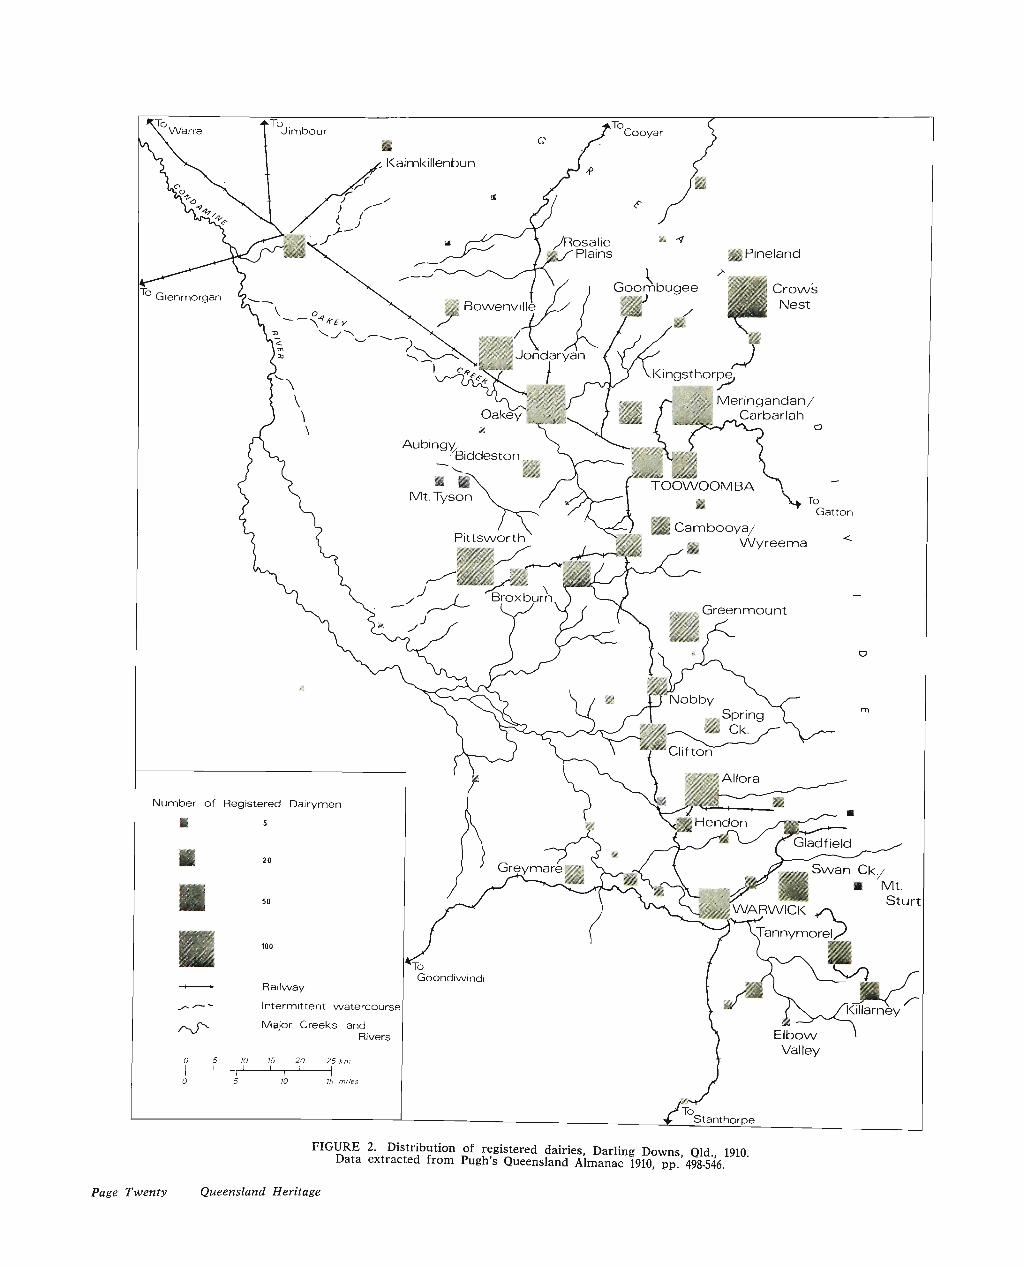
Dairying on the Downs was concentrated in the strip of well-watered country between Toowoomba and KUlarney, generally in country which received at least 560 mm of rain per year (approximately 23 inches). Although a dearth of data for the initial period of growth makes an accurate assessment of the distribution of dairying on the Downs difficult, returns for the 1890s indicate a concentration of dairy farming around the two major settlements of Toowoomba and Warwick. A more precise pattern of distribution is avaUable in 1904 (Table 3) . The data mdicates the even spread of dairying in the strip of country from Toowoomba through the Clifton/AUora district to Warwick. By 1910 the figures show that an expansion of dairying had occurred westwards and northwards from the original area of concentration. In 1910 the Dalby area had a dairy cattle population of over 12,000. Significant growth had also occurred in the Pittsworth district. Figure 2 attempts to show the distribution of registered dairies on the Downs in 1910. The concentration on the eastern portion of the Settled District is very evident and was closely associated with the better watered country of this area. The heart of the dairy district of the Downs was from Toowoomba to Warwick adjacent to the major eastern bank tributaries of the Condamine — Oakey Creek, Hodgson Creek, Spring Creek, Dahymple Creek and Glen-gaUan Creek. Commercial dairying was not successful westwards as the avaUability of surface water decreased.
Regional variations in herd size and internal organization of operating units can be noted in the initial period of development. The attraction of a regular monetary payment meant that dairying was practised on a wide range of types and sizes of property and in varying combinations with other agricultural enterprises. On the Downs it was found as a minor subsidiary line on large pastoral properties, on mixed-farming properties of from 400-1210 hectares (1000-3000 acres), or as the sole support of a pioneer scrub farm of less than 130 hectares (approximately 320 acres). GlengaUan was one of the large pastoral properties that undertook commercial dairying during the late 1880s and in the 1890s. By the mid-1890s it worked a mUking herd of between 100 and 120 dairy shorthorns and gave employment to three fiUl-time dairymen. In 1896, for example, the dairy produced in excess of 100,000 litres (22,000 gallons) of milk and made a net return of £155 '2. Talgai West, owned by the Scottish AustraUan Investment Company, was another large pastoral property on the Eastern Downs to start dairying. This enterprise was run on a share-system ' Under the system, the Company established each dairyman and his family on a farm. This included a house, shed, utensUs and a dairy herd. The farmer supplied the horses and labour. The results of the enterprise were divided equally. Once established, the dairyman was supplied with ten to twelve sows and a boar. In 1906 some 800 cattle were worked in this manner on Talgai West and by 1910, 1000 cattle on nine share-farms were in commercial dairy production. Average gross returns from the dairy farms and their pig enterprises in 1910 was approximately £1000 '*.
* Senior Lecturer in Geography, University of Newcastle, N.S.W.
Queensland Heritage Page Fifteen
Yangan Cheese Factory.
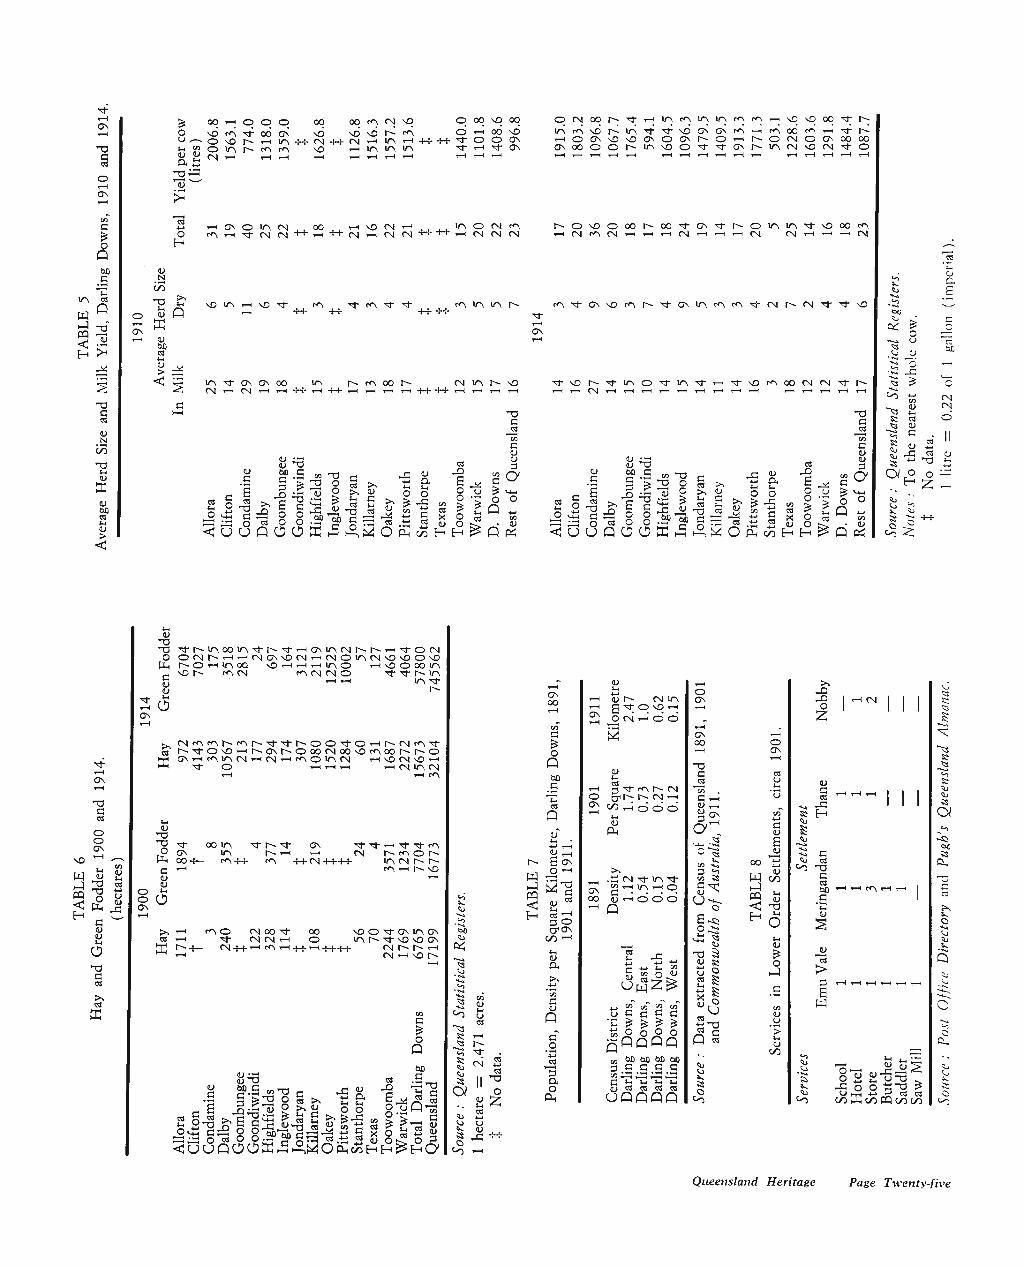
In comparison with these reasonably large scale operations the majority of dairy farms on' the Downs were much smaller. Data for ninety-seven farms with dairy herds in the Toowoomba-Gowrie-Greenmount area for 1903 gives an average herd size of sixteen point three (Table 4) '^. The range in herd size on the Downs was from three to 100 with a median of thirteen. Such a range in herd size and types of enterprises makes it difficult to establish any norm for a dairying unit. However, variations in the average size of milking herd do show regional differences within the Downs and within Queensland as a whole. The average size of dairy herd on the Downs in 1910 was twenty-two (Table 5) . Qn the eastern Downs dairy herds were smaller. The Toowoomba area was marked by the smallest sized herds of about fifteen dairy cows per enterprise. Herd size on the Downs was approximately the same as that in other dairying districts of southeast Queensland. Overall the more favoured south-eastern zone of Queensland was characterized by average herd sizes of from fifteen to twenty-five cows. The lower Brisbane River area was marked by the smallest herds. Dairy farms in this district ran an average of about fifteen cows and were mainly concerned with supplying liquid milk to Brisbane. The largest herds in the State were found north of Rockhampton and in the western zone. The average herd size in the Rockhampton division was forty-seven. As well, the northern farms had a high proportion of dry cows.
Of greater significance than the variations of herd size were the regional differences in productivity per cow. Downs dairy cattle were the highest producers within the State (Table 5) . In 1910 the average annual yield per dairy cow on the Downs was 1408 litres (307 gallons) in comparison with the average State yield of 996 litres (219 gaUons). The highest unit average on the Downs was on farms within the AUora (2006 litres or 441 gallons) and Highfields districts (1626 litres or 358 gallons). Six of the other divisions on the Downs had milk yields per cow in excess of 1500 litres or 310 gallons.
According to available data, the Warwick district had a low
productivity. The inclusion of figures for the less fertile Stanthorpe and Inglewood areas with the Warwick figures may have given a false indication of yields in the district immediately surrounding Warwick. Elsewhere in southern Queensland milk yields per cow were generally lower than those obtained on the Downs. In other areas, the highest milk yields were obtained in the Logan (1903 litres or 418.7 gallons), Laidley (1858 litres or 408.8 gallons) and Dugandan (1537 litres or 338.3 gallons) districts. Throughout the period a gradual improvement in milk yields per cow occurred as a result of improved husbandry, including better breeding, culling of stock and the provision of adequate winter feed. By 1914 annual milk yield per cow on the Downs had risen to 1484 litres (326.1 gallons), an increase of 6 per cent on the 1910 figures. The Downs retained its position as the State's leading dairying district with an average milk yield per cow approximately 35 per cent above the State average of 1087 Utres (240 gallons).
MUk Utilisation and Manufacture
The utUisation of mUk produced on the Downs differed from that of Queensland as a whole. The approximate usage of milk in Queensland in the period 1890 to 1914 was 75 per cent for butter, 8 per cent for cheese, 4 per cent consumed as Uquid milk and 13 per cent for other purposes. On the Downs there was a greater concentration on cheese production, 26 per cent of milk being used in cheese manufacture. Butter production used 61 per cent of milk output. Liquid milk accounted for 1.6 per cent and 10.5 per cent was utilised for other purposes, mainly on the farm. Approximately 90 to 95 per cent of the State's cheese output came from the Downs. There was a marked regional specialisation in cheese production in the district between Clifton and Pittsworth. The dominance of the Pittsworth region in cheese manufacture appears to be largely the result of entrepreneurial drive rather than any specific environmental cause. In this area, as with much of the Downs, relatively good access over easy country facilitated the daUy movement of whole milk to the local cheese factory. The
Page Sixteen Queensland Heritage
success of cheese manufacture in the Pittsworth district, which accounted for over 80 per cent of the Downs output, was such that in 1914 Queensland produced more cheese than any other State and in 1918 Queensland exported three times as much cheese as did New South Wales and Victoria '".
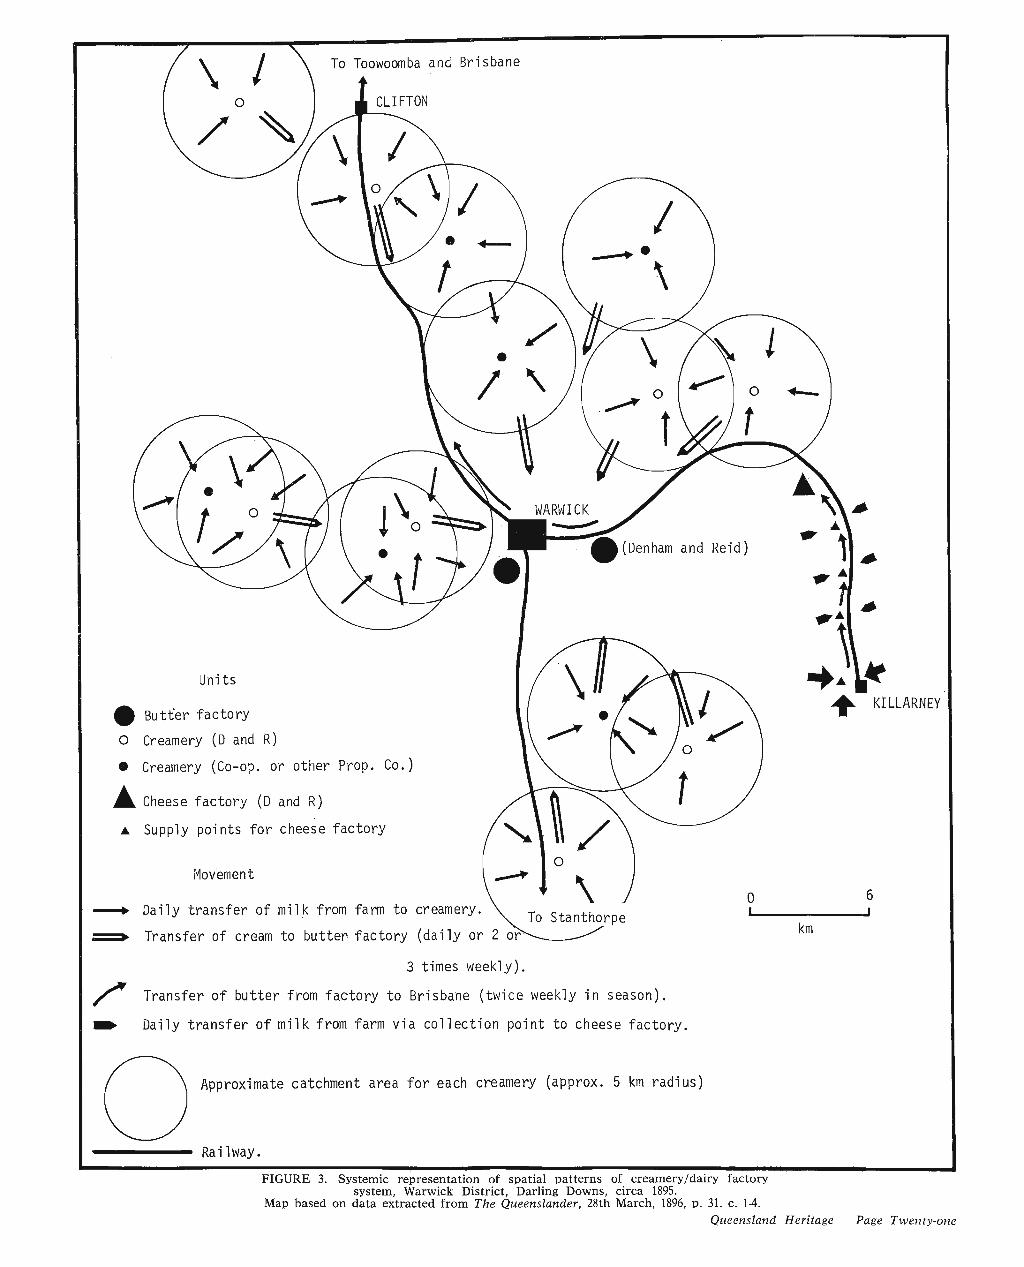
The dairy industry involves the production of mUk and its manufacture into dairy products. Prior to full-scale commercial butter and cheese production both products were made on the farm. The technological innovations of the 1880s and 1890s revolutionized manufacture and by the mid-1890s butter production was based on the system of a central butter factory supplied by a number of outlying separating units (creameries). The dairy farmer-creamery-central butter factory chain of production became the normal pattern for commercial dairy production on the Downs, as it did elsewhere in southern Queensland, during the 1890s. All over the eastern Downs creameries were established, some supplying local proprietary companies, while others supplied proprietary companies with main factories in Brisbane. Figure 3 shows in a systemic manner the spatial pattern and movement in the creamery-butter factory system within the Warwick area in 1893-95. In the development of the dairy industry in this district the SUverwood Dairy Factory Company (Denham and Reid) was of major importance " .
In the early 1890s the company operated a butter factory at Caiming Downs, just outside the town of Warwick, and a cheese factory at Yangan. The cheese factory, which started production in 1893, received the btUk of its milk supplies from dairy farms adjacent to the KiUarney branch railway line. Milk was sent by the early morning train from collection points at KiUarney, Dan-deroo, Farm Creek and Emu Vale. The Company's butter factory was suppUed by about seven or eight creameries throughout the period 1893 to 1895. The creameries were located from Back Plains in the north (approximately 40 kilometres or 25 mUes distant) to Cherry GuUy iti the south. Each creamery received milk daUy from farmers within an approximate five kilometres (three mUes) radius. DUficulties in road transport limited the area served by each creamery.
The quantity of milk received daUy at each separating plant varied greatly. Seasonal conditions influenced mUk yields and in the irutial period of development many of the separating plants operated below capacity during the winter months of June to August. It was not uncommon for them to cease operations for short periods due to the lack of mUk. The supply of mUk to each separating imit was also affected by competition. In many areas intense competition developed between rival proprietary companies and between proprietary companies and farmers' co-operatives. Figure 3 indicates the overlapping of the catchment areas of many of the separating plants. Due to a variety of ckcumstances, which included the inabUity to utilize fnUy plant capacity because of inadequate cream suppUes, the Silverwood Proprietary Company closed its butter factory at Canning Downs and built a new factory at Toowoomba '8. The new location aUowed the Company to draw its cream supplies from creameries situated along the Western Une as weU as along the Southern line and its branches. By the late 1890s the Company's central butter factory at Toowoomba was receiving cream from about thirty creameries located from Bowen-vUle in the west to Warwick in the south " . By comparison, the Westbrook creamery (one of seven near Toowoomba) sent its cream to the Model Dairy Factory in Brisbane.
The creamery occupies a central position, and mUk is sent to it from distances varying from a half-a-mUe to three mUes. The separator, which is driven by a 4 horse power engine, is said to have a capacity of 250 gaUons per hour and 400 gaUons are sent to it daUy for treatment. The cream is carted to Southbrook raUway station — a distance of about 5 miles — and thence forwarded to Brisbane. 20
The dairy farm-separating plant-central butter factory chain entaUed a great deal of movement. The daUy movement of mUk, biJky and heavy, was not an easy task for the dairy farmer.
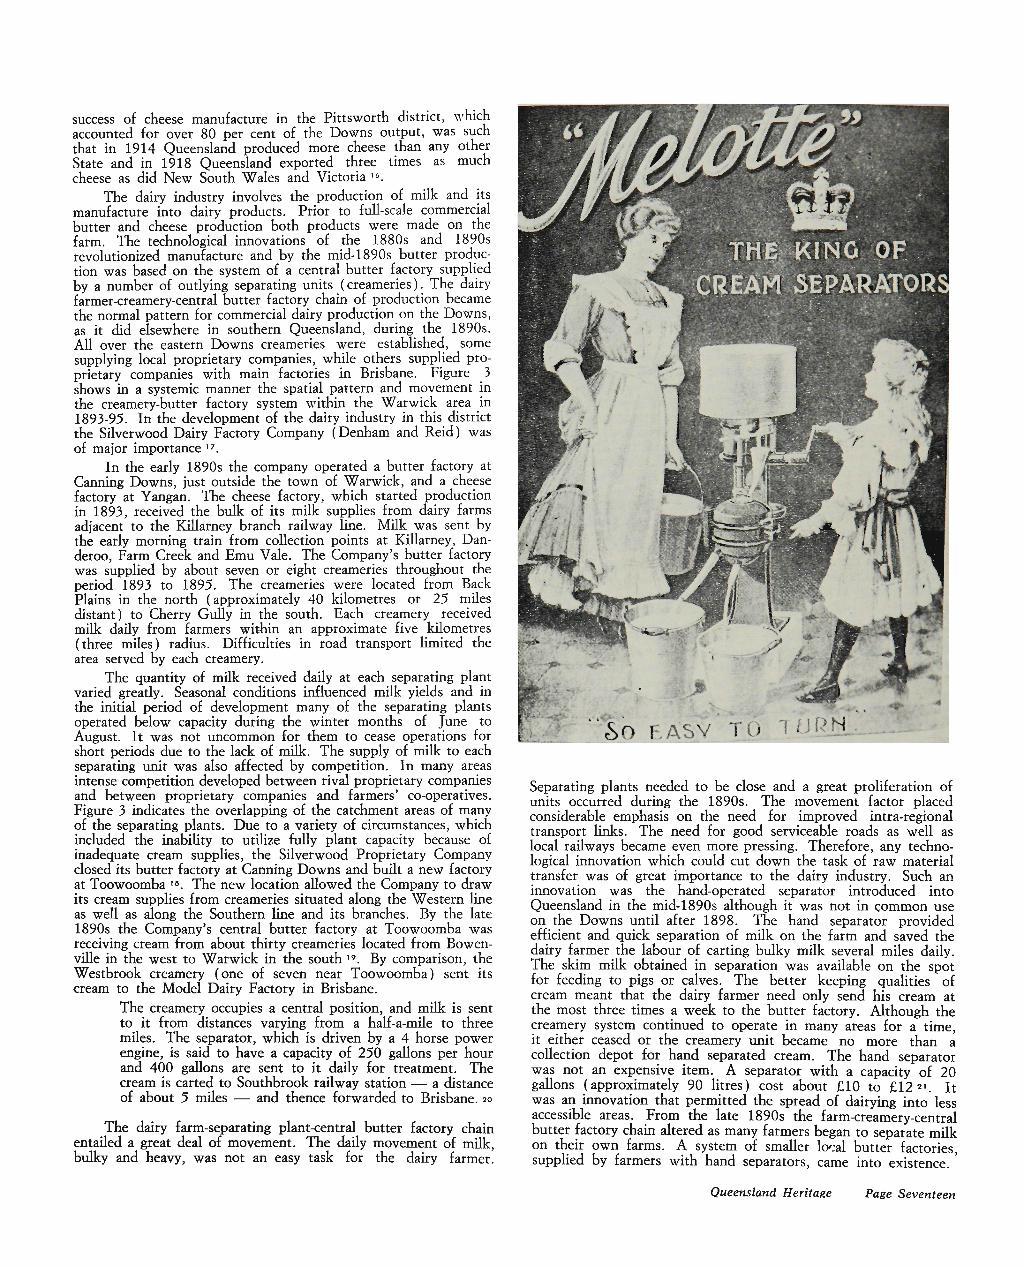
So EASY TO TURN
Separating plants needed to be close and a great proliferation of units occurred during the 1890s. The movement factor placed considerable emphasis on the need for improved intra-regional transport links. The need for good serviceable roads as well as local railways became even more pressing. Therefore, any technological innovation which could cut down the task of raw material transfer was of great importance to the dairy industry. Such an innovation was the hand-operated separator introduced into Queensland in the mid-1890s although it was not in common use on the Downs until after 1898. The hand separator provided efficient and quick separation of mUk on the farm and saved the dairy farmer the labour of carting bulky mUk several miles daily. The skim mUk obtained in separation was avaUable on the spot for feeding to pigs or calves. The better keeping qualities of cream meant that the dairy farmer need only send his cream at the most three times a week to the butter factory. Although the creamery system continued to operate in many areas for a time, it either ceased or the creamery unit became no more than a coUection depot for hand separated cream. The hand separator was not an expensive item. A separator with a capacity of 20 gaUons (approximately 90 litres) cost about £10 to £12 2'. j ^ was an irmovation that permitted the spread of dairying into less accessible areas. From the late 1890s the farm-creamery-central butter factory chain altered as many farmers began to separate mUk on their own farms. A system of smaUer local butter factories, supplied by farmers with hand separators, came into existence. '
Queensland Heritage Page Seventeen
During the same period that developments in separating techniques were affecting major savings in transport costs in the butter industry, the cheese industry on the Downs was also undergoing expansion. By 1908 there were twenty-two cheese factories on the Downs and by 1915 there were fifty-nine cheese factories in production. (See Figure 1). The large number of cheese factories resulted from the use of whole mUk in the production of cheese. The problem of transporting a bulky and heavy raw material daily to the factory limited the supply of the individual cheese manufacturing plant.
THE IMPACT OF THE DAIRY REVOLUTION Changing Patterns of Land Use
The successful establishment of dairying on the Downs brought changes through a whole spectrum of rural activities. Essential to the placement of dairying on a commercial footing was the provision of all year round feed supplies, which, in turn generated new land uses. Creameries and butter factories became important foci for a developing settlement net. Attempts to improve milk output per cow resulted in new land use activities involving a greater use of artificially formed pastures, particularly in small paddocks in which stock were frequently changed ^ . Table 6 summarises the development of green fodder and hay cultivation on the Downs and in Queensland. The importance of the Downs in the cultivation of stock feed is evident. In 1900 35.9 per cent of the hay and 45.9 per cent of the green fodder acreage in Queensland was on the Downs. By 1905 there were 7609 hectares (18,812 acres) of hay which represented 50 per cent of the State's total and 11423 hectares (38,228 acres) of green fodder on the Downs, 58 per cent of the State's total. Expansion in the acreage sown to stock feed continued in 1905-10 and by 1910 approximately three-quarters of both hay and green fodder acreage in Queensland was on the Downs. After 1910 the cultivation of hay decreased by about 9.2 per cent per year. In contrast the area sown to green fodder expanded rapidly. The Downs was the leading area in this expansion. Acreage devoted to this crop increased at the rate of about 39 per cent. By comparison the State's increase averaged approximately 23 per cent per year. In the 1914 season 77.5 per cent of Queensland's green fodder was grown on the Downs. The cultivation of stock feed was concentrated on four Downs divisions — AUora (6704 hectares or 16,565 acres), Clifton (7,027 hectares or 17,364 acres), Oakey (12,525 hectares or 30,950 acres) and Pittsworth (10,002 hectares or 24,717 acres). These four divisions accounted for 62 per cent of Downs output. In the higher rainfall divisions of KUlarney, Warwick, Highfields and Toowoomba there was less emphasis on green fodder cultivation.
Growth in Population and Settlement By 1915 the enterprise of dairying was firmly established as
a part of the regional economy of the Downs and it had led to the establishment of a manufacturing chain of dairy factories and a diversification of farm activities and needs. A measure of the regional impact of dairy producing units, mediated through diversification and intensification of land use, can be found in population density and urbanization. The distribution and size of central places is related to population density and hence to the size and intensity of land use of rural holdings. Large freehold pastoral properties tended towards self-sufficiency with weak local economic linkages and obviated the growth of service centres 23. Conversely, the dispersion of demand for services in the small-family farm co-operative dairy system generated a more comprehensive settlement hierarchy. As agricultural development, dairying in particular, progressed in the decade after 1891, the population of the Downs increased. A 37.1 per cent increase, from 40,375 to 55,334 was recorded through the 1890s. By compari-soir the State's population increased by 27.8 per cent in the decade. A more rapid growth in population occurred on the Downs after 1901 and by 1911 the population had reached 84,460, which represented 16.2 per cent of Queensland's population. The average annual rate of growth on the Downs from 1901 to 1911 of 5.26
per cent per annum compares with the Queensland average of 2.04 per cent per annum. The Downs growth rate outstripped that of Brisbane where population increase in the decades of the 1890s and 1900s was approximately 2.5 per cent and 1.8 per cent per annum respectively. In this respect Brisbane, which held approximately one-quarter of Queensland's population 24, differed markedly from both Sydney and Melbourne, which not only contained higher percentages of their respective States' populatioris but were also growing at faster rates than the remainder of their respective States.
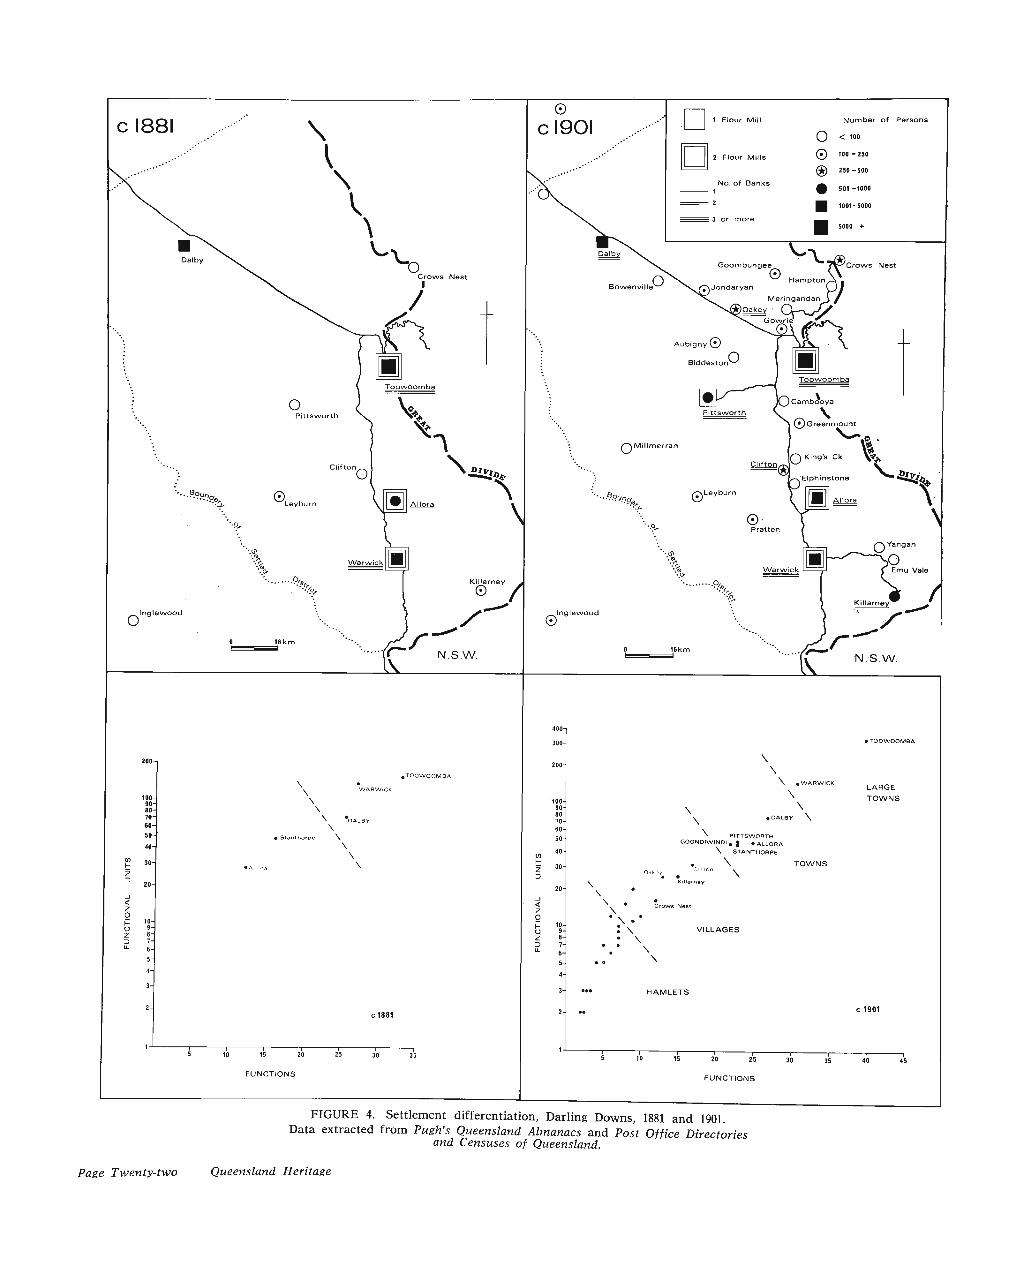
Mean population density increased in the period from 1891 to 1911. Table 7 summarises by census districts the mean population denshy per square kilometre for the period 1891 to 1911. Population density was greatest in the eastern Settled District of the Downs and was closely associated with land sub-division and greater agricultural productivity. By contrast in the western Unsettled District of the Downs, which was economically dominated by large pastoral enterprises, population density had not exceeded 0.15 per square kilometre in 1911. The dominance of the eastern Downs, as the population centre, was emphasised bv the rapid growth of Toowoomba in the twenty years from 1891 and by the steady growth of Warwick. The remainder of the increase in population on the Downs was absorbed in the establishment and expansion of numerous smaU agricultural settlements, which were located in the main on the eastern and central Downs and which were established following the subdivision of pastoral estates after the 1890s. Agricultural expansion needed to be supported by many new services, including farm implement manufacture and maintenance and transport — a positive feedback. These new services and job opportunities were in the main located in the expanding centres of Toowoomba, Warwick and Dalby, and the newly established rural centres of AUora, Pittsworth, KUlarney and Clifton. Throughout the Settled District of the Downs other small settlements grew up and expanded to serve the needs of the district's expanding agricultural population. The contrast between the settlement pattern and hierarchy associated with 'traditional' pastoral economy of the 1880s and the distribution and hierarchy of population centres following land sub-division and the establishment of mixed-farming/dairying is clearly iUustrated in Figure Four. Four basic groups of centres emerged — hamlets, vUlages, towns and large towns. Characteristically hamlets contained a store, an hotel, and a school (Table 8) . VUlages differed from hamlets by their maintenance of churches and banks. Towns possessed Magistrates' courts, public halls. School of Arts and newspapers (Table 9). The spatial distribution of central places was closely related to distribution of agricultural output and to the development of the transport network. As one moved west across the Downs the settlement net became more sparse.
SUMMARY The export of dairy produce was one of the major outcomes
of land sub-division on the Downs and in this political encouragement in the form of new railways and roads was of importance. Taken as a whole dairying in Queensland lagged behind the levels of production and returns of the southern States. But the Downs component of the industry, even after Federation resulted in the removal of tariffs on butter and cheese, was in a position to withstand competition. By comparison wheat growers on the Downs were not in a position to face severe competition 25, The dairy industry provided an activity that was capable by late nineteenth century and early twentieth century standards of maintaining viable closer settlement in south-east Queensland. Despite its inferior ranking within the national scene, within the State context dairy farming was viewed by politicians and the public as a rural industry of great potential and of greater reliabUity for the maintenance of a rural class in the southern portion of the State than any other agricultural activity. It was an industry to be encouraged and, if need be, subsidized, for it was the foundation for a large part of the settlement growth on the Downs in the period 1890 to 1915.
Page Eighteen Queensland Heritage
To \ Cooyar
C r o w s Nest
Butter Factory
Cheese Factory
Condensed Milk Factory
Contours in metres
-< 1- Railway
Rainfall Isohyets (in millirnstres)
5 1 1 1
i [
I 1
~r J 5 Am 1 1
•5 V'es
FIGURE 1. Distribution of dairj' manufacturing plants, Darling Downs, Qld., 1915. Data extracted from Queensland Intelligence and Tourist Bureau,
Queensland Dairying. Brisbane. 1916, pp. 90-96.
Queensland Heritage Page Nineteen
• Pineland
Crows Nest
Number of Registered Dairymen
Railway
Intermittent watercourse
Major Creel<s and Rivers
10 15 20 25* / , _l
Stanthorpe
FIGURE 2. Distribution of registered dairies. Darling Downs, Qld 1910 Data extracted from Pugh's Queensland Almanac 1910, pp. 498-546.
Page Twenty Queensland Heritage
^ Butter factory
O Creamery (D and R)
• Creamery (Co-op. or other Prop. Co.)
^ L Cheese factory (D and R)
• Supply points for cheese factory
Movement
» Daily transfer of milk from farm to creamery.
= > Transfer of cream to butter factory (daily or 2 or^
3 times weekly).
^"^ Transfer of butter from factory to Brisbane (twice weekly in season).
^»' Daily transfer of milk from farm via collection point to cheese factory.
Approximate catchment area for each creamery (approx. 5 km radius)
Railway.
FIGURE 3. Systemic representation of spatial patterns of creamery/dairy factory system, Warwick District, Darling Downs, circa 1895.
Map based on data extracted from The Queenslander, 28th March, 1896, p. 31. c. 14. Queensland Heritage Page Twenty-one
CI88I
Crows Nest
Inglewood
N.S.W.
WARWICK
\
Z 8-D 7-"- 6-
\ \ *DALBY \
t Stanthorpe \ \ \ \
c1881
10 15 20
FUNCTIONS
1 Flour Mill
2 Flour Mills
No. of Banks
Number of Persons
O < '»» (£) 100-250
® 250-500
A 501-1000
Crows Nest
)(_)Cambooya Pi t tsworth V^ V
Q^ Greenmount
o Millmerran
^Sy.oo ©^
© Inglewood
N.S.W.
< z o I- 10-U 9-Z 8 D 7-
6-
\ \
\ .WARWICK
\ \
• DALBY \
• TOOWOOMBA
LARGE TOWNS
^ PITTSWORTH GOONDIWINDI, • .ALLORA
\ STANTHORPE
\
\ . \ • \ ••
: \ • \
\
HAMLETS
c1901
~i f~ ~~l 1 1— 15 20 25
F U N C T I O N S
30 35 40 45
FIGURE 4. Settlement differentiation. Darling Downs, 1881 and 1901. Data extracted from Pugh's Queensland Almanacs and Post Office Directories
and Censuses of Queensland.
Page Twenty-two Queensland Heritage
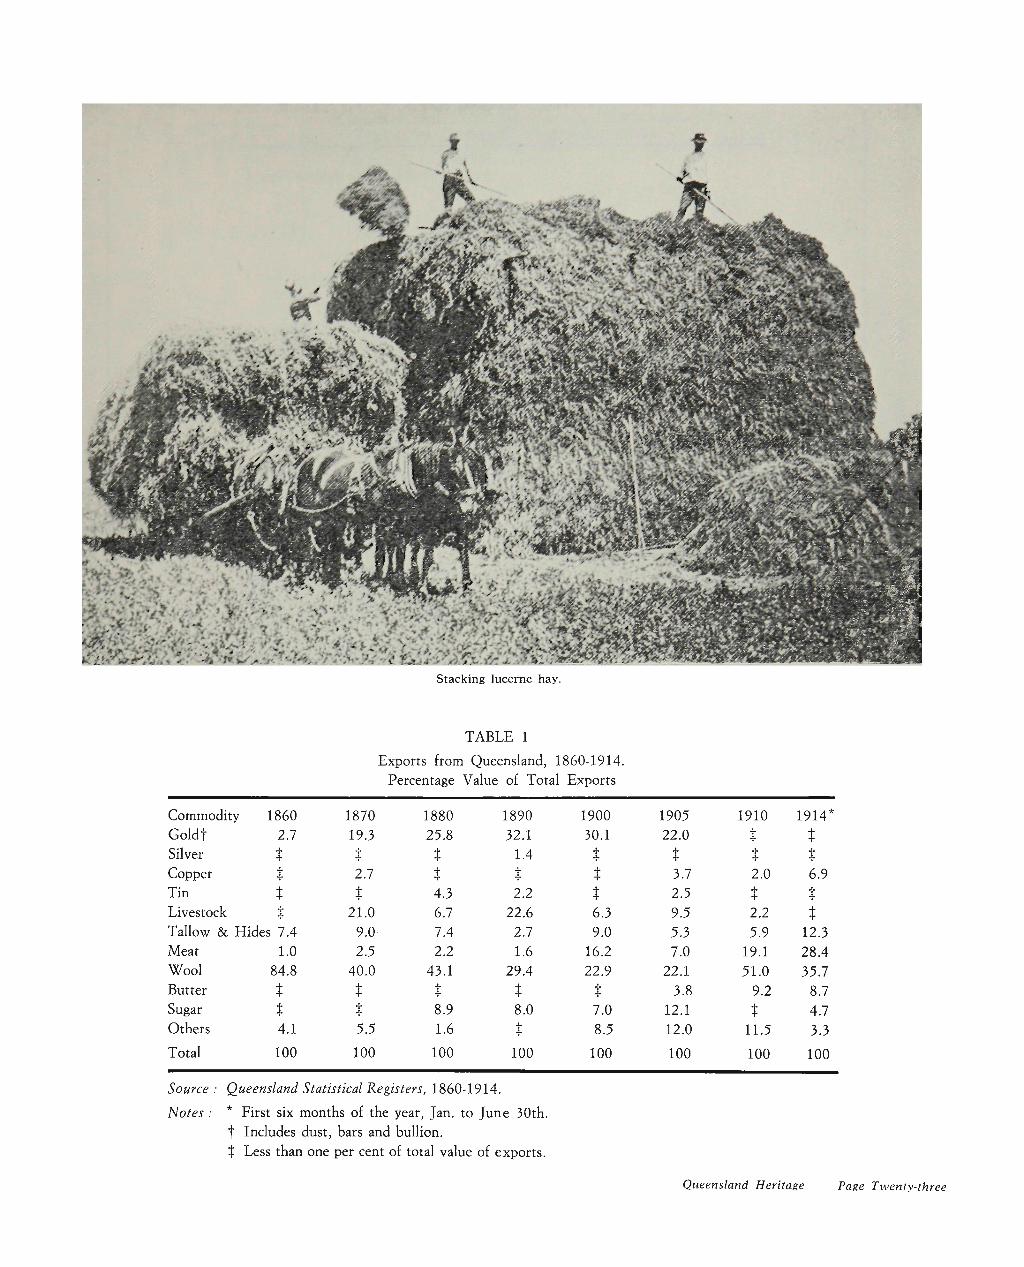
Stacking lucerne hay.
TABLE 1
Exports from Queensland, 1860-1914. Percentage Value of Total Exports
Commodity
Goldt Silver Copper Tin Livestock
1860 2.7 + + t +
•r
Tallovi & Hides 7.4 Meat Wool Butter Sugar Others
Total
1.0 84.8
-H-
t
4.1
100
1870 19.3
T
2.7 f
21.0 9.0 2.5
40.0
t t 5.5
100
1880 25.8
t i
4.3 6,7 7.4 2.2
43.1 +
8.9 1.6
100
1890 32.1
1.4
1 2.2
22.6 2.7 1.6
29.4 t
B.0 t
100
1900 30.1
t t t 6.3 9.0
16.2 22.9
t 7.0 8.5
100
1905 22.0
t 3.7 2.5 9.5 5.3 7.0
22.1 3.8
12.1 12.0
100
1910 *T*
-I--I-
2.0 "T
2.2 5.9
19.1 51.0
9.2
t 11.5
100
1914*
1: t 6.9
t
++
12.3 28.4 35.7
8.7 4.7 3.3
100
Source : Queensland Statistical Registers, 1860-1914.
Notes : * First six months of the year, Jan. to June 30th. t Includes dust, bars and bullion. + Less than one per cent of total value of exports.
Queensland Heritage Page Twenty-three
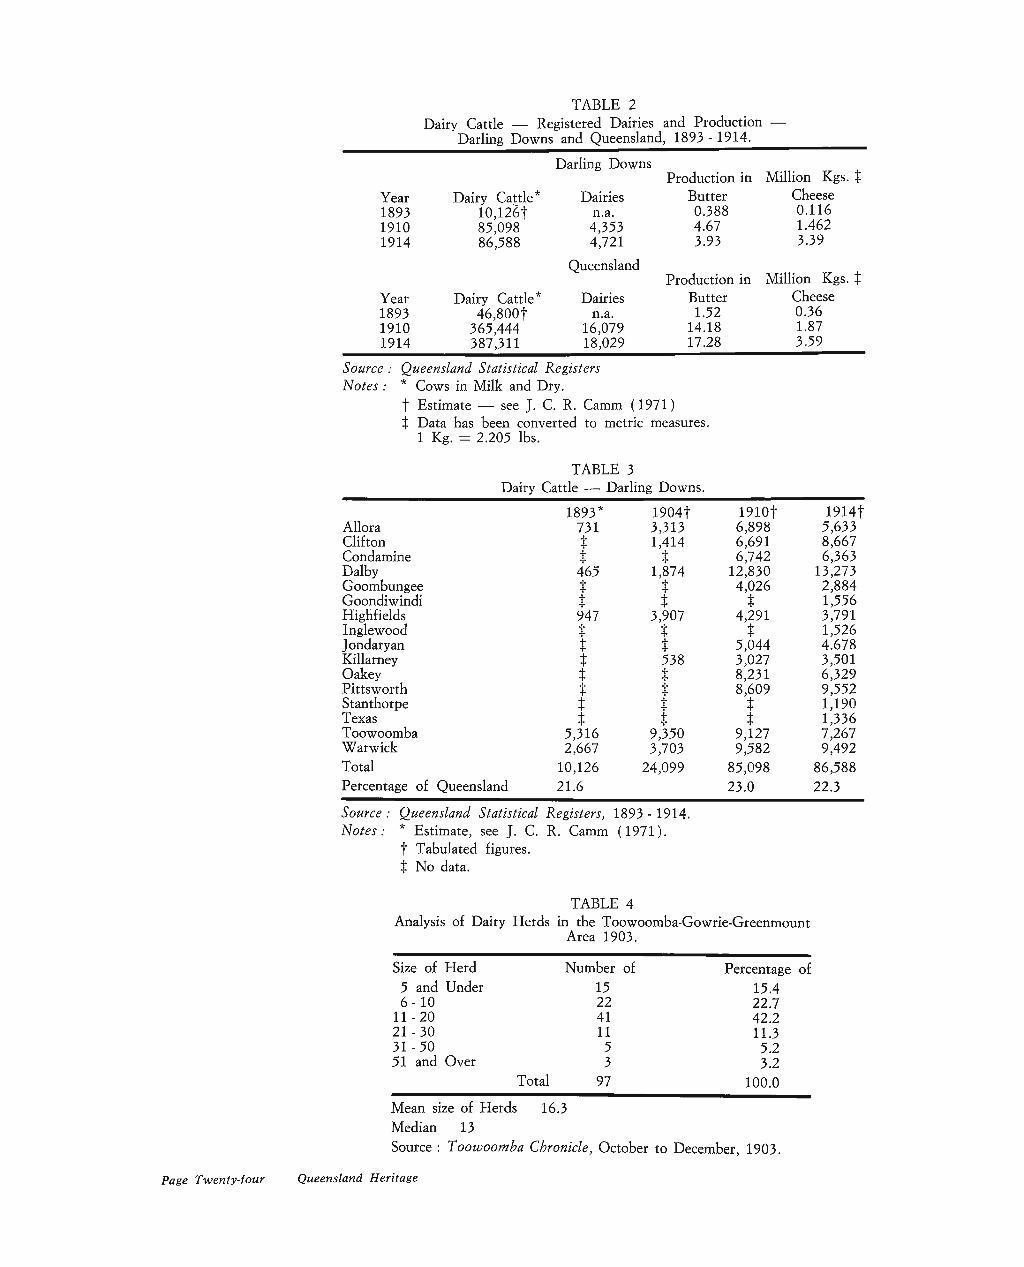
TABLE 2 Dairy Cattle — Registered Dairies and Production —
Darling Downs and Queensland, 1893 - 1914.
Year Dairy Cattle'' 1893 10,126t 1910 85,098 1914 86,588
Year Dairy Cattle* 1893 46,800t 1910 365,444 1914 387,311
Darling Downs
Dairies n.a. 4,353 4,721
Queensland
Dairies n.a.
16,079 18,029
Production in Million Kgs. t Butter Cheese 0.388 0.116 4.67 1.462 3.93 3.39
Production in Butter 1.52
14.18 17.28
Million Kgs, Cheese 0.36 1.87 3.59
t
Source : Queensland Statistical Registers Notes : * Cows in Milk and Dry.
t Estimate — see J. C. R. Camm (1971) % Data has been converted to metric measures.
1 Kg. = 2.205 lbs.
Allora Clifton Condamine Dalby Goombungee Goondiwindi Highfields Inglewood Jondaryan KiUarney Oakey Pittsworth Stanthorpe Texas Toowoomba Warwick Total
TABLE 3 Dairy Cattle — Darling Downs.
1893* 1904t 731 3,313 % 1,414 t % 465 1,874
t t t t 947 3,907 % %
% t X 538
X X X X X X X X
5,n6 9,350 2,667 3,703
10,126 24,099 Percentage of Queensland 21.6
1910t 6,898 6,691 6,742
12,830 4,026
X 4,291
X 5,044 3,027 8,231 8,609
X X
9,127 9,582
85,098 23.0
1914t 5,633 8,667 6,363
13,273 2,884 1,556 3,791 1,526 4.678 3,501 6,329 9,552 1,190 1,336 7,267 9,492
86,588 22.3
Source : Queensland Statistical Registers, 1893 - 1914. Notes: * Estimate, see J. C. R. Camm (1971).
t Tabulated figures. X No data.
TABLE 4 Analysis of Dairy Herds in the Toowoomba-Gowrie-Greenmount
Area 1903.
Size of Herd 5 and Under 6-10
11-20 21-30 31-50 51 and Over
Number of 15 22 41 11 5 3
Total 97
Percentage of 15.4 22.7 42.2 11.3 5.2 3.2
100.0
Mean size of Herds 16.3 Median 13
Source : Toowoomba Chronicle, October to December, 1903.
Page Twenty-four Queensland Heritage
W
, -H ON ^ H
G
ca
o , -H ON
1 H
Q o T-H ON
-a G
« N
1)
« J H CJ >
<
a i 3
o H
IU N
C ^
1-1 >^ y " V Q
OJ
ao
> :^
^ o O i - H O O O 00 o q r < ^ < N N q O N O f N T l - o d o N NO V O N O t ^ r T N < - ' ' - ^ O N O r ^ < - H i r N - H - ( N + + (N "-H ITN >—I ! H « 0 1 A r ^ r < ^ r < - N NO . — I I T N I A I A W O J f N I ^ ^ ^ ^ ^ ^ ^ ^
O 0 0 NO 0 0 O "-H 00 NO
++ -H- - ^ O O ON TJ- ^ T l - ON
O f N o o i ^ ^ ' - H i r N r r N i r N i r N m r O ' - H s o ^ o o O ' ^ r ^ ^H r A 0 0 r<^. ^H ";}- r ^ r^ o CNi o ON 00 00
O N o o o o r ^ i A N O O ^ ^ O N r ^ m < N ^ O ( N T } - o
ITN r^ NO r~ ITN • * O ON NO N D ON
Tj- s o ON O N r N O ON I ^ O
<-H ON • ^ <N fNl + + --H +-'• fN
NO f N >-H r H ( N CNJ
NO ITN ^ NO ^ xf- rA - ^ • *
, , ITN O <N r/N + + i-H ( N (N rvj
CTN ITN l A r~~
r-~ o NO o 00 r~-T-H ( N t ^ <N »-H -H
O O ' ^ O N T l - r ^ O l A l A ^ N O O O r r s , - H ( N . - H ^ H . — I < N I C N l ' - H ' — < ^ H r \ l
( ^ • ^ O N N O r ^ r ^ - ' ^ O N l r N r A r A ' N r f N i r ^ C N ' ^ ^ N O
, — I ON
I A - ^ O N O N O O ITN r ^ r r \ o o r ^ ( N l A r ~ - N O fNl --H CN ^H ,—I - H - T-H - H - T-H .^^ ---I ^—1 + + + + r - l r - l ^H ^H
^ NO r - ^ - H ^ ( N T-H
ITN O ^ l A ' ^ T j - s O r A O O f N C N I ^ r ^
a
G "S ra s « fH O - .Q
^ V ^ G
< u u
nj ^o
> E G S
o
y. G a o
ra
o
_ o c ra
o ID
ra
2 w
-T3 c ra
c CJ V
SO' ^ M H
o o Q ^
Q Pi;
<u c
"E ra
1 3 G o ra O
G ^ 2
S -G W o
" O G ° ra >> p > , <LI te )H C K* frt 1—
< U U Q O O K .2P M
ra -T3
>. te
(L)
- ^ tn
S 7G ra -tH
ra J3
E o o o o
H
c
o Q
-a G ra cn c w
o-
Pi
c^ o c
ra
CN
r : <u *::
Ol O o =
E Z ^ "o ^
l>5 <
ON
o PL, c w (U tH
o
•^r^iTNooirN-^j-t^Tj-^osirNCNr^r^^'^ocN O C N I ^ r - I ^ H r N l C J N N O r N l ^ C N O l n C N N O N O O N O r ^ O ' - H l T N O Q S O T - H , - H , — i l T N O T - H N O O O O I T N NO r-- (^ (N (N O ^ ^ r~- i r \
T-H ON
G ra
o o ON
^ C N f ' N r ^ I ^ r ^ > - - * - ^ r ^ O O - ^ 0 ' - H r ^ C N r ^ ' ^ 5^ r ^ ^ O N O ^ H i - ~ ( 3 N r ^ o o o < N o o N O r ^ o o r ^ i ^ o
1-H C T N T - H r ' N V N C N ' - i C N ' - H r ' N O l ' A f N l T - H S O C N N O T - H 1-^ x J - O < - H T - H I - H 1 - H C N I O C N
T-H T-H r^N
NO ^
<1 PL,
^ G u u IH
o G ra
>. ra
CA
1 )
ra +H
u
o o CJN
IU -T3
o PL, G <u
; H
o
ON 0 0 -
0 0 iTN ' ^ r ^ Tj- ON iTN r ^ T-H T-H r ^ - H - r^ - H - C N -
T^f TJ- ^ T T T^- c ^ CN r-- (<N o r--
h-H- ir\ CN r^ r^ r ^ ^ t ^ NO
ra T-H 1 ^ O ( N 0 0 - r f 00 NO O x f ON ITN ON
• ^ rNI CN T-H O ITN r^ - ^ NO NO (3N CN++T-H f<N T-H ++T-H+^.^_ j . CN 1 ^ t ^ T-H
CN T-H so r^
G
o Q
CJ T j
G-SjG-a
ra - § 1 ^ i ra >>
«H G
»H 5H
o o >> te^ u ,^ -e
« 6 0
c
O r ' c
ers.
60 ^ J
leal
R
tisti
slan
d S
ta
471
acre
s Q
ueen
. re =
2.
No
data
U CJ b w . .
0 5 T-H
AB
LE 7
H
• ON 00
cn" G
0 Q so
^ Q
-4—> ^ H
y ^
re K
ilom
an
d 19
ra T::;
croN C/2 ^
per
S>T
C/3
:ion.
Den
ra
pul;
0
T-H «-H
CN
T—1
0 ON
1891
u t.1
OJ t ^ CN ITN g ^ 0 NO T-H
_ 0 CN ^ " 0 0
w
OJ
3 Tj- rTN r^ CN Q i r - ; r-; CN T-H
c/3,_; 0 0 0
(U
. t ! CN ^ ITN 'st-" T-; i r \ ^ 0 CJ T-H 0 0 0 P
Cen
tral
E
ast
Nor
th
Wes
t
Dis
tric
t D
owns
, D
owns
, D
owns
, D
owns
,
„ Ml {JO bD W)
3.S.S .S .5 ^T tH iH iH ^ flj ra ra ra ra
U P Q P Q
.__( 0 CJN
., T 1
ON 00 ^ H
-o
slan
G ^
Que
e , 1
91
^ • S o"^
Cen
sus
of
Aus
tr
2 ~ v i 5S
cted
:
'onw
e •
Dat
a ex
tra
and
Com
m
Sour
ce
AB
LE 8
H
^ H
0 ON T - H
irca
CJ
ents
.
E CJ
der
Set
t
iH
0 Ul
Low
e
_c
Serv
ices
> T
J 3 J 3
0
z
CJ
G ra
^ »-<i is G
Se
ring
anda
CJ
Val
e
s w
•f/C
(
- C o o t i ^ 3 P u i-p, * j ^ ra ra
c/3 (JH oT) p q c/:) t n
CU
Ol
o Cj
Q
Queensland Heritage Page Twenty-five
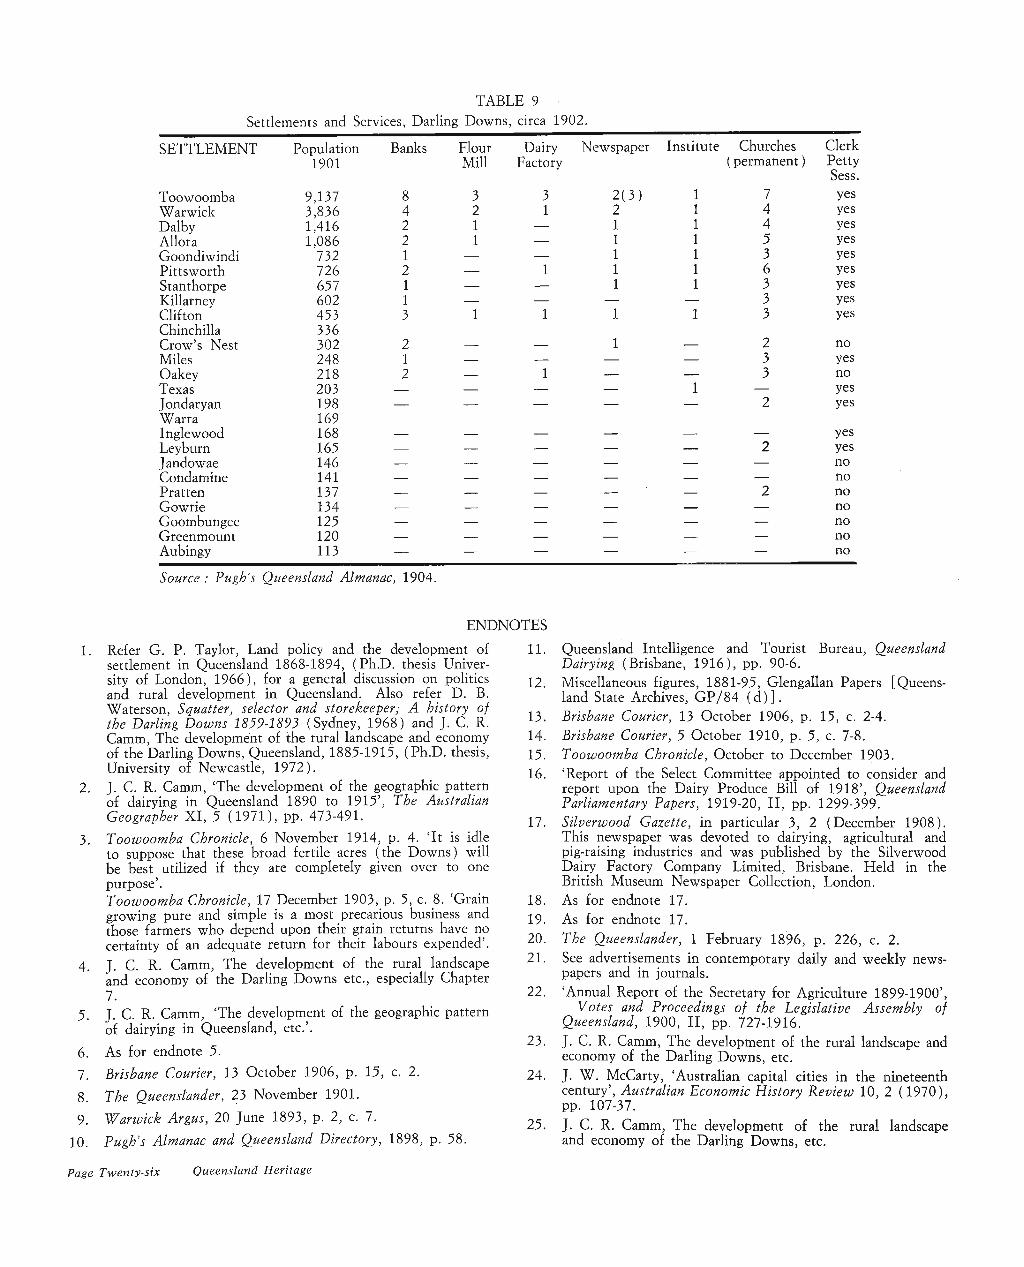
TABLE 9 Settlements and Services, Darling Downs, circa 1902.
2.
3.
SETTLEMENT
Toowoomba Warwick Dalby Allora Goondiwindi Pittsworth Stanthorpe KiUarney Clifton Chinchilla Crow's Nest Miles Oakey Texas Jondaryan Warra Inglewood Leyburn Jandowae Condamine Pratten Gowrie Goombungee Greenmount Aubingy
Source : Pugh's
Population 1901
9,137 3,836 1,416 1,086
732 726 657 602 453 336 302 248 218 203 198 169 168 165 146 141 137 134 125 120 113
Banks
8 4 2 2 1 2 1 1 3
2 1 2
— —
— — — — ^ — — — —
Queensland Almanac, 1904.
Flour Mill
3 2 1 1
— — — —
1
— — — — —-
— — — — — — — — —
Dairy Factory
3 1
— — —
1 — —
1
— —
1 — —
— — — — — — — — —
ENDNOTES
Newspaper
2(3) 2 1 1 1 1 1
— 1
1 — — — —
— — — — — — — — —
Institute
— 1
— — —
1 —
— — — — — — — — —
Churches (permanent)
7 4 4 5 3 6 3 3 3
2 3 3
— 2
— 2
— —
2 — — — —
Clerk Petty Sess. yes yes yes yes yes yes yes yes yes
no yes no yes yes
yes yes no no no no no no no
1. Refer G. P. Taylor, Land policy and the development of settlement in Queensland 1868-1894, (Ph.D. thesis University of London, 1966), for a general discussion on politics and rural development in Queensland. Also refer D. B. Waterson, Squatter, selector and storekeeper; A history of the Darling Downs 1859-1893 (Sydney, 1968) and J. C. R. Camm, The development of the rural landscape and economy of the Darling Downs, Queensland, 1885-1915, (Ph.D. thesis. University of Newcastle, 1972). J. C. R. Camm, 'The development of the geographic pattern of dairying in Queensland 1890 to 1915', The Australian Geographer XI, 5 (1971), pp. 473-491.
Toowoomba Chronicle, 6 November 1914, p. 4. 'It is idle to suppose that these broad fertile acres (the Downs) will be best utilized if they are completely given over to one purpose'. Toowoomba Chronicle, 17 December 1903, p. 5, c. 8. 'Grain growing pure and simple is a most precarious business and those farmers who depend upon their grain returns have no certainty of an adequate return for their labours expended'.
4. J. C. R. Camm, The development of the rural landscape and economy of the Darling Downs etc., especially Chapter 7.
5. J. C. R. Camm, 'The development of the geographic pattern of dairying in Queensland, etc.'.
6. As for endnote 5.
7. Brisbane Courier, 13 October 1906, p. 15, c. 2.
8. The Queenslander, 23 November 1901.
9. Warwick Argus, 20 June 1893, p. 2, c. 7.
10. Pugh's Almanac and Queensland Directory, 1898, p. 58.
11. Queensland Intelligence and Tourist Bureau, Queensland Dairying (Brisbane, 1916), pp. 90-6.
12. Miscellaneous figures, 1881-95, Glengallan Papers [Queensland State Archives, GP/84 ( d ) ] .
13. Brisbane Courier, 13 October 1906, p. 15, c. 2-4. 14. Brisbane Courier, 5 October 1910, p. 5, c. 7-8. 15. Toowoomba Chronicle, October to December 1903. 16. 'Report of the Select Committee appointed to consider and
report upon the Dairy Produce Bill of 1918', Queensland Parliamentary Papers, 1919-20, II , pp. 1299-399.
17. Silverwood Gazette, in particular 3, 2 (December 1908). This newspaper was devoted to dairying, agricultural and pig-raising industries and was published by the Silverwood Dairy Factory Company Limited, Brisbane. Held in the British Museum Newspaper Collection, London.
18. As for endnote 17. 19. As for endnote 17. 20. The Queenslander, 1 February 1896, p. 226, c. 2. 21. See advertisements in contemporary daily and weekly news
papers and in journals. 22. 'Annual Report of the Secretary for Agriculture 1899-1900',
Votes and Proceedings of the Legislative Assembly of Queensland, 1900, II, pp. 727-1916.
23. J. C. R. Camm, The development of the rural landscape and economy of the Darling Downs, etc.
24. J. W. McCarty, 'Australian capital cities in the nineteenth century', Australian Economic History Review 10, 2 (1970), pp. 107-37.
25. J. C. R. Camm, The development of the rural landscape and economy of the Darling Downs, etc.
Page Twenty-six Queensland Heritage