Embed Size (px)
Citation preview
56
DAFTAR PUSTAKA
1. World Health Organization. WHO global report on trends in prevalence of
tobacco smoking [Internet]. Switzerland; 2015. [cited 2015 Jan 26].
Available from:
http://apps.who.int/iris/bitstream/10665/156262/1/9789241564922_eng.pdf
?ua=1
2. Balai Penelitian dan Pengembangan Kesehatan Kementerian Kesehatan.
Riset Kesehatan Dasar [Internet]. Jakarta; 2013. [cited 2015 Jan 26]
Available from: http://www.depkes.go.id/resourcesnload/general/Hasil
Riskesdas 2013.pdf
3. Mehta N, Preston S. Continued increases in the relative risk of death from
smoking. Am J Public Health. 2012;102(11):2181–6.
4. Fisk N, Cleary-goldman A. Synopses of Research Articles Assessing the
Risks of Twin Pregnancies. 2005;2(6).
5. Douglas D. Reh, Thomas S, Timothy L. Smith. Impact of tobacco smoke on
chronic rhinosinusitis : a review of the literature. 2012;00(0):1–8.
6. Vachier I, Vignola M, Chiappara G, Bruno A, Meziane H, Godard P, et al.
Inflammatory features of nasal mucosa in smokers with and without COPD.
Thorax. 2004;59(4):303–7.
7. Tamashiro E, Cohen N, Palmer JN, Lima WT. Effects of cigarette smoking
on the respiratory epithelium and its role in the pathogenesis of chronic
rhinosinusitis. Braz J Otorhinolaryngol; 2009;75(6):903–7.
8. Tomooka LT, Murphy C, Davidson TM. Clinical study and literature review
of nasal irrigation. Laryngoscope. 2000;110(7):1189–93.
9. Yeung DF. Review Efficacy of Nasal Saline Sprays to Relieve Symptoms of
Chronic Sinusitis. 2012;88(2):84–7.
10. Rabone SJ, Saraswati S. Acceptance and effects of nasal lavage in
volunteer woodworkers and effects of nasal lavage in volunteer
woodworkers. OM (Lond). 1999;49(6):365-36.
11. David R, Aleksandra Z, Marlon M, Bruce B, James B; And Rob M. Efficacy
of daily hypertonic saline nasal irrigation among patients with sinusitis : A
randomized controlled trial. J Fam Pract. 2002;51:1049–55.
12. Hermelingmeier KE, Weber RK, Hellmich M, Heubach CP, Mösges R.
Nasal irrigation as an adjunctive treatment in allergic rhinitis: A systematic
review and meta-analysis. Am J Rhinol Allergy. 2012;26(5):119–25.
13. Will Corbridge, Rogan H. Essential ENT Practice: A Clinical Text. 1998.
19-20 p. 127-135
14. Netter FH. Atlas of Human Anatomy 25th Edition. Jakarta: EGC; 2014.p.35-
39
15. Howard L, M Pais. Sinus Surgery : Endoscopic and Microscopic
Approaches. New York : Thieme, 2005. p 16-19
16. Ballenger. Hidung dan Sinus Paranasal. In: Penyakit Telinga,
Hidung,Tenggorokan, Kepala, dan Leher; jilid I. Tangerang: Bina Rupa
57
Aksara; 2009. p. 4–243.
17. Soetjipto D, Wardani R. Buku Ajar Ilmu Kesehatan Telinga Hidung
Tenggorok Kepala dan Leher. Edisi Keenam. Jakarta : FK UI; 2007. p. 118-
122.
18. Dhingra PL. Disease of Ear Nose and Throat. 4thEd.New Delhi, India :
Elsevier, 2007. pp : 129-135; 145-148.
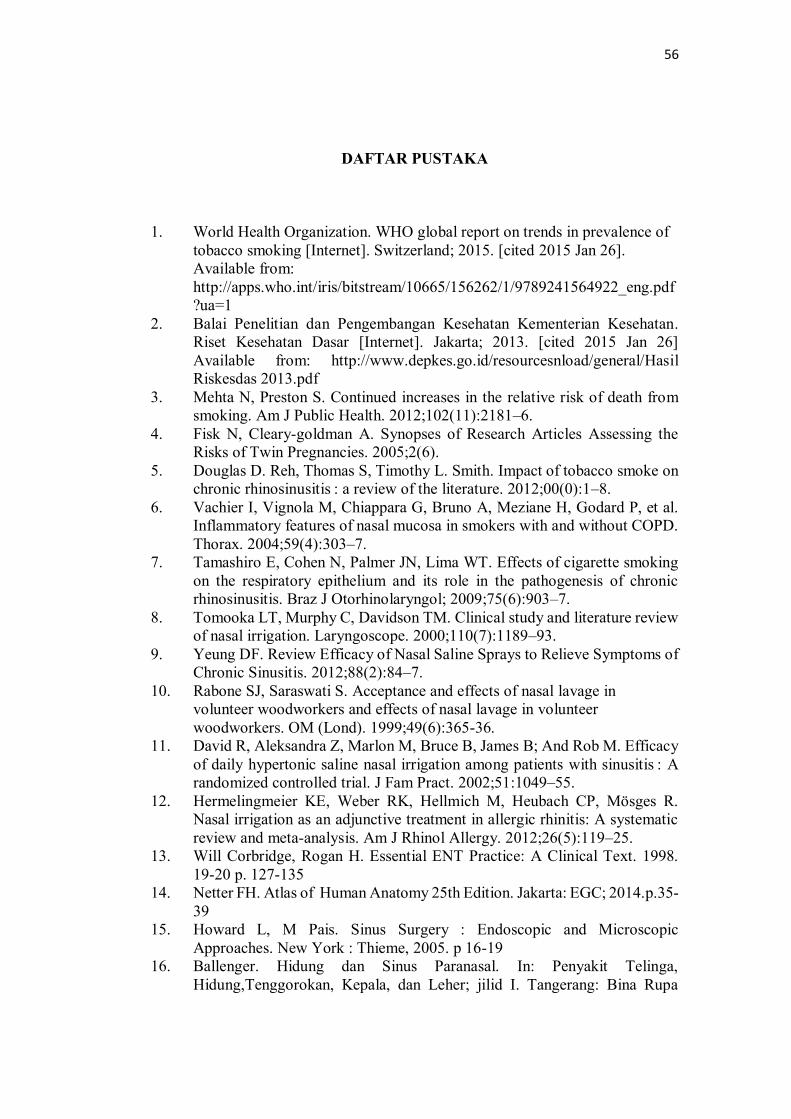
19. Bachert C, Naclerio R, Baraniuk JN. Pathophysiology of nasal congestion.
Int J Gen Med. 2010;3:47.
20. Tan RA, Corren J. The Relationship of Rhinitis and Asthma, Sinusitis, Food
Allergy, and Eczema. Immunol Allergy Clin North Am. Elsevier Inc;
2011;31(3):481–91.
21. Salib RJ, Harries PG, Nair SB, Howarth PH. Mechanisms and mediators of
nasal symptoms in non-allergic rhinitis. Clin Exp Allergy. 2008;38(3):393–
404.
22. Abbas AK, Lichtman AH. Effector mechanism of immune responses. In :
Celluler and moleculer immunology. Fifth edition. Philadelphia : WB
Saunders Company. 2003; 189-206.
23. Sam A, Deshmukh PT, Patil C, Jain S, Patil R. Nasal Septal Deviation and
External Nasal Deformity: A Correlative Study of 100 Cases. Indian J
Otolaryngol Head Neck Surg. 2012;64(4):312–8.
24. Rao JJ, Kumar ECV, Babu KR, Chowdary VS, Singh J, Rangamani SV.
Classification of nasal septal deviations-Relation to sinonasal pathology.
Indian J Otolaryngol Head Neck Surg. 2005;57(3):199–201.
25. Jin RH, Lee YJ. New description method and calssification system for septal
deviation. J Rhinol 2007;14(1): 27-31.
26. Steven TW. Neoplasms of the Nose and Paranasal Sinuses: Grand Rounds
Presentation, UTMB, Dept. of Otolaryngology. 2004;(5):1–10.
27. Varghese M, Glaum MC, Lockey RF. Drug-induced rhinitis. Clin Exp
Allergy. 2010;40(3):381–4.
28. Carr P. Cardiovascular drugs. Home Health Nurse. 2015;6(5):37–8.
29. Pinargote P, Guillen D, Guarderas JC. ACE inhibitors: upper respiratory
symptoms. 2014;2014:1–3.
30. Millas I, Liquidato BM, Meceles LR, Inmunohistochemical LR.
Inmunohistochemical Evaluation of Estrogen Receptors Alpha and Beta in
Normal Inferior Turbinate Mucosa. 2010;28(1):143–50.
31. Setiawati A, Darmansjah I, Parwati DR, Soemantri RD, Mulyarjo. The
efficacy of Rhinos ® SR on nasal resistance and nasal symptoms in patients
with perennial allergic rhinitis : a randomized , double-blind , placebo-
controlled study. Med J Indones. 2008;17(2):114–26.
32. Gillett S, Hopkins C , Slack R, Browne J, A pilot study of the SNOT 22
score in adults with no sinonasal disease. Clinical Otolaryngology. 2009;34:
467–469.
33. Van Spronsen E, Ingels KJ a O, Jansen a. H, Graamans K, Fokkens WJ.
Evidence-based recommendations regarding the differential diagnosis and
assessment of nasal congestion: Using the new grade system. Allergy Eur J
Allergy Clin Immunol. 2008;63(7):820–33.
58
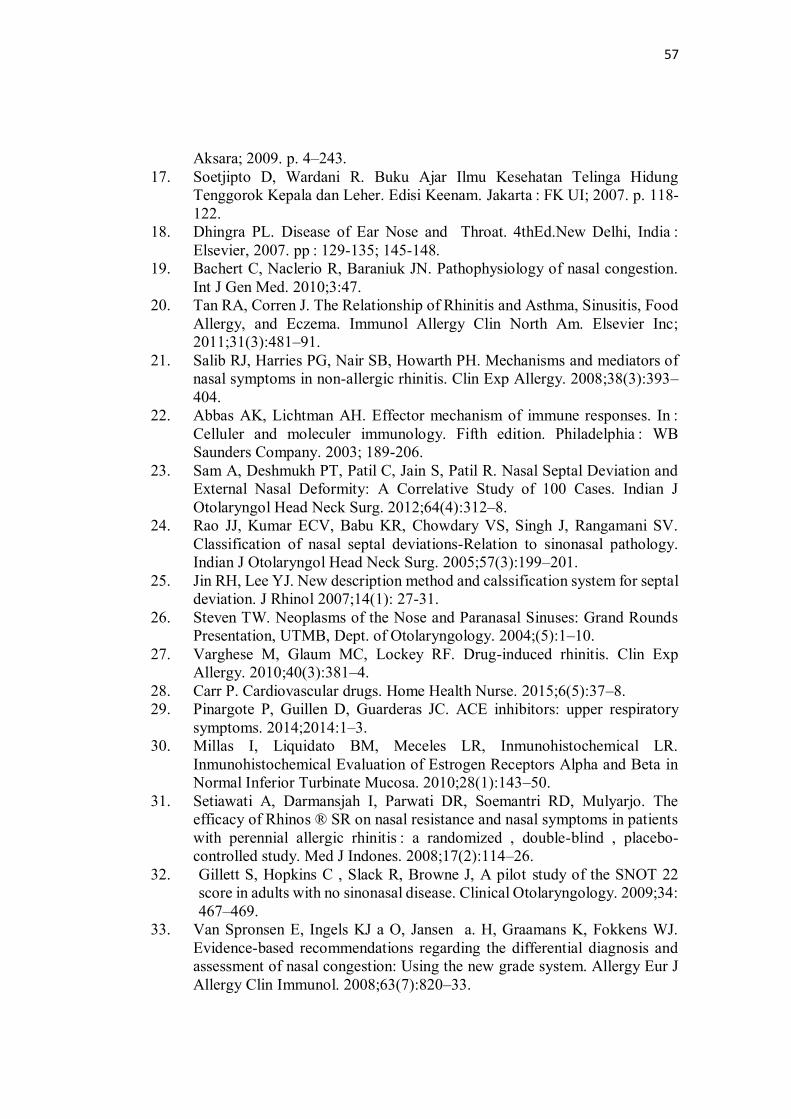
34. Lachanas V a, Tsiouvaka S, Tsea M, Hajiioannou JK, Skoulakis CE.
Validation of the Nasal Obstruction Symptom Evaluation (NOSE) Scale for
Greek Patients. J Am Acad Otolaryngol Neck Surg. 2014;151(8):819–23.
35. Stewart M, Witsell D, Smith T, Weaver E, Yueh B, Hannley M.
Development and validation of the Nasal Obstruction Symptom Evaluation
(NOSE) scale. 2004;130(2):157–63.
36. Iswarini AD. Validitas skor sumbatan hidung sebagai alat ukur gejala hidung
tersumbat. [unpublished] [dissertation]. Karya tulis akhir program studi ilmu
kesehatan THT. Yogyakarta. 2005.
37. Baraniuk JN. Subjective nasal fullness and objective congestion. Proc Am
Thorac Soc. 2011;8(1):62–9.
38. Armstrong S. Pengaruh Rokok Terhadap Kesehatan. Jakarta : Arcan;1995.
p.15-25
39. Marvin L. Essentials od Life and Health. 5th Ed. New York: Random
House;1984. p.210
40. Kakamu T, Tanabe T, Moriwaki S, Amano H. Cumulative Number of
Cigarettes Smoked Is an Effective Marker to Predict Future Diabetes.
2013;29(29):71–8.
41. Pace E, Ferraro M, Di S, Gerbino S, Bruno A, Lanata L, et al. Toxicology in
Vitro Oxidative stress and innate immunity responses in cigarette smoke
stimulated nasal epithelial cells. Toxicol Vitr. Elsevier Ltd; 2014;28(2):292–
9.
42. Rom O, Avezov K, Aizenbud D, Reznick AZ. Cigarette smoking and
inflammation revisited. Respir Physiol Neurobiol. Elsevier B.V.;
2013;187(1):5–10.
43. Papsin B, McTavish A. Saline nasal irrigation. Its role as an adjunct
treatment. Can Fam Physician. 2003;49:168–73.
44. Bastier P. Nasal irrigation: From empiricism to evidence-based medicine. A
review. Eur Ann Otorhinolaryngol Head Neck Dis. Elsevier Masson SAS;
2015; 132(5):281-5.
45. Rabago D, Zgierska A. Saline nasal irrigation for upper respiratory
conditions. Am Fam Physician. American Family Physician;
2009;80(10):117–9.
46. Heatley DG, McConnell KE, Kille TL, Leverson GE. Nasal irrigation for the
alleviation of sinonasal symptoms. Otolaryngol Head Neck Surg.
2001;125(1):44–8.
47. Baby MK, Muthu PK, Johnson P, Kannan S. Effect of cigarette smoking on
nasal mucociliary clearance: A comparative analysis using saccharin test.
Lung India. 2014;31(1):39–42.
59
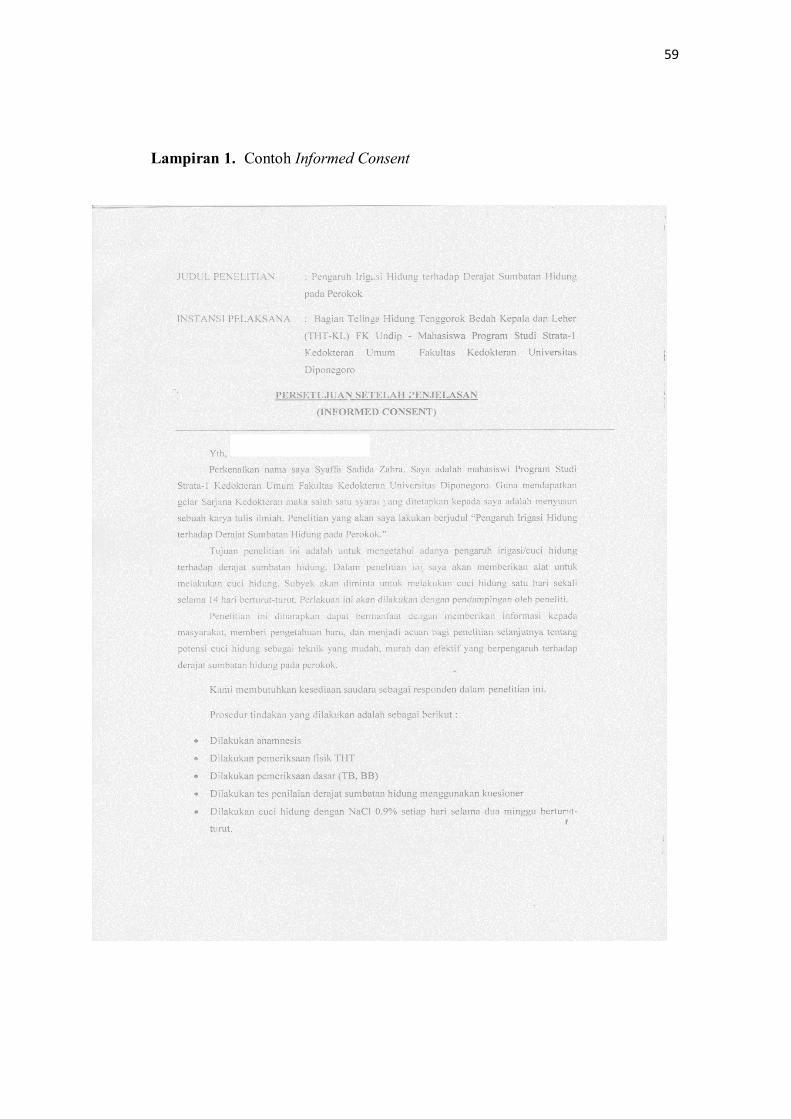
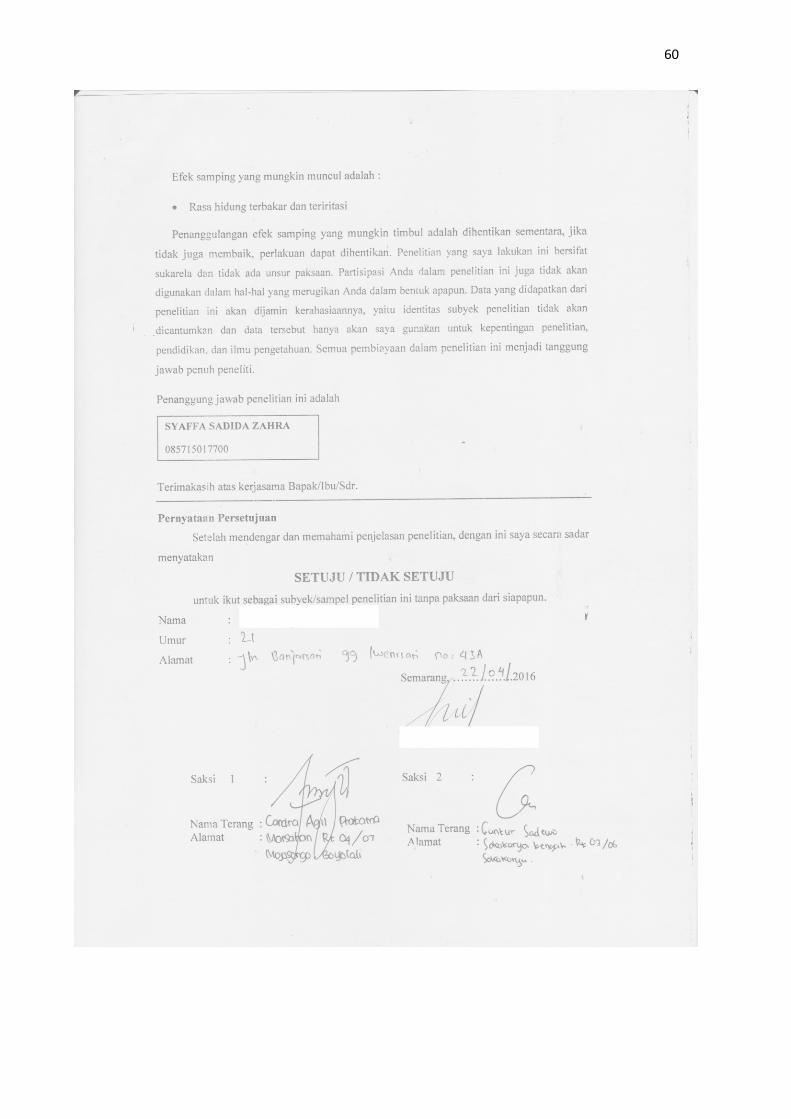
Lampiran 1. Contoh Informed Consent
Lampiran 2. Contoh Data Pasien
60
61
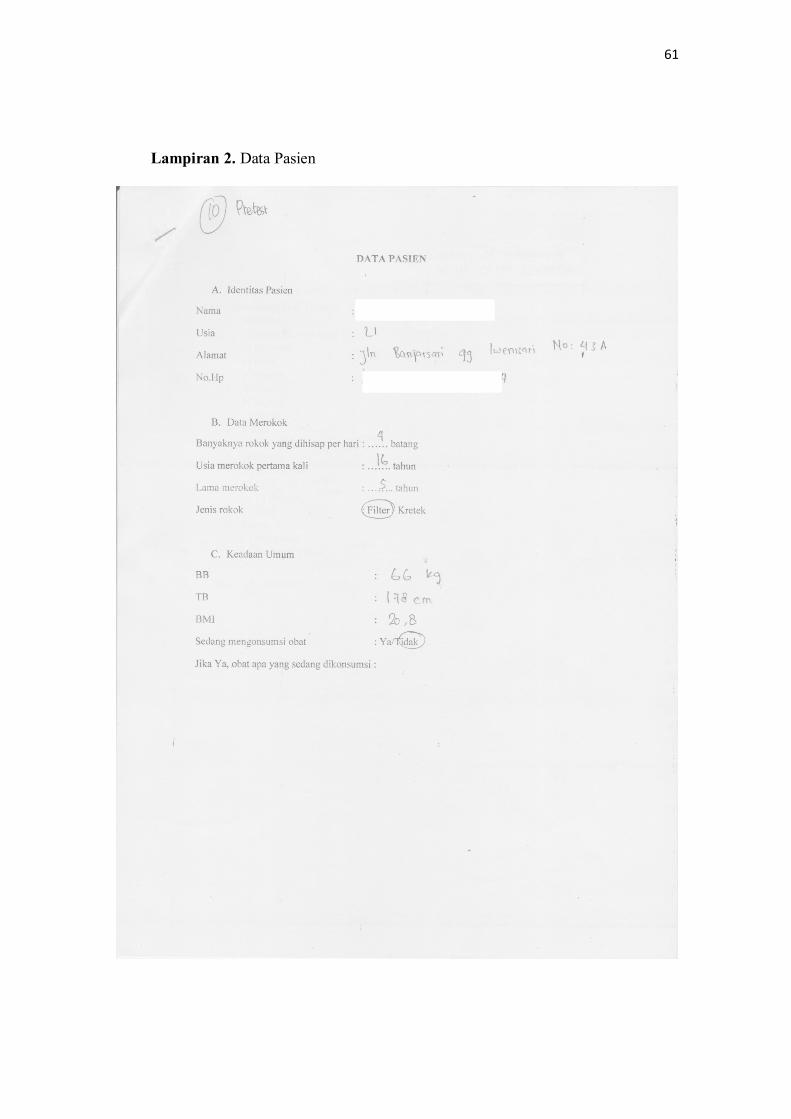
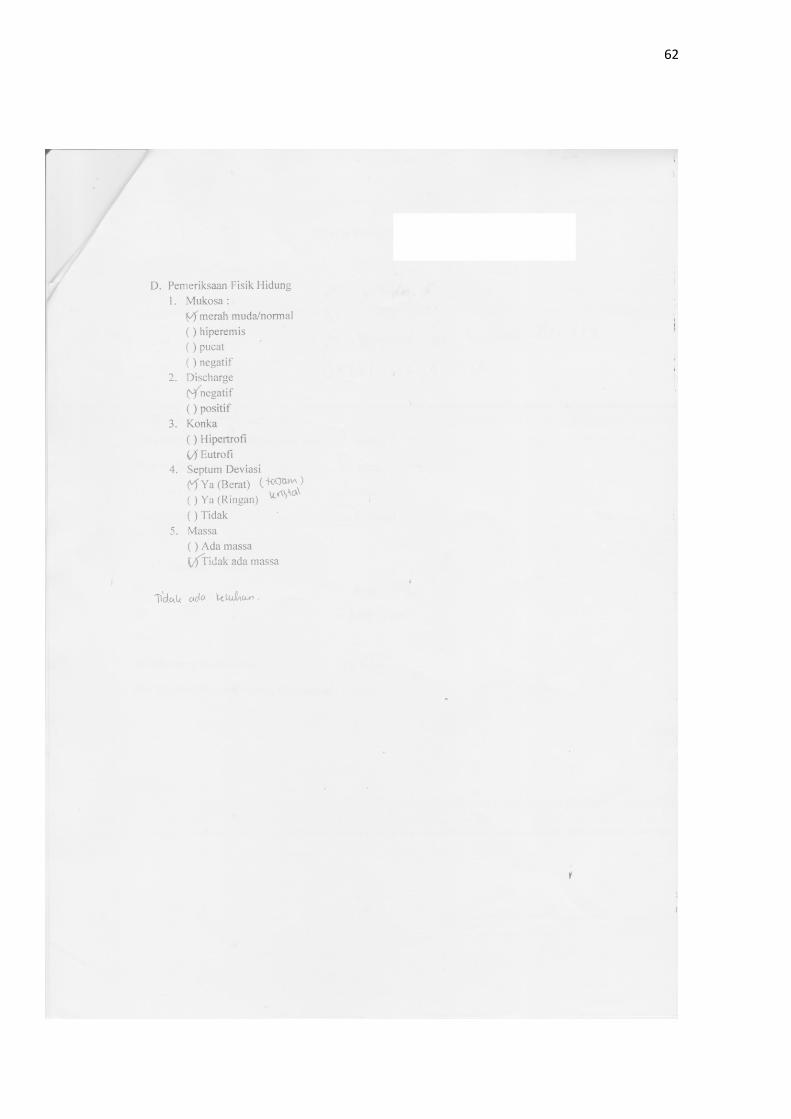
Lampiran 2. Data Pasien
62
63
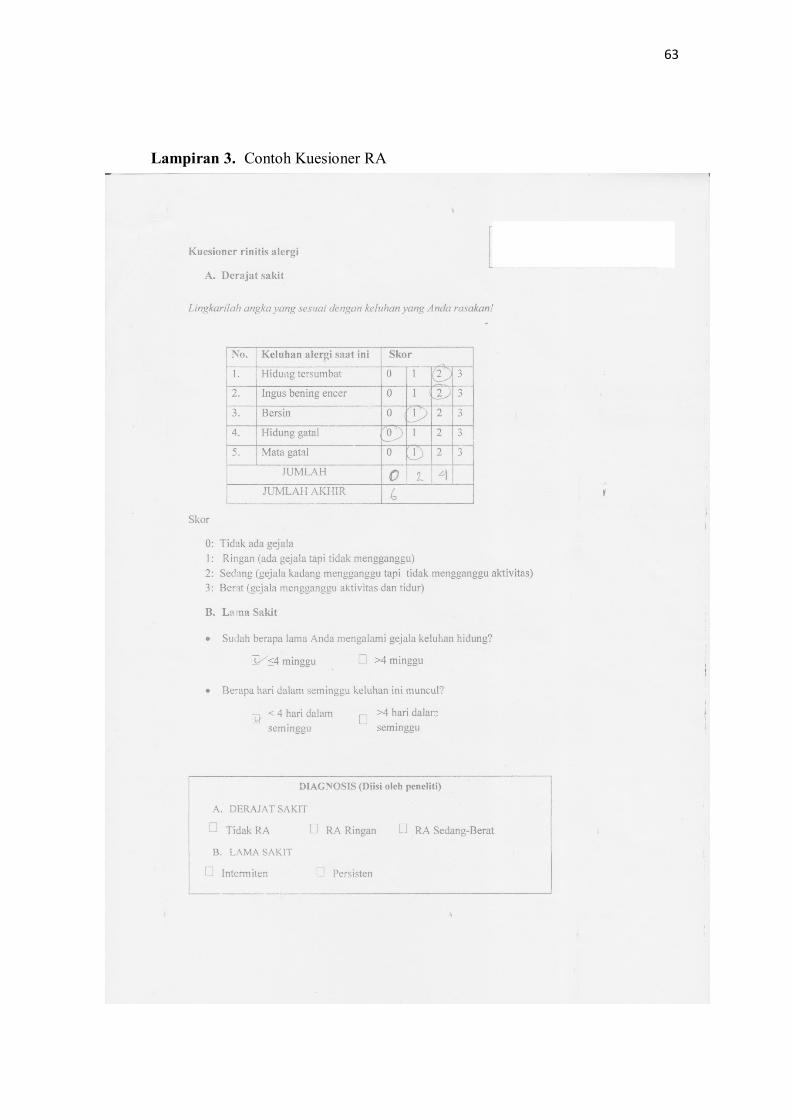
Lampiran 3. Contoh Kuesioner RA

64
Lampiran 4. Contoh NOSE Scale
65
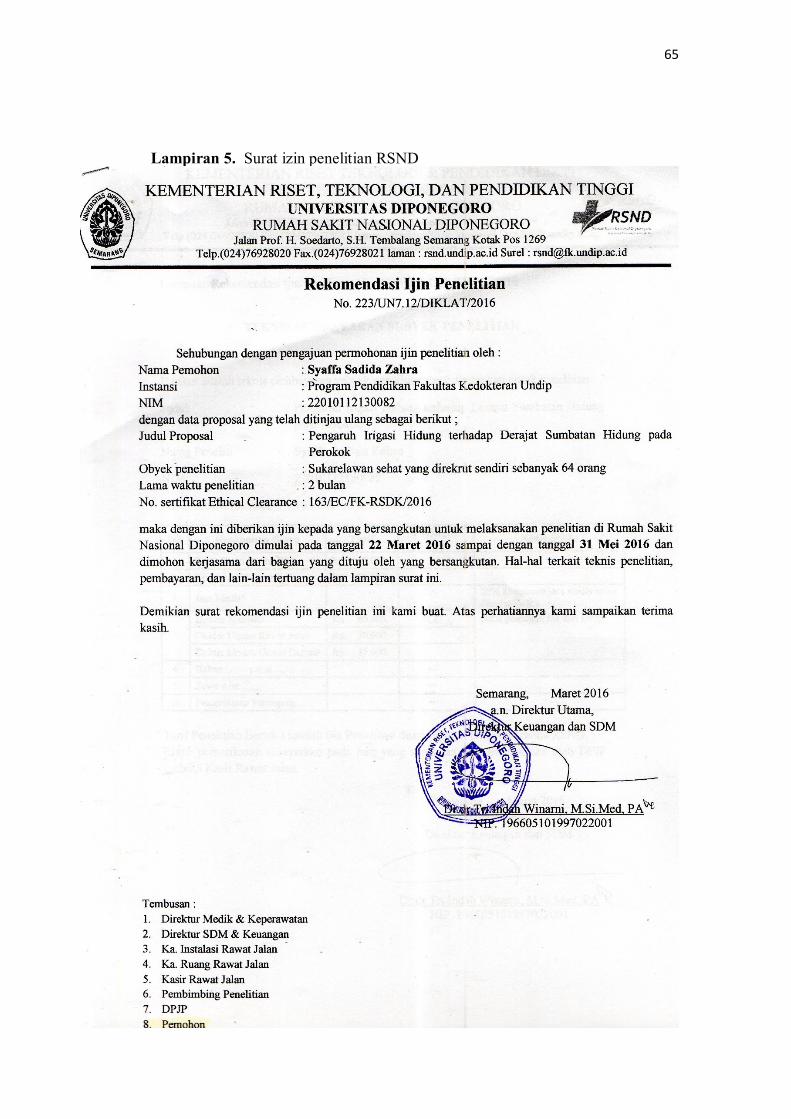
Lampiran 5. Surat izin penelitian RSND
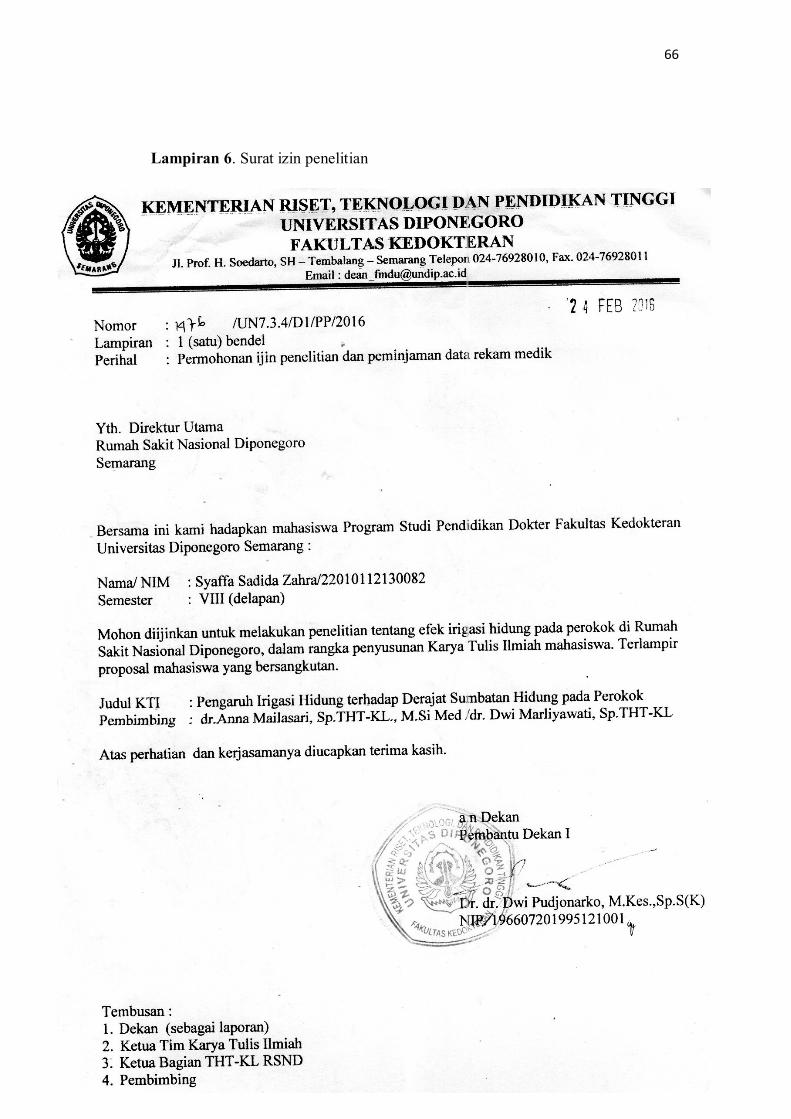
Lampiran 6. Surat izin penelitian
66
Lampiran 6. Surat izin penelitian
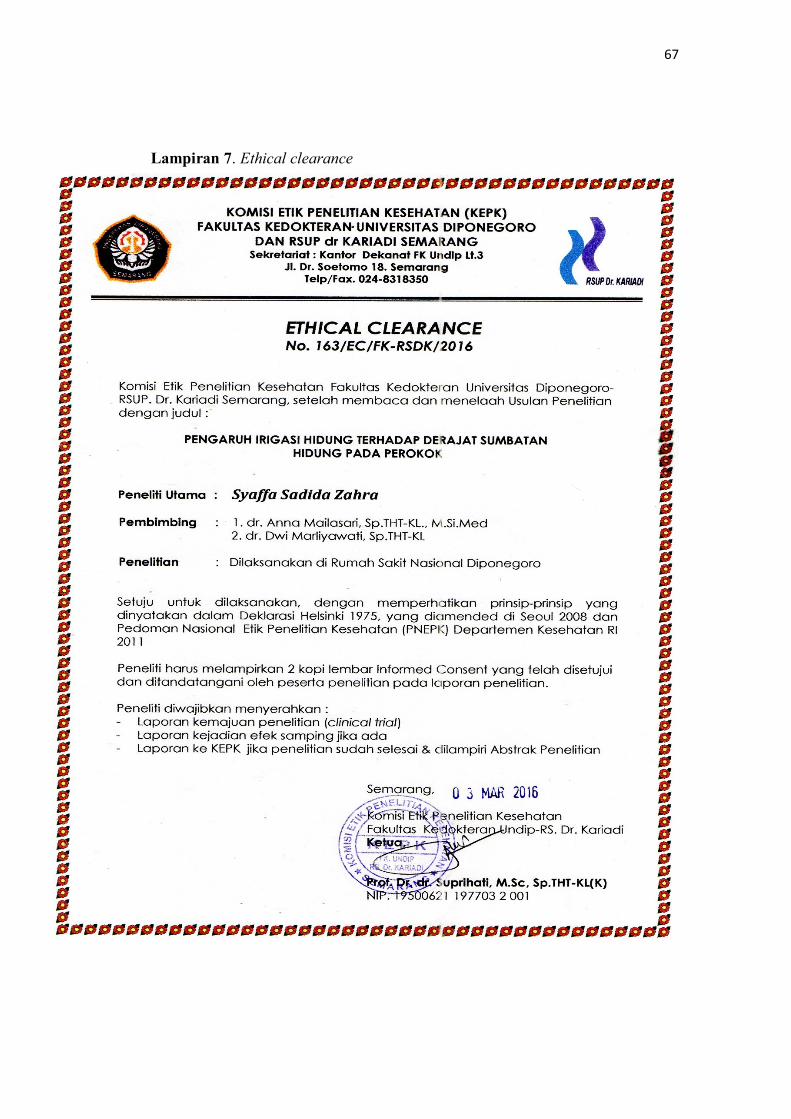
Lampiran 7. Ethical clearance
67
Lampiran 7. Ethical clearance
68
68
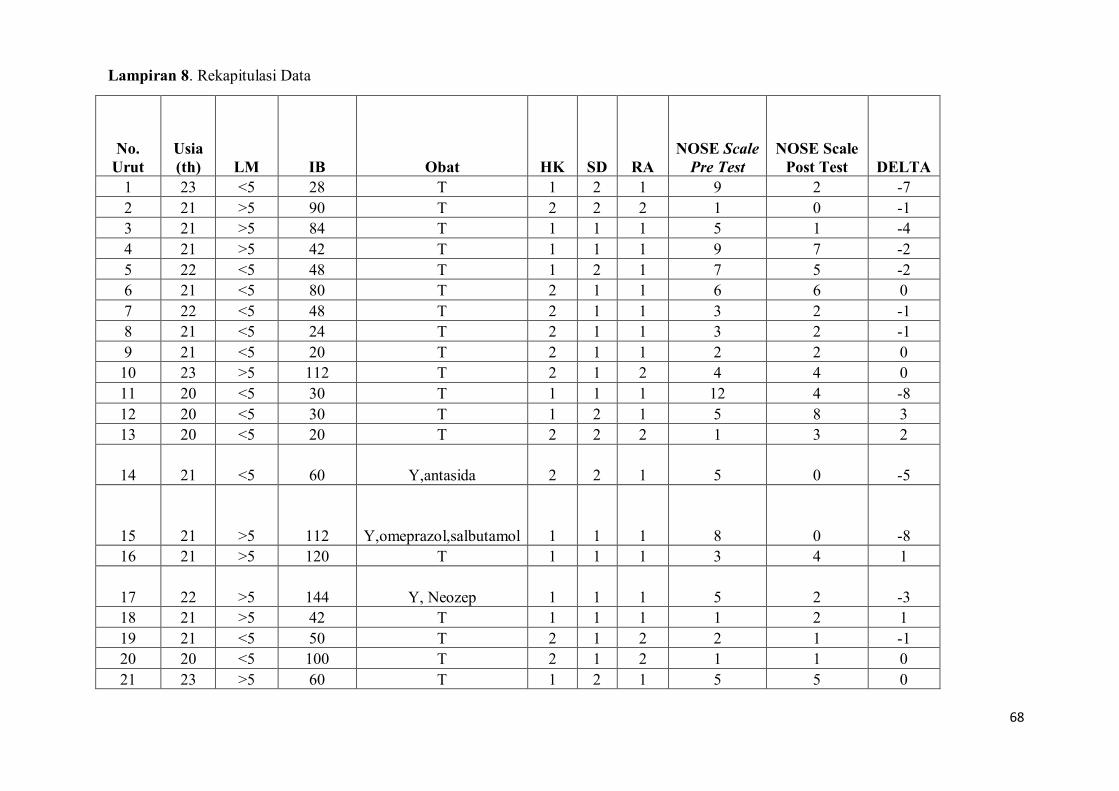
No.
Urut
Usia
(th) LM IB Obat HK SD RA
NOSE Scale
Pre Test
NOSE Scale
Post Test DELTA
1 23 <5 28 T 1 2 1 9 2 -7
2 21 >5 90 T 2 2 2 1 0 -1
3 21 >5 84 T 1 1 1 5 1 -4
4 21 >5 42 T 1 1 1 9 7 -2
5 22 <5 48 T 1 2 1 7 5 -2
6 21 <5 80 T 2 1 1 6 6 0
7 22 <5 48 T 2 1 1 3 2 -1
8 21 <5 24 T 2 1 1 3 2 -1
9 21 <5 20 T 2 1 1 2 2 0
10 23 >5 112 T 2 1 2 4 4 0
11 20 <5 30 T 1 1 1 12 4 -8
12 20 <5 30 T 1 2 1 5 8 3
13 20 <5 20 T 2 2 2 1 3 2
14 21 <5 60 Y,antasida 2 2 1 5 0 -5
15 21 >5 112 Y,omeprazol,salbutamol 1 1 1 8 0 -8
16 21 >5 120 T 1 1 1 3 4 1
17 22 >5 144 Y, Neozep 1 1 1 5 2 -3
18 21 >5 42 T 1 1 1 1 2 1
19 21 <5 50 T 2 1 2 2 1 -1
20 20 <5 100 T 2 1 2 1 1 0
21 23 >5 60 T 1 2 1 5 5 0
Lampiran 8. Rekapitulasi Data
69
69
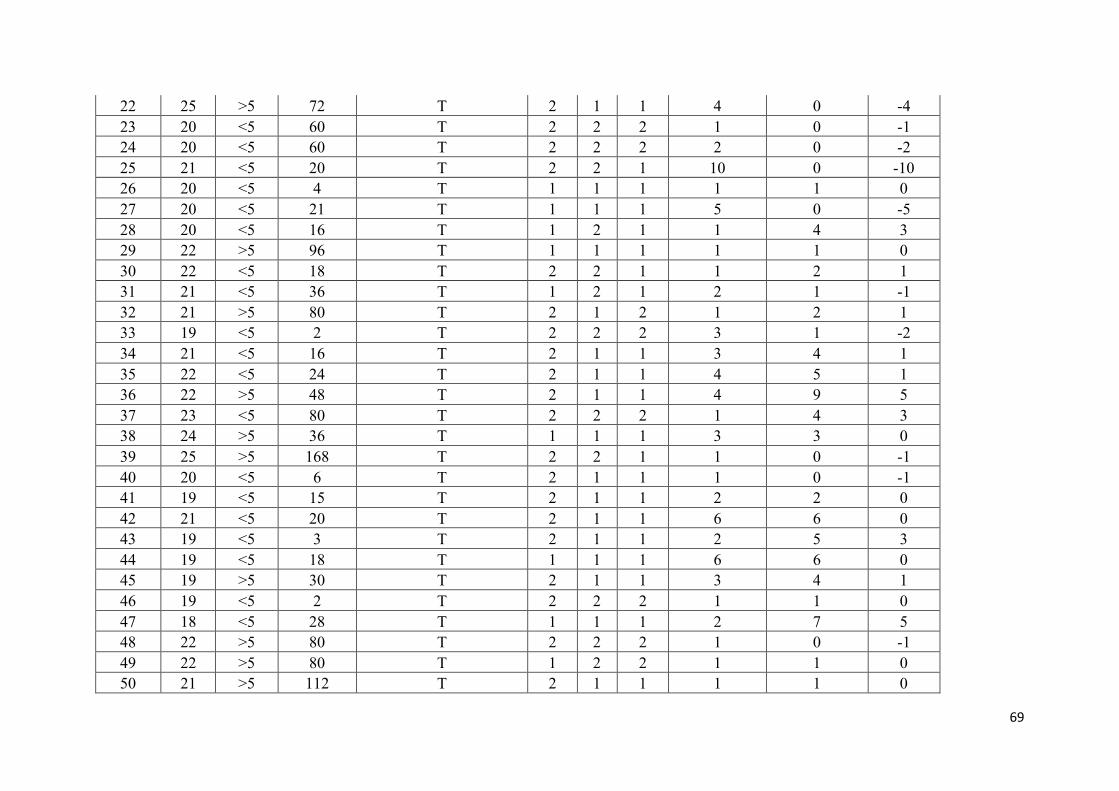
22 25 >5 72 T 2 1 1 4 0 -4
23 20 <5 60 T 2 2 2 1 0 -1
24 20 <5 60 T 2 2 2 2 0 -2
25 21 <5 20 T 2 2 1 10 0 -10
26 20 <5 4 T 1 1 1 1 1 0
27 20 <5 21 T 1 1 1 5 0 -5
28 20 <5 16 T 1 2 1 1 4 3
29 22 >5 96 T 1 1 1 1 1 0
30 22 <5 18 T 2 2 1 1 2 1
31 21 <5 36 T 1 2 1 2 1 -1
32 21 >5 80 T 2 1 2 1 2 1
33 19 <5 2 T 2 2 2 3 1 -2
34 21 <5 16 T 2 1 1 3 4 1
35 22 <5 24 T 2 1 1 4 5 1
36 22 >5 48 T 2 1 1 4 9 5
37 23 <5 80 T 2 2 2 1 4 3
38 24 >5 36 T 1 1 1 3 3 0
39 25 >5 168 T 2 2 1 1 0 -1
40 20 <5 6 T 2 1 1 1 0 -1
41 19 <5 15 T 2 1 1 2 2 0
42 21 <5 20 T 2 1 1 6 6 0
43 19 <5 3 T 2 1 1 2 5 3
44 19 <5 18 T 1 1 1 6 6 0
45 19 >5 30 T 2 1 1 3 4 1
46 19 <5 2 T 2 2 2 1 1 0
47 18 <5 28 T 1 1 1 2 7 5
48 22 >5 80 T 2 2 2 1 0 -1
49 22 >5 80 T 1 2 2 1 1 0
50 21 >5 112 T 2 1 1 1 1 0
70
70
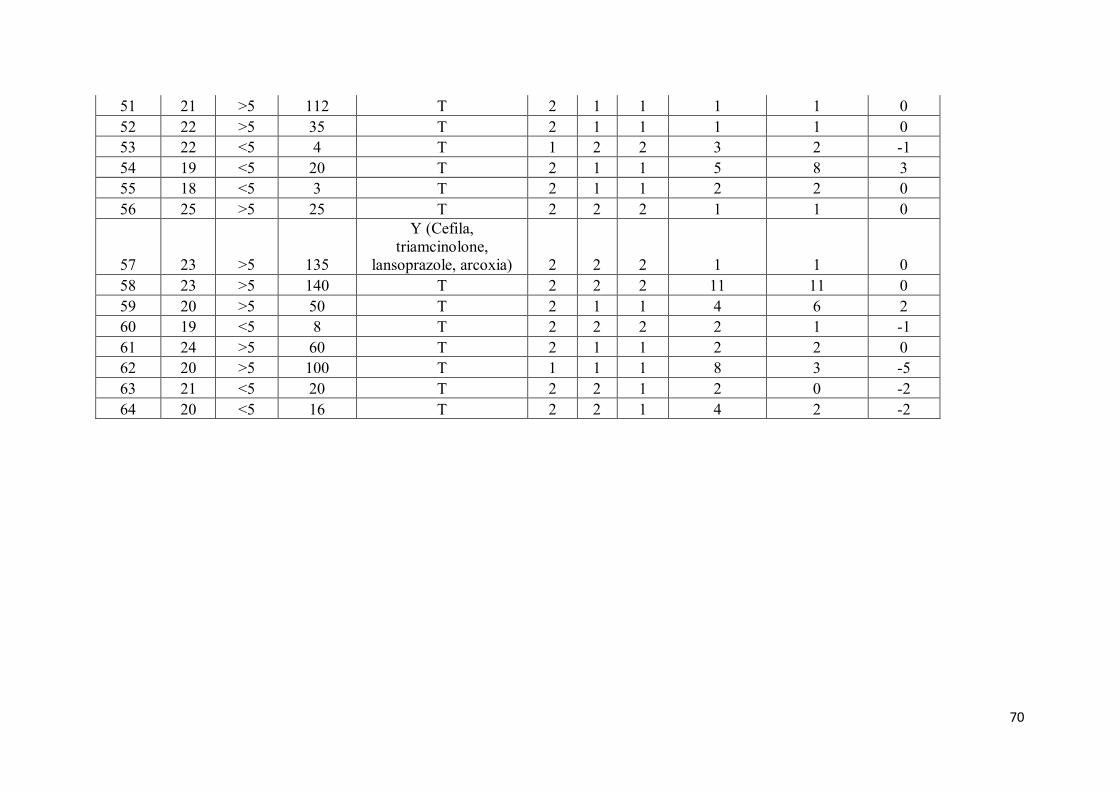
51 21 >5 112 T 2 1 1 1 1 0
52 22 >5 35 T 2 1 1 1 1 0
53 22 <5 4 T 1 2 2 3 2 -1
54 19 <5 20 T 2 1 1 5 8 3
55 18 <5 3 T 2 1 1 2 2 0
56 25 >5 25 T 2 2 2 1 1 0
57 23 >5 135
Y (Cefila,
triamcinolone,
lansoprazole, arcoxia) 2 2 2 1 1 0
58 23 >5 140 T 2 2 2 11 11 0
59 20 >5 50 T 2 1 1 4 6 2
60 19 <5 8 T 2 2 2 2 1 -1
61 24 >5 60 T 2 1 1 2 2 0
62 20 >5 100 T 1 1 1 8 3 -5
63 21 <5 20 T 2 2 1 2 0 -2
64 20 <5 16 T 2 2 1 4 2 -2
71
71
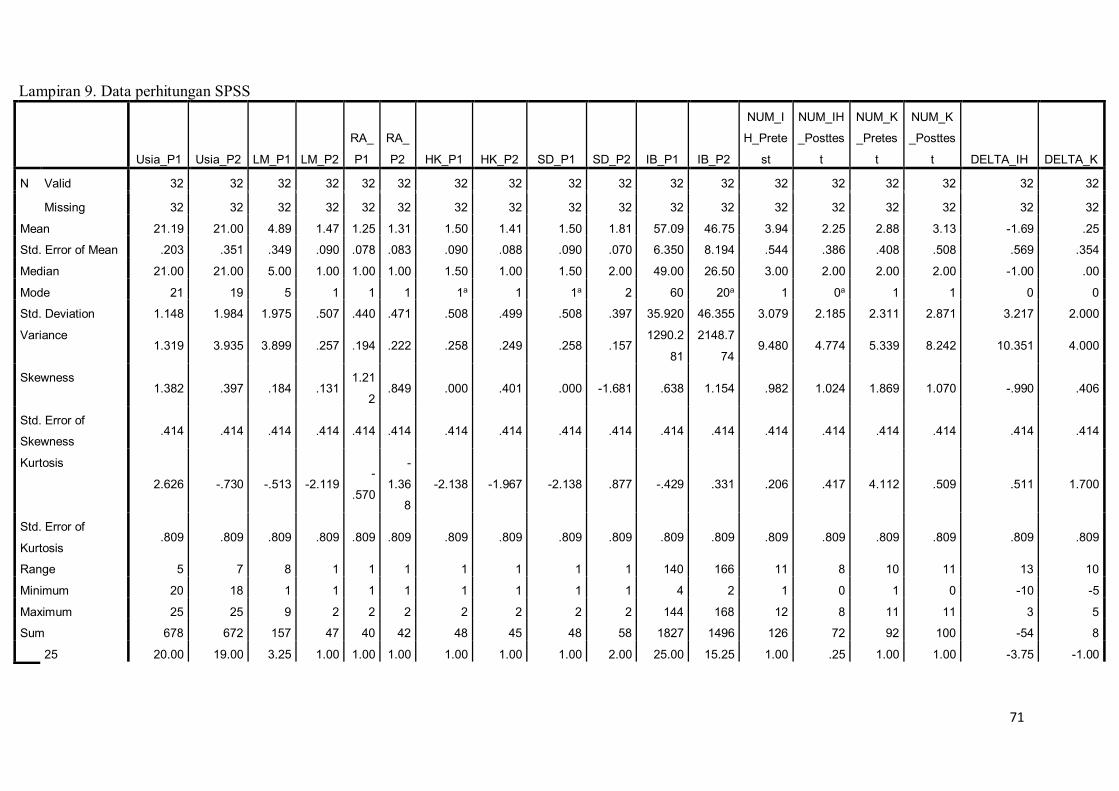
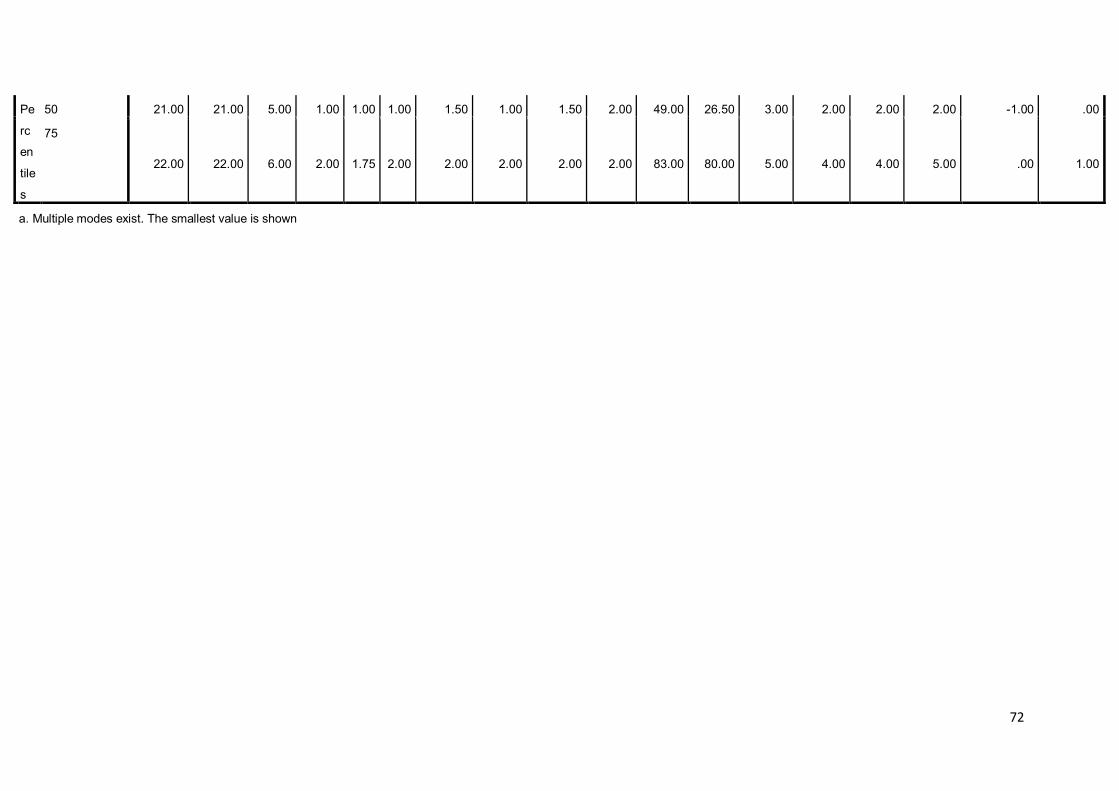
Lampiran 9. Data perhitungan SPSS
Usia_P1 Usia_P2 LM_P1 LM_P2
RA_
P1
RA_
P2 HK_P1 HK_P2 SD_P1 SD_P2 IB_P1 IB_P2
NUM_I
H_Prete
st
NUM_IH
_Posttes
t
NUM_K
_Pretes
t
NUM_K
_Posttes
t DELTA_IH DELTA_K
N Valid 32 32 32 32 32 32 32 32 32 32 32 32 32 32 32 32 32 32
Missing 32 32 32 32 32 32 32 32 32 32 32 32 32 32 32 32 32 32
Mean 21.19 21.00 4.89 1.47 1.25 1.31 1.50 1.41 1.50 1.81 57.09 46.75 3.94 2.25 2.88 3.13 -1.69 .25
Std. Error of Mean .203 .351 .349 .090 .078 .083 .090 .088 .090 .070 6.350 8.194 .544 .386 .408 .508 .569 .354
Median 21.00 21.00 5.00 1.00 1.00 1.00 1.50 1.00 1.50 2.00 49.00 26.50 3.00 2.00 2.00 2.00 -1.00 .00
Mode 21 19 5 1 1 1 1a 1 1a 2 60 20a 1 0a 1 1 0 0
Std. Deviation 1.148 1.984 1.975 .507 .440 .471 .508 .499 .508 .397 35.920 46.355 3.079 2.185 2.311 2.871 3.217 2.000
Variance 1.319 3.935 3.899 .257 .194 .222 .258 .249 .258 .157
1290.2
81
2148.7
74 9.480 4.774 5.339 8.242 10.351 4.000
Skewness 1.382 .397 .184 .131
1.21
2 .849 .000 .401 .000 -1.681 .638 1.154 .982 1.024 1.869 1.070 -.990 .406
Std. Error of
Skewness .414 .414 .414 .414 .414 .414 .414 .414 .414 .414 .414 .414 .414 .414 .414 .414 .414 .414
Kurtosis
2.626 -.730 -.513 -2.119 -
.570
-
1.36
8
-2.138 -1.967 -2.138 .877 -.429 .331 .206 .417 4.112 .509 .511 1.700
Std. Error of
Kurtosis .809 .809 .809 .809 .809 .809 .809 .809 .809 .809 .809 .809 .809 .809 .809 .809 .809 .809
Range 5 7 8 1 1 1 1 1 1 1 140 166 11 8 10 11 13 10
Minimum 20 18 1 1 1 1 1 1 1 1 4 2 1 0 1 0 -10 -5
Maximum 25 25 9 2 2 2 2 2 2 2 144 168 12 8 11 11 3 5
Sum 678 672 157 47 40 42 48 45 48 58 1827 1496 126 72 92 100 -54 8
25 20.00 19.00 3.25 1.00 1.00 1.00 1.00 1.00 1.00 2.00 25.00 15.25 1.00 .25 1.00 1.00 -3.75 -1.00
72
72
Pe
rc
en
tile
s
50 21.00 21.00 5.00 1.00 1.00 1.00 1.50 1.00 1.50 2.00 49.00 26.50 3.00 2.00 2.00 2.00 -1.00 .00
75
22.00 22.00 6.00 2.00 1.75 2.00 2.00 2.00 2.00 2.00 83.00 80.00 5.00 4.00 4.00 5.00 .00 1.00
a. Multiple modes exist. The smallest value is shown
73
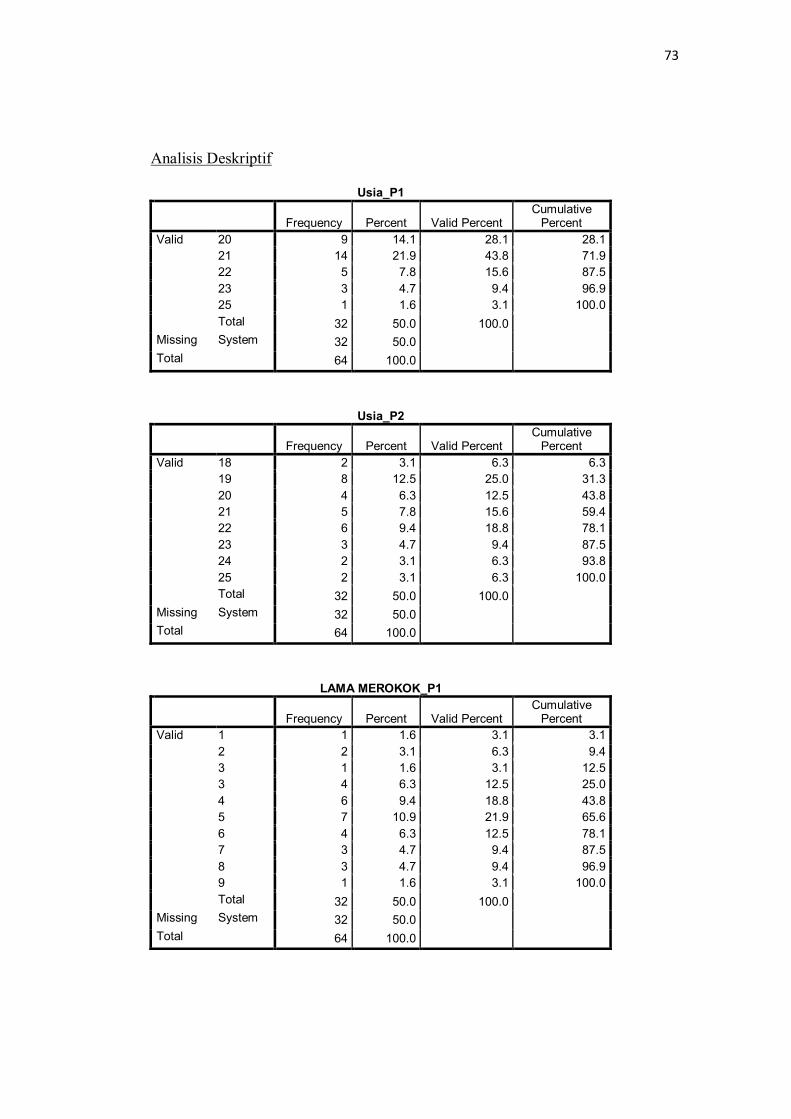
Analisis Deskriptif
Usia_P1
Frequency Percent Valid Percent Cumulative
Percent
Valid 20 9 14.1 28.1 28.1
21 14 21.9 43.8 71.9
22 5 7.8 15.6 87.5
23 3 4.7 9.4 96.9
25 1 1.6 3.1 100.0
Total 32 50.0 100.0 Missing System 32 50.0 Total 64 100.0
Usia_P2
Frequency Percent Valid Percent Cumulative
Percent
Valid 18 2 3.1 6.3 6.3
19 8 12.5 25.0 31.3
20 4 6.3 12.5 43.8
21 5 7.8 15.6 59.4
22 6 9.4 18.8 78.1
23 3 4.7 9.4 87.5
24 2 3.1 6.3 93.8
25 2 3.1 6.3 100.0
Total 32 50.0 100.0 Missing System 32 50.0 Total 64 100.0
LAMA MEROKOK_P1
Frequency Percent Valid Percent Cumulative
Percent
Valid 1 1 1.6 3.1 3.1
2 2 3.1 6.3 9.4
3 1 1.6 3.1 12.5
3 4 6.3 12.5 25.0
4 6 9.4 18.8 43.8
5 7 10.9 21.9 65.6
6 4 6.3 12.5 78.1
7 3 4.7 9.4 87.5
8 3 4.7 9.4 96.9
9 1 1.6 3.1 100.0
Total 32 50.0 100.0 Missing System 32 50.0 Total 64 100.0
74
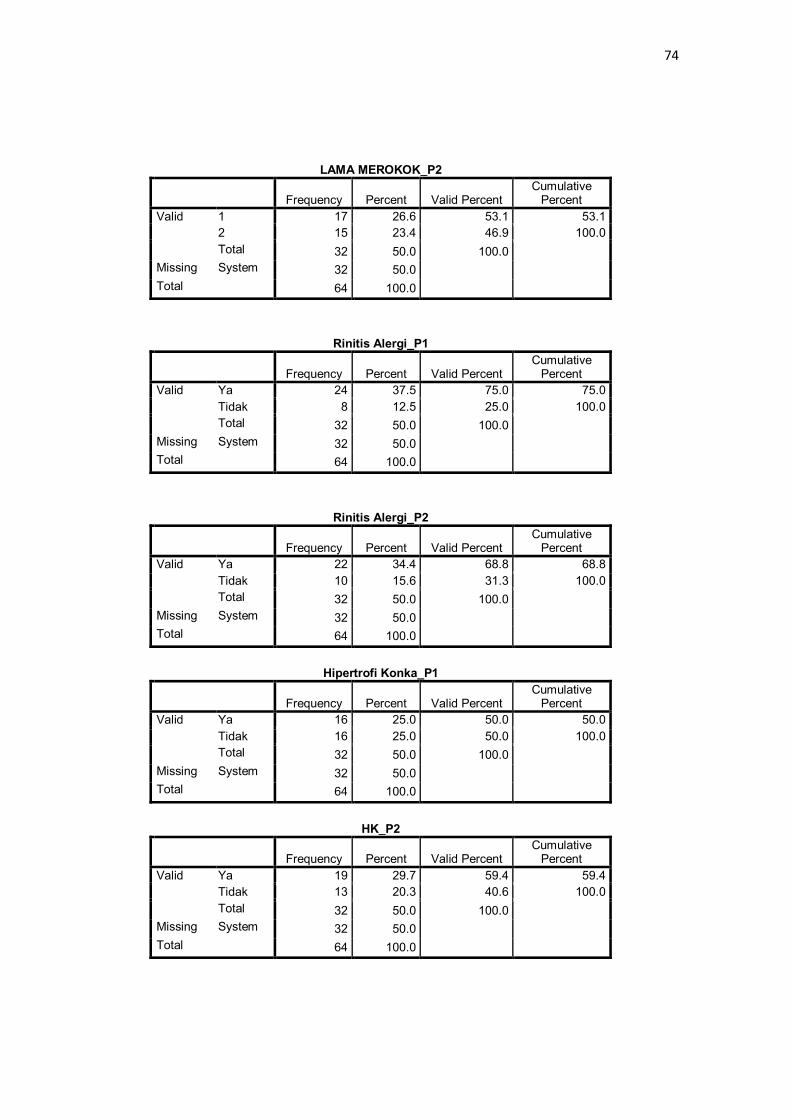
LAMA MEROKOK_P2
Frequency Percent Valid Percent Cumulative
Percent
Valid 1 17 26.6 53.1 53.1
2 15 23.4 46.9 100.0
Total 32 50.0 100.0 Missing System 32 50.0 Total 64 100.0
Rinitis Alergi_P1
Frequency Percent Valid Percent Cumulative
Percent
Valid Ya 24 37.5 75.0 75.0
Tidak 8 12.5 25.0 100.0
Total 32 50.0 100.0 Missing System 32 50.0 Total 64 100.0
Rinitis Alergi_P2
Frequency Percent Valid Percent Cumulative
Percent
Valid Ya 22 34.4 68.8 68.8
Tidak 10 15.6 31.3 100.0
Total 32 50.0 100.0 Missing System 32 50.0 Total 64 100.0
Hipertrofi Konka_P1
Frequency Percent Valid Percent Cumulative
Percent
Valid Ya 16 25.0 50.0 50.0
Tidak 16 25.0 50.0 100.0
Total 32 50.0 100.0 Missing System 32 50.0 Total 64 100.0
HK_P2
Frequency Percent Valid Percent Cumulative
Percent
Valid Ya 19 29.7 59.4 59.4
Tidak 13 20.3 40.6 100.0
Total 32 50.0 100.0 Missing System 32 50.0 Total 64 100.0
75
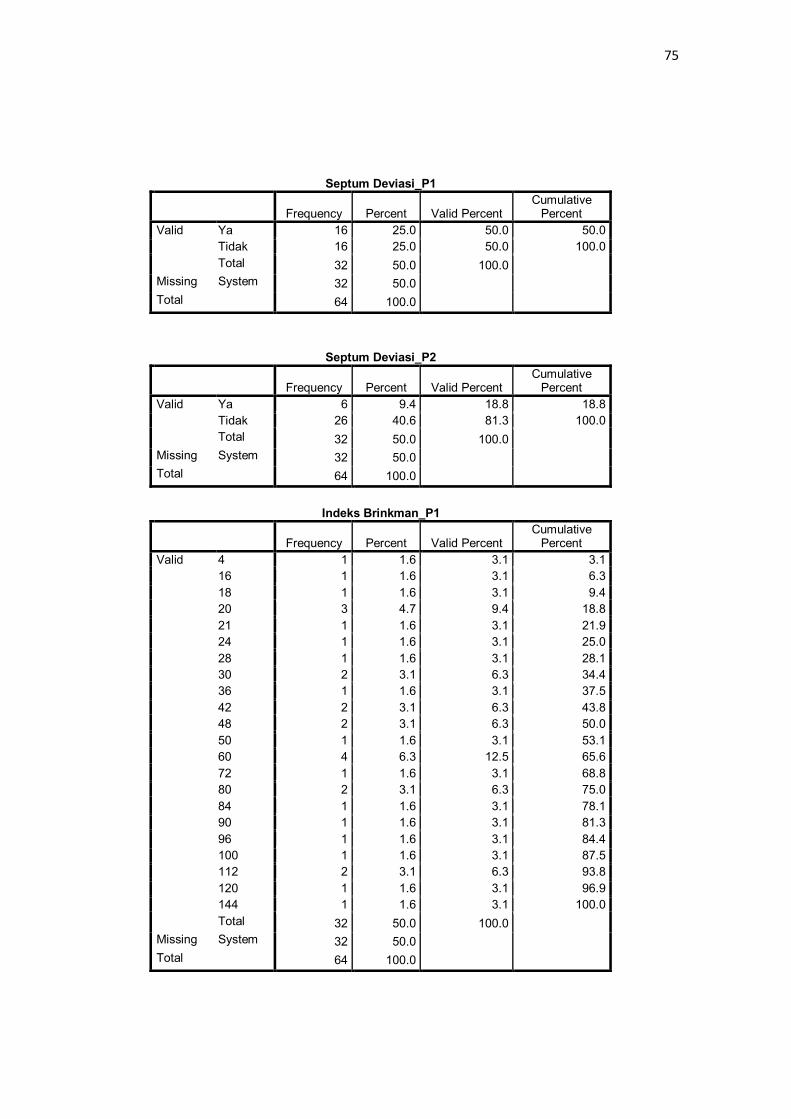
Septum Deviasi_P1
Frequency Percent Valid Percent Cumulative
Percent
Valid Ya 16 25.0 50.0 50.0
Tidak 16 25.0 50.0 100.0
Total 32 50.0 100.0 Missing System 32 50.0 Total 64 100.0
Septum Deviasi_P2
Frequency Percent Valid Percent Cumulative
Percent
Valid Ya 6 9.4 18.8 18.8
Tidak 26 40.6 81.3 100.0
Total 32 50.0 100.0 Missing System 32 50.0 Total 64 100.0
Indeks Brinkman_P1
Frequency Percent Valid Percent Cumulative
Percent
Valid 4 1 1.6 3.1 3.1
16 1 1.6 3.1 6.3
18 1 1.6 3.1 9.4
20 3 4.7 9.4 18.8
21 1 1.6 3.1 21.9
24 1 1.6 3.1 25.0
28 1 1.6 3.1 28.1
30 2 3.1 6.3 34.4
36 1 1.6 3.1 37.5
42 2 3.1 6.3 43.8
48 2 3.1 6.3 50.0
50 1 1.6 3.1 53.1
60 4 6.3 12.5 65.6
72 1 1.6 3.1 68.8
80 2 3.1 6.3 75.0
84 1 1.6 3.1 78.1
90 1 1.6 3.1 81.3
96 1 1.6 3.1 84.4
100 1 1.6 3.1 87.5
112 2 3.1 6.3 93.8
120 1 1.6 3.1 96.9
144 1 1.6 3.1 100.0
Total 32 50.0 100.0 Missing System 32 50.0 Total 64 100.0
76
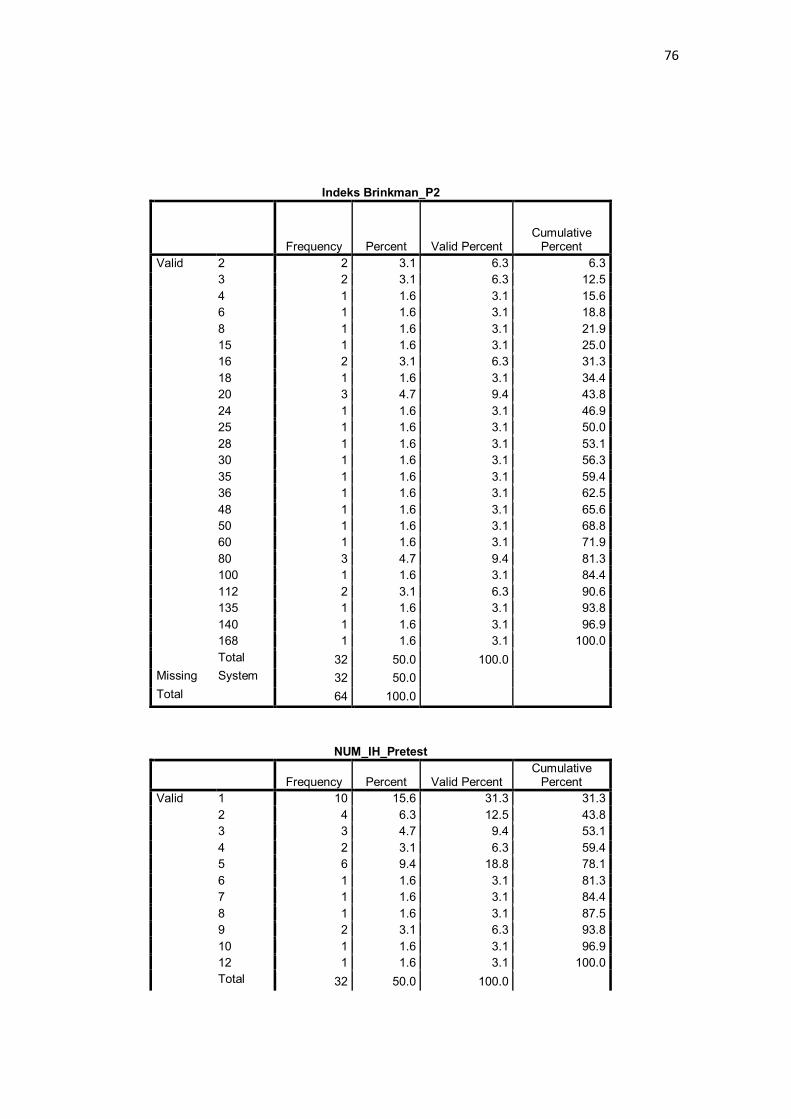
Indeks Brinkman_P2
Frequency Percent Valid Percent Cumulative
Percent
Valid 2 2 3.1 6.3 6.3
3 2 3.1 6.3 12.5
4 1 1.6 3.1 15.6
6 1 1.6 3.1 18.8
8 1 1.6 3.1 21.9
15 1 1.6 3.1 25.0
16 2 3.1 6.3 31.3
18 1 1.6 3.1 34.4
20 3 4.7 9.4 43.8
24 1 1.6 3.1 46.9
25 1 1.6 3.1 50.0
28 1 1.6 3.1 53.1
30 1 1.6 3.1 56.3
35 1 1.6 3.1 59.4
36 1 1.6 3.1 62.5
48 1 1.6 3.1 65.6
50 1 1.6 3.1 68.8
60 1 1.6 3.1 71.9
80 3 4.7 9.4 81.3
100 1 1.6 3.1 84.4
112 2 3.1 6.3 90.6
135 1 1.6 3.1 93.8
140 1 1.6 3.1 96.9
168 1 1.6 3.1 100.0
Total 32 50.0 100.0 Missing System 32 50.0 Total 64 100.0
NUM_IH_Pretest
Frequency Percent Valid Percent Cumulative
Percent
Valid 1 10 15.6 31.3 31.3
2 4 6.3 12.5 43.8
3 3 4.7 9.4 53.1
4 2 3.1 6.3 59.4
5 6 9.4 18.8 78.1
6 1 1.6 3.1 81.3
7 1 1.6 3.1 84.4
8 1 1.6 3.1 87.5
9 2 3.1 6.3 93.8
10 1 1.6 3.1 96.9
12 1 1.6 3.1 100.0
Total 32 50.0 100.0
77
Missing System 32 50.0 Total 64 100.0
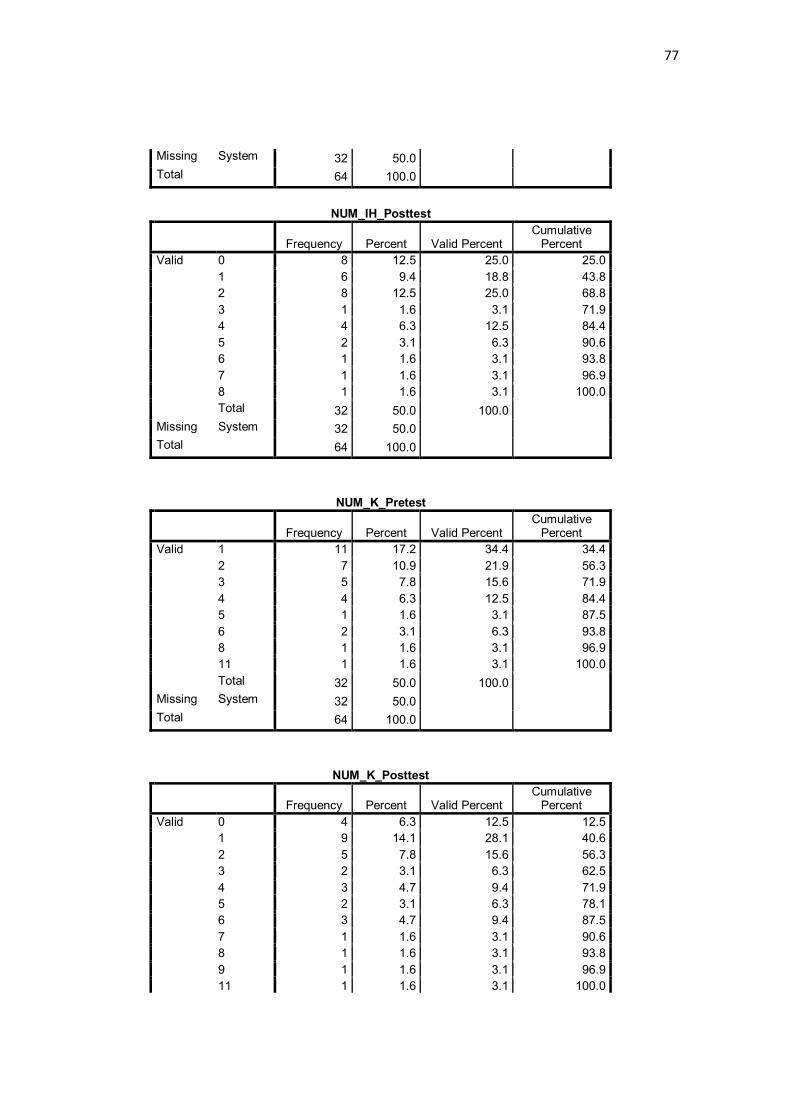
NUM_IH_Posttest
Frequency Percent Valid Percent Cumulative
Percent
Valid 0 8 12.5 25.0 25.0
1 6 9.4 18.8 43.8
2 8 12.5 25.0 68.8
3 1 1.6 3.1 71.9
4 4 6.3 12.5 84.4
5 2 3.1 6.3 90.6
6 1 1.6 3.1 93.8
7 1 1.6 3.1 96.9
8 1 1.6 3.1 100.0
Total 32 50.0 100.0 Missing System 32 50.0 Total 64 100.0
NUM_K_Pretest
Frequency Percent Valid Percent Cumulative
Percent
Valid 1 11 17.2 34.4 34.4
2 7 10.9 21.9 56.3
3 5 7.8 15.6 71.9
4 4 6.3 12.5 84.4
5 1 1.6 3.1 87.5
6 2 3.1 6.3 93.8
8 1 1.6 3.1 96.9
11 1 1.6 3.1 100.0
Total 32 50.0 100.0 Missing System 32 50.0 Total 64 100.0
NUM_K_Posttest
Frequency Percent Valid Percent Cumulative
Percent
Valid 0 4 6.3 12.5 12.5
1 9 14.1 28.1 40.6
2 5 7.8 15.6 56.3
3 2 3.1 6.3 62.5
4 3 4.7 9.4 71.9
5 2 3.1 6.3 78.1
6 3 4.7 9.4 87.5
7 1 1.6 3.1 90.6
8 1 1.6 3.1 93.8
9 1 1.6 3.1 96.9
11 1 1.6 3.1 100.0
78
Total 32 50.0 100.0 Missing System 32 50.0 Total 64 100.0
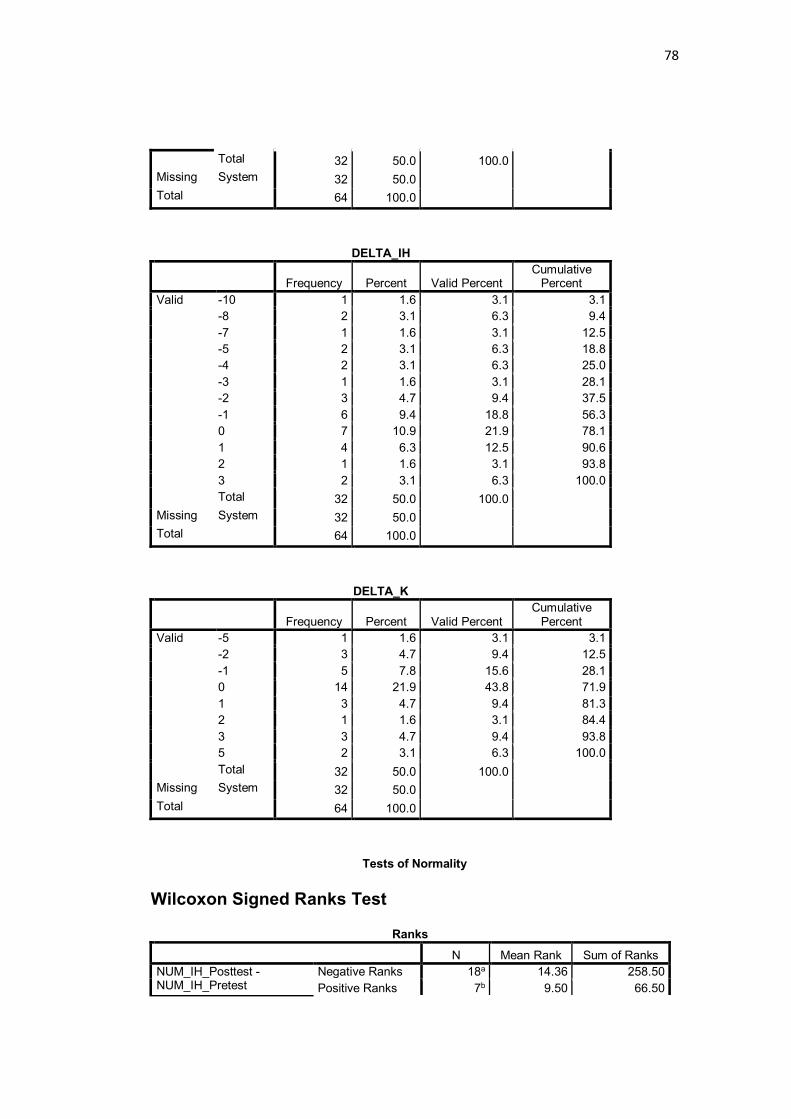
DELTA_IH
Frequency Percent Valid Percent Cumulative
Percent
Valid -10 1 1.6 3.1 3.1
-8 2 3.1 6.3 9.4
-7 1 1.6 3.1 12.5
-5 2 3.1 6.3 18.8
-4 2 3.1 6.3 25.0
-3 1 1.6 3.1 28.1
-2 3 4.7 9.4 37.5
-1 6 9.4 18.8 56.3
0 7 10.9 21.9 78.1
1 4 6.3 12.5 90.6
2 1 1.6 3.1 93.8
3 2 3.1 6.3 100.0
Total 32 50.0 100.0 Missing System 32 50.0 Total 64 100.0
DELTA_K
Frequency Percent Valid Percent Cumulative
Percent
Valid -5 1 1.6 3.1 3.1
-2 3 4.7 9.4 12.5
-1 5 7.8 15.6 28.1
0 14 21.9 43.8 71.9
1 3 4.7 9.4 81.3
2 1 1.6 3.1 84.4
3 3 4.7 9.4 93.8
5 2 3.1 6.3 100.0
Total 32 50.0 100.0 Missing System 32 50.0 Total 64 100.0
Tests of Normality
Wilcoxon Signed Ranks Test
Ranks
N Mean Rank Sum of Ranks
NUM_IH_Posttest - NUM_IH_Pretest
Negative Ranks 18a 14.36 258.50
Positive Ranks 7b 9.50 66.50
79
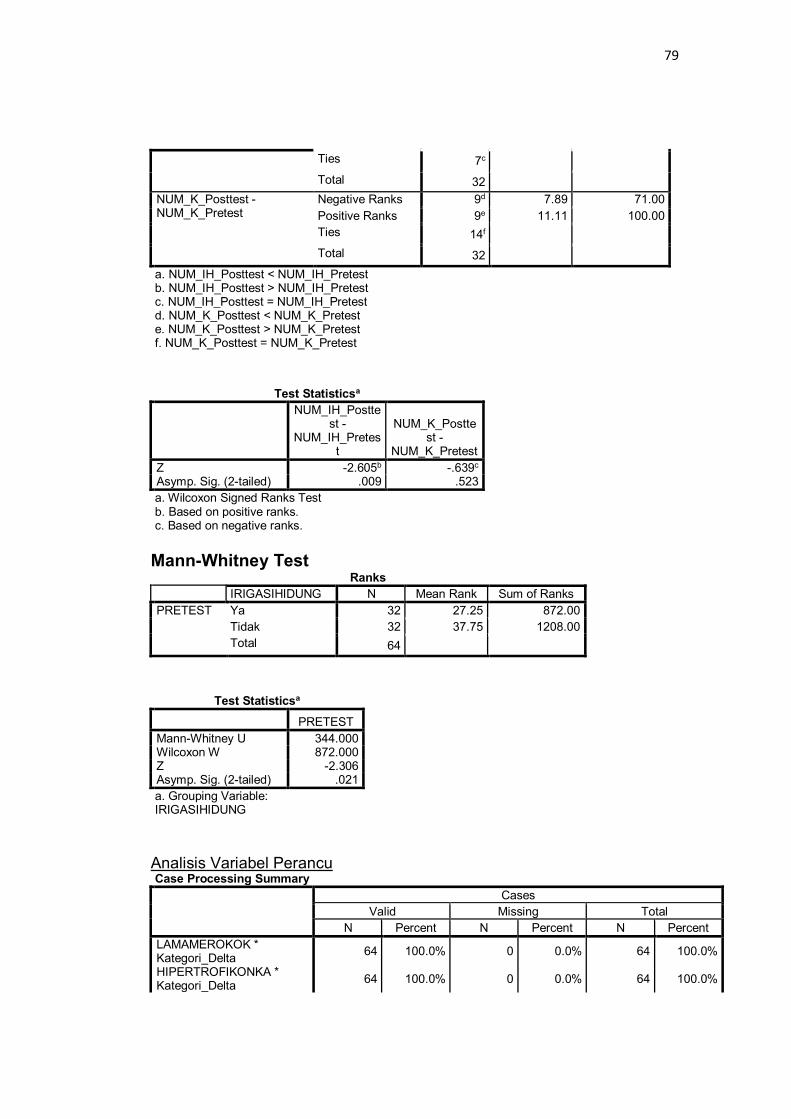
Ties 7c Total 32
NUM_K_Posttest - NUM_K_Pretest
Negative Ranks 9d 7.89 71.00
Positive Ranks 9e 11.11 100.00
Ties 14f Total 32
a. NUM_IH_Posttest < NUM_IH_Pretest b. NUM_IH_Posttest > NUM_IH_Pretest c. NUM_IH_Posttest = NUM_IH_Pretest d. NUM_K_Posttest < NUM_K_Pretest e. NUM_K_Posttest > NUM_K_Pretest f. NUM_K_Posttest = NUM_K_Pretest
Test Statisticsa
NUM_IH_Posttest -
NUM_IH_Pretest
NUM_K_Posttest -
NUM_K_Pretest
Z -2.605b -.639c Asymp. Sig. (2-tailed) .009 .523
a. Wilcoxon Signed Ranks Test b. Based on positive ranks. c. Based on negative ranks.
Mann-Whitney Test Ranks
IRIGASIHIDUNG N Mean Rank Sum of Ranks
PRETEST Ya 32 27.25 872.00
Tidak 32 37.75 1208.00
Total 64
Test Statisticsa
PRETEST
Mann-Whitney U 344.000 Wilcoxon W 872.000 Z -2.306 Asymp. Sig. (2-tailed) .021
a. Grouping Variable: IRIGASIHIDUNG
Analisis Variabel Perancu
Case Processing Summary
Cases
Valid Missing Total
N Percent N Percent N Percent
LAMAMEROKOK * Kategori_Delta
64 100.0% 0 0.0% 64 100.0%
HIPERTROFIKONKA * Kategori_Delta
64 100.0% 0 0.0% 64 100.0%
80
SD * Kategori_Delta 64 100.0% 0 0.0% 64 100.0% RA * Kategori_Delta 64 100.0% 0 0.0% 64 100.0% IRIGASIHIDUNG * Kategori_Delta
64 100.0% 0 0.0% 64 100.0%
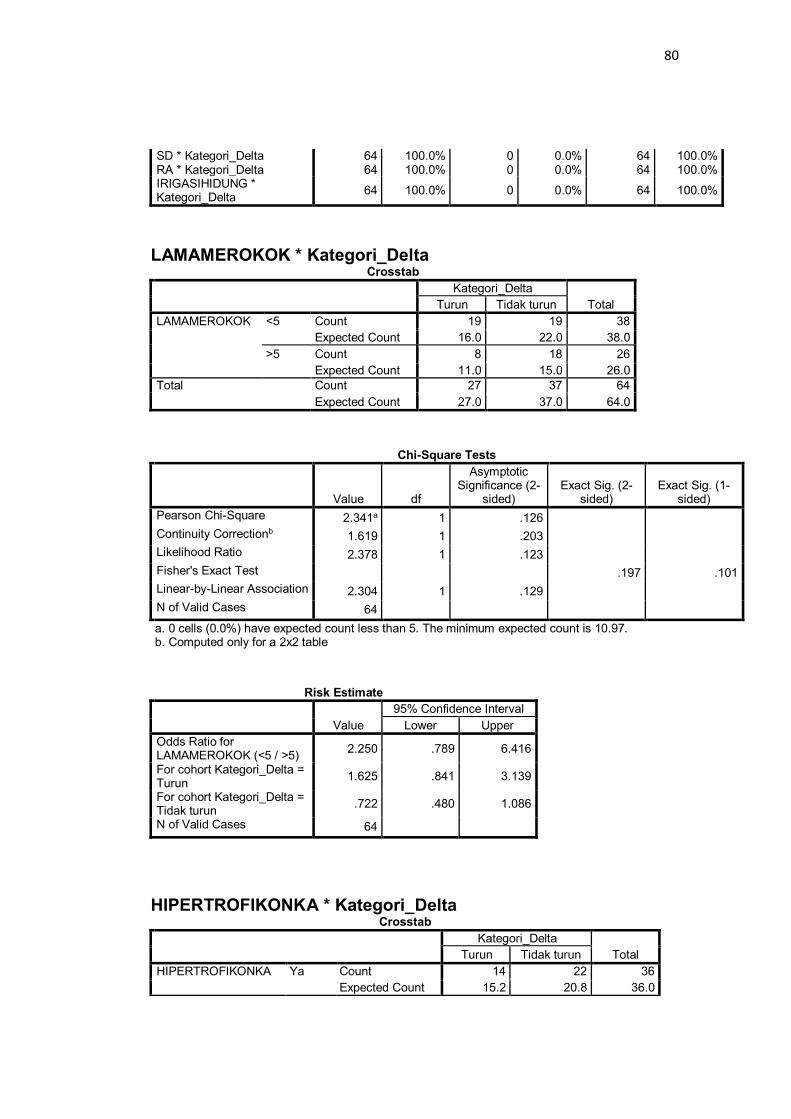
LAMAMEROKOK * Kategori_Delta
Crosstab
Kategori_Delta
Total Turun Tidak turun
LAMAMEROKOK <5 Count 19 19 38
Expected Count 16.0 22.0 38.0
>5 Count 8 18 26
Expected Count 11.0 15.0 26.0
Total Count 27 37 64
Expected Count 27.0 37.0 64.0
Chi-Square Tests
Value df
Asymptotic Significance (2-
sided) Exact Sig. (2-
sided) Exact Sig. (1-
sided)
Pearson Chi-Square 2.341a 1 .126 Continuity Correctionb 1.619 1 .203 Likelihood Ratio 2.378 1 .123 Fisher's Exact Test .197 .101
Linear-by-Linear Association 2.304 1 .129 N of Valid Cases 64 a. 0 cells (0.0%) have expected count less than 5. The minimum expected count is 10.97. b. Computed only for a 2x2 table
Risk Estimate
Value
95% Confidence Interval
Lower Upper
Odds Ratio for LAMAMEROKOK (<5 / >5)
2.250 .789 6.416
For cohort Kategori_Delta = Turun
1.625 .841 3.139
For cohort Kategori_Delta = Tidak turun
.722 .480 1.086
N of Valid Cases 64
HIPERTROFIKONKA * Kategori_Delta
Crosstab
Kategori_Delta
Total Turun Tidak turun
HIPERTROFIKONKA Ya Count 14 22 36
Expected Count 15.2 20.8 36.0
81
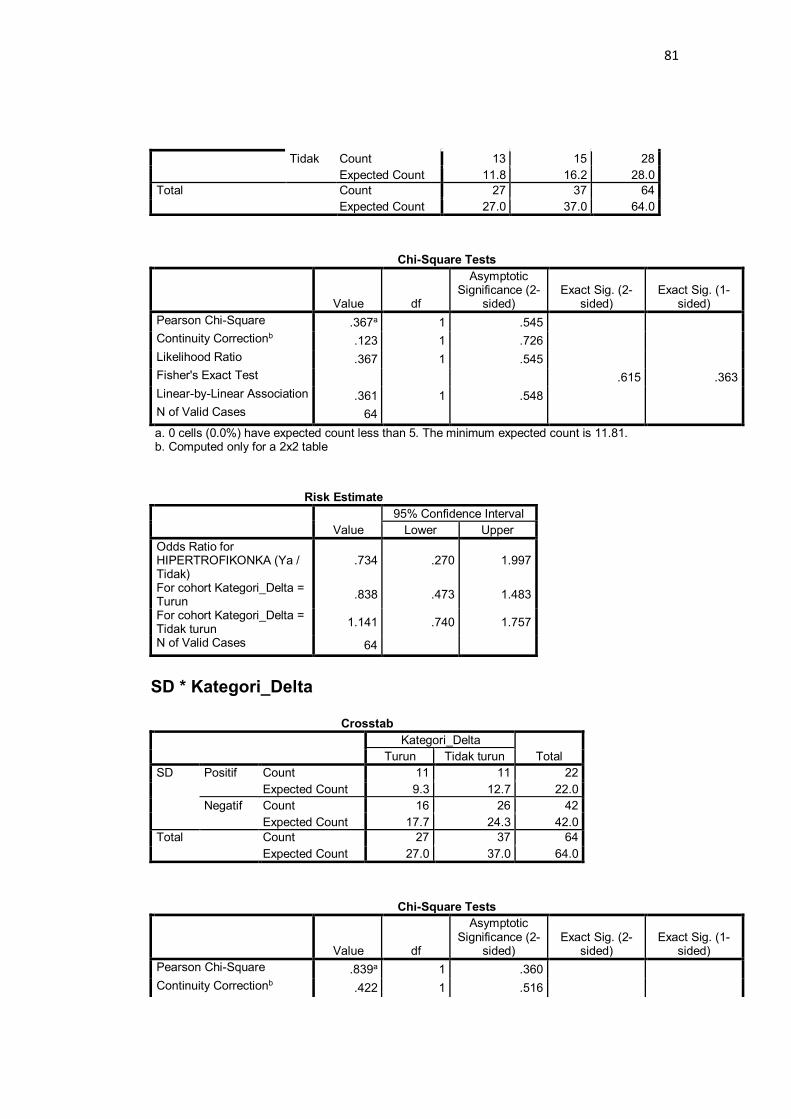
Tidak Count 13 15 28
Expected Count 11.8 16.2 28.0
Total Count 27 37 64
Expected Count 27.0 37.0 64.0
Chi-Square Tests
Value df
Asymptotic Significance (2-
sided) Exact Sig. (2-
sided) Exact Sig. (1-
sided)
Pearson Chi-Square .367a 1 .545 Continuity Correctionb .123 1 .726 Likelihood Ratio .367 1 .545 Fisher's Exact Test .615 .363
Linear-by-Linear Association .361 1 .548 N of Valid Cases 64 a. 0 cells (0.0%) have expected count less than 5. The minimum expected count is 11.81. b. Computed only for a 2x2 table
Risk Estimate
Value
95% Confidence Interval
Lower Upper
Odds Ratio for HIPERTROFIKONKA (Ya / Tidak)
.734 .270 1.997
For cohort Kategori_Delta = Turun
.838 .473 1.483
For cohort Kategori_Delta = Tidak turun
1.141 .740 1.757
N of Valid Cases 64
SD * Kategori_Delta
Crosstab
Kategori_Delta
Total Turun Tidak turun
SD Positif Count 11 11 22
Expected Count 9.3 12.7 22.0
Negatif Count 16 26 42
Expected Count 17.7 24.3 42.0
Total Count 27 37 64
Expected Count 27.0 37.0 64.0
Chi-Square Tests
Value df
Asymptotic Significance (2-
sided) Exact Sig. (2-
sided) Exact Sig. (1-
sided)
Pearson Chi-Square .839a 1 .360 Continuity Correctionb .422 1 .516
82
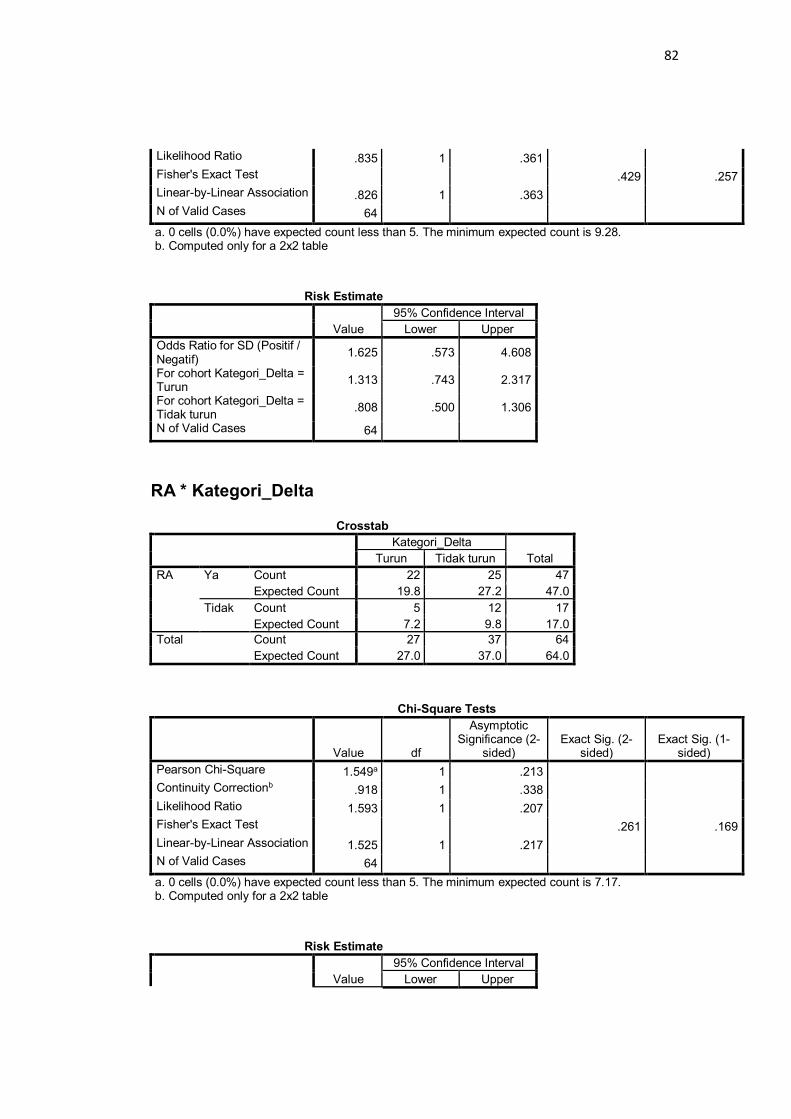
Likelihood Ratio .835 1 .361 Fisher's Exact Test .429 .257
Linear-by-Linear Association .826 1 .363 N of Valid Cases 64 a. 0 cells (0.0%) have expected count less than 5. The minimum expected count is 9.28. b. Computed only for a 2x2 table
Risk Estimate
Value
95% Confidence Interval
Lower Upper
Odds Ratio for SD (Positif / Negatif)
1.625 .573 4.608
For cohort Kategori_Delta = Turun
1.313 .743 2.317
For cohort Kategori_Delta = Tidak turun
.808 .500 1.306
N of Valid Cases 64
RA * Kategori_Delta
Crosstab
Kategori_Delta
Total Turun Tidak turun
RA Ya Count 22 25 47
Expected Count 19.8 27.2 47.0
Tidak Count 5 12 17
Expected Count 7.2 9.8 17.0
Total Count 27 37 64
Expected Count 27.0 37.0 64.0
Chi-Square Tests
Value df
Asymptotic Significance (2-
sided) Exact Sig. (2-
sided) Exact Sig. (1-
sided)
Pearson Chi-Square 1.549a 1 .213 Continuity Correctionb .918 1 .338 Likelihood Ratio 1.593 1 .207 Fisher's Exact Test .261 .169
Linear-by-Linear Association 1.525 1 .217 N of Valid Cases 64 a. 0 cells (0.0%) have expected count less than 5. The minimum expected count is 7.17. b. Computed only for a 2x2 table
Risk Estimate
Value
95% Confidence Interval
Lower Upper
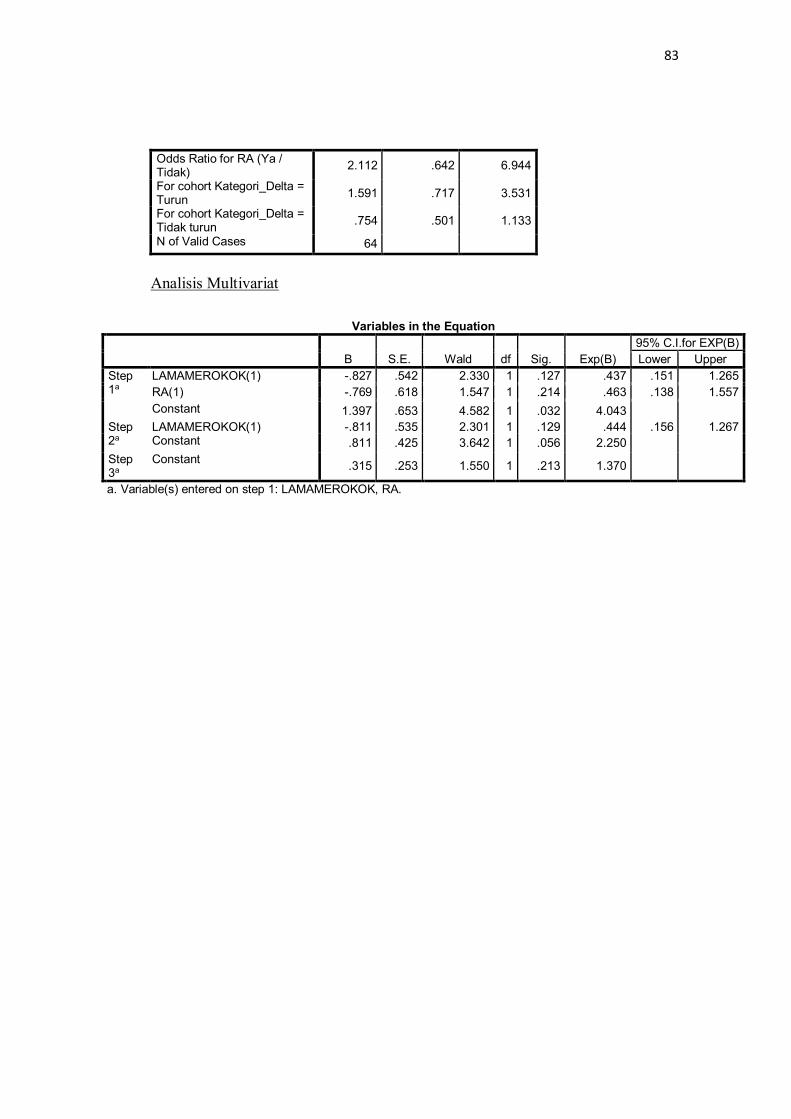
83
Odds Ratio for RA (Ya / Tidak)
2.112 .642 6.944
For cohort Kategori_Delta = Turun
1.591 .717 3.531
For cohort Kategori_Delta = Tidak turun
.754 .501 1.133
N of Valid Cases 64
Analisis Multivariat
Variables in the Equation
B S.E. Wald df Sig. Exp(B)
95% C.I.for EXP(B)
Lower Upper
Step 1a
LAMAMEROKOK(1) -.827 .542 2.330 1 .127 .437 .151 1.265
RA(1) -.769 .618 1.547 1 .214 .463 .138 1.557
Constant 1.397 .653 4.582 1 .032 4.043 Step 2a
LAMAMEROKOK(1) -.811 .535 2.301 1 .129 .444 .156 1.267 Constant .811 .425 3.642 1 .056 2.250
Step 3a
Constant .315 .253 1.550 1 .213 1.370
a. Variable(s) entered on step 1: LAMAMEROKOK, RA.
84
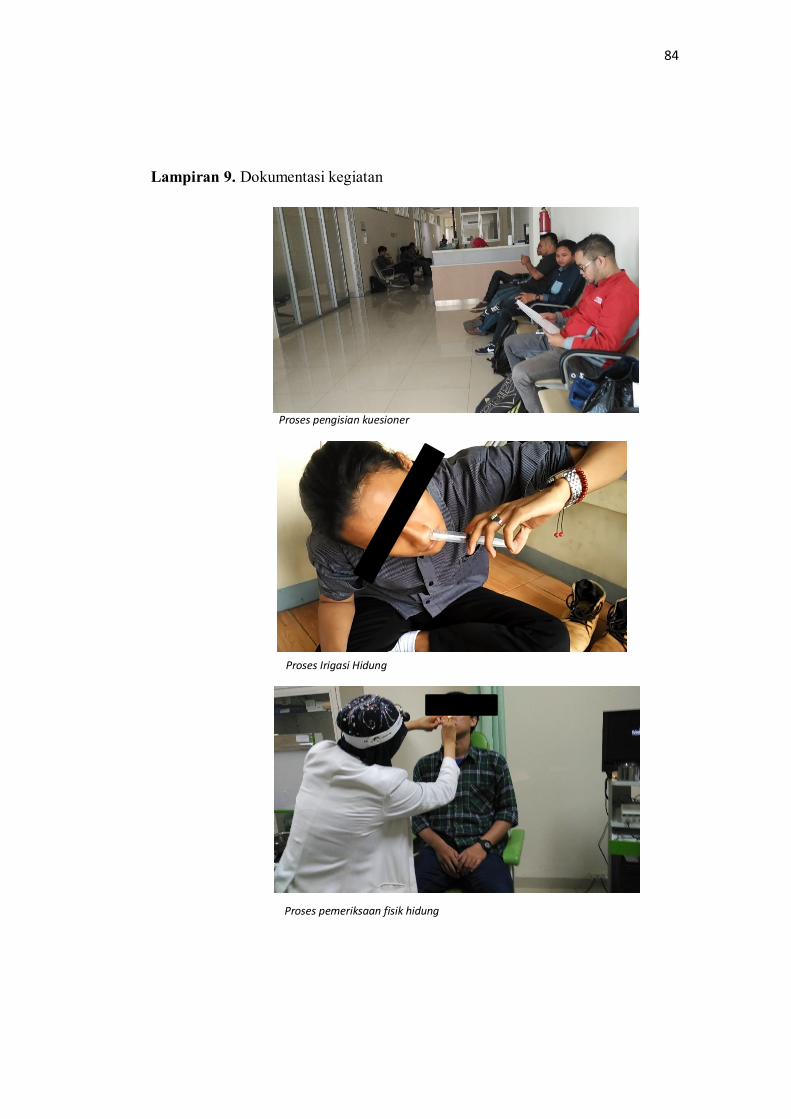
Lampiran 9. Dokumentasi kegiatan
Proses Irigasi Hidung
Proses pengisian kuesioner
Proses pemeriksaan fisik hidung
85
Lampiran 10. Biodata Mahasiswa
Nama : Syaffa Sadida Zahra
NIM : 22010112130082
Tempat/Tanggal Lahir: Tangerang/5 Desember 1995
Jenis Kelamin : Perempuan
Alamat : Jl. Cendana 1 no.4 Cimanggu Asri Bogor
No. Handphone : 085715017700
Email : [email protected]
Riwayat Pendidikan Formal
1. SD : SDIT Ummul Quro Lulus tahun: 2007
2. SMP : SMP School of Universe Lulus tahun: 2009
3. SMA : SMA Negeri 1 Bogor Lulus tahun: 2012
4. S1 : Fakultas Kedokteran Universitas Diponegoro Masuk tahun: 2012
Keanggotaan Organisasi
1. Remaja Masjid Kampus Undip 2016
2. Asyifa Medical Team 2014-2016
3. Badan Eksekutif Mahasiswa Universitas Diponegoro tahun 2015
4. Himpunan Mahasiswa Kedokteran Umum Universitas Diponegoro tahun 2013-
2014
5. Rohani Islam Pendidikan Dokter Universitas Diponegoro tahun 2013-2014
![DAFTAR PUSTAKA - etd.repository.ugm.ac.idetd.repository.ugm.ac.id/downloadfile/96937/potongan/S1-2016... · 90 DAFTAR PUSTAKA DAFTAR PUSTAKA [1] Badan Standardisasi Nasional. “SNI](https://img.pdfslide.us/doc/110x75/5ccf188d88c99385278e02a1/daftar-pustaka-etd-90-daftar-pustaka-daftar-pustaka-1-badan-standardisasi.jpg)
![Daftar Pustaka [799.8 KB]](https://img.pdfslide.us/doc/110x75/5879e7431a28abd0398c04b0/daftar-pustaka-7998-kb.jpg)