Embed Size (px)
Citation preview
Current Research at the Virginia Tech Transportation
InstituteDr. Jeffrey Hickman
Research Scientist
Canal Risk Management Seminar
March 22, 2018
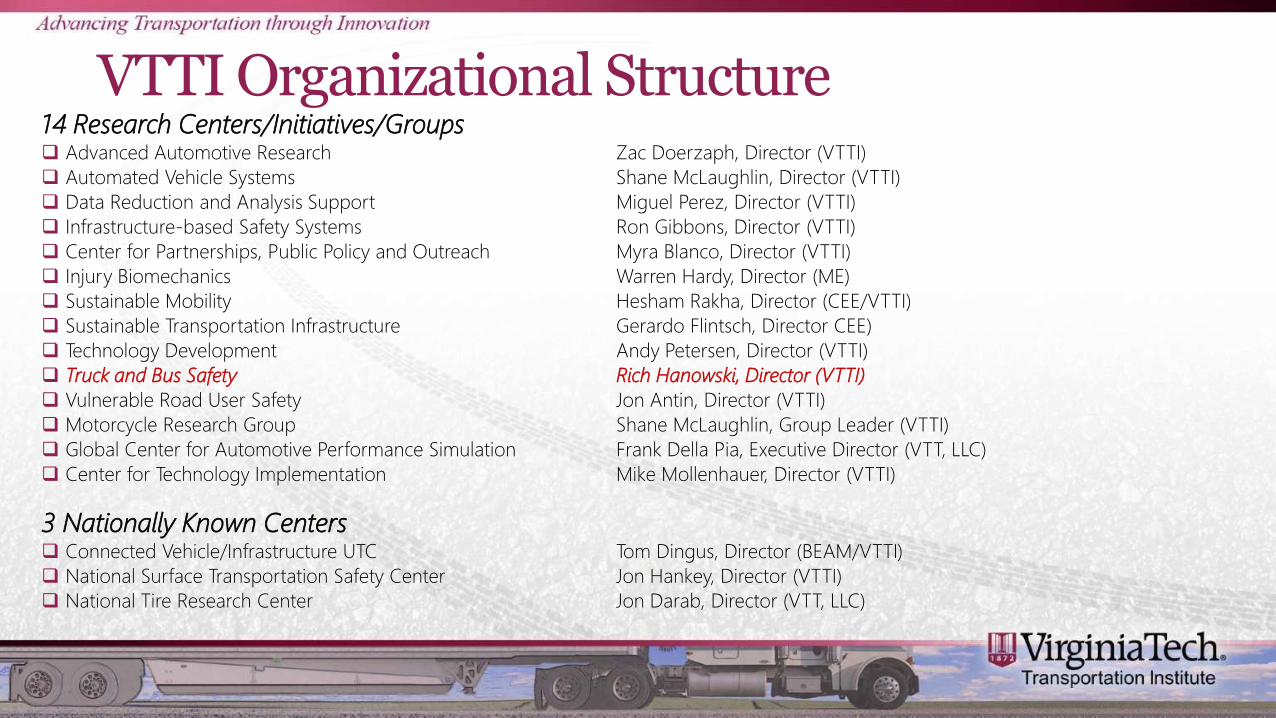
VTTI Organizational Structure14 Research Centers/Initiatives/Groups Advanced Automotive Research Zac Doerzaph, Director (VTTI)
Automated Vehicle Systems Shane McLaughlin, Director (VTTI)
Data Reduction and Analysis Support Miguel Perez, Director (VTTI)
Infrastructure-based Safety Systems Ron Gibbons, Director (VTTI)
Center for Partnerships, Public Policy and Outreach Myra Blanco, Director (VTTI)
Injury Biomechanics Warren Hardy, Director (ME)
Sustainable Mobility Hesham Rakha, Director (CEE/VTTI)
Sustainable Transportation Infrastructure Gerardo Flintsch, Director CEE)
Technology Development Andy Petersen, Director (VTTI)
Truck and Bus Safety Rich Hanowski, Director (VTTI)
Vulnerable Road User Safety Jon Antin, Director (VTTI)
Motorcycle Research Group Shane McLaughlin, Group Leader (VTTI)
Global Center for Automotive Performance Simulation Frank Della Pia, Executive Director (VTT, LLC)
Center for Technology Implementation Mike Mollenhauer, Director (VTTI)
3 Nationally Known Centers Connected Vehicle/Infrastructure UTC Tom Dingus, Director (BEAM/VTTI)
National Surface Transportation Safety Center Jon Hankey, Director (VTTI)
National Tire Research Center Jon Darab, Director (VTT, LLC)
3
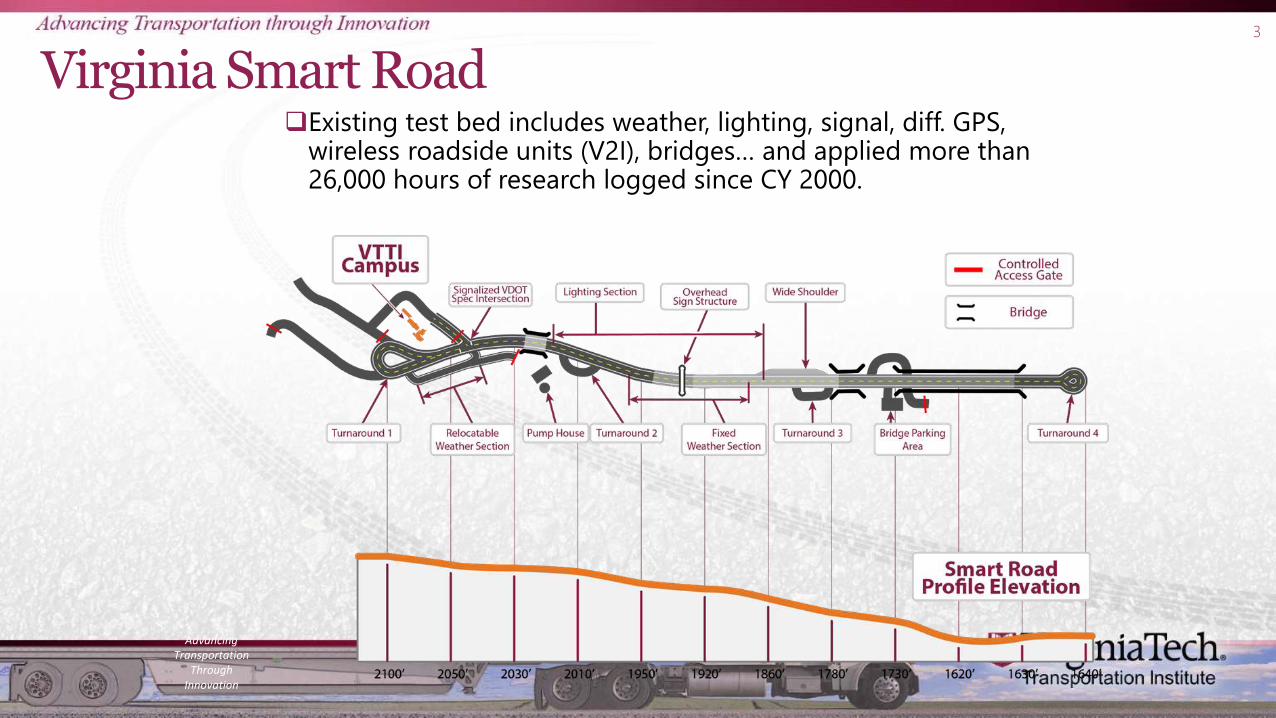
Virginia Smart RoadExisting test bed includes weather, lighting, signal, diff. GPS,
wireless roadside units (V2I), bridges… and applied more than 26,000 hours of research logged since CY 2000.
Advancing Transportation
Through Innovation
4
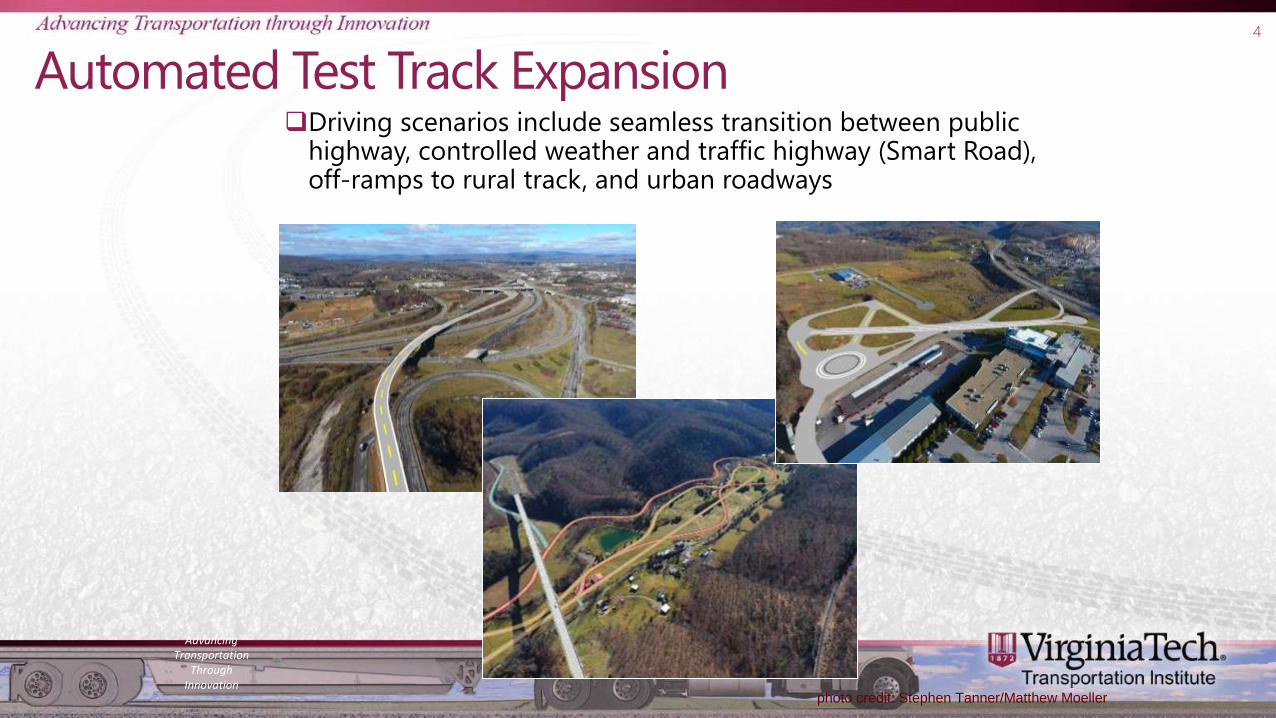
Automated Test Track ExpansionDriving scenarios include seamless transition between public
highway, controlled weather and traffic highway (Smart Road), off-ramps to rural track, and urban roadways
photo credit: Stephen Tanner/Matthew Moeller
Advancing Transportation
Through Innovation
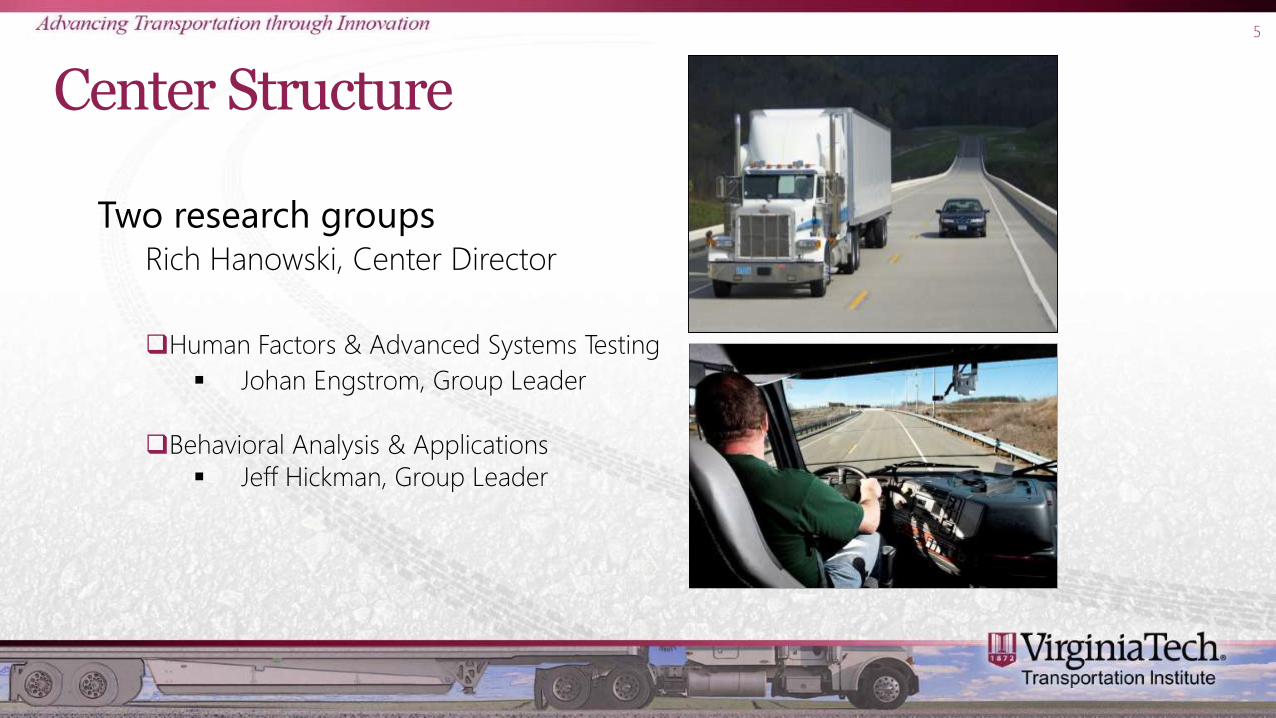
Center Structure
Two research groupsRich Hanowski, Center Director
Human Factors & Advanced Systems Testing
Johan Engstrom, Group Leader
Behavioral Analysis & Applications
Jeff Hickman, Group Leader
5
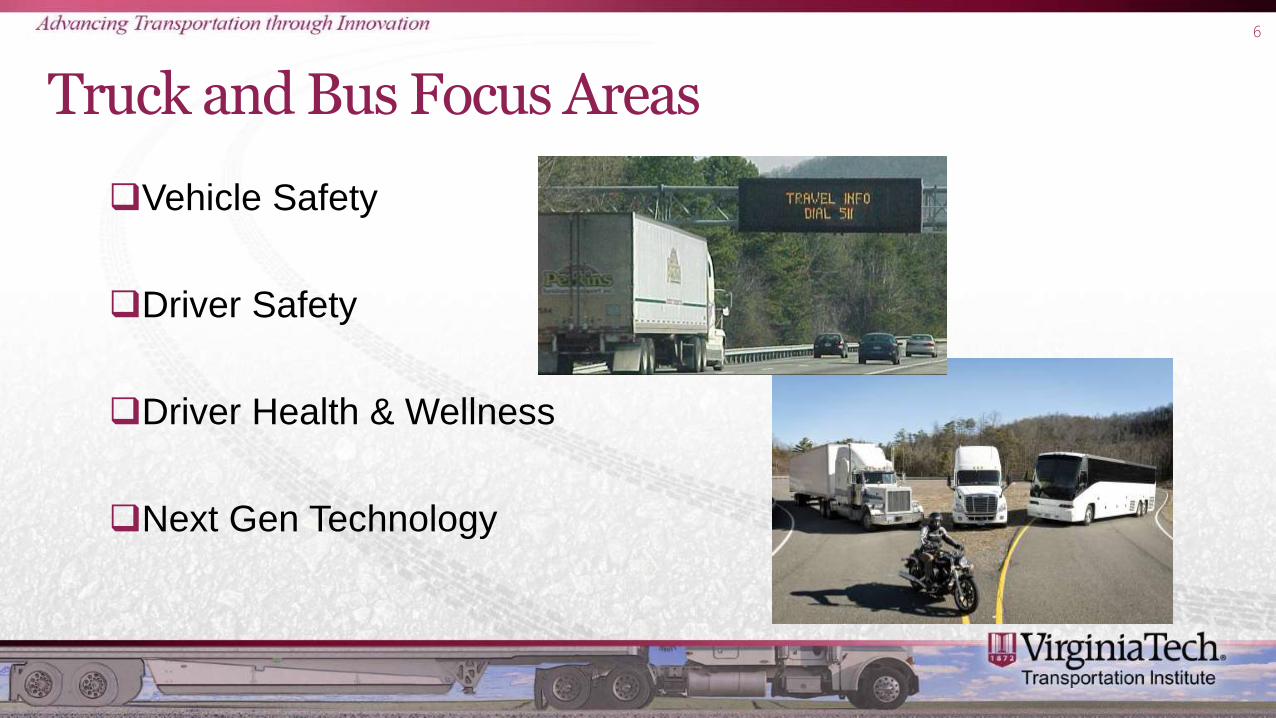
Truck and Bus Focus Areas
Vehicle Safety
Driver Safety
Driver Health & Wellness
Next Gen Technology
6

Video
7

Video
8

Video
9

Video
10

Video
11

Video
12

Video
13

Video
14

Video
15

Video
16
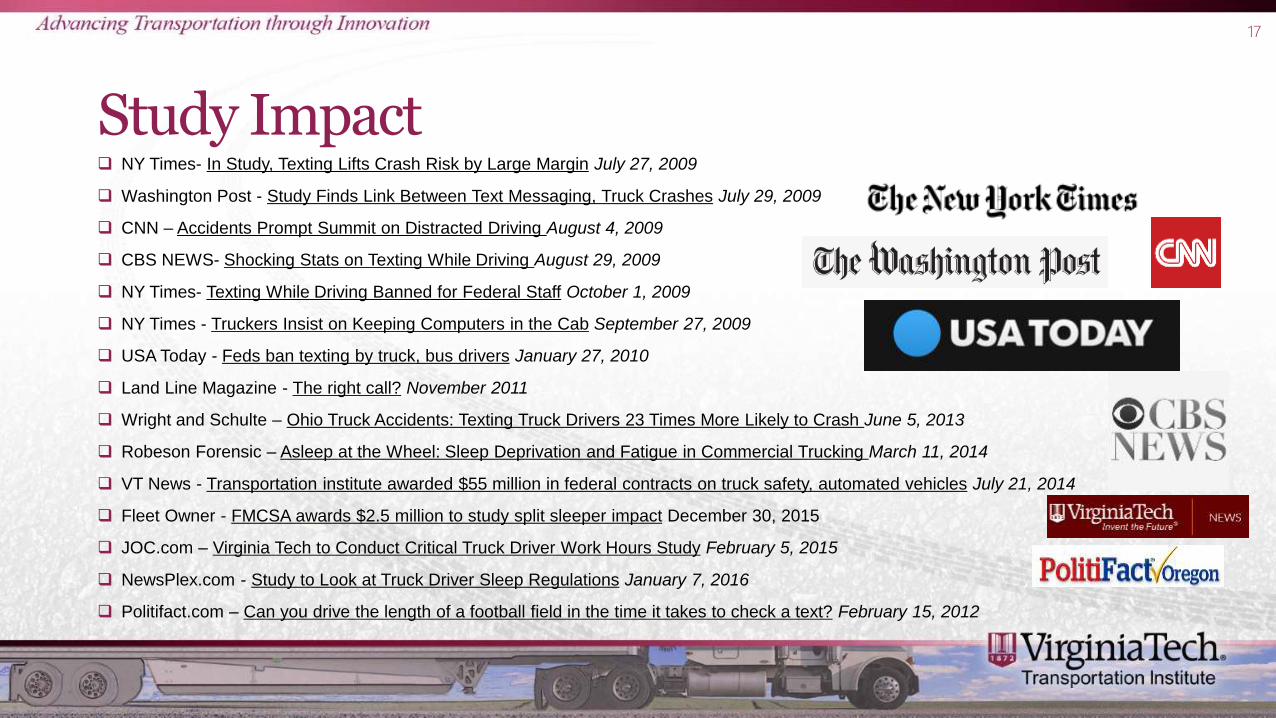
Study Impact
17
NY Times- In Study, Texting Lifts Crash Risk by Large Margin July 27, 2009
Washington Post - Study Finds Link Between Text Messaging, Truck Crashes July 29, 2009
CNN – Accidents Prompt Summit on Distracted Driving August 4, 2009
CBS NEWS- Shocking Stats on Texting While Driving August 29, 2009
NY Times- Texting While Driving Banned for Federal Staff October 1, 2009
NY Times - Truckers Insist on Keeping Computers in the Cab September 27, 2009
USA Today - Feds ban texting by truck, bus drivers January 27, 2010
Land Line Magazine - The right call? November 2011
Wright and Schulte – Ohio Truck Accidents: Texting Truck Drivers 23 Times More Likely to Crash June 5, 2013
Robeson Forensic – Asleep at the Wheel: Sleep Deprivation and Fatigue in Commercial Trucking March 11, 2014
VT News - Transportation institute awarded $55 million in federal contracts on truck safety, automated vehicles July 21, 2014
Fleet Owner - FMCSA awards $2.5 million to study split sleeper impact December 30, 2015
JOC.com – Virginia Tech to Conduct Critical Truck Driver Work Hours Study February 5, 2015
NewsPlex.com - Study to Look at Truck Driver Sleep Regulations January 7, 2016
Politifact.com – Can you drive the length of a football field in the time it takes to check a text? February 15, 2012
Overview of Driver Fatigue and Fatigue Management Program
18
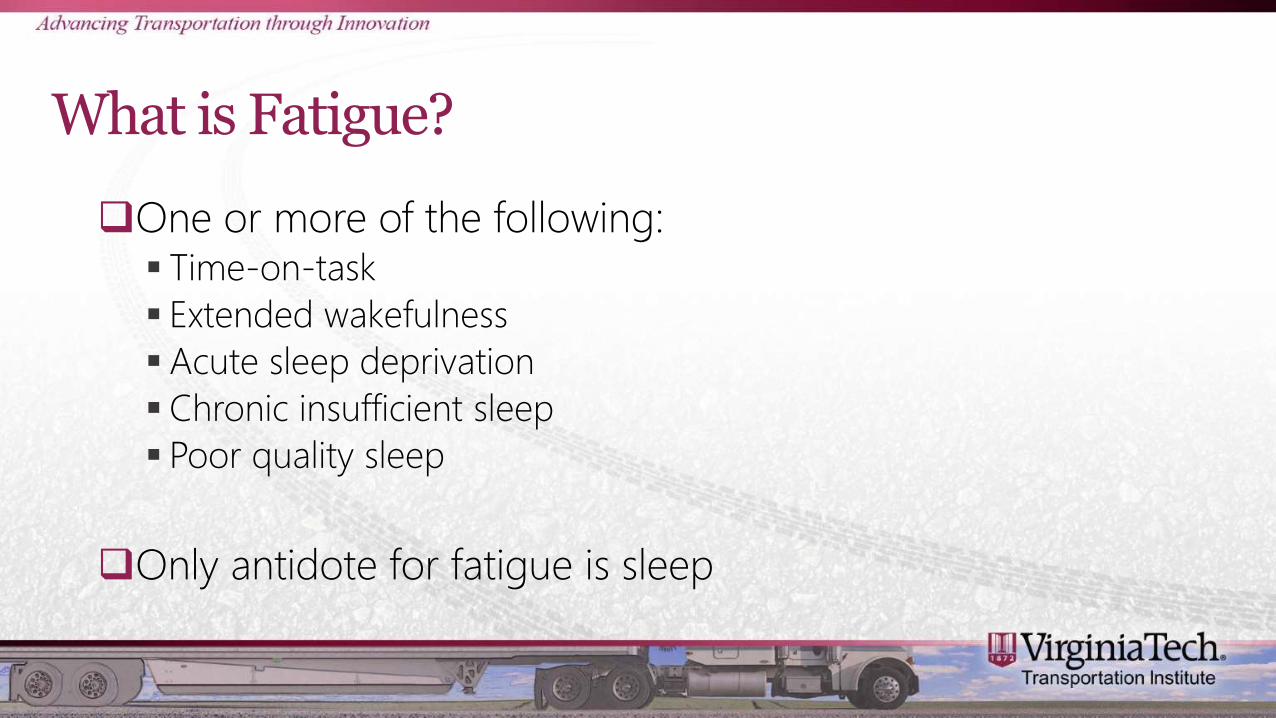
What is Fatigue?
One or more of the following: Time-on-task
Extended wakefulness
Acute sleep deprivation
Chronic insufficient sleep
Poor quality sleep
Only antidote for fatigue is sleep
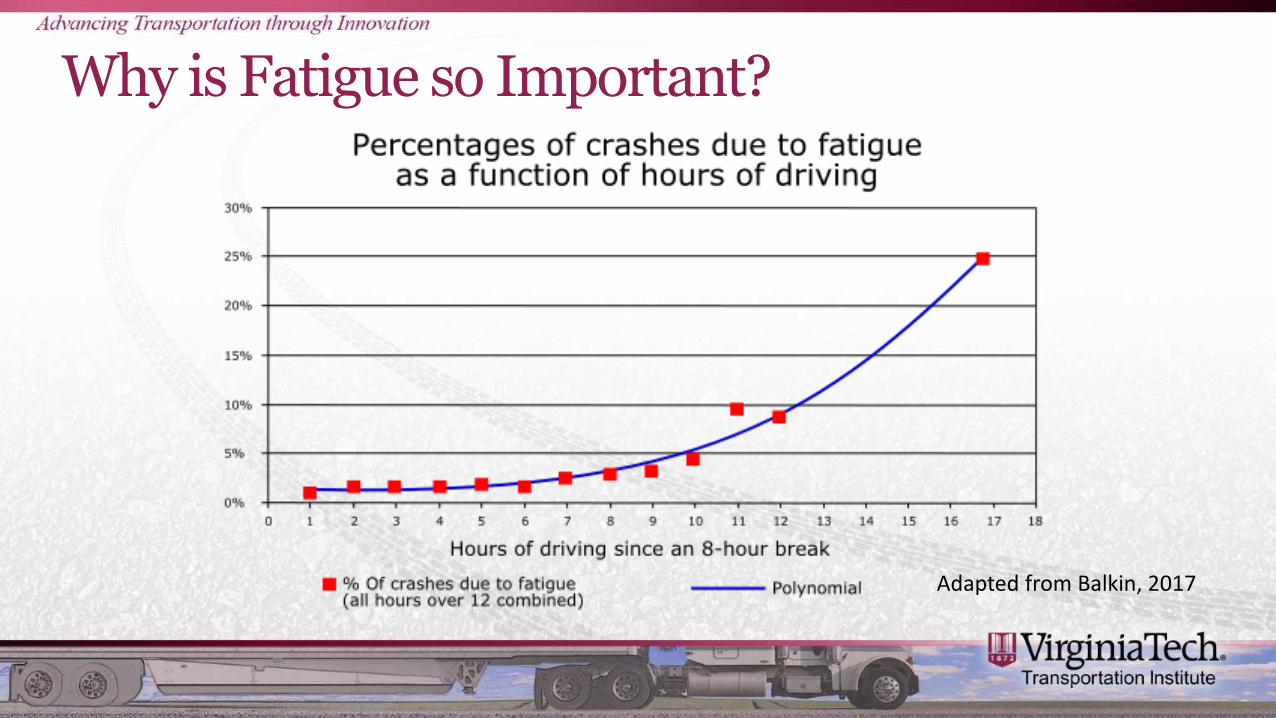
Why is Fatigue so Important?
Adapted from Balkin, 2017

Video
21

Video
22
Can you Bank Sleep?
“Sleep Banking”. The more sleep that an individual obtains prior to an operation involving sleep loss (either acute total sleep deprivation or multiple days of sleep restriction) the better the performance.
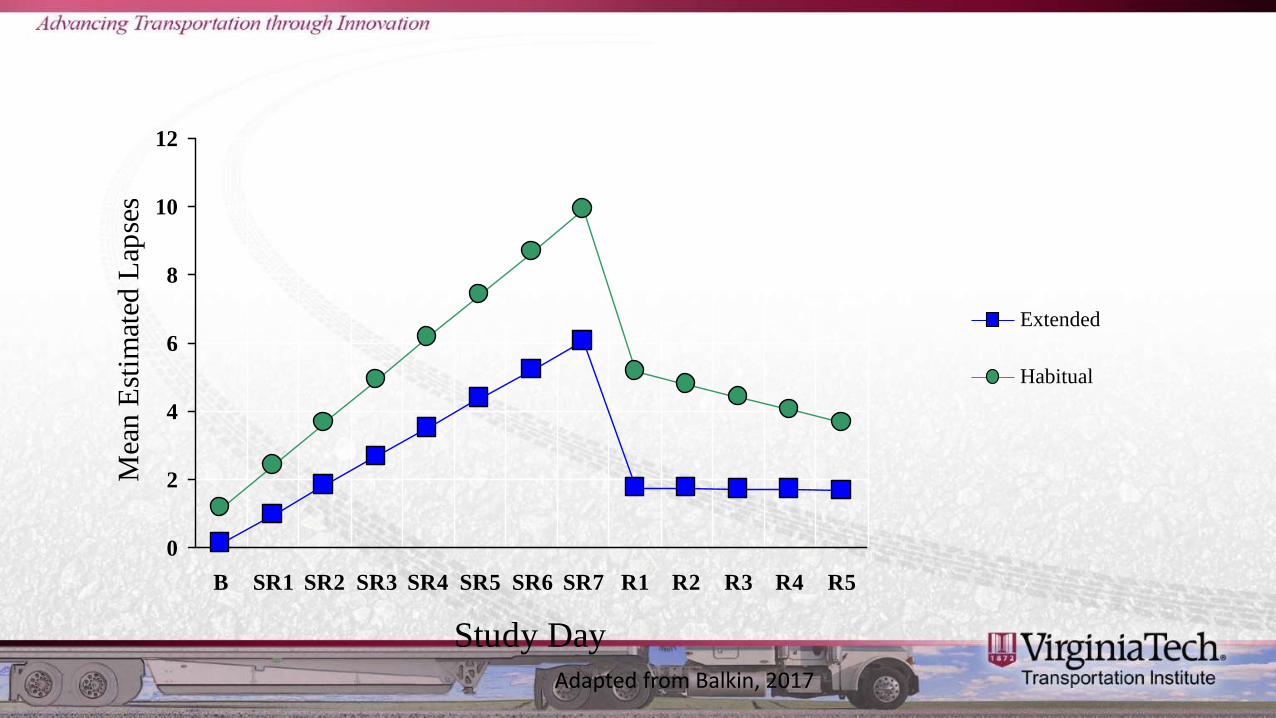
0
2
4
6
8
10
12
B SR1 SR2 SR3 SR4 SR5 SR6 SR7 R1 R2 R3 R4 R5
Study Day
Mea
n E
stim
ated
Lap
ses
Extended
Habitual
Adapted from Balkin, 2017

Sleep Reservoir
Adapted from Balkin, 2017
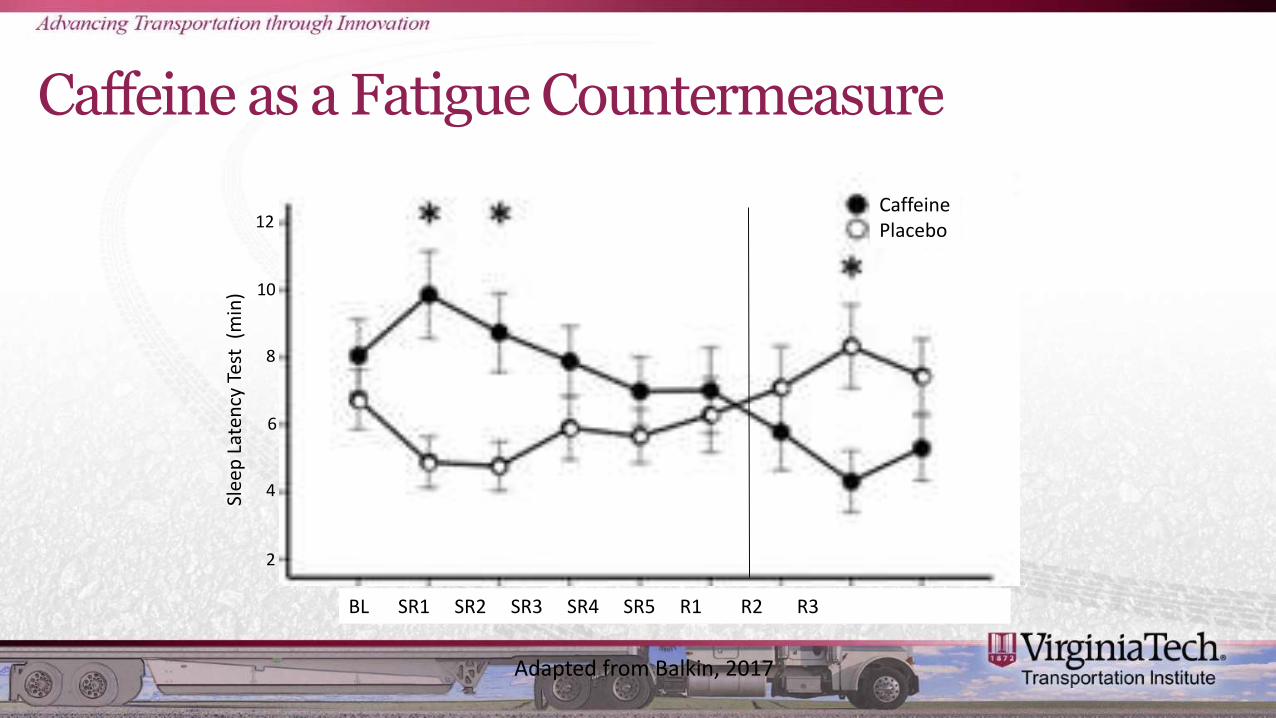
Caffeine as a Fatigue Countermeasure
Slee
p L
aten
cy T
est
(m
in)
12
8
6
4
10
2
CaffeinePlacebo
BL SR1 SR2 SR3 SR4 SR5 R1 R2 R3
Adapted from Balkin, 2017
OSA Tx and Crash Risk
Retrospective analysis of mandatory OSA screening/testing program
PSG drivers (~2,000) matched to controls (~2,000) Control
Negative PSG
Full adherence
Partial adherence
No adherence
Tx (CPAP) objectively monitored
Burks, S.V., Anderson, J.E., Bombyk, M., Haider, R., Ganzhorn, D., Jiao, X., Lewis, C., Lexvold, A., Liu, H., Ning, J., Toll, A., Hickman, J.S., Mabry, J.E., Berger, M., Malhotra, A., Czeisler, C.A., Kales, S.N. (2016). Nonadherence with employer-mandated sleep apnea treatment and increased risk of serious truck crashes. Sleep, 39(5), 1-9.
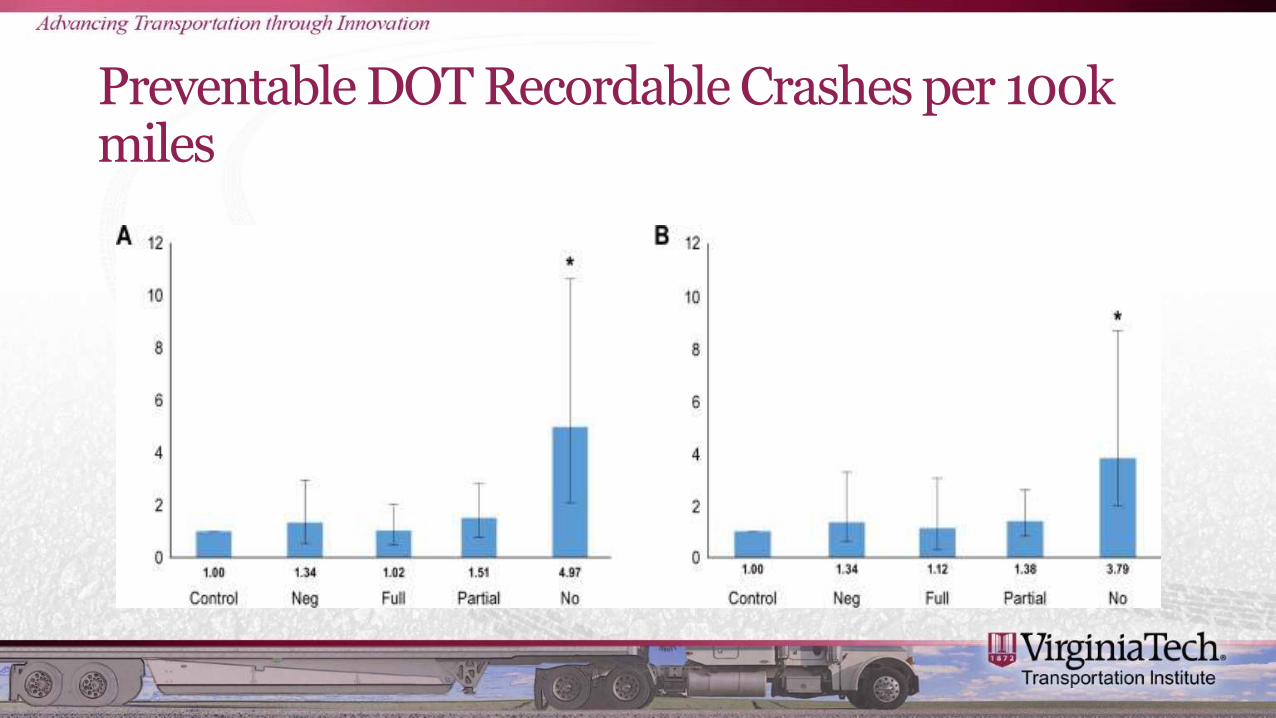
Preventable DOT Recordable Crashes per 100k miles
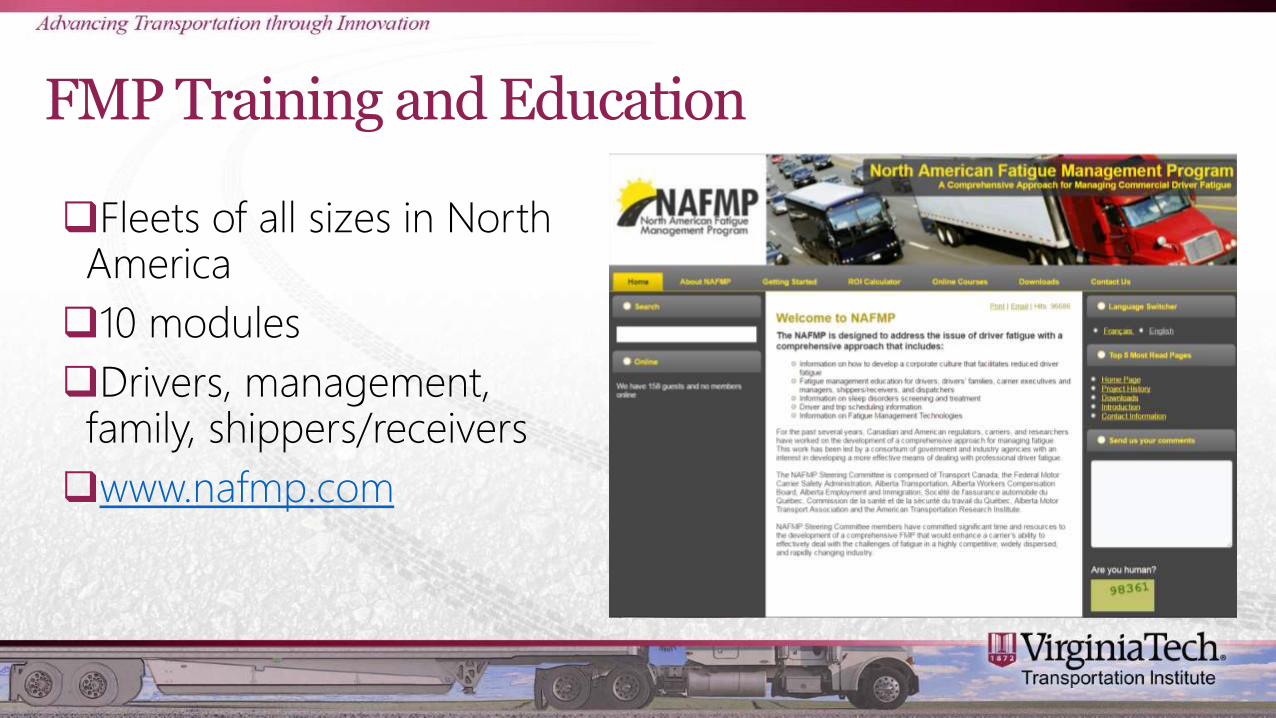
FMP Training and Education
Fleets of all sizes in North America
10 modules
Drivers, management, family, shippers/receivers
www.nafmp.com
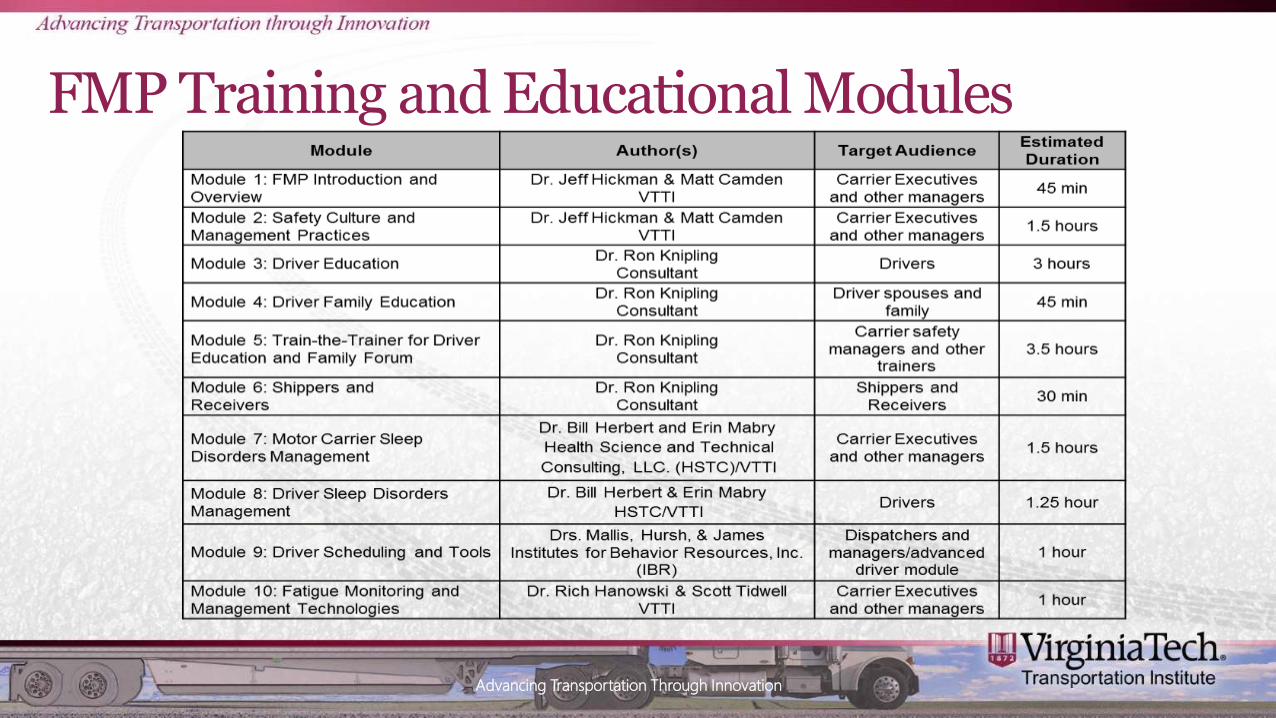
FMP Training and Educational Modules
Advancing Transportation Through Innovation
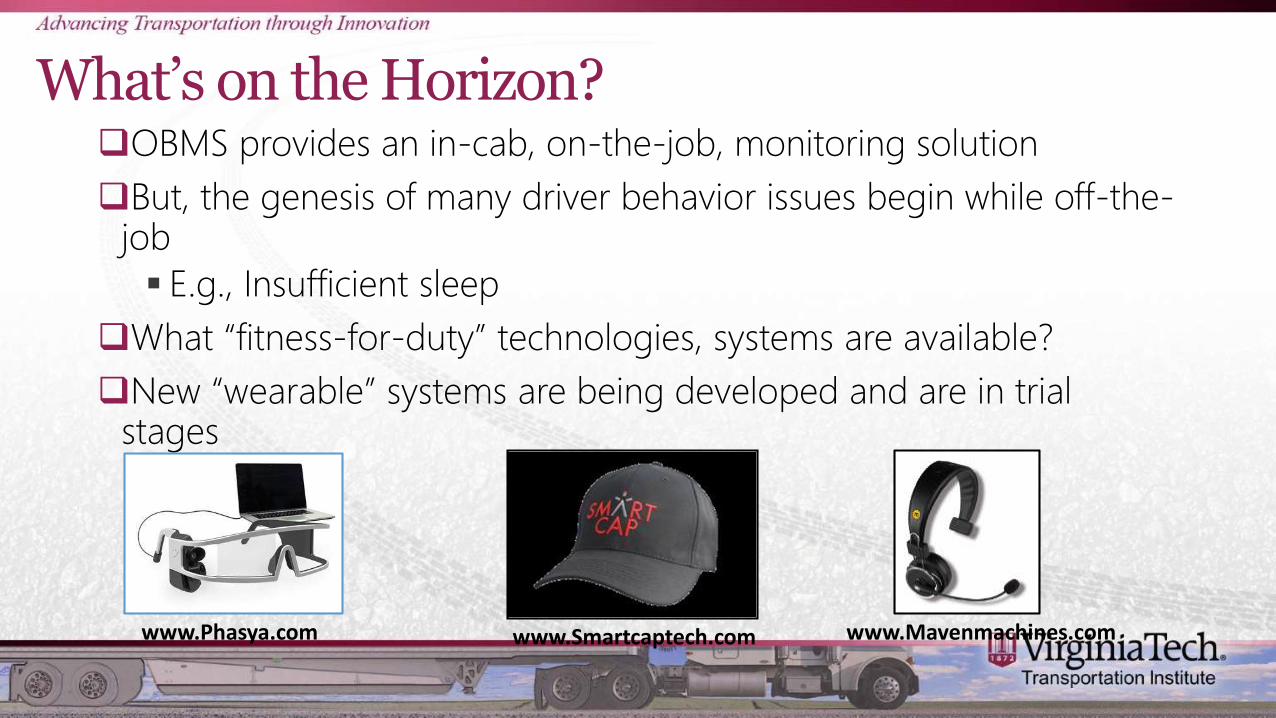
What’s on the Horizon?OBMS provides an in-cab, on-the-job, monitoring solution
But, the genesis of many driver behavior issues begin while off-the-job
E.g., Insufficient sleep
What “fitness-for-duty” technologies, systems are available?
New “wearable” systems are being developed and are in trial stages
www.Phasya.com www.Smartcaptech.com www.Mavenmachines.com
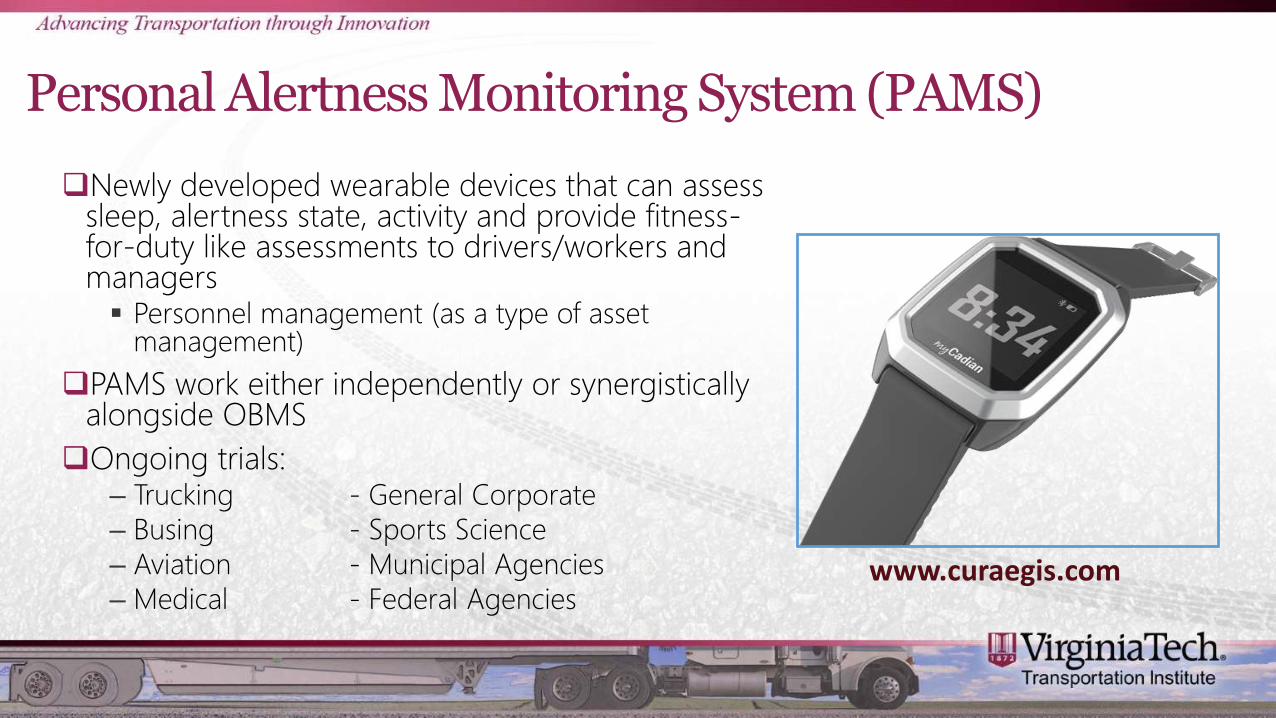
Personal Alertness Monitoring System (PAMS)
Newly developed wearable devices that can assess sleep, alertness state, activity and provide fitness-for-duty like assessments to drivers/workers and managers Personnel management (as a type of asset
management)
PAMS work either independently or synergistically alongside OBMS
Ongoing trials:‒ Trucking - General Corporate
‒ Busing - Sports Science
‒ Aviation - Municipal Agencies
‒ Medical - Federal Agencieswww.curaegis.com
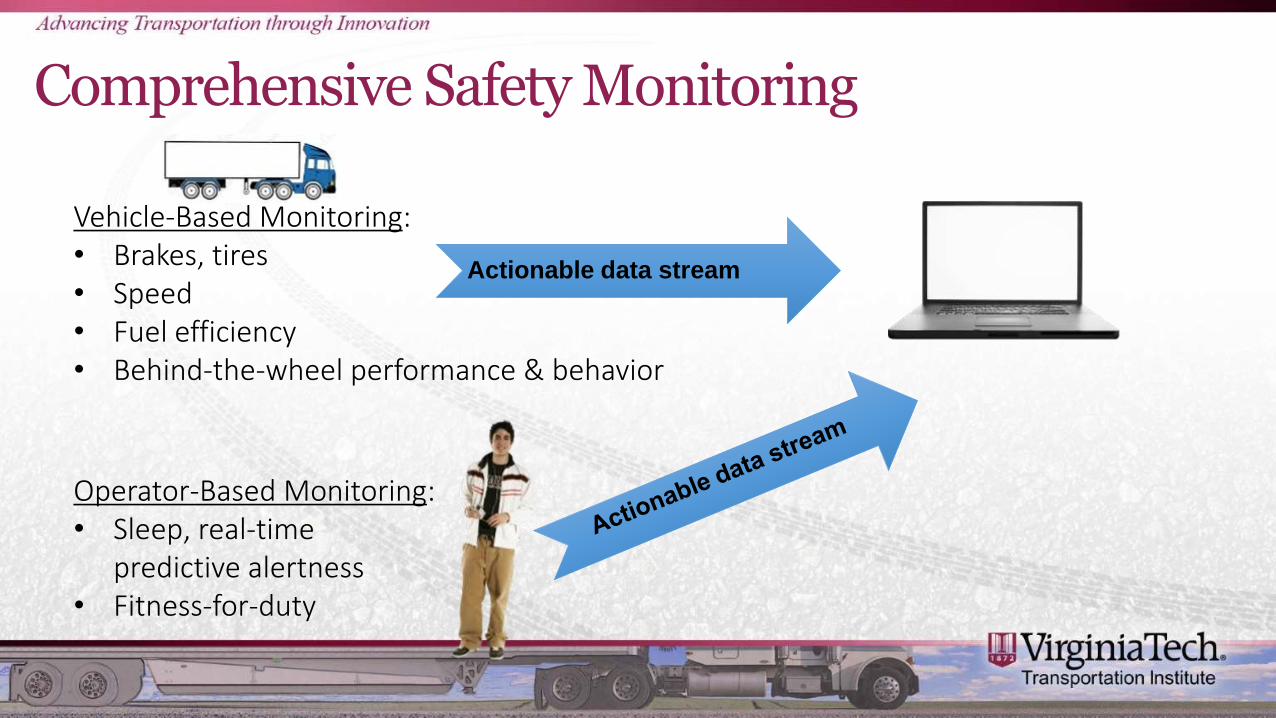
Comprehensive Safety Monitoring
Vehicle-Based Monitoring:• Brakes, tires• Speed• Fuel efficiency• Behind-the-wheel performance & behavior
Operator-Based Monitoring:• Sleep, real-time
predictive alertness• Fitness-for-duty
Actionable data stream
Field Study of heavy vehicle Crash avoidance systems
performance
34
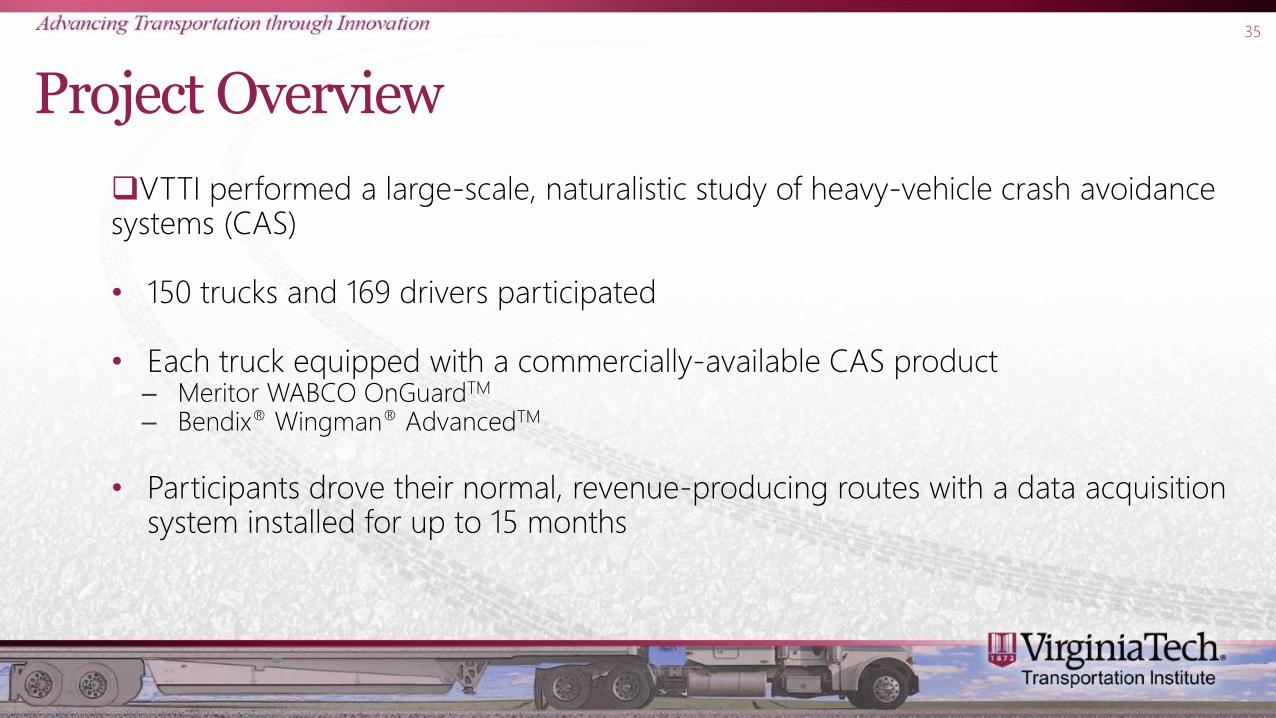
Project Overview
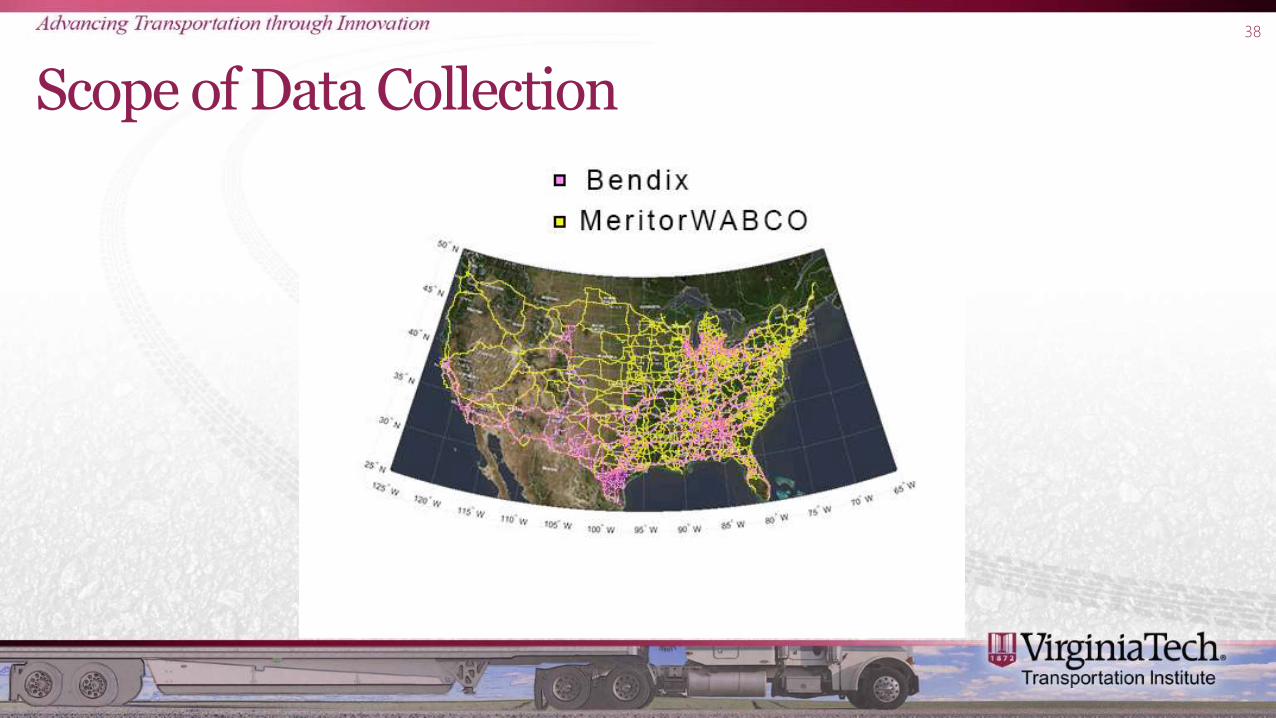
VTTI performed a large-scale, naturalistic study of heavy-vehicle crash avoidance systems (CAS)
• 150 trucks and 169 drivers participated
• Each truck equipped with a commercially-available CAS product– Meritor WABCO OnGuardTM
– Bendix® Wingman® AdvancedTM
• Participants drove their normal, revenue-producing routes with a data acquisition system installed for up to 15 months
35
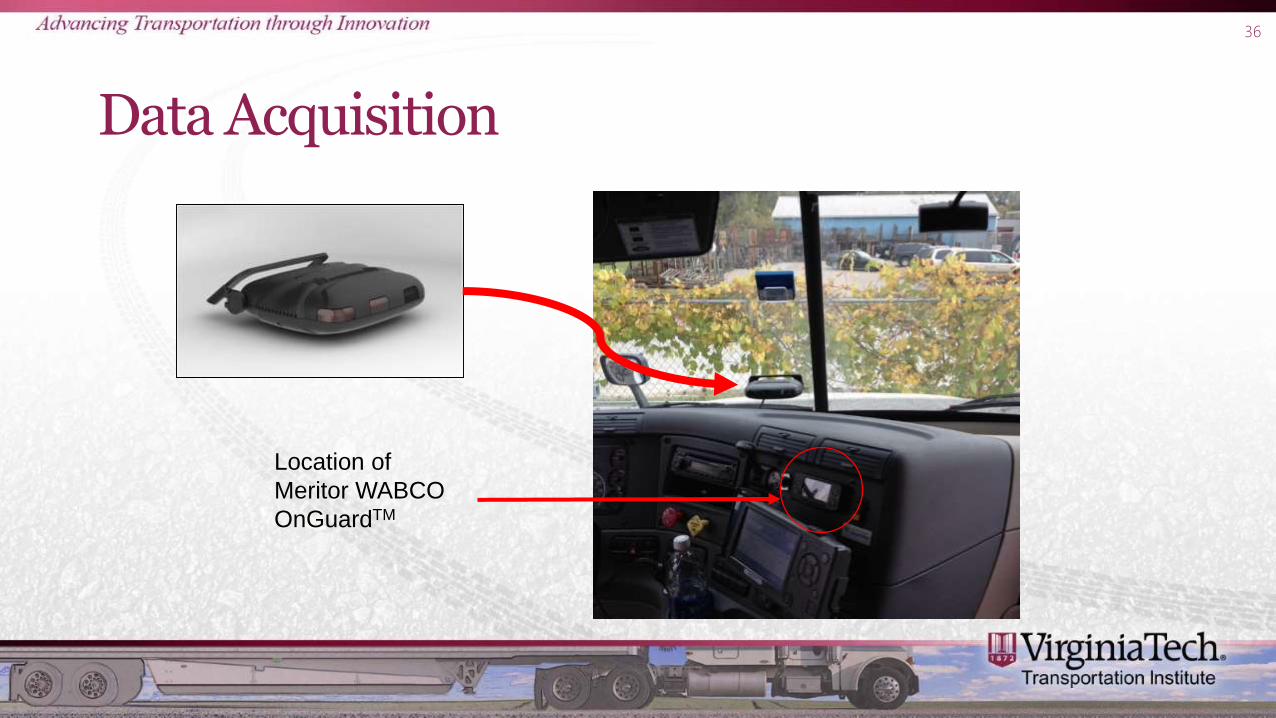
Data Acquisition
36
Location of
Meritor WABCO
OnGuardTM
Scope of Data Collection
Continuous data If the truck was in motion, we captured video and vehicle network
In total 85,000 hours and 2.5 million miles of data recorded 187 terabytes of secure data storage
Hundreds of man-hours to review and code the data
37
Scope of Data Collection
38
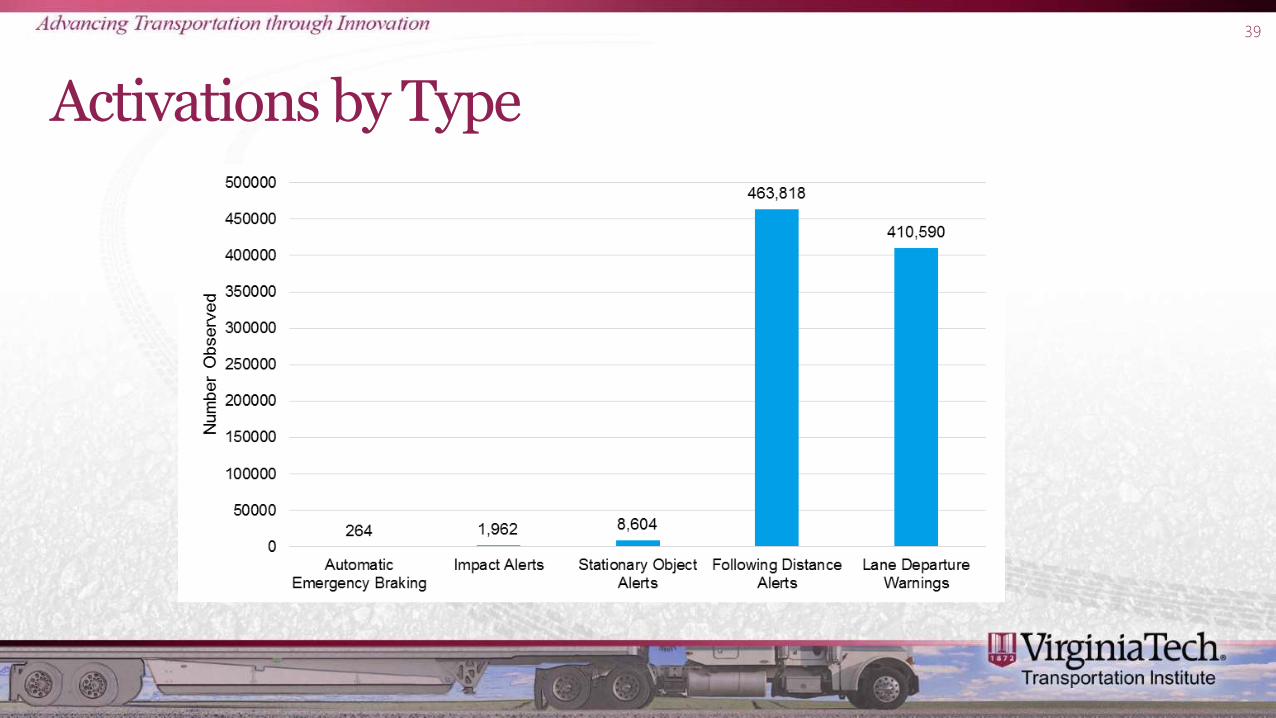
Activations by Type
39

Video
40

Video
41

Video
42

Video
43

Video
44
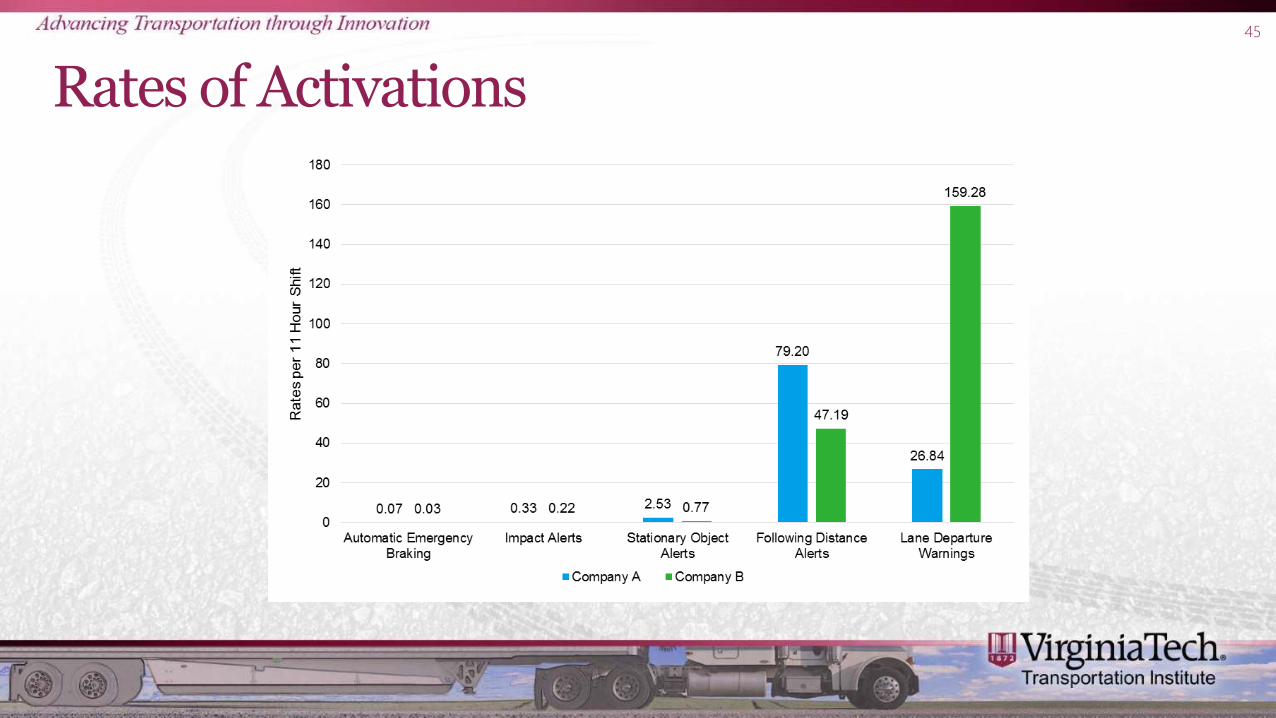
Rates of Activations45
Examining Activations46
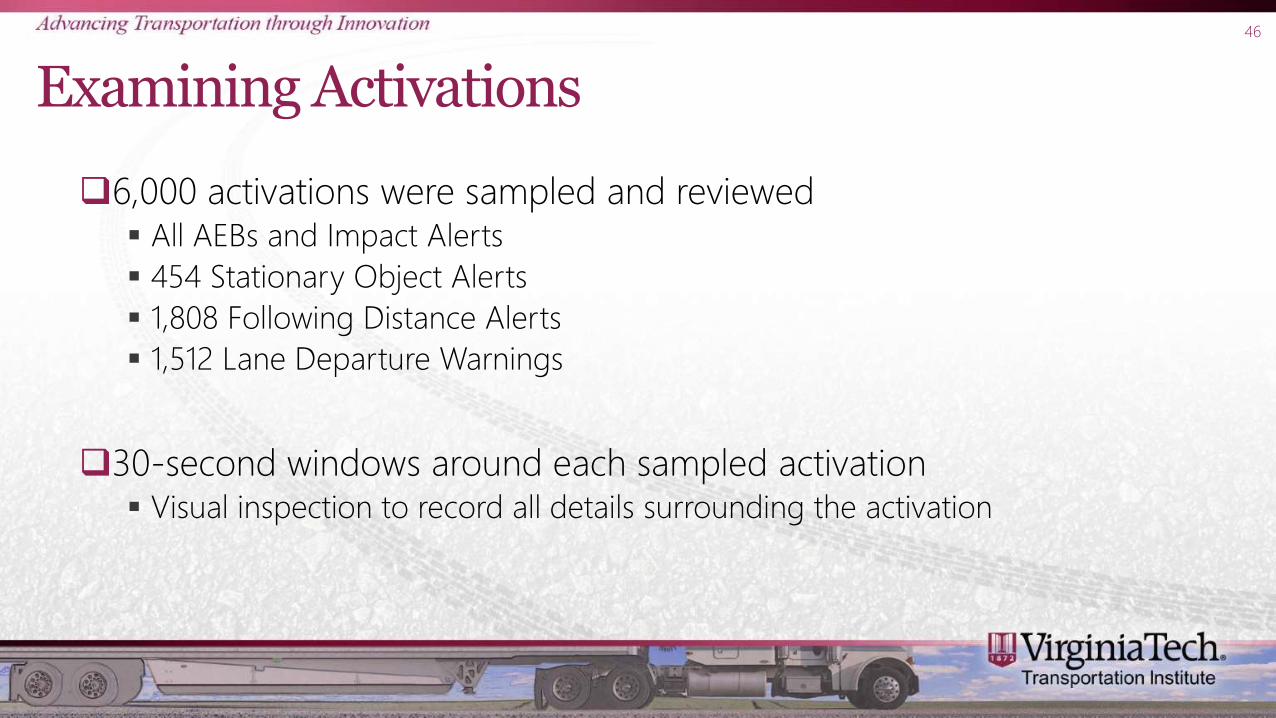
6,000 activations were sampled and reviewed All AEBs and Impact Alerts
454 Stationary Object Alerts
1,808 Following Distance Alerts
1,512 Lane Departure Warnings
30-second windows around each sampled activation Visual inspection to record all details surrounding the activation
Changes in Alert Rates
VTTI | Driving Transportation with Technology
47
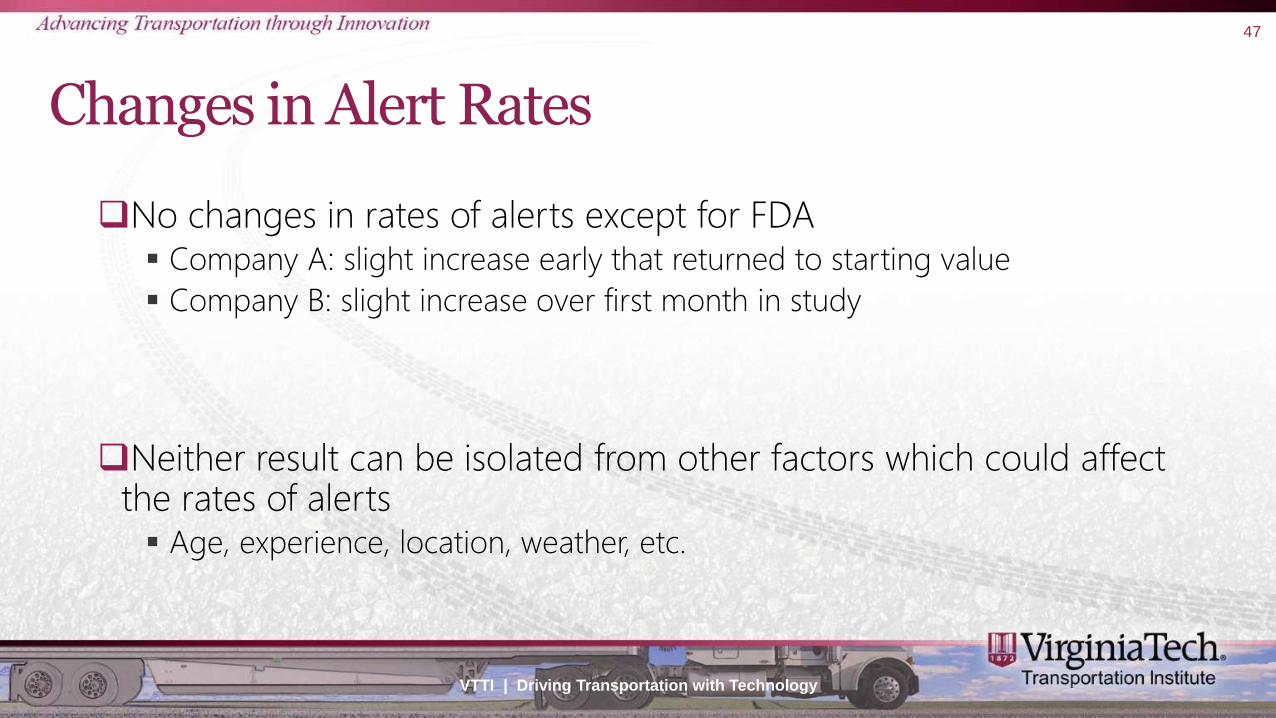
No changes in rates of alerts except for FDA Company A: slight increase early that returned to starting value
Company B: slight increase over first month in study
Neither result can be isolated from other factors which could affect the rates of alerts Age, experience, location, weather, etc.
Changes in Driving Behavior
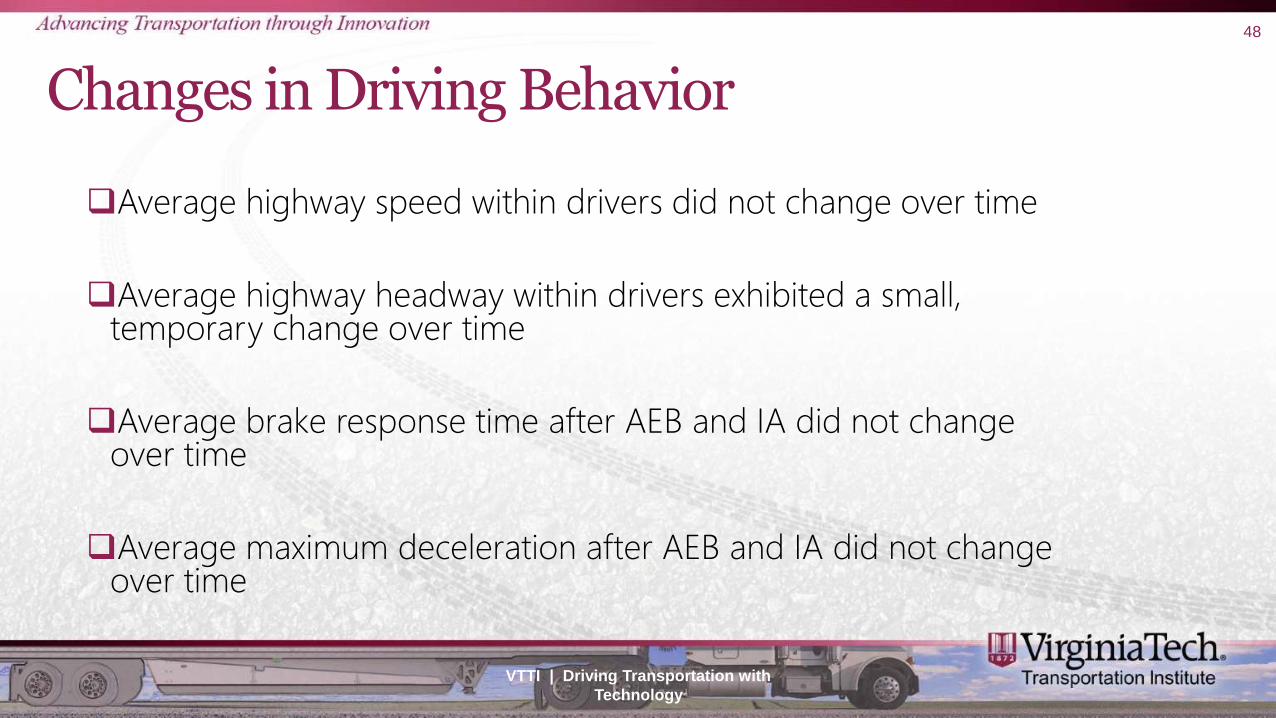
Average highway speed within drivers did not change over time
Average highway headway within drivers exhibited a small, temporary change over time
Average brake response time after AEB and IA did not change over time
Average maximum deceleration after AEB and IA did not change over time
VTTI | Driving Transportation with
Technology
48
Data on Conflicts
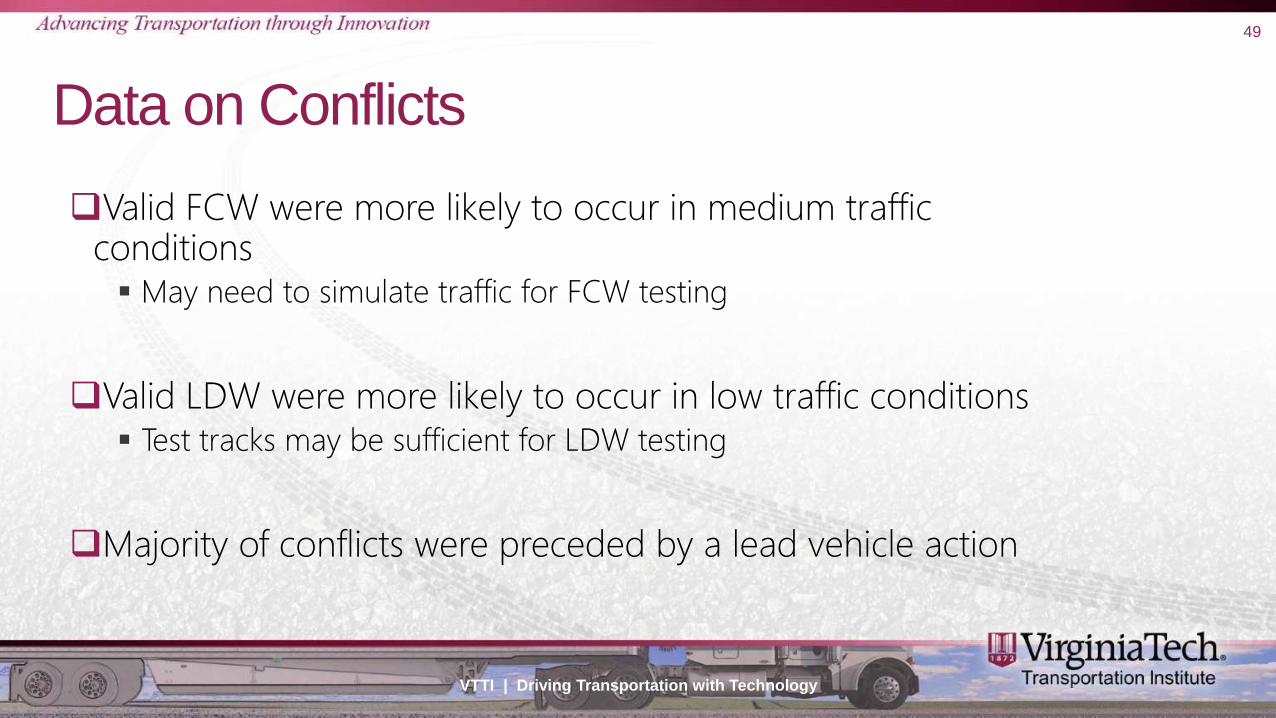
Valid FCW were more likely to occur in medium traffic conditions May need to simulate traffic for FCW testing
Valid LDW were more likely to occur in low traffic conditions Test tracks may be sufficient for LDW testing
Majority of conflicts were preceded by a lead vehicle action
VTTI | Driving Transportation with Technology
49
Conclusions
VTTI | Driving Transportation with
Technology
50
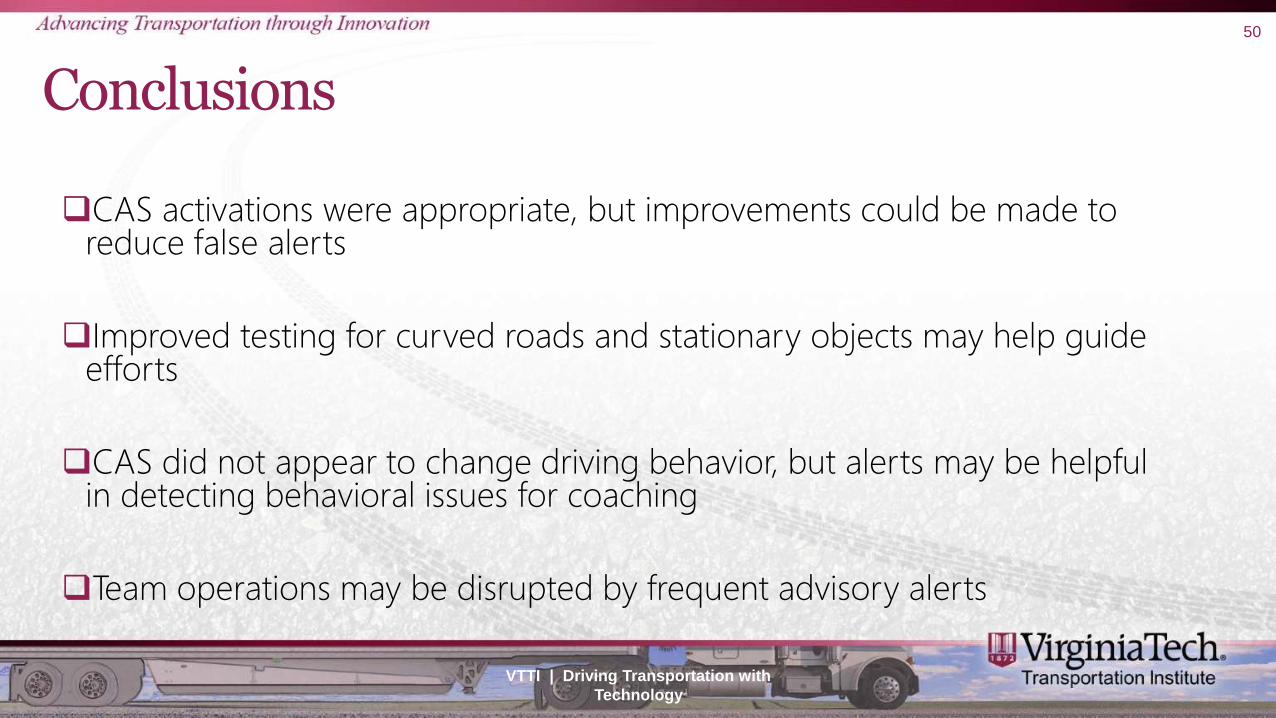
CAS activations were appropriate, but improvements could be made to reduce false alerts
Improved testing for curved roads and stationary objects may help guide efforts
CAS did not appear to change driving behavior, but alerts may be helpful in detecting behavioral issues for coaching
Team operations may be disrupted by frequent advisory alerts
Conclusions
VTTI | Driving Transportation with
Technology
51
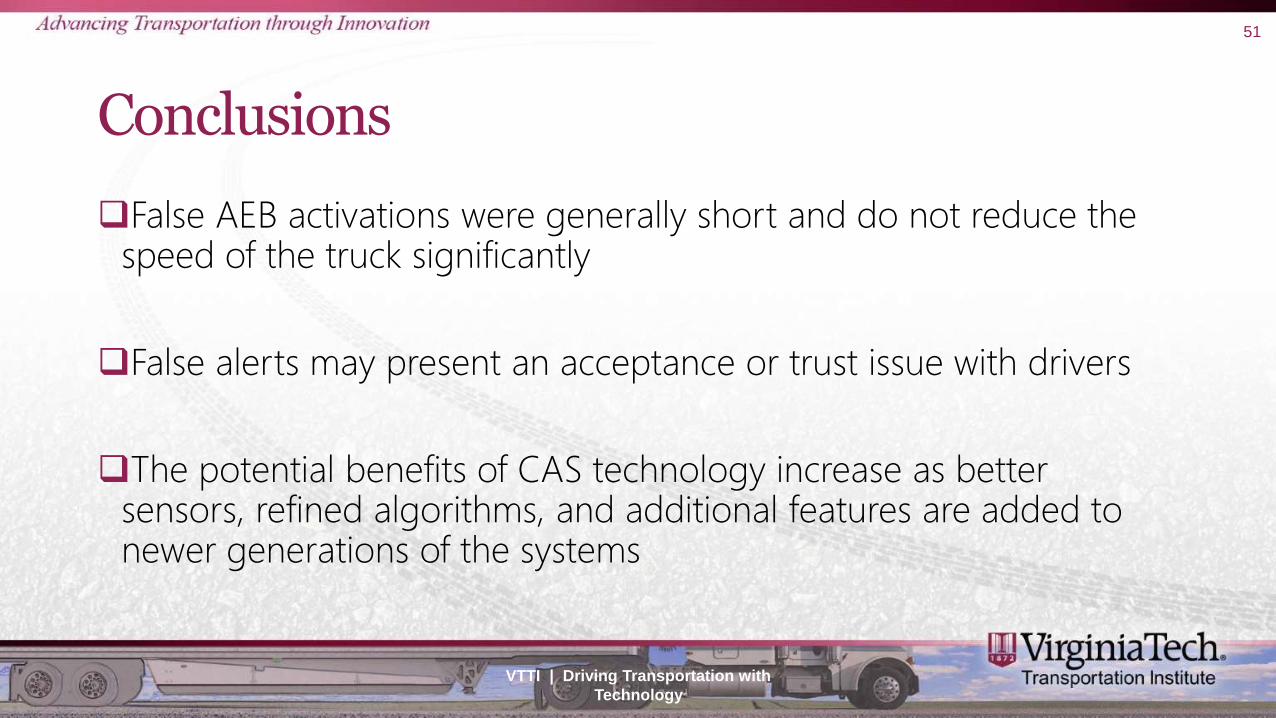
False AEB activations were generally short and do not reduce the speed of the truck significantly
False alerts may present an acceptance or trust issue with drivers
The potential benefits of CAS technology increase as better sensors, refined algorithms, and additional features are added to newer generations of the systems
Leveraging Large Truck Technology & Engineering to
Realize Safety Gains
52
Objective
Collect benefit and cost data for popular large truck advanced safety technologies (AST) Literature review
Expert Panel
Societal benefit-cost analysis for each selected AST
53
Literature Review
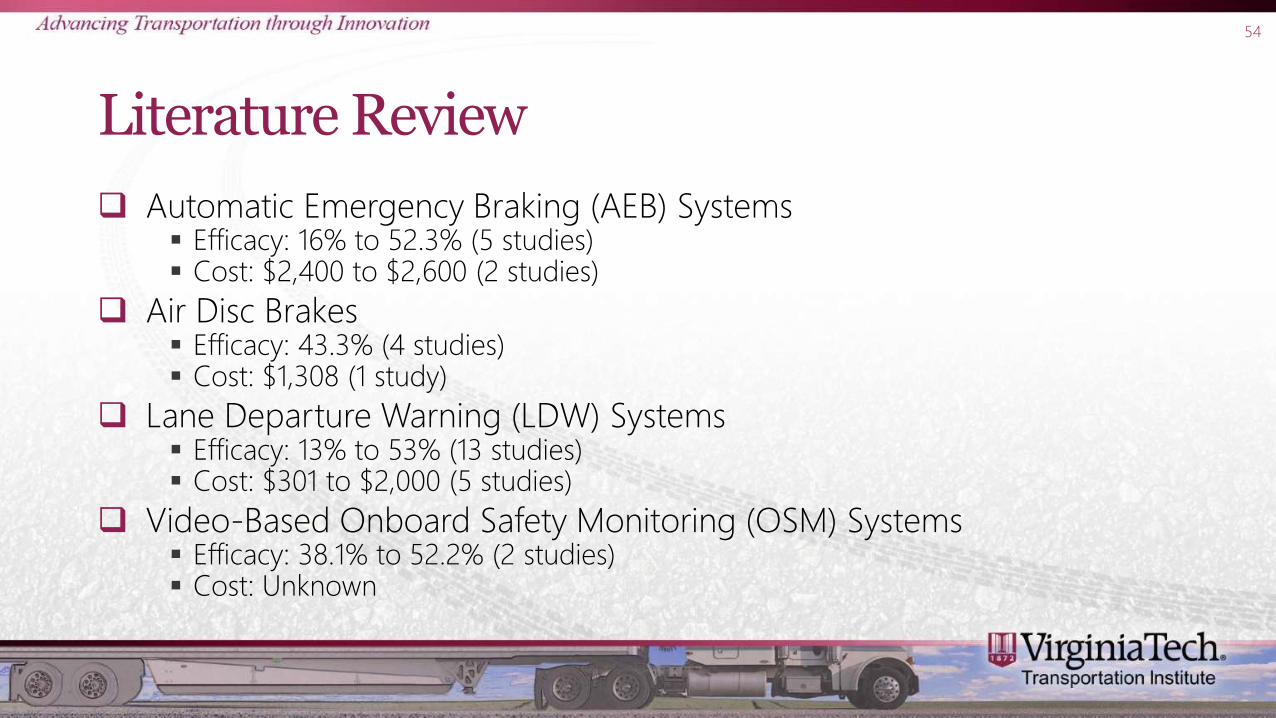
Automatic Emergency Braking (AEB) Systems Efficacy: 16% to 52.3% (5 studies) Cost: $2,400 to $2,600 (2 studies)
Air Disc Brakes Efficacy: 43.3% (4 studies) Cost: $1,308 (1 study)
Lane Departure Warning (LDW) Systems Efficacy: 13% to 53% (13 studies) Cost: $301 to $2,000 (5 studies)
Video-Based Onboard Safety Monitoring (OSM) Systems Efficacy: 38.1% to 52.2% (2 studies) Cost: Unknown
54
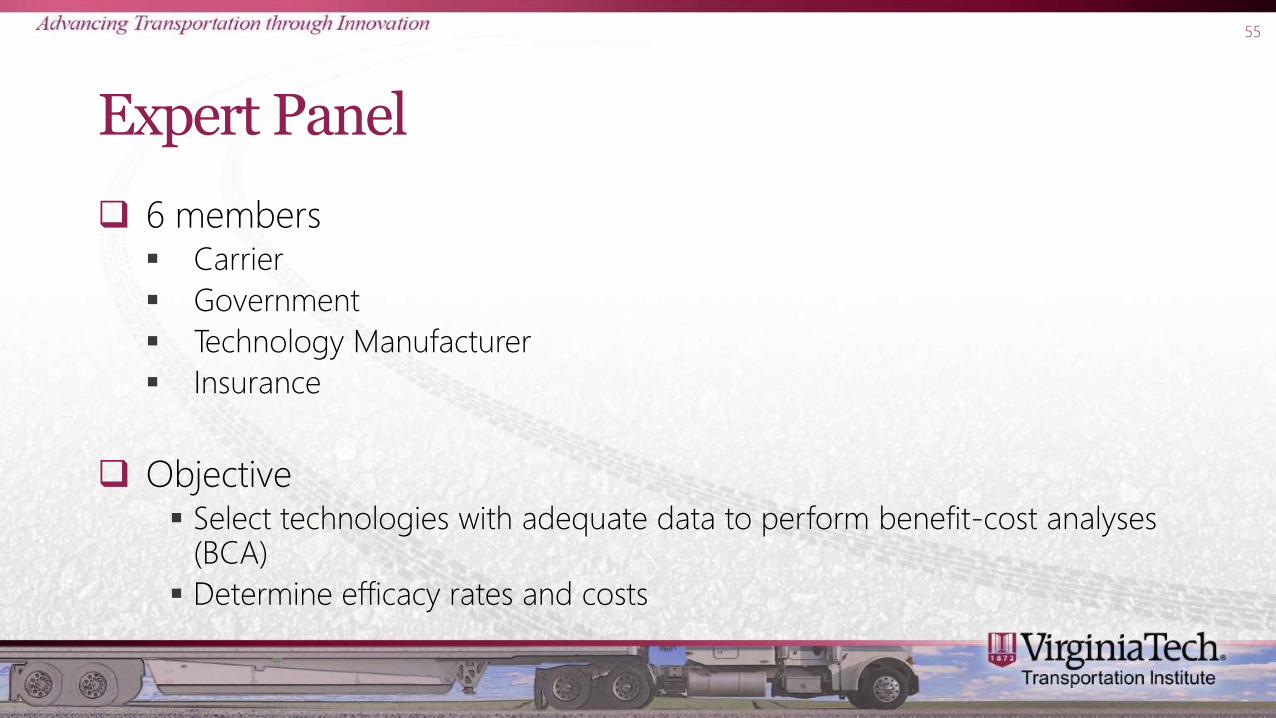
Expert Panel
6 members Carrier
Government
Technology Manufacturer
Insurance
Objective Select technologies with adequate data to perform benefit-cost analyses
(BCA)
Determine efficacy rates and costs
55
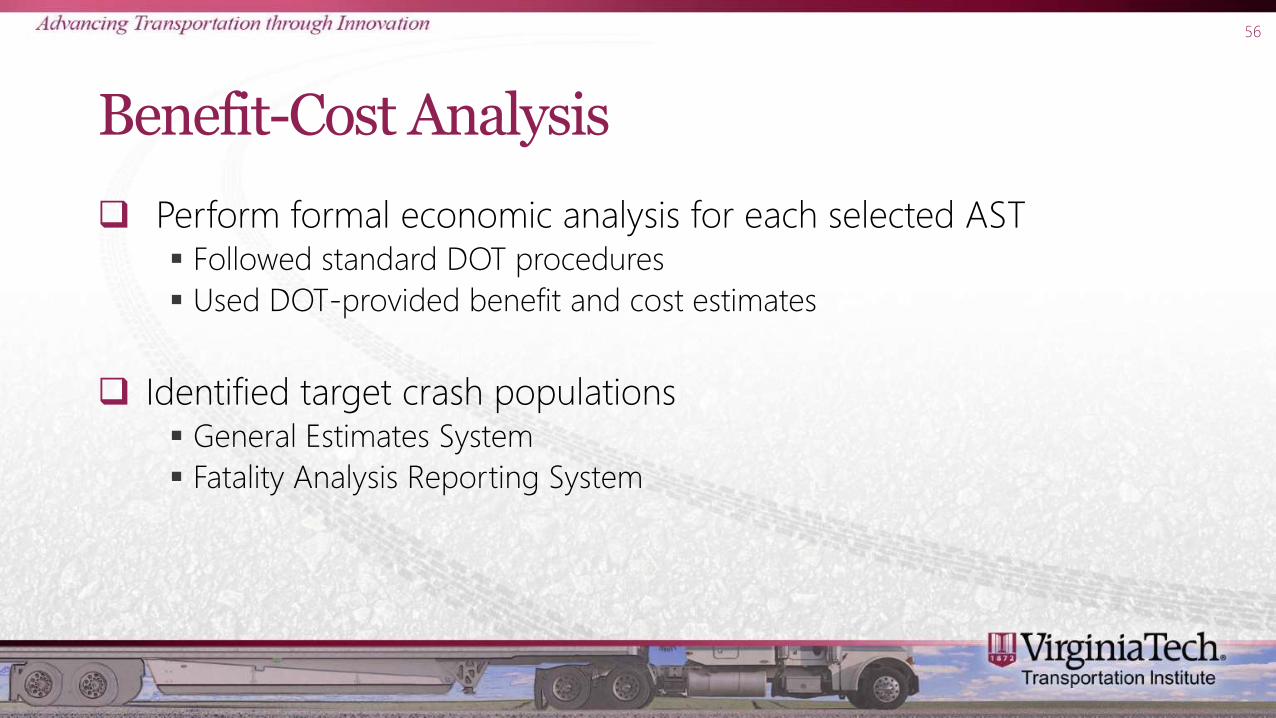
Benefit-Cost Analysis
Perform formal economic analysis for each selected AST Followed standard DOT procedures
Used DOT-provided benefit and cost estimates
Identified target crash populations General Estimates System
Fatality Analysis Reporting System
56
Automatic Emergency Braking
Results: Retrofitting All Trucks
58
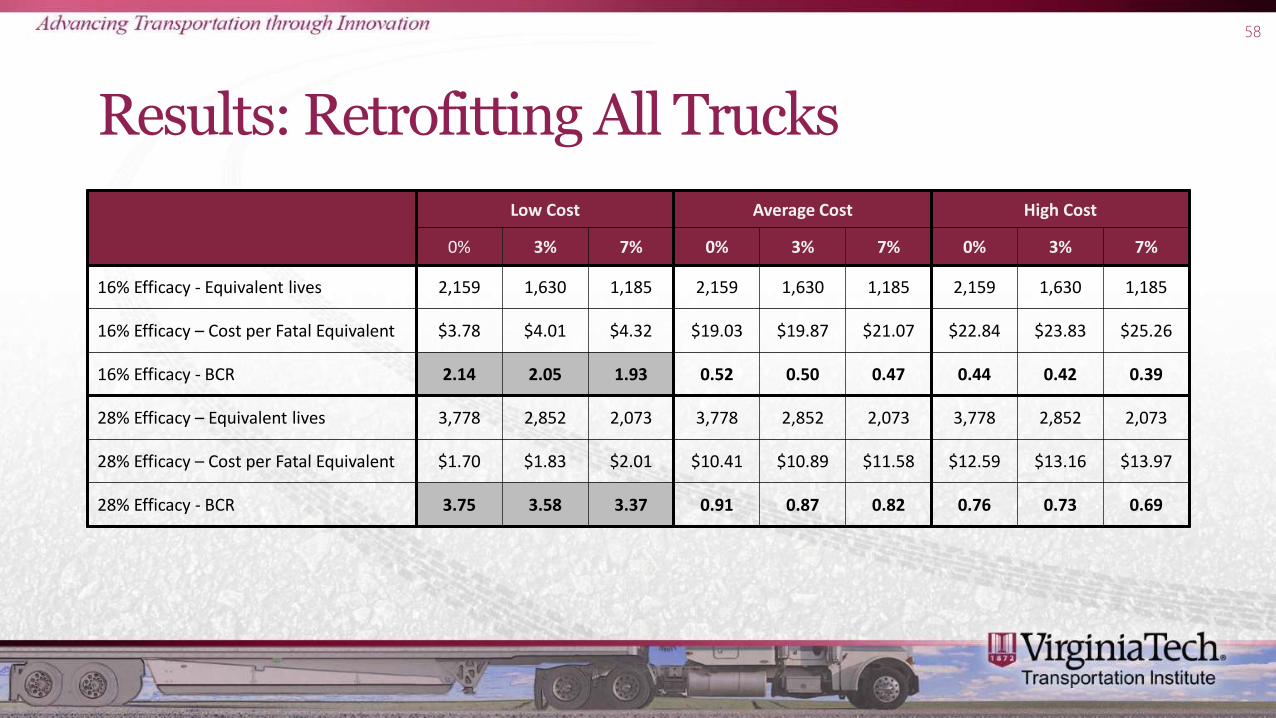
Low Cost Average Cost High Cost
0% 3% 7% 0% 3% 7% 0% 3% 7%
16% Efficacy - Equivalent lives 2,159 1,630 1,185 2,159 1,630 1,185 2,159 1,630 1,185
16% Efficacy – Cost per Fatal Equivalent $3.78 $4.01 $4.32 $19.03 $19.87 $21.07 $22.84 $23.83 $25.26
16% Efficacy - BCR 2.14 2.05 1.93 0.52 0.50 0.47 0.44 0.42 0.39
28% Efficacy – Equivalent lives 3,778 2,852 2,073 3,778 2,852 2,073 3,778 2,852 2,073
28% Efficacy – Cost per Fatal Equivalent $1.70 $1.83 $2.01 $10.41 $10.89 $11.58 $12.59 $13.16 $13.97
28% Efficacy - BCR 3.75 3.58 3.37 0.91 0.87 0.82 0.76 0.73 0.69
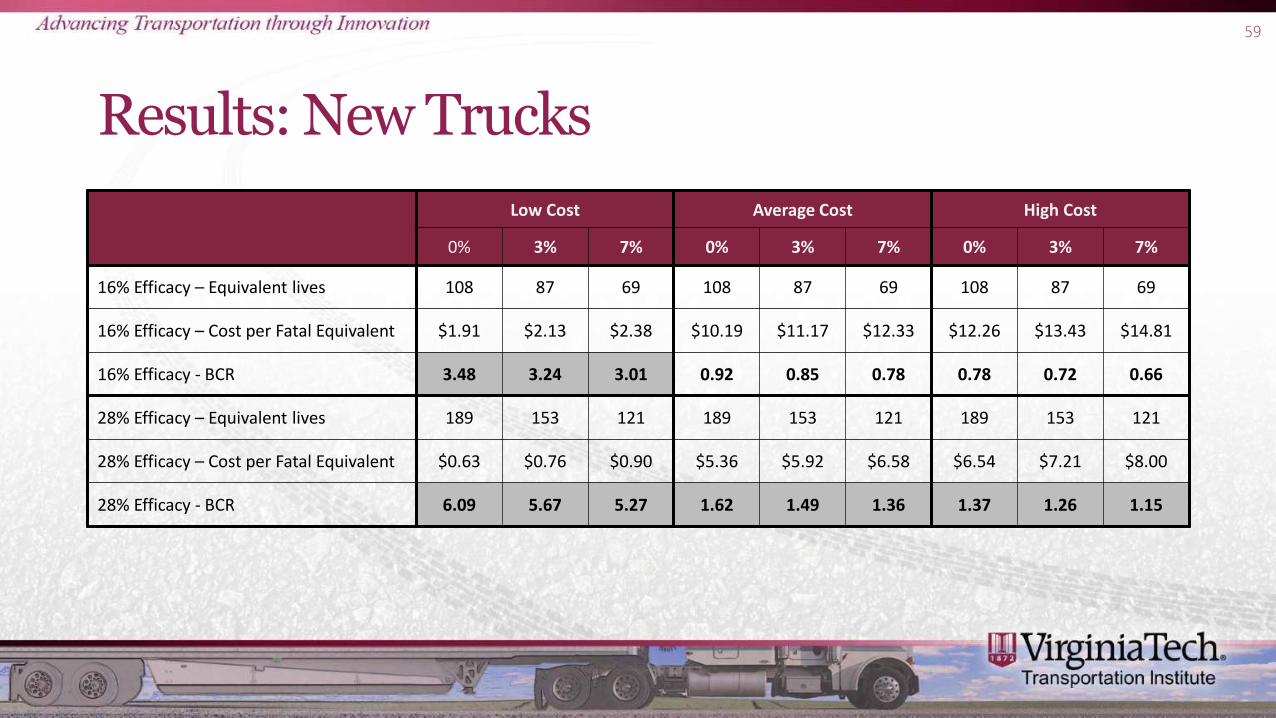
Results: New Trucks
59
Low Cost Average Cost High Cost
0% 3% 7% 0% 3% 7% 0% 3% 7%
16% Efficacy – Equivalent lives 108 87 69 108 87 69 108 87 69
16% Efficacy – Cost per Fatal Equivalent $1.91 $2.13 $2.38 $10.19 $11.17 $12.33 $12.26 $13.43 $14.81
16% Efficacy - BCR 3.48 3.24 3.01 0.92 0.85 0.78 0.78 0.72 0.66
28% Efficacy – Equivalent lives 189 153 121 189 153 121 189 153 121
28% Efficacy – Cost per Fatal Equivalent $0.63 $0.76 $0.90 $5.36 $5.92 $6.58 $6.54 $7.21 $8.00
28% Efficacy - BCR 6.09 5.67 5.27 1.62 1.49 1.36 1.37 1.26 1.15
Discussion
Number of crashes prevented similar to previous research 16% efficacy: 3,025 total crashes, 1,507 injuries, 31 fatalities
28% efficacy: 5,294 total crashes, 2,638 injuries, 55 fatalities
BCA results similar to previous research (Murray, 2009)
Current pricing/efficacy rates did not always suggest AEB was cost effective Only equipping new trucks
28% efficacy
More cost effective for CUTs
60
Air Disc Brakes
61
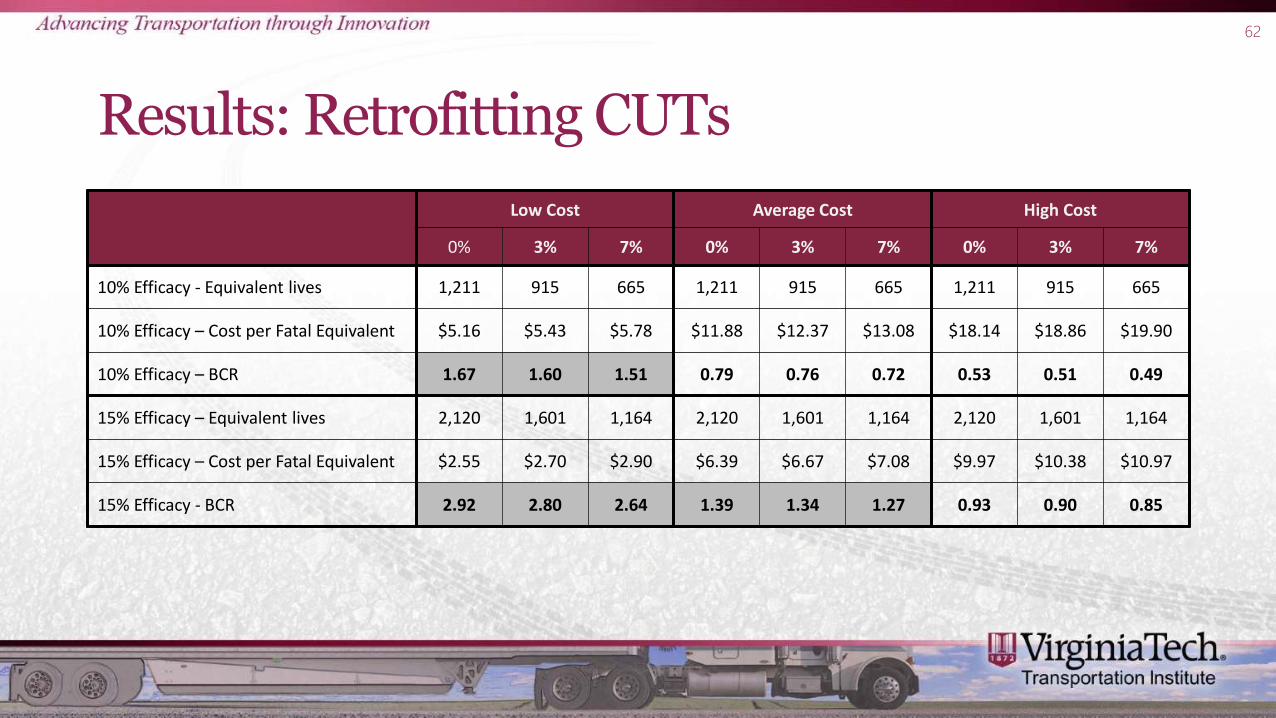
Results: Retrofitting CUTs
62
Low Cost Average Cost High Cost
0% 3% 7% 0% 3% 7% 0% 3% 7%
10% Efficacy - Equivalent lives 1,211 915 665 1,211 915 665 1,211 915 665
10% Efficacy – Cost per Fatal Equivalent $5.16 $5.43 $5.78 $11.88 $12.37 $13.08 $18.14 $18.86 $19.90
10% Efficacy – BCR 1.67 1.60 1.51 0.79 0.76 0.72 0.53 0.51 0.49
15% Efficacy – Equivalent lives 2,120 1,601 1,164 2,120 1,601 1,164 2,120 1,601 1,164
15% Efficacy – Cost per Fatal Equivalent $2.55 $2.70 $2.90 $6.39 $6.67 $7.08 $9.97 $10.38 $10.97
15% Efficacy - BCR 2.92 2.80 2.64 1.39 1.34 1.27 0.93 0.90 0.85
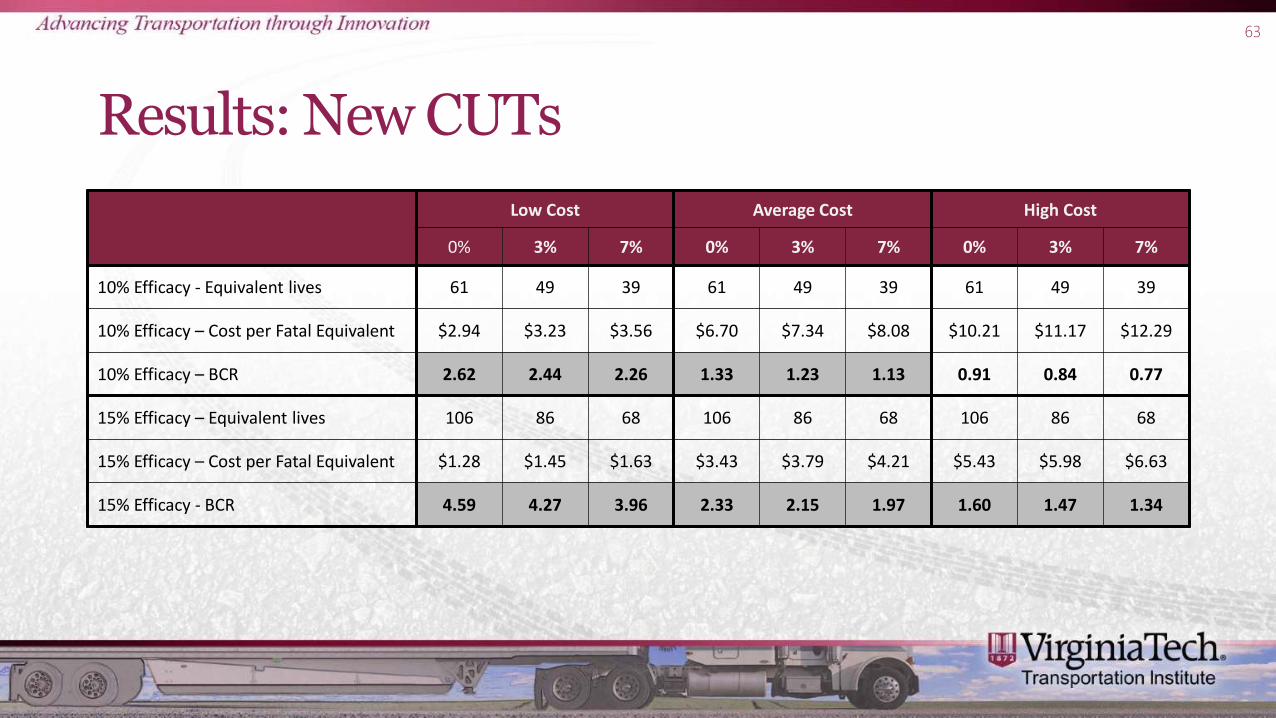
Results: New CUTs
63
Low Cost Average Cost High Cost
0% 3% 7% 0% 3% 7% 0% 3% 7%
10% Efficacy - Equivalent lives 61 49 39 61 49 39 61 49 39
10% Efficacy – Cost per Fatal Equivalent $2.94 $3.23 $3.56 $6.70 $7.34 $8.08 $10.21 $11.17 $12.29
10% Efficacy – BCR 2.62 2.44 2.26 1.33 1.23 1.13 0.91 0.84 0.77
15% Efficacy – Equivalent lives 106 86 68 106 86 68 106 86 68
15% Efficacy – Cost per Fatal Equivalent $1.28 $1.45 $1.63 $3.43 $3.79 $4.21 $5.43 $5.98 $6.63
15% Efficacy - BCR 4.59 4.27 3.96 2.33 2.15 1.97 1.60 1.47 1.34
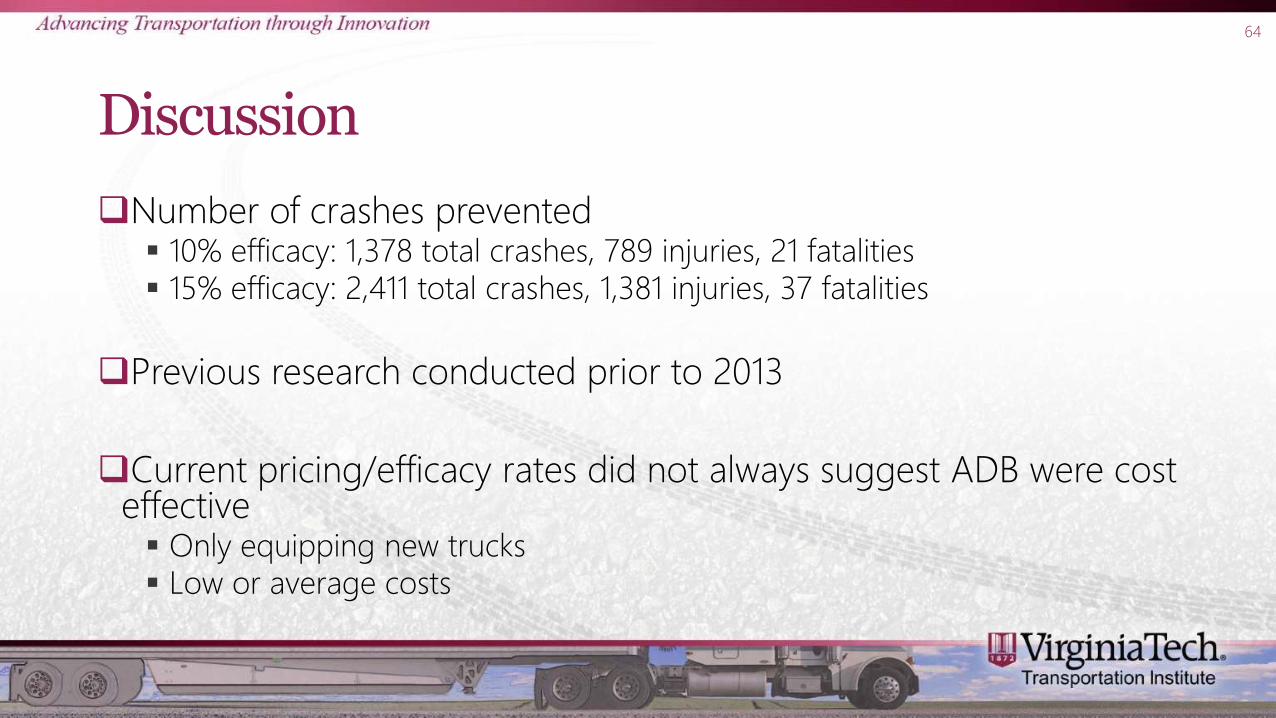
Discussion
64
Number of crashes prevented 10% efficacy: 1,378 total crashes, 789 injuries, 21 fatalities 15% efficacy: 2,411 total crashes, 1,381 injuries, 37 fatalities
Previous research conducted prior to 2013
Current pricing/efficacy rates did not always suggest ADB were cost effective Only equipping new trucks Low or average costs
Results: Lane Departure Warning
65
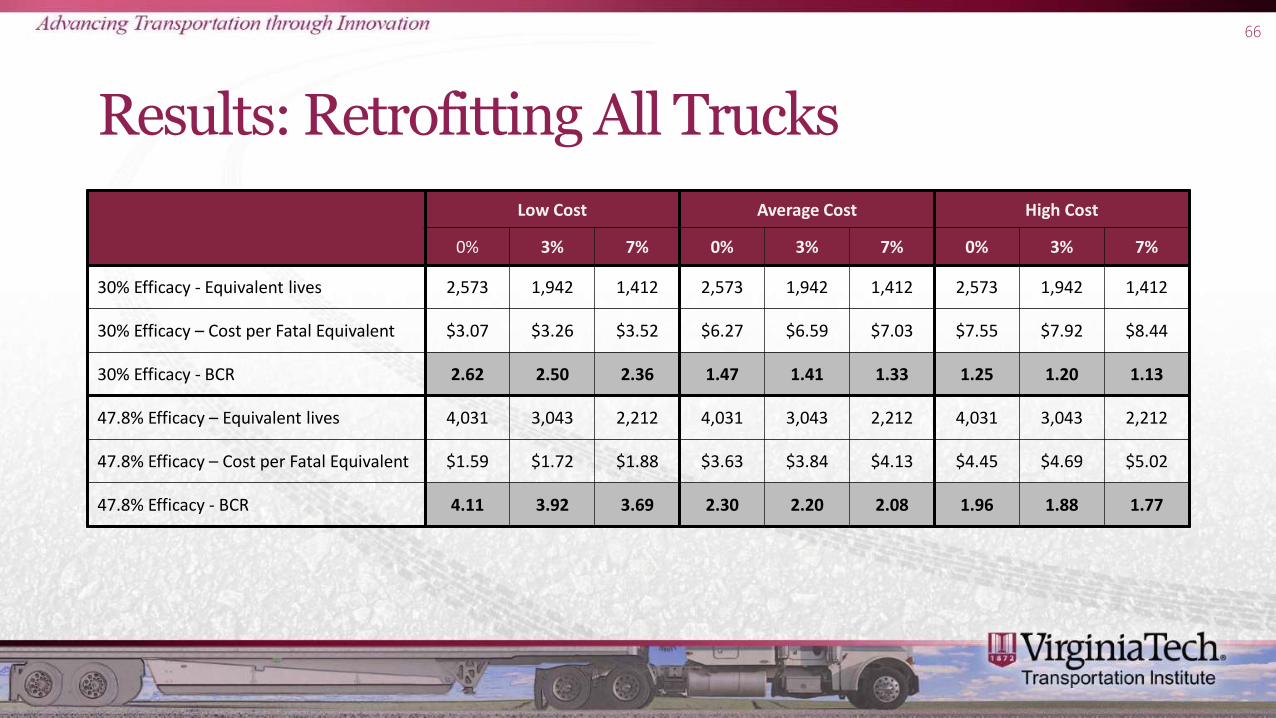
Results: Retrofitting All Trucks
66
Low Cost Average Cost High Cost
0% 3% 7% 0% 3% 7% 0% 3% 7%
30% Efficacy - Equivalent lives 2,573 1,942 1,412 2,573 1,942 1,412 2,573 1,942 1,412
30% Efficacy – Cost per Fatal Equivalent $3.07 $3.26 $3.52 $6.27 $6.59 $7.03 $7.55 $7.92 $8.44
30% Efficacy - BCR 2.62 2.50 2.36 1.47 1.41 1.33 1.25 1.20 1.13
47.8% Efficacy – Equivalent lives 4,031 3,043 2,212 4,031 3,043 2,212 4,031 3,043 2,212
47.8% Efficacy – Cost per Fatal Equivalent $1.59 $1.72 $1.88 $3.63 $3.84 $4.13 $4.45 $4.69 $5.02
47.8% Efficacy - BCR 4.11 3.92 3.69 2.30 2.20 2.08 1.96 1.88 1.77

Results: New Trucks
67
Low Cost Average Cost High Cost
0% 3% 7% 0% 3% 7% 0% 3% 7%
30% Efficacy - Equivalent lives 129 104 83 129 104 83 129 104 83
30% Efficacy – Cost per Fatal Equivalent $1.50 $1.69 $1.89 $3.24 $3.58 $3.98 $3.93 $4.34 $4.81
30% Efficacy - BCR 4.26 3.96 3.68 2.52 2.33 2.14 2.16 2.00 1.83
47.8% Efficacy – Equivalent lives 202 163 130 202 163 130 202 163 130
47.8% Efficacy – Cost per Fatal Equivalent $0.59 $0.71 $0.84 $1.70 $1.92 $2.17 $2.14 $2.40 $2.71
47.8% Efficacy - BCR 6.67 6.21 5.77 3.94 3.65 3.36 3.39 3.13 2.87
Discussion
68
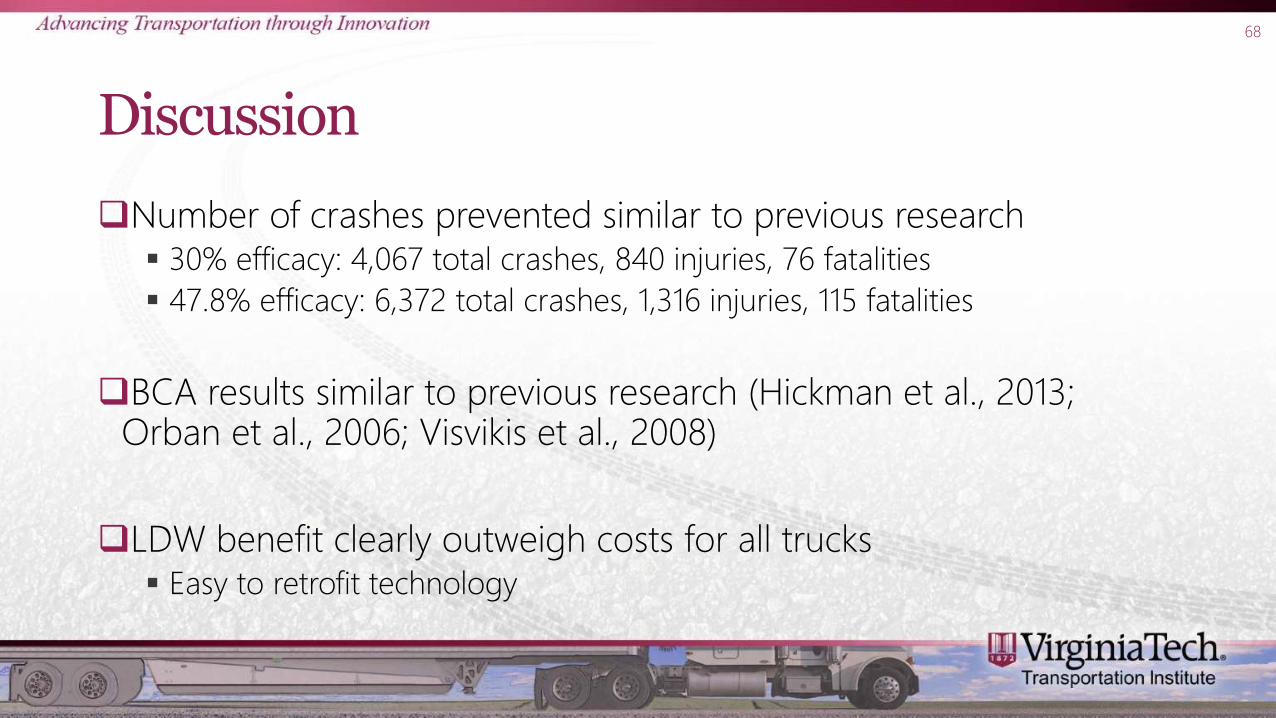
Number of crashes prevented similar to previous research 30% efficacy: 4,067 total crashes, 840 injuries, 76 fatalities
47.8% efficacy: 6,372 total crashes, 1,316 injuries, 115 fatalities
BCA results similar to previous research (Hickman et al., 2013; Orban et al., 2006; Visvikis et al., 2008)
LDW benefit clearly outweigh costs for all trucks Easy to retrofit technology
Results: Video-Based Onboard Safety Monitoring Sytems
69
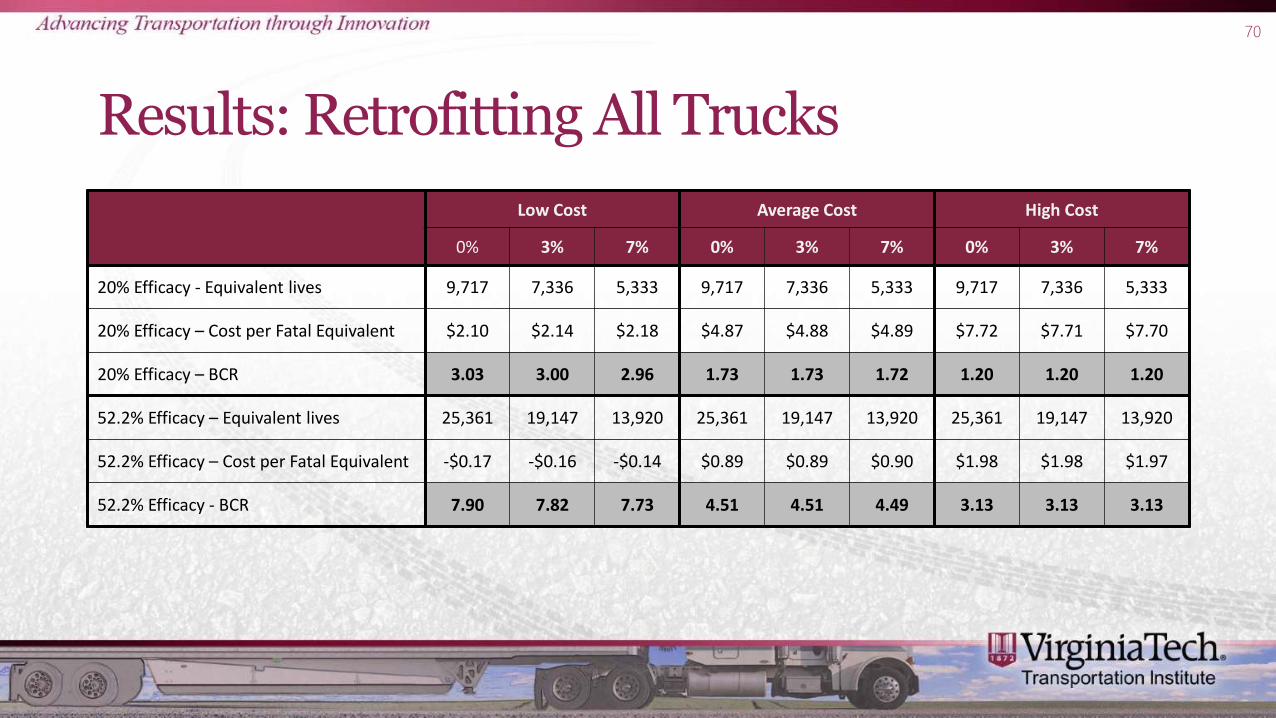
Results: Retrofitting All Trucks
70
Low Cost Average Cost High Cost
0% 3% 7% 0% 3% 7% 0% 3% 7%
20% Efficacy - Equivalent lives 9,717 7,336 5,333 9,717 7,336 5,333 9,717 7,336 5,333
20% Efficacy – Cost per Fatal Equivalent $2.10 $2.14 $2.18 $4.87 $4.88 $4.89 $7.72 $7.71 $7.70
20% Efficacy – BCR 3.03 3.00 2.96 1.73 1.73 1.72 1.20 1.20 1.20
52.2% Efficacy – Equivalent lives 25,361 19,147 13,920 25,361 19,147 13,920 25,361 19,147 13,920
52.2% Efficacy – Cost per Fatal Equivalent -$0.17 -$0.16 -$0.14 $0.89 $0.89 $0.90 $1.98 $1.98 $1.97
52.2% Efficacy - BCR 7.90 7.82 7.73 4.51 4.51 4.49 3.13 3.13 3.13
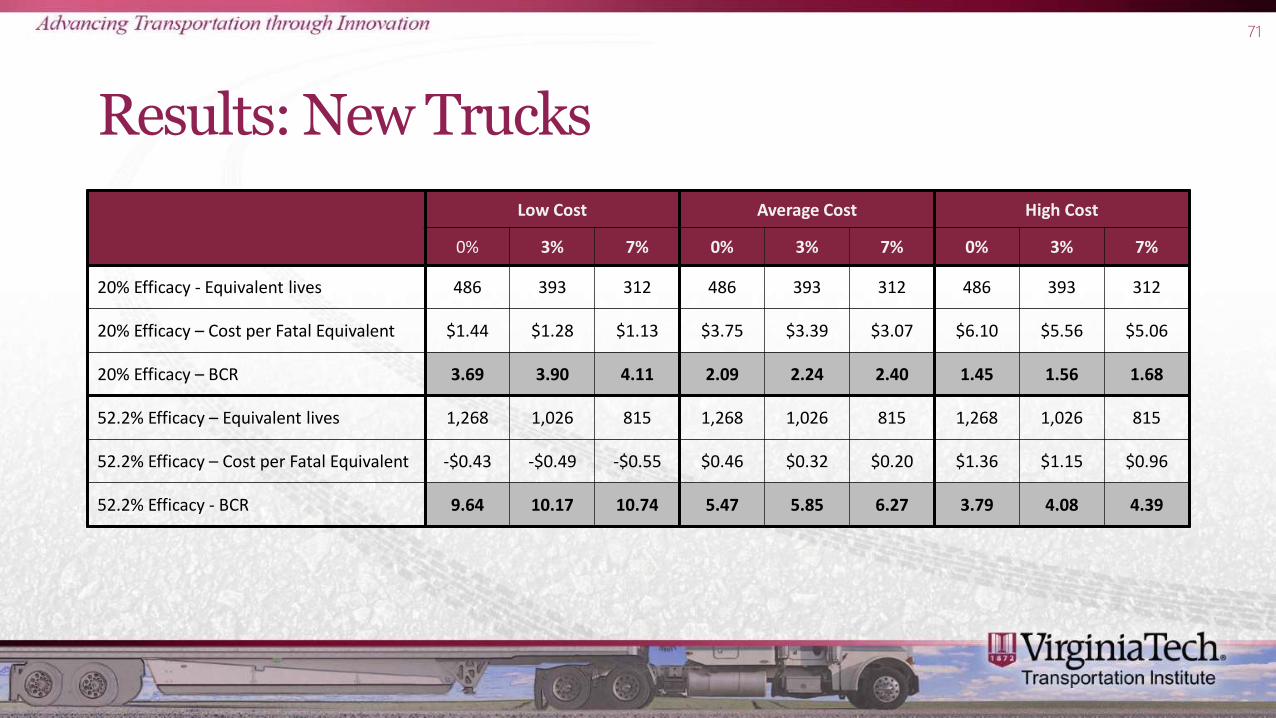
Results: New Trucks
71
Low Cost Average Cost High Cost
0% 3% 7% 0% 3% 7% 0% 3% 7%
20% Efficacy - Equivalent lives 486 393 312 486 393 312 486 393 312
20% Efficacy – Cost per Fatal Equivalent $1.44 $1.28 $1.13 $3.75 $3.39 $3.07 $6.10 $5.56 $5.06
20% Efficacy – BCR 3.69 3.90 4.11 2.09 2.24 2.40 1.45 1.56 1.68
52.2% Efficacy – Equivalent lives 1,268 1,026 815 1,268 1,026 815 1,268 1,026 815
52.2% Efficacy – Cost per Fatal Equivalent -$0.43 -$0.49 -$0.55 $0.46 $0.32 $0.20 $1.36 $1.15 $0.96
52.2% Efficacy - BCR 9.64 10.17 10.74 5.47 5.85 6.27 3.79 4.08 4.39
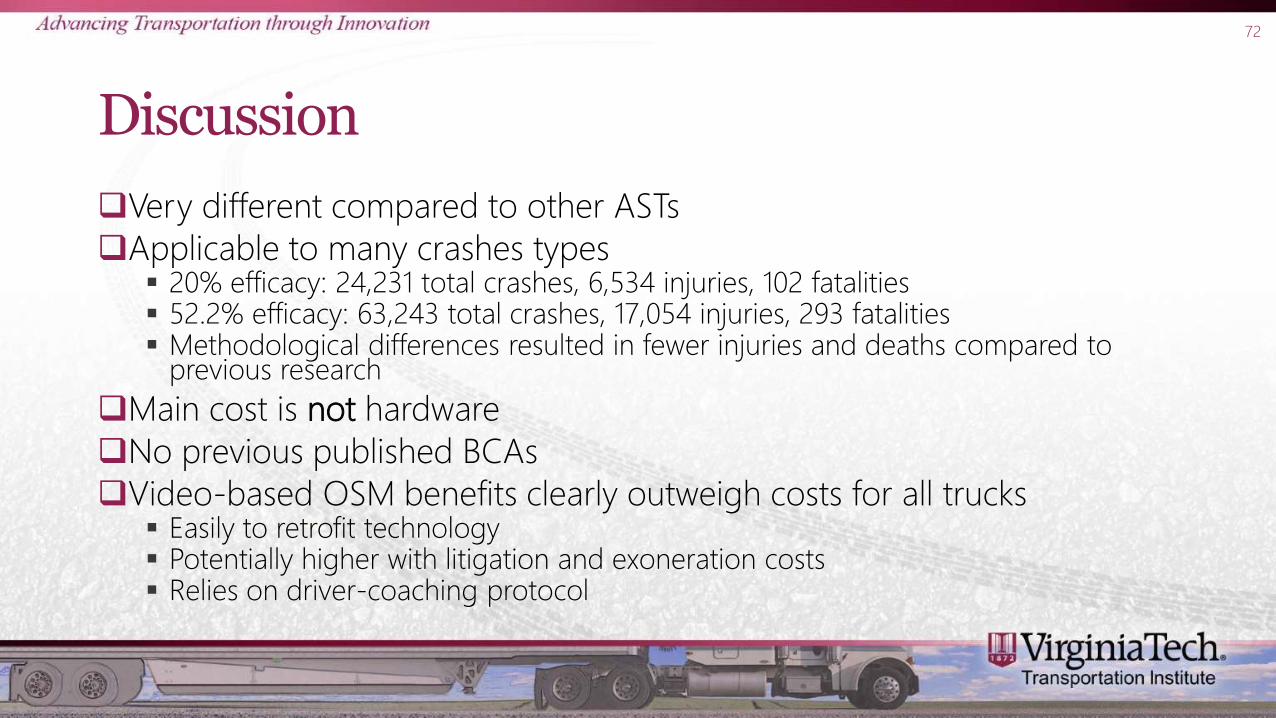
Discussion
72
Very different compared to other ASTs
Applicable to many crashes types 20% efficacy: 24,231 total crashes, 6,534 injuries, 102 fatalities 52.2% efficacy: 63,243 total crashes, 17,054 injuries, 293 fatalities Methodological differences resulted in fewer injuries and deaths compared to
previous research
Main cost is not hardware
No previous published BCAs
Video-based OSM benefits clearly outweigh costs for all trucks Easily to retrofit technology Potentially higher with litigation and exoneration costs Relies on driver-coaching protocol
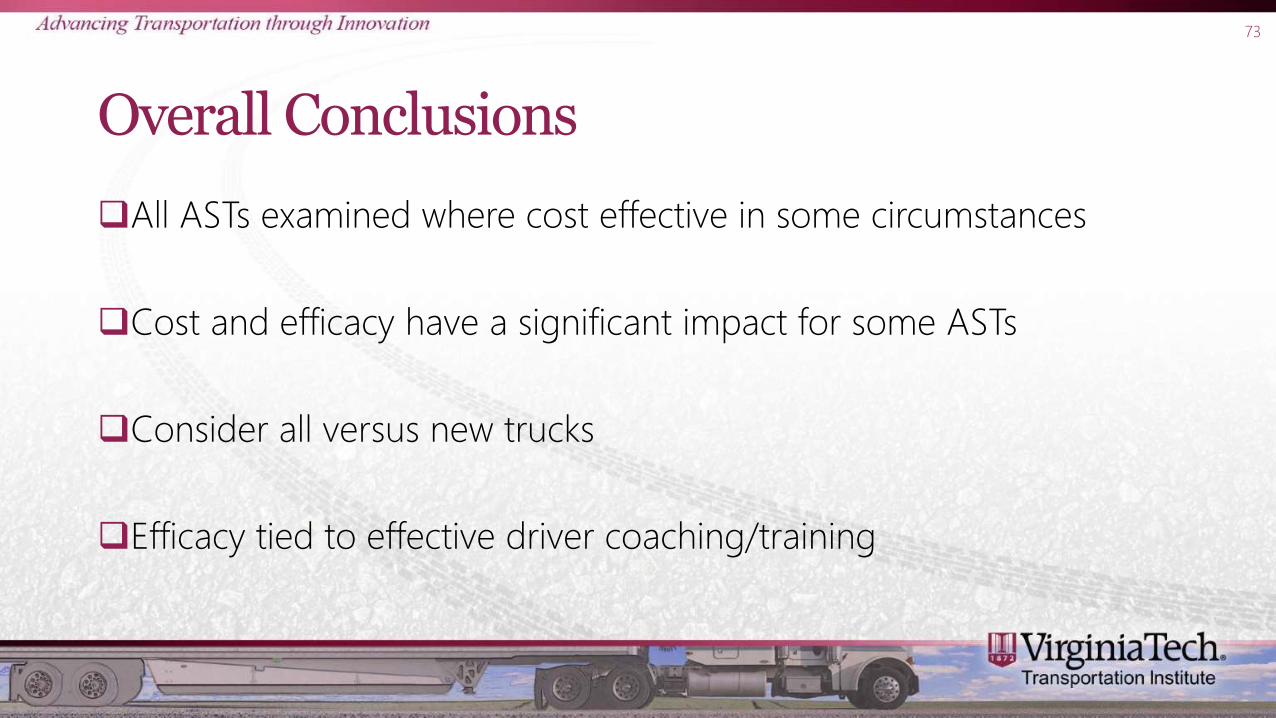
Overall Conclusions
All ASTs examined where cost effective in some circumstances
Cost and efficacy have a significant impact for some ASTs
Consider all versus new trucks
Efficacy tied to effective driver coaching/training
73
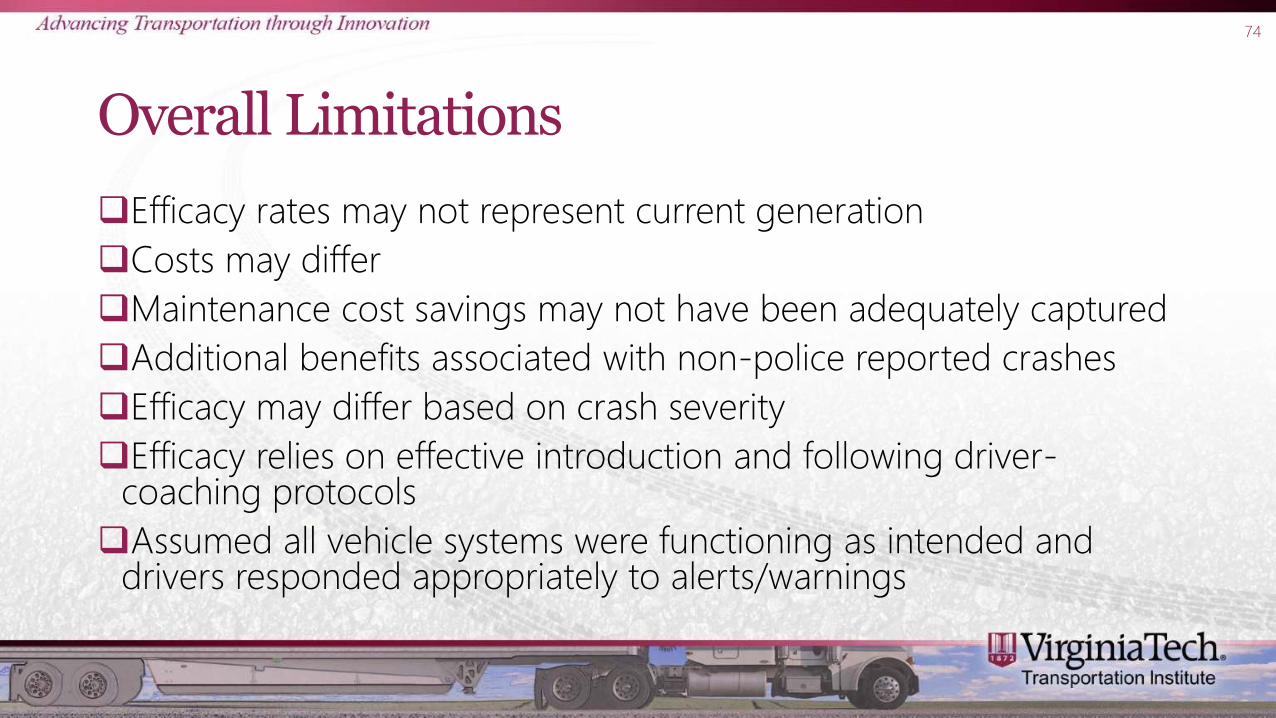
Overall Limitations
Efficacy rates may not represent current generation
Costs may differ
Maintenance cost savings may not have been adequately captured
Additional benefits associated with non-police reported crashes
Efficacy may differ based on crash severity
Efficacy relies on effective introduction and following driver-coaching protocols
Assumed all vehicle systems were functioning as intended and drivers responded appropriately to alerts/warnings
74
Jeffrey Hickman, Ph.D.
Virginia Tech Transportation Institute
Center for Truck and Bus Safety
540-231-1542


![CANAL [T] Canal Soth Florida](https://img.pdfslide.us/doc/110x75/55cf9803550346d03395034f/canal-t-canal-soth-florida.jpg)