Embed Size (px)
Citation preview
CTP2E User Manual LP101016 Rev 2.00 14 January 2005
CTP2E - LP101016 Rev 2.00 – 14 Jan 2005 MKS Instruments, Spectra Products
2
As part of our continuous product improvement policy, we are always pleased to receive your comments and suggestions about how we should develop our product range. We believe that the manual is an important part of the product and would welcome your feedback particularly relating to any omissions or inaccuracies you may discover. You can send your comments to:- MKS Instruments, Spectra Products Cowley Way Crewe Cheshire CW1 6AG U.K. Tel: +44 1270 250150 Fax: +44 1270 251939 Email: [email protected]
Endura is a trademark of Applied Materials Windows and Windows 95 are trademarks of the Microsoft Corporation.
All other brand or product names are trademarks or registered trademarks of their respective companies.
CTP2E - LP101016 Rev 2.00 – 14 Jan 2005 MKS Instruments, Spectra Products
3
1. Introduction ....................................................................................... 4 2. Overview............................................................................................. 5
2.1 Purpose................................................................................................ 5 2.2 Principles of Operation .......................................................................... 6
3. Getting Started................................................................................... 9 3.1 Starting Process Eye Professional in Automatic Mode .............................. 9 3.2 Responding to Warnings and Alarms .................................................... 12 3.3 Reviewing Reports .............................................................................. 13 3.4 Using manual mode and leak checking ................................................. 14
4. Modules ............................................................................................ 15 4.1 Basic and Common Characteristics ....................................................... 15 4.2 Instrument / Chamber Options ............................................................ 18 4.3 Idle State ........................................................................................... 19 4.4 Pumpdown state ................................................................................. 20 4.5 Base vacuum state.............................................................................. 22 4.6 Process monitoring state ..................................................................... 23 4.7Auto-calibration ................................................................................... 25
5. Introducing Recall ............................................................................ 26 6. Report Writer.................................................................................... 29 7. Module Editor ................................................................................... 35
7.1 Module Specific Notes ......................................................................... 39 7.1.1 HPQ2S on Ti/TiN PVD ................................................................... 39 7.1.2 HPQ2S on Ti, Al PVD..................................................................... 41 7.1.3 V1000B on PVD ............................................................................ 43 7.1.4 HPQ2S on PreClean II................................................................... 45 7.1.4 HPQ2 on PreClean II..................................................................... 47 7.1.5 HPQ2 on Clamped Degas .............................................................. 49 7.1.6 HPQ2 on Orientor Degas ............................................................... 51 7.1.7 HPQ2 on Buffer ............................................................................ 53
CTP2E - LP101016 Rev 2.00 – 14 Jan 2005 MKS Instruments, Spectra Products
4
1. Introduction This document addresses system level use of the MKS Cluster Tool Profiler, Level 2, for the Applied Materials EnduraTM - the CTP 2E. A CTP 2E system comprises a controller, software and one to ten modules. A module is a specific sensor package, on a particular type of chamber and its associated software for automatic operation. This manual is intended to be used in conjunction with, and is supplemental to, the Process Eye Professional Software Manual (LP101015) and the individual manuals for the sensors of the respective modules for a given installed configuration (e.g., the HPQ-2 Manual, PN LP101011). Initial installation and setup information is contained in the Installation Guides for the CTP 2E controller (including Endura configuration) and the specific modules installed. An MKS service representative will generally be involved in initial installation of the system. When it becomes necessary to service or move components of the system, please refer to the safety precautions in each of the sensor manuals before handling any electrical components. The detailed information contained in those manuals is not duplicated here. This manual is designed to assist you in realizing the full potential of your CTP 2E system. It describes the purpose of the system and modules, and reviews each of the features meant to help you manufacture more successfully. The Getting Started section is particularly pertinent for a new user. Detailed explanations of each component follow in the Profiler Module section. Additional sections focus on data retrieval and how to modify the alarm set points and other user adjustable parameters in the Modules.
CTP2E - LP101016 Rev 2.00 – 14 Jan 2005 MKS Instruments, Spectra Products
5
2. Overview 2.1 Purpose The Cluster Tool Profiler provides in-situ monitoring and real-time process control of your Applied Materials Endura System. Use of the CTP2E will facilitate improved Endura utilization and reduce scrap during production. In the simplest terms, the CTP 2E logs and issues real-time warnings and alarms and generates standard summary reports, completely automatically, for those chambers equipped with an appropriate CTP 2E sensor Module. No operator assistance is required during normal tool operation. In the event of certain unsafe or undesirable tool or process conditions, it immediately sends a warning or alarm via the “RGA SECS II interface” to the Endura, which logs and displays the message on the tool console for operator response. An alarm blocks processing subsequent wafers in any chamber with a fault. This provides protection for your Endura and your product on a 24 by 7 basis. This functionality is pre-programmed and is set up on-site by the MKS installation engineer. The CTP 2E also contributes to optimized tool utilization and availability by providing standard summary reports of tool and process performance. These reports include information such as the degree of incoming photo-resist contamination on in-coming wafers, summarized by lot names, over the past month. This visibility provided by this type of in-line inspection report helps to maintain up-stream process quality and reduce avoidable downtime on the Endura. This functionality is pre-programmed and is set up on-site by the MKS installation engineer. While running, the Endura itself is a very reliable tool. Problems occur more often when PM’s are performed. The CTP 2E automatically monitors Endura chambers after PM’s to quickly identify common faults, such as contaminated kits and leaking seals. This real-time feedback to the Equipment Maintenance team often permits them to save many hours in turn-around time. Summary reports of chamber recovery are generated, automatically, for periodic review. This functionality is pre-programmed and is set up on-site by the MKS installation engineer.
CTP2E - LP101016 Rev 2.00 – 14 Jan 2005 MKS Instruments, Spectra Products
6
To ensure reliable data and conclusions, the CTP 2E system employs automatic sensor sensitivity calibration - human assist is no longer required for this routine but critical operation. In addition to completely automatic operation generating real-time alarms, standard summary reports and PM monitoring, the CTP 2E supports post event fault analysis and interactive vacuum system troubleshooting. All the data monitored by the CTP 2E system, including select tool parameters polled via the RGA SECS port, are stored for many months. This permits in-depth review of tool conditions when product failures occur and investigations of possible causes are being carried out. Finally, the QMA sensors of the CTP 2E can be used in a manual mode to perform traditional, interactive vacuum and process troubleshooting. 2.2 Principles of Operation A CTP 2E system is composed of a CTP 2E controller (a control computer running Windows NT and the Process Eye Professional software suite with a SECS link to the Endura), and one or more Modules (each a sensor and electronics, and application-specific programming). The collection of all of the hardware and chamber-specific software to perform the jobs for one Endura chamber is called a Module, such as the ResistTorr module. It comprises an HPQ-2 analyzer in an appropriate vacuum housing mounted on an O/D chamber (i.e., at position E or F). This runs specific software recipes and algorithms to monitor for residual photoresist, capture pump-downs, monitor the base vacuum of the buffer and provide appropriate alarms and reports on all of these vacuum conditions. To perform successfully in an industrial setting, the CTP 2E system must execute its functions with no routine operator assistance. To accomplish this, MKS Instruments has developed an automation package specifically for this targeted environment found on the Applied Materials Endura. To provide the many benefits of the CTP 2E system, it operates a “state engine” that is aware of the conditions in the Endura and can respond to them. This method of operation ensures the safety of the CTP 2E sensors, collection of critical events such as pumpdowns or processing wafers, and the generation of appropriate alarms and reports.
CTP2E - LP101016 Rev 2.00 – 14 Jan 2005 MKS Instruments, Spectra Products
7
The only action required for routine operation is to power up the CTP 2E system. It will automatically establish a SECS link to the Endura, determine the vacuum status of each monitored chamber, connect to each analyzer sensor and bring that particular head up when it is safe to do so. The CTP 2E controller will then automatically run the appropriate recipes as the vacuum chamber steps through each of the states defined for that chamber; such as pumpdown, base vacuum, wafer processing and the “at atmosphere” condition. A substantial set of alarm rules has been preset. If conditions during any of these states occur which violate any of the rules, a warning or alarm is sent to the Endura via the SECS link. It will appear as a yellow or red line message on the main Endura monitor. Additional information regarding the alarm is also shown on the CTP 2E monitor and recorded in its data files. After powering up, the user is no longer required to maintain the functions of the CTP 2E. The primary interaction between the system and user is the process of reviewing summary reports and responding when there are warnings and alarms. There are a few special maintenance procedures, such as mass location tuning or filament changes, that do still require user or service engineer action, but routine sensitivity calibration is now performed automatically. A wealth of information is gathered during the operation of all of the sensors, which is captured by the CTP 2E system. This body of data is reduced into easily understandable graphs by the ReportWriter feature in Process Eye Professional. An integrated scheduler automatically generates reports at regular intervals. The reports may be found on the CTP hard drive (usually D:\) and can be viewed using a Web browser, or printed as desired. Some reports show wafer-by-wafer values for various gases or monitored parameters from the Endura. Others show lot averages for these values or distribution charts covering a specific period of time. These are automatically updated and stored for easy access. The summarized data from each report are also saved in a “.csv” (comma separated variable) file, which can be imported into a spreadsheet for further analysis. The predefined standard reports provide the user with the principle value of information from the system, but custom reports can be obtained using the Report Writer application to summarize other information. In addition to summary reports, the raw data files are available for retrieval and review using the Recall Data function.
CTP2E - LP101016 Rev 2.00 – 14 Jan 2005 MKS Instruments, Spectra Products
8
Alarm settings and the customer can modify other Module set points by using the Module Editor application, but we strongly advise that you consult with an MKS applications specialist for assistance before attempting to make any changes. While the primary mode of operation for the CTP 2E system is automatic mode, individual modules can be used manually by switching the module to “manual” and running a manual recipe, such as leak hunt or Analog scan. The use and creation of these recipes is covered in the Process Eye Professional Manual. The CTP 2E modules include standard “generic manual” recipes that may be modified by the user without adversely affecting automatic operating functions. However, the Leak Hunting recipe should not be modified significantly. NOTE: Do NOT change any data paths, program subdirectories or the computer “name” (network identifier). Doing so will corrupt the database and cause loss of data. Substantial reinstallation and reconfiguration will be required to recover.
CTP2E - LP101016 Rev 2.00 – 14 Jan 2005 MKS Instruments, Spectra Products
9
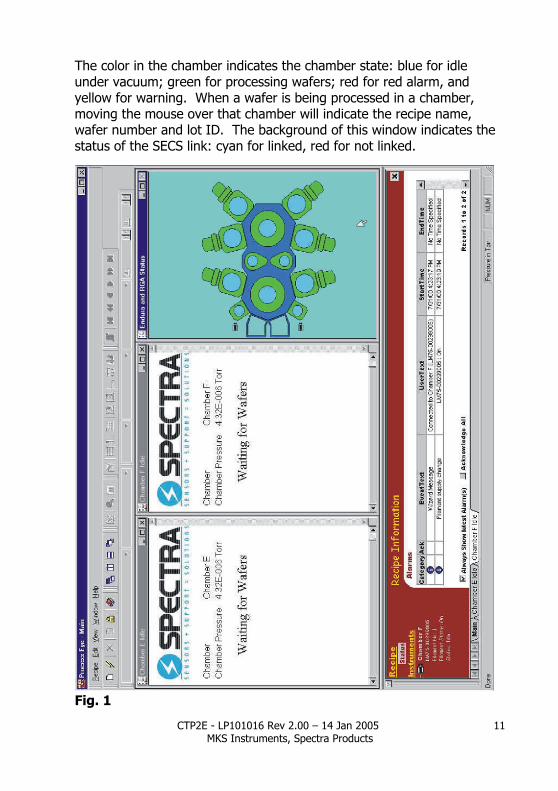
3. Getting Started 3.1 Starting Process Eye Professional in Automatic Mode Be sure all module hardware is properly interconnected and powered up. Then, to start CTP 2E system operation, just start the computer. When power is provided to the control computer of the CTP, the Process Eye Professional and ReportWriter applications will start automatically. If the Process Eye Professional application has been shut down for any reason, you can restart the system by double clicking on the Process Eye Professional desktop icon or selecting Process Eye Professional in the Start menu. The other system software components, including Report Writer and Recall Data, are also found there as well as icons on the desktop. An alternate method to ensure proper restart of all required components is to re-boot the computer. Once the CTP 2E is running in Automatic Mode, there is nothing more the user must do. Each chamber attached to an analyzer is now protected and on a regular basis reports will be generated for your review. However, the interested user can watch a series of steps displayed on the CTP 2E monitor. Figure 1 shows the CTP 2E screen with two Modules in the Idle State. There is a window for each head, scrolling “Waiting for SECS Link”. When appropriate vacuum is sensed for the chamber of each Module, the filament will light. If the chamber is at atmosphere, the “Waiting for Vacuum” message is shown for that chamber. After a pre-programmed filament warm-up time, monitoring can begin. As each module cycles through its various states of operation, corresponding status messages are shown. Each Module has an active window, as does the Endura System. The recipe selection window is on the left of the screen. Information pertaining to the operation of each Module is in the bottom window. The Endura state window shows an outline of the tool. Each chamber with an installed Module has a small sensor icon located near it. The mode of each Module can be changed between Automatic and Manual
CTP2E - LP101016 Rev 2.00 – 14 Jan 2005 MKS Instruments, Spectra Products
10
by right-clicking on the sensor icon and making the appropriate selection.
CTP2E - LP101016 Rev 2.00 – 14 Jan 2005 MKS Instruments, Spectra Products
11
The color in the chamber indicates the chamber state: blue for idle under vacuum; green for processing wafers; red for red alarm, and yellow for warning. When a wafer is being processed in a chamber, moving the mouse over that chamber will indicate the recipe name, wafer number and lot ID. The background of this window indicates the status of the SECS link: cyan for linked, red for not linked.
Fig. 1
CTP2E - LP101016 Rev 2.00 – 14 Jan 2005 MKS Instruments, Spectra Products
12
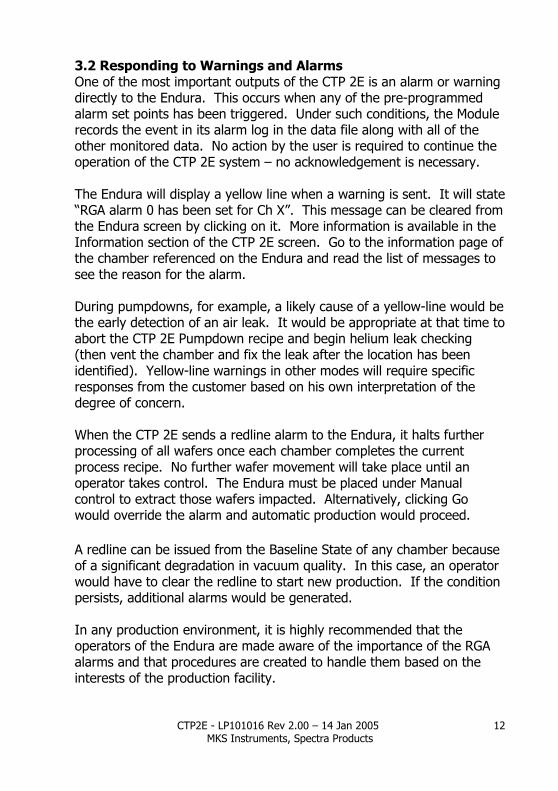
3.2 Responding to Warnings and Alarms One of the most important outputs of the CTP 2E is an alarm or warning directly to the Endura. This occurs when any of the pre-programmed alarm set points has been triggered. Under such conditions, the Module records the event in its alarm log in the data file along with all of the other monitored data. No action by the user is required to continue the operation of the CTP 2E system – no acknowledgement is necessary. The Endura will display a yellow line when a warning is sent. It will state “RGA alarm 0 has been set for Ch X”. This message can be cleared from the Endura screen by clicking on it. More information is available in the Information section of the CTP 2E screen. Go to the information page of the chamber referenced on the Endura and read the list of messages to see the reason for the alarm. During pumpdowns, for example, a likely cause of a yellow-line would be the early detection of an air leak. It would be appropriate at that time to abort the CTP 2E Pumpdown recipe and begin helium leak checking (then vent the chamber and fix the leak after the location has been identified). Yellow-line warnings in other modes will require specific responses from the customer based on his own interpretation of the degree of concern. When the CTP 2E sends a redline alarm to the Endura, it halts further processing of all wafers once each chamber completes the current process recipe. No further wafer movement will take place until an operator takes control. The Endura must be placed under Manual control to extract those wafers impacted. Alternatively, clicking Go would override the alarm and automatic production would proceed. A redline can be issued from the Baseline State of any chamber because of a significant degradation in vacuum quality. In this case, an operator would have to clear the redline to start new production. If the condition persists, additional alarms would be generated. In any production environment, it is highly recommended that the operators of the Endura are made aware of the importance of the RGA alarms and that procedures are created to handle them based on the interests of the production facility.
CTP2E - LP101016 Rev 2.00 – 14 Jan 2005 MKS Instruments, Spectra Products
13
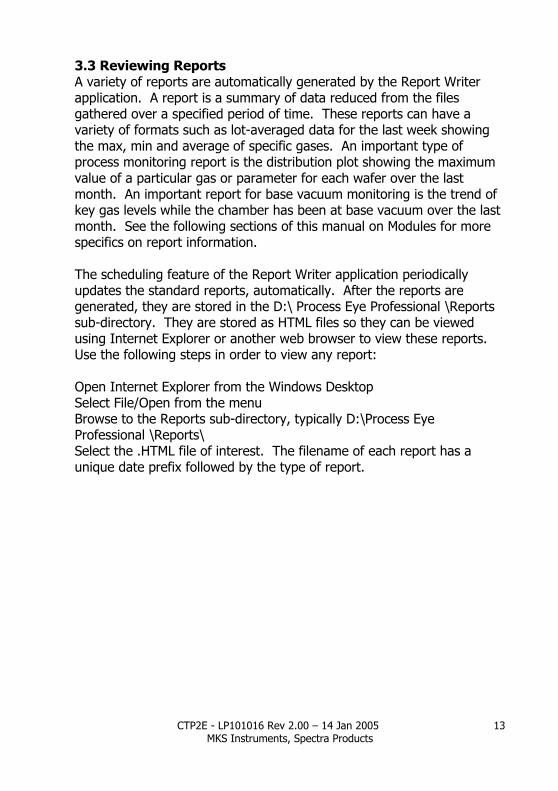
3.3 Reviewing Reports A variety of reports are automatically generated by the Report Writer application. A report is a summary of data reduced from the files gathered over a specified period of time. These reports can have a variety of formats such as lot-averaged data for the last week showing the max, min and average of specific gases. An important type of process monitoring report is the distribution plot showing the maximum value of a particular gas or parameter for each wafer over the last month. An important report for base vacuum monitoring is the trend of key gas levels while the chamber has been at base vacuum over the last month. See the following sections of this manual on Modules for more specifics on report information. The scheduling feature of the Report Writer application periodically updates the standard reports, automatically. After the reports are generated, they are stored in the D:\ Process Eye Professional \Reports sub-directory. They are stored as HTML files so they can be viewed using Internet Explorer or another web browser to view these reports. Use the following steps in order to view any report: Open Internet Explorer from the Windows Desktop Select File/Open from the menu Browse to the Reports sub-directory, typically D:\Process Eye Professional \Reports\ Select the .HTML file of interest. The filename of each report has a unique date prefix followed by the type of report.
CTP2E - LP101016 Rev 2.00 – 14 Jan 2005 MKS Instruments, Spectra Products
14
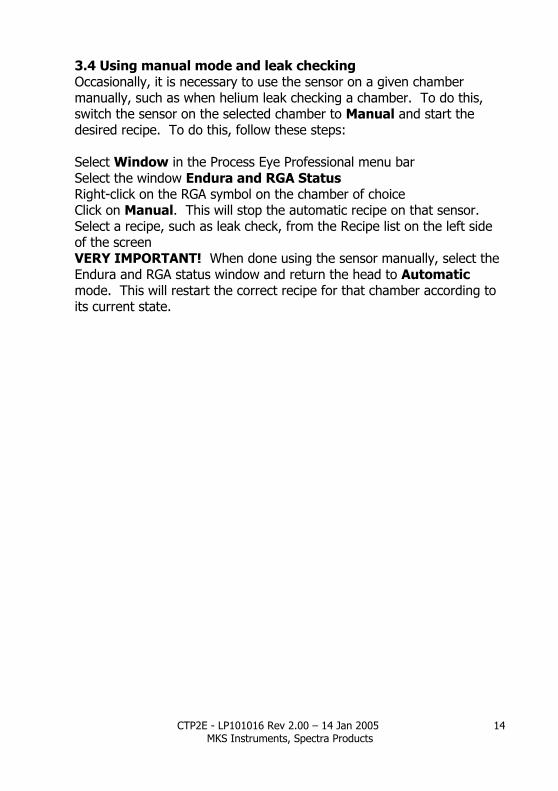
3.4 Using manual mode and leak checking Occasionally, it is necessary to use the sensor on a given chamber manually, such as when helium leak checking a chamber. To do this, switch the sensor on the selected chamber to Manual and start the desired recipe. To do this, follow these steps: Select Window in the Process Eye Professional menu bar Select the window Endura and RGA Status Right-click on the RGA symbol on the chamber of choice Click on Manual. This will stop the automatic recipe on that sensor. Select a recipe, such as leak check, from the Recipe list on the left side of the screen VERY IMPORTANT! When done using the sensor manually, select the Endura and RGA status window and return the head to Automatic mode. This will restart the correct recipe for that chamber according to its current state.
CTP2E - LP101016 Rev 2.00 – 14 Jan 2005 MKS Instruments, Spectra Products
15
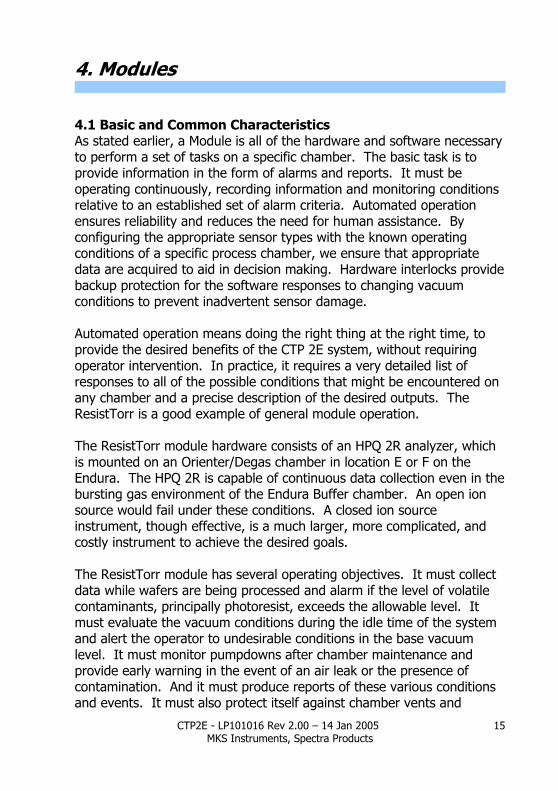
4. Modules 4.1 Basic and Common Characteristics As stated earlier, a Module is all of the hardware and software necessary to perform a set of tasks on a specific chamber. The basic task is to provide information in the form of alarms and reports. It must be operating continuously, recording information and monitoring conditions relative to an established set of alarm criteria. Automated operation ensures reliability and reduces the need for human assistance. By configuring the appropriate sensor types with the known operating conditions of a specific process chamber, we ensure that appropriate data are acquired to aid in decision making. Hardware interlocks provide backup protection for the software responses to changing vacuum conditions to prevent inadvertent sensor damage. Automated operation means doing the right thing at the right time, to provide the desired benefits of the CTP 2E system, without requiring operator intervention. In practice, it requires a very detailed list of responses to all of the possible conditions that might be encountered on any chamber and a precise description of the desired outputs. The ResistTorr is a good example of general module operation. The ResistTorr module hardware consists of an HPQ 2R analyzer, which is mounted on an Orienter/Degas chamber in location E or F on the Endura. The HPQ 2R is capable of continuous data collection even in the bursting gas environment of the Endura Buffer chamber. An open ion source would fail under these conditions. A closed ion source instrument, though effective, is a much larger, more complicated, and costly instrument to achieve the desired goals. The ResistTorr module has several operating objectives. It must collect data while wafers are being processed and alarm if the level of volatile contaminants, principally photoresist, exceeds the allowable level. It must evaluate the vacuum conditions during the idle time of the system and alert the operator to undesirable conditions in the base vacuum level. It must monitor pumpdowns after chamber maintenance and provide early warning in the event of an air leak or the presence of contamination. And it must produce reports of these various conditions and events. It must also protect itself against chamber vents and
CTP2E - LP101016 Rev 2.00 – 14 Jan 2005 MKS Instruments, Spectra Products
16
calibrate itself against the chambers pressure manometers. This must be done day and night without human assistance. The ResistTorr Module accomplishes these tasks in response to specific events. When the CTP 2E computer is turned on, assuming power to the analyzer heads is available and all cables are connected, a SECS link is established to the Endura. The chamber pressure is monitored and, when appropriate, the sensor filament is turned on. Data collection is delayed until after a suitable warm up time has elapsed for the sensor to stabilize. The module then enters the Idle State, waiting for wafers or a chamber vent. As long as no wafer motion is detected, the head will enter the Base Vacuum State every hour and scan the base vacuum environment several seconds to accumulate a record of base vacuum conditions. Alarm criteria that are specific for the Buffer chamber are used so that when any unacceptable vacuum condition exists, a warning or alarm is sent to the Endura screen and a more detailed message sent to the CTP monitor. All data are stored for inclusion in the base vacuum summary reports. At weekly intervals, the sensor sensitivity is calibrated against the Buffer chamber ion gauge and corrects its output to match. This ensures that any trend observed in the data is the result of change in the actual vacuum conditions, not a change in the sensitivity of the sensor. If the head sensitivity degrades beyond a reasonable amount, a warning is generated alerting the owner to the need for maintenance on the system. When a slit valve from either load lock cycles, the ResistTorr enters the Process Monitoring State. This recipe calculates the PR Index for each wafer - a measure of “dirtiness”. As each wafer enters the O/D chamber and the degas process is run, a message from the Endura is received which contains the Lot ID, the load lock of origin, the cassette slot from which it came, and the process recipe name. This information is stored in a database so that future reports may be linked to this information and correlated. The Process Monitor recipe will run for as long as wafers are cycled. Twenty minutes after the last slit valve cycle, the recipe will be halted and the module returns to the idle state. When the Buffer gate valve is closed, the filament is turned off (by software with a backup hardware interlock sensing the pneumatic
CTP2E - LP101016 Rev 2.00 – 14 Jan 2005 MKS Instruments, Spectra Products
17
control of the gate valve). If the chamber pressure exceeds 300 Torr, the Module logs the chamber as vented to the Atmosphere State. When the pressure next drops and the gate valve opens, the Module enters the Pumpdown State. The rate of fall of gases is monitored and, in the event of abnormal behaviour, a warning is sent to the Endura. The characteristics of the pumpdown are logged for summary reports of chamber turnaround performance. When base vacuum is reached, the Module returns to the Idle State. The cycle repeats: periodic baseline scans; auto calibration; process monitoring; and pumpdown monitoring to provide full time fault detection. For each type of Module, the details of when a filament is turned on or off, or how many scans are taken during a baseline monitor recipe, or what level of oxygen is tolerable during processing are all set with default values based on typical or conservative performance expectations. This allows a new CTP to be installed at a customer site and immediately begin doing its job. All the key variables that control Module behavior are accessible by the customer using a feature called the Module Editor. The Editor allows easy review and modification of the alarm limits and other related parameters. It is strongly recommended that the customer contact a MKS Applications Support Engineer for advice prior to modifying any of these variables. In addition to alarm set points, there are many control parameters which impact the safe operation of the sensor and the quality of data gathered. On a daily basis, summary reports are automatically updated. In the case of ResistTorr Module described above, plots summarize the preceding seven days performance of the PR IndexTM for each wafer and for the average of each lot versus time, as well as a frequency distribution of the number of wafers versus PR Index level. Once a week, the weekly report is permanently stored and a summary of the preceding month is updated. Once a month, the monthly summary is permanently saved.
CTP2E - LP101016 Rev 2.00 – 14 Jan 2005 MKS Instruments, Spectra Products
18
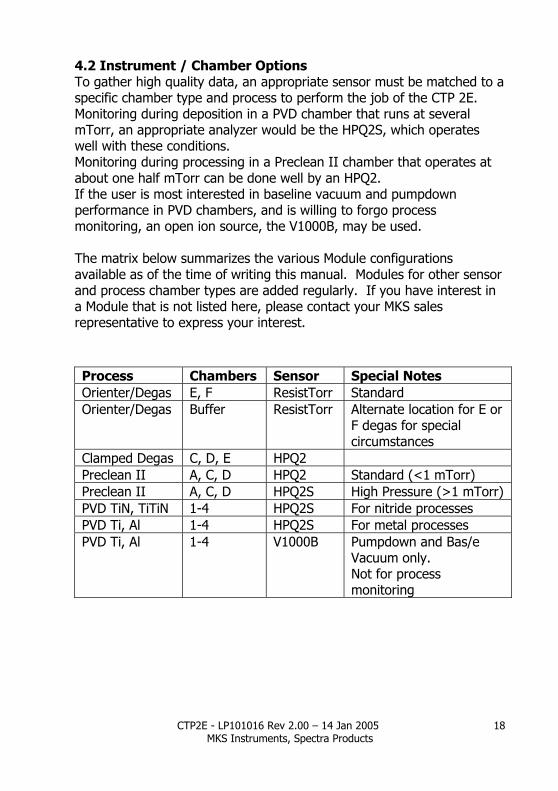
4.2 Instrument / Chamber Options To gather high quality data, an appropriate sensor must be matched to a specific chamber type and process to perform the job of the CTP 2E. Monitoring during deposition in a PVD chamber that runs at several mTorr, an appropriate analyzer would be the HPQ2S, which operates well with these conditions. Monitoring during processing in a Preclean II chamber that operates at about one half mTorr can be done well by an HPQ2. If the user is most interested in baseline vacuum and pumpdown performance in PVD chambers, and is willing to forgo process monitoring, an open ion source, the V1000B, may be used. The matrix below summarizes the various Module configurations available as of the time of writing this manual. Modules for other sensor and process chamber types are added regularly. If you have interest in a Module that is not listed here, please contact your MKS sales representative to express your interest. Process Chambers Sensor Special Notes Orienter/Degas E, F ResistTorr Standard Orienter/Degas Buffer ResistTorr Alternate location for E or
F degas for special circumstances
Clamped Degas C, D, E HPQ2 Preclean II A, C, D HPQ2 Standard (<1 mTorr) Preclean II A, C, D HPQ2S High Pressure (>1 mTorr) PVD TiN, TiTiN 1-4 HPQ2S For nitride processes PVD Ti, Al 1-4 HPQ2S For metal processes PVD Ti, Al 1-4 V1000B Pumpdown and Bas/e
Vacuum only. Not for process monitoring
CTP2E - LP101016 Rev 2.00 – 14 Jan 2005 MKS Instruments, Spectra Products
19
4.3 Idle State The Idle State is the first one the module enters when it is turned on. Despite its name, this is an active state for the CTP 2E during which time the Endura is being monitored for events or times that will initiate the next state of Module operation. Filament turn on, warm up and stabilization sequences are initiated and controlled in the Idle State. Idle automatically initiate actions such as auto-calibration, base vacuum scanning and process monitoring when appropriate. Data is not recorded during the Idle State, but the Endura vacuum conditions are continuously monitored to provide filament protection. The Module Editor allows review and modification of a number of Idle State variables. The Editor has a detailed help section that explains each of the variables available for modification. Here are a few of the variables the customer might wish to understand. Please refer to the Module Editor Help section for more detail. As with all other states, we strongly recommend that you contact an MKS Applications Support Engineer for advice prior to modifying any of these variables. Calibration interval: The frequency at which auto-calibration will be performed. It varies with specific modules, but is typically set for every 7 days. Filament turn on (or “trip”) pressures: The software limits at which the filament operation is controlled. They are appropriate to the type of sensor used. Note that there are also mechanical filament protection circuits that operate independently from the software. Filament warm up and stabilisation times: The delay times between turning on a filament and progressing to a monitoring State. The times are dependent upon the current and prior sensor and vacuum conditions, such as whether the chamber has just been at atmosphere or at base vacuum. Baseline intervals: Two settings for the times the Baseline recipe should be run. First, the time after entering the Idle State and second, the time between subsequent Baseline scans.
CTP2E - LP101016 Rev 2.00 – 14 Jan 2005 MKS Instruments, Spectra Products
20
4.4 Pumpdown state All current Modules monitor chamber conditions during pumpdown from atmosphere. The primary purpose for this is to provide early warning of a condition, such as an air leak, that would prevent the chamber from reaching base vacuum in the required time. This feature allows the user to save substantial time by detecting conditions in minutes that would otherwise take many hours to detect based on total pressure alone. The Pumpdown State is activated when the gate valve opens after a chamber has cycled above its “at Atmosphere” pressure set point. If the Module observes an air leak or a high contamination level, a yellow warning message will appear on the Endura screen indicating an “RGA fault” from that chamber. The CTP 2E monitor-screen will provide additional detail so that the appropriate corrective action can be taken. For example, if an air leak is observed, the Module can be switched to Manual mode and used as a helium leak hunter to find the leak. Or, if high contamination levels are present, the chamber should be vented to find the contamination source, such as an IPA bottle or the ubiquitous lint free rag. During pumpdown monitoring, the Module monitors the bake-out lamp drive signal through the SECS link to the Endura. It suspends the alarm level presets for contamination immediately after lamps have been turned on and re-enables them after a cool-down period has elapsed. The Pumpdown recipe ends after achieving the base vacuum set point, indicating a successful pumpdown. If chamber pressure exceeds a set point pressure during the pumpdown, or if the base vacuum is not achieved within the specified time, the pumpdown is considered to have “failed”. Thus, if a leak is observed and the chamber is vented to effect a repair, the initial pumpdown is marked unsuccessful. The subsequent pumpdown is considered a new pumpdown, which will also either fail or succeed, and a separate data file is generated for it. Several Pumpdown reports are generated based on the data gathered by this Module, automatically. Several of these show the times required to achieve base vacuum for all of the pumpdowns that have occurred over the last year. Pumpdowns are successful or not based upon whether they have achieved a base vacuum value within a stipulated time or not. These reports can be utilized to establish realistic target values for expected pumpdown performance. By monitoring actual results, the best practices for minimizing pumpdown time can be determined.
CTP2E - LP101016 Rev 2.00 – 14 Jan 2005 MKS Instruments, Spectra Products
21
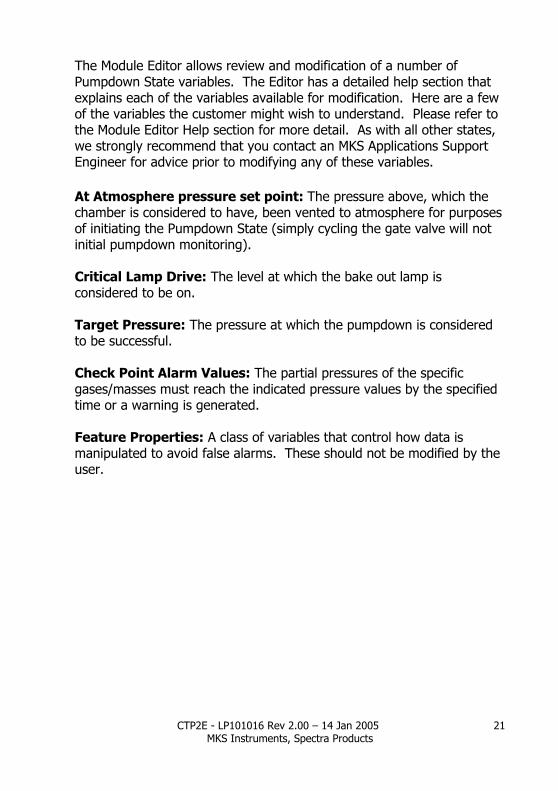
The Module Editor allows review and modification of a number of Pumpdown State variables. The Editor has a detailed help section that explains each of the variables available for modification. Here are a few of the variables the customer might wish to understand. Please refer to the Module Editor Help section for more detail. As with all other states, we strongly recommend that you contact an MKS Applications Support Engineer for advice prior to modifying any of these variables. At Atmosphere pressure set point: The pressure above, which the chamber is considered to have, been vented to atmosphere for purposes of initiating the Pumpdown State (simply cycling the gate valve will not initial pumpdown monitoring). Critical Lamp Drive: The level at which the bake out lamp is considered to be on. Target Pressure: The pressure at which the pumpdown is considered to be successful. Check Point Alarm Values: The partial pressures of the specific gases/masses must reach the indicated pressure values by the specified time or a warning is generated. Feature Properties: A class of variables that control how data is manipulated to avoid false alarms. These should not be modified by the user.
CTP2E - LP101016 Rev 2.00 – 14 Jan 2005 MKS Instruments, Spectra Products
22
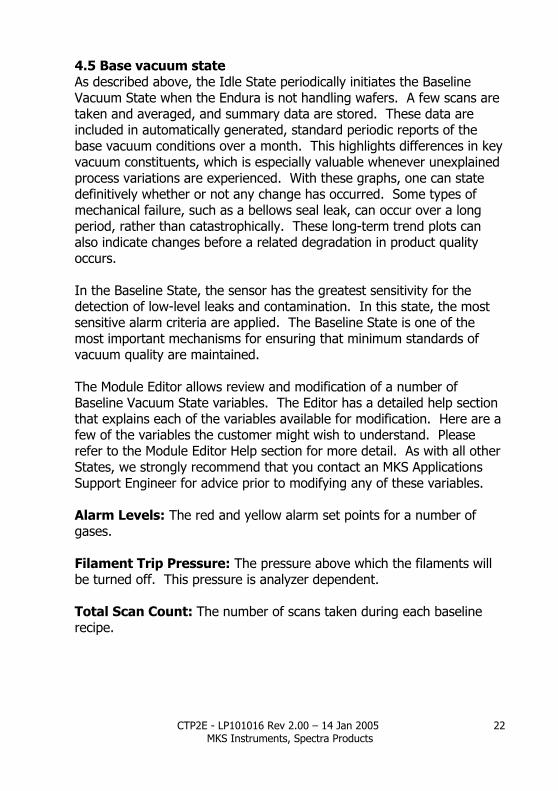
4.5 Base vacuum state As described above, the Idle State periodically initiates the Baseline Vacuum State when the Endura is not handling wafers. A few scans are taken and averaged, and summary data are stored. These data are included in automatically generated, standard periodic reports of the base vacuum conditions over a month. This highlights differences in key vacuum constituents, which is especially valuable whenever unexplained process variations are experienced. With these graphs, one can state definitively whether or not any change has occurred. Some types of mechanical failure, such as a bellows seal leak, can occur over a long period, rather than catastrophically. These long-term trend plots can also indicate changes before a related degradation in product quality occurs. In the Baseline State, the sensor has the greatest sensitivity for the detection of low-level leaks and contamination. In this state, the most sensitive alarm criteria are applied. The Baseline State is one of the most important mechanisms for ensuring that minimum standards of vacuum quality are maintained. The Module Editor allows review and modification of a number of Baseline Vacuum State variables. The Editor has a detailed help section that explains each of the variables available for modification. Here are a few of the variables the customer might wish to understand. Please refer to the Module Editor Help section for more detail. As with all other States, we strongly recommend that you contact an MKS Applications Support Engineer for advice prior to modifying any of these variables. Alarm Levels: The red and yellow alarm set points for a number of gases. Filament Trip Pressure: The pressure above which the filaments will be turned off. This pressure is analyzer dependent. Total Scan Count: The number of scans taken during each baseline recipe.
CTP2E - LP101016 Rev 2.00 – 14 Jan 2005 MKS Instruments, Spectra Products
23
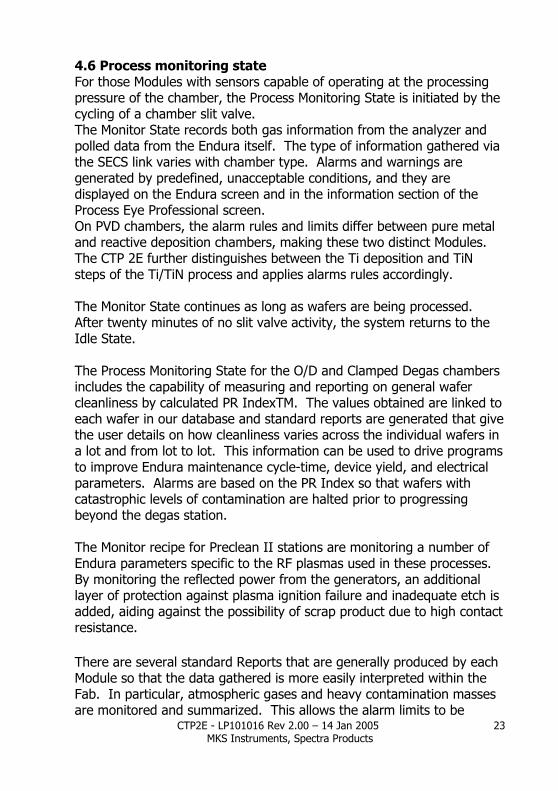
4.6 Process monitoring state For those Modules with sensors capable of operating at the processing pressure of the chamber, the Process Monitoring State is initiated by the cycling of a chamber slit valve. The Monitor State records both gas information from the analyzer and polled data from the Endura itself. The type of information gathered via the SECS link varies with chamber type. Alarms and warnings are generated by predefined, unacceptable conditions, and they are displayed on the Endura screen and in the information section of the Process Eye Professional screen. On PVD chambers, the alarm rules and limits differ between pure metal and reactive deposition chambers, making these two distinct Modules. The CTP 2E further distinguishes between the Ti deposition and TiN steps of the Ti/TiN process and applies alarms rules accordingly. The Monitor State continues as long as wafers are being processed. After twenty minutes of no slit valve activity, the system returns to the Idle State. The Process Monitoring State for the O/D and Clamped Degas chambers includes the capability of measuring and reporting on general wafer cleanliness by calculated PR IndexTM. The values obtained are linked to each wafer in our database and standard reports are generated that give the user details on how cleanliness varies across the individual wafers in a lot and from lot to lot. This information can be used to drive programs to improve Endura maintenance cycle-time, device yield, and electrical parameters. Alarms are based on the PR Index so that wafers with catastrophic levels of contamination are halted prior to progressing beyond the degas station. The Monitor recipe for Preclean II stations are monitoring a number of Endura parameters specific to the RF plasmas used in these processes. By monitoring the reflected power from the generators, an additional layer of protection against plasma ignition failure and inadequate etch is added, aiding against the possibility of scrap product due to high contact resistance. There are several standard Reports that are generally produced by each Module so that the data gathered is more easily interpreted within the Fab. In particular, atmospheric gases and heavy contamination masses are monitored and summarized. This allows the alarm limits to be
CTP2E - LP101016 Rev 2.00 – 14 Jan 2005 MKS Instruments, Spectra Products
24
evaluated and adjusted for the conditions that can vary from Fab site to site, and to correlate with other measured parameters gathered along the production flow. The Module Editor provides access to two pages of parameters for the Process module. We strongly advise against making any changes on the first page, Monitor Settings. The second page, labeled Contamination, contains the set points for the yellow and red line alarms. There are settings for reactive and non-reactive deposition processes. Modification of these levels should be based on actual observation of the processes run in the user’s plant. Here again, as with all other Module States, we strongly recommended that you contact a MKS Applications Support Engineer for advice prior to modifying any of these variables. The Module Editor section below also describes how to enable and disable sending any of these warnings and alarms to the Endura and how to send redline alarms as if they were only yellow-line warnings during initial use.
CTP2E - LP101016 Rev 2.00 – 14 Jan 2005 MKS Instruments, Spectra Products
25
4.7Auto-calibration Auto-calibration is a unique Module State because it is not driven by a vacuum state of the Endura; rather, it is a maintenance routine for the analyzer. It runs after the specified time since the last auto-calibration, immediately following the Baseline Vacuum State, when the vacuum conditions are stable. If calibration is unsuccessful, it will be run again at the next opportunity. For most modules, auto calibration also takes place during process monitoring steps, but not for the ResistTorr. The ResistTorr performs automatic calibration checking while in the Process Monitoring State. The calibration performed is specifically a sensitivity calibration. The output of the analyzer is adjusted so that the total pressure, as calculated by the analyzer (the sum of the major currents in a scan), matches the reading from the chamber gauge obtained via the SECS link. This procedure is vital in maintaining the quality of data presented to the user. If the analyzer sensitivity was allowed to go uncorrected over time, data trends may be misinterpreted as actual pressure trends in the process. The automatic, periodic operation of this state ensures that good data are being acquired. In addition to correcting for sensitivity drift, the auto-calibration routine will alert the operator in the event of unacceptable sensitivity loss that cannot be compensated by software. Calibration results are logged and viewable using the Recall function. It is strongly recommended that the customer do not modify the settings for the calibration routines. We strongly recommend that you contact an MKS Applications Support Engineer for advice prior to modifying any of these variables.
CTP2E - LP101016 Rev 2.00 – 14 Jan 2005 MKS Instruments, Spectra Products
26
5. Introducing Recall During automatic operation, the CTP 2E stores the data from its various monitoring recipes. There are four basic types of recipes for most Modules: the pump-down; base vacuum; process monitoring; and auto sensitivity calibration. Each time a recipe runs, it creates its own data file. These data files are stored under a subdirectory for that recipe of that Module. A user can use Windows Explorer to locate these files in the data drive, D:\. Examples of typical paths are:
D:\Process Eye 2000\Data\Chamber 1 Baseline\ D:\Process Eye 2000\Data\Chamber C Monitor\ D:\Process Eye 2000\Data\Chamber D Pumpdown\ D:\Process Eye 2000\Data\Chamber 2 Calibration\
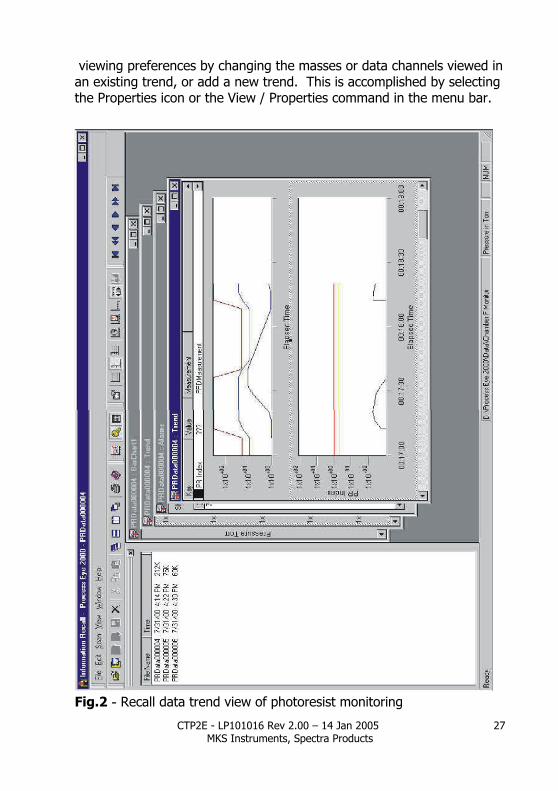
To access the data files, Double click the Recall icon (or select Start Menu, Programs, Process Eye Professional, and Recall). Then, select File/Open from the menu bar of the Recall program, and Select the data file by using the browser and double clicking the desired file. This will bring up the stored data, which may include several windows such as trends, bar charts, and alarm pages. Details of how to manipulate the appearances of the displayed data are provided in the the Process Eye Professional - Recall manual. The customer is strongly encouraged to read the Process Eye Professional manual to develop skills in the advanced use of their System. It is addressed here to point out some of the ways the Recall functions can be used to aid the owner of a CTP 2E. A “trend” is a view of selected mass peaks or data channels displayed versus time (Figure 2). This is the preferred view for displaying process dynamics, such as a process chamber while wafers are entering and leaving. Any mass or data channel stored by the recipe can be viewed, even if it was not displayed while the recipe was running. In this case, edit the
CTP2E - LP101016 Rev 2.00 – 14 Jan 2005 MKS Instruments, Spectra Products
27
viewing preferences by changing the masses or data channels viewed in an existing trend, or add a new trend. This is accomplished by selecting the Properties icon or the View / Properties command in the menu bar.
Fig.2 - Recall data trend view of photoresist monitoring
CTP2E - LP101016 Rev 2.00 – 14 Jan 2005 MKS Instruments, Spectra Products
28
Once a view has been created that shows particular details of interest, additional files in the same directory can be easily viewed by stepping through them using the up/down arrow keys in the Task bar. To scan for deviations from the normal, such as oxygen level during a sputter etch, create a view displaying oxygen in one of the files at the beginning or end of the time period of interest. Then step through the series of files to see the range of variation and possible patterns in the variation versus time. Another feature in the Recall application is the Save Data command under the File item of the Menu bar. This copies the binary data in the file to a new, tab-delimited text file of the data. This text file can be viewed using any text editor, such as Note Pad, or better, by a spreadsheet application such as Microsoft Excel. This is a very powerful capability. When opening the file using Excel, it uses a short wizard to format the information into columns and rows. Select the default, tab delimiting, from the options. Once the file is opened, all of the usual Excel functions can be applied to create graphs or determine statistically relevant parameters within the data.
CTP2E - LP101016 Rev 2.00 – 14 Jan 2005 MKS Instruments, Spectra Products
29
6. Report Writer ReportWriter is a powerful data-mining engine. It generates standard reports on a regular basis specific to each of the CTP 2E Modules. It can also be used to create custom reports based on the unique interests of the user. The customer is strongly encouraged to read the ReportWriter Manual for a complete set of instructions on how this powerful application can be used. This description highlights a few of the ways it can be used to aid the user in understanding his vacuum environment. A report is a summary of filtered data from the raw data files created during the operation of each specific Module. To understand how data can be filtered, it is important to understand the types of data being stored. Most Modules store the following data file types:
Baseline and Baseline Summary files Pumpdown files Monitor files Calibration Files
Each type of file is stored in a separate subdirectory and each has a distinct set of reports. To review vacuum conditions during chamber idle times, the reports compile the data in the Baseline Summary files. The data in these files contain no references to wafers, since no wafers are processed under these chamber conditions. Process Monitoring files, however, are linked to the database of starts and ends of wafers and process recipes. This data can be summarized to display wafer or Lot Ids. Reports created from Pumpdown files are summaries of the time to completion of these pumpdowns. The individual mass channels are not shown but may be viewed using the Recall application on each individual Pumpdown data file.
CTP2E - LP101016 Rev 2.00 – 14 Jan 2005 MKS Instruments, Spectra Products
30
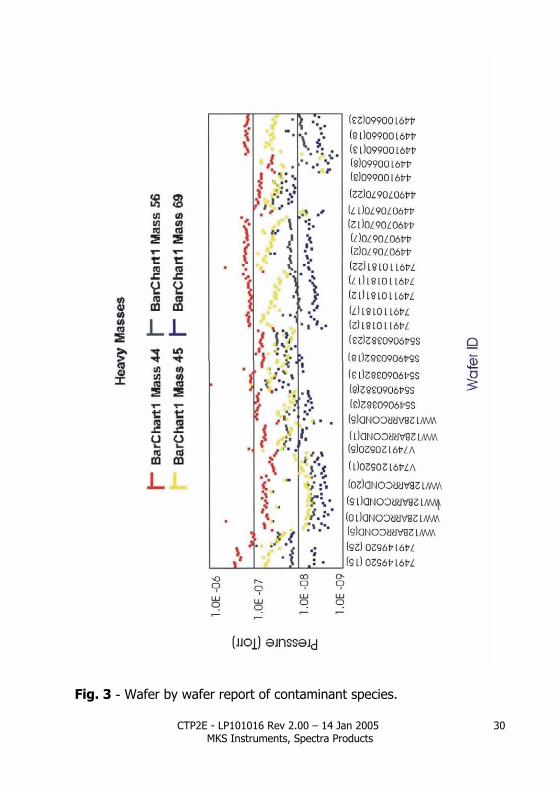
Fig. 3 - Wafer by wafer report of contaminant species.
CTP2E - LP101016 Rev 2.00 – 14 Jan 2005 MKS Instruments, Spectra Products
31
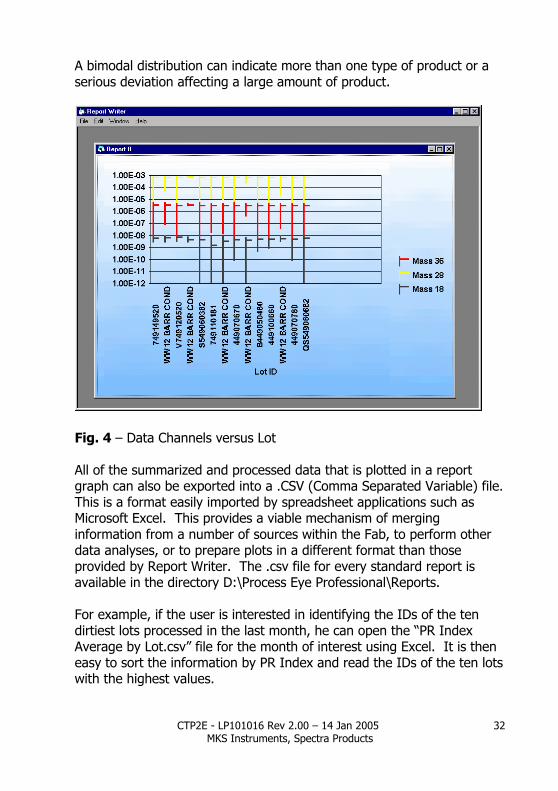
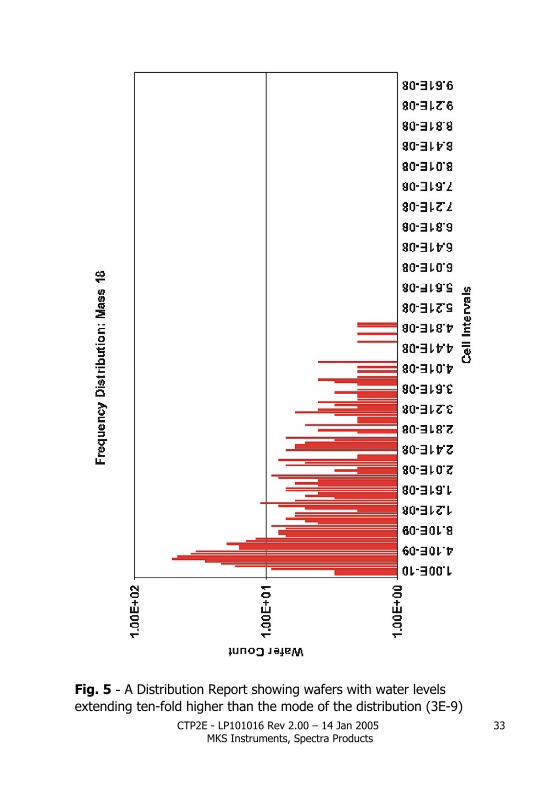
When viewing reports based on Process Monitoring data, two report types are available: wafer-by-wafer; and lot-by-lot. The wafer-level display plots a point, or bar, for each wafer processed in the selected chamber. This is particularly useful for identifying trends across a cassette or phenomenon such as first or last wafer effects (Figure 3). Since many tools process thousands of wafers a week, it is advisable to specify a large number of wafers per graph page. The standard reports typically use 200 wafers per page and only show a single point per wafer - the maximum or average of a particular gas (not max, min and average all at once). Lot-based graphs show the calculated averages for individual lots. This format displays data channels versus the Lot ID (Figure 4). Each time a wafer enters a process chamber, the lot ID is stored in the Process Eye Professional database (the operator enters it into the Endura when linking the Lot ID to the Sequence name). There are far fewer lots than wafers, so a smaller number of lots can be displayed per graph page. At 20 per page, the Lot ID of each lot will be labeled on the X-axis. With more lots per page, all lot data is still shown, but there is not enough room to label all lots so some lot names will not be shown. A Frequency Distribution of the data can also be created. This is normally a wafer-based summary of the data. It shows the number of wafers that have a particular level of the selected data channel. For instance, a frequency distribution of water vapor levels is shown in Figure 5. It shows the number of wafers in the vertical axis and increasing levels of water vapor for these wafers along the horizontal axis. This is a very powerful summary. In a single page, it communicates the current degree process control. Process engineers like to have very little variation in the processing conditions for each wafer. This would be shown in the frequency distribution as a very narrow band with all of the processed wafers being lumped together in this band. If, however, large variation exists, “tails” in the data are readily seen. In the example shown, the tail extends to a full order of magnitude higher than the mode of the distribution. Shifts in the distribution clearly indicate changes in the average levels for a process. These displays give the process engineer visibility of any tails so they can be monitored and, eventually controlled.
CTP2E - LP101016 Rev 2.00 – 14 Jan 2005 MKS Instruments, Spectra Products
32
A bimodal distribution can indicate more than one type of product or a serious deviation affecting a large amount of product.
Fig. 4 – Data Channels versus Lot All of the summarized and processed data that is plotted in a report graph can also be exported into a .CSV (Comma Separated Variable) file. This is a format easily imported by spreadsheet applications such as Microsoft Excel. This provides a viable mechanism of merging information from a number of sources within the Fab, to perform other data analyses, or to prepare plots in a different format than those provided by Report Writer. The .csv file for every standard report is available in the directory D:\Process Eye Professional\Reports. For example, if the user is interested in identifying the IDs of the ten dirtiest lots processed in the last month, he can open the “PR Index Average by Lot.csv” file for the month of interest using Excel. It is then easy to sort the information by PR Index and read the IDs of the ten lots with the highest values.
CTP2E - LP101016 Rev 2.00 – 14 Jan 2005 MKS Instruments, Spectra Products
33
Fig. 5 - A Distribution Report showing wafers with water levels extending ten-fold higher than the mode of the distribution (3E-9)
CTP2E - LP101016 Rev 2.00 – 14 Jan 2005 MKS Instruments, Spectra Products
34
Custom reports can be defined to filter according to cassette slot position or by process recipe name and this information can then be correlated to other information obtained by the fab.
CTP2E - LP101016 Rev 2.00 – 14 Jan 2005 MKS Instruments, Spectra Products
35
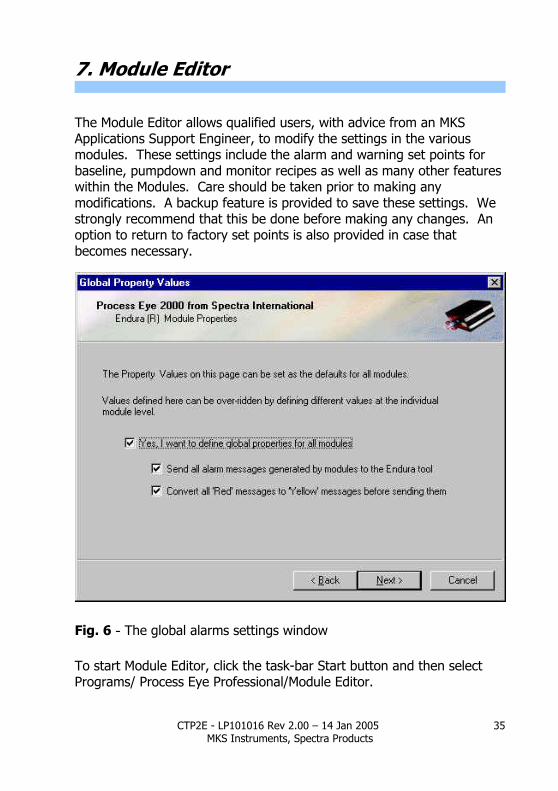
7. Module Editor The Module Editor allows qualified users, with advice from an MKS Applications Support Engineer, to modify the settings in the various modules. These settings include the alarm and warning set points for baseline, pumpdown and monitor recipes as well as many other features within the Modules. Care should be taken prior to making any modifications. A backup feature is provided to save these settings. We strongly recommend that this be done before making any changes. An option to return to factory set points is also provided in case that becomes necessary.
Fig. 6 - The global alarms settings window To start Module Editor, click the task-bar Start button and then select Programs/ Process Eye Professional/Module Editor.
CTP2E - LP101016 Rev 2.00 – 14 Jan 2005 MKS Instruments, Spectra Products
36
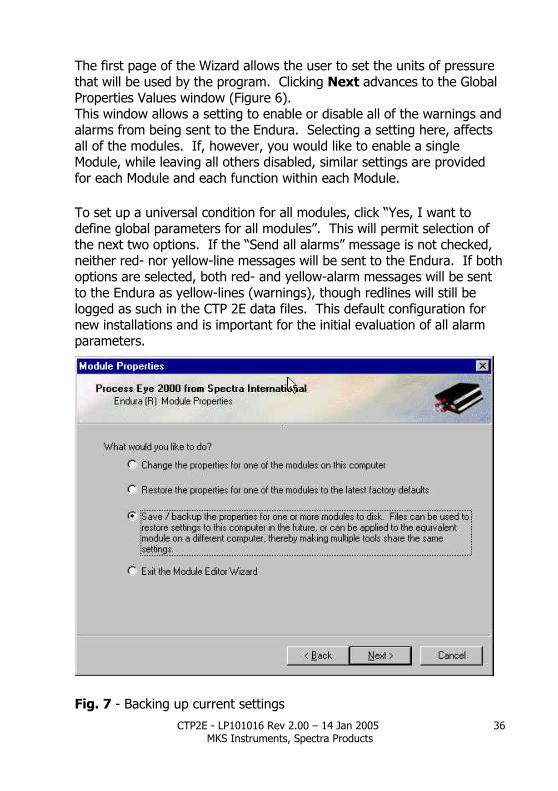
The first page of the Wizard allows the user to set the units of pressure that will be used by the program. Clicking Next advances to the Global Properties Values window (Figure 6). This window allows a setting to enable or disable all of the warnings and alarms from being sent to the Endura. Selecting a setting here, affects all of the modules. If, however, you would like to enable a single Module, while leaving all others disabled, similar settings are provided for each Module and each function within each Module. To set up a universal condition for all modules, click “Yes, I want to define global parameters for all modules”. This will permit selection of the next two options. If the “Send all alarms” message is not checked, neither red- nor yellow-line messages will be sent to the Endura. If both options are selected, both red- and yellow-alarm messages will be sent to the Endura as yellow-lines (warnings), though redlines will still be logged as such in the CTP 2E data files. This default configuration for new installations and is important for the initial evaluation of all alarm parameters.
Fig. 7 - Backing up current settings
CTP2E - LP101016 Rev 2.00 – 14 Jan 2005 MKS Instruments, Spectra Products
37
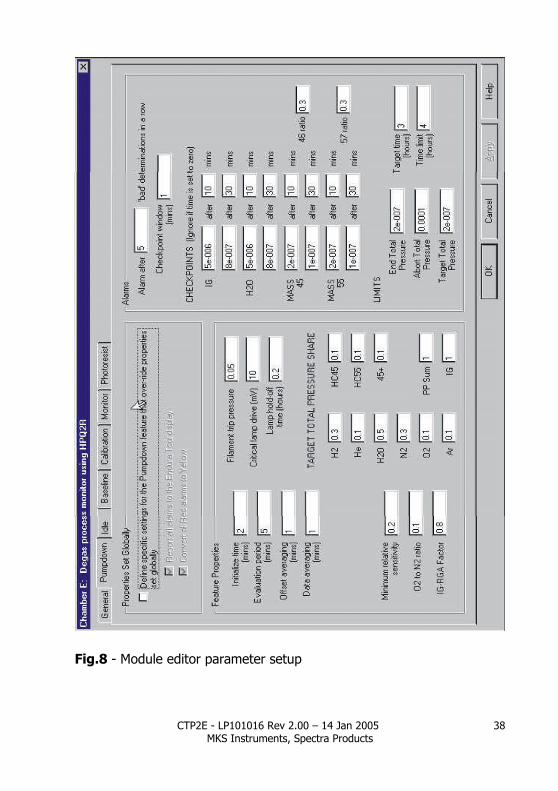
The Module Properties window offers four options to the user. Selecting the first option, Change the settings of one of the Modules on this computer presents a list of all of the Modules currently installed on the system. A reminder window is also displayed asking if you would like to back up the current settings (Figure 7). If this has not been done, you should do so at this point. After selecting a Module, the next three options are presented: The first resets all values in that Module to the factory defaults; The second retains the current settings; And the third allows a new set of parameters to be loaded from a backup file. Settings for the Modules are stored in a properties file with an extension of SI-P in a subdirectory below the Module Editor. When a selection is made and Next is clicked, the Property Values window is presented with the General properties displayed. This is similar to the global parameter page described previously. Selecting Yes (define default global properties here), this Module will operate according to the settings on this page, regardless of the setting on the initial global parameter settings page. Settings in later screens always take precedence over those of earlier screens. This allows redline and yellow-line messages for any Module can be controlled independently from the other Modules and from the global settings. The selection tabs for the setup pages of this screen are shown near the top of this window (Figure 8). These generally include the Idle, Baseline, Pumpdown, Calibration and Monitor (with Contamination) settings. Select a tab to review and edit those settings. Once any settings are changed and the next window is selected, those windows will be saved. The option is then presented to exit the Module Editor, or return to the beginning of the Wizard to select another Module.
CTP2E - LP101016 Rev 2.00 – 14 Jan 2005 MKS Instruments, Spectra Products
38
Fig.8 - Module editor parameter setup
CTP2E - LP101016 Rev 2.00 – 14 Jan 2005 MKS Instruments, Spectra Products
39
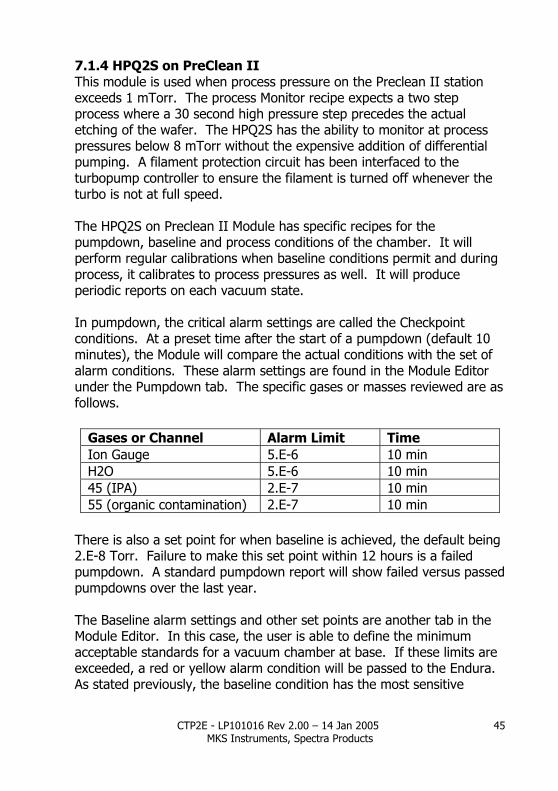
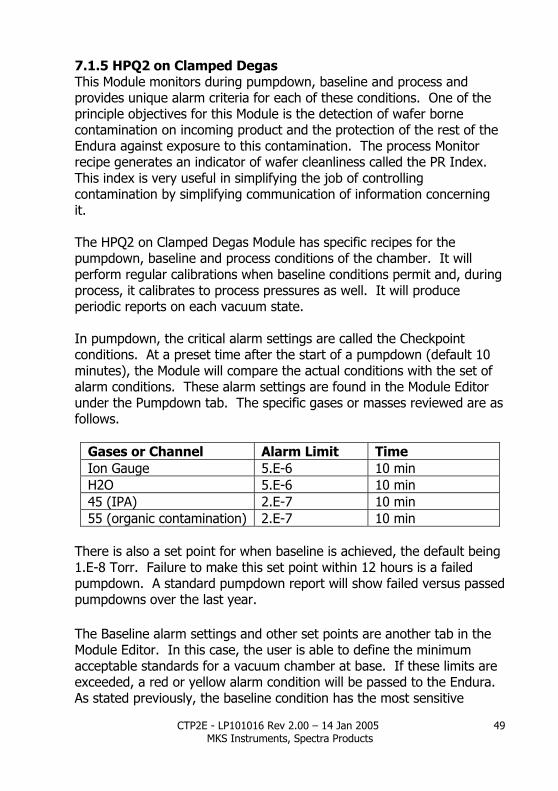
7.1 Module Specific Notes 7.1.1 HPQ2S on Ti/TiN PVD This Module makes use of the pump-free high-pressure monitoring capability of the HPQ2S to observe chamber characteristics even during the PVD process of up to 8 mTorr. It has been packaged with a set of alarm criteria flexible enough to identify the difference between a reactive TiN deposition and an inert titanium deposition. This module is particularly useful in monitoring the purity of both of the process gases likely to be used on the Endura. If the gas delivery system suffers from a leak or is contaminated with a slug of air inadvertently introduced while modifying factory lines, the HPQ2S will be able to identify this event and generate an alarm or warning to minimize product loss. This chamber will see both argon and nitrogen flow and so could offer protection to all process chambers if a limited installation profile prevents the monitoring of all stations. The Ti/TiN Module has specific recipes for the pumpdown, baseline and process conditions of the chamber. It will perform regular calibrations when baseline conditions permit and during process, it calibrates to process pressures as well. It will produce periodic reports on each vacuum state. In pumpdown, the critical alarm settings are called the Checkpoint conditions. At a preset time after the start of a pumpdown (default 10 minutes), the Module will compare the actual conditions with the set of alarm conditions. These alarm settings are found in the Module Editor under the Pumpdown tab. The specific gases or masses reviewed are as follows.
Gases or Channel Alarm Limit Time Ion Gauge 5.E-6 10 min H2O 5.E-6 10 min 45 (IPA) 2.E-7 10 min 55 (organic contamination)
2.E-7 10 min
CTP2E - LP101016 Rev 2.00 – 14 Jan 2005 MKS Instruments, Spectra Products
40
There is also a set point for when baseline is achieved, the default being 1.E-8 Torr. Failure to make this set point within 12 hours is a failed pumpdown. A standard pumpdown report will show failed versus passed pumpdowns over the last year. The Baseline alarm settings and other set points are another tab in the Module Editor. In this case, the user is able to define the minimum acceptable standards for a vacuum chamber at base. If these limits are exceeded, a red or yellow alarm condition will be passed to the Endura. As stated previously, the baseline condition has the most sensitive settings because in this environment the analyzer is most able to identify low levels of contamination. Please review these set points in the Module Editor. A much more elaborate list of gases and ion gauge set points is used than during pump down. The levels of various atmospheric gases, hydrocarbons and fluorocarbons are monitored. The Process Monitor recipe for this Module has alarm settings for both the reactive deposition mode and the non-reactive mode (nitrogen on and nitrogen off). It uses actual gas analysis results to identify which mode is currently being run on the tool. Despite the presence of a nitrogen limit in the TiN section of the Module Editor, this value is not used and no alarm will be generated for the nitrogen present during the nitride step. Again, a variety of gases have set points for alarm generation. Oxygen is a particularly important set point, as the presence of even low amounts of oxygen in a titanium or nitride process may have dramatic impact on film properties such as stress. The Module Editor has two pages of variables for the Monitor State, Monitor and Contamination. Most variables found on the monitor page deal primarily with calibration during process and should not be modified. The exceptions are in Alarm Properties, which sets whether process warnings and alarms are sent to the Endura and, if so, whether redlines are only sent as warnings (yellow-lines). Alarm settings, which will impact the actual operation of the Endura are understandably within the domain of customer interest and are on the Contamination page. Please do not hesitate to contact an MKS Applications Support Engineer for assistance in understanding these alarm set points. Four standard reports are generated on a daily, weekly and monthly basis for the process Monitor data. The information displayed shows
CTP2E - LP101016 Rev 2.00 – 14 Jan 2005 MKS Instruments, Spectra Products
41
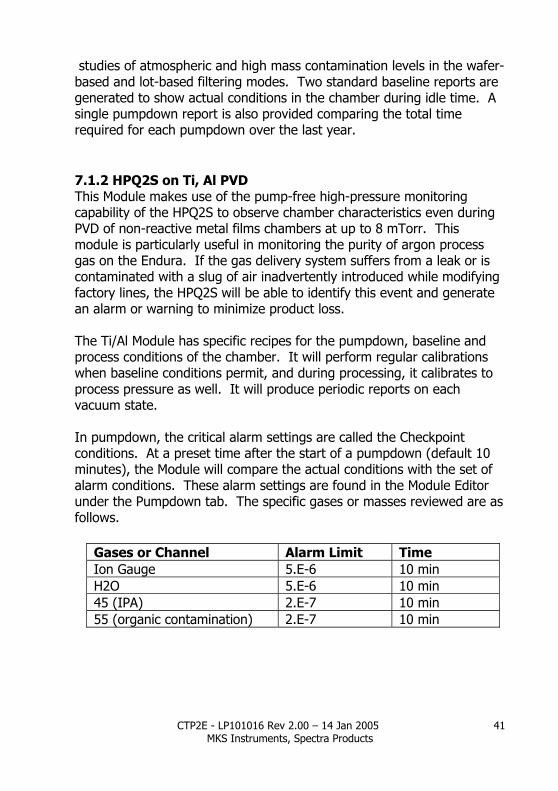
studies of atmospheric and high mass contamination levels in the wafer-based and lot-based filtering modes. Two standard baseline reports are generated to show actual conditions in the chamber during idle time. A single pumpdown report is also provided comparing the total time required for each pumpdown over the last year. 7.1.2 HPQ2S on Ti, Al PVD This Module makes use of the pump-free high-pressure monitoring capability of the HPQ2S to observe chamber characteristics even during PVD of non-reactive metal films chambers at up to 8 mTorr. This module is particularly useful in monitoring the purity of argon process gas on the Endura. If the gas delivery system suffers from a leak or is contaminated with a slug of air inadvertently introduced while modifying factory lines, the HPQ2S will be able to identify this event and generate an alarm or warning to minimize product loss. The Ti/Al Module has specific recipes for the pumpdown, baseline and process conditions of the chamber. It will perform regular calibrations when baseline conditions permit, and during processing, it calibrates to process pressure as well. It will produce periodic reports on each vacuum state. In pumpdown, the critical alarm settings are called the Checkpoint conditions. At a preset time after the start of a pumpdown (default 10 minutes), the Module will compare the actual conditions with the set of alarm conditions. These alarm settings are found in the Module Editor under the Pumpdown tab. The specific gases or masses reviewed are as follows.
Gases or Channel Alarm Limit Time Ion Gauge 5.E-6 10 min H2O 5.E-6 10 min 45 (IPA) 2.E-7 10 min 55 (organic contamination) 2.E-7 10 min
CTP2E - LP101016 Rev 2.00 – 14 Jan 2005 MKS Instruments, Spectra Products
42
There is also a set point for when baseline is achieved, the default being 1.E-8 Torr. Failure to make this set point within 12 hours is a failed pumpdown. A standard pumpdown report will show failed versus passed pumpdowns over the last year. The Baseline alarm settings and other set points are another tab in the Module Editor. In this case, the user is able to define the minimum acceptable standards for a vacuum chamber at base. If these limits are exceeded, a red or yellow alarm condition will be passed to the Endura. As stated previously, the baseline condition has the most sensitive settings because in this environment the analyzer is most able to identify low levels of contamination. Please review these set points in the Module Editor. A much more elaborate list of gases and ion gauge set points is used than during pump down. The levels of various atmospheric gases, hydrocarbons and fluorocarbons are monitored. During processing the Module runs the Monitor recipe. It has been equipped with warning and alarm settings for the light gases, possibly good indicators of cryo pump maintenance cycles, atmospheric contamination levels, important identifiers of potentially catastrophic problems and levels for hydrocarbon and fluorocarbon contamination. These are accessible in the Module Editor. When using the Module Editor, the customer is advised to NOT modify the settings found on the Monitor page. These are primarily related to calibration at process pressure. The exceptions are in Alarm Properties, which sets whether process warnings and alarms are sent to the Endura and, if so, whether redlines are only sent as warnings (yellow-lines). The alarm set points are found on the Contamination page. Four standard reports are generated on a daily, weekly and monthly basis for the process Monitor data. The information displayed shows studies of atmospheric and high mass contamination levels in the wafer-based and lot-based filtering modes. Two standard baseline reports are generated to show actual conditions in the chamber during idle time. A single pumpdown report is also provided comparing the total time required for each pumpdown over the last year.
CTP2E - LP101016 Rev 2.00 – 14 Jan 2005 MKS Instruments, Spectra Products
43
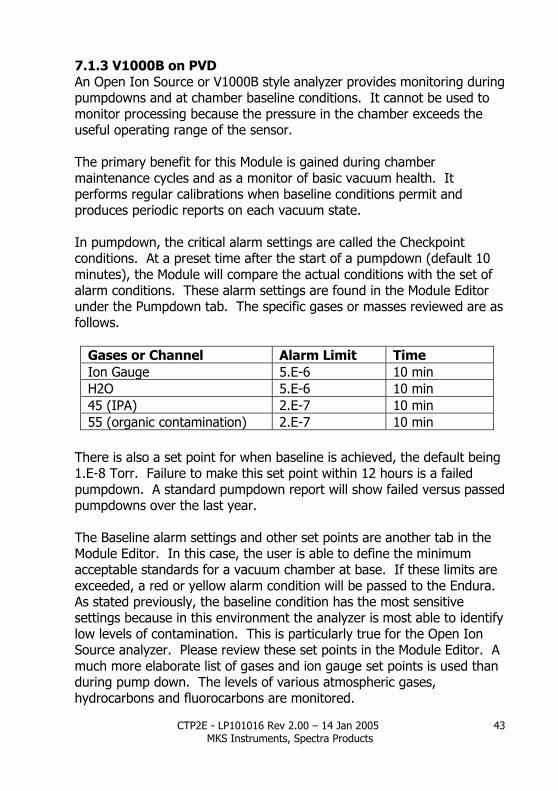
7.1.3 V1000B on PVD An Open Ion Source or V1000B style analyzer provides monitoring during pumpdowns and at chamber baseline conditions. It cannot be used to monitor processing because the pressure in the chamber exceeds the useful operating range of the sensor. The primary benefit for this Module is gained during chamber maintenance cycles and as a monitor of basic vacuum health. It performs regular calibrations when baseline conditions permit and produces periodic reports on each vacuum state. In pumpdown, the critical alarm settings are called the Checkpoint conditions. At a preset time after the start of a pumpdown (default 10 minutes), the Module will compare the actual conditions with the set of alarm conditions. These alarm settings are found in the Module Editor under the Pumpdown tab. The specific gases or masses reviewed are as follows.
Gases or Channel Alarm Limit Time Ion Gauge 5.E-6 10 min H2O 5.E-6 10 min 45 (IPA) 2.E-7 10 min 55 (organic contamination) 2.E-7 10 min
There is also a set point for when baseline is achieved, the default being 1.E-8 Torr. Failure to make this set point within 12 hours is a failed pumpdown. A standard pumpdown report will show failed versus passed pumpdowns over the last year. The Baseline alarm settings and other set points are another tab in the Module Editor. In this case, the user is able to define the minimum acceptable standards for a vacuum chamber at base. If these limits are exceeded, a red or yellow alarm condition will be passed to the Endura. As stated previously, the baseline condition has the most sensitive settings because in this environment the analyzer is most able to identify low levels of contamination. This is particularly true for the Open Ion Source analyzer. Please review these set points in the Module Editor. A much more elaborate list of gases and ion gauge set points is used than during pump down. The levels of various atmospheric gases, hydrocarbons and fluorocarbons are monitored.
CTP2E - LP101016 Rev 2.00 – 14 Jan 2005 MKS Instruments, Spectra Products
44
The standard reports generated for this module include the Pumpdown report, which covers activity over the past year for this class of data file and two Baseline reports generated on a daily, weekly and monthly basis.
CTP2E - LP101016 Rev 2.00 – 14 Jan 2005 MKS Instruments, Spectra Products
45
7.1.4 HPQ2S on PreClean II This module is used when process pressure on the Preclean II station exceeds 1 mTorr. The process Monitor recipe expects a two step process where a 30 second high pressure step precedes the actual etching of the wafer. The HPQ2S has the ability to monitor at process pressures below 8 mTorr without the expensive addition of differential pumping. A filament protection circuit has been interfaced to the turbopump controller to ensure the filament is turned off whenever the turbo is not at full speed. The HPQ2S on Preclean II Module has specific recipes for the pumpdown, baseline and process conditions of the chamber. It will perform regular calibrations when baseline conditions permit and during process, it calibrates to process pressures as well. It will produce periodic reports on each vacuum state. In pumpdown, the critical alarm settings are called the Checkpoint conditions. At a preset time after the start of a pumpdown (default 10 minutes), the Module will compare the actual conditions with the set of alarm conditions. These alarm settings are found in the Module Editor under the Pumpdown tab. The specific gases or masses reviewed are as follows.
Gases or Channel Alarm Limit Time Ion Gauge 5.E-6 10 min H2O 5.E-6 10 min 45 (IPA) 2.E-7 10 min 55 (organic contamination) 2.E-7 10 min
There is also a set point for when baseline is achieved, the default being 2.E-8 Torr. Failure to make this set point within 12 hours is a failed pumpdown. A standard pumpdown report will show failed versus passed pumpdowns over the last year. The Baseline alarm settings and other set points are another tab in the Module Editor. In this case, the user is able to define the minimum acceptable standards for a vacuum chamber at base. If these limits are exceeded, a red or yellow alarm condition will be passed to the Endura. As stated previously, the baseline condition has the most sensitive
CTP2E - LP101016 Rev 2.00 – 14 Jan 2005 MKS Instruments, Spectra Products
46
settings because in this environment the analyzer is most able to identify low levels of contamination. Please review these set points in the Module Editor. A much more elaborate list of gases and ion gauge set points is used than during pump down. The levels of various atmospheric gases, hydrocarbons and fluorocarbons are monitored. During process the Module runs the Monitor recipe. The process is broken into two sections, the preconditioning step and the process step. The preconditioning step is a 30 second step where the chamber is operating at higher pressure without rf power being applied to the wafer. It is followed by the sputter etch processing step. The Module Editor has set points for both of these conditions, including set points for reflected rf power. These settings are on the Contamination tab. Settings on the Monitor tab should not be changed, with the exception of the Alarm Properties section, which sets whether process warnings and alarms are sent to the Endura and, if so, whether redlines are only sent as warnings (yellow-lines). Four standard reports are generated on a daily, weekly and monthly basis for the process Monitor data. The information displayed shows studies of atmospheric and high mass contamination levels in the wafer-based and lot-based filtering modes. Two standard baseline reports are generated to show actual conditions in the chamber during idle time. A single pumpdown report is also provided comparing the total time required for each pumpdown over the last year.
CTP2E - LP101016 Rev 2.00 – 14 Jan 2005 MKS Instruments, Spectra Products
47
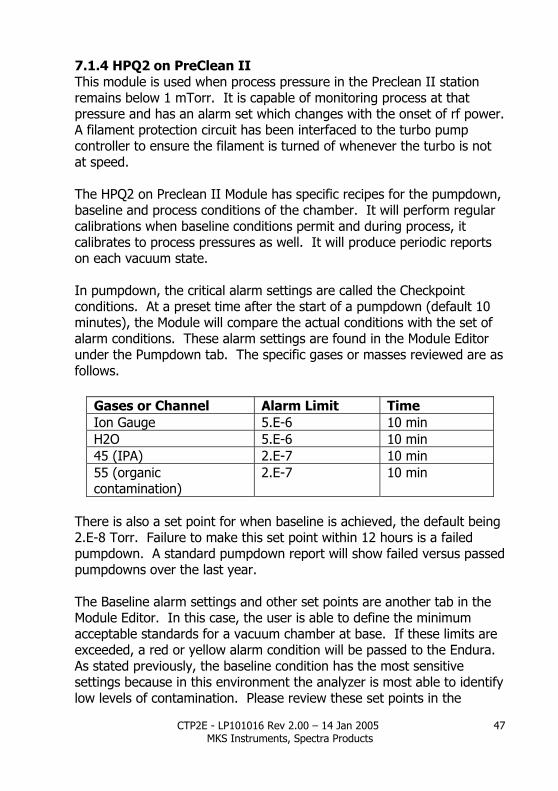
7.1.4 HPQ2 on PreClean II This module is used when process pressure in the Preclean II station remains below 1 mTorr. It is capable of monitoring process at that pressure and has an alarm set which changes with the onset of rf power. A filament protection circuit has been interfaced to the turbo pump controller to ensure the filament is turned of whenever the turbo is not at speed. The HPQ2 on Preclean II Module has specific recipes for the pumpdown, baseline and process conditions of the chamber. It will perform regular calibrations when baseline conditions permit and during process, it calibrates to process pressures as well. It will produce periodic reports on each vacuum state. In pumpdown, the critical alarm settings are called the Checkpoint conditions. At a preset time after the start of a pumpdown (default 10 minutes), the Module will compare the actual conditions with the set of alarm conditions. These alarm settings are found in the Module Editor under the Pumpdown tab. The specific gases or masses reviewed are as follows.
Gases or Channel Alarm Limit Time Ion Gauge 5.E-6 10 min H2O 5.E-6 10 min 45 (IPA) 2.E-7 10 min 55 (organic contamination)
2.E-7 10 min
There is also a set point for when baseline is achieved, the default being 2.E-8 Torr. Failure to make this set point within 12 hours is a failed pumpdown. A standard pumpdown report will show failed versus passed pumpdowns over the last year. The Baseline alarm settings and other set points are another tab in the Module Editor. In this case, the user is able to define the minimum acceptable standards for a vacuum chamber at base. If these limits are exceeded, a red or yellow alarm condition will be passed to the Endura. As stated previously, the baseline condition has the most sensitive settings because in this environment the analyzer is most able to identify low levels of contamination. Please review these set points in the
CTP2E - LP101016 Rev 2.00 – 14 Jan 2005 MKS Instruments, Spectra Products
48
Module Editor. A much more elaborate list of gases and ion gauge set points is used than during pump down. The levels of various atmospheric gases, hydrocarbons and fluorocarbons are monitored. During process the Module runs the Monitor recipe. The process is broken into two sections, the preconditioning step and the process step. The Module Editor has set points for both of these conditions, including set points for reflected rf power. Four standard reports are generated on a daily, weekly and monthly basis for the process Monitor data. The information displayed shows studies of atmospheric and high mass contamination levels in the wafer-based and lot-based filtering modes. Two standard baseline reports are generated to show actual conditions in the chamber during idle time. A single pumpdown report is also provided comparing the total time required for each pumpdown over the last year.
CTP2E - LP101016 Rev 2.00 – 14 Jan 2005 MKS Instruments, Spectra Products
49
7.1.5 HPQ2 on Clamped Degas This Module monitors during pumpdown, baseline and process and provides unique alarm criteria for each of these conditions. One of the principle objectives for this Module is the detection of wafer borne contamination on incoming product and the protection of the rest of the Endura against exposure to this contamination. The process Monitor recipe generates an indicator of wafer cleanliness called the PR Index. This index is very useful in simplifying the job of controlling contamination by simplifying communication of information concerning it. The HPQ2 on Clamped Degas Module has specific recipes for the pumpdown, baseline and process conditions of the chamber. It will perform regular calibrations when baseline conditions permit and, during process, it calibrates to process pressures as well. It will produce periodic reports on each vacuum state. In pumpdown, the critical alarm settings are called the Checkpoint conditions. At a preset time after the start of a pumpdown (default 10 minutes), the Module will compare the actual conditions with the set of alarm conditions. These alarm settings are found in the Module Editor under the Pumpdown tab. The specific gases or masses reviewed are as follows.
Gases or Channel Alarm Limit Time Ion Gauge 5.E-6 10 min H2O 5.E-6 10 min 45 (IPA) 2.E-7 10 min 55 (organic contamination) 2.E-7 10 min
There is also a set point for when baseline is achieved, the default being 1.E-8 Torr. Failure to make this set point within 12 hours is a failed pumpdown. A standard pumpdown report will show failed versus passed pumpdowns over the last year. The Baseline alarm settings and other set points are another tab in the Module Editor. In this case, the user is able to define the minimum acceptable standards for a vacuum chamber at base. If these limits are exceeded, a red or yellow alarm condition will be passed to the Endura. As stated previously, the baseline condition has the most sensitive
CTP2E - LP101016 Rev 2.00 – 14 Jan 2005 MKS Instruments, Spectra Products
50
settings because in this environment the analyzer is most able to identify low levels of contamination. Please review these set points in the Module Editor. A much more elaborate list of gases and ion gauge set points is used than during pump down. The levels of various atmospheric gases, hydrocarbons and fluorocarbons are monitored. At the time of this writing, the Monitor set points are unavailable for editing by the customer. A scalable alarm and warning multiplier will be available shortly. The principal Monitor set points that are important for the user to be able to adjust are the PRI Limit and the relative PR warning level (the fraction of the PRI Limit value that will generate a yellow-line). These values are found on the Photoresist tab of the Module Editor (Figure 9, Page 54). Do NOT modify any other settings without consulting with an MKS Applications Support Engineer. The reason for preventing modification is to maintain the integrity of the definition of the PR Index. It is appropriate that the meaning is kept consistent from tool to tool. The point at which alarms or warnings are generated however is a variable that can be changed. Three standard reports are generated on a daily, weekly and monthly basis for the process Monitor data. The information displayed shows variation in the PR Index or wafer contamination level in the wafer-based and lot-based filtering modes, and a distribution frequency display of this data. Two standard baseline reports are generated to show actual conditions in the chamber during idle time. A single pumpdown report is also provided comparing the total time required for each pumpdown over the last year.
CTP2E - LP101016 Rev 2.00 – 14 Jan 2005 MKS Instruments, Spectra Products
51
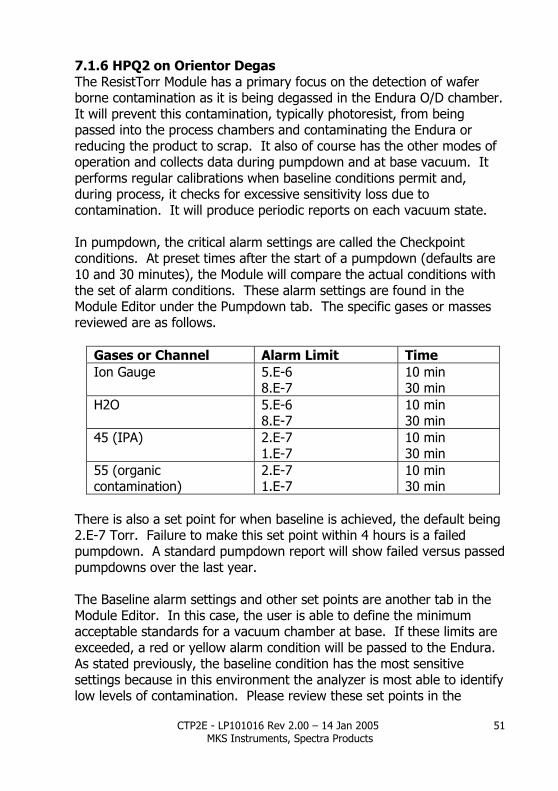
7.1.6 HPQ2 on Orientor Degas The ResistTorr Module has a primary focus on the detection of wafer borne contamination as it is being degassed in the Endura O/D chamber. It will prevent this contamination, typically photoresist, from being passed into the process chambers and contaminating the Endura or reducing the product to scrap. It also of course has the other modes of operation and collects data during pumpdown and at base vacuum. It performs regular calibrations when baseline conditions permit and, during process, it checks for excessive sensitivity loss due to contamination. It will produce periodic reports on each vacuum state. In pumpdown, the critical alarm settings are called the Checkpoint conditions. At preset times after the start of a pumpdown (defaults are 10 and 30 minutes), the Module will compare the actual conditions with the set of alarm conditions. These alarm settings are found in the Module Editor under the Pumpdown tab. The specific gases or masses reviewed are as follows.
Gases or Channel Alarm Limit Time Ion Gauge 5.E-6
8.E-7 10 min 30 min
H2O 5.E-6 8.E-7
10 min 30 min
45 (IPA) 2.E-7 1.E-7
10 min 30 min
55 (organic contamination)
2.E-7 1.E-7
10 min 30 min
There is also a set point for when baseline is achieved, the default being 2.E-7 Torr. Failure to make this set point within 4 hours is a failed pumpdown. A standard pumpdown report will show failed versus passed pumpdowns over the last year. The Baseline alarm settings and other set points are another tab in the Module Editor. In this case, the user is able to define the minimum acceptable standards for a vacuum chamber at base. If these limits are exceeded, a red or yellow alarm condition will be passed to the Endura. As stated previously, the baseline condition has the most sensitive settings because in this environment the analyzer is most able to identify low levels of contamination. Please review these set points in the
CTP2E - LP101016 Rev 2.00 – 14 Jan 2005 MKS Instruments, Spectra Products
52
Module Editor. A much more elaborate list of gases and ion gauge set points is used than during pump down. The levels of various atmospheric gases, hydrocarbons and fluorocarbons are monitored. The Monitor recipe is scanning the O/D chamber as the lamps are heating each wafer. This drives off volatile compounds that are detected by the analyzer. A PR Index is calculated for each wafer and recorded in the data files. The PR Index is useful as a measure of wafer cleanliness. An alarm level is set for the magnitude of the PR Index, as opposed to a single specific gas level. The Module Editor can be used to set this alarm level (Figure 9, Page 54). The default PR Index Limit is 1. It is common practice for a factory that has only recently installed a ResistTorr to disable the sending of redline alarms for the first few weeks of operation and accumulate a knowledge of the degree of contamination routinely seen on product. This varies a great deal from factory to factory. Once this information has been gathered, it is easy to determine where an alarm level should be set. The frequency distribution graph is very useful in illustrating this level. If the alarm level must be raised to allow for higher levels of contamination, a number between 1 and 10 is entered into the alarm level box of the Module contamination screen. If it is desired to prevent even small amounts of contamination from being processed, a level between 0.1 and 1 may be entered. The fraction of this level where a yellow-line warning is sent, the PR warning level, is set there as well. The default warning level is 0.5, or half of the redline value. Three standard reports are generated on a daily, weekly and monthly basis for the process Monitor data. The information displayed shows variation in the PR Index or wafer contamination level in the wafer-based and lot-based filtering modes, and a distribution frequency display of this data. Two standard baseline reports are generated to show actual conditions in the chamber during idle time. A single pumpdown report is also provided comparing the total time required for each pumpdown over the last year.
CTP2E - LP101016 Rev 2.00 – 14 Jan 2005 MKS Instruments, Spectra Products
53
7.1.7 HPQ2 on Buffer The ResistTorr Module has a primary focus on the detection of wafer borne contamination as it is being degassed in the Endura O/D chamber. It will prevent this contamination, typically photoresist, from being passed into the process chambers and contaminating the Endura or reducing the product to scrap. It also of course has the other modes of operation and collects data during pumpdown and at base vacuum. It performs regular calibrations when baseline conditions permit and, during process, it checks for excessive sensitivity loss due to contamination. It will produce periodic reports on each vacuum state. In pumpdown, the critical alarm settings are called the Checkpoint conditions. At preset times after the start of a pumpdown (defaults are 10 and 30 minutes), the Module will compare the actual conditions with the set of alarm conditions. These alarm settings are found in the Module Editor under the Pumpdown tab. The specific gases or masses reviewed are as follows.
Gases or Channel Alarm Limit Time Ion Gauge 5.E-6
8.E-7 10 min 30 min
H2O 5.E-6 8.E-7
10 min 30 min
45 (IPA) 2.E-7 1.E-7
10 min 30 min
55 (organic contamination) 2.E-7 1.E-7
10 min 30 min
There is also a set point for when baseline is achieved, the default being 2.E-7 Torr. Failure to make this set point within 4 hours is a failed pumpdown. A standard pumpdown report will show failed versus passed pumpdowns over the last year. The Baseline alarm settings and other set points are another tab in the Module Editor. In this case, the user is able to define the minimum acceptable standards for a vacuum chamber at base. If these limits are exceeded, a red or yellow alarm condition will be passed to the Endura. As stated previously, the baseline condition has the most sensitive settings because in this environment the analyzer is most able to identify
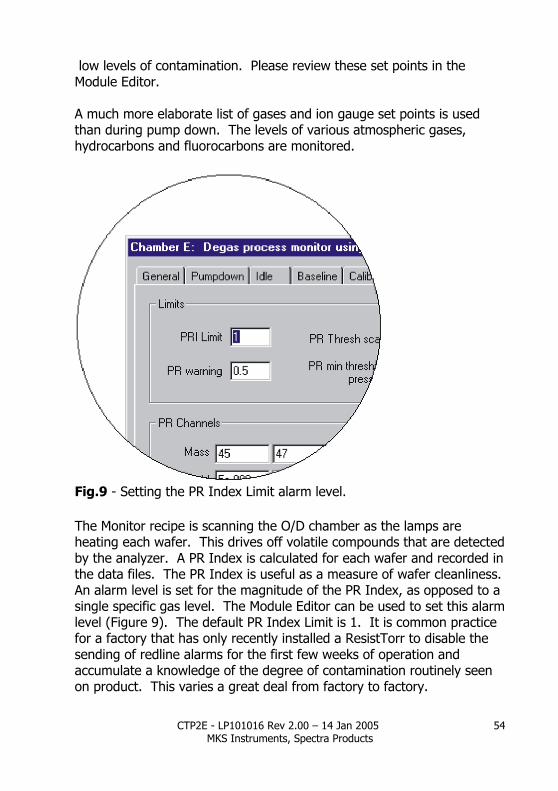
CTP2E - LP101016 Rev 2.00 – 14 Jan 2005 MKS Instruments, Spectra Products
54
low levels of contamination. Please review these set points in the Module Editor. A much more elaborate list of gases and ion gauge set points is used than during pump down. The levels of various atmospheric gases, hydrocarbons and fluorocarbons are monitored.
Fig.9 - Setting the PR Index Limit alarm level. The Monitor recipe is scanning the O/D chamber as the lamps are heating each wafer. This drives off volatile compounds that are detected by the analyzer. A PR Index is calculated for each wafer and recorded in the data files. The PR Index is useful as a measure of wafer cleanliness. An alarm level is set for the magnitude of the PR Index, as opposed to a single specific gas level. The Module Editor can be used to set this alarm level (Figure 9). The default PR Index Limit is 1. It is common practice for a factory that has only recently installed a ResistTorr to disable the sending of redline alarms for the first few weeks of operation and accumulate a knowledge of the degree of contamination routinely seen on product. This varies a great deal from factory to factory.
CTP2E - LP101016 Rev 2.00 – 14 Jan 2005 MKS Instruments, Spectra Products
55
Once this information has been gathered, it is easy to determine where an alarm level should be set. The frequency distribution graph is very useful in illustrating this level. If the alarm level must be raised to allow for higher levels of contamination, a number between 1 and 10 is entered into the alarm level box of the Module contamination screen. If it is desired to prevent even small amounts of contamination from being processed, a level between 0.1 and 1 may be entered. The fraction of this level where a yellow-line warning is sent, the PR warning level, is set there as well. The default warning level is 0.5, or half of the redline value. Three standard reports are generated on a daily, weekly and monthly basis for the process Monitor data. The information displayed shows variation in the PR Index or wafer contamination level in the wafer-based and lot-based filtering modes, and a distribution frequency display of this data. Two standard baseline reports are generated to show actual conditions in the chamber during idle time. A single pumpdown report is also provided comparing the total time required for each pumpdown over the last year.