Embed Size (px)
Citation preview
Waste to energy in Indonesia Assessing opportunities and barriers using insights from the
UK and beyond
Working with :
The Carbon Trust was set up by the UK Government to accelerate the move to a low carbon economy. It is a world leading expert on carbon reduction and clean technology. As a not-for-dividend group, it advises governments and leading companies around the world, reinvesting profits into its low carbon mission.
The Institute for Essential Services Reform (IESR) is a leading Indonesian think tank with the mission to promote the equality of natural resource management. Its efforts promote sustainable, affordable and fair use of energy through policy advocacy, research, information and capacity development of non-governmental organizations, and the development of networks.
The UK Foreign & Commonwealth Office’s (FCO) South East Asia Prosperity Fund funded this report. The South East Asia Prosperity Fund is FCO’s technical cooperation programme that aims to create the conditions for global growth. Working closely with project implementers and FCO’s network of overseas missions, the Programme has supported over 90 policy projects, providing technical assistance, building capacity, encouraging stakeholder discussions and sharing the UK experience.
Authors:
James Rawlins Associate Director – The Carbon Trust [email protected]
Jeff Beyer Manager – The Carbon Trust [email protected]
João Lampreia Strategy Analyst – The Carbon Trust [email protected]
Fabby Tumiwa Executive Director – IESR [email protected]
3
Contents
1 Executive Summary ....................................................................................... 4
2 Introduction ................................................................................................... 7
3 Background ................................................................................................... 9 Indonesia’s waste situation .............................................................................................................. 9 Indonesia’s energy demand ............................................................................................................ 11
4 Waste to Energy .......................................................................................... 12 Solid waste streams ........................................................................................................................ 12 Overview of WtE technologies ......................................................................................................... 12 Technology profiles ......................................................................................................................... 14 Technologies’ suitability to waste streams .................................................................................... 19 Technology costs ............................................................................................................................. 20
5 Current energy and waste management policies ........................................ 23 General overview ............................................................................................................................. 23 Overview of selected policies .......................................................................................................... 24
6 WtE in Indonesia ......................................................................................... 27 General overview ............................................................................................................................. 27 Perspectives for Indonesia’s WtE industry ..................................................................................... 29
7 Barriers ....................................................................................................... 32 Overview .......................................................................................................................................... 32 Summary of challenges .................................................................................................................. 36 Economic barriers ........................................................................................................................... 37 Technical barriers ........................................................................................................................... 43 Policy barriers ................................................................................................................................. 44 Institutional barriers ....................................................................................................................... 45 Social barriers ................................................................................................................................. 47
8 Solutions and international examples ......................................................... 48 Improving the economic viability of WtE facilities ......................................................................... 48 Improve waste conditions ................................................................................................................ 62
Local capacity building ..................................................................................................................... 65 Government coordination................................................................................................................. 72 Public awareness raising................................................................................................................. 77 Other solutions ................................................................................................................................. 80
9 References .................................................................................................. 86
10 Appendix I – WtE Technology Schematics ................................................... 94
11 Appendix II– Examples of MSW incineration costs in Italy and Germany….……..101
4
1 Executive summary Introduction This report investigates the potential of waste-to-energy (WtE) technologies as a solution to Indonesia’s growing waste and energy challenges, and offers recommendations that address barriers to deployment.
The report describes Indonesia’s current waste and energy situation, profiles WtE technologies, and reviews Indonesia’s WtE policy landscape and current projects. Three overarching challenges are identified that focus on the economic viability of facilities, the need for local government capacity building and government coordination, and the social dimensions of WtE. These challenges encapsulate a set of 14 discrete barriers to WtE deployment, each of which are described and related to Indonesia’s unique context.
To address the overarching challenges, a set of seven solutions are presented that leverage international examples of best practice. Each solution is accompanied by specific implementation recommendations. Below, the highlight recommendations are explained as they relate to the overarching challenges.
The Carbon Trust and the Institute for Essential Services Reform conducted this work for the Indonesian Ministry of Energy and Mineral Resources (MEMR) with the support of the UK Foreign and Commonwealth Office’s Prosperity Fund. The study was conducted from November 2013 to March 2014 using desk-based research and 22 interviews with project developers, investors, donor agencies, academics, and government representatives.
Improving the economic viability of facilities The major sources of revenue for WtE projects in Indonesia come from tipping fees and electricity sales which count on a Feed-in Tariff (FIT) subsidy. Local WtE project developers are finding it difficult to secure a revenue package that provides a reasonable rate of return given their financing and operating costs. The cost of finance is high because investors consider Indonesia to be a risky market for WtE. Many technologies have not been tested locally, a history of consistent policy has yet to be demonstrated, and in some cases procurement processes have not been entirely transparent. The strength of contracts with PT PLN and local governments is questioned by some investors, and national government insurance mechanisms like the Indonesia Infrastructure Guarantee Fund have not yet been applied to WtE.
In the immediate term, a revenue package must be put together to sufficiently outweigh these costs and deliver project developers an internal rate of return (IRR) of about 15%. The national government has aimed to set the FIT to deliver a 15% IRR, but the tipping fees that local governments seem prepared to pay for WtE incineration projects seem to be inappropriately benchmarked against other less expensive WtE solutions, like landfill gas or anaerobic digestion,
5
and are thus lower than project developers require. As a consequence some WtE solutions are currently unable to reach sufficiently high IRRs.
To overcome these barriers, better information is needed to understand the realistic cost ranges for different WtE technologies, and to identify how costs can be reduced. Local governments need to be able to assess the suitability of different technologies and understand their financial implications. The national government needs to know what tipping fees municipalities are prepared to pay so that it can set the feed-in tariff accordingly while balancing support with other low carbon energy options. It is recommended that MEMR:
Develop an evidence base for project costs by collating existing WtE feasibility studies (with review by WtE experts to ensure they are realistic) to enable more effective discussion about national and local government cost sharing, and to identify how costs can be reduced. If there are not enough robust feasibility studies available, representing a range of technologies and contexts, then MEMR should consider commissioning new feasibility studies to create this evidence base. Such an evidence base would help identify what factors are making WtE more expensive in Indonesia than other countries and would thus identify what needs to be done to reduce those costs
Map the landscape of available finance (both national and international) to identify the most attractive options for financing the development of the sector, and understand the necessary conditions to attract these funding sources into the market. A roadmap can then be developed to attract funding for crucial next steps such as demonstration projects, and ultimately to scale up commercial deployment
Develop demonstration projects to work through first-mover project risks and give comfort to investors (and the general public)
Evolve the feed-in tariff in concert with local government tipping fees to create an attractive revenue package for project developers, but including protections against excessive subsidies or windfall profits
Consider implementing a landfill tax to raise the cost of alternative disposal methods, recognising the need to strictly enforce illegal dumping laws
Building local government capacity and improving government coordination Incineration facilities are expensive and long term assets. The development and procurement of these projects is not straightforward, especially for local governments that have little experience in this sector. Inexperience creates uncertainty and delays in the process and is likely to increase development and financing costs. It also seems that a lack of knowledge about the costs of different WtE technologies has led to local governments' reluctance to pay the required tipping fees.
At the national level, it is important for government ministries to coordinate their activities and ensure that clear signals are sent to key actors, since WtE covers several ministerial remits. Local capacity building should also be supported nationally. It is therefore recommended that MEMR:
Support existing programmes like the EU-Indonesia Trade Cooperation Facility (TCF), whose capacity building goals reflect MEMR’s WtE ambitions
6
Encourage the creation of local government guidance on WtE technologies, procurement best practice, benchmark cost information, and systemic changes to the waste management system that improve waste quality, as well as standardised contract templates
Develop a longer-term capacity building strategy, which could include creating a dedicated entity within government that carries forward and builds on TCF’s current work
Consider creating a cross-ministerial WtE working group to share information and coordinate WtE activities at the national level
Involve national government in local government WtE procurement processes once plans reach a certain threshold to target support and ensure consistency across Indonesia
Enhancing the social acceptability of WtE technologies and supporting waste pickers WtE incineration faces social opposition in many markets around the world. In Indonesia, this challenge is less of an issue due to the early stage of development, but as the market grows, opposition is likely to increase. Public opposition is often due to an outdated perception of the local environmental and health impacts of plants.
Separately, implementing WtE solutions may disrupt the livelihoods of waste pickers, who rely on established waste management practices for income. To address these issues, it is recommended that MEMR:
Continue awareness raising activities and involve the public in developing local waste management plans
Use demonstration projects with strict environmental performance standards to show the public that plants are not harmful to health and the environment. These standards are likely to be required by international donor finance (such as from the ADB)
Recognise waste pickers as an important group that needs to be considered when pursuing WtE solutions, and build capacity and financially assist them to work on upstream recycling
Strong prospects for WtE Indonesia's size, rapid pace of development and growing waste challenge make it a market of significant interest for WtE investors and project developers. Indonesia already has in place some of the policy and regulatory drivers to enable WtE, but better information is needed to properly calibrate incentives in coordination with local governments to ensure that WtE facilities are economically attractive investments. An evidence base of expertly reviewed feasibility studies would provide that information, and demonstration projects would help reduce future risks, costs, and negative perceptions of WtE technologies. Together with support for local government capacity building and attention to its social dimensions, Indonesia could become a vibrant market for WtE solutions.
7
2 Introduction Indonesia is facing a dual waste and energy challenge. Economic growth, rising living standards and swelling urban populations are driving growth of municipal solid waste volumes as well as energy demand. Waste management and energy authorities are eager to support alternatives that divert municipal solid waste from limited landfills and enhance the country’s power generation capacity while improving social and environmental indicators.
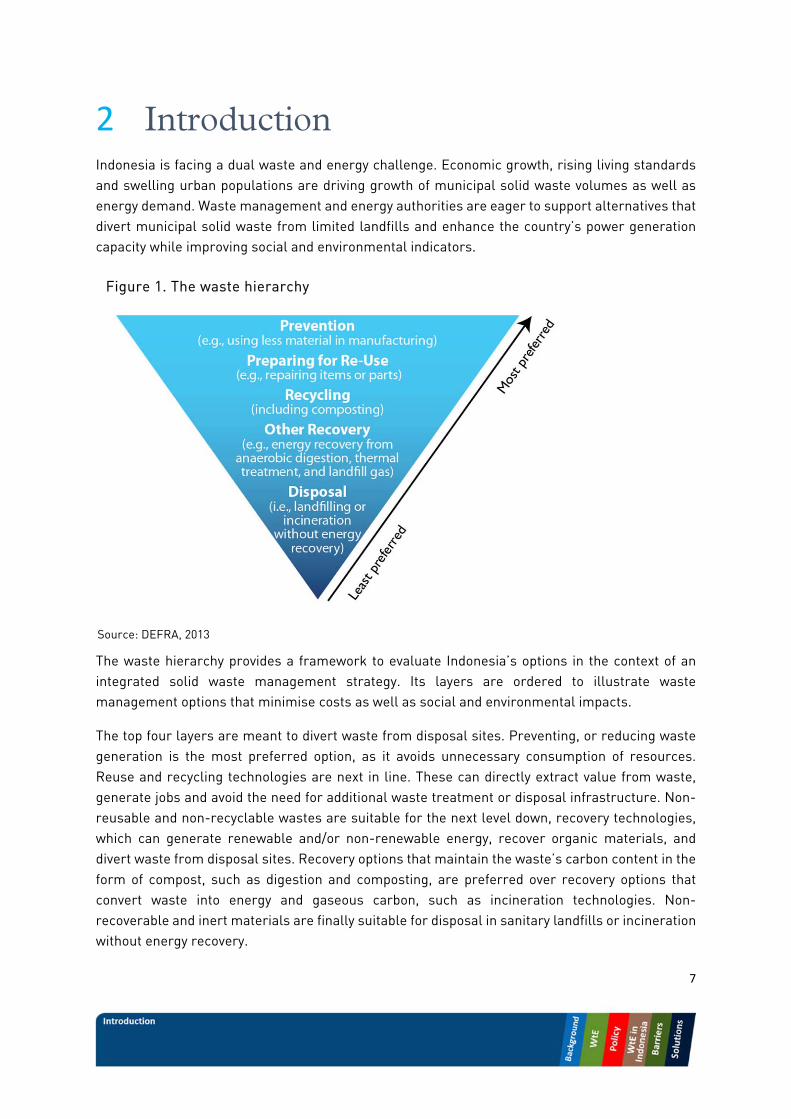
The waste hierarchy provides a framework to evaluate Indonesia’s options in the context of an integrated solid waste management strategy. Its layers are ordered to illustrate waste management options that minimise costs as well as social and environmental impacts.
The top four layers are meant to divert waste from disposal sites. Preventing, or reducing waste generation is the most preferred option, as it avoids unnecessary consumption of resources. Reuse and recycling technologies are next in line. These can directly extract value from waste, generate jobs and avoid the need for additional waste treatment or disposal infrastructure. Non-reusable and non-recyclable wastes are suitable for the next level down, recovery technologies, which can generate renewable and/or non-renewable energy, recover organic materials, and divert waste from disposal sites. Recovery options that maintain the waste’s carbon content in the form of compost, such as digestion and composting, are preferred over recovery options that convert waste into energy and gaseous carbon, such as incineration technologies. Non-recoverable and inert materials are finally suitable for disposal in sanitary landfills or incineration without energy recovery.
Figure 1. The waste hierarchy
Source: DEFRA, 2013
8
This report focuses on Waste to Energy (WtE) technologies as an option to manage Indonesia’s waste problem whilst generating electricity. The objective of this document is to provide MEMR with a set of recommendations that will help it address the barriers to WtE in Indonesia. The evidence base for this report includes a major desk-based review of relevant published literature and a series of 22 interviews carried out with project developers, investors, donor agencies, academics, and government representatives with direct experience with WtE in multiple markets.
This report is divided in five parts. A background section summarises Indonesia’s waste and energy situation. A technology section examines WtE technologies as a means of treating solid waste streams and looks at their relative costs as well as their fit into a broader waste management strategy. A policy section outlines Indonesia’s policies related to energy and waste, leading to a section that outlines the country’s current WtE market and development prospects in the coming years. A barriers section shows how 14 discrete barriers combine to form three major overarching challenges to the sector, focused on economic viability, local government capacity and coordination, and the social dimension of WtE. Finally, a section on solutions uses international examples to illustrate ways in which barriers were overcome elsewhere, and summarises key recommendations for MEMR to further support the development of a vibrant WtE market in Indonesia.
9
3 Background Economic development and growing urban populations are generating an increasing amount of municipal solid waste (MSW) and a rising energy demand in Indonesia. Combined, these present a daunting challenge for waste management and energy authorities. The way these challenges are dealt with in the coming decades will significantly influence the country’s greenhouse gas (GHG) emissions profile and the social externalities of waste.
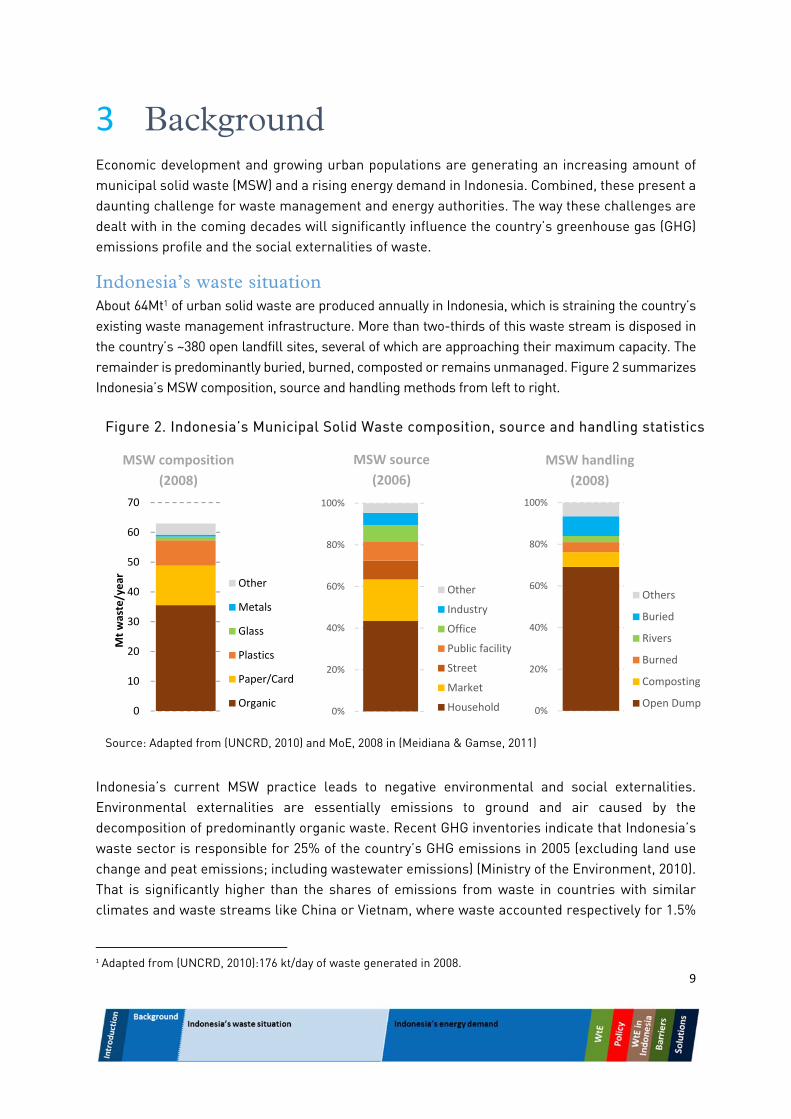
Indonesia’s waste situation About 64Mt1 of urban solid waste are produced annually in Indonesia, which is straining the country’s existing waste management infrastructure. More than two-thirds of this waste stream is disposed in the country’s ~380 open landfill sites, several of which are approaching their maximum capacity. The remainder is predominantly buried, burned, composted or remains unmanaged. Figure 2 summarizes Indonesia’s MSW composition, source and handling methods from left to right.
Indonesia’s current MSW practice leads to negative environmental and social externalities. Environmental externalities are essentially emissions to ground and air caused by the decomposition of predominantly organic waste. Recent GHG inventories indicate that Indonesia’s waste sector is responsible for 25% of the country’s GHG emissions in 2005 (excluding land use change and peat emissions; including wastewater emissions) (Ministry of the Environment, 2010). That is significantly higher than the shares of emissions from waste in countries with similar climates and waste streams like China or Vietnam, where waste accounted respectively for 1.5%
1 Adapted from (UNCRD, 2010):176 kt/day of waste generated in 2008.
Figure 2. Indonesia’s Municipal Solid Waste composition, source and handling statistics
Source: Adapted from (UNCRD, 2010) and MoE, 2008 in (Meidiana & Gamse, 2011)
0
10
20
30
40
50
60
70
Mt waste/year Other
Metals
Glass
Plastics
Paper/Card
Organic0%
20%
40%
60%
80%
100%
Other
Industry
Office
Public facility
Street
Market
Household 0%
20%
40%
60%
80%
100%
Others
Buried
Rivers
Burned
Composting
Open Dump
MSW composition
(2008)
MSW source
(2006)
MSW handling
(2008)
10
of emissions in 2005 (UNFCCC, 2010a), and 6% of emissions in 2000 (UNFCCC, 2010b) also without accounting for land use change and peat emissions. If numbers are compared per capita, Indonesia’s waste sector emitted 743 kgCO2e/capita while China emitted 83kgCO2e/capita in 2005 and Vietnam 100 kgCO2e per capita in 20002.
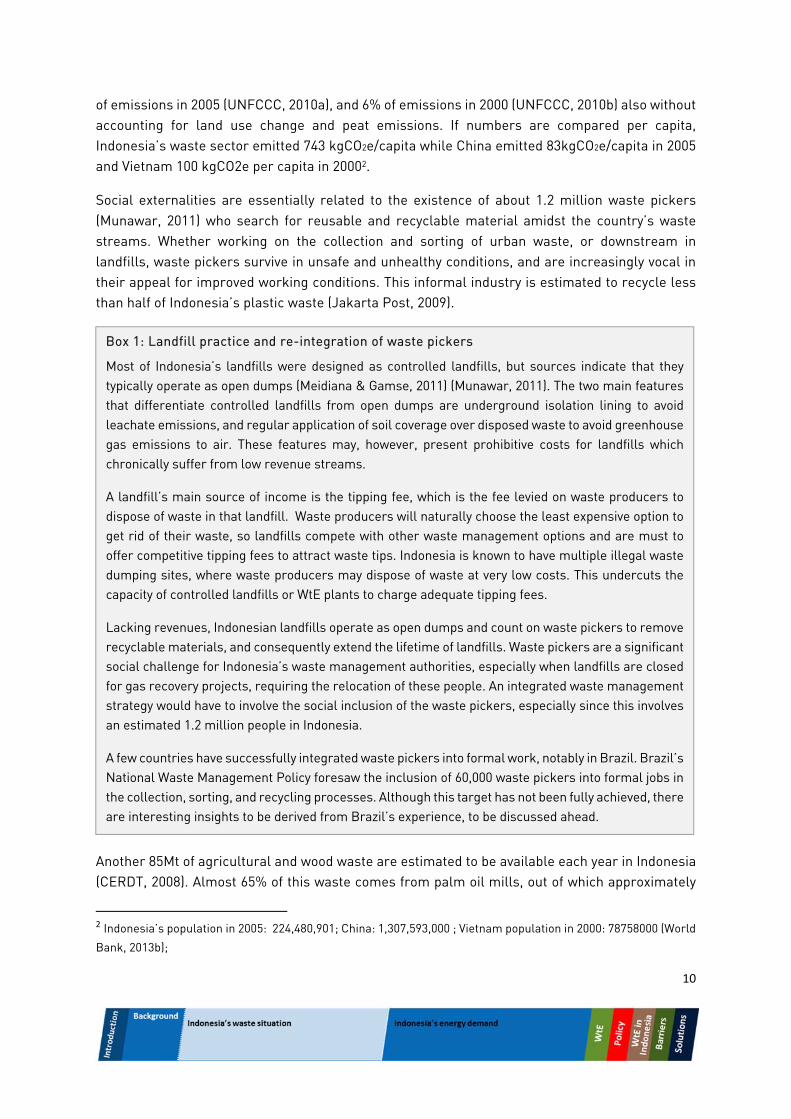
Social externalities are essentially related to the existence of about 1.2 million waste pickers (Munawar, 2011) who search for reusable and recyclable material amidst the country’s waste streams. Whether working on the collection and sorting of urban waste, or downstream in landfills, waste pickers survive in unsafe and unhealthy conditions, and are increasingly vocal in their appeal for improved working conditions. This informal industry is estimated to recycle less than half of Indonesia’s plastic waste (Jakarta Post, 2009).
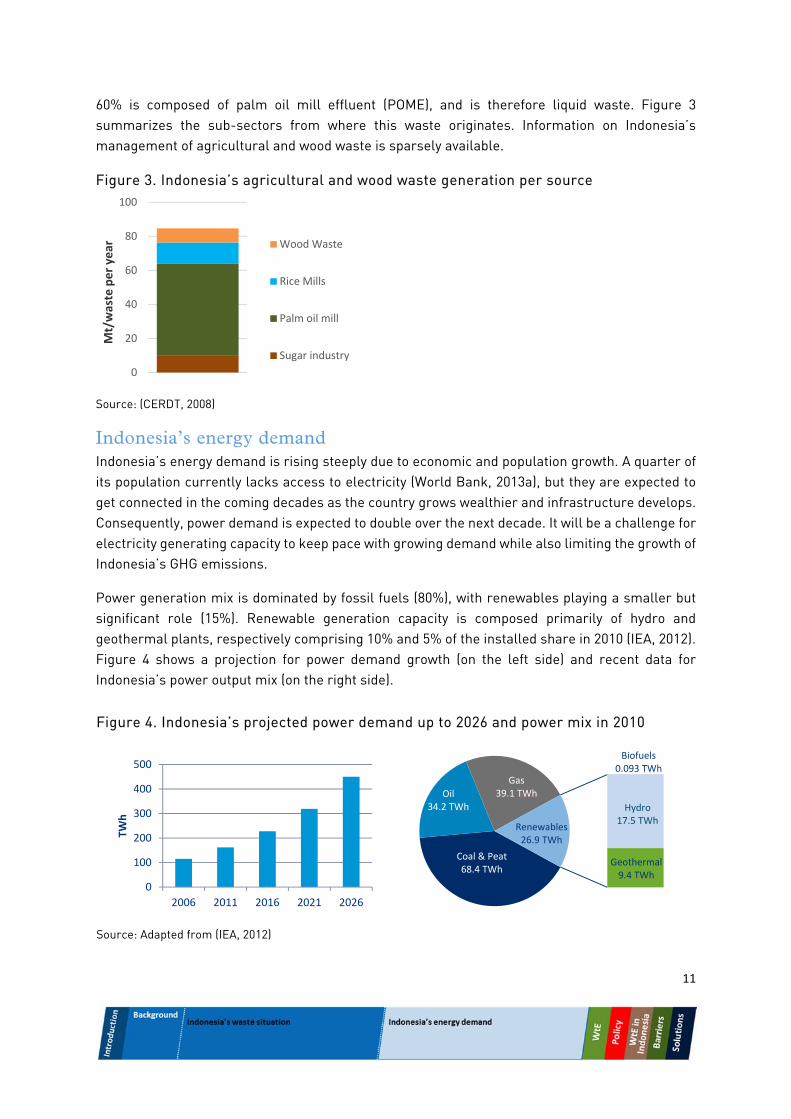
Another 85Mt of agricultural and wood waste are estimated to be available each year in Indonesia (CERDT, 2008). Almost 65% of this waste comes from palm oil mills, out of which approximately
2 Indonesia’s population in 2005: 224,480,901; China: 1,307,593,000 ; Vietnam population in 2000: 78758000 (World
Bank, 2013b);
Box 1: Landfill practice and re-integration of waste pickers
Most of Indonesia’s landfills were designed as controlled landfills, but sources indicate that they typically operate as open dumps (Meidiana & Gamse, 2011) (Munawar, 2011). The two main features that differentiate controlled landfills from open dumps are underground isolation lining to avoid leachate emissions, and regular application of soil coverage over disposed waste to avoid greenhouse gas emissions to air. These features may, however, present prohibitive costs for landfills which chronically suffer from low revenue streams.
A landfill’s main source of income is the tipping fee, which is the fee levied on waste producers to dispose of waste in that landfill. Waste producers will naturally choose the least expensive option to get rid of their waste, so landfills compete with other waste management options and are must to offer competitive tipping fees to attract waste tips. Indonesia is known to have multiple illegal waste dumping sites, where waste producers may dispose of waste at very low costs. This undercuts the capacity of controlled landfills or WtE plants to charge adequate tipping fees.
Lacking revenues, Indonesian landfills operate as open dumps and count on waste pickers to remove recyclable materials, and consequently extend the lifetime of landfills. Waste pickers are a significant social challenge for Indonesia’s waste management authorities, especially when landfills are closed for gas recovery projects, requiring the relocation of these people. An integrated waste management strategy would have to involve the social inclusion of the waste pickers, especially since this involves an estimated 1.2 million people in Indonesia.
A few countries have successfully integrated waste pickers into formal work, notably in Brazil. Brazil’s National Waste Management Policy foresaw the inclusion of 60,000 waste pickers into formal jobs in the collection, sorting, and recycling processes. Although this target has not been fully achieved, there are interesting insights to be derived from Brazil’s experience, to be discussed ahead.
11
60% is composed of palm oil mill effluent (POME), and is therefore liquid waste. Figure 3 summarizes the sub-sectors from where this waste originates. Information on Indonesia’s management of agricultural and wood waste is sparsely available.
Figure 3. Indonesia’s agricultural and wood waste generation per source
Source: (CERDT, 2008)
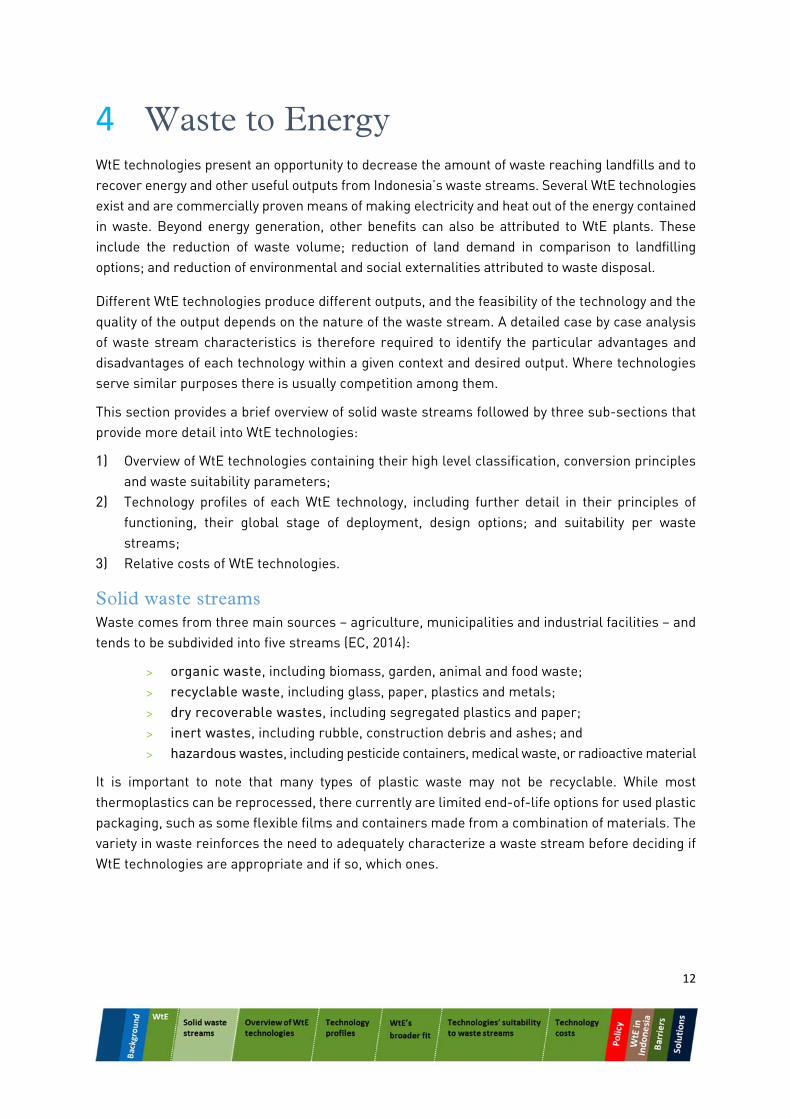
Indonesia’s energy demand Indonesia’s energy demand is rising steeply due to economic and population growth. A quarter of its population currently lacks access to electricity (World Bank, 2013a), but they are expected to get connected in the coming decades as the country grows wealthier and infrastructure develops. Consequently, power demand is expected to double over the next decade. It will be a challenge for electricity generating capacity to keep pace with growing demand while also limiting the growth of Indonesia’s GHG emissions.
Power generation mix is dominated by fossil fuels (80%), with renewables playing a smaller but significant role (15%). Renewable generation capacity is composed primarily of hydro and geothermal plants, respectively comprising 10% and 5% of the installed share in 2010 (IEA, 2012). Figure 4 shows a projection for power demand growth (on the left side) and recent data for Indonesia’s power output mix (on the right side).
0
20
40
60
80
100
Mt/waste per year Wood Waste
Rice Mills
Palm oil mill
Sugar industry
Figure 4. Indonesia’s projected power demand up to 2026 and power mix in 2010
Source: Adapted from (IEA, 2012)
0
100
200
300
400
500
2006 2011 2016 2021 2026
TWh
Coal & Peat68.4 TWh
Oil34.2 TWh
Gas39.1 TWh
Biofuels0.093 TWh
Hydro17.5 TWh
Geothermal9.4 TWh
Renewables26.9 TWh
12
4 Waste to Energy WtE technologies present an opportunity to decrease the amount of waste reaching landfills and to recover energy and other useful outputs from Indonesia’s waste streams. Several WtE technologies exist and are commercially proven means of making electricity and heat out of the energy contained in waste. Beyond energy generation, other benefits can also be attributed to WtE plants. These include the reduction of waste volume; reduction of land demand in comparison to landfilling options; and reduction of environmental and social externalities attributed to waste disposal.
Different WtE technologies produce different outputs, and the feasibility of the technology and the quality of the output depends on the nature of the waste stream. A detailed case by case analysis of waste stream characteristics is therefore required to identify the particular advantages and disadvantages of each technology within a given context and desired output. Where technologies serve similar purposes there is usually competition among them.
This section provides a brief overview of solid waste streams followed by three sub-sections that provide more detail into WtE technologies:
1) Overview of WtE technologies containing their high level classification, conversion principles and waste suitability parameters;
2) Technology profiles of each WtE technology, including further detail in their principles of functioning, their global stage of deployment, design options; and suitability per waste streams;
3) Relative costs of WtE technologies.
Solid waste streams Waste comes from three main sources – agriculture, municipalities and industrial facilities – and tends to be subdivided into five streams (EC, 2014):
organic waste, including biomass, garden, animal and food waste; recyclable waste, including glass, paper, plastics and metals; dry recoverable wastes, including segregated plastics and paper; inert wastes, including rubble, construction debris and ashes; and hazardous wastes, including pesticide containers, medical waste, or radioactive material
It is important to note that many types of plastic waste may not be recyclable. While most thermoplastics can be reprocessed, there currently are limited end-of-life options for used plastic packaging, such as some flexible films and containers made from a combination of materials. The variety in waste reinforces the need to adequately characterize a waste stream before deciding if WtE technologies are appropriate and if so, which ones.
13
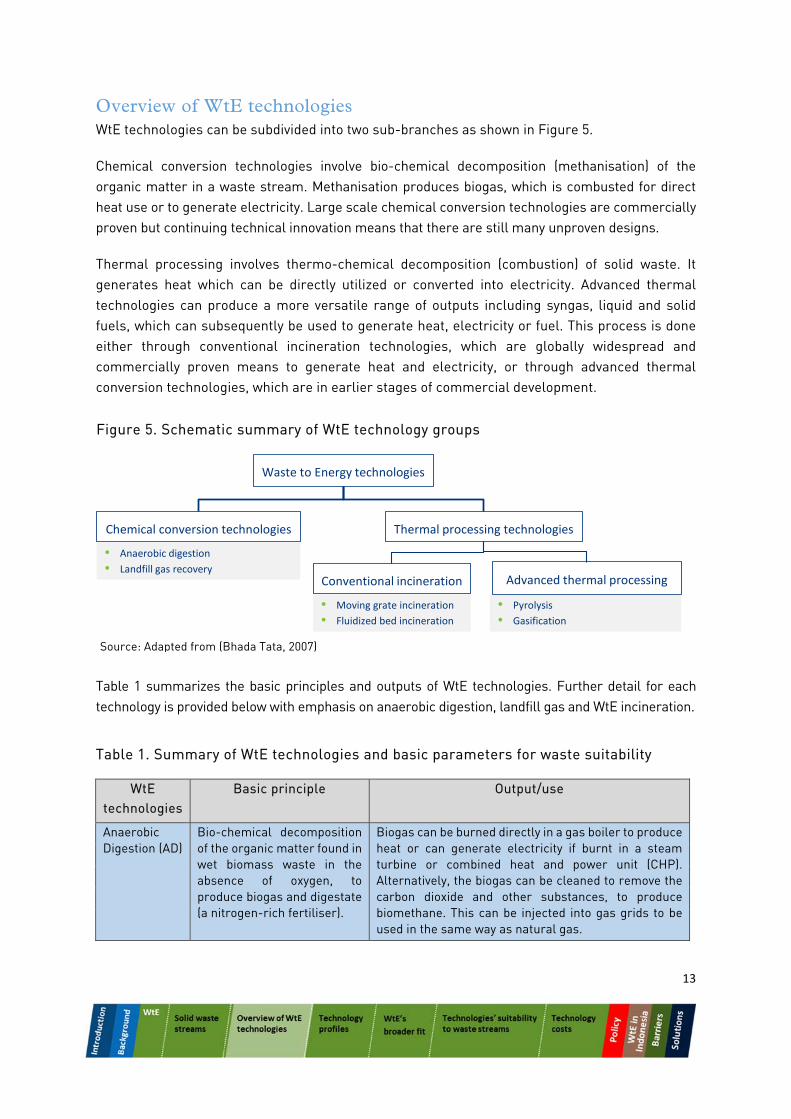
Overview of WtE technologies WtE technologies can be subdivided into two sub-branches as shown in Figure 5.
Chemical conversion technologies involve bio-chemical decomposition (methanisation) of the organic matter in a waste stream. Methanisation produces biogas, which is combusted for direct heat use or to generate electricity. Large scale chemical conversion technologies are commercially proven but continuing technical innovation means that there are still many unproven designs.
Thermal processing involves thermo-chemical decomposition (combustion) of solid waste. It generates heat which can be directly utilized or converted into electricity. Advanced thermal technologies can produce a more versatile range of outputs including syngas, liquid and solid fuels, which can subsequently be used to generate heat, electricity or fuel. This process is done either through conventional incineration technologies, which are globally widespread and commercially proven means to generate heat and electricity, or through advanced thermal conversion technologies, which are in earlier stages of commercial development.
Table 1 summarizes the basic principles and outputs of WtE technologies. Further detail for each technology is provided below with emphasis on anaerobic digestion, landfill gas and WtE incineration.
Table 1. Summary of WtE technologies and basic parameters for waste suitability
WtE technologies
Basic principle Output/use
Anaerobic Digestion (AD)
Bio-chemical decomposition of the organic matter found in wet biomass waste in the absence of oxygen, to produce biogas and digestate (a nitrogen-rich fertiliser).
Biogas can be burned directly in a gas boiler to produce heat or can generate electricity if burnt in a steam turbine or combined heat and power unit (CHP). Alternatively, the biogas can be cleaned to remove the carbon dioxide and other substances, to produce biomethane. This can be injected into gas grids to be used in the same way as natural gas.
Figure 5. Schematic summary of WtE technology groups
Source: Adapted from (Bhada Tata, 2007)
• Anaerobic digestion
• Landfill gas recovery
• Pyrolysis
• Gasification
• Moving grate incineration
• Fluidized bed incineration
Waste to Energy technologies
Thermal processing technologiesChemical conversion technologies
Advanced thermal processingConventional incineration
14
Landfill gas recovery (LFG)
Collection and combustion of biogas directly from landfill.
Landfill biogas can be used as biogas described above. LFG projects require landfills that are operating for several years (~10 years) receiving sufficient amounts of organic waste to generate enough biogas to justify an LFG investment. The number of years of operation to generate sufficient biogas is determined by the waste streams entering the landfill and their decay rates in the local conditions (EPA, 2010).
Conventional Incineration
Combustion of solid waste to generate power and/or heat.
The heat generated can be used directly for heating purposes or can generate electricity using a steam turbine, or both, through combined heat and power (CHP) systems.
Pyrolysis Advanced thermo-chemical decomposition of organic matter by the action of heat in the absence of oxygen.
Outputs may include combustible gas, oil or solid char. All can be used for heat and electricity generation purposes. Pyrolysis oil can be upgraded to produce petrol and diesel using oil refining techniques.
Gasification Advanced thermo-chemical decomposition of organic matter by the action of heat requiring an oxygen concentration slightly below the stoichiometric level.
The combustible gas output can be used directly to generate heat and electricity. Alternatively it can be upgraded to syngas. This can be used to manufacture either biomethane for gas grids, or transport fuels such as hydrogen, ethanol, synthetic diesel or jet fuel.
Source: Adapted from (Ministry of Urban Development, 2000) and (DEFRA and DECC, 2013)
Technology profiles3
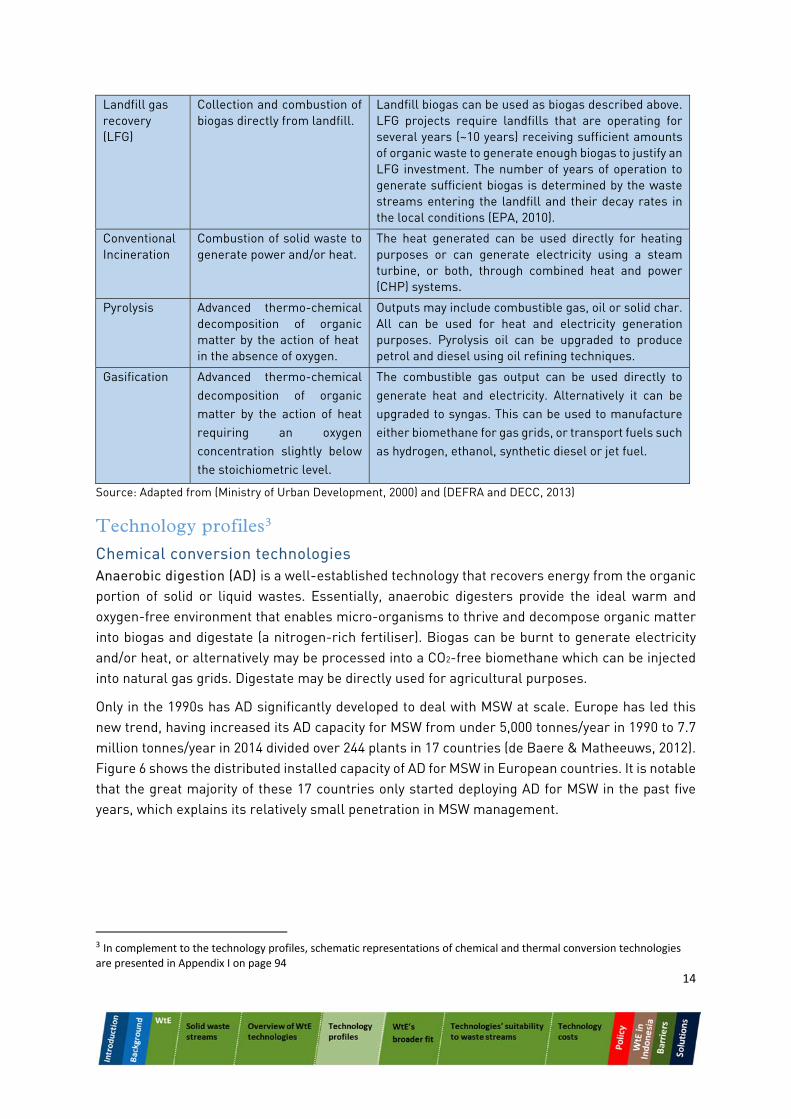
Chemical conversion technologies Anaerobic digestion (AD) is a well-established technology that recovers energy from the organic portion of solid or liquid wastes. Essentially, anaerobic digesters provide the ideal warm and oxygen-free environment that enables micro-organisms to thrive and decompose organic matter into biogas and digestate (a nitrogen-rich fertiliser). Biogas can be burnt to generate electricity and/or heat, or alternatively may be processed into a CO2-free biomethane which can be injected into natural gas grids. Digestate may be directly used for agricultural purposes.
Only in the 1990s has AD significantly developed to deal with MSW at scale. Europe has led this new trend, having increased its AD capacity for MSW from under 5,000 tonnes/year in 1990 to 7.7 million tonnes/year in 2014 divided over 244 plants in 17 countries (de Baere & Matheeuws, 2012). Figure 6 shows the distributed installed capacity of AD for MSW in European countries. It is notable that the great majority of these 17 countries only started deploying AD for MSW in the past five years, which explains its relatively small penetration in MSW management.
3 In complement to the technology profiles, schematic representations of chemical and thermal conversion technologies
are presented in Appendix I on page 94
15
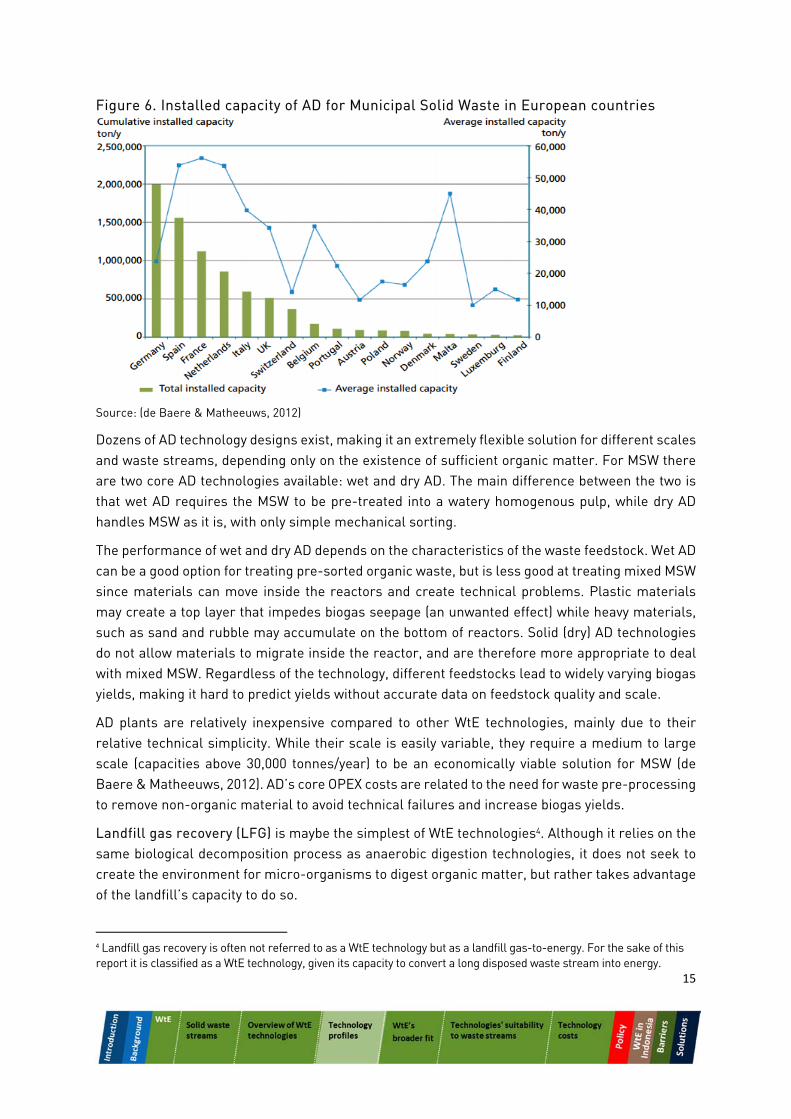
Figure 6. Installed capacity of AD for Municipal Solid Waste in European countries
Source: (de Baere & Matheeuws, 2012)
Dozens of AD technology designs exist, making it an extremely flexible solution for different scales and waste streams, depending only on the existence of sufficient organic matter. For MSW there are two core AD technologies available: wet and dry AD. The main difference between the two is that wet AD requires the MSW to be pre-treated into a watery homogenous pulp, while dry AD handles MSW as it is, with only simple mechanical sorting.
The performance of wet and dry AD depends on the characteristics of the waste feedstock. Wet AD can be a good option for treating pre-sorted organic waste, but is less good at treating mixed MSW since materials can move inside the reactors and create technical problems. Plastic materials may create a top layer that impedes biogas seepage (an unwanted effect) while heavy materials, such as sand and rubble may accumulate on the bottom of reactors. Solid (dry) AD technologies do not allow materials to migrate inside the reactor, and are therefore more appropriate to deal with mixed MSW. Regardless of the technology, different feedstocks lead to widely varying biogas yields, making it hard to predict yields without accurate data on feedstock quality and scale.
AD plants are relatively inexpensive compared to other WtE technologies, mainly due to their relative technical simplicity. While their scale is easily variable, they require a medium to large scale (capacities above 30,000 tonnes/year) to be an economically viable solution for MSW (de Baere & Matheeuws, 2012). AD’s core OPEX costs are related to the need for waste pre-processing to remove non-organic material to avoid technical failures and increase biogas yields.
Landfill gas recovery (LFG) is maybe the simplest of WtE technologies4. Although it relies on the same biological decomposition process as anaerobic digestion technologies, it does not seek to create the environment for micro-organisms to digest organic matter, but rather takes advantage of the landfill’s capacity to do so.
4 Landfill gas recovery is often not referred to as a WtE technology but as a landfill gas-to-energy. For the sake of this report it is classified as a WtE technology, given its capacity to convert a long disposed waste stream into energy.
16
Landfills start generating gas shortly after they begin accepting waste and can keep producing gas for up to 30 years after the landfill closes. LFG production over these years is the most important factor to be considered when designing a landfill gas recovery project. This can be estimated from a basic first-order decay model. Drilling the landfill with a series of pipes, landfill gas can be harnessed and used in the same way as biogas.
LFG projects are widely deployed in the USA and Europe, and have recently taken off in developing countries. Global installed LFG capacity adds up to at least 3,228 MW in 2012 (GMI, 2012), of which 242 MW are located in developing countries and registered under the United Nations Framework Convention on Climate Change’s (UNFCCC) Clean Development Mechanism (CDM). CDM approved LFG are eligible to generate marketable Certified Emission Reductions (CER), representing an additional revenue stream for project investors. The market value of CERs has fallen from about €25/tCO2 in 2008 to less than €1/tCO2 today, however, limiting their incentive value.
LFG is especially interesting for Indonesia since value can be recovered from the waste that has already been disposed of. Even if Indonesia were to implement an ideal waste management system following the principles of the waste hierarchy, where landfills receive only inert materials, there would still be an opportunity to recover the gas from organic waste that was disposed of many years before.
Thermal processing technologies Conventional incineration (CI) is the most established waste recovery technology with more than 1,000 plants worldwide (WSP, 2013). Most plants use the heat generated by burning waste to produce steam to generate electricity. Incineration plants may also operate as combined heat and power plants (CHP) by recovering waste heat to improve the process efficiency, or for direct use in residential or industrial heat networks.
The most common incineration technology is moving grate combustion. This typically involves moving solid waste from an inlet to the outlet under a vertical or horizontal boiler. Moving grates have different designs, all of which tend to have lower investment costs but also lower efficiencies than competing incineration technologies.
A potentially more efficient combustion technique is fluidised bed combustion. Fluidisation is the term applied to the process whereby a bed of fine solids is transformed into a liquid-like state through contact with an upward flowing gas, usually air (WSP, 2013) as it is combusted. This is a proven process to effectively convert multiple feedstocks, including solid waste, into heat. Fluidised bed combustion requires pre-sorting and shredding of the waste feedstock, which tends to increase its operating costs when compared to moving grates. Relatively few (~100) fluidized bed plants are in operation globally.
The steam conditions in a WTE combustion plant have typically been limited to 40bar and 400°C, leading to energy conversion efficiencies ranging between 22% and 25%, as inevitably some of the energy released by the waste feedstock is lost. Advanced techniques are being developed to boost plant efficiency raising boiler pressure up to 90bar and 500oC (WSP, 2013), raising plant efficiencies up to about 30%. Advanced techniques entail additional capital and operational costs but these may eventually be offset by increased revenue from electricity (and potentially heat) sales. It is also important to note that thermal WtE systems may operate in co-combustion with other fuel
17
burning electricity and heat generation systems. Systems in which MSW is co-combusted with natural gas or biogas are already a reality, and offer advantages in their input flexibility. The range of possible co-combustion systems is not further looked into in this report.
Incineration technologies could address the pressing issues identified in Indonesia. They reduce the amount of waste that reaches landfills, and consequently landfill emissions – plants can be viable treating from 30 tonnes/day (Ellyin, 2012) to 3,000 tonnes/day (Covanta, 2013); they generate energy from the waste - about 550 kWh/tonne of waste (EPA, 2013a); and may provide the opportunity to integrate waste pickers into the job market. Additionally, if the waste stream has a suitable moisture content and calorific value, incineration technologies may operate with waste ‘as-received’, i.e. with no pre-treatment (depending on the plant design and on physiochemical characteristics of the waste, especially water content).
Advanced thermal processing technologies Advanced thermal (AT) technologies offer advantages over direct combustion of the wastes but are generally more costly. Both pyrolysis and gasification technologies convert more chemical energy in the waste fuel into energy in the output gas. The syngas output also allows for great flexibility in usage, with potentially increased overall efficiencies. AT technologies also cost more, mostly due to these technologies’ feedstock pre-processing needs and flue gas treatment. AT processes are established and viable using certain waste streams (e.g. biomass, industrial wastes, tyres etc.) but are in early stages in terms of treating MSW.
Pyrolysis is a relatively new WtE technology that uses heat and an oxygen-free environment to break down the organic solids in the waste into three products: solid char, pyrolysis oil and pyrolysis syngas. The proportions of each output is determined by the characteristics of the waste and the operating temperature within the pyrolysis reactor, which varies between 300oC and 800oC. In general, the hotter the process, the more syngas will be produced at the expense of pyrolysis oil. These outputs can be used to fuel steam turbines and generate electricity, or used as fuels.
Gasification is also a relatively new WtE technology which partially oxidises the organic solids present in the waste. It is important to clarify that there may be confusion in the use of the term gasification as it is sometimes used to denote the production of biogas from organic waste. In this report, the term gasification exclusively refers to the advanced thermal treatment of solid waste in which carbon-based materials are converted into syngas.
In the gasification process, the majority of the carbon and hydrogen in the waste is converted into syngas, leaving some solid residue (ash or char). The quality of the syngas depends primarily on whether the feedstock is gasified with pure oxygen – resulting in a higher heating value of syngas – or with air resulting in a lower heating value. Gasification reactors operate between 700oC and 1400oC, with pure oxygen gasification tending towards the higher end. Higher temperatures also have the advantage of melting the ash (inorganic content of the input waste) to produce a slag (WSP, 2013), which is an inert output that can be commercialized as a construction material.
There are multiple designs for gasification reactors, spanning a wide range of costs. Because of this technology’s adaptability and outputs, it is often an interesting option for countries with high
18
share of organic waste, such as Indonesia. The availability of multiple reactors and other components in the market allows for at least 10 possible configurations when building gasification plants (WSP, 2013), meaning costs can vary widely.
The last and most recent WtE technology to enter the market is plasma arc gasification. This involves passing waste into a kiln at 4000oC and 7000oC, so that syngas is produced and all other waste products are immobilised in a vitrified mass that can be safely disposed of, avoiding the need to deal with gaseous or solid emissions (Hicks & Rawlinson, 2010). Plasma arc gasification is an inherently expensive technology due to the amount of energy required to raise the reactor’s temperature to the required level. Essentially, for the purpose of producing and selling energy, its own energy needs inflict a considerably high energy penalty on the plant. There are currently no commercial plasma arc gasification plants in operation (WSP, 2013). At least one demonstration scale plasma arc gasification plant exists in Ottawa, Canada, owned by Plasco Energy, converting about 75 tons a day of municipal solid waste into synthetic gas, inert solid material and heat (WorldFuels, 2014).
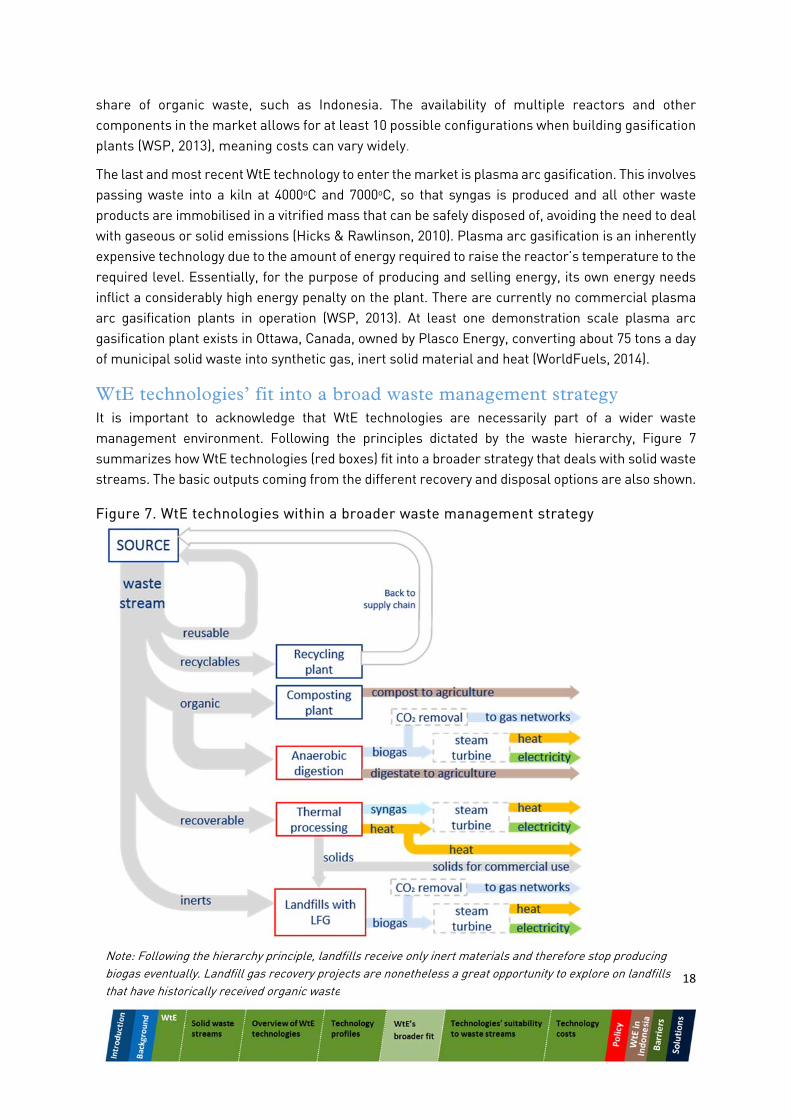
WtE technologies’ fit into a broad waste management strategy It is important to acknowledge that WtE technologies are necessarily part of a wider waste management environment. Following the principles dictated by the waste hierarchy, Figure 7 summarizes how WtE technologies (red boxes) fit into a broader strategy that deals with solid waste streams. The basic outputs coming from the different recovery and disposal options are also shown.
Figure 7. WtE technologies within a broader waste management strategy
Note: Following the hierarchy principle, landfills receive only inert materials and therefore stop producing biogas eventually. Landfill gas recovery projects are nonetheless a great opportunity to explore on landfills that have historically received organic waste
19
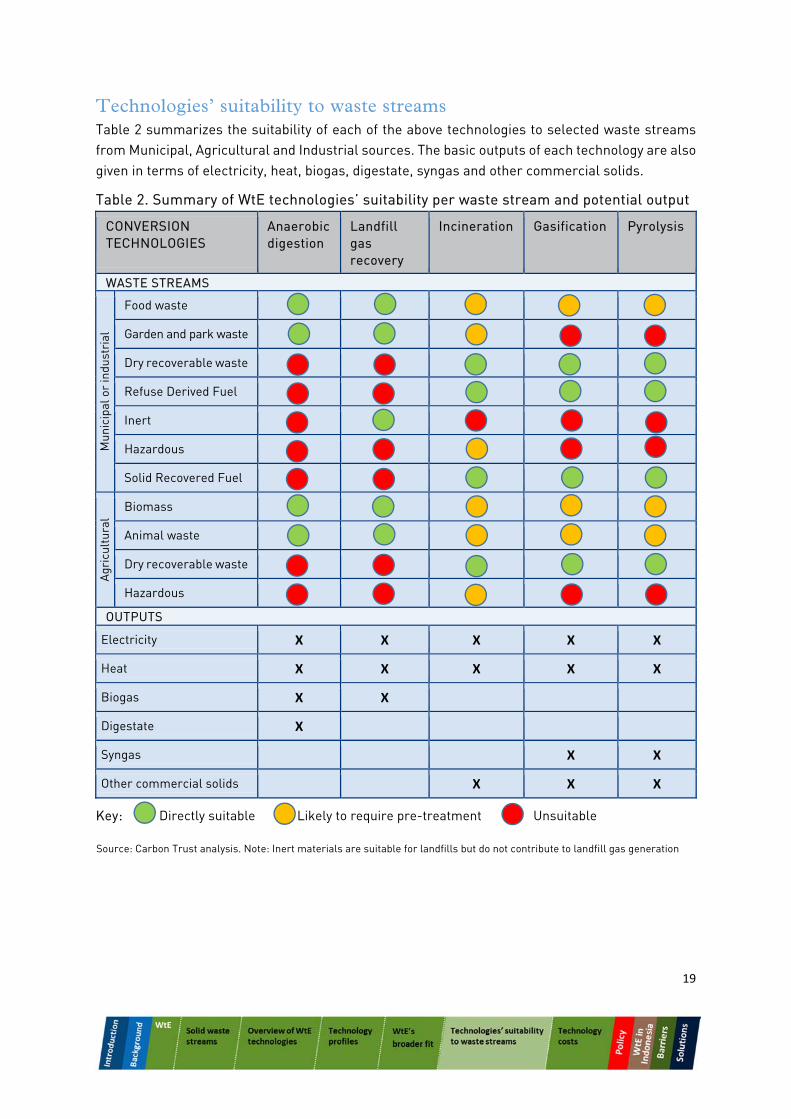
Technologies’ suitability to waste streams Table 2 summarizes the suitability of each of the above technologies to selected waste streams from Municipal, Agricultural and Industrial sources. The basic outputs of each technology are also given in terms of electricity, heat, biogas, digestate, syngas and other commercial solids.
Table 2. Summary of WtE technologies’ suitability per waste stream and potential output
CONVERSION TECHNOLOGIES
Anaerobic digestion
Landfill gas recovery
Incineration Gasification Pyrolysis
WASTE STREAMS
Mun
icip
al o
r in
dust
rial
Food waste X X X X
Garden and park waste
Dry recoverable waste X X X
Refuse Derived Fuel X X X
Inert
Hazardous
Solid Recovered Fuel X X X
Agr
icul
tura
l
Biomass X X X X X
Animal waste X X X X X
Dry recoverable waste X X X
Hazardous
OUTPUTS
Electricity X X X X X
Heat X X X X X
Biogas X X
Digestate X
Syngas X X
Other commercial solids X X X
Key: Directly suitable Likely to require pre-treatment Unsuitable
Source: Carbon Trust analysis. Note: Inert materials are suitable for landfills but do not contribute to landfill gas generation
20
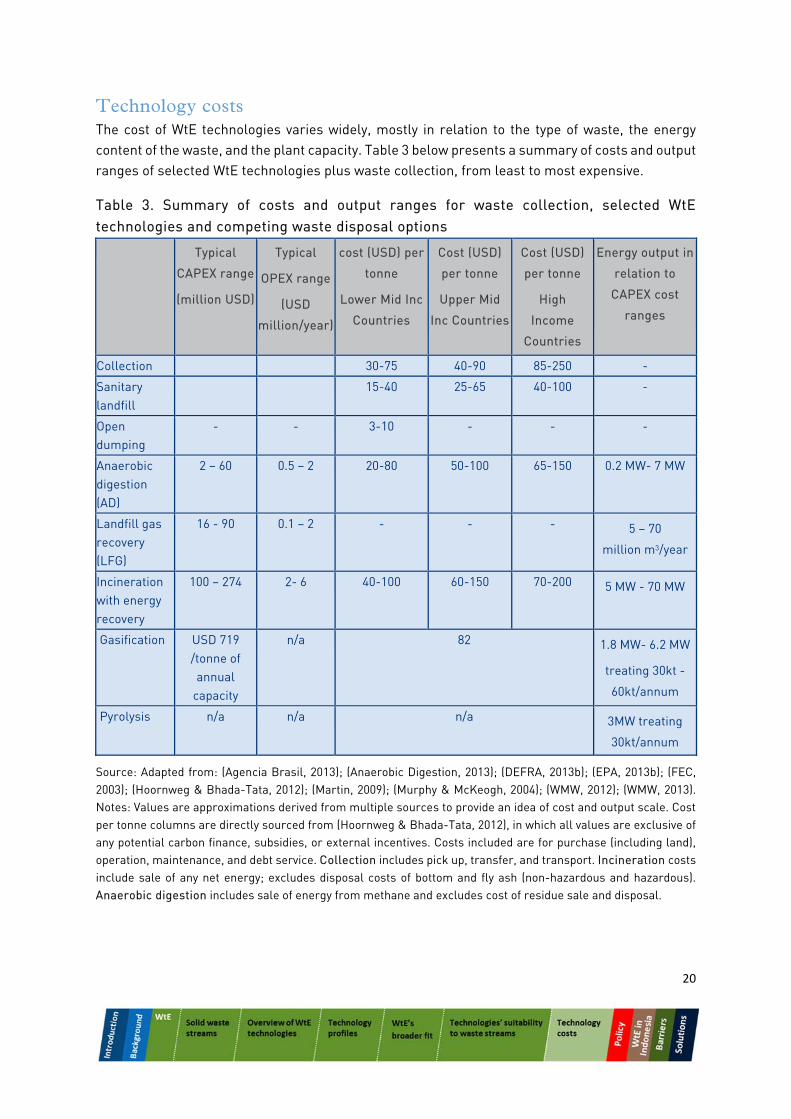
Technology costs The cost of WtE technologies varies widely, mostly in relation to the type of waste, the energy content of the waste, and the plant capacity. Table 3 below presents a summary of costs and output ranges of selected WtE technologies plus waste collection, from least to most expensive.
Table 3. Summary of costs and output ranges for waste collection, selected WtE technologies and competing waste disposal options Typical
CAPEX range
(million USD)
Typical
OPEX range
(USD
million/year)
cost (USD) per
tonne
Lower Mid Inc
Countries
Cost (USD)
per tonne
Upper Mid
Inc Countries
Cost (USD)
per tonne
High
Income
Countries
Energy output in
relation to
CAPEX cost
ranges
Collection 30-75 40-90 85-250 -
Sanitary landfill
15-40 25-65 40-100 -
Open dumping
- - 3-10 - - -
Anaerobic digestion (AD)
2 – 60
0.5 – 2 20-80 50-100 65-150 0.2 MW- 7 MW
Landfill gas recovery (LFG)
16 - 90 0.1 – 2 - - - 5 – 70
million m3/year
Incineration with energy recovery
100 – 274 2- 6 40-100 60-150 70-200 5 MW - 70 MW
Gasification USD 719 /tonne of annual
capacity
n/a 82 1.8 MW- 6.2 MW
treating 30kt -
60kt/annum
Pyrolysis n/a n/a n/a 3MW treating
30kt/annum
Source: Adapted from: (Agencia Brasil, 2013); (Anaerobic Digestion, 2013); (DEFRA, 2013b); (EPA, 2013b); (FEC, 2003); (Hoornweg & Bhada-Tata, 2012); (Martin, 2009); (Murphy & McKeogh, 2004); (WMW, 2012); (WMW, 2013). Notes: Values are approximations derived from multiple sources to provide an idea of cost and output scale. Cost per tonne columns are directly sourced from (Hoornweg & Bhada-Tata, 2012), in which all values are exclusive of any potential carbon finance, subsidies, or external incentives. Costs included are for purchase (including land), operation, maintenance, and debt service. Collection includes pick up, transfer, and transport. Incineration costs include sale of any net energy; excludes disposal costs of bottom and fly ash (non-hazardous and hazardous). Anaerobic digestion includes sale of energy from methane and excludes cost of residue sale and disposal.
21
For MSW incineration, thermal output is the key parameter determining the investment and operating costs, more than the MSW mass throughput. The thermal output determines the size of the boiler and primarily the flue-gas volume and therefore the size of the flue-gas cleaning devices (EC, 2006). MSW with high moisture content has less thermal output, than drier waste. The cost of MSW incineration is therefore likely to be higher in countries with high shares of organic waste, such as Indonesia, when compared to the costs of MSW incineration in European countries.
Below, examples of CAPEX and OPEX cost analysis are presented for thermal WtE plants with relation to their scale in the UK and for AD plants with relation to their capacity in Europe. Other European examples of CAPEX and OPEX cost analysis for MSW incinerators are presented in Appendix II.
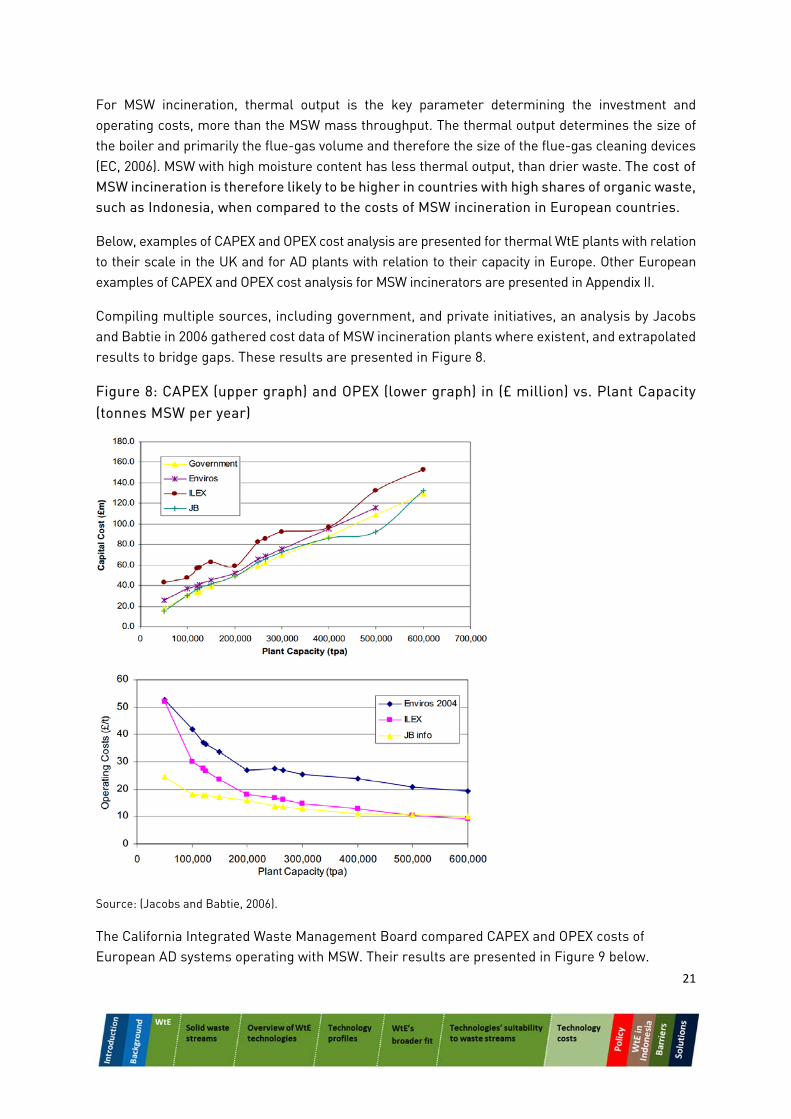
Compiling multiple sources, including government, and private initiatives, an analysis by Jacobs and Babtie in 2006 gathered cost data of MSW incineration plants where existent, and extrapolated results to bridge gaps. These results are presented in Figure 8.
Figure 8: CAPEX (upper graph) and OPEX (lower graph) in (£ million) vs. Plant Capacity (tonnes MSW per year)
Source: (Jacobs and Babtie, 2006).
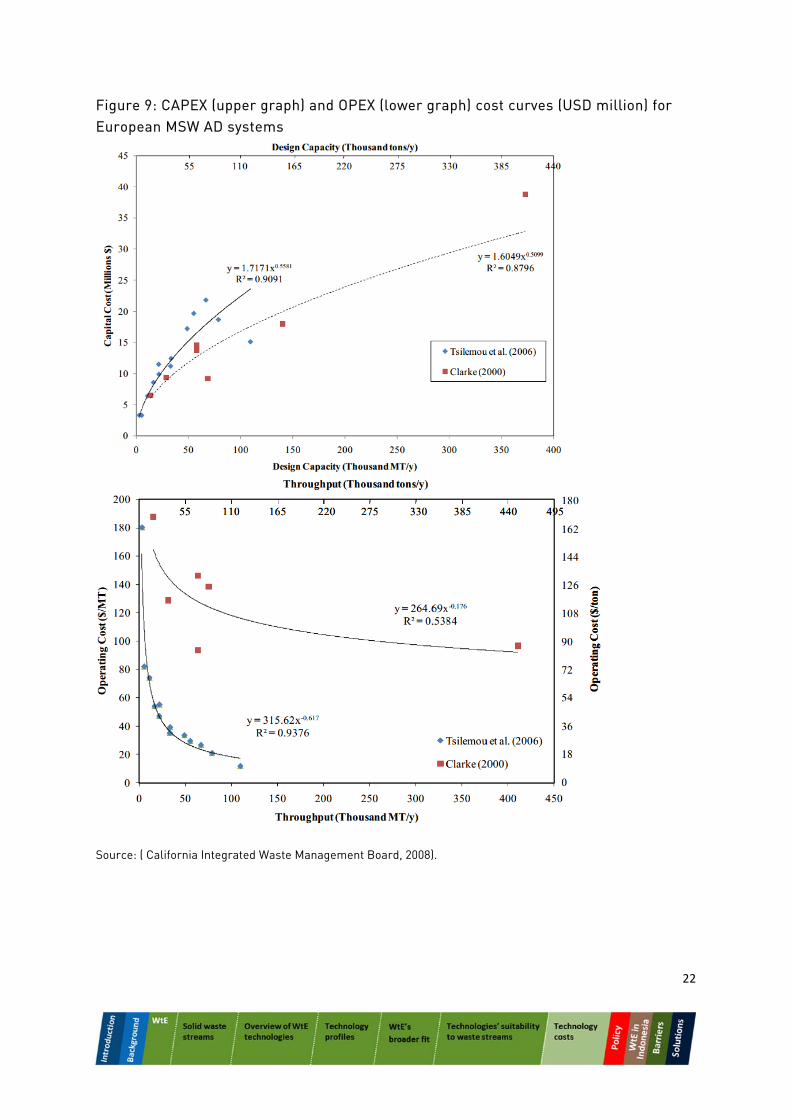
The California Integrated Waste Management Board compared CAPEX and OPEX costs of European AD systems operating with MSW. Their results are presented in Figure 9 below.
22
Figure 9: CAPEX (upper graph) and OPEX (lower graph) cost curves (USD million) for European MSW AD systems
Source: ( California Integrated Waste Management Board, 2008).
23
5 Current energy and waste management policies
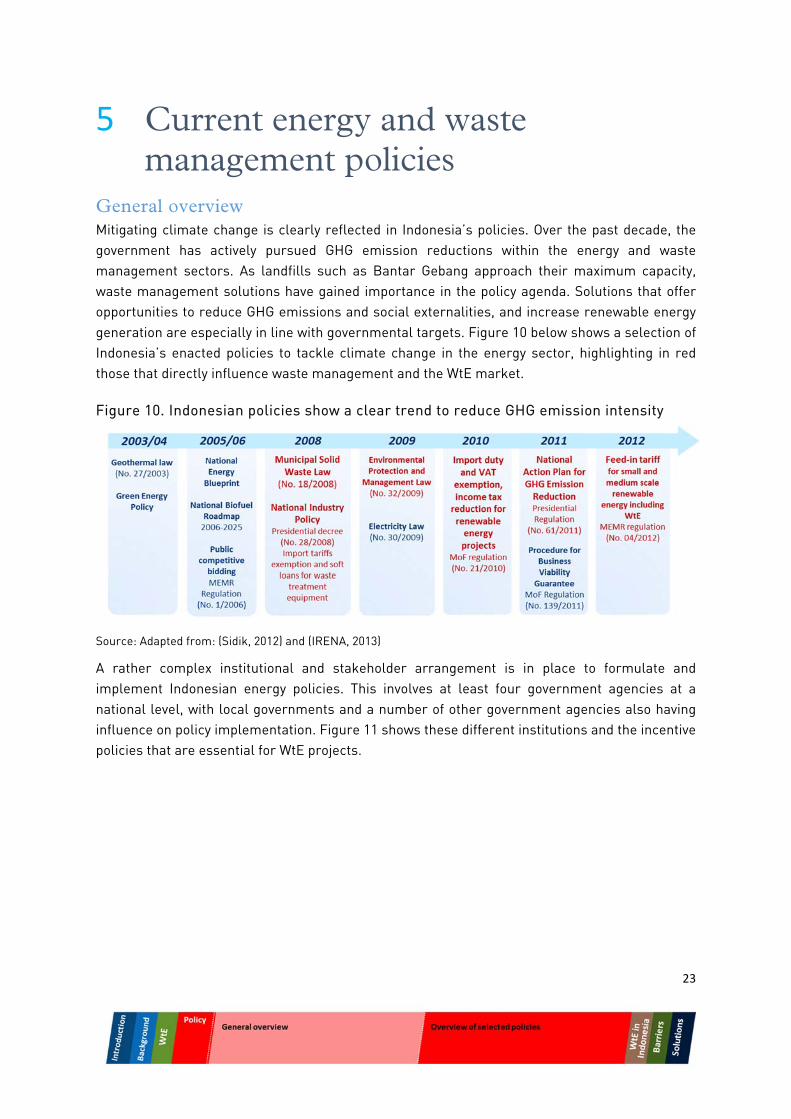
General overview Mitigating climate change is clearly reflected in Indonesia’s policies. Over the past decade, the government has actively pursued GHG emission reductions within the energy and waste management sectors. As landfills such as Bantar Gebang approach their maximum capacity, waste management solutions have gained importance in the policy agenda. Solutions that offer opportunities to reduce GHG emissions and social externalities, and increase renewable energy generation are especially in line with governmental targets. Figure 10 below shows a selection of Indonesia’s enacted policies to tackle climate change in the energy sector, highlighting in red those that directly influence waste management and the WtE market.
Figure 10. Indonesian policies show a clear trend to reduce GHG emission intensity
Source: Adapted from: (Sidik, 2012) and (IRENA, 2013)
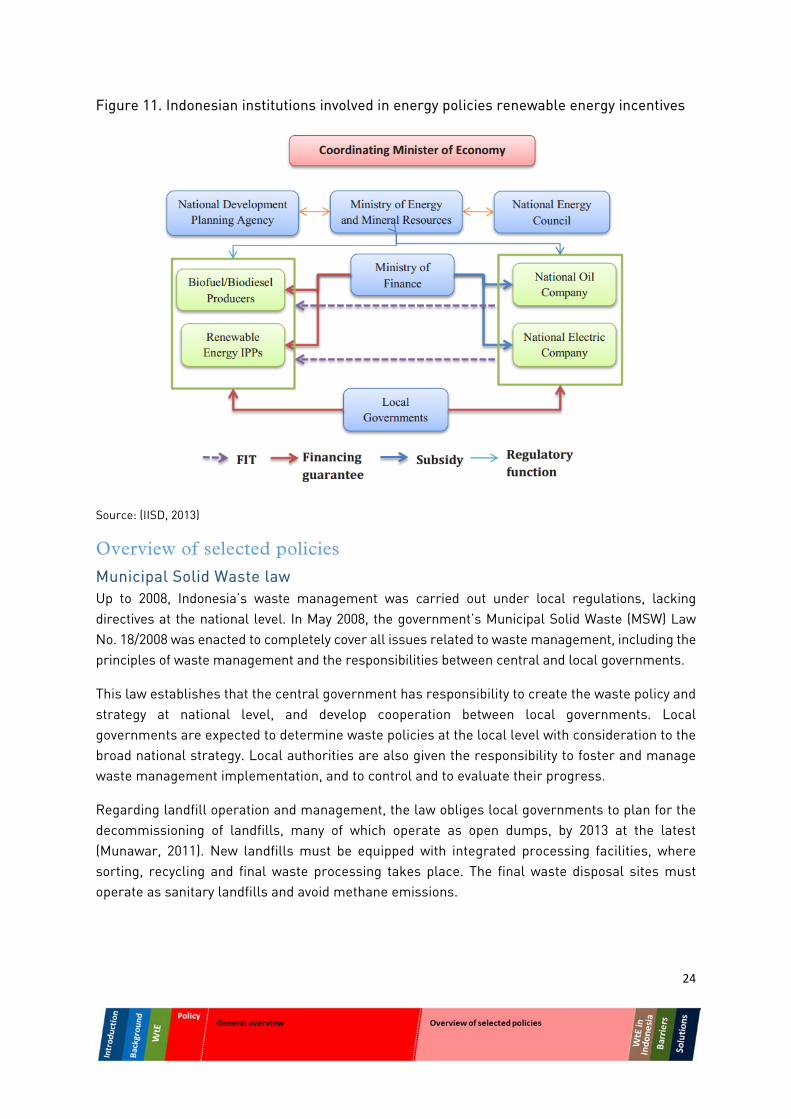
A rather complex institutional and stakeholder arrangement is in place to formulate and implement Indonesian energy policies. This involves at least four government agencies at a national level, with local governments and a number of other government agencies also having influence on policy implementation. Figure 11 shows these different institutions and the incentive policies that are essential for WtE projects.
24
Figure 11. Indonesian institutions involved in energy policies renewable energy incentives
Source: (IISD, 2013)
Overview of selected policies
Municipal Solid Waste law Up to 2008, Indonesia’s waste management was carried out under local regulations, lacking directives at the national level. In May 2008, the government’s Municipal Solid Waste (MSW) Law No. 18/2008 was enacted to completely cover all issues related to waste management, including the principles of waste management and the responsibilities between central and local governments.
This law establishes that the central government has responsibility to create the waste policy and strategy at national level, and develop cooperation between local governments. Local governments are expected to determine waste policies at the local level with consideration to the broad national strategy. Local authorities are also given the responsibility to foster and manage waste management implementation, and to control and to evaluate their progress.
Regarding landfill operation and management, the law obliges local governments to plan for the decommissioning of landfills, many of which operate as open dumps, by 2013 at the latest (Munawar, 2011). New landfills must be equipped with integrated processing facilities, where sorting, recycling and final waste processing takes place. The final waste disposal sites must operate as sanitary landfills and avoid methane emissions.
25
Following the enactment of the MSW law, Indonesia’s Ministry of Environment (MoE) formulated regulations for waste minimisation and handling to assist municipalities to move forward with the decommissioning of landfills, but most municipalities are still unable to comply with the regulation.
In combination with the broad MSW law, the National Industrial Policy and the Environmental Protection and Management law were developed to enable improved waste management in the industrial sectors.
National Industrial Policy and Environmental Protection and Management law The National Industrial Policy (No. 28/2008) aims to accelerate industrial development in Indonesia using mechanisms such as tariff exemptions on waste treatment & pollution control equipment; soft loans and grants for the acquisition of such equipment; and a voluntary eco-labelling scheme to enhance industrial efficiency (WTO, 2013) (Meidiana & Gamse, 2010).
Environmental Protection and Management Law No. 32/20095 superseded earlier environmental laws and provided a push to stricter industrial waste management. It requires highly pollutant industrial sectors to obtain detailed permits which restrict their solid, liquid and gaseous emissions, and introduces harsher penalties for those who fail to comply. Although the law has been criticised for increasing legal hurdles for the industry (ALB, 2010), it strengthens the case for modern industrial WtE solutions that can reduce industrial emissions, such as incineration of solid waste in cement kilns.
The Ministry of Environment is preparing a regulation to impose stricter control on the industrial waste6. The new regulation is expected to oblige industries (including thermal WtE) to submit documents stating their abilities adequately treat waste before requiring permits to collect and/or manage waste categorized as hazardous.
Import duty exemption and income tax reduction
In 2010, the Ministry of Finance’s regulation (No.21/2010) enacted import duty exemptions on machinery and capital for the development of renewable power plants, which includes those fuelled by solid waste. The policy also determined the various facilities for income tax on energy development projects, including net income reduction, accelerated depreciation, and a reduction of dividends for foreign investors and compensation for losses (IISD, 2013).
National Action Plan for GHG Emission Reduction In 2009, Indonesia endorsed the Copenhagen Accord when it voluntarily committed to reduce its GHG emissions by 26% (with national efforts) and by 41% (with international supports) by 2020 compared to BAU (UNFCCC, 2009) (Witoelar, 2009). To achieve these targets Indonesia developed a National Action Plan for GHG Emission Reduction, or Rencana Aksi Nasional Penurunan Emisi Gas Rumah Kaca (RAN GRK), enacted through the Presidential Regulation (No. 61/2011). RAN GRK is relevant for Indonesia’s WtE market as it defines targets for increased renewable energy participation and for waste sector GHG emission reductions. Renewables are to provide 30.9% of
5 Law No. 32/2009 can be found in the following link: http://www.env.go.jp/en/recycle/asian_net/Country_Information/Law_N_Regulation/Indonesia/law32‐2009.pdf 6 http://www.thejakartapost.com/news/2014/02/11/govt-plans-impose-stricter-control-industrial-waste.html
26
electricity generation by 2030; renewable generation capacity is to rise by 10 GW by 2025 (REN21, 2014); and the waste sector must reduce GHG emission by 48 MtCO2e under the 26% target and 78 MtCO2e under the 41% target (UNFCCC, 2009).
To achieve its waste-related targets, RAN GRK set a list of priority actions involving municipal solid waste and waste water management systems (Sidik, 2012):
Improvement of institutional capacity and regulation at local level; Improvement of urban waste water management systems; Minimisation of MSW generation through 3Rs (reduce, reuse and recycle) activities; Improvement of MSW handling at final disposal; Improvement of final disposal; Utilisation of waste as source of clean energy.
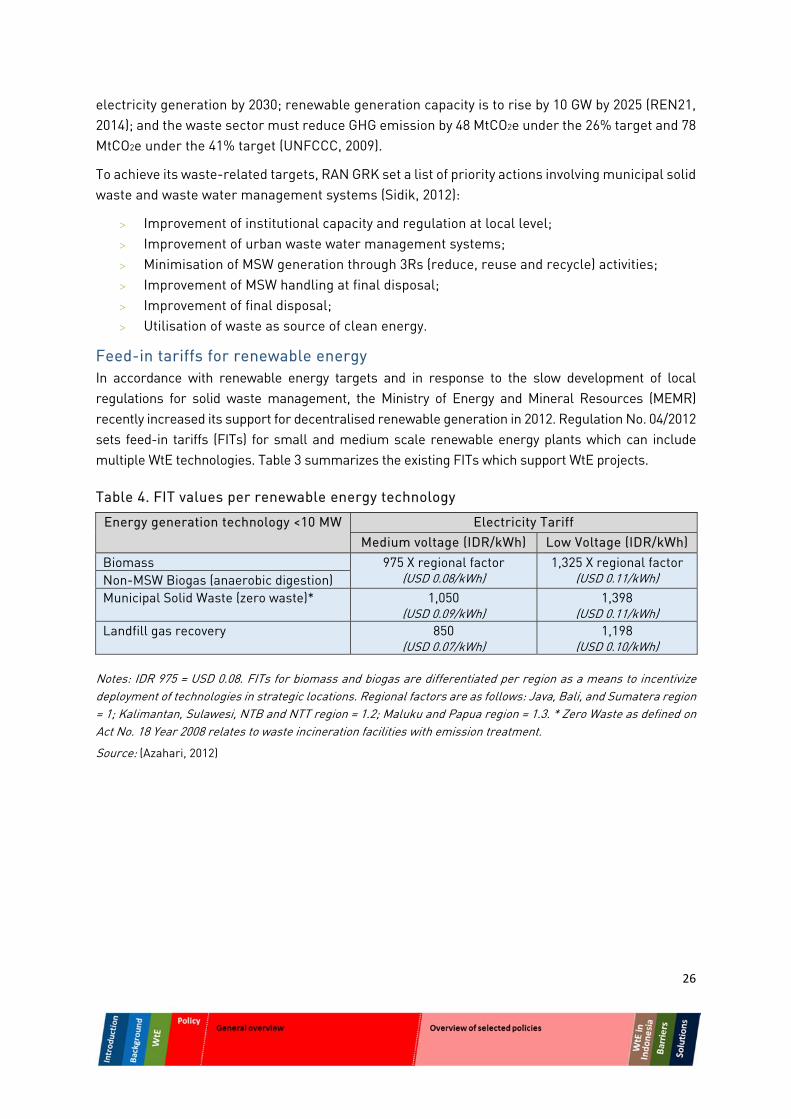
Feed-in tariffs for renewable energy In accordance with renewable energy targets and in response to the slow development of local regulations for solid waste management, the Ministry of Energy and Mineral Resources (MEMR) recently increased its support for decentralised renewable generation in 2012. Regulation No. 04/2012 sets feed-in tariffs (FITs) for small and medium scale renewable energy plants which can include multiple WtE technologies. Table 3 summarizes the existing FITs which support WtE projects.
Table 4. FIT values per renewable energy technology
Energy generation technology <10 MW Electricity Tariff Medium voltage (IDR/kWh) Low Voltage (IDR/kWh)
Biomass 975 X regional factor (USD 0.08/kWh)
1,325 X regional factor (USD 0.11/kWh) Non-MSW Biogas (anaerobic digestion)
Municipal Solid Waste (zero waste)* 1,050 (USD 0.09/kWh)
1,398 (USD 0.11/kWh)
Landfill gas recovery 850 (USD 0.07/kWh)
1,198 (USD 0.10/kWh)
Notes: IDR 975 = USD 0.08. FITs for biomass and biogas are differentiated per region as a means to incentivize deployment of technologies in strategic locations. Regional factors are as follows: Java, Bali, and Sumatera region = 1; Kalimantan, Sulawesi, NTB and NTT region = 1.2; Maluku and Papua region = 1.3. * Zero Waste as defined on Act No. 18 Year 2008 relates to waste incineration facilities with emission treatment.
Source: (Azahari, 2012)
27
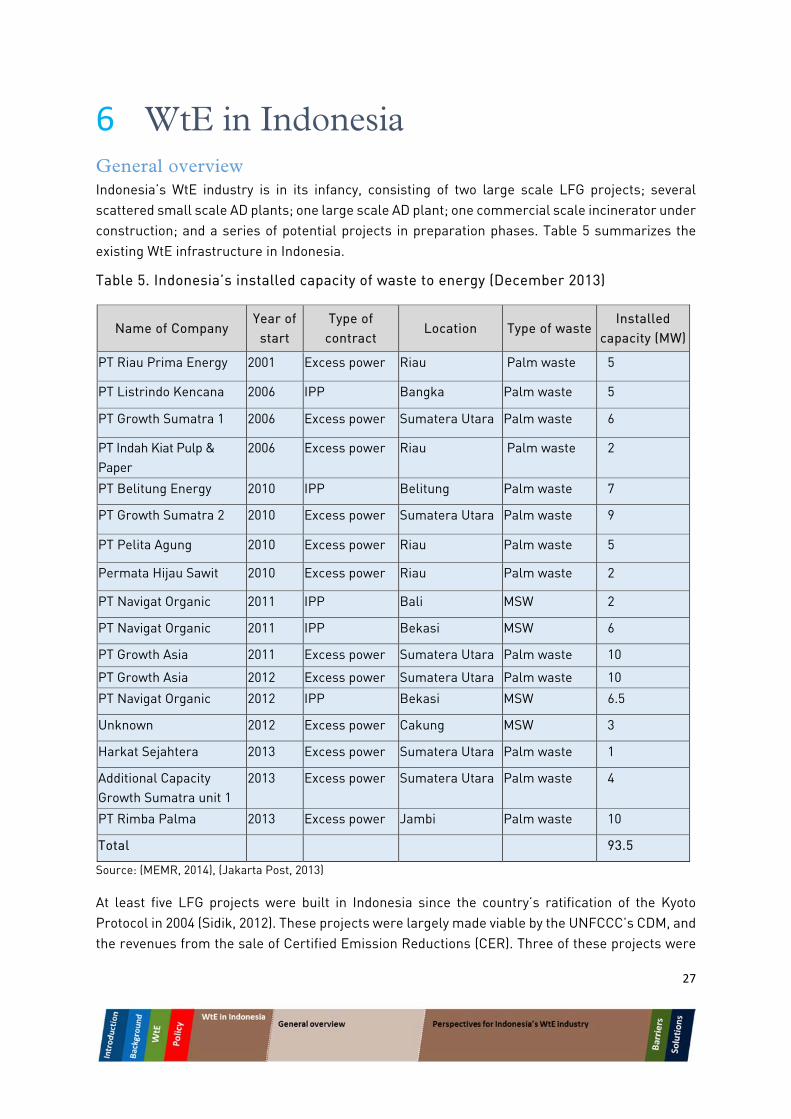
6 WtE in Indonesia General overview Indonesia’s WtE industry is in its infancy, consisting of two large scale LFG projects; several scattered small scale AD plants; one large scale AD plant; one commercial scale incinerator under construction; and a series of potential projects in preparation phases. Table 5 summarizes the existing WtE infrastructure in Indonesia.
Table 5. Indonesia’s installed capacity of waste to energy (December 2013)
Name of Company Year of
start Type of
contract Location Type of waste
Installed capacity (MW)
PT Riau Prima Energy 2001 Excess power Riau Palm waste 5
PT Listrindo Kencana 2006 IPP Bangka Palm waste 5
PT Growth Sumatra 1 2006 Excess power Sumatera Utara Palm waste 6
PT Indah Kiat Pulp & Paper
2006 Excess power Riau Palm waste 2
PT Belitung Energy 2010 IPP Belitung Palm waste 7
PT Growth Sumatra 2 2010 Excess power Sumatera Utara Palm waste 9
PT Pelita Agung 2010 Excess power Riau Palm waste 5
Permata Hijau Sawit 2010 Excess power Riau Palm waste 2
PT Navigat Organic 2011 IPP Bali MSW 2
PT Navigat Organic 2011 IPP Bekasi MSW 6
PT Growth Asia 2011 Excess power Sumatera Utara Palm waste 10
PT Growth Asia 2012 Excess power Sumatera Utara Palm waste 10
PT Navigat Organic 2012 IPP Bekasi MSW 6.5
Unknown 2012 Excess power Cakung MSW 3
Harkat Sejahtera 2013 Excess power Sumatera Utara Palm waste 1
Additional Capacity Growth Sumatra unit 1
2013 Excess power Sumatera Utara Palm waste 4
PT Rimba Palma 2013 Excess power Jambi Palm waste 10
Total 93.5
Source: (MEMR, 2014), (Jakarta Post, 2013)
At least five LFG projects were built in Indonesia since the country’s ratification of the Kyoto Protocol in 2004 (Sidik, 2012). These projects were largely made viable by the UNFCCC’s CDM, and the revenues from the sale of Certified Emission Reductions (CER). Three of these projects were
28
discontinued following an acute decrease in CER values over the past few years and the uncertainty of the CDM’s continuation. Currently, two LFG projects (Bantar Gebang and Bali) represent all of Indonesia’s LFG capacity of 8MW (Dadan, 2013), about 0.01% of Indonesia’s total capacity of 40 GW (IEA, 2012).
Of existing LFG projects, Bantar Gebang stands out for its plan to integrate other WtE technologies. Operated by a joint venture between PT Godang Tua Jaya and Navigat Organic Energy, the existing LFG plant required a total investment of IDR 700 billion (USD 70 million), and operates with a tipping fee of IDR 114,000/tonne (USD 9.3/tonne). Interviewees indicate that only about two-thirds of its installed capacity of 6MW are actually utilized, due to technical hindrances that limit the production of methane.
Despite the technical constraints, the consortium intends to increase and optimize the facility’s waste treatment capacity. To enhance its recovery of value from waste two new complimentary WtE technologies are planned to be implemented in the same site in the coming years. A new AD facility of 7MW capacity and a pyrolysis plant are being constructed and are expected to be active in the coming years. When active, these are expected to significantly decrease the volume of waste to be landfilled, generating biogas and 300 tonnes per day of compost. Bantar Gebang receives up to 6,000 tonnes of waste per day, though the WtE facility would only process 2,000 tonnes.
Beyond the existing policies to support WtE projects in Indonesia, such as the FIT and tax reduction policies described below, Bantar Gebang’s LFG project and expected subsequent developments were made possible by three key agreements. Firstly, the private joint venture agreed with the provincial government of Jakarta on a 15 year Design Build Operate Transfer contract. That is, the private companies are allowed to build and operate the site for 15 years after which its ownership is passed to the government. Secondly, a waste supply agreement with the provincial government guaranteed to supply 4,500 tonnes/day of waste to the facility, providing safety for the investors. Thirdly, the private joint venture secured a Power Purchase Agreement (PPA) with Indonesia’s PT PLN, the state-owned electricity distributer, securing the sales of all the electricity produced in the site.
Anaerobic digestion (AD) systems are well known in Indonesia’s agricultural sector, although generally limited to small scales. Palm oil producers are known to use Palm Oil Mill Effluent (POME) as a feedstock to anaerobic digesters, generating biogas and electricity to offset some of the agricultural energy demand. Only one commercial scale AD plant is known to operate in the city of Cakung where mixed MSW is sorted to recover recyclables before directing the rest to a large anaerobic digester (Jakarta Post, 2013). The biogas powers about 3MW of electricity generators. Indonesia’s total generation capacity of anaerobic digestion in Indonesia is unknown.
One commercial scale thermal treatment facility is currently in construction in Surabaya, while 64 small incinerators with no energy recovery are (or have been) operational, scattered throughout Indonesia (End, 2013); (IndII, 2011); (UNEP, 2013). Incinerators have historically faced significant public opposition in Indonesia, as seen in (GAIA, 2008). New large-scale incineration plants are therefore likely to face some degree of public opposition.
The commercial scale thermal treatment facility under construction in Surabaya is led by Indonesian engineering company PT Sumber Organik. The company won the tender to build a
29
waste treatment facility in Surabaya in 2012, with an offer to build a 2 MW LFG plant and a 7 MW gasification plant, adding to IDR 316 billion (USD 26 million). The facility’s initial tipping fee is expected to be as low as IDR 119,000/tonne (USD 9.76/tonne).
Similar to what was seen in Bantar Gebang, three key agreements beyond the existing incentives were crucial to have this project go ahead. Firstly, the tender, held by Surabaya’s provincial government, offered a 20 year design build operate transfer (BOT) contract for the company willing to implement an LFG and a thermal treatment technology in the local landfill. The agreement with the provincial government determined the tipping fee would increase by 7% annually until 2019, remaining flat thereafter. Secondly, the municipality of Surabaya signed a guarantee to supply 1,000 tonnes/day of waste, with penalties for non-compliance, which provided sufficient security of feedstock for investors. Thirdly, a PPA was agreed with PT PLN, providing sufficient revenue security for investors. As a result, Sumber Organik calculated an internal rate of return (IRR) of 14 to 15% with expected pay-back period of 7 years.
Interviewees indicate that the tendering process performed by Surbaya’s provincial government presented barriers for potential investors. Primarily there are indications that the tender process was lengthy and lacked transparency. Lasting for about 4 years, the process was said to be largely influenced by political forces who questioned the choice for the winning company and demanded lower tipping fees even after the tender had been awarded. Secondly, interviewees report that municipalities lack understanding of waste management facilities. While they are eager to partner with private companies to manage waste treatment facilities, they were unwilling to pay the tipping fee deemed to be required for the project’s viability. These factors combined were said to discourage potential bidders.
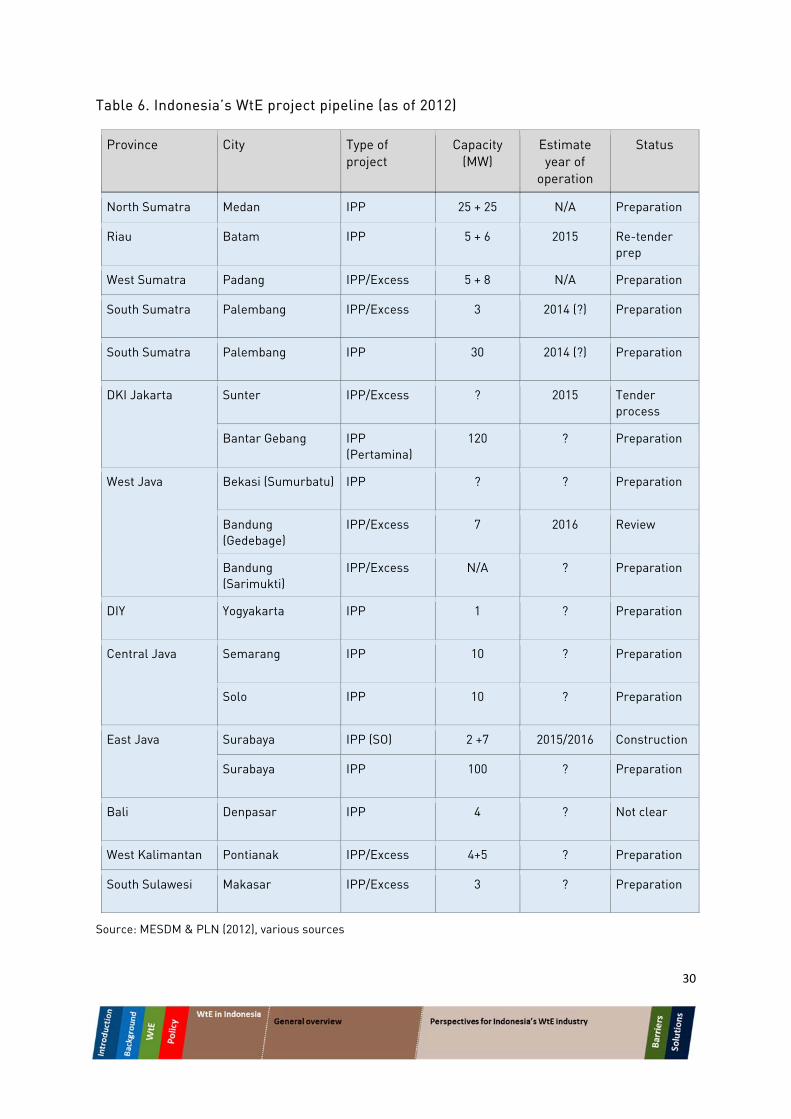
Perspectives for Indonesia’s WtE industry Beyond the existing WtE facilities described above, Indonesia has a pipeline of projects in different preparation phases. Although at this stage it is unclear whether they will all operate, together they amount to another 373MW of capacity. Consisting mostly of thermal treatment facilities, these projects are planned to receive agricultural waste and MSW. A highlight of the projects in the pipeline is the integrated gasification plant planned for Bantar-Gebang, for which a detailed feasibility assessment is currently being developed. Led by the Indonesian engineering company PT Godang Tua Jaya, the assessment indicates an investment need between USD 250 - 300 million, for a prospective 120 MW gasification power plant. There is currently no estimate to begin the construction of this facility. Table 6 shows potential upcoming WtE projects in Indonesia as of 2012.
30
Table 6. Indonesia’s WtE project pipeline (as of 2012)
Province City Type of project
Capacity (MW)
Estimate year of
operation
Status
North Sumatra Medan IPP 25 + 25 N/A Preparation
Riau Batam IPP 5 + 6 2015 Re-tender prep
West Sumatra Padang IPP/Excess 5 + 8 N/A Preparation
South Sumatra Palembang IPP/Excess 3 2014 (?) Preparation
South Sumatra Palembang IPP 30 2014 (?) Preparation
DKI Jakarta Sunter IPP/Excess ? 2015 Tender process
Bantar Gebang IPP (Pertamina)
120 ? Preparation
West Java Bekasi (Sumurbatu) IPP ? ? Preparation
Bandung (Gedebage)
IPP/Excess 7 2016 Review
Bandung (Sarimukti)
IPP/Excess N/A ? Preparation
DIY Yogyakarta IPP 1 ? Preparation
Central Java Semarang IPP 10 ? Preparation
Solo IPP 10 ? Preparation
East Java Surabaya IPP (SO) 2 +7 2015/2016 Construction
Surabaya IPP 100 ? Preparation
Bali Denpasar IPP 4 ? Not clear
West Kalimantan Pontianak IPP/Excess 4+5 ? Preparation
South Sulawesi Makasar IPP/Excess 3 ? Preparation
Source: MESDM & PLN (2012), various sources
31
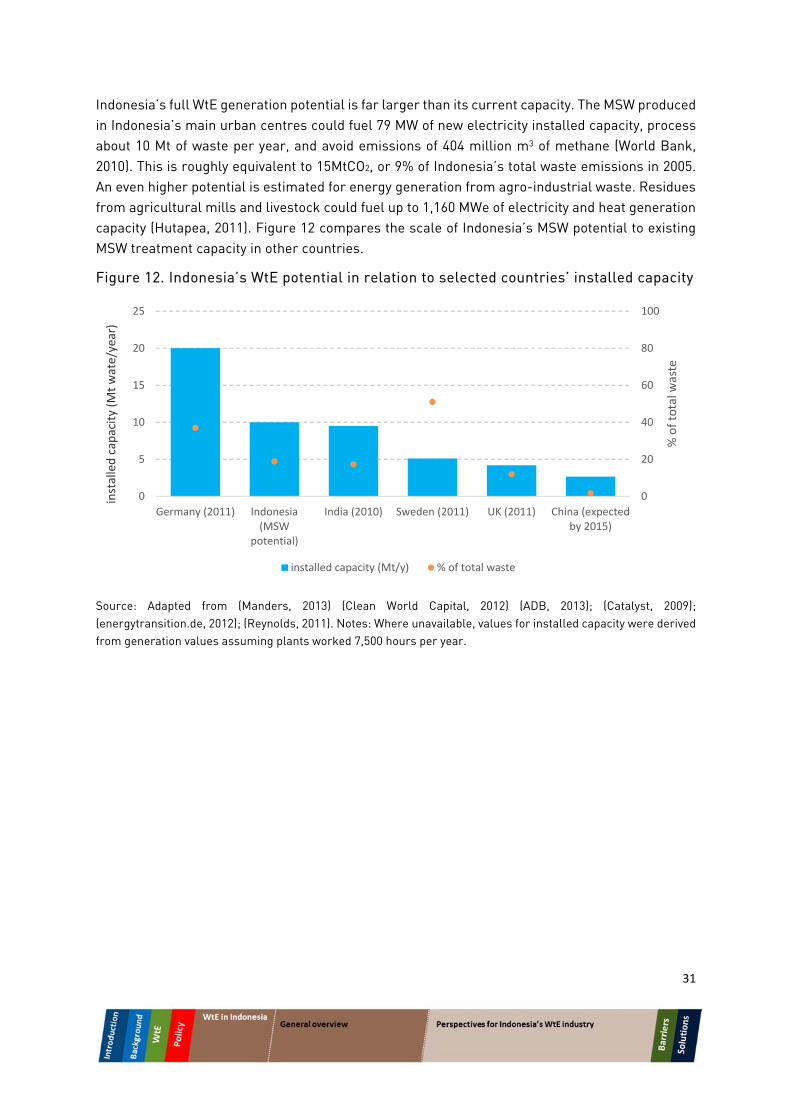
Indonesia’s full WtE generation potential is far larger than its current capacity. The MSW produced in Indonesia’s main urban centres could fuel 79 MW of new electricity installed capacity, process about 10 Mt of waste per year, and avoid emissions of 404 million m3 of methane (World Bank, 2010). This is roughly equivalent to 15MtCO2, or 9% of Indonesia’s total waste emissions in 2005. An even higher potential is estimated for energy generation from agro-industrial waste. Residues from agricultural mills and livestock could fuel up to 1,160 MWe of electricity and heat generation capacity (Hutapea, 2011). Figure 12 compares the scale of Indonesia’s MSW potential to existing MSW treatment capacity in other countries.
Figure 12. Indonesia’s WtE potential in relation to selected countries’ installed capacity
Source: Adapted from (Manders, 2013) (Clean World Capital, 2012) (ADB, 2013); (Catalyst, 2009); (energytransition.de, 2012); (Reynolds, 2011). Notes: Where unavailable, values for installed capacity were derived from generation values assuming plants worked 7,500 hours per year.
0
20
40
60
80
100
0
5
10
15
20
25
Germany (2011) Indonesia(MSW
potential)
India (2010) Sweden (2011) UK (2011) China (expectedby 2015)
% of total w
aste
installed capacity (M
t wate/year)
installed capacity (Mt/y) % of total waste
32
7 Barriers Overview Despite the government’s policy efforts, Indonesia’s WtE sector remains small. Several barriers are slowing down deployment of WtE in Indonesia, as indeed they are in other countries. We have classified barriers into five broad categories: financial, technical, political, institutional and social, recognising that barriers often overlap and come together to form more complex issues.
Indeed, it is not always individual barriers that impede the development and deployment of WtE solutions, but rather a combination of barriers which, together, manifest as larger challenges that interfere with deployment.
The most common challenges are:
1. Economic, which includes revenue and cost barriers, but also elements of policy and technology risk, financial risks, institutional misalignment, and waste quality issues
2. Local capacity and political context, which revolve around the limited experience of local government with WtE and the potential for politicisation of projects
3. Social, which is a multifaceted challenge that considers the WtE from the perspective of voters, the importance of a well-articulated debate about the trade-offs required when implementing waste management solutions, and the need to address waste pickers
In this section, these three challenge areas are described in a narrative way to explain how they manifest in Indonesia. Each challenge is the result of interactions between a set of discrete barriers, and each barrier is particular in its own way. After describing the higher level challenges, we therefore describe each barrier in turn and include a description of how it is happening in Indonesia. Some barriers do not fit smoothly into any of the three overarching challenges, but are included in this section because they are also important to understanding specific barriers to WtE in Indonesia.
1. Economic challenges
The risk-weighted discounted revenues of a project over its lifetime must exceed its costs and provide project developers and investors with an acceptable return on their investment. This is a necessary condition for any commercial project, and if it is not achieved, projects will not go forward.
Project revenues for WtE facilities in Indonesia mainly come from two sources: from the sale of electricity (including the FIT) and from the tipping fee that is paid per tonne of accepted or processed waste. Some combination of these revenues must sufficiently outweigh costs to make a project economically viable, but must also aim to provide solutions that represent value for money, do not overburden the public budget, and avoid windfall profits for project developers and investors.
In Indonesia, the expected revenues for WtE, especially incineration, often fail to deliver an IRR of at least 15%, which is considered acceptable by both industry and government. The tipping fee and/or the FIT either need to increase, or costs need to come down, to make facilities economically viable.
33
Presently, local authorities seem prepared to pay a tipping fee of roughly USD 9-10 per tonne of waste, which contrasts with industry’s stated need for about USD 25-30 per tonne for incineration. Tipping fees for LFG WtE agreed in places like Jakarta are about USD 10 per tonne, and may be (inappropriately) influencing other municipalities' willingness to pay for more expensive WtE technologies like incineration. MEMR recently increased the WtE feed-in tariff rate to try to encourage deployment, but to be effective, it needs to be set in coordination with the tipping fee municipalities are prepared to pay, and also needs to be set with an understanding of the cost of different WtE solutions.
The challenge is rooted in a lack of information about the true costs of WtE technologies in Indonesia (especially incineration). Without accurate cost data, there remains uncertainty about what combination of tipping fees and FIT levels are required to make a WtE facility economically viable.
Without accurate cost information, it is also difficult to know what factors are influencing costs and how those factors can be addressed. It is understood that the cost of finance can be very high for WtE in Indonesia, with interest rates on debt finance reaching up to 30% for landfill gas projects. Equity investors would demand even higher rates of return. The high cost of finance makes it very difficult to make a project economically viable, and is brought about by a number of risks, including:
technology risk, since most WtE technologies have not be tested in the Indonesian context risk of policy change, where project developers may not have confidence in the longevity of
the FIT level since it is a relatively new instrument in the Indonesian WtE policy landscape risk of local government solvency, where there is concern that local government budgets
may be overcommitted at some point over the lifetime of a contract and recourse to compensation would be difficult or costly
risk of contractual default from PT PLN, which some interviewees highlighted as a major concern based on historical events
risk of currency fluctuations, which could affect the maintenance cost of a loan if money was lent or borrowed in a foreign currency
risk of public opposition to WtE facilities, which could influence the decisions of local politicians whose mandate is to represent its citizens’ interests and who also have the final say in WtE commissioning
risks of non-transparent local government processes, which may disadvantage project proponents even if they have the most competitive business case
There are additional barriers that manifest in the economics of WtE deployment. Since many WtE technologies are new to Indonesia, there are few locally trained people with the technical skills and operational capacity to design and run a WtE facility. Project developers rely on expensive international expertise to train workers and find limited support for these activities from government.
Another cost barrier stems from the quality of the waste itself. The characteristics of the waste affect the efficiency of WtE technologies. For example, if waste is very wet, it will either burn less efficiently in an incinerator, or will require pre-treatment, which raises costs. Those costs can be reduced by improving collection infrastructure (containerising waste and/or separating it at source), but such activities require local municipal capacity. Local authorities need to be able to evaluate the relative
34
costs of implementing structural changes to the waste management system versus paying a higher tipping fee to have WtE operators pay for pre-treatment or run plants less efficiently.
Finally, grid interconnection is also costly. PT PLN pays for grid interconnection, but has multiple investment priorities. Roughly a quarter of Indonesians lack access to electricity (World Bank, 2014), and PT PLN must use its limited budget to satisfy competing political priorities. In most cases, the costs of grid interconnection are too high to be borne by project proponents.
Overall, the economic challenge stems from a lack of information about the true costs of WtE technologies, which makes it difficult to put together a revenue package that appropriately considers costs. Not knowing which risks and other factors are driving costs makes it difficult to know how to address them.
Solutions and recommendations that aim to address the elements of this overarching challenge are described in the next chapter. But it is useful to note that these challenges touch on many barriers, including financial, government coordination, technical and issues of local capacity, and to recognise the interplay between the different barriers so that this is acknowledged when considering possible solutions.
2. Local capacity and political context
Moving a WtE project along a development journey requires significant participation from local political stakeholders and officials. Implementing a WtE project involves many steps: the initial concept stage; pre-feasibility and feasibility assessments; technology selection; public tendering; permitting and contractual agreements, including selecting an appropriate tipping fee; project finance; project implementation; operations; and eventually decommissioning.
Most of these require some degree of local government capacity. In a waste management environment that has only been open to commercial participation since 2008, and in which waste management competes with many other municipal issues for the attention of local government, it is unsurprising that well-developed processes and deep WtE expertise are sometimes lacking.
Issues may arise at any stage of project development. Alerting potential local or international WtE project developers to the municipal opportunity can be a preliminary hurdle to overcome. Many local governments do not have fully understand how potential WtE options relate to their own waste management system , so have difficulty engaging with WtE concept proposals.
Providing developers with basic information about local waste characteristics or allowing project developers to collect this information is also critical to the pre-feasibility and feasibility assessments, and heavily influences technology selection. Again, many local governments are not aware of the approximate costs and benefits of certain technologies, nor do they understand how different technologies address (or fail to address) the issues of greatest concern in their local context.
Awareness of technology costs and how these need to be compensated when combined with the electricity price and FIT is also crucial when local governments engage with national government stakeholders. But Indonesian experience shows that municipalities and developers can have vastly different expectations when considering what makes an appropriate tipping fee (sometimes differing by a factor of three).
35
Vertical coordination between levels of government is important so that a competitive economic package can be offered to developers. It also helps to detect spurious promises from developers and avoid embarrassment if suspiciously attractive financial promises are made upfront, as has happened in some cases. But this type of coordination could be improved in Indonesia.
Clear and transparent processes for project selection are also critical to building trust in the industry, especially at this point when it is in its infancy, but the politicisation of some projects is threatening this. Additionally, local governments need to understand how their contractual terms affect the financial terms that developers are able to secure from banks and other investors, which ultimately affects the costs that are passed on to local governments through the tipping fee.
3. Social challenges
The purpose of any waste management activity is to improve conditions for people in a community by minimising the negative impacts of waste. Impacts include public health, environmental protection, and also financial cost. WtE should therefore be viewed according to its overall impact on the population, and weighed against other approaches to waste management.
Any waste solution involves trade-offs. Landfill expansion faces strong opposition in Indonesia, which is a major motivator for local governments to come up with alternative solutions. While LFG projects are useful because they generate electricity from what would otherwise be a wasted and harmful pollutant (methane), they do not deal with the fundamental waste volume problem, nor the odour issue that frustrates nearby residents. That is why many municipalities are eager to implement so-called “zero waste” incineration WtE solutions. The opportunities presented by AD technology have perhaps been less explored in terms of waste volume reduction, but they offer potential.
While fewer barriers fall under the higher-level social challenge, it is nevertheless a serious obstacle to WtE deployment, and impacts upon the previous two challenges. Social resistance to certain technologies may be rooted in incorrect information, and may unduly influence political decision making when WtE tenders are being considered. Public cooperation through behaviour change may be needed to make certain technologies economically viable, but a lack of knowledge about the role of citizen participation in waste management may hamper WtE operations.
Additionally, social barriers may stem from a lack of deep and broad stakeholder engagement by local authorities. Without public participation in the process, WtE technologies may not get a ‘social licence to operate,’ which could delay political approvals and construction times, and create resistance to behaviour changes designed to enable the technology, like source separation or containerisation. All of these could affect costs.
Finally, waste pickers are important and need to be considered in the development of WtE solutions. Their support for projects makes implementations much easier, and projects that fail to engage with them are likely to face significant on-the-ground challenges.
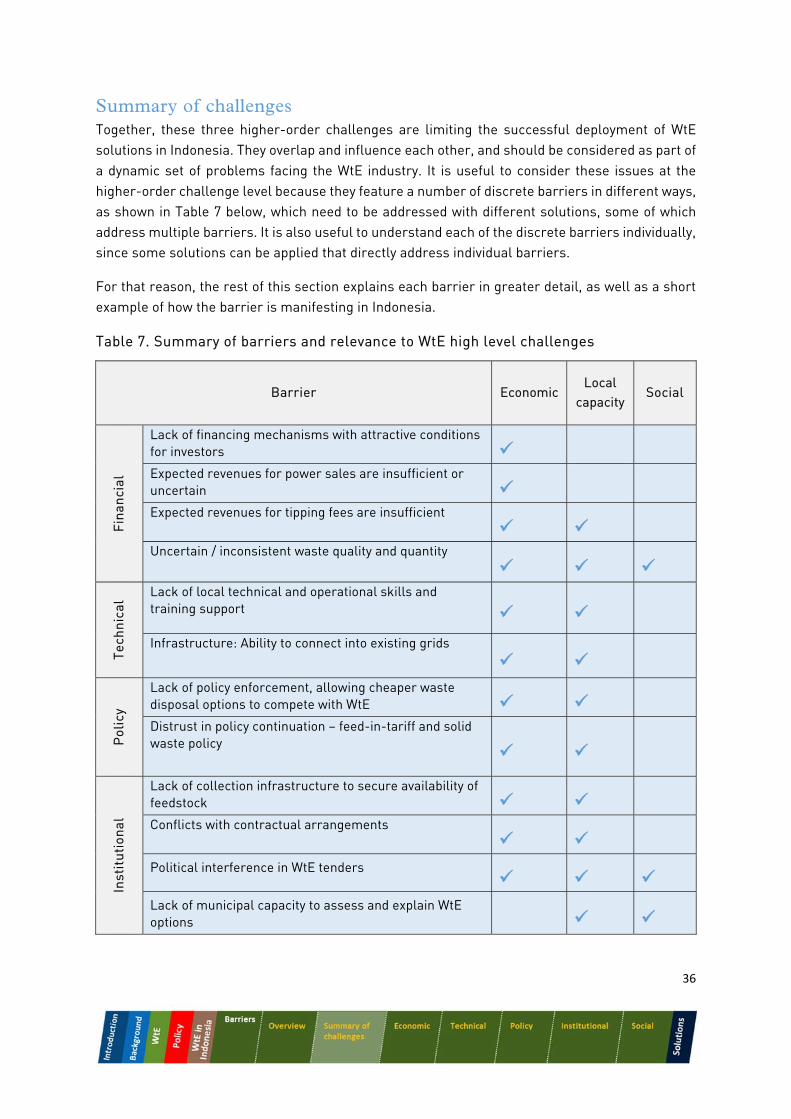
36
Summary of challenges Together, these three higher-order challenges are limiting the successful deployment of WtE solutions in Indonesia. They overlap and influence each other, and should be considered as part of a dynamic set of problems facing the WtE industry. It is useful to consider these issues at the higher-order challenge level because they feature a number of discrete barriers in different ways, as shown in Table 7 below, which need to be addressed with different solutions, some of which address multiple barriers. It is also useful to understand each of the discrete barriers individually, since some solutions can be applied that directly address individual barriers.
For that reason, the rest of this section explains each barrier in greater detail, as well as a short example of how the barrier is manifesting in Indonesia.
Table 7. Summary of barriers and relevance to WtE high level challenges
Barrier EconomicLocal
capacity Social
Fina
ncia
l
Lack of financing mechanisms with attractive conditions for investors
Expected revenues for power sales are insufficient or uncertain Expected revenues for tipping fees are insufficient
Uncertain / inconsistent waste quality and quantity
Tech
nica
l Lack of local technical and operational skills and training support
Infrastructure: Ability to connect into existing grids
Pol
icy
Lack of policy enforcement, allowing cheaper waste disposal options to compete with WtE Distrust in policy continuation – feed-in-tariff and solid waste policy
Inst
itut
iona
l
Lack of collection infrastructure to secure availability of feedstock Conflicts with contractual arrangements
Political interference in WtE tenders
Lack of municipal capacity to assess and explain WtE options
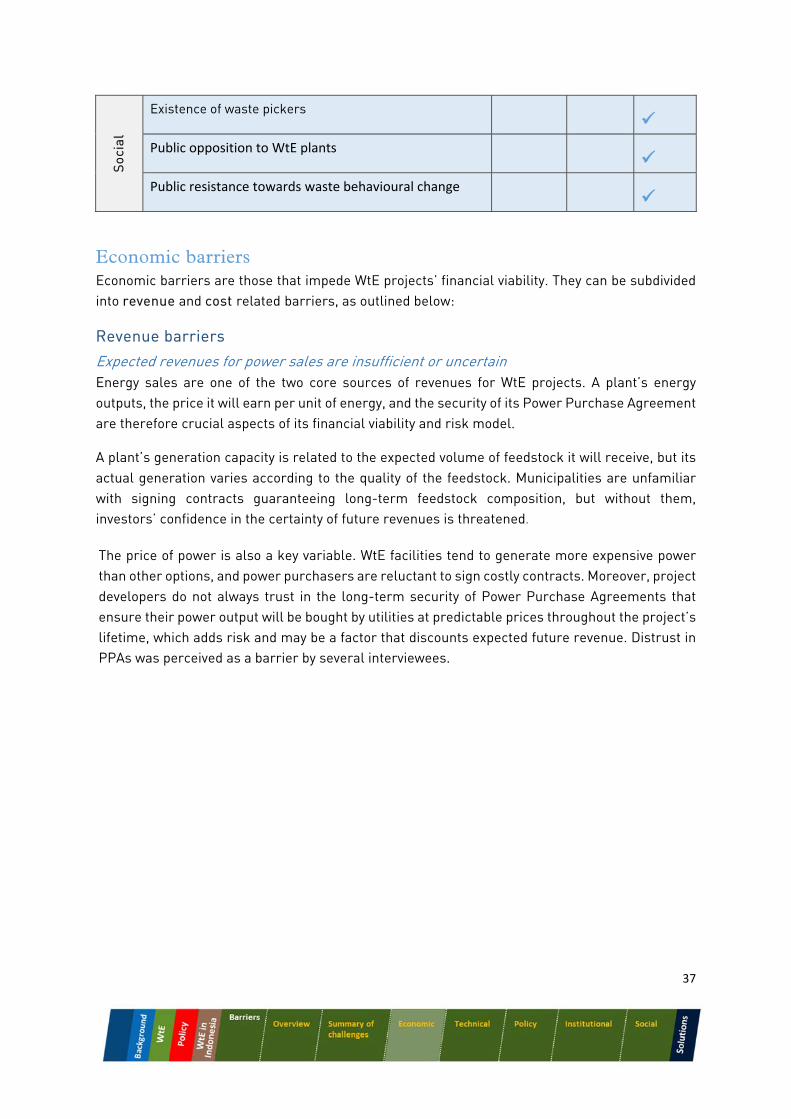
37
Soc
ial
Existence of waste pickers
Public opposition to WtE plants
Public resistance towards waste behavioural change
Economic barriers Economic barriers are those that impede WtE projects’ financial viability. They can be subdivided into revenue and cost related barriers, as outlined below:
Revenue barriers
Expected revenues for power sales are insufficient or uncertain Energy sales are one of the two core sources of revenues for WtE projects. A plant’s energy outputs, the price it will earn per unit of energy, and the security of its Power Purchase Agreement are therefore crucial aspects of its financial viability and risk model.
A plant’s generation capacity is related to the expected volume of feedstock it will receive, but its actual generation varies according to the quality of the feedstock. Municipalities are unfamiliar with signing contracts guaranteeing long-term feedstock composition, but without them, investors’ confidence in the certainty of future revenues is threatened.
The price of power is also a key variable. WtE facilities tend to generate more expensive power than other options, and power purchasers are reluctant to sign costly contracts. Moreover, project developers do not always trust in the long-term security of Power Purchase Agreements that ensure their power output will be bought by utilities at predictable prices throughout the project’s lifetime, which adds risk and may be a factor that discounts expected future revenue. Distrust in PPAs was perceived as a barrier by several interviewees.
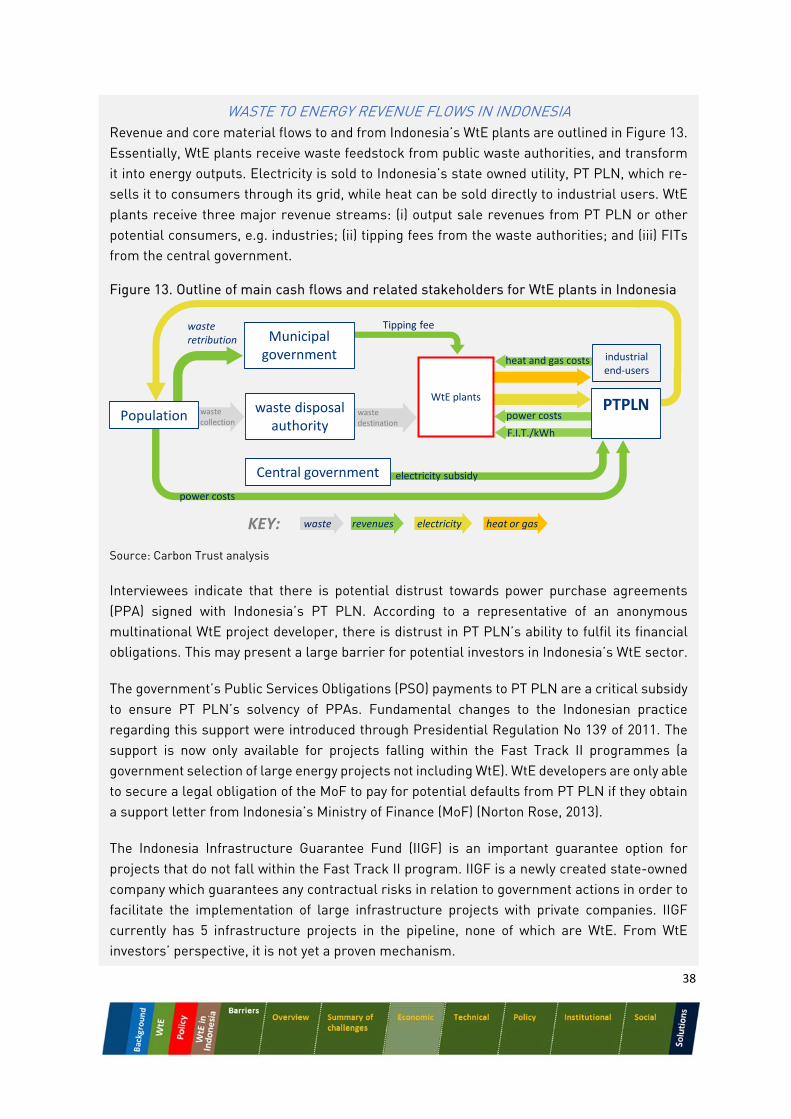
38
WASTE TO ENERGY REVENUE FLOWS IN INDONESIA Revenue and core material flows to and from Indonesia’s WtE plants are outlined in Figure 13. Essentially, WtE plants receive waste feedstock from public waste authorities, and transform it into energy outputs. Electricity is sold to Indonesia’s state owned utility, PT PLN, which re-sells it to consumers through its grid, while heat can be sold directly to industrial users. WtE plants receive three major revenue streams: (i) output sale revenues from PT PLN or other potential consumers, e.g. industries; (ii) tipping fees from the waste authorities; and (iii) FITs from the central government.
Figure 13. Outline of main cash flows and related stakeholders for WtE plants in Indonesia
Source: Carbon Trust analysis
Interviewees indicate that there is potential distrust towards power purchase agreements (PPA) signed with Indonesia’s PT PLN. According to a representative of an anonymous multinational WtE project developer, there is distrust in PT PLN’s ability to fulfil its financial obligations. This may present a large barrier for potential investors in Indonesia’s WtE sector.
The government’s Public Services Obligations (PSO) payments to PT PLN are a critical subsidy to ensure PT PLN’s solvency of PPAs. Fundamental changes to the Indonesian practice regarding this support were introduced through Presidential Regulation No 139 of 2011. The support is now only available for projects falling within the Fast Track II programmes (a government selection of large energy projects not including WtE). WtE developers are only able to secure a legal obligation of the MoF to pay for potential defaults from PT PLN if they obtain a support letter from Indonesia’s Ministry of Finance (MoF) (Norton Rose, 2013).
The Indonesia Infrastructure Guarantee Fund (IIGF) is an important guarantee option for projects that do not fall within the Fast Track II program. IIGF is a newly created state-owned company which guarantees any contractual risks in relation to government actions in order to facilitate the implementation of large infrastructure projects with private companies. IIGF currently has 5 infrastructure projects in the pipeline, none of which are WtE. From WtE investors’ perspective, it is not yet a proven mechanism.
industrial end‐users
PTPLNwaste disposal authority
Tipping fee
power costsPopulation wastecollection
waste destination
WtE plants
power costs
KEY: waste revenues electricity heat or gas
heat and gas costs
Central government
F.I.T./kWh
Municipal government
waste retribution
electricity subsidy
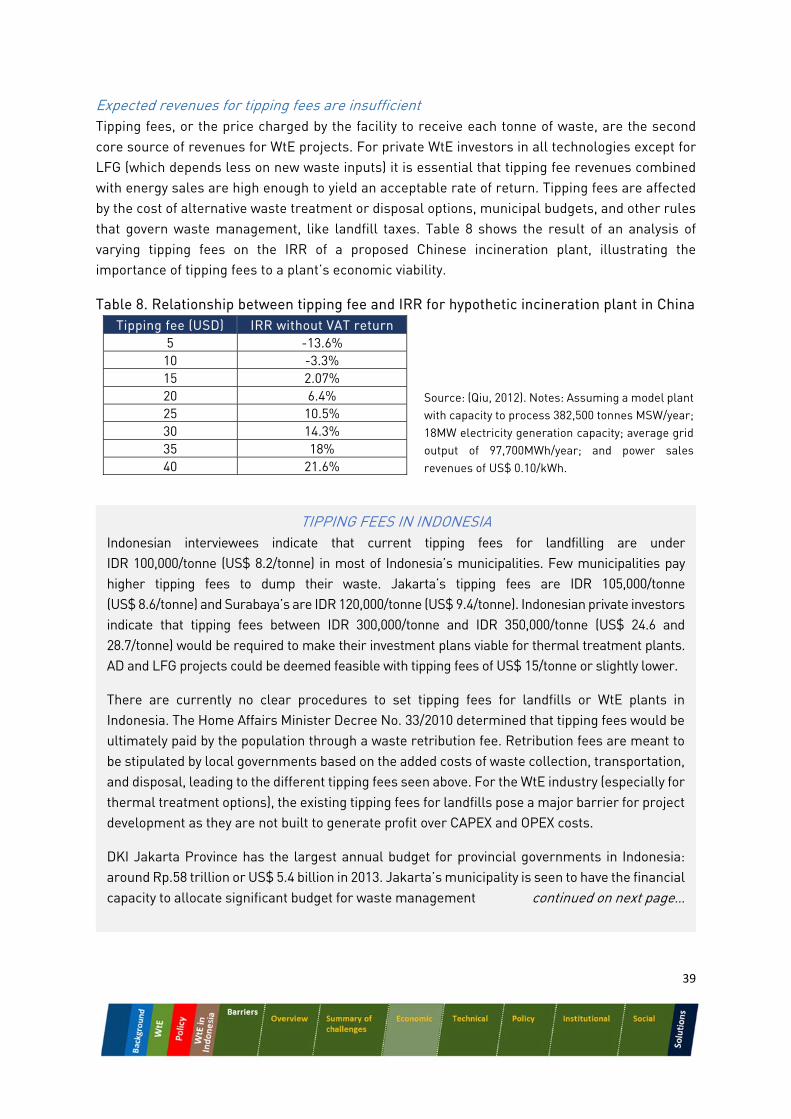
39
Expected revenues for tipping fees are insufficient Tipping fees, or the price charged by the facility to receive each tonne of waste, are the second core source of revenues for WtE projects. For private WtE investors in all technologies except for LFG (which depends less on new waste inputs) it is essential that tipping fee revenues combined with energy sales are high enough to yield an acceptable rate of return. Tipping fees are affected by the cost of alternative waste treatment or disposal options, municipal budgets, and other rules that govern waste management, like landfill taxes. Table 8 shows the result of an analysis of varying tipping fees on the IRR of a proposed Chinese incineration plant, illustrating the importance of tipping fees to a plant’s economic viability.
Table 8. Relationship between tipping fee and IRR for hypothetic incineration plant in China Tipping fee (USD) IRR without VAT return
5 -13.6% 10 -3.3% 15 2.07% 20 6.4% 25 10.5% 30 14.3% 35 18% 40 21.6%
TIPPING FEES IN INDONESIA Indonesian interviewees indicate that current tipping fees for landfilling are under IDR 100,000/tonne (US$ 8.2/tonne) in most of Indonesia’s municipalities. Few municipalities pay higher tipping fees to dump their waste. Jakarta’s tipping fees are IDR 105,000/tonne (US$ 8.6/tonne) and Surabaya’s are IDR 120,000/tonne (US$ 9.4/tonne). Indonesian private investors indicate that tipping fees between IDR 300,000/tonne and IDR 350,000/tonne (US$ 24.6 and 28.7/tonne) would be required to make their investment plans viable for thermal treatment plants. AD and LFG projects could be deemed feasible with tipping fees of US$ 15/tonne or slightly lower.
There are currently no clear procedures to set tipping fees for landfills or WtE plants in Indonesia. The Home Affairs Minister Decree No. 33/2010 determined that tipping fees would be ultimately paid by the population through a waste retribution fee. Retribution fees are meant to be stipulated by local governments based on the added costs of waste collection, transportation, and disposal, leading to the different tipping fees seen above. For the WtE industry (especially for thermal treatment options), the existing tipping fees for landfills pose a major barrier for project development as they are not built to generate profit over CAPEX and OPEX costs.
DKI Jakarta Province has the largest annual budget for provincial governments in Indonesia: around Rp.58 trillion or US$ 5.4 billion in 2013. Jakarta’s municipality is seen to have the financial capacity to allocate significant budget for waste management continued on next page…
Source: (Qiu, 2012). Notes: Assuming a model plant with capacity to process 382,500 tonnes MSW/year; 18MW electricity generation capacity; average grid output of 97,700MWh/year; and power sales revenues of US$ 0.10/kWh.
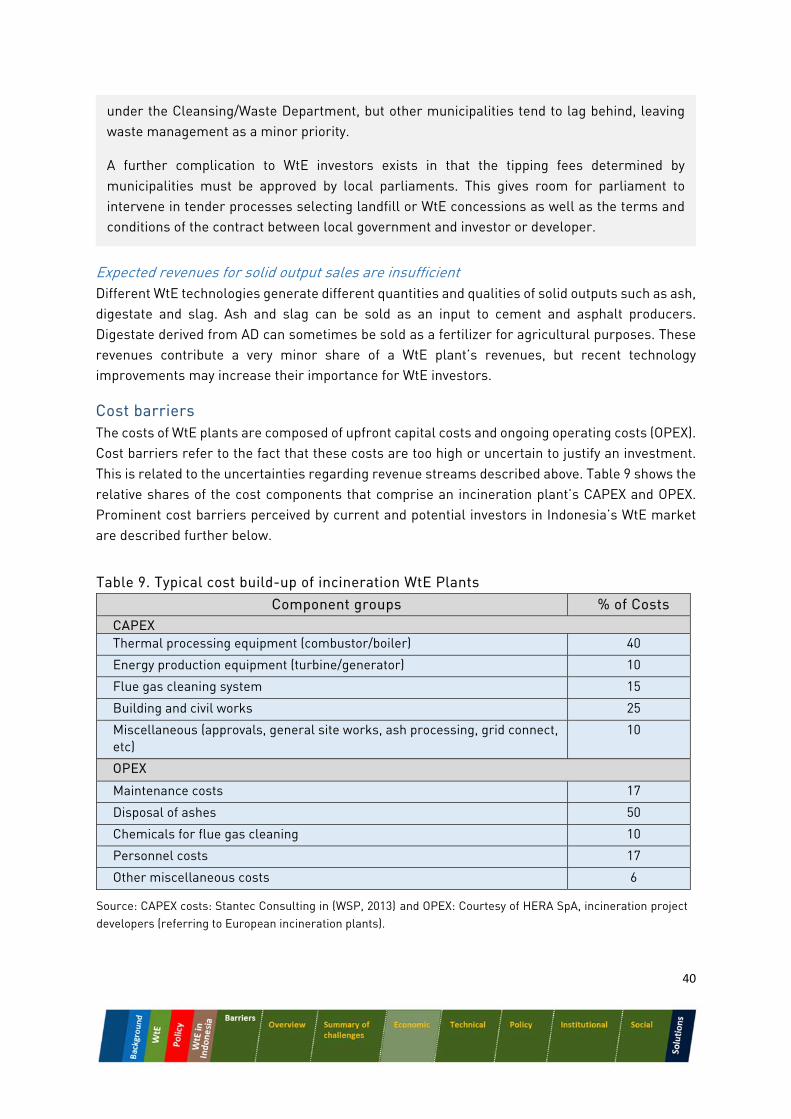
40
Expected revenues for solid output sales are insufficient Different WtE technologies generate different quantities and qualities of solid outputs such as ash, digestate and slag. Ash and slag can be sold as an input to cement and asphalt producers. Digestate derived from AD can sometimes be sold as a fertilizer for agricultural purposes. These revenues contribute a very minor share of a WtE plant’s revenues, but recent technology improvements may increase their importance for WtE investors.
Cost barriers The costs of WtE plants are composed of upfront capital costs and ongoing operating costs (OPEX). Cost barriers refer to the fact that these costs are too high or uncertain to justify an investment. This is related to the uncertainties regarding revenue streams described above. Table 9 shows the relative shares of the cost components that comprise an incineration plant’s CAPEX and OPEX. Prominent cost barriers perceived by current and potential investors in Indonesia’s WtE market are described further below.
under the Cleansing/Waste Department, but other municipalities tend to lag behind, leaving waste management as a minor priority.
A further complication to WtE investors exists in that the tipping fees determined by municipalities must be approved by local parliaments. This gives room for parliament to intervene in tender processes selecting landfill or WtE concessions as well as the terms and conditions of the contract between local government and investor or developer.
Table 9. Typical cost build-up of incineration WtE Plants Component groups % of Costs
CAPEX Thermal processing equipment (combustor/boiler) 40
Energy production equipment (turbine/generator) 10
Flue gas cleaning system 15
Building and civil works 25
Miscellaneous (approvals, general site works, ash processing, grid connect, etc)
10
OPEX
Maintenance costs 17
Disposal of ashes 50
Chemicals for flue gas cleaning 10
Personnel costs 17
Other miscellaneous costs 6
Source: CAPEX costs: Stantec Consulting in (WSP, 2013) and OPEX: Courtesy of HERA SpA, incineration project developers (referring to European incineration plants).
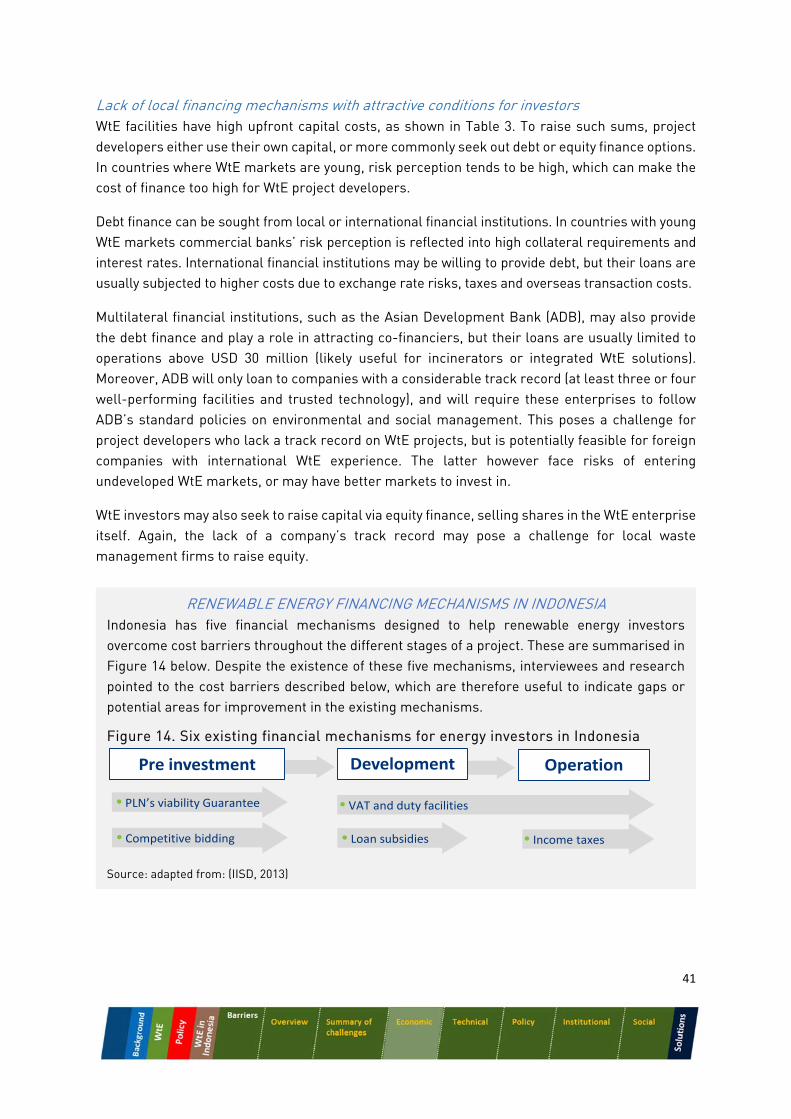
41
Lack of local financing mechanisms with attractive conditions for investors WtE facilities have high upfront capital costs, as shown in Table 3. To raise such sums, project developers either use their own capital, or more commonly seek out debt or equity finance options. In countries where WtE markets are young, risk perception tends to be high, which can make the cost of finance too high for WtE project developers.
Debt finance can be sought from local or international financial institutions. In countries with young WtE markets commercial banks’ risk perception is reflected into high collateral requirements and interest rates. International financial institutions may be willing to provide debt, but their loans are usually subjected to higher costs due to exchange rate risks, taxes and overseas transaction costs.
Multilateral financial institutions, such as the Asian Development Bank (ADB), may also provide the debt finance and play a role in attracting co-financiers, but their loans are usually limited to operations above USD 30 million (likely useful for incinerators or integrated WtE solutions). Moreover, ADB will only loan to companies with a considerable track record (at least three or four well-performing facilities and trusted technology), and will require these enterprises to follow ADB’s standard policies on environmental and social management. This poses a challenge for project developers who lack a track record on WtE projects, but is potentially feasible for foreign companies with international WtE experience. The latter however face risks of entering undeveloped WtE markets, or may have better markets to invest in.
WtE investors may also seek to raise capital via equity finance, selling shares in the WtE enterprise itself. Again, the lack of a company’s track record may pose a challenge for local waste management firms to raise equity.
RENEWABLE ENERGY FINANCING MECHANISMS IN INDONESIA Indonesia has five financial mechanisms designed to help renewable energy investors overcome cost barriers throughout the different stages of a project. These are summarised in Figure 14 below. Despite the existence of these five mechanisms, interviewees and research pointed to the cost barriers described below, which are therefore useful to indicate gaps or potential areas for improvement in the existing mechanisms.
Figure 14. Six existing financial mechanisms for energy investors in Indonesia
Source: adapted from: (IISD, 2013)
Pre investment Development Operation
• PLN’s viability Guarantee
• Competitive bidding
• VAT and duty facilities
• Loan subsidies • Income taxes
42
Uncertainty with waste quality may lead to the need of unforeseen pre-treatment costs Pre-treatment is a common requirement of WtE plants, usually considered in early feasibility assessments. Unexpected requirements for extra pre-treatment procedures may pose a technical barrier, with potentially significant implications for the costs of running WtE facilities. Such requirements may arise if the waste quality changes over the lifetime of a WtE plant.
Pre-treatments broadly involve one or more of the following processes: (i) sorting of waste into organic, recyclables, other combustible materials and inerts; (ii) drying; and (iii) shredding/mixing. Pre-treatment requirements are determined by the WtE technology used and the quality of the waste feedstock.
Not all WtE technologies are prone to require pre-treatment. Wet AD plants are able to treat sorted organic waste, and do not work well when dealing with shredded mixed MSW. Dry AD technologies treat mixed MSW in Europe but may require some degree of waste sorting to remove recyclables and inert solids that may reduce the efficiency of the biogas reactor (de Baere & Matheeuws, 2012). LFG plants do not require pre-treatment, as landfills that accept organic matter usually will not impede the entry of mixed waste. Incineration and advanced thermal technologies will usually require some sort of pre-treatment to remove recyclables and eliminate inert materials that reduce the efficiency of the reactor. Moreover, when the waste is largely organic, or wet, waste will likely need to be dried to enable combustion, which raises operating costs.
Technical barriers Technical barriers refer to technology limitations that prevent a WtE plant from operating efficiently. They are discussed below.
Despite the existence of the mechanisms above, Indonesian interviewees indicate there is a lack of attractive financing mechanisms for potential WtE investors in Indonesia. According to investors in Surabaya’s LFG and gasification facility, obtaining credit for the US$ 30 million CAPEX required was a major challenge. Local commercial banks were not comfortable financing WtE as the company had no track record of large-scale WtE projects. As a consequence, interest rates charged were about 13%. The investors also searched for credit from outside Indonesia but were faced with excessive collateral requirements, forcing them to remain with the local offer.
WASTE QUALITY ISSUES IN INDONESIA Interviewees indicate that a large share of Indonesian waste tends to be exposed to rain in its journey from source to disposal or treatment facilities, which makes it very wet. This presents a problem for incineration facilities, which work best with dry waste. Incineration plants will therefore require the waste to be dewatered through processes that consume fuel, and thus add to costs to plant operation. While this may not present a problem for LFG or AD operations, excessive moisture weakens a thermal WtE plant’s overall resource efficiency and economic
return, and also leads to increased GHG emissions.
43
Unsuitability of waste stream for certain technology or vice-versa Different WtE technologies operate optimally within certain ranges of the waste feedstock’s physiochemical parameters. If fed with waste outside of this range it is common for plants to develop technical problems. A decisive parameter is the moisture content of a waste stream. While anaerobic digestion technologies are suitable to treat waste with >50% moisture, thermal treatment technologies perform best with waste containing <45% moisture, where lower moisture translates to higher heating value.
With regards to thermal treatment technologies, this barrier is largely dependent on an investor’s certainty regarding the calorific value of the waste feedstock. Coupled with certainty on the amount of feedstock to be received, these variables assure investors of the energy generation potential of a thermal treatment WtE plant. As mentioned above, the thermal output is the key parameter to determine the size of an incineration boiler and the flue-gas volume and therefore the size of the flue-gas cleaning devices (EC, 2006).
Uncertainties with regards to the composition of the waste feedstock over time (including seasonally) therefore leave investors unsure of the efficiency and profitability of WtE projects, affecting the whole project. This barrier directly relates to economic uncertainties of having to pre-treat waste, as described in the cost barriers above.
Lack of local operation and maintenance capacity / lack of technical training Since WtE is relatively new in many countries, project developers often have trouble finding appropriate local expertise. Hiring foreign consultants can significantly increase upfront costs of a plant since international experts need to be brought in before a plant is operational. Technical training is costly, and pioneer developers have found that once they have invested in training, there is an expectation they will share their expensive education with others. Indonesian developers have found little financial support from the government to help pay for training. This barrier is exacerbated with thermal treatment technologies, and even more with advanced thermal technologies, which are more technically complex than chemical conversion technologies. Thermal technologies require a combination of chemical, mechanical, and production engineering expertise with very specific training needs.
Infrastructure: Ability to plug into electricity grids WtE plants need to be able to sell their energy output. Whilst WtE facilities can operate off-grid by exporting their output directly to an end-user (e.g. an adjacent industry), they often require grid connections to be able to commercialize their output. Connecting WtE facilities to electricity grids can be a technical challenge, as it requires engineering work beyond the domain of the WtE project.
It can also be a policy or institutional challenge if electricity operators are reluctant to allow grid interconnection and the government does not mandate them to do so. Interviewees indicate that utilities may not want to accept waste-derived electricity, because this may require specific engineering works to be done at their expense. This poses a barrier to WtE projects as it may slow down original construction plans or delay the realisation of revenue streams.
44
Policy barriers While policies can be designed to overcome economic and technical barriers, the barriers sometimes lie with the policy itself. Policies can hinder the development of WtE project directly or indirectly, or fail to sufficiently incentivise certain technologies or behaviours.
Lack of law enforcement, allowing cheap waste disposal options to thrive Waste disposal is can be regulated to ban the least wanted (and usually cheapest) disposal methods. The existence of illegal dumpsites poses unfair competition for WtE plants, since the former is often less expensive. For WtE investors, it is essential that these dumpsites are closed, creating a level playing field for WtE plants to charge the required tipping fees. The sheer existence of a significant amount of illegal dumpsites may lead WtE investors to decide not to invest in a country.
Distrust in policy continuation – feed-in-tariff and solid waste policy The potential discontinuation of existing policies can be perceived as a barrier for WtE investors, as it puts at risk several of the economic and technical considerations. This broad barrier covers direct revenues for WtE plants, such as feed-in tariffs, as well as the enforcement of policies that are critical to the business model (such as landfill taxes). Investors are wary of FIT agreements being modified or of municipalities failing to deal with illegal dumping of waste, which can reduce waste volumes or tipping fees received by WtE plants.
Institutional barriers Institutional barriers also relate to policies, but more broadly to how local institutions’ procedures, systematically discourage WtE investors, or simply do not attract WtE project development.
Political interference in WtE tenders WtE investors seek open tendering processes that give them the opportunity to win public contracts in a reasonable timeframe, ranked against fair and transparent criteria. Irregularities or political interference in the tendering process may slow it down or lead to contested outcomes, forcing bidders to invest more time and money than would otherwise be necessary to complete the process. The mere possibility of going through long and unclear tenders scares off WtE investors who are unlikely to engage.
ILLEGAL DUMPING IN INDONESIA
Many of Indonesia’s illegal dumpsites remain active due to lack of law enforcement. In addition to closing illegal dumpsites, Indonesia’s MSW Law No. 18/2008 ruled that local governments had to decommission legal landfills operating as open dumps and turn them into adequate sanitary landfills. This should significantly remove the cheap options that compete against WtE, favouring the development of new WtE projects. However, most municipalities were unable to comply with the regulation (Munawar, 2011) due to budgetary and technical capacity constraints.
45
Lack of municipal capacity to assess WtE options and contractual arrangements
Due to the novelty of some WtE solutions or priority being given to other municipal challenges, many Indonesian municipalities lack capacity to assess and formulate waste management strategies that include WtE. Local governments need to be able to assess the suitability of different WtE technologies and understand their financial and contractual implications, then create a track record of public private partnerships (PPP).
Local authorities play many roles in bringing large PPP to successful close. This includes understanding how WtE technologies might align with their local waste management system, what are the cost implications of various technical solutions, what kind of local engagement and behaviour change is required to maximise value for money, and how to draw up, assess, and secure long-term contracts across a range of issues. Contractual issues will involve for example, project design, financial obligations, waste delivery requirements and ownership rights.
Lack of waste collection infrastructure to ensure availability of waste
Waste must be collected and transported to WtE facilities, so a failure in waste collection and delivery that comes from poor contracts or a lack of public infrastructure can be an institutional barrier that threatens the security of feedstock supply.
POLITICAL CHALLENGES FACED BY WASTE TO ENERGY DEVELOPERS IN INDONESIA
Interviewees that have gone through Indonesia’s renewable energy tender process find the selection process for bidders to be lengthy or have inconsistent selection criteria. Two key issues underlie this barrier: (i) tenders are sometimes evaluated through scoring processes performed by a political committee, which may lack transparency and technical evaluation capacity, and (ii) tenders held by provincial governments are said to require approval of the respective city’s mayor, which can hold up the process. The tenders held for WtE facilities in Gedebage and Bandung are both said to have suffered from these issues: both tenders were voted through by committee using a scoring process, but are stuck while waiting for the respective mayors’ approval.
Interviewees also indicate that Indonesia’s major WtE project, run by of PT Godang Tua Jaya (GTJ) and Navigat Organic Energy Indonesia (NOEI) in the Bantar Gebang site, is recurrently suffering from political interference. Having been awarded a concession contract in 2008 for the period of 15 years, the companies have been limited in their capacity to enhance WtE activities due to low tipping fees and government opposition.
Authorities have questioned the project’s energy production capacity as well as its accuracy in terms of reporting data about waste treatment volumes. As a consequence, the original contract has been amended three times and risks being completely annulled, which would lead to a re-tender and negative impact upon future investor confidence. The project is currently under political threat and is an unfortunate example for other WtE investors, some of whom are already cautious about investing in Indonesia’s WtE sector.
46
Waste collection in Indonesia often involves at least two groups: 1) individuals and/or local privately employed collectors who bring municipal waste to local tips, and 2) municipally employed collectors who transport waste from the local tip to a transfer station or landfill. Municipalities need to sign contracts with WtE operators that guarantee a minimum amount of waste will be delivered to the facility over a certain timeframe, usually 15-20 years. Uncertainty about future waste streams and collection plans, or collectors that are subcontracted and not under full municipal control, can make these contracts difficult to agree.
Social barriers WtE’s market development faces considerable social challenges as it affects the lives of specific social groups and may face public resistance to change. WtE projects have positive and negative social externalities intertwined. While a plant creates jobs for some it may eradicate the jobs of others who depended on the former waste management structure. While WtE’s reduce pollution and GHG emissions in a wider picture, they may represent a new source of emissions in one specific location. In both situations WtE plants may trigger public unrest. Furthermore, the optimal-functioning of a waste management system which includes WtE plants is likely to require public participation in that the people are best placed to separate MSW at its source. These two broad social barriers are described below.
Existence of waste-pickers/need to deal with them
The existence of waste pickers in landfill sites can be a barrier to all kinds of WtE technologies. Some LFG projects require landfills to be capped with layers of soil and clay, which restricts access to recyclable material and requires waste pickers to be relocated (Hitachi Zosen, 2012). For incineration WtE technologies that receive mixed MSW, waste pickers tend to remove waste with higher calorific value (plastics) upstream, which reduces the energy content of the waste that reaches the WtE facility. Any intervention in an established waste management system impacts upon the livelihoods of waste pickers, so must be designed very carefully and with attention paid to the on-the-ground political realities that waste pickers create.
While waste pickers could be included in a more integrated solid waste management programme (for example, in waste separation facilities) integrating them into formalised work is often difficult, and also perceived as a barrier. This is in part because their entrepreneurial work culture is very different from the formalised work environment in a separation facility. As it stands, WtE projects can be largely slowed down or deemed unfeasible because of this large and strong constituency.
47
Public opposition
Thermal treatments of MSW suffer from historic public opposition and ‘Not in my Backyard’ (NIMBY) syndrome. Public opposition is typically fuelled by fears that polluting emissions would degrade neighbour residents’ health, community livelihood, and the environment. Opposition may slow down approval processes or create uncertainty around construction timelines due to public demonstrations, which raises risks and potential costs.
Public resistance towards waste separation
Although a minor barrier for WtE investors, people’s resistance to separating their waste at home causes an indirect problem for the development of a WtE market. Separating waste at its source, and maintaining segregated waste streams during collection and transportation, means that WtE plants or other intermediate facilities do not have to do any separation. Avoiding that WtE plants have to incorporate infrastructure to pre-treat waste (e.g. sort or dry the waste) reduces the CAPEX and OPEX of WtE plants and therefore increases their operating efficiency.
WASTE PICKERS IN INDONESIA Waste pickers can pose a challenge to WtE project developers. In the case PT Navigat Organic’s WtE project in Bantar Gebang, the social and political aspect of waste pickers was one of the most difficult and delicate things to manage. The interests of local leaders in the waste picking community needed to be maintained in order to enable the project to go forward. A top-down, non-consultative decision that changed the waste stream and altered the power dynamics of the waste picking community would have threated the safety, security and stability of the project.
PT Navigat Organic found creative ways to cooperate with this group, for example, by ensuring that a pelletising plant in the landfill only bought material from inside the landfill, even though it was sold by waste pickers at a premium. What was lost in revenue through this arrangement was considered to be offset by improved safety and stability for the project.
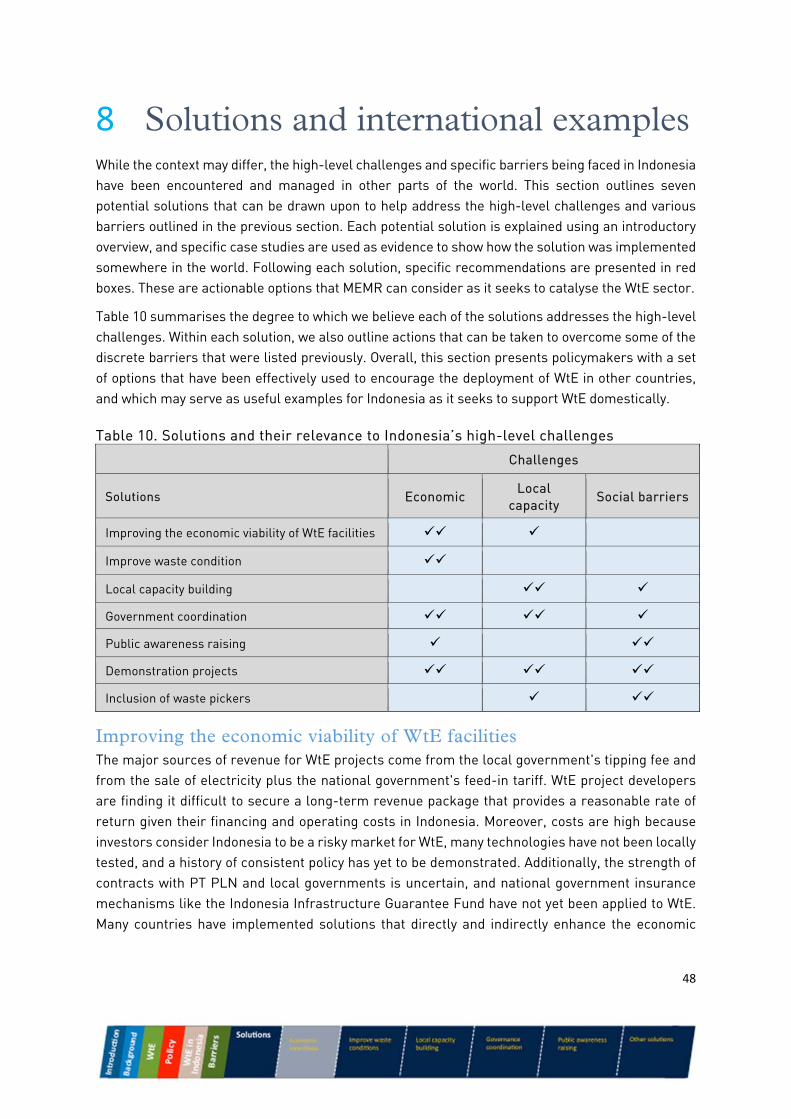
48
8 Solutions and international examples While the context may differ, the high-level challenges and specific barriers being faced in Indonesia have been encountered and managed in other parts of the world. This section outlines seven potential solutions that can be drawn upon to help address the high-level challenges and various barriers outlined in the previous section. Each potential solution is explained using an introductory overview, and specific case studies are used as evidence to show how the solution was implemented somewhere in the world. Following each solution, specific recommendations are presented in red boxes. These are actionable options that MEMR can consider as it seeks to catalyse the WtE sector.
Table 10 summarises the degree to which we believe each of the solutions addresses the high-level challenges. Within each solution, we also outline actions that can be taken to overcome some of the discrete barriers that were listed previously. Overall, this section presents policymakers with a set of options that have been effectively used to encourage the deployment of WtE in other countries, and which may serve as useful examples for Indonesia as it seeks to support WtE domestically.
Table 10. Solutions and their relevance to Indonesia’s high-level challenges
Challenges
Solutions Economic Local
capacity Social barriers
Improving the economic viability of WtE facilities
Improve waste condition
Local capacity building
Government coordination
Public awareness raising
Demonstration projects
Inclusion of waste pickers
Improving the economic viability of WtE facilities The major sources of revenue for WtE projects come from the local government's tipping fee and from the sale of electricity plus the national government's feed-in tariff. WtE project developers are finding it difficult to secure a long-term revenue package that provides a reasonable rate of return given their financing and operating costs in Indonesia. Moreover, costs are high because investors consider Indonesia to be a risky market for WtE, many technologies have not been locally tested, and a history of consistent policy has yet to be demonstrated. Additionally, the strength of contracts with PT PLN and local governments is uncertain, and national government insurance mechanisms like the Indonesia Infrastructure Guarantee Fund have not yet been applied to WtE. Many countries have implemented solutions that directly and indirectly enhance the economic
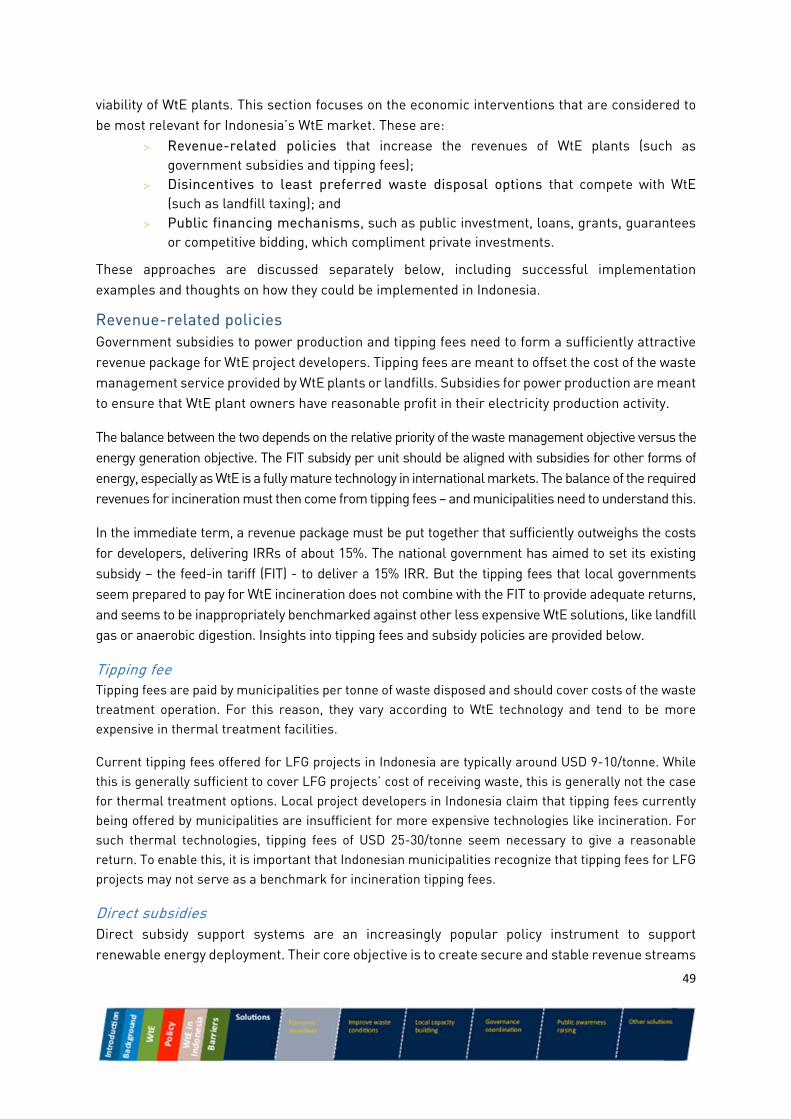
49
viability of WtE plants. This section focuses on the economic interventions that are considered to be most relevant for Indonesia’s WtE market. These are:
Revenue-related policies that increase the revenues of WtE plants (such as government subsidies and tipping fees);
Disincentives to least preferred waste disposal options that compete with WtE (such as landfill taxing); and
Public financing mechanisms, such as public investment, loans, grants, guarantees or competitive bidding, which compliment private investments.
These approaches are discussed separately below, including successful implementation examples and thoughts on how they could be implemented in Indonesia.
Revenue-related policies Government subsidies to power production and tipping fees need to form a sufficiently attractive revenue package for WtE project developers. Tipping fees are meant to offset the cost of the waste management service provided by WtE plants or landfills. Subsidies for power production are meant to ensure that WtE plant owners have reasonable profit in their electricity production activity.
The balance between the two depends on the relative priority of the waste management objective versus the energy generation objective. The FIT subsidy per unit should be aligned with subsidies for other forms of energy, especially as WtE is a fully mature technology in international markets. The balance of the required revenues for incineration must then come from tipping fees – and municipalities need to understand this.
In the immediate term, a revenue package must be put together that sufficiently outweighs the costs for developers, delivering IRRs of about 15%. The national government has aimed to set its existing subsidy – the feed-in tariff (FIT) - to deliver a 15% IRR. But the tipping fees that local governments seem prepared to pay for WtE incineration does not combine with the FIT to provide adequate returns, and seems to be inappropriately benchmarked against other less expensive WtE solutions, like landfill gas or anaerobic digestion. Insights into tipping fees and subsidy policies are provided below.
Tipping fee Tipping fees are paid by municipalities per tonne of waste disposed and should cover costs of the waste treatment operation. For this reason, they vary according to WtE technology and tend to be more expensive in thermal treatment facilities.
Current tipping fees offered for LFG projects in Indonesia are typically around USD 9-10/tonne. While this is generally sufficient to cover LFG projects’ cost of receiving waste, this is generally not the case for thermal treatment options. Local project developers in Indonesia claim that tipping fees currently being offered by municipalities are insufficient for more expensive technologies like incineration. For such thermal technologies, tipping fees of USD 25-30/tonne seem necessary to give a reasonable return. To enable this, it is important that Indonesian municipalities recognize that tipping fees for LFG projects may not serve as a benchmark for incineration tipping fees.
Direct subsidies Direct subsidy support systems are an increasingly popular policy instrument to support renewable energy deployment. Their core objective is to create secure and stable revenue streams
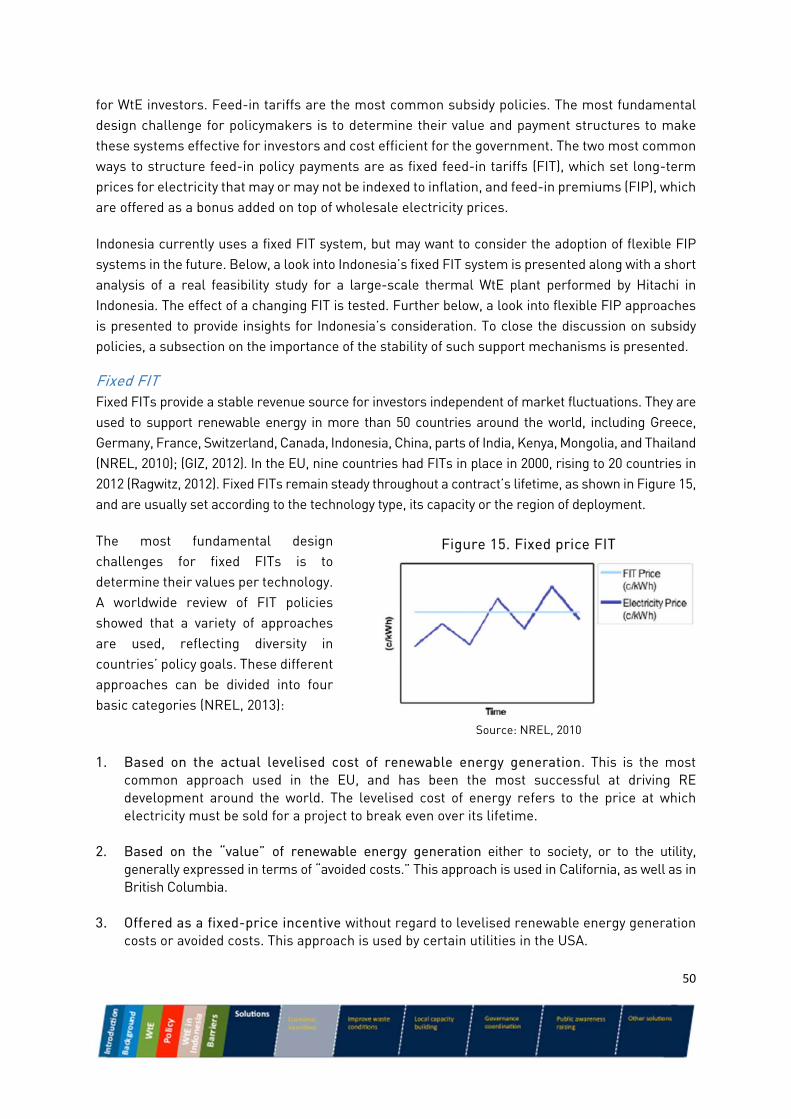
50
for WtE investors. Feed-in tariffs are the most common subsidy policies. The most fundamental design challenge for policymakers is to determine their value and payment structures to make these systems effective for investors and cost efficient for the government. The two most common ways to structure feed-in policy payments are as fixed feed-in tariffs (FIT), which set long-term prices for electricity that may or may not be indexed to inflation, and feed-in premiums (FIP), which are offered as a bonus added on top of wholesale electricity prices.
Indonesia currently uses a fixed FIT system, but may want to consider the adoption of flexible FIP systems in the future. Below, a look into Indonesia’s fixed FIT system is presented along with a short analysis of a real feasibility study for a large-scale thermal WtE plant performed by Hitachi in Indonesia. The effect of a changing FIT is tested. Further below, a look into flexible FIP approaches is presented to provide insights for Indonesia’s consideration. To close the discussion on subsidy policies, a subsection on the importance of the stability of such support mechanisms is presented.
Fixed FIT Fixed FITs provide a stable revenue source for investors independent of market fluctuations. They are used to support renewable energy in more than 50 countries around the world, including Greece, Germany, France, Switzerland, Canada, Indonesia, China, parts of India, Kenya, Mongolia, and Thailand (NREL, 2010); (GIZ, 2012). In the EU, nine countries had FITs in place in 2000, rising to 20 countries in 2012 (Ragwitz, 2012). Fixed FITs remain steady throughout a contract’s lifetime, as shown in Figure 15, and are usually set according to the technology type, its capacity or the region of deployment.
The most fundamental design challenges for fixed FITs is to determine their values per technology. A worldwide review of FIT policies showed that a variety of approaches are used, reflecting diversity in countries’ policy goals. These different approaches can be divided into four basic categories (NREL, 2013):
1. Based on the actual levelised cost of renewable energy generation. This is the most common approach used in the EU, and has been the most successful at driving RE development around the world. The levelised cost of energy refers to the price at which electricity must be sold for a project to break even over its lifetime.
2. Based on the “value” of renewable energy generation either to society, or to the utility, generally expressed in terms of “avoided costs.” This approach is used in California, as well as in British Columbia.
3. Offered as a fixed-price incentive without regard to levelised renewable energy generation costs or avoided costs. This approach is used by certain utilities in the USA.
Figure 15. Fixed price FIT
Source: NREL, 2010
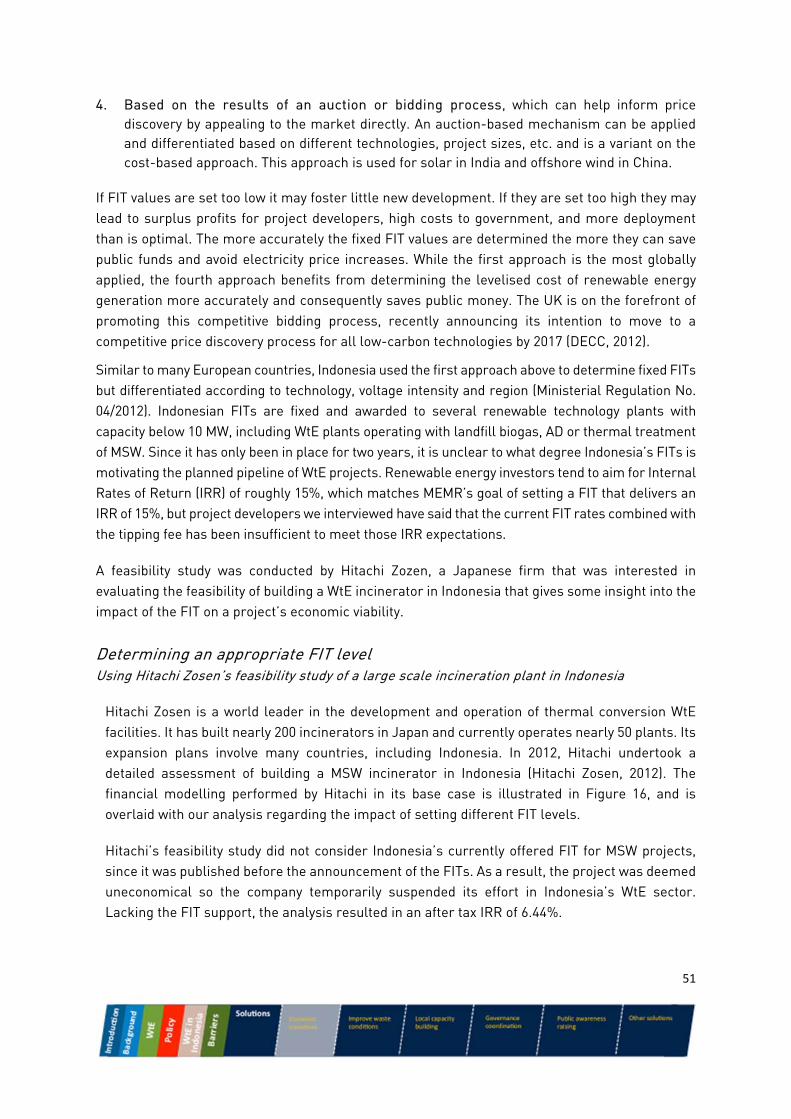
51
4. Based on the results of an auction or bidding process, which can help inform price discovery by appealing to the market directly. An auction-based mechanism can be applied and differentiated based on different technologies, project sizes, etc. and is a variant on the cost-based approach. This approach is used for solar in India and offshore wind in China.
If FIT values are set too low it may foster little new development. If they are set too high they may lead to surplus profits for project developers, high costs to government, and more deployment than is optimal. The more accurately the fixed FIT values are determined the more they can save public funds and avoid electricity price increases. While the first approach is the most globally applied, the fourth approach benefits from determining the levelised cost of renewable energy generation more accurately and consequently saves public money. The UK is on the forefront of promoting this competitive bidding process, recently announcing its intention to move to a competitive price discovery process for all low-carbon technologies by 2017 (DECC, 2012).
Similar to many European countries, Indonesia used the first approach above to determine fixed FITs but differentiated according to technology, voltage intensity and region (Ministerial Regulation No. 04/2012). Indonesian FITs are fixed and awarded to several renewable technology plants with capacity below 10 MW, including WtE plants operating with landfill biogas, AD or thermal treatment of MSW. Since it has only been in place for two years, it is unclear to what degree Indonesia’s FITs is motivating the planned pipeline of WtE projects. Renewable energy investors tend to aim for Internal Rates of Return (IRR) of roughly 15%, which matches MEMR’s goal of setting a FIT that delivers an IRR of 15%, but project developers we interviewed have said that the current FIT rates combined with the tipping fee has been insufficient to meet those IRR expectations.
A feasibility study was conducted by Hitachi Zozen, a Japanese firm that was interested in evaluating the feasibility of building a WtE incinerator in Indonesia that gives some insight into the impact of the FIT on a project’s economic viability.
Determining an appropriate FIT level Using Hitachi Zosen’s feasibility study of a large scale incineration plant in Indonesia
Hitachi Zosen is a world leader in the development and operation of thermal conversion WtE facilities. It has built nearly 200 incinerators in Japan and currently operates nearly 50 plants. Its expansion plans involve many countries, including Indonesia. In 2012, Hitachi undertook a detailed assessment of building a MSW incinerator in Indonesia (Hitachi Zosen, 2012). The financial modelling performed by Hitachi in its base case is illustrated in Figure 16, and is overlaid with our analysis regarding the impact of setting different FIT levels.
Hitachi’s feasibility study did not consider Indonesia’s currently offered FIT for MSW projects, since it was published before the announcement of the FITs. As a result, the project was deemed uneconomical so the company temporarily suspended its effort in Indonesia’s WtE sector. Lacking the FIT support, the analysis resulted in an after tax IRR of 6.44%.
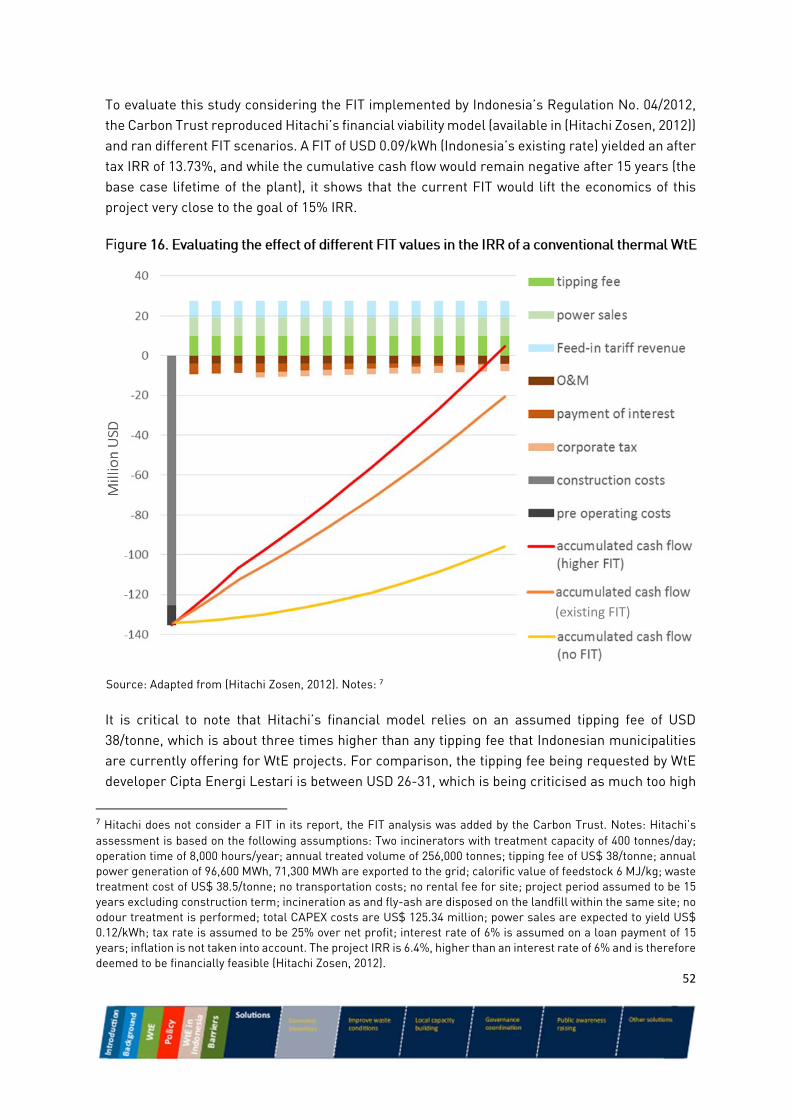
52
To evaluate this study considering the FIT implemented by Indonesia’s Regulation No. 04/2012, the Carbon Trust reproduced Hitachi’s financial viability model (available in (Hitachi Zosen, 2012)) and ran different FIT scenarios. A FIT of USD 0.09/kWh (Indonesia’s existing rate) yielded an after tax IRR of 13.73%, and while the cumulative cash flow would remain negative after 15 years (the base case lifetime of the plant), it shows that the current FIT would lift the economics of this project very close to the goal of 15% IRR.
Figure 16. Evaluating the effect of different FIT values in the IRR of a conventional thermal WtE
Source: Adapted from (Hitachi Zosen, 2012). Notes: 7
It is critical to note that Hitachi’s financial model relies on an assumed tipping fee of USD 38/tonne, which is about three times higher than any tipping fee that Indonesian municipalities are currently offering for WtE projects. For comparison, the tipping fee being requested by WtE developer Cipta Energi Lestari is between USD 26-31, which is being criticised as much too high
7 Hitachi does not consider a FIT in its report, the FIT analysis was added by the Carbon Trust. Notes: Hitachi’s assessment is based on the following assumptions: Two incinerators with treatment capacity of 400 tonnes/day; operation time of 8,000 hours/year; annual treated volume of 256,000 tonnes; tipping fee of US$ 38/tonne; annual power generation of 96,600 MWh, 71,300 MWh are exported to the grid; calorific value of feedstock 6 MJ/kg; waste treatment cost of US$ 38.5/tonne; no transportation costs; no rental fee for site; project period assumed to be 15 years excluding construction term; incineration as and fly-ash are disposed on the landfill within the same site; no odour treatment is performed; total CAPEX costs are US$ 125.34 million; power sales are expected to yield US$ 0.12/kWh; tax rate is assumed to be 25% over net profit; interest rate of 6% is assumed on a loan payment of 15 years; inflation is not taken into account. The project IRR is 6.4%, higher than an interest rate of 6% and is therefore deemed to be financially feasible (Hitachi Zosen, 2012).
(existing FIT)
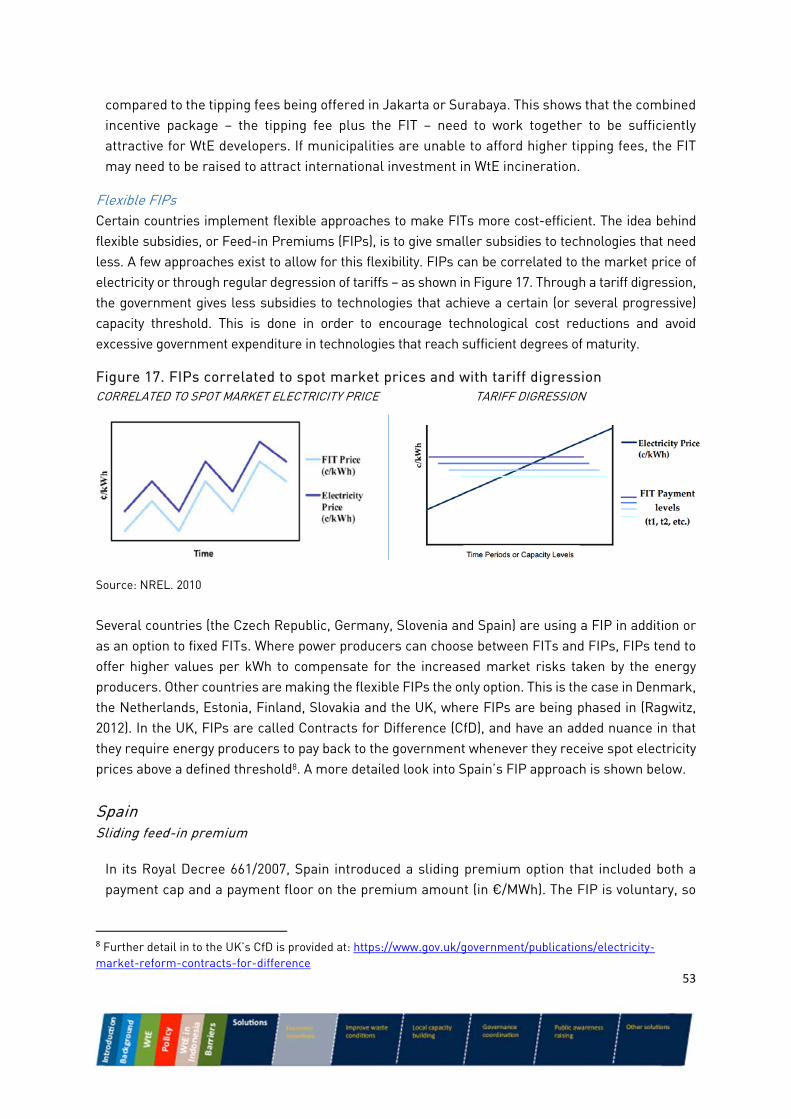
53
compared to the tipping fees being offered in Jakarta or Surabaya. This shows that the combined incentive package – the tipping fee plus the FIT – need to work together to be sufficiently attractive for WtE developers. If municipalities are unable to afford higher tipping fees, the FIT may need to be raised to attract international investment in WtE incineration.
Flexible FIPs Certain countries implement flexible approaches to make FITs more cost-efficient. The idea behind flexible subsidies, or Feed-in Premiums (FIPs), is to give smaller subsidies to technologies that need less. A few approaches exist to allow for this flexibility. FIPs can be correlated to the market price of electricity or through regular degression of tariffs – as shown in Figure 17. Through a tariff digression, the government gives less subsidies to technologies that achieve a certain (or several progressive) capacity threshold. This is done in order to encourage technological cost reductions and avoid excessive government expenditure in technologies that reach sufficient degrees of maturity.
Several countries (the Czech Republic, Germany, Slovenia and Spain) are using a FIP in addition or as an option to fixed FITs. Where power producers can choose between FITs and FIPs, FIPs tend to offer higher values per kWh to compensate for the increased market risks taken by the energy producers. Other countries are making the flexible FIPs the only option. This is the case in Denmark, the Netherlands, Estonia, Finland, Slovakia and the UK, where FIPs are being phased in (Ragwitz, 2012). In the UK, FIPs are called Contracts for Difference (CfD), and have an added nuance in that they require energy producers to pay back to the government whenever they receive spot electricity prices above a defined threshold8. A more detailed look into Spain’s FIP approach is shown below.
Spain Sliding feed-in premium
In its Royal Decree 661/2007, Spain introduced a sliding premium option that included both a payment cap and a payment floor on the premium amount (in €/MWh). The FIP is voluntary, so
8 Further detail in to the UK’s CfD is provided at: https://www.gov.uk/government/publications/electricity-market-reform-contracts-for-difference
Figure 17. FIPs correlated to spot market prices and with tariff digression CORRELATED TO SPOT MARKET ELECTRICITY PRICE TARIFF DIGRESSION
Source: NREL, 2010
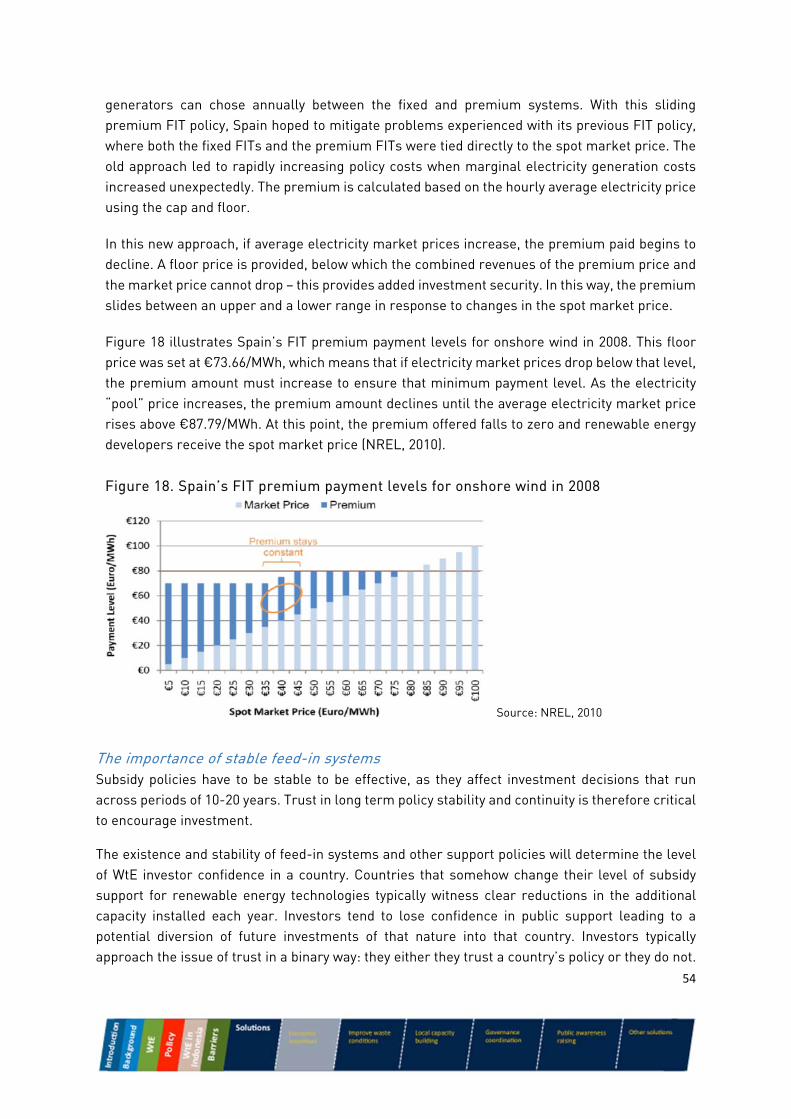
54
generators can chose annually between the fixed and premium systems. With this sliding premium FIT policy, Spain hoped to mitigate problems experienced with its previous FIT policy, where both the fixed FITs and the premium FITs were tied directly to the spot market price. The old approach led to rapidly increasing policy costs when marginal electricity generation costs increased unexpectedly. The premium is calculated based on the hourly average electricity price using the cap and floor.
In this new approach, if average electricity market prices increase, the premium paid begins to decline. A floor price is provided, below which the combined revenues of the premium price and the market price cannot drop – this provides added investment security. In this way, the premium slides between an upper and a lower range in response to changes in the spot market price.
Figure 18 illustrates Spain’s FIT premium payment levels for onshore wind in 2008. This floor price was set at €73.66/MWh, which means that if electricity market prices drop below that level, the premium amount must increase to ensure that minimum payment level. As the electricity “pool” price increases, the premium amount declines until the average electricity market price rises above €87.79/MWh. At this point, the premium offered falls to zero and renewable energy developers receive the spot market price (NREL, 2010).
Figure 18. Spain’s FIT premium payment levels for onshore wind in 2008
Source: NREL, 2010
The importance of stable feed-in systems Subsidy policies have to be stable to be effective, as they affect investment decisions that run across periods of 10-20 years. Trust in long term policy stability and continuity is therefore critical to encourage investment.
The existence and stability of feed-in systems and other support policies will determine the level of WtE investor confidence in a country. Countries that somehow change their level of subsidy support for renewable energy technologies typically witness clear reductions in the additional capacity installed each year. Investors tend to lose confidence in public support leading to a potential diversion of future investments of that nature into that country. Investors typically approach the issue of trust in a binary way: they either they trust a country’s policy or they do not.
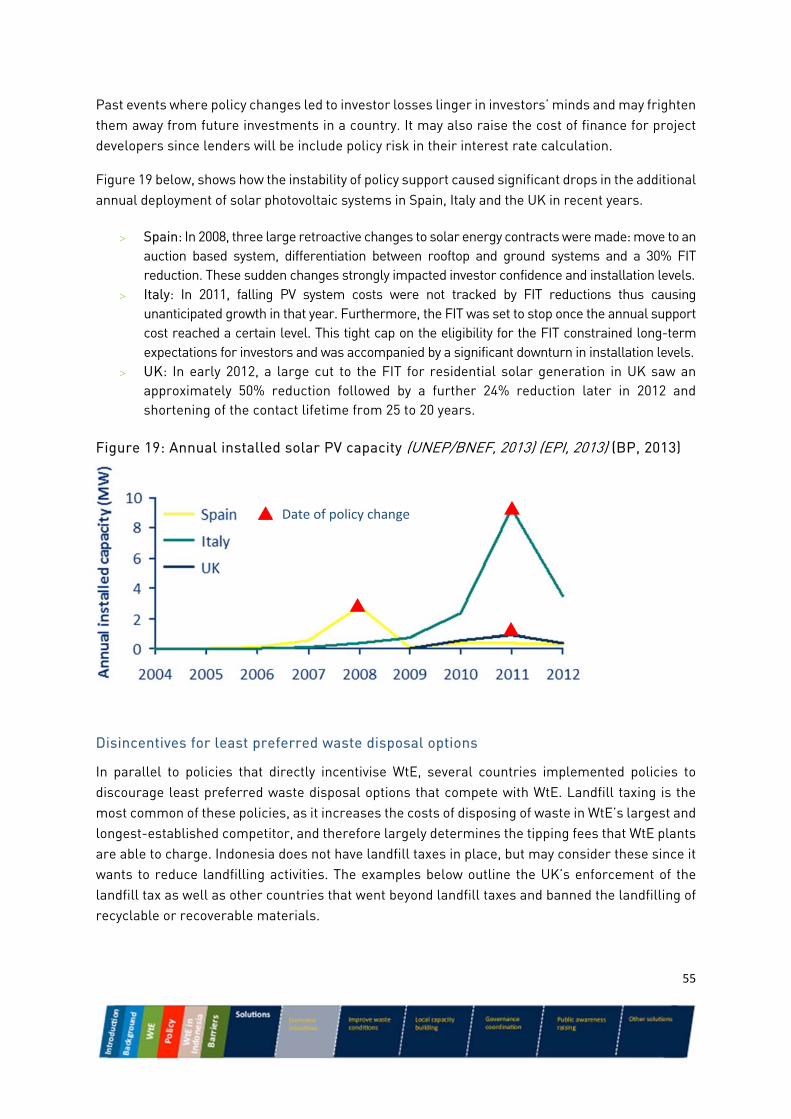
55
Past events where policy changes led to investor losses linger in investors’ minds and may frighten them away from future investments in a country. It may also raise the cost of finance for project developers since lenders will be include policy risk in their interest rate calculation.
Figure 19 below, shows how the instability of policy support caused significant drops in the additional annual deployment of solar photovoltaic systems in Spain, Italy and the UK in recent years.
Spain: In 2008, three large retroactive changes to solar energy contracts were made: move to an auction based system, differentiation between rooftop and ground systems and a 30% FIT reduction. These sudden changes strongly impacted investor confidence and installation levels.
Italy: In 2011, falling PV system costs were not tracked by FIT reductions thus causing unanticipated growth in that year. Furthermore, the FIT was set to stop once the annual support cost reached a certain level. This tight cap on the eligibility for the FIT constrained long-term expectations for investors and was accompanied by a significant downturn in installation levels.
UK: In early 2012, a large cut to the FIT for residential solar generation in UK saw an approximately 50% reduction followed by a further 24% reduction later in 2012 and shortening of the contact lifetime from 25 to 20 years.
Figure 19: Annual installed solar PV capacity (UNEP/BNEF, 2013) (EPI, 2013) (BP, 2013)
Disincentives for least preferred waste disposal options
In parallel to policies that directly incentivise WtE, several countries implemented policies to discourage least preferred waste disposal options that compete with WtE. Landfill taxing is the most common of these policies, as it increases the costs of disposing of waste in WtE’s largest and longest-established competitor, and therefore largely determines the tipping fees that WtE plants are able to charge. Indonesia does not have landfill taxes in place, but may consider these since it wants to reduce landfilling activities. The examples below outline the UK’s enforcement of the landfill tax as well as other countries that went beyond landfill taxes and banned the landfilling of recyclable or recoverable materials.
Date of policy change
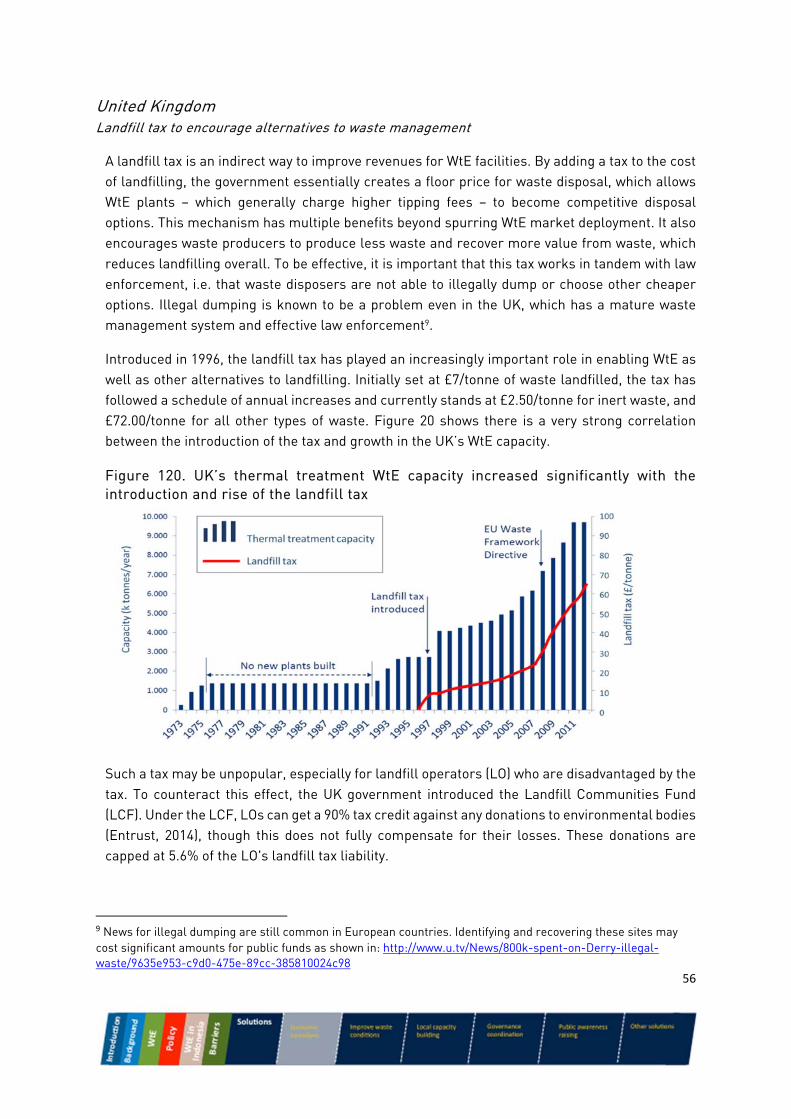
56
United Kingdom Landfill tax to encourage alternatives to waste management
A landfill tax is an indirect way to improve revenues for WtE facilities. By adding a tax to the cost of landfilling, the government essentially creates a floor price for waste disposal, which allows WtE plants – which generally charge higher tipping fees – to become competitive disposal options. This mechanism has multiple benefits beyond spurring WtE market deployment. It also encourages waste producers to produce less waste and recover more value from waste, which reduces landfilling overall. To be effective, it is important that this tax works in tandem with law enforcement, i.e. that waste disposers are not able to illegally dump or choose other cheaper options. Illegal dumping is known to be a problem even in the UK, which has a mature waste management system and effective law enforcement9.
Introduced in 1996, the landfill tax has played an increasingly important role in enabling WtE as well as other alternatives to landfilling. Initially set at £7/tonne of waste landfilled, the tax has followed a schedule of annual increases and currently stands at £2.50/tonne for inert waste, and £72.00/tonne for all other types of waste. Figure 20 shows there is a very strong correlation between the introduction of the tax and growth in the UK’s WtE capacity.
Figure 120. UK’s thermal treatment WtE capacity increased significantly with the introduction and rise of the landfill tax
Such a tax may be unpopular, especially for landfill operators (LO) who are disadvantaged by the tax. To counteract this effect, the UK government introduced the Landfill Communities Fund (LCF). Under the LCF, LOs can get a 90% tax credit against any donations to environmental bodies (Entrust, 2014), though this does not fully compensate for their losses. These donations are capped at 5.6% of the LO's landfill tax liability.
9 News for illegal dumping are still common in European countries. Identifying and recovering these sites may cost significant amounts for public funds as shown in: http://www.u.tv/News/800k-spent-on-Derry-illegal-waste/9635e953-c9d0-475e-89cc-385810024c98
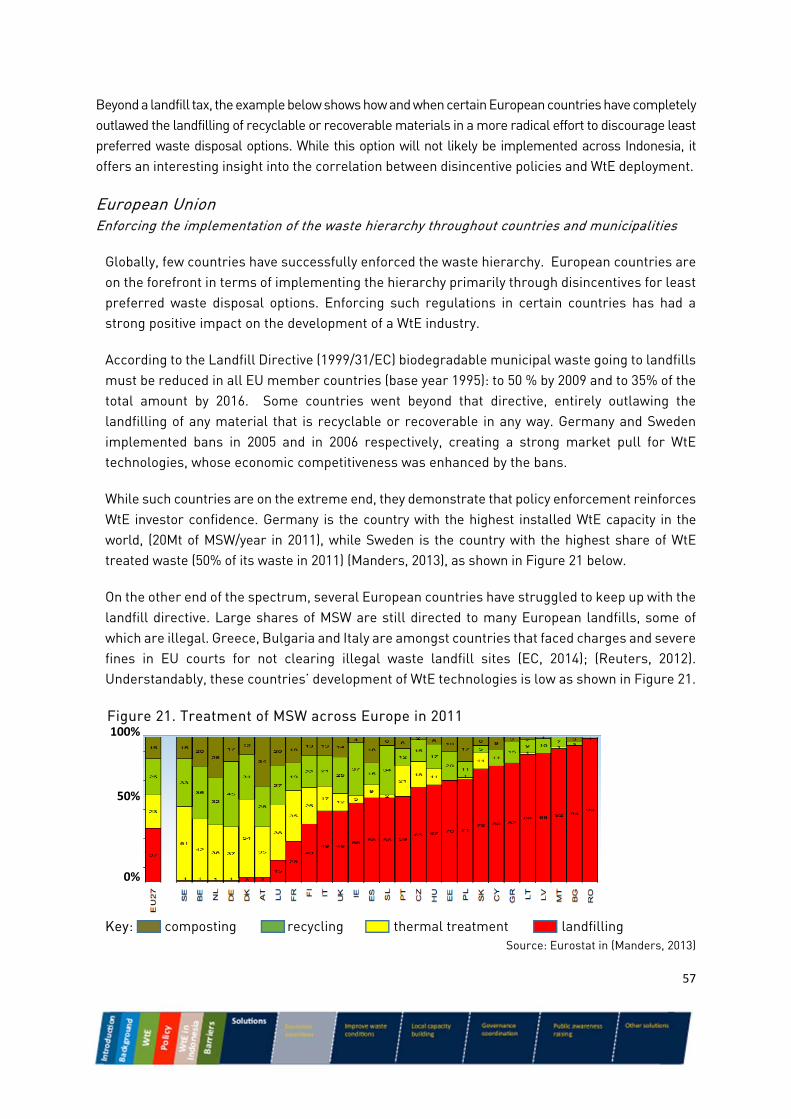
57
Beyond a landfill tax, the example below shows how and when certain European countries have completely outlawed the landfilling of recyclable or recoverable materials in a more radical effort to discourage least preferred waste disposal options. While this option will not likely be implemented across Indonesia, it offers an interesting insight into the correlation between disincentive policies and WtE deployment.
European Union Enforcing the implementation of the waste hierarchy throughout countries and municipalities
Globally, few countries have successfully enforced the waste hierarchy. European countries are on the forefront in terms of implementing the hierarchy primarily through disincentives for least preferred waste disposal options. Enforcing such regulations in certain countries has had a strong positive impact on the development of a WtE industry.
According to the Landfill Directive (1999/31/EC) biodegradable municipal waste going to landfills must be reduced in all EU member countries (base year 1995): to 50 % by 2009 and to 35% of the total amount by 2016. Some countries went beyond that directive, entirely outlawing the landfilling of any material that is recyclable or recoverable in any way. Germany and Sweden implemented bans in 2005 and in 2006 respectively, creating a strong market pull for WtE technologies, whose economic competitiveness was enhanced by the bans.
While such countries are on the extreme end, they demonstrate that policy enforcement reinforces WtE investor confidence. Germany is the country with the highest installed WtE capacity in the world, (20Mt of MSW/year in 2011), while Sweden is the country with the highest share of WtE treated waste (50% of its waste in 2011) (Manders, 2013), as shown in Figure 21 below.
On the other end of the spectrum, several European countries have struggled to keep up with the landfill directive. Large shares of MSW are still directed to many European landfills, some of which are illegal. Greece, Bulgaria and Italy are amongst countries that faced charges and severe fines in EU courts for not clearing illegal waste landfill sites (EC, 2014); (Reuters, 2012). Understandably, these countries’ development of WtE technologies is low as shown in Figure 21.
Figure 21. Treatment of MSW across Europe in 2011
Key: composting recycling thermal treatment landfilling
Source: Eurostat in (Manders, 2013)
100%
50%
0%
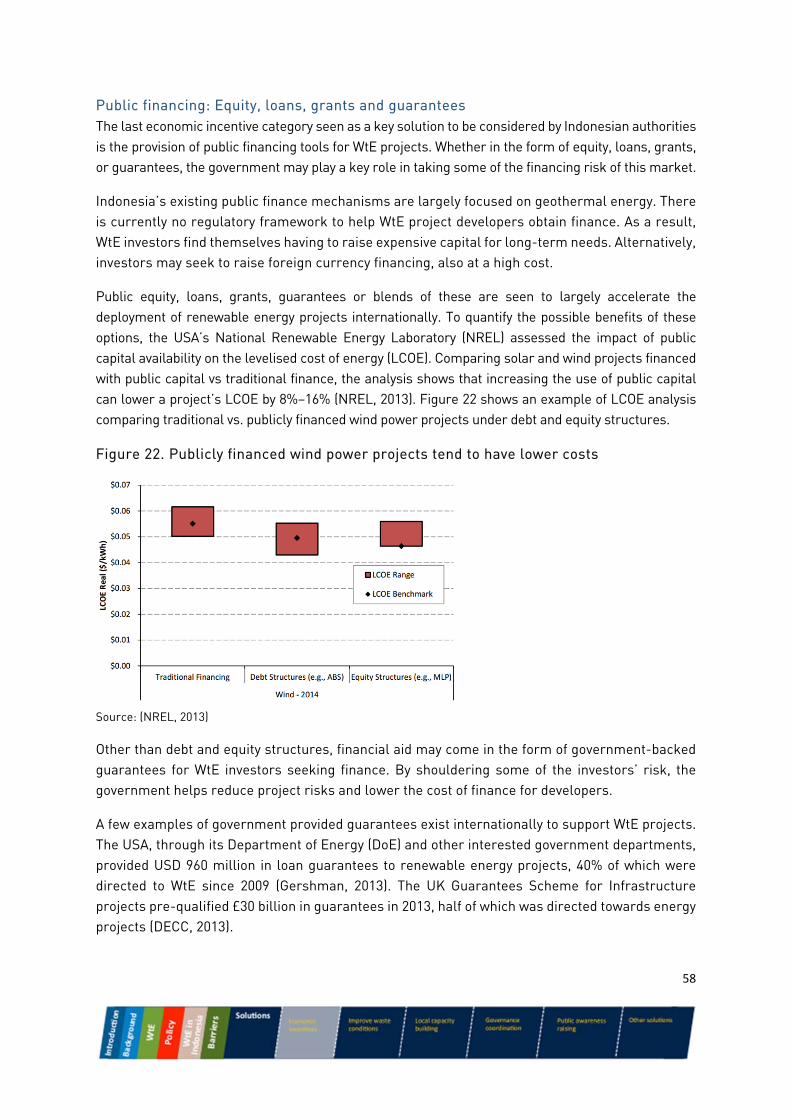
58
Public financing: Equity, loans, grants and guarantees The last economic incentive category seen as a key solution to be considered by Indonesian authorities is the provision of public financing tools for WtE projects. Whether in the form of equity, loans, grants, or guarantees, the government may play a key role in taking some of the financing risk of this market.
Indonesia’s existing public finance mechanisms are largely focused on geothermal energy. There is currently no regulatory framework to help WtE project developers obtain finance. As a result, WtE investors find themselves having to raise expensive capital for long-term needs. Alternatively, investors may seek to raise foreign currency financing, also at a high cost.
Public equity, loans, grants, guarantees or blends of these are seen to largely accelerate the deployment of renewable energy projects internationally. To quantify the possible benefits of these options, the USA’s National Renewable Energy Laboratory (NREL) assessed the impact of public capital availability on the levelised cost of energy (LCOE). Comparing solar and wind projects financed with public capital vs traditional finance, the analysis shows that increasing the use of public capital can lower a project’s LCOE by 8%–16% (NREL, 2013). Figure 22 shows an example of LCOE analysis comparing traditional vs. publicly financed wind power projects under debt and equity structures.
Figure 22. Publicly financed wind power projects tend to have lower costs
Source: (NREL, 2013)
Other than debt and equity structures, financial aid may come in the form of government-backed guarantees for WtE investors seeking finance. By shouldering some of the investors’ risk, the government helps reduce project risks and lower the cost of finance for developers.
A few examples of government provided guarantees exist internationally to support WtE projects. The USA, through its Department of Energy (DoE) and other interested government departments, provided USD 960 million in loan guarantees to renewable energy projects, 40% of which were directed to WtE since 2009 (Gershman, 2013). The UK Guarantees Scheme for Infrastructure projects pre-qualified £30 billion in guarantees in 2013, half of which was directed towards energy projects (DECC, 2013).
59
Multilateral guarantee mechanisms are also available internationally. In 2013, the World Bank’s Multilateral Investment Guarantee Agency underwrote USD 38 million for WtE incineration projects in Sri Lanka (MIGA, 2013).
Multilateral financial institutions are also open to debt and equity finance, and could work in parallel with Indonesia’s public finance. The case of the Asian Development Bank’s (ADB) debt finance enabling WtE projects in China is shown below as a successful example that can be drawn to Indonesia.
Asian Development Bank Combined loans and technical assistance grants
In 2012, the Asian Development Bank (ADB) announced the first of four major investments to support WtE incineration plants in China In total, a USD 200 million 10-year loan was provided to the state-owned environmental, energy and water company, China Everbright International Ltd, to finance three WtE incinerators. The lending activity supports China’s goal of establishing a ‘recycling economy’ that includes strong policies that promote WtE (ADB, 2012). As the country’s lead public waste management company, China Everbright plans on building at least 10 new incinerators by 2016. Combined, these are expected to treat 7,300 tonnes of waste a day with a total installed capacity of 155 MW, generating around 1,240 GWh/year by 2016 (ADB, 2012).
The ADB lent USD 100 million (an "A loan”) and secured another USD 100 million (a “B loan”) by structuring a financing package that involved five Chinese commercial banks and a Canadian financing institution. Combining finance with the ADB (the primary “A” lender) legally extends ADB’s international immunities and privileges to the secondary “B” lenders, even if these institutions do not reside in the country of the borrower. Co-lending through institutions like the ADB helps reduce risks and costs for lenders since they enjoy:
Use of ADB’s loan administration services Exemption from restrictions on currency conversions and on remittance of interest
payments and repatriation of principal Exemption from withholding taxes Reduced likelihood of rescheduling in the event of an external debt crisis in the borrowing
country Exemption from country provisioning requirements (where applicable) (ADB, 2013c)
In addition to the loan, ADB granted China Everbright US$ 653,000 for technical assistance through its Clean Energy Financing Partnership Facility (ADB, 2014). The grant was provided because this project was ADB’s first WtE loan, so the bank had a strong interest in ensuring the facilities were well-operated, met stringent (EU level) environmental and social management system standards, and stimulated interest in wider WtE deployment.
Several characteristics made Chinese WtE an attractive investment option for the ADB, some of which are yet to be established in Indonesia:
60
Scale: In general, ADB will only consider WtE loans that are greater than US$ 30 million with capacities in excess of 500 tonnes/day
Contracts: The Chinese government developed standardised 20 year concessional agreements between municipalities and waste management companies such as Everbright. These agreements are simple and short (only a few pages), give waste companies the exclusive waste collection rights in multiple cities, and allow them to charge predictable tipping fees throughout the contractual term. This gives lenders confidence that the incineration projects will have stable sources of feedstock and tipping fee revenues throughout the project’s lifetime.
Sector experience and size: China Everbright International has a track record of successfully building and operating WtE incinerators, and have demonstrated that they can do it cost-effectively. With seven operating WtE facilities and five more under construction, risk of one or two plants underperforming does not threaten the solvency of the whole company.
Government-backed security: The company’s parent is China Everbright Limited, a state-owned enterprise, which significantly reduces the risk of bankruptcy.
Opportunity for wider deployment: China has many very large cities, and even third tier cities have populations over 1 million. Supporting WtE project development in China that meets stringent environmental and social standards should demonstrate that these facilities can be widely deployed and profitable while also having positive environmental and social outcomes.
In addition to the above factors, ADB required three key conditions from Everbright to support their investment:
Everbright needed to be independently managed and demonstrate adequate managerial capacity through a track record of large waste management projects, which it did
The planned incinerators needed to comply with European equivalent emission standards as a means to improve the international image of incinerators and encourage further dissemination;
Everbright needed to comply with standard ADB policies on environmental and social management systems, detailed in (ADB, 2013b)
61
Recommendations to improve economic attractiveness: Develop an evidence base for project costs by collating or commissioning a set of WtE
feasibility studies, reviewed by an expert, to enable more effective discussion about national and local government cost sharing, and to identify how costs can be reduced
Map the landscape of available finance, and identify the necessary conditions for international donor agencies to support WtE in Indonesia, and make a plan to attract funding for demonstration projects and to scale up commercial deployment
Ensure that the overall financial package received by WtE project developers (feed-in tariff plus the tipping fee) generates an acceptable IRR. This requires coordination with local governments to determine what level of tipping fee they can reasonably afford.
Evolve the feed-in tariff in concert with local government tipping fees to create an attractive revenue package for project developers, but including protections against excessive subsidies or windfall profits
Consider implementing a landfill tax, phased regionally and over time, to provide a financial incentive for local governments to develop alternative waste management options, including WtE. Recognise the need to strictly enforce illegal dumping laws.
Create the conditions that are necessary for international donor agencies to support WtE in Indonesia. Concessional finance from development banks (e.g. ADB) could help reduce financing costs, crowd in lower cost private sector investment, and accelerate deployment. In China, the ADB looked for scale, secure contracting, sector experience, some level of government-backed security, the opportunity for wider deployment, and environmental and social best-practice. Developing a WtE NAMA would also open up other pools of international finance.
Extend government guarantees such as the IIGF for WtE projects to address credit risk at the municipality level
62
Improve waste conditions Barriers to Indonesia’s WtE market can be further addressed by improving the condition of the waste stream, or assuring its condition remains suitable throughout a WtE project’s lifetime. This is essential to attract WtE investors as the unsuitability of waste causes additional pre-treatment costs within WtE plants. Local government should be able to evaluate the cost effectiveness of making upstream systematic changes that improve the conditions of waste before it reaches WtE plants compared to compensating WtE operators for pre-treatment costs through higher tipping fees. Ultimately the cost has to be dealt with by the municipality at some stage. Upstream solutions such as source separation, containerisation, and segregated waste collection and transportation may be less expensive than downstream solutions when considering the full range of benefits of the former. Essentially, upstream solutions create a more healthy urban environment, new job opportunities and enhance the municipality’s capacity to recover value from waste, e.g. from reuse and recycling.
Municipalities must decide whether or not to sort waste streams, and if so, whether to have individuals do source separation, or sort waste in central material recovery facilities. It is important that municipalities are equipped to assess the costs and benefits of a range of options. Looking strictly into the costs of a waste management system, source separation reduces the need for municipalities to spend money on sorting downstream, but increases the costs of collection and transport logistics, since more trucks – each with its particular characteristics - have to be sent out for collection and waste delivery (even if less often).
The underlining principle is that if waste streams are never disposed of together, they do not contaminate each other (e.g. segregated paper and plastic does not get soaked with organic matter and can be directly passed onto recycling or treatment facilities without requiring further separation or pre-treatment). Whether or not waste is source separated, for thermal WtE technologies, it is highly beneficial that is containerised during collection and transport to keep it away from the rain. This considerably reduces the moisture content of the waste streams, avoiding the need for costly drying processes required in incineration facilities. Adequately collecting and transporting Indonesia’s waste in containers would require a systematic change to municipal collection systems.
Different cities in different parts of the world have developed integrated models or pilot projects to analyse their options for source separation, MRF, mixes of both or none of these. The results vary widely according to the variables in each city. Examples of such initiatives can be found in India, Indonesia, the Philippines, Thailand, Pakistan, Egypt, Mali, Senegal, Kenya, Tanzania, Brazil, Peru, Colombia and Costa Rica, to name some of the main countries (Lardinois & Christine, 1999). Importantly, source separation is never seen to be enforced on an absolute national level, but always on a municipal level, taking into account local specificities. The examples of Helsinki and of a pilot project in eight Chinese cities are briefly outlined below.
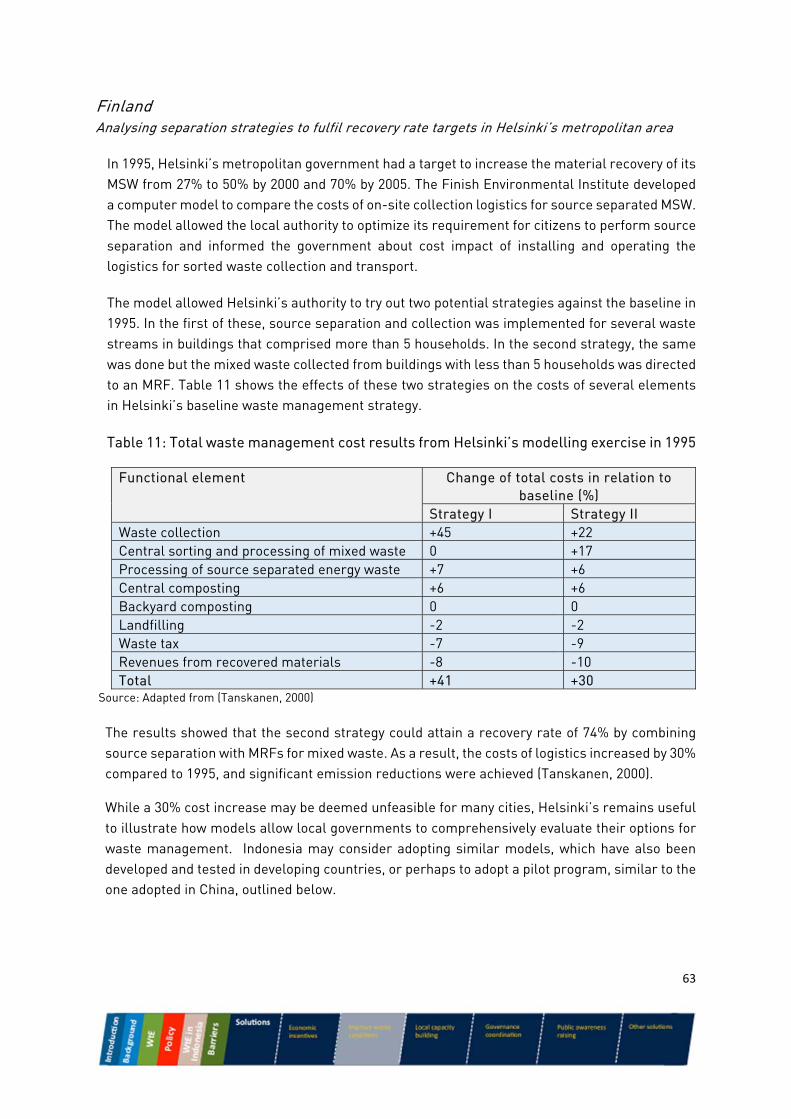
63
Finland Analysing separation strategies to fulfil recovery rate targets in Helsinki’s metropolitan area
In 1995, Helsinki’s metropolitan government had a target to increase the material recovery of its MSW from 27% to 50% by 2000 and 70% by 2005. The Finish Environmental Institute developed a computer model to compare the costs of on-site collection logistics for source separated MSW. The model allowed the local authority to optimize its requirement for citizens to perform source separation and informed the government about cost impact of installing and operating the logistics for sorted waste collection and transport.
The model allowed Helsinki’s authority to try out two potential strategies against the baseline in 1995. In the first of these, source separation and collection was implemented for several waste streams in buildings that comprised more than 5 households. In the second strategy, the same was done but the mixed waste collected from buildings with less than 5 households was directed to an MRF. Table 11 shows the effects of these two strategies on the costs of several elements in Helsinki’s baseline waste management strategy.
Table 11: Total waste management cost results from Helsinki’s modelling exercise in 1995
Source: Adapted from (Tanskanen, 2000)
The results showed that the second strategy could attain a recovery rate of 74% by combining source separation with MRFs for mixed waste. As a result, the costs of logistics increased by 30% compared to 1995, and significant emission reductions were achieved (Tanskanen, 2000).
While a 30% cost increase may be deemed unfeasible for many cities, Helsinki’s remains useful to illustrate how models allow local governments to comprehensively evaluate their options for waste management. Indonesia may consider adopting similar models, which have also been developed and tested in developing countries, or perhaps to adopt a pilot program, similar to the one adopted in China, outlined below.
Functional element Change of total costs in relation to baseline (%)
Strategy I Strategy II Waste collection +45 +22 Central sorting and processing of mixed waste 0 +17 Processing of source separated energy waste +7 +6 Central composting +6 +6 Backyard composting 0 0 Landfilling -2 -2 Waste tax -7 -9 Revenues from recovered materials -8 -10 Total +41 +30
64
China Pilot programme for source separation
A pilot programme was launched in eight major cities throughout China in 2000 to enforce and analyse the impacts of source separation. Detailed investigations were carried out and a comprehensive system was constructed to evaluate the effects of the eight-year implementation in those cities (Tai, Zhang, Che, & Feng, 2011).
The results of the pilot demonstrated that source separation was generally successful in the eight cities, but the project recognises that an ideal source-separation and collection system has not yet been established in China (Tai, Zhang, Che, & Feng, 2011). The effectiveness of the implementation in the eight cities was classified into three levels: Beijing and Shanghai belonged to the ‘‘excellent’’ level. Guangzhou belonged to the ‘‘adequate’’ level. Other cities, including Xiamen, Shenzhen, Hangzhou, Nanjing and Guilin, showed a ‘‘limited’’ success. Local differences in the separation of waste streams are considered to be the main variable that determined the systems’ effectiveness but researchers seem to have been unable to find the level of source separation that optimises recovery rates.
Following from the pilot scheme, Chinese cities are working to improve their understanding of source separation. Lei et al., (2011) developed a model to evaluate the parameters that determine Beijing’s source separation activity and concluded that internal motivation is a key factor. Researchers evaluated the public opinion about the source separation of MSW in Shanghai (Zhang, et al., 2012). It concludes that negative neighbour effects, confused classification of MSW, and mixed transportation and disposal are the biggest limitations of MSW source-separated collection.
Literature on China’s pilot scheme seems to be limited in quantifying the benefits of source separation. Nonetheless, the Chinese case serves as a good example of local governments attempting to assess their opportunities in relation to their budget constraints to create waste management improvements.
Recommendations to improve waste conditions:
Consider developing guidance for local governments to help them evaluate which changes to the waste system would improve the conditions of the waste (e.g. source vs central sorting), and how would these impact upon the cost of the whole waste management system.
Guidance should help local governments consider the costs and benefits of changing their waste management systems in line with the waste hierarchy (e.g. material recovery and recycling rates), as well as broader social welfare improvements (e.g. job generation, emission reduction and improving quality of life).
Carry out trials to test systemic changes and to demonstrate results before scaling up.
65
Local capacity building The local capacity and political context challenge is most clearly addressed through local capacity building initiatives, but such initiatives also help to address some elements of the economic and social challenges. Since WtE projects are relatively new in Indonesia, municipalities only have limited experience in their commissioning and operations.
Having municipal authorities learn about the costs, benefits and contextual suitability of different WtE technologies is useful for all stages of WtE project implementation. With some knowledge, they can better evaluate project concept bids, contribute to project developers’ feasibility assessments, develop approximate cost expectations, and communicate these issues to local residents.
Local capacity building is important for these reasons, but this section focuses mostly on managing regulatory issues, procurement processes and investment frameworks, which tend to be particularly challenging (IICPWtE, 2014). This section is therefore subdivided into two parts:
The need to raise awareness among municipalities of the wider context of waste management and WtE as an option, including financing mechanisms; and
Options for running objective and transparent procurement processes using adequate contractual structures.
Raise awareness of municipalities towards waste management and WtE To foster WtE markets within a wider waste management strategy, municipalities have to be aware of the benefits of WtE along with further insights into which WtE technology is best for each situation, what is the scale of tipping fees required, and what are the concerns of WtE investors. This should enable municipalities to be able to judge if a WtE solution is appropriate for the local context, which will help them target the right investors.
A few international initiatives are helping to raise municipal government awareness towards waste management and WtE. In this subsection, the EU-Indonesia Trade Cooperation Facility is used as a successful example of a local capacity building initiative that could be built upon in Indonesia. The European Covenant CapaCITY programme is shown as an example of a cross country capacity building initiative. Beyond that, the UK’s Waste & Resources Action Programme (WRAP) provides an example of a public delivery body that has worked to enhance municipalities’ capacity to assess waste management options including WtE.
EU-Indonesia Trade Cooperation Facility
The EU-Indonesia Trade Cooperation Facility (TCF) is a four-year project that began in 2013. It is aimed at improving the trade and investment environment in Indonesia and contributing to the country’s long-term sustainable economic development (TCF, 2014). TCF serves as an example of an ongoing successful capacity building solution for Indonesian municipalities to deal with WtE assessments. Funded by the EU, the TCF is implemented by an international consortium of consultancy companies who deliver on the ground capacity building to government institutions under six key topics.
66
Energy is one of the TCF’s key topics. TCF’s technical assistance teams already provide capacity building programmes for the MEMR, the National Energy Council and other relevant Indonesian ministries to help with energy policy formulation and planning. This programme includes several activities aimed at enhancing national and municipal governments’ capacity to assess and develop WtE projects, including:
The development of a guidebook for WtE projects and investments in Indonesia, covering regulatory framework at national, provincial and district levels and providing contract templates and investment models for AD, LFG and thermal treatment WtE projects
Coordination meetings with key WtE stakeholders in Europe and Indonesia, involving knowledge dissemination courses to Indonesian municipalities
Setting up of a WtE website to facilitate collaboration between Indonesian and European Municipalities
Workshops with provincial authorities for promotion and capacity building of WtE investments, including exchange visits between European and Indonesian municipalities
Together, these activities should lead to further cooperation between Indonesian government and private initiatives. A series of case studies of commercially viable projects in the WTE sector are currently being written to serve as examples that demonstrate successful cooperation between private and public institutions. The case studies will describe the technology, investment and operational costs, environmental issues, required technical and institutional capacity, the mechanisms (including subsidies, feed-in-tariffs and guarantees) used to finance the projects, and the terms and conditions of the Power Purchase Agreements between the projects and the off-takers (IICPWtE, 2014). Finally, TCF intends to help Indonesian stakeholders to design specific tools to enable new WtE projects, such as the actual financial and contractual arrangements between municipalities and private sector.
TCF’s objectives represent a major opportunity for Indonesian local governments. Many critical barriers identified in this study can be substantially addressed through local capacity building, so TCF’s work could lead to very positive outcomes for Indonesia’s WtE industry.
World Bank The Public-Private Infrastructure Advisory Facility
The Public-Private Infrastructure Advisory Facility (PPIAF) was created in 1999 to act as a catalyst to increase private sector participation in emerging markets. With funding boundaries between USD 25,000 and USD 500,000, it has financed several projects to support governments’ creation of sound enabling environments for private sector investments.
PPIAF has funded projects that provided technical assistance for local governments looking into WtE solutions in Vietnam, Egypt and other countries (PPIAF, 2012). In Egypt for example, it financed a prefeasibility study for the country’s WtE potential completed in 2013. PPIAF has also aided governments and private initiatives to fund and monitor projects that incorporate waste pickers into micro-enterprises in formal MSW management systems.
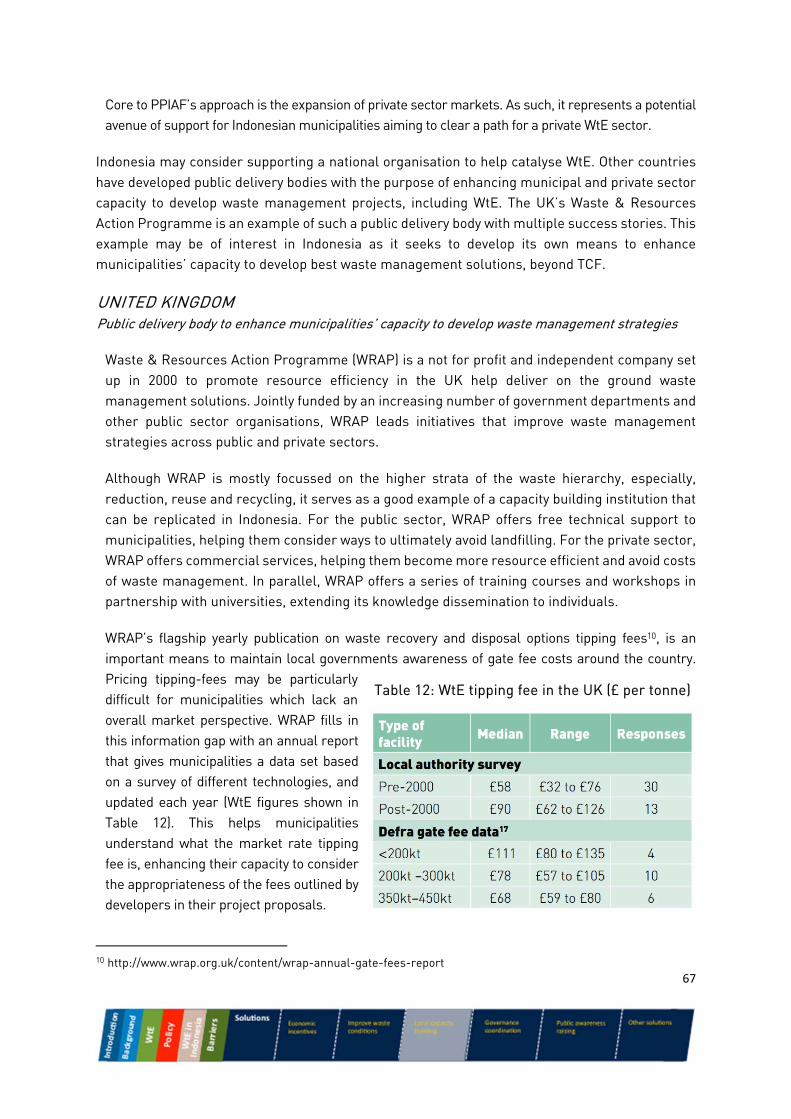
67
Core to PPIAF’s approach is the expansion of private sector markets. As such, it represents a potential avenue of support for Indonesian municipalities aiming to clear a path for a private WtE sector.
Indonesia may consider supporting a national organisation to help catalyse WtE. Other countries have developed public delivery bodies with the purpose of enhancing municipal and private sector capacity to develop waste management projects, including WtE. The UK’s Waste & Resources Action Programme is an example of such a public delivery body with multiple success stories. This example may be of interest in Indonesia as it seeks to develop its own means to enhance municipalities’ capacity to develop best waste management solutions, beyond TCF.
UNITED KINGDOM Public delivery body to enhance municipalities’ capacity to develop waste management strategies
Waste & Resources Action Programme (WRAP) is a not for profit and independent company set up in 2000 to promote resource efficiency in the UK help deliver on the ground waste management solutions. Jointly funded by an increasing number of government departments and other public sector organisations, WRAP leads initiatives that improve waste management strategies across public and private sectors.
Although WRAP is mostly focussed on the higher strata of the waste hierarchy, especially, reduction, reuse and recycling, it serves as a good example of a capacity building institution that can be replicated in Indonesia. For the public sector, WRAP offers free technical support to municipalities, helping them consider ways to ultimately avoid landfilling. For the private sector, WRAP offers commercial services, helping them become more resource efficient and avoid costs of waste management. In parallel, WRAP offers a series of training courses and workshops in partnership with universities, extending its knowledge dissemination to individuals.
WRAP’s flagship yearly publication on waste recovery and disposal options tipping fees10, is an important means to maintain local governments awareness of gate fee costs around the country. Pricing tipping-fees may be particularly difficult for municipalities which lack an overall market perspective. WRAP fills in this information gap with an annual report that gives municipalities a data set based on a survey of different technologies, and updated each year (WtE figures shown in Table 12). This helps municipalities understand what the market rate tipping fee is, enhancing their capacity to consider the appropriateness of the fees outlined by developers in their project proposals.
10 http://www.wrap.org.uk/content/wrap-annual-gate-fees-report
Table 12: WtE tipping fee in the UK (£ per tonne)
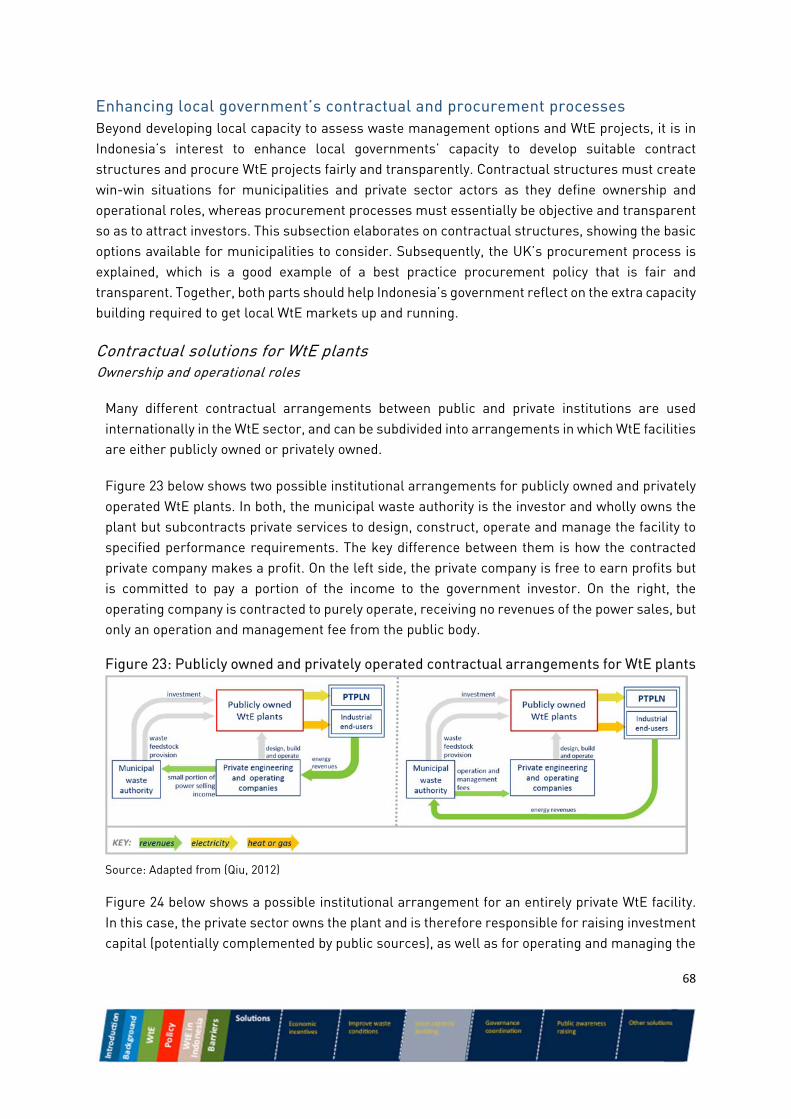
68
Enhancing local government’s contractual and procurement processes Beyond developing local capacity to assess waste management options and WtE projects, it is in Indonesia’s interest to enhance local governments’ capacity to develop suitable contract structures and procure WtE projects fairly and transparently. Contractual structures must create win-win situations for municipalities and private sector actors as they define ownership and operational roles, whereas procurement processes must essentially be objective and transparent so as to attract investors. This subsection elaborates on contractual structures, showing the basic options available for municipalities to consider. Subsequently, the UK’s procurement process is explained, which is a good example of a best practice procurement policy that is fair and transparent. Together, both parts should help Indonesia’s government reflect on the extra capacity building required to get local WtE markets up and running.
Contractual solutions for WtE plants Ownership and operational roles
Many different contractual arrangements between public and private institutions are used internationally in the WtE sector, and can be subdivided into arrangements in which WtE facilities are either publicly owned or privately owned.
Figure 23 below shows two possible institutional arrangements for publicly owned and privately operated WtE plants. In both, the municipal waste authority is the investor and wholly owns the plant but subcontracts private services to design, construct, operate and manage the facility to specified performance requirements. The key difference between them is how the contracted private company makes a profit. On the left side, the private company is free to earn profits but is committed to pay a portion of the income to the government investor. On the right, the operating company is contracted to purely operate, receiving no revenues of the power sales, but only an operation and management fee from the public body.
Figure 23: Publicly owned and privately operated contractual arrangements for WtE plants
Source: Adapted from (Qiu, 2012)
Figure 24 below shows a possible institutional arrangement for an entirely private WtE facility. In this case, the private sector owns the plant and is therefore responsible for raising investment capital (potentially complemented by public sources), as well as for operating and managing the
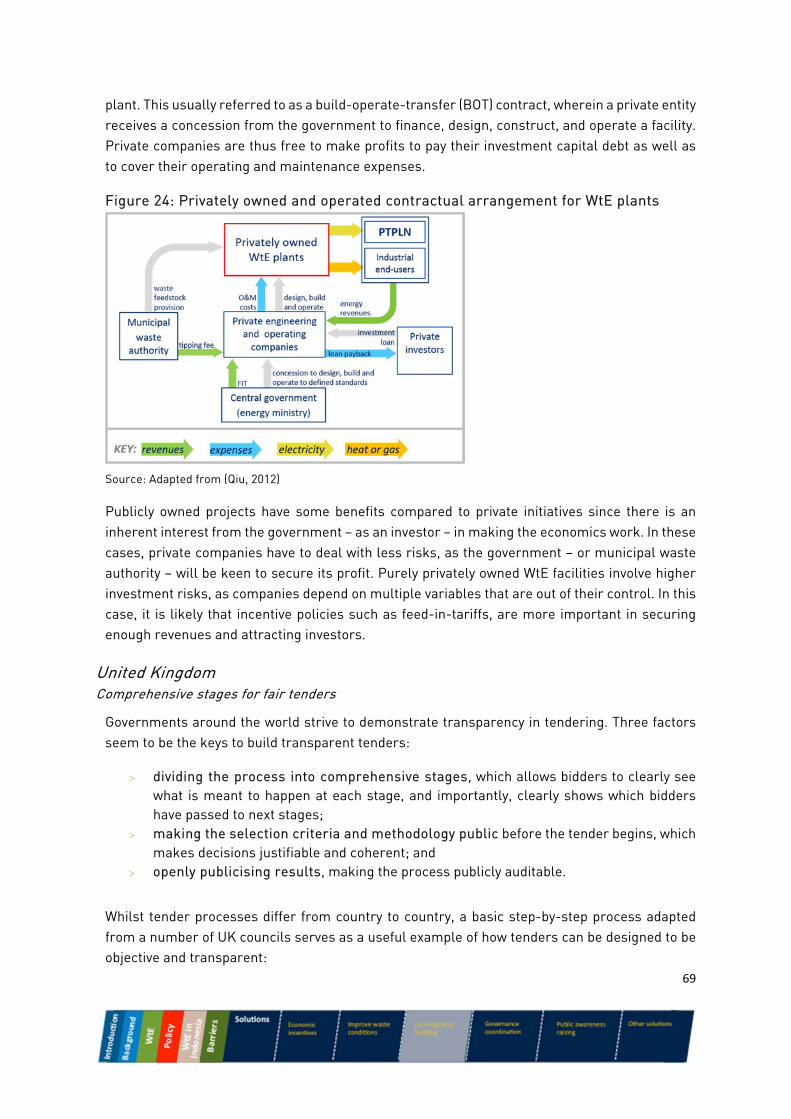
69
plant. This usually referred to as a build-operate-transfer (BOT) contract, wherein a private entity receives a concession from the government to finance, design, construct, and operate a facility. Private companies are thus free to make profits to pay their investment capital debt as well as to cover their operating and maintenance expenses.
Figure 24: Privately owned and operated contractual arrangement for WtE plants
Source: Adapted from (Qiu, 2012)
Publicly owned projects have some benefits compared to private initiatives since there is an inherent interest from the government – as an investor – in making the economics work. In these cases, private companies have to deal with less risks, as the government – or municipal waste authority – will be keen to secure its profit. Purely privately owned WtE facilities involve higher investment risks, as companies depend on multiple variables that are out of their control. In this case, it is likely that incentive policies such as feed-in-tariffs, are more important in securing enough revenues and attracting investors.
United Kingdom Comprehensive stages for fair tenders
Governments around the world strive to demonstrate transparency in tendering. Three factors seem to be the keys to build transparent tenders:
dividing the process into comprehensive stages, which allows bidders to clearly see what is meant to happen at each stage, and importantly, clearly shows which bidders have passed to next stages;
making the selection criteria and methodology public before the tender begins, which makes decisions justifiable and coherent; and
openly publicising results, making the process publicly auditable.
Whilst tender processes differ from country to country, a basic step-by-step process adapted from a number of UK councils serves as a useful example of how tenders can be designed to be objective and transparent:
70
1- Advertising the opportunity/expression of interest
Tenderers publicly announce the opportunity, clearly stating the subject of the bid, the methodology of evaluation of bidders and the steps ahead. Bidders have to accept a series of terms and conditions to be able to submit a tender, avoiding unwanted legal hurdles in the stages ahead.
2- Selection stage
The tenderer needs to be satisfied that its suppliers are financially robust, properly insured and qualified, and have the capacity to undertake the work. This can be assessed through a pre-qualification questionnaire. The tenderer will select and de-select bidders for the next stage at this point. It is important to provide a full debrief for candidates who are unsuccessful, supporting them to improve their future tender opportunities.
3- Award stage
Successful candidates are invited to tender. The invitation to tender (ITT) stage should contain instructions on how to complete the documents in full and on time along with a checklist to assist them in submitting documents. The ITT should also be clear on how the bid will be evaluated, under which criteria, with criteria having a specified relative ‘weight’. Where applicable evidence is requested as part of the award section to confirm the capability of the supplier. Bids at this stage may also be assessed by independent audit officers to assure their accuracy before following to the next stage.
4- Evaluations
All bids in the last stage are evaluated on the basis of pre-determined criteria, which generally point to the most economically advantageous one (but not necessarily the cheapest, when all elements are considered). The criteria for evaluation may differ from tender to tender.
5- Intention to award
All suppliers who submit a bid are notified of the outcome of the last stage through a clear and secure system, usually online. Unsuccessful suppliers can request a debrief meeting to understand what criteria did they not fulfil as required.
6- Award of contract
Once debriefs are closed, the appropriate contracting procedure can go ahead to the winning bidder.
7- Contract management
Suppliers are monitored and managed as part of the specification listed in the tender process.
71
Recommendations to build local government capacity:
Create an entity or project team at the national level (like the UK’s WRAP) that develops WtE guidance for local governments and acts as a central contact point for local authorities. Guidance could include information on how to improve the fairness and transparency of tendering processes, and an annual review of tipping fees secured for WtE projects throughout the country. The entity could also facilitate local to national information sharing.
Develop standardised contract templates at the national level (in consultation with major lenders and project developers) and offer them to local governments. This will help address contractual risk and ultimately reduce financing costs. Contracts should include:
- Guarantees over minimum waste volume delivery - Exclusivity guarantees for waste in a defined catchment area - Tipping fee indexed to the cost base (or inflation) - Feed-in tariff that is locked in for the lifetime of the project - Long-term waste quality guarantees
Support the TCF’s activities, and consider retaining and augmenting its activities with an entity internal to government after TCFs activities end in 2017.
72
Government coordination Coordination within national government Policy coordination is a fourth possible solution that addresses many economic and political barriers. Policy coordination is ultimately about aligning policy initiatives to create a harmonised approach within government ministries.
WtE can address the concerns of many different government ministries. For the Ministry of Environment, it helps divert waste from landfill, reduce greenhouse gas emissions, and avoid soil and water contamination; for the Ministry Energy, it is a potential source of non-polluting energy; for the Ministry of Public Works, WtE contributes to waste planning objectives; and for employment ministries it can contribute to job creation through infrastructure development. It is therefore essential that ministries and other public bodies align their priorities and work together for common goals when rolling out policies.
The multiple mandates of PT PLN serve as an example of how competing or conflicting ministerial priorities may manifest in one organization, and why national government policy alignment is important. PT PLN aims to provide the lowest cost electricity to end-users but is also expected to pay for grid interconnection for renewables and increase the share of renewable energy on the grid by honouring its PPAs and FIT obligations. With a limited budget, PT PLN would benefit from a clear and harmonised directive avoiding what are inherently conflicting goals. It is thus essential to carefully evaluate the priorities of agencies like PT PLN to ensure that they have a clear and well-articulated mandate.
Coordination between local and national governments Governments play a key role in mainstreaming WtE technologies, but the roles of national and local governments are typically different.
National governments should develop targets and supporting policies, and direct stakeholders (such as the appropriate ministries, municipal governments, WtE industry representatives and civil society) to implement these policies. WtE policy coordination can be supported by forming a working group on WtE that includes these stakeholders.
National waste policies should define the roles of these stakeholders and ensure that there are no conflicts, as seen with some current Indonesian WtE tender processes11. National governments can also play a leading role in information management, guiding stakeholders to desired directions not only through command and control, but through capacity building and knowledge dissemination, especially towards municipal governments.
Local governments are recommended to liaise more effectively with national governments (perhaps participating in the WtE working group suggested above), to develop local strategies and plans to achieve targets set out in the national strategy, to engage with local stakeholders, and to
11 Interviewees that have gone through Indonesia’s renewable energy tender process find the selection process for bidders to be lengthy or have inconsistent selection criteria, as shown in the box of page 42.
73
nurture innovation initiatives that may lead to desired outcome (e.g. WtE investors, community recycling banks, waste sorting and recycling cooperatives, and local AD initiatives). Local governments also have important roles to play in enforcing the law (such as closing down illegal landfills or ensuring WtE plants operate under regulated emission standards).
Coordinating different levels of government is a challenge faced all over the world, and it is being addressed in many ways. Multiple countries have developed online portals intended to coordinate WtE efforts, usually attached to the relevant ministerial websites or promulgated from environmental protection agencies. National leadership in this domain can also be an opportunity to help build local government capacity. The USA’s EPA and the UK’s DEFRA are used as examples of this kind of solution.
USA Environmental Protection Agency as a catalyser for local WtE efforts
The United States’ Environmental Protection Agency (EPA) runs a WtE website12 in which it provides the public and local governments with a wide range of WtE information. Ranging from basic knowledge to an elaborate MSW Decision Support Tool (MSW DST)13 available only for municipalities, the EPA recommends that American municipalities consider the waste hierarchy and WtE as MSW management options.
The MSW DST is designed to help solid waste planners evaluate the cost and environmental aspects of integrated municipal solid waste management strategies. The tool enables users to simulate existing MSW management practices and conduct scenario analyses of new strategies based on cost and environmental objectives. The MSW DST includes multiple design options for waste collection, transfer, materials recovery, composting, waste-to-energy, and landfill disposal (RTI, 2014).
The MSW DST can also be used to evaluate strategies to improve recycling and waste diversion, quantify potential environmental benefits associated with recycling, optimise energy recovery from MSW, and evaluate options for reducing greenhouse gases, air pollutants, and environmental releases to water-bodies or ecosystems (RTI, 2014).
UK Department for Environment, Food and Rural Affairs’ WtE guide
The UK’s Department for Environment, Food and Rural Affairs (DEFRA) published a guide to initiate discussion on WtE and inform municipalities on key WtE facts14. The guide covers WtE’s position in the waste hierarchy; the infrastructure required to support WtE; the inputs, pre-
12 http://www.epa.gov/epawaste/nonhaz/municipal/wte/ 13 MSW DST details provided at: https://mswdst.rti.org/ 14 DEFRA’s guide for debate can be found at: https://www.gov.uk/government/uploads/system/uploads/attachment_data/file/284612/pb14130-energy-waste-201402.pdf
74
treatment needs, outputs, and scale and site needs for different technologies; and guidance on how to obtain financing, planning permission, permits, and implementation of a project. It is a comprehensive, national government approach that helps inform local governments about WtE options. In complement to DEFRA’s guide for debate, the UK’s WRAP published the Energy for Waste Development Guidance15 document, in which it guides project developers to potential sources of funding.
Importantly, DEFRA’s guide points to the UK central government’s future policy direction, leading local governments to follow a clear guideline. The Government sees a long term role for WtE both as a waste management tool and as a source of energy, and as such is prepared to support WtE by implementing many of the solutions seen above.
Solutions to government coordination may also be led by local governments. Drawing on pre-existing organisations, certain countries created WtE working groups to help coordinate efforts. This enables governments to leverage an existing forum or institution to manage WtE issues. South Africa16, the UK17 and Australia18 are among countries where local government associations are active in discussing WtE solutions. The Western Australia Local Governments Association (WALGA) is used as an example below.
Australia Local government associations as key agents of government coordination
In 2012, WALGA published its Vision for Waste Management in the Metropolitan Area19. Responding to Australia’s central government’s Waste Strategy, which aims for municipal solid waste diversion from landfill of 50% by 2015 and 65% by 2020, WALGA proposes a coordinated approach between its municipalities and calls for a statutory plan for waste management from the state Waste Authority. With its initiative WALGA is pushing the central government to define a clear direction for the municipal governments to follow, showing that central governments need to show strong leadership by mandating the expectations for waste treatment options.
The national government might consider encouraging Indonesian municipalities that are interested in WtE to self-organise and present their concerns to national ministries in a coordinated way. Also, developing guidance that can help build local capacity, and communicating the shape of future national plans may help with local government decision making.
15 WRAP’s Energy for Waste Development Guidance can be found at: http://www.wrap.org.uk/sites/files/wrap/O_And_EFW_Guidance_FULL.pdf 16 http://www.salga.org.za/pages/About-SALGA/National-and-Provincial-Working-Groups 17 http://www.local.gov.uk/productivity/-/journal_content/56/10180/3510540/ARTICLE 18 http://www.environment.gov.au/system/files/consultations/7784c3e2-8bb5-4410-abd2-380a45216c80/files/017-walga.pdf 19https://www.google.co.uk/url?sa=t&rct=j&q=&esrc=s&source=web&cd=1&cad=rja&ved=0CEoQFjAA&url=http%3A%2F%2Fwww.walga.asn.au%2Fdownloader.aspx%3Fp%3D%2FPortals%2F0%2FTemplates%2FEnviro%2BWaste%2FWaste_Vision%2B.pdf&ei=f2oXU4WcNqKBywOjhoH4Aw&usg=AFQjCNEIWXEVo8rfrrxZ5jJ5zT_EDJxjbQ&sig2=TaJeJpFFV3Rrl-fIUt4Biw&bvm=bv.62286460,d.bGQ
75
Recommendations for government coordination:
Create a national government WtE “working group” that involves ministries with an interest in WtE (perhaps MMER, Ministry of Public Works, Ministry of Environmental Affairs, Ministry of Finance) and meets periodically to share their department’s plans and activities related to WtE. The working group can provide a forum to ensure a coordinated government approach to WtE that avoids misaligned incentives or confused priorities for entities like PT PLN.
Involve national government in local procurement processes at key points. Once WtE plans reach a certain threshold, they should be reported to the MEMR, who would then join key meetings and review key documents to ensure consistency and avoid issues. MEMR would also be able to keep an up to date and realistic pipeline report, showing which plants were at what stage
Recommend to local governments that they consider forming their own WtE local government associations to share best practice. The associations could also be forums in which municipal issues or concerns were aggregated before being taken to the national level, which would streamline administration.
76
Public awareness raising Public awareness raising and responding to concerns over WtE plants is another potential solution that helps to address many of the social barriers to WtE deployment. These solutions help to create a more informed debate about the costs of waste disposal so that people understand the trade-offs between the options in the waste hierarchy. They also help to correct outdated perceptions about WtE technologies, especially incineration.
This is important in Indonesia, where organised public opposition to waste-to-energy facilities can delay political approval processes and raises risks and costs for developers. It is also important when fostering public debate about waste management solutions, which could include (unpopular) landfill expansion, WtE, or interventions that address waste higher up the waste hierarchy. Systemic changes to waste management, such as source separation, rely on behaviour change, and sustained behaviour change tends to require consistent and targeted awareness-raising campaigns.
This section outlines examples of awareness raising, both to promote change in the waste hierarchy, and to correct misperceptions of certain WtE technologies.
Raising awareness to the waste hierarchy options Raising public awareness about the waste hierarchy, and to the fact that waste is a resource, is a basic step to change Indonesia’s public perception of WtE. Beyond improving the perception of WtE technologies, a government may seek to explain the negative consequences of a poorly managed waste system and the positive effects if managed according to the hierarchy. It is important that citizens recognise these benefits and see their role in waste management solutions.
Several countries and cities have implemented initiatives to raise awareness of waste management strategies and the importance of the population’s participation. Most initiatives try to overcome the idea that "it is the government's job to deal with garbage." Examples of public education in both industrialised and the developing countries include:
Regular "Green and Clean" campaigns to promote waste awareness by the Women Balikatan Movement and Green Forum in Manila
Introduction of environmental education and ecology in the school curricula; organization of teachers' workshops in Australia and New Zealand
Television cartoons (e.g., the Magic Eyes movement in Bangkok) In many Japanese cities, extensive outreach by solid waste departments through school
visits to explain MSW problems and waste minimisation, recycling, and reuse. In Osaka, there are "anti-littering" leaders and "no littering" forums; the first day of each month is designated "beautification day," when there is a coordinated clean-up effort
Promotion of green products, green labelling, and green manufacturing Establishment of instruction centres which are responsible for publishing newsletters and
providing information to schools, businesses, the public, and plant managers to enhance performance and create awareness (e.g., in Osaka).
Indonesia itself has been the stage for some action in the past, as described below.
77
Indonesia Awareness raising campaigns
Awareness raising and behavioural change activities have been carried out throughout Indonesia, and the awareness raising element of the programme of Medan, Bandung, Subang and Surabaya was studied in 2006. Trainers from foreign aid organisations and NGOs joined Indonesian community leaders and facilitators to instruct residents in 3R (reduce, reuse, recycling) principles (USAID, 2006). Activities included waste separation at the source, composting and the initiation of a refuse bank, which received domestic recyclable waste from the community. However, the longer-term impact of these activities is unclear, and they likely require institutional support from local and national governments as well as increased scale in order to solidify behaviour change in the local population and make a material difference to waste management outcomes.
The refuse bank initiative is being carried forward in decentralised efforts in Indonesia, such as an ongoing World Bank supported project which is currently engaged in developing commercially self-sustaining refuse banks. This practice is not widespread, and requires the participation of waste collectors and transfer facilities to have impacts in downstream WtE facilities.
Correcting an outdated misperception A challenge that faced by WtE is an outdated perception that thermal WtE plants have negative environmental and health consequences. Modern thermal treatment plants evolved considerably over the past two decades, reducing their emissions of health threatening substances to operate under strict environmental regulations. Amongst several reports commissioned to evaluate the current state of MSW thermal treatment plant emissions on human health, the UK’s Health Protection Agency report serves as an example to be looked into.
The report categorically concludes: “The Health Protection Agency has reviewed research undertaken to examine the suggested links between emissions from municipal waste incinerators and effects on health. While it is not possible to rule out adverse health effects from modern, well regulated municipal waste incinerators with complete certainty, any potential damage to the health of those living close-by is likely to be very small, if detectable.” (HPA, 2009).
Initiatives to raise public awareness of the social benefits and reduced health impacts of WtE incinerators are usually packaged together with WtE development plans or broader awareness raising. So while few stand-alone examples of WtE aware raising initiatives exist, interesting insights have come out of interviews and desk research.
“Key to winning public confidence is public disclosure of all data about emissions and operations of each WtE plant. Publicly disclosing this information on a website, with an independent assessment on a monthly basis should be the first step for governments and WtE investors to demonstrate transparency and commitment towards public health.” (Plasco, 2012)
“It is important to get people to see that we are building a WtE plant, and not a simple incinerator. Changing the term usually changes people’s perception” (European WtE project developer)
78
UNEP’s Climate and Clean Air Coalition (CCAC) runs a MSW Knowledge network online designed to promote information and provide outreach resources to support cities and governments to reduce waste derived pollutants and raise awareness. It includes:
A Database Directory which contain a wealth of relevant information and resources on the themes of Waste Management; Sustainable Development and Climate Change.
A Document Library providing key publications sourced from a wide range of reputable sources focused on best practices for the management of MSW leading to the reduction of methane, black carbon and other air pollutants.
Webinars and online Training to support capacity building and improving MSW practices
The information from the CCAC’s Knowledge Network and other networks could prove to be a valuable resource for Indonesian government authorities as they seek to educate constituents about the risks posed by WtE solutions.
Recommendations for public awareness raising:
Consider integrating education about WtE in any national awareness raising campaign about waste management, highlighting the health and environmental improvements of newer technology, and the trade-offs that exist between different waste management options.
Involve the local public as the waste management plan is developed for each area, leading to greater buy-in and support
Use demonstration projects with strict performance standards to show the public that plants are not harmful to health and the environment
79
Other solutions Finally, demonstration projects and integration of waste pickers are seen as complementary to the potential solutions outlined above. Both solutions are looked into below.
Demonstration projects Demonstration projects are meant to leverage best practices and create a transformational effect on the uptake of technologies. Their purpose is essentially to build confidence among customers, governments and financiers that WtE technologies work and have considerable benefits, and they are also useful to benchmark the costs of different WtE technologies. Demonstrations integrate many of the solutions above since they have to overcome multiple barriers, and act as pioneer projects that other stakeholders can learn from and follow.
Governments usually play a role in funding demonstration projects to build confidence amongst stakeholders. This is essential since technologies that are new to a particular context are commonly perceived to be risky by private investors, who may require prohibitively high returns on their investment. Governments may provide grant funding; special tax treatment; targeted local capacity building and public awareness raising; small-scale trials if changes to the waste system are required; and require a close working relationship between local and national governments and among key government ministries. Demonstration projects may also help build public confidence in WtE plants by showing that they can be deployed without adverse health or environmental impacts.
Supporting demonstration projects can also be an effective way to create a robust evidence base for WtE technology costs. Government support can be offered for a selected number of bidders under the condition that bidders share their feasibility studies. This would support the government’s interest in better understanding the costs of WtE under multiple circumstances, and would help national government ministries and municipalities identify any financing gaps that need to be addressed to create a balanced revenue package for projects.
Three examples of governments funding WtE demonstration projects are described below. The three experiences are relatively new, and so have limited insights towards concrete results. Further below, however, other low carbon electricity demonstration programmes are more mature and offer insights into their actual impact.
UK Funding demonstration projects as a continued policy goal
The UK directed some finance to WtE projects in demonstration phases, from the Green Investment Bank, WRAP and the Energy Technologies Institute (ETI). The government considers demonstration and grant funding to be effective at delivering more reliable, more efficient and more cost effective advanced WtE technologies in future.
In 2013, the UK government part-funded the ETI’s £13M waste to gasification demonstration project, and continued funding is planned (DEFRA, 2014). ETI has held several tenders for WtE demonstration projects, including £2.8 million given out in grants for UK companies developing
80
WtE projects in 2013 including an industrial scale demonstration of an organic waste gasification and plasma arc gasification projects (ETI, 2013).
Canada Plasma arc gasification demonstration project
Plasco Energy runs a demonstration scale plasma arc gasification plant in Ottawa, Canada, that processes 75 tonnes of MSW per day into synthetic gas, inert solid material and heat (WorldFuels, 2014). The plant is one of the world’s first examples of a successful advanced thermal treatment plant running on MSW.
Costing a total of approximately USD 120 million, the plant was seed funded by a public sector body, Sustainable Development Technology Canada (SDTC), which provided USD 9 million, and attracted the remaining capital value from equity investors. The demonstration project has influenced the cities of Ottawa and Red Deer, in Alberta, to sign letters of intent to build two other similar plants with capacities of 400 tonnes/day and 200/tonnes day respectively.
USA WtE demonstration examples
In 2006 the USA’s Department of Energy (DOE) financed a WtE demonstration project that provided a solution to the agricultural straw waste of seed farmers. In collaboration with private initiatives, the DOE supported the testing of a dual-stage gasification system capable of processing 500 pounds per hour of grass straw to produce syngas, electricity and liquid fuels (DoE, 2006). The project was intended to influence other farmers to adopt similar methods, using available finance mechanisms. It is unclear whether the project was effective in disseminating the technology.
In 2013, the California Energy Commission approved USD 1.75 million in funding for a private initiative to demonstrate a biosolids to energy technology (Renewable Energy Focus, 2013). Biosolids are a by-product of waste water treatment plants which must transport them over long distances for land application or for disposal in landfills. The demonstration project provides a solution that avoids the haulage costs and provides benefits by tapping biosolids energy content.
Other than those focused on WtE, many demonstration initiatives exist to accelerate the deployment of low carbon technologies globally. Indonesia may draw important lessons from several countries to develop demonstration initiatives of its own. Below, one of the UK’s electricity sector innovation and demonstration models is outlined to serve as an example of a way to incentivise the private sector to develop demonstration projects with partial government support.
UK Incentivising utilities to lead low carbon energy demonstration projects
The UK’s Low Carbon Networks Fund (LCNF) is an innovation programme managed by the power sector regulator (Ofgem) focusing on the electricity distribution sector. It incentivises utilities to
81
develop and demonstrate innovative technologies that lower costs and emissions, and improve the reliability of the UK’s power system.
As opposed to receiving direct subsidies from the government, the LCNF uses a very different approach. The regulator offers utilities the opportunity to compete for revenues, which are originally collected through a levy on electricity bills. Utilities with the most effective proposals receive co-funding for their projects. It is therefore in the interest of utilities to develop projects as a means to gain governmental funding and improve their own networks.
In order to select those technologies that are likely to be most effective, a rigorous project selection process is carried out by an appointed panel of experts. Not all projects are approved, which forces those competing to ensure they are proposing the best technologies and solutions they can provide. The LCNF focuses on the demonstration of near-commercial technologies more than the development of new technologies, so that successful competitors and solutions can be pushed out into the market quickly and to a greater benefit to those involved.
Recommendations for demonstration projects:
Open tenders for government demonstration support for WtE demonstration projects in Indonesia, requiring open access to feasibility studies to overcome a number of the barriers faced by WtE stakeholders and address market and technology risks by:
- Developing an evidence base for project costs based on real feasibility studies to enable more effective debate about how costs can be reduced
- Giving investors confidence that projects can be developed and plants operated successfully in Indonesia, thus reducing perceived risk and financing costs
- Encouraging international technology and project developers to view Indonesia as a promising market
- Providing a reference point for local governments to inform their own plans to develop projects, and to develop their own WtE capabilities
- Showing local populations that WtE plants can be deployed in their area without adverse health or environmental impacts
- Providing the opportunity to develop standard contracting models and other processes using a real-life example.
Support the effective design and implementation of a demonstration project programme so that it includes:
- Transparent and open procurement of the best technology solution and transparent use of public funds
- Widespread stakeholder engagement to gain buy-in and support from the outset - Publication and dissemination of performance details (ideally independently
verified) – including waste throughput, energy output, and local emissions - Availability of the plant for visits from local government and other stakeholders
during construction and operation – to spread best practice and lessons
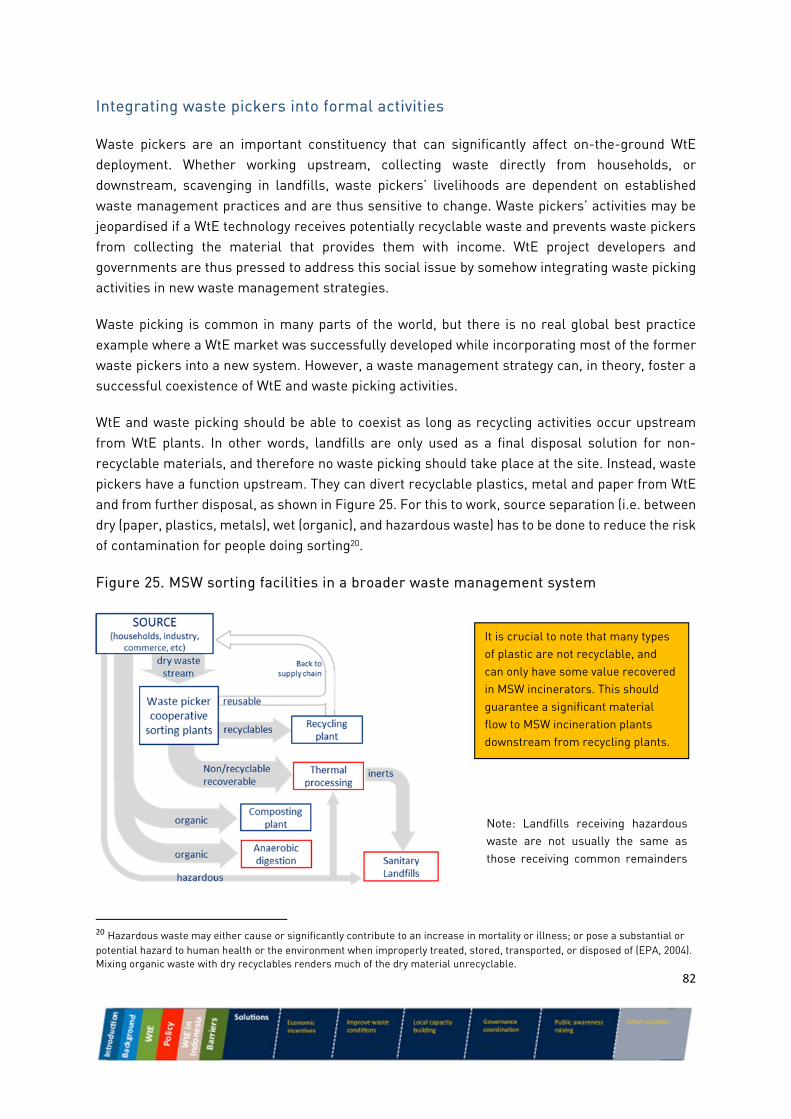
82
Integrating waste pickers into formal activities
Waste pickers are an important constituency that can significantly affect on-the-ground WtE deployment. Whether working upstream, collecting waste directly from households, or downstream, scavenging in landfills, waste pickers’ livelihoods are dependent on established waste management practices and are thus sensitive to change. Waste pickers’ activities may be jeopardised if a WtE technology receives potentially recyclable waste and prevents waste pickers from collecting the material that provides them with income. WtE project developers and governments are thus pressed to address this social issue by somehow integrating waste picking activities in new waste management strategies.
Waste picking is common in many parts of the world, but there is no real global best practice example where a WtE market was successfully developed while incorporating most of the former waste pickers into a new system. However, a waste management strategy can, in theory, foster a successful coexistence of WtE and waste picking activities.
WtE and waste picking should be able to coexist as long as recycling activities occur upstream from WtE plants. In other words, landfills are only used as a final disposal solution for non-recyclable materials, and therefore no waste picking should take place at the site. Instead, waste pickers have a function upstream. They can divert recyclable plastics, metal and paper from WtE and from further disposal, as shown in Figure 25. For this to work, source separation (i.e. between dry (paper, plastics, metals), wet (organic), and hazardous waste) has to be done to reduce the risk of contamination for people doing sorting20.
Figure 25. MSW sorting facilities in a broader waste management system
20 Hazardous waste may either cause or significantly contribute to an increase in mortality or illness; or pose a substantial or potential hazard to human health or the environment when improperly treated, stored, transported, or disposed of (EPA, 2004). Mixing organic waste with dry recyclables renders much of the dry material unrecyclable.
Note: Landfills receiving hazardous waste are not usually the same as those receiving common remainders
It is crucial to note that many types of plastic are not recyclable, and can only have some value recovered in MSW incinerators. This should guarantee a significant material flow to MSW incineration plants downstream from recycling plants.
83
Promoting this shift to formal employment is however a complex process that may result in negative side effects. Waste pickers that remain unemployed may engage in illegal landfilling activities as they strive to keep their usual livelihoods. As discussed above, illegal dumping represents a waste of recoverable material and energy resources (as well as an environmental cost) and should be discouraged wherever possible.
The example below outlines the Brazilian experience and its attempt to integrate waste pickers into a new, safer and more sanitary system.
BRAZIL The challenge of reintegrating waste pickers into formal jobs
Similar to what is seen in Indonesia, Brazil in its National Policy on Waste Management of 2010, required municipalities to close open dumpsites by 2014. About one million waste pickers were estimated to subsist from diverting recyclables in Brazil, whether upstream or in landfills, leading to a significant social challenge as landfills began closing down. The challenge is still far from resolved, but Brazil has managed to successfully improve its recycling rates upstream - close to the source of MSW - by helping waste pickers shift from informal and independent livelihoods to organised recycling cooperatives. This was achieved partially with public financial support and partially through the support of WtE project developers, namely LFG project consortiums. Crucially, the success of these actions depends on the separation of waste at its source, as outlined above.
Two public financing mechanisms are helping to shift Brazilian waste picking activities upstream, by financially assisting the establishment of recycling facilities. The first one existed before the implementation of the National Waste Policy - between 2007 and 2008 – and consisted of a credit line provided by Brazil’s National Development Bank (BNDES). During its lifetime, the mechanism supported 34 recycling cooperative projects by providing low cost finance for machinery, technical assistance and land. BNDES estimates that the credit line’s total disbursement of about USD 12 million created 2,300 formal jobs for formal landfill scavengers, generating a 45% average income increase for those individuals (BNDES, 2012).
The second financing mechanism was developed along with the National Waste Policy and features a more structured approach to encourage waste picking activities to move upstream. Launched in 2009, the Federal Government’s Cataforte Programme is divided into three phases and has cost approximately USD 86 million to date.
Phase one lasted for one year and aimed to teach existing waste picking groups how to build structured recycling cooperatives. For phase two, rolled out in 2010, the logistical capacity of these recycling cooperatives was strengthened. The federal government donated trucks to 35 organizations throughout the country and provided those with technical assistance helping them build their business plan. Recycling cooperatives were invited to bid for the support if they could demonstrate that they were:
84
legal organizations with adequate registration; open to receive new individuals at a reasonable cost; and free of sanitary risks, i.e., their waste source could not be a landfill and they had to follow
basic work safety and health parameters.
In its ongoing third phase, the programme seeks to aggregate multiple partners to make more financial resources available and enable the development of recycling cooperatives throughout the country. The federal government intends to see cooperatives working as allies of municipal governments, and therefore wants to see them being able sign formal contracts to provide recycling services over several years. Over its lifetime, Cataforte programme estimates that 250 enterprises were aided beyond the 35 cooperative organisations, adding to a total of 10,000 waste pickers supported (Portal Brasil, 2013).
Municipalities and WtE project developers in Brazil also played a role in supporting the central government’s goals as landfills closed down, but solutions were not always effective. Rio de Janeiro’s Gramacho landfill was one of the world's largest open-air landfills until late 2012, when it was closed for the construction of a large LFG project. Almost 2,300 waste pickers were known to informally scavenge on the site, posing a challenge to the LFG consortium that moved in. Attracting media and government attention the scavengers demanded financial compensation, capacity building and formal jobs, but an agreement was reached when the consortium offered to pay a ~USD 6,000 to each of the waste pickers who in turn agreed to leave the site. Many of the pickers were left with little other subsistence options or capacity to find new jobs, casting doubt over the effectiveness of this solution. The consortium was in fact limited in its capacity to employ people, as its facilities required less than 30 unskilled employees in its operations, meaning additional solutions were needed to provide jobs to most of the remaining individuals.
Two years after Gramacho’s closure, Rio de Janeiro’s municipal government still struggles to employ all the former 2,300 waste pickers. In 2013, the municipality opened a modern recycling centre. Costing about USD 2 million in public resources, the facility receives industrial waste with high rates of recyclability, which it sorts and re-sells to other industries. In its initial phase, the centre currently provides direct employment to 110 former waste pickers. Another 390 jobs are expected to be created as the facility increases its capacity up to 2015 (SEA, 2013). To fill the remaining employment gap, Rio’s municipality seeks to use the centre to provide complimentary solutions for the hundreds of unaddressed waste pickers through capacity building courses. These are offered free of charge to enable individuals to compete for formal jobs elsewhere.
Brazil’s example shows that investments from public and private initiatives can accelerate the integration of a large population of waste pickers, basically by building capacity and subsidizing their establishment as upstream recyclers – allowing them to acquire the necessary sorting and/or recycling equipment. Expenditures on the order of USD 100 million resulted in the integration of more than 10,000 waste pickers, out of the 1 million who were estimated to exist in
85
Brazil in 2010. This does not include independent initiatives happening in each of the country’s cities, which are pressed to provide alternatives for waste pickers as landfills close down. City initiatives are numerous and lack consolidated information. They are likely to add a few more million USD in investments and incorporate thousands of waste pickers.
Incorporating waste pickers remains a challenge in Brazil, as many former landfill scavengers remain unemployed. Local experts indicate that the vicinities of closed landfill sites have been plagued by illegal landfilling, urging authorities to enforce laws but also to provide employment alternatives to these individuals.
Recommendations to address waste pickers:
Recognise waste pickers as an important group that can either facilitate or disrupt on the ground implementation of WtE solutions. Capacity building and financial assistance are likely to be required.
Engage waste pickers in the development of upstream recycling solutions to ensure they are not disadvantaged and do not become obstructive. This will likely need to be done on a case by case basis as landfills close.
Look into and support Indonesia’s existing activities on upstream waste recycling, such as the World Bank’s initiative on waste banks.
Take into account the disadvantaged background from which landfill waste pickers come, and help them gravitate to formal jobs where they are an important part of a larger system.
86
9 References ADB. (2012). ADB, China Everbright to Help PRC Create Energy from Farm, Municipal Waste.
Retrieved online from: http://www.adb.org/news/adb-china-everbright-help-prc-create-energy-farm-municipal-waste
ADB. (2013). Chinese company to install 8 GW of waste-to-energy capacity. Retrieved online from: Biomass Magazine: http://biomassmagazine.com/articles/8377/chinese-company-to-install-8-gw-of-waste-to-energy-capacity
ADB. (2013b). Environment Safeguards. Retrieved online from: http://www.adb.org/site/safeguards/environment
ADB. (2013c). Loan Syndication. Retrieved online from: http://www.adb.org/site/private-sector-financing/commercial-cofinancing/loan-syndication
ADB, C. (2014). Clean Energy Financing Partnership Facility. Retrieved online from: http://www.adb.org/site/funds/funds/clean-energy-financing-partnership-facility
Agencia Brasil. (2013). Retrieved online from: http://agenciabrasil.ebc.com.br/noticia/2013-06-08/usina-vai-transformar-lixo-de-gramacho-em-energia-limpa
Aikan. (2012). Integrated Dry Anaerobic Digestion and Composting. Retrieved online from: http://www.aikantechnology.com/fileadmin/user_upload/file_pdf/ProdSheetAikan-03_INT-A4_IntegratedDryAD(Municipal).pdf
ALB. (May de 2010). New environmental law - better protection or more legal hurdles for industry. Retrieved online from: Asian Legal Business: http://asia.legalbusinessonline.com/industry-updates/indonesia-soemadipradja-taher/new-environmental-law-better-protection-or-more-legal-hurdles-for-industry/46199
Anaerobic Digestion. (2013). Retrieved online from: http://www.biogas-info.co.uk/index.php/ad-investment-checklist
Azahari, H. L. (2012). Retrieved online from: Indonesia’s Feed-in Tariff : http://energy-indonesia.com/03dge/Hasrul%20L.%20Azahari.pdf
Bhada Tata, P. (2007). Feasibility Analysis of Waste to Energy as a key Element in Solid Waste management in Mumbai, India. New York: Columbia University.
BNDES. (2012). Brazilian Development Bank. Retrieved online from: http://www.bndes.gov.br/SiteBNDES/bndes/bndes_pt/Institucional/Apoio_Financeiro/Programas_e_Fundos/Fundo_Social/catadores.html
87
California Integrated Waste Management Board (2008) Current Anaerobic Digestion Technologies Used for Treatment ofMunicipal Organic Solid Waste. Retrieved online from: http://www.calrecycle.ca.gov/publications/Documents/Organics%5C2008011.pdf
Catalyst. (2009). Energy from Waste Set to attract investment. Retrieved online from: http://www.catalystcf.co.uk/uploads/document_assets/e879ac60e881c5051aa0f97ff8aee9ba.pdf
CEPA. (2008). Current Anaerobic Digestion Technologies Used for Treatment of Municipal Solid Waste. California Integrated Waste Management Board. Retrieved online from: http://www.calrecycle.ca.gov/Publications/Documents/Organics%5C2008011.pdf
CERDT. (2008). Center of Energy Resource Development Technology. Retrieved online from: Agricultural and Wood Waste Potentials and Utilization in Indonesia: http://www.biomass-asia-workshop.jp/biomassws/04workshop/presentation_files/28_Priyant.pdf
Chaerul, M., Tanaka, M., & Shekdar, A. V. (2007). MUNICIPAL SOLID WASTE MANAGEMENT IN INDONESIA. Journal of the Faculty of Environmental Science and Technology, 41-49.
Clean World Capital. (2012). Retrieved online from: http://www.cleanworldcapital.com/news/161-waste-to-energy-in-india-understanding-interaction-between-technology-and-local-waste-characteristics-a-must-in-order-to-realise-full-potential.html
Covanta. (2013). Covanta Dade Renewable Energy. Retrieved online from: http://www.covantaenergy.com/facilities/facility-by-location/miami-dade.aspx
Cresswell, D. (2007). Municipal Waste Incinerator Ash in manufactured Aggregate.
Dadan. (2013). Policies and strategies for the development of Waste to Energy.
de Baere, L., & Matheeuws, B. (2012). Anaerobic Digestion of the Organic Fraction of Municipal Solid Waste in Europe - Status, Experience and Prospects. Retrieved online from: http://www.ows.be/wp-content/uploads/2013/02/Anaerobic-digestion-of-the-organic-fraction-of-MSW-in-Europe.pdf
de Keizer, M. (2012). Rising from the Ashes. Retrieved online from: http://www.waste-management-world.com/articles/print/volume-10/issue-6/features/rising-from-the-ashes.html
DECC. (2011). GHG Inventory summary Factsheet. Retrieved online from: https://www.gov.uk/government/uploads/system/uploads/attachment_data/file/48421/1226-ghg-inventory-summary-factsheet-waste.pdf
DECC. (2013). Digest of United Kingdom Energy Statistics 2013. London.
88
DEFRA. (2013b). Retrieved online from: https://www.gov.uk/government/uploads/system/uploads/attachment_data/file/221036/pb13889-incineration-municipal-waste.pdf
DEFRA. (2013b). Advanced Thermal Treatment of Municipal Solid Waste. Retrieved online from: https://www.gov.uk/government/uploads/system/uploads/attachment_data/file/221035/pb13888-thermal-treatment-waste.pdf
DEFRA and DECC. (2013). Retrieved online from: Generating energy from waste, including anaerobic digestion: https://www.gov.uk/generating-energy-from-waste-including-anaerobic-digestion
EC (2006) (European Commission) Integrated Pollution Prevention and Control. Reference Document on the Best Available Techniques for Waste Incineration.
EC. (2014). European Commission. Retrieved online from: Infringement Cases: http://ec.europa.eu/environment/legal/law/press_en.htm
EC. (2014). European Waste Classification for Statistics, version 3. Retrieved online from: http://ec.europa.eu/eurostat/ramon/other_documents/ewc_stat_3/index.cfm?TargetUrl=DSP_EWC_STAT_3
Ellyin, C. (2012). SMALL SCALE WASTE-TO-ENERGY TECHNOLOGIES. Retrieved online from: http://www.seas.columbia.edu/earth/wtert/sofos/Ellyin_Thesis.pdf
End, D. J. (2013). Project PLTSa Bantargebang Claimed the World's Largest. Retrieved online from: Okezone Economy: http://economy.okezone.com/read/2013/03/01/19/769695/proyek-pltsa-bantargebang-diklaim-terbesar-di-dunia
energytransition.de. (2012). Germany Energy Transition. Retrieved online from: http://energytransition.de/wp-content/themes/boell/pdf/en/GET_Graphics_en_Technology-as-key-issue.pdf
Entrust. (2014). Retrieved online from: http://www.entrust.org.uk/
EPA. (2004). Hazardous and Non-Hazardous Solid Waste Requirements for Construction Projects. Retrieved online from: http://www.epa.gov/compliance/resources/publications/assistance/sectors/constructmyer/myer1c_solidwaste.pdf
EPA. (2010). US Environmental Protection Agency. Retrieved online from: Landfill Gas Modelling: Estimation of Landfill Gas Decay Rate Constants and Yields for Individual Waste Components: http://www.epa.gov/lmop/documents/pdfs/conf/13th/barlaz.pdf
EPA. (2013a). Retrieved online from: http://www.epa.gov/waste/nonhaz/municipal/wte/basic.htm
89
EPA. (2013b). Retrieved online from: http://www.epa.gov/lmop/documents/pdfs/overview.pdf
EURACTIV. (2014). EU ponders 2017 deadline for green energy funding rules. Retrieved online from: http://www.euractiv.com/energy/eu-ponders-2017-deadline-green-e-news-534309
Equinox Overseas Investments (2014) Renewable Green Energy. Retrieved online at: http://eqnxcorp.com/expertise.htm
FEC. (2003). Retrieved online from: http://www.scotland.gov.uk/Resource/Doc/1057/0002224.pdf
Frost & Sullivan. (2012). Retrieved online from: 2012 Indonesia Power Sector Outlook: http://www.slideshare.net/FrostandSullivan/indonesia-2012-indonesia-power-sector-outlook
GAIA. (2008). No Incinerators in Indonesia. Retrieved online from: http://www.no-burn.org/article.php?id=373
GMI. (2012). International Best Practices Guide for LFGE Projects – 2012. Retrieved online from: https://www.globalmethane.org/documents/toolsres_lfg_ibpgch4.pdf
Hicks, M., & Rawlinson, S. (2010). Cost model for energy from waste. Retrieved online from: Building: http://www.building.co.uk/cost-model-energy-from-waste/3162156.article
Hitachi Zosen. (2012). STUDY ON THE INTEGRATED WASTE TO ENERGY PROJECT IN GREATER MALANG, THE REPUBLIC OF INDONESIA.
Hoornweg, D., & Bhada-Tata, P. (2012). What a Waste. A Global Review of Solid Waste Management. Washington: The World Bank.
HPA. (2009). UK's Health Protection Agency. Retrieved online from: The Impact on Health of Emissions to Air from Municipal Waste Incinerators: http://www.hpa.org.uk/webc/hpawebfile/hpaweb_c/1251473372218
Hutapea, M. (2011). Retrieved online from: HOW TO TAP THE WASTE TO ENERGY POTENTIAL IN THE INDONESIAN AGRO INDUSTRY: http://indonesien.ahk.de/fileadmin/ahk_indonesien/PAST_EVENTS/RENERGY2011/TUESDAY/1-Ibu_Maritje.pdf
IEA. (2012). Energy Balances from Non-OECD Countries. IEA/OECD. Paris
IISD. (2013). Investment Incentives in Indonesia. Retrieved online from: http://www.iisd.org/tkn/pdf/investment_incentives_indonesia.pdf
IndII. (2011). Indonesia Infrastructure Initiative. Retrieved online from: SCOPING STUDY FOR SOLID WASTE MANAGEMENT IN INDONESIA: http://www.indii.co.id/upload_file/201207310822150.Scoping%20Study%20for%20Solid%20Waste%20Management%20in%20Indonesia.pdf
90
IRENA. (2013). Retrieved online from: Renewable Energy Country Profiles. Asia: http://www.irena.org/DocumentDownloads/Publications/_AsiaComplete.pdf
IRENA. (2013b). Waste to Energy for More Effective Landfill Site Management. City in focus: Belo Horizonte.
Jacobs and Babtie. (2006). Waste Development Framework. Assessment of the Economies of Scale associated with the provision of waste treatment facilities. Reading. Retrieved online from: https://shareweb.kent.gov.uk/Documents/environment-and-planning/recycling-and-rubbish/spatial-options-consultation/assessment-of-economies-associated-with-waste-treament.pdf?Mobile=1&Source=%2F_layouts%2Fmobile%2Fview.aspx%3FList%3D3c0fe70d-81b9-4935-bc54
Jakarta Post. (22 de May de 2013). Winding road of Jakarta. Retrieved online from: Jakarta Post: http://www.thejakartapost.com/news/2013/05/22/winding-road-jakarta-waste-management.html
Lardinois, I., & Christine, F. (1999). Source separation of household waste materials: Analysis of case studies from Pakistan, the Philippines, India, Brazil, Argentina and the Netherlands. York.
Lei, Y., Zhen-Shan, L., & Hui-Zhen, F. (2011). Model of Municipal Solid Waste Source Separation Activity:. Journal of the Air & Waste Management. Retrieved online from: http://www.tandfonline.com/doi/pdf/10.3155/1047-3289.61.2.157
Manders, J. (2013). Integrated waste management of MSW across Europe. Retrieved online from: http://elfm.eu/Uploads/ELFM/FILE_cda3ca83-aea6-432b-bc5a-f2b3782c982d.pdf
Martin, C. (2009). renewable energy development. Retrieved online from: http://www.seas.columbia.edu/earth/wtert/sofos/cdn_martin.pdf
Meidiana, C., & Gamse, T. (2010). Development of Waste Management Practices in Indonesia. European Journal of Scientific Research , Vol.40 No.2 (2010), pp.199-210. Retrieved online from: http://storage.globalcitizen.net/data/topic/knowledge/uploads/20130220223550879532_ejsr_40_2_04.pdf
MEWR. (2012). Public tender no. 16/12 for Submission of Proposals for a Pilot and Demonstration Project . Retrieved online from: http://energy.gov.il/English/PublicInfo/Tenders/Documents/tender_16_12_English.pdf
Ministry of the Environment. (2010). Indonesia Second National Communication under the UNFCCC. Retrieved online from: http://unfccc.int/files/national_reports/non-annex_i_natcom/submitted_natcom/application/pdf/indonesia_snc.pdf
Ministry of Urban Development. (2000). Retrieved online from: Manual on Solid Waste Management(CPHEEO): http://moud.gov.in/swm_manual
91
Munawar, E. (2011). INJURY TIME FOR INDONESIAN LANDFILLS. Retrieved online from: Waste Management World: http://www.waste-management-world.com/articles/print/volume-14/issue-2/features/injury-time-for-indonesian-landfills.html
National University of Singapore and the National Research Foundation. (2013) Biomass (Solid Waste/Sludge) Gasification. Retrieved online from: http://cheed.nus.edu.sg/stf/chewch/NEW/biomass_gasification.htmNLWA. (2014). North London waste and energy procurement advances to final tenders. Retrieved online from: North London Waste Authority: http://www.nlwa.gov.uk/news/2012/2012/02/13/north-london-waste-and-energy-procurement-advances-to-final-tenders
NETL (2014) Types of Gasifiers - Gasifiers for special applications. Retrieved online from: http://www.netl.doe.gov/research/coal/energy-systems/gasification/gasifipedia/westinghouse
Norton Rose. (2013). Retrieved online from: http://www.nortonrosefulbright.com/files/ten-things-to-know-indonesia-power-projects-74165.pdf
ONS. (2011). Office for National Statistics. Retrieved online from: http://www.ons.gov.uk/ons/rel/npp/national-population-projections/2010-based-projections/stb-2010-based-npp-principal-and-key-variants.html
PCME. (2014). Retrieved online from: http://www.pcme.com/applications/incineration
Portal Brasil. (2013). Portal Brasil. Retrieved online from: Brasil vai investir R$ 200 milhões em reciclagem: http://www.brasil.gov.br/economia-e-emprego/2013/07/brasil-investe-em-empreendimentos-de-catadores-de-materiais-reciclaveis
Qiu, L. (2012). ANALYSIS OF THE ECONOMICS OF WASTE-TO-ENERGY PLANTS IN CHINA . Columbia University . Retrieved online from: http://www.seas.columbia.edu/earth/wtert/sofos/Qiu_thesis.pdf
Reddy, J. (2011). Municipal Solid Waste Management: Processing - Energy Recovery - Global Examples. BS Publications.
REN21. (2014). Retrieved online from: RENEWABLES INTERACTIVE MAP COUNTRY PROFILE: Indonesia: http://www.map.ren21.net/PDF/ProfilePDF.aspx?idcountry=64
Reuters. (2012). Italy faces huge fines over illegal landfills. Retrieved online from: http://www.reuters.com/article/2012/10/24/us-eu-italy-waste-idUSBRE89N0JX20121024
Reynolds, P. (2011). Study finds potential to treble electricity generation from EfW. Retrieved online from: http://www.mrw.co.uk/news/study-finds-potential-to-treble-electricity-generation-from-efw/8616085.article
92
SEDA. (2013). Sustainable Energy Development Authority of Malaysia. Retrieved online from: http://seda.gov.my/?omaneg=00010100000001010101000100001000000000000000000000&s=563
SEA. (2013). Polo de Reciclagem Gramacho. Retrieved online from: atadores de antigo lixão em Caxias começam nova fase profissional, trabalhando em projeto pioneiro com o auxílio de moderno maquinário: http://www.rj.gov.br/web/sea/exibeconteudo?article-id=1055432
Sidik, U. S. (2012). Global Methane. Retrieved online from: LANDFILL GAS IN INDONESIA: CHALLENGES AND OPPORTUNITIES: https://www.globalmethane.org/documents/events_land_120702_msw_indonesia.pdf
Tai, J., Zhang, W., Che, Y., & Feng, D. (2011). Municipal solid waste source-separated collection in China: A comparative analysis. Retrieved online from: http://www.ncbi.nlm.nih.gov/pubmed/21504843
Tanskanen, J.-H. (2000). Strategic planning of municipal solid waste management. Resource Conservation and Recycling, 111-133.
TCF. (2014). EU-Indonesia Trade Cooperation Facility. Retrieved online from: http://www.euind-tcf.com/energy/
Tsukahara, M. (2012). Presentation of Presentation of Japanese technology of waste to energy. Retrieved online from: http://www.mofa.go.jp/region/latin/fealac/pdfs/4-9_jase.pdf
UNCRD. (2010). Implementation of 3R in Indonesia. Retrieved online from: http://www.uncrd.or.jp/env/3r_02/presentations/BG2/RT2_03_Indonesia.pdf
UNEP. (2013). Newsletter and Technical Publications. Municipal Solid Waste Management. Retrieved online from: http://www.unep.or.jp/ietc/estdir/pub/msw/ro/Asia/Topic_d.asp
UNFCCC. (2009). National Economic, Environment and Development Study (NEEDS) for Climate Change. Jakarta. Retrieved online from: https://unfccc.int/files/adaptation/application/pdf/indonesianeeds.pdf
UNFCCC. (2010a). Emission Summary for China. Retrieved online from: http://unfccc.int/files/ghg_data/ghg_data_unfccc/ghg_profiles/application/pdf/chn_ghg_profile.pdf
UNFCCC. (2010b). Emission Summary for Vietnam. Retrieved online from: http://unfccc.int/files/ghg_data/ghg_data_unfccc/ghg_profiles/application/pdf/chn_ghg_profile.pdf
USAID. (2006). Comparative Assessment: Community based solid waste management (CBSWM), Medan, Bandung, Subang and Surabaya. Retrieved online from: USAID (United State Agency for International Development).
Wikimedia Commons, (2014) Retrieved online from: http://commons.wikimedia.org/wiki/File:Landfill_gas_collection_system.JPG
93
Witoelar, R. (2009). Indonesia's Communications for the Copenhagen Accord. Retrieved online from: Indonesia's confirmation: http://unfccc.int/files/meetings/cop_15/copenhagen_accord/application/pdf/indonesiacphaccord.pdf
WMW. (2012). 78 MW WASTE TO ENERGY INCINERATION PLANT UNDER WAY IN FINLAND. Retrieved online from: http://www.waste-management-world.com/articles/2012/07/78-mw-waste-to-energy-incineration-plant-under-way-in-finland.html
WMW. (2013). ANAEROBIC DIGESTION PLANT HEAT USED TO DRY TOBACCO IN ITALY. Retrieved online from: http://www.waste-management-world.com/articles/2013/09/anaerobic-digestion-plant-heat-used-to-dry-tobacco-in-italy.html
World Bank. (1999). Municipal Solid Waste Incineration. Retrieved online from: http://www.worldbank.org/urban/solid_wm/erm/CWG%20folder/Waste%20Incineration.pdf
World Bank. (2010). Retrieved online from: World Bank Experience in Landfill Gas and Prospects for Indonesia: http://siteresources.worldbank.org/INTINDONESIA/Resources/226271-1125376763288/1607524-1125376945368/1607526-1126756835610/balipresent-john_II.ppt
World Bank. (2013a). Statistics. Retrieved online from: http://data.worldbank.org/country/indonesia
World Bank. (2013b). Retrieved online from: http://data.worldbank.org/indicator/EG.ELC.ACCS.ZS
World Bank. (2014). Access to electricity (% of population). Retrieved online from: http://data.worldbank.org/indicator/EG.ELC.ACCS.ZS
WorldFuels. (2014). Canadian Agency Praises Plasco’s Ottawa WTE Demonstration Plant. Retrieved online from: http://www.worldfuels.com/wfExtract/exports/Content/82001070-d225-4ee2-94cf-6ee6aafda5a0.html
WSP. (2013). Review of State of the Art Waste to Energy Technologies. Retrieved online from: http://www.wtert.com.br/home2010/arquivo/noticias_eventos/WSP%20Waste%20to%20Energy%20Technical%20Report%20Stage%20Two.pdf
WTERT (2014). Anaerobic Digestion Systems. Retrieved online from: http://www.wtert.eu/default.asp?Menue=13&ShowDok=17
WTO. (2013). World trade Organization. TRADE POLICY REVIEW. Retrieved online from: http://www.wto.org/english/tratop_e/tpr_e/g278_e.pdf
Zhang W; Che Y; Yang K; Ren X; Tai J. (2012). Public opinion about the source separation of municipal solid waste in Shanghai, China. Waste Management and Resource. Retrieved online from; http://wmr.sagepub.com/content/30/12/1261.abstract
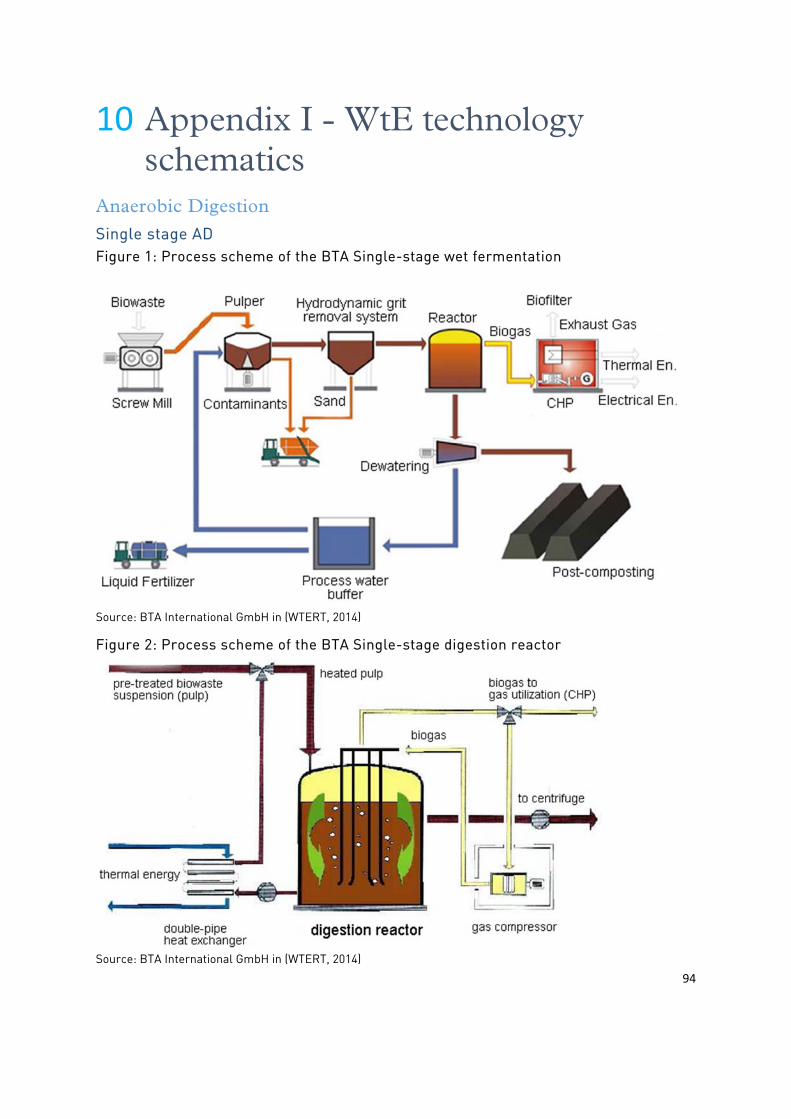
94
10 Appendix I - WtE technology schematics
Anaerobic Digestion
Single stage AD Figure 1: Process scheme of the BTA Single-stage wet fermentation
Source: BTA International GmbH in (WTERT, 2014)
Figure 2: Process scheme of the BTA Single-stage digestion reactor
Source: BTA International GmbH in (WTERT, 2014)
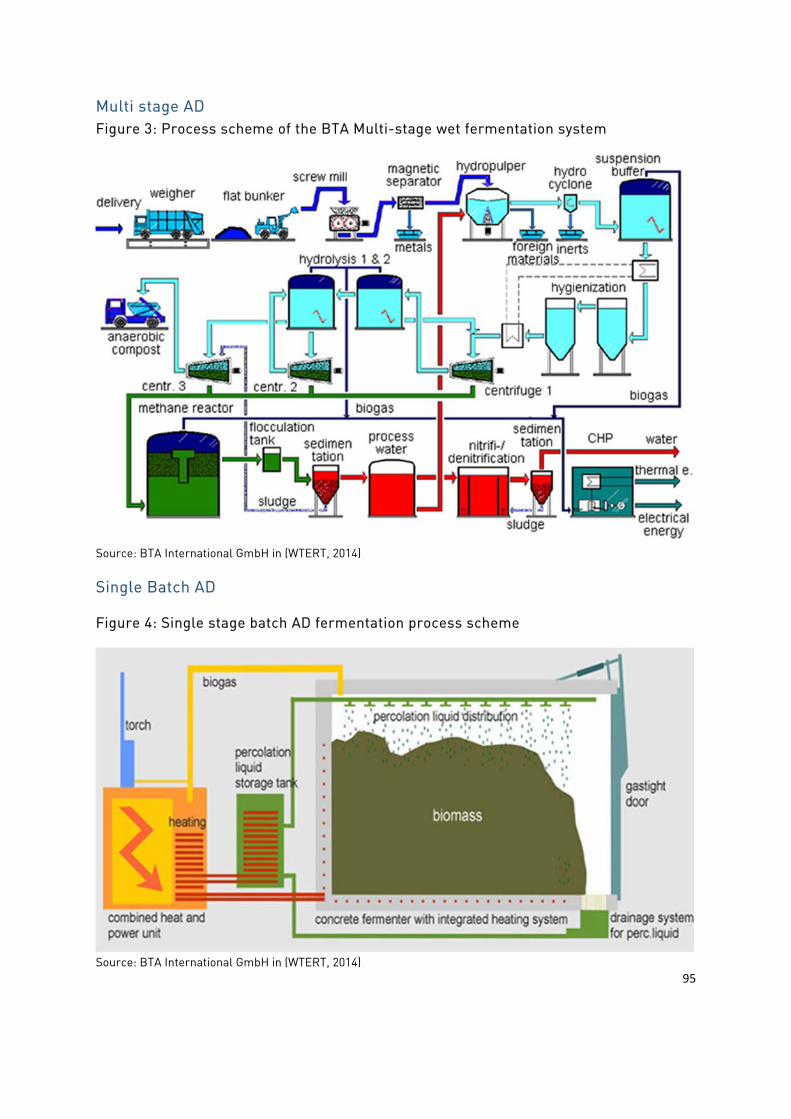
95
Multi stage AD Figure 3: Process scheme of the BTA Multi-stage wet fermentation system
Source: BTA International GmbH in (WTERT, 2014)
Single Batch AD
Figure 4: Single stage batch AD fermentation process scheme
Source: BTA International GmbH in (WTERT, 2014)
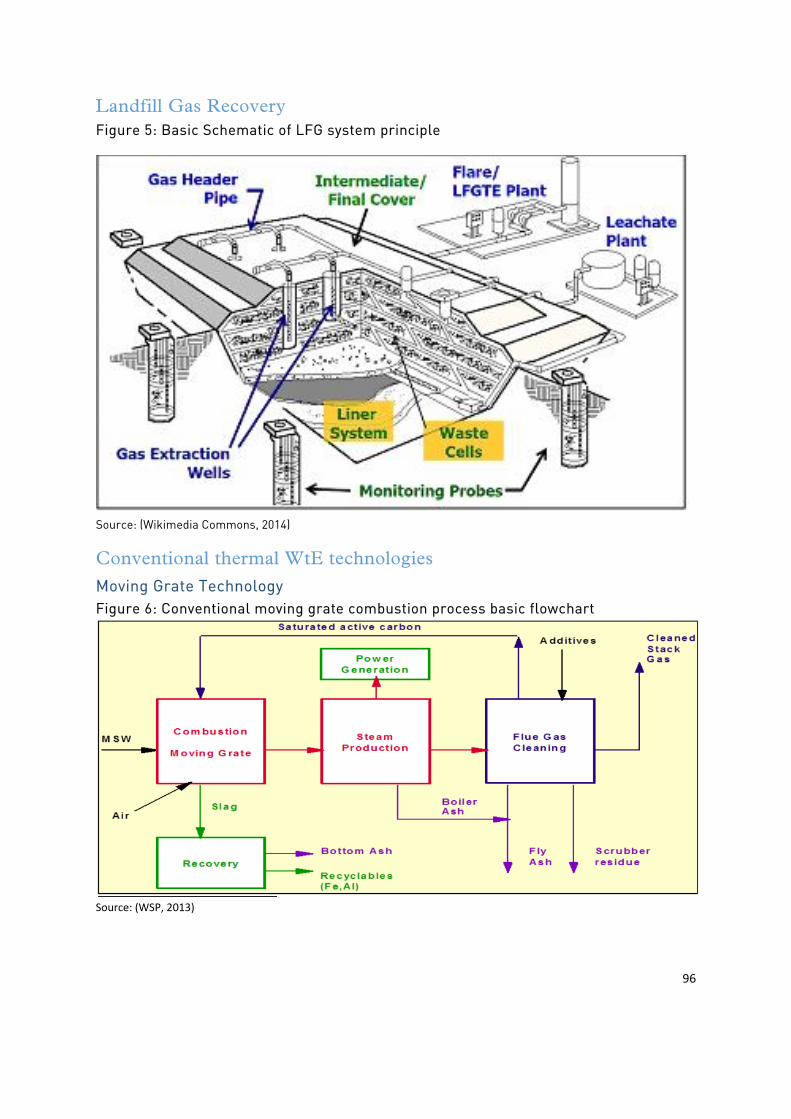
96
Landfill Gas Recovery Figure 5: Basic Schematic of LFG system principle
Source: (Wikimedia Commons, 2014)
Conventional thermal WtE technologies
Moving Grate Technology Figure 6: Conventional moving grate combustion process basic flowchart
Source: (WSP, 2013)
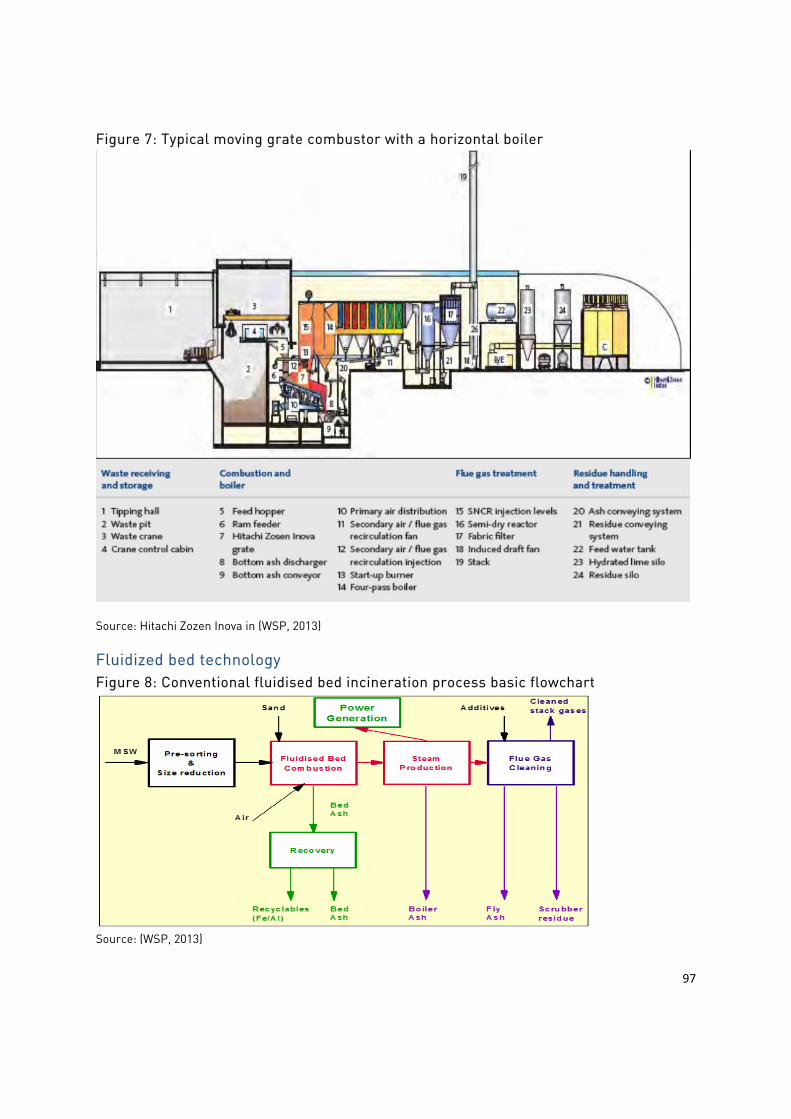
97
Figure 7: Typical moving grate combustor with a horizontal boiler
Source: Hitachi Zozen Inova in (WSP, 2013)
Fluidized bed technology Figure 8: Conventional fluidised bed incineration process basic flowchart
Source: (WSP, 2013)
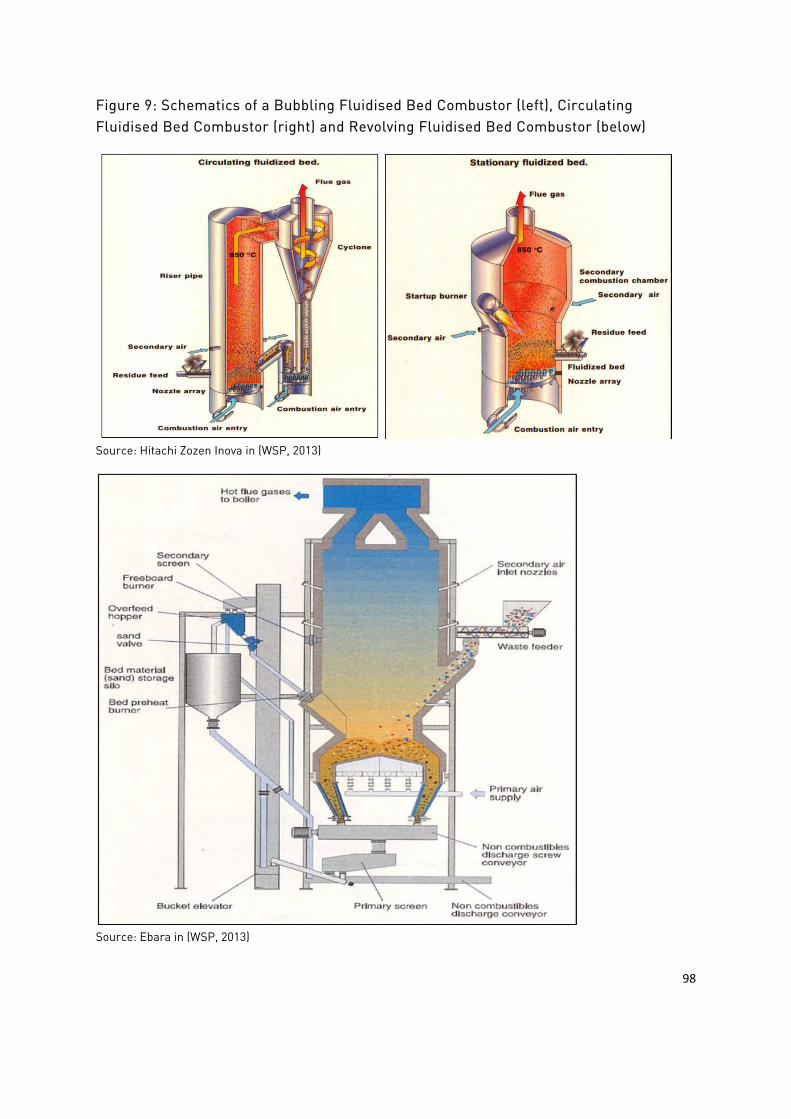
98
Figure 9: Schematics of a Bubbling Fluidised Bed Combustor (left), Circulating Fluidised Bed Combustor (right) and Revolving Fluidised Bed Combustor (below)
Source: Hitachi Zozen Inova in (WSP, 2013)
Source: Ebara in (WSP, 2013)
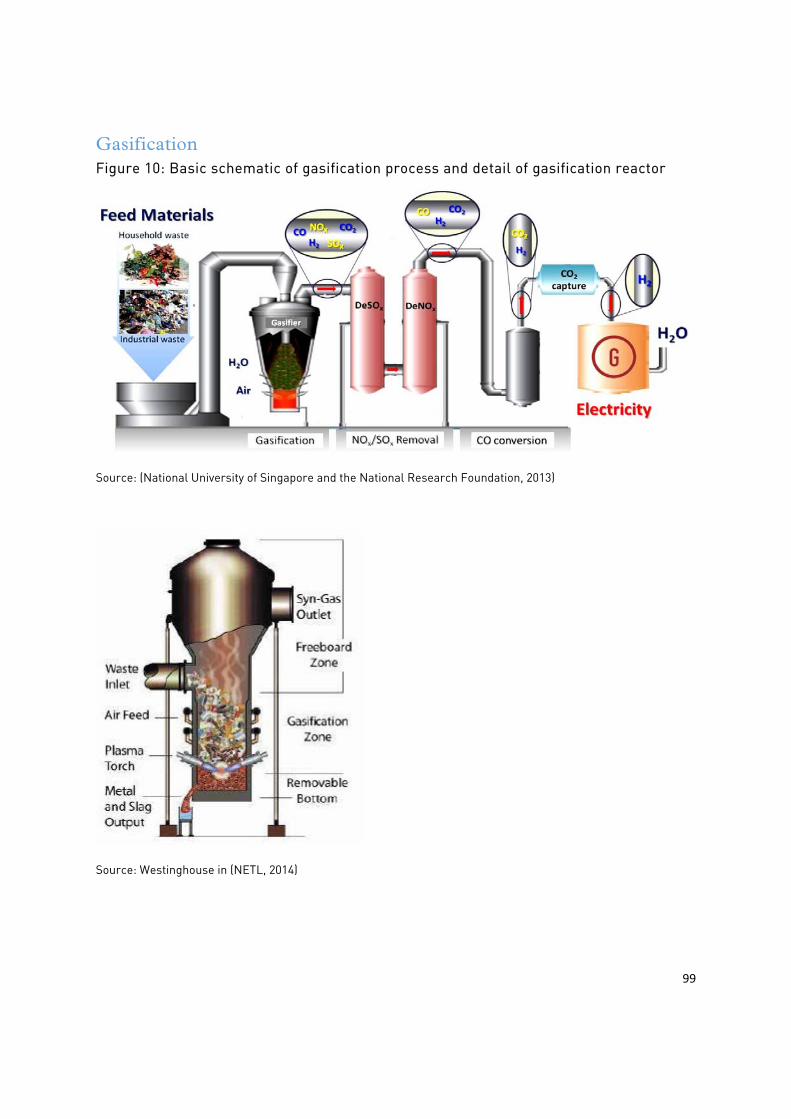
99
Gasification Figure 10: Basic schematic of gasification process and detail of gasification reactor
Source: (National University of Singapore and the National Research Foundation, 2013)
Source: Westinghouse in (NETL, 2014)
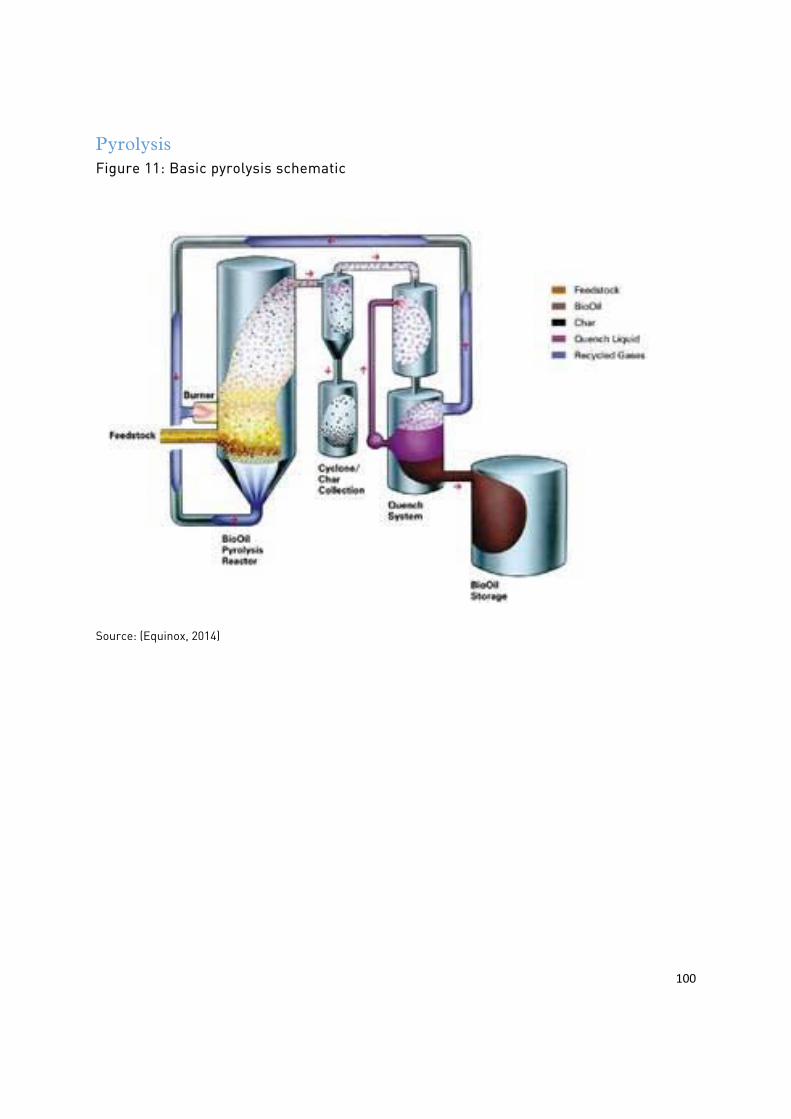
100
Pyrolysis Figure 11: Basic pyrolysis schematic
Source: (Equinox, 2014)
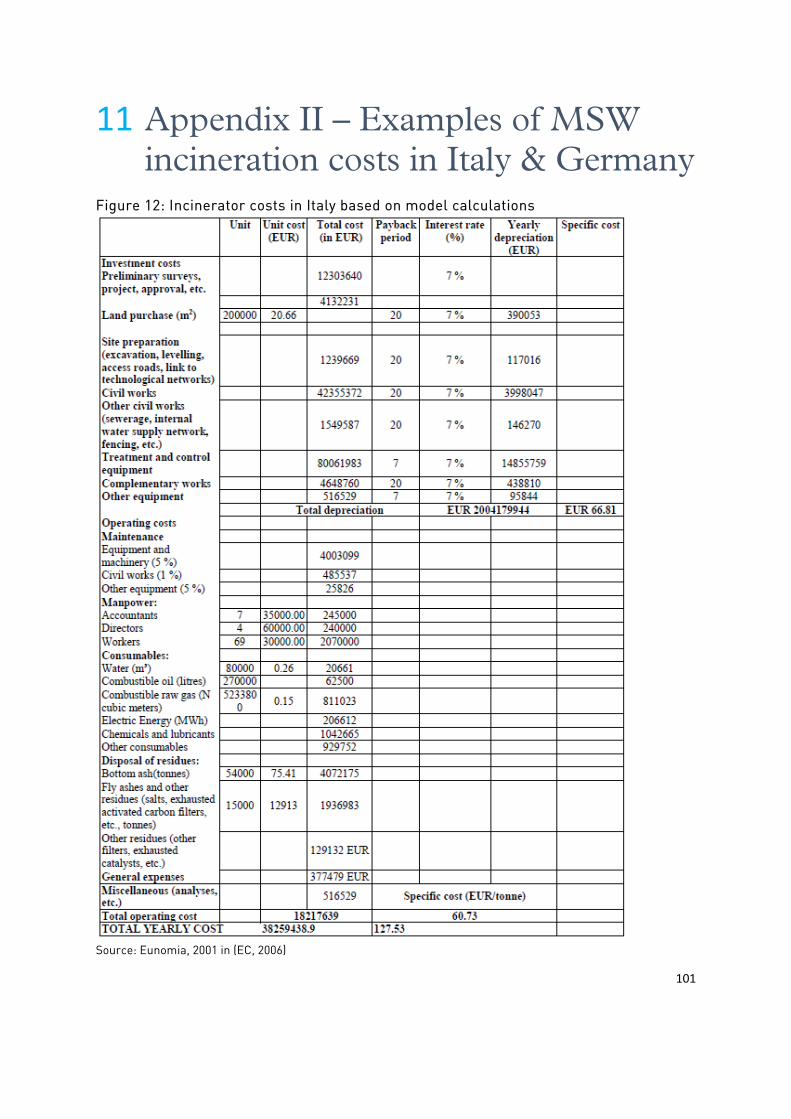
101
11 Appendix II – Examples of MSW incineration costs in Italy & Germany
Figure 12: Incinerator costs in Italy based on model calculations
Source: Eunomia, 2001 in (EC, 2006)
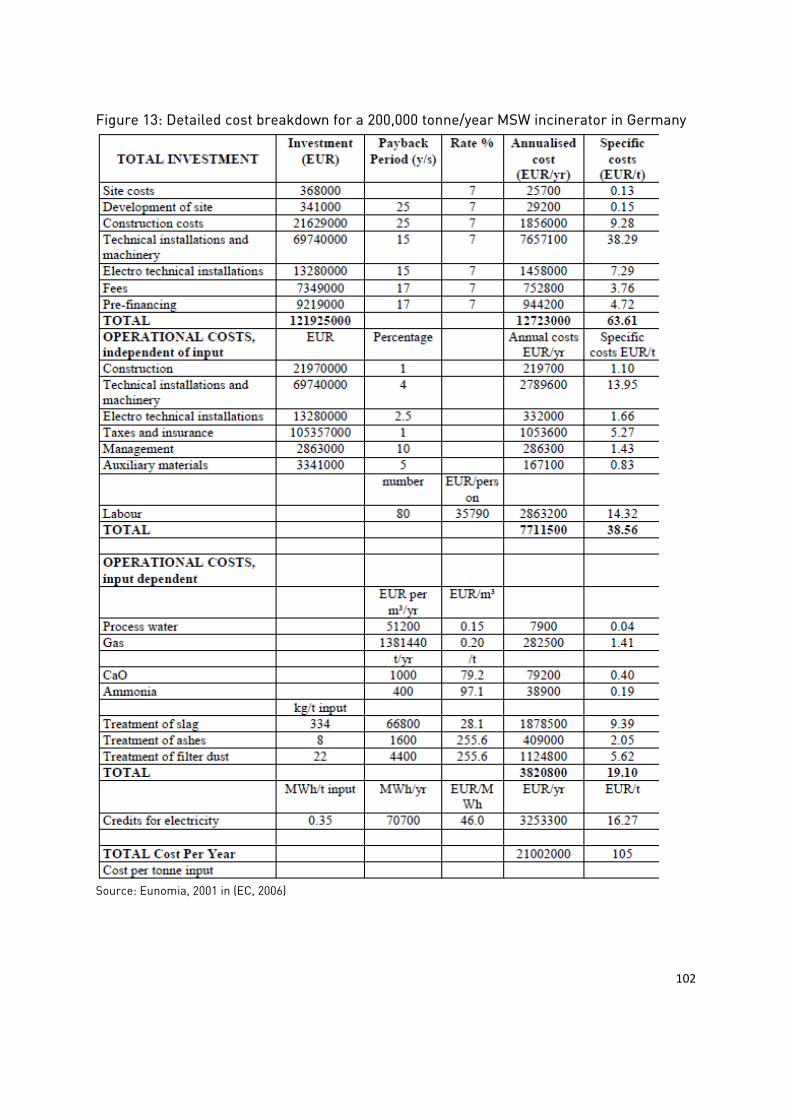
102
Figure 13: Detailed cost breakdown for a 200,000 tonne/year MSW incinerator in Germany
Source: Eunomia, 2001 in (EC, 2006)
The Carbon Trust is a world-leading not-for-profit group helping businesses, governments and the public sector to accelerate the move to a low-carbon economy through carbon reduction, energy-saving strategies and commercialising low-carbon technologies. We offer a range of tailored services, designed to meet the needs of businesses, governments and the public sector. By stimulating low-carbon action we contribute to green goals, including the lowering of carbon emissions, the development of low-carbon businesses, increased energy security and job creation.
We advise businesses, governments and the public sector on their opportunities in a sustainable low-carbon world
We measure and certify the environmental footprint of organisations, supply chains and products
We develop and deploy low-carbon technologies and solutions, from energy efficiency to renewable power
www.carbontrust.com
+44 (0)20 7170 7000
CTC831
Whilst reasonable steps have been taken to ensure that the information contained within this publication is correct, the authors, the Carbon Trust, its agents, contractors and sub-contractors give no warranty and make no representation as to its accuracy and accept no liability for any errors or omissions. Any trademarks, service marks or logos used in this publication, and copyright in it, are the property of the Carbon Trust. Nothing in this publication shall be construed as granting any licence or right to use or reproduce any of the trademarks, service marks, logos, copyright or any proprietary information in any way without the Carbon Trust’s prior written permission. The Carbon Trust enforces infringements of its intellectual property rights to the full extent permitted by law.
The Carbon Trust is a company limited by guarantee and registered in England and Wales under Company number 4190230 with its Registered Office at: 4th Floor, Dorset House, 27-45 Stamford Street, London SE1 9NT
Published in the UK: June, 2014
© The Carbon Trust 2014. All rights reserved.


![WASTE-TO-ENERGY IN INDONESIA · 2020. 8. 5. · [3] PLTSa: Waste-to-Energy Plant Needs a strong coordination between local authorities, developers & other institutions 5 1 Requires](https://img.pdfslide.us/doc/110x75/60c2d949a9e75708845d5122/waste-to-energy-in-indonesia-2020-8-5-3-pltsa-waste-to-energy-plant-needs.jpg)