Embed Size (px)
Citation preview

Overview of the Waste-to-Energy Potential for Grid-connected Electricity Generation (Solid Biomass and Biogas) in Indonesia
Promotion of Least Cost Renewables in Indonesia(LCORE-Indo)
Compiled by: Lisa Conrad
Ikke Prasetyaning
March 2014
Implemented by:

i
TABLE OF CONTENTS
List of Figure .................................................................................................................................................. ii
List of Table .................................................................................................................................................. iii
List of Abbreviations .................................................................................................................................... iv
Executive summary ....................................................................................................................................... 1
Chapter I: introduction ................................................................................................................................. 2
1.1. Background ....................................................................................................................................... 2
1.2. Objective ........................................................................................................................................... 2
1.3. Methodology ..................................................................................................................................... 3
Chapter II: Biomass Resource Potential ........................................................................................................ 4
Chapter III: Theoretical Potential .................................................................................................................. 5
3.1. Palm Oil Industry ............................................................................................................................... 5
3.2. Rice Paddy Industry ........................................................................................................................... 6
3.3. Sugar Industry ................................................................................................................................... 6
3.4 Other Industries ................................................................................................................................ 7
3.4.1 Rubber Residue ............................................................................................................................. 7
3.4.2 Cassava .......................................................................................................................................... 7
3.4.3 Corn Residue ................................................................................................................................. 8
3.5 Overview of the theoretical biomass potential ................................................................................ 9
Chapter IV: Biomass/biogas to electricity technologies and their application in Indonesia ...................... 10
4.1 Biomass co-firing ............................................................................................................................. 10
4.2 Biomass Combined Heat and Power (CHP) ..................................................................................... 10
4.3 Biomass Gasification ....................................................................................................................... 11
4.4 Biogas an-aerobic digestion ............................................................................................................ 11
Chapter V: Technical potential and CO2 reduction potential ..................................................................... 12
5.1 Palm oil industry ............................................................................................................................. 13
5.1.1 EFB: fuel for medium pressure steam turbine – CHP Technology .............................................. 14
5.1.2 Shell and Fiber used in optimized high pressure steam turbine ................................................ 14
5.1.3 Biogas power plant using POME ................................................................................................. 15
5.1.4 Overall technical potential Palm Oil Industry ............................................................................. 16
5.2 Rice Industry ................................................................................................................................... 16
ii
5.3 Sugar Industry ................................................................................................................................. 17
5.4 Overview of the technical biomass potential ................................................................................. 19
Chapter VI: Overview of Biomass Potential and Emission Reduction Potential ......................................... 20
Chapter VII: Economic Potential ................................................................................................................. 21
7.1 Rice Industry ................................................................................................................................... 21
7.2 Palm Oil Industry ............................................................................................................................. 22
Bibliography ................................................................................................................................................ 24
Annex .......................................................................................................................................................... 27
Annex A: Mass Balance of Palm Oil Extracts and Residues ........................................................................ 27
Annex B: Indonesia sugar cane production in the past five years .............................................................. 27
Annex C: Biomass conversion paths ........................................................................................................... 28
Annex D: Map of Palm Oil Mills in Indonesia .............................................................................................. 28
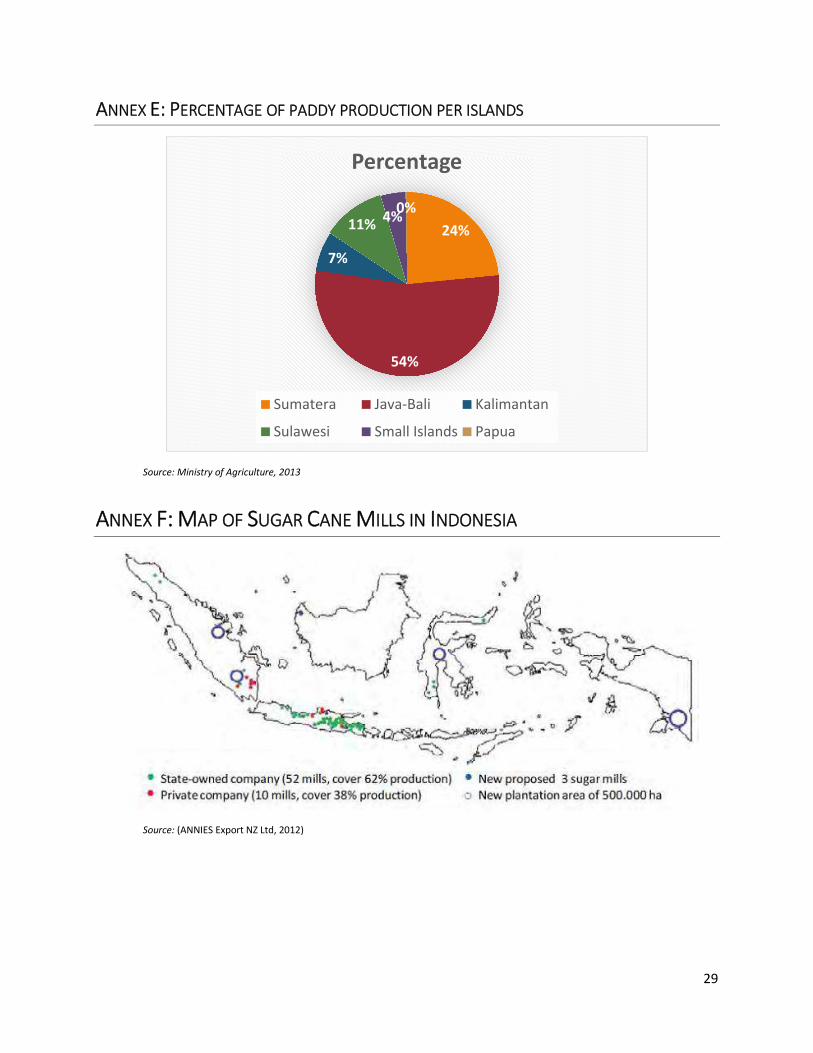
Annex E: Percentage of paddy production per islands ............................................................................... 29
Annex F: Map of Sugar Cane Mills in Indonesia .......................................................................................... 29
LIST OF FIGURE
Figure 1: Types of biomass potential (own outline based on (NREL, 2013) ................................................. 3
Figure 2 Production of Top 3 Crops in Indonesia (2001-2011) (FAO, 2013) ................................................. 4
Figure 3 PLN Transmission Grids and Biomass Concentration Map ........................................................... 12
Figure 4 Screening process to calculate the technical electricity generation ............................................ 13
Figure 5: Shares of land ownership of palm plantation (EKONID, 2011) .................................................... 22

iii
LIST OF TABLE
Table 1 Total installed capacity by PT PLN (Persero) .................................................................................... 2
Table 2 Agricultural commodities (resource potential) produced in Indonesia ........................................... 4
Table 3 Shares and amounts of residues in palm oil mills ............................................................................ 5
Table 4 Theoretical electricity generation from palm oil residues in Indonesia .......................................... 5
Table 5 Theoretical electricity generation from rice industry residues in Indonesia ................................... 6
Table 6 Theoretical power generation from sugar cane factories residues ................................................. 7
Table 7 Theoretical power generation from rubber wood residue .............................................................. 7
Table 8 Theoretical power generation from cassava processing industry biogas power plant* ................. 8
Table 9 Overview of the theoretical potential from three largest agriculture commodities ....................... 9
Table 10 Technical power generation potential from EFB feedstock ......................................................... 14
Table 11 CO2 Emission Reduction potential of EFB feedstock ................................................................... 14
Table 12 Technical power generation potential from Shell & Fiber feedstock .......................................... 15
Table 13 CO2 Emission Reduction potential of Shell & Fiber feedstock ..................................................... 15
Table 14 Technical power generation potential from POME ..................................................................... 15
Table 15 CO2 Emission Reduction potential from methane capture & electricity generation of POME
feedstock ..................................................................................................................................................... 16
Table 16 Overall technical potential from palm oil industry ...................................................................... 16
Table 17 Technical electricity generation potential from rice industry ...................................................... 17
Table 18 CO2 emission reduction potential from rice husk ....................................................................... 17
Table 19 Technical electricity generation potential from sugar industry ................................................... 18
Table 20 CO2 Emission Reduction potential from bagasse ......................................................................... 18
Table 21 Overview of the technical potential from three largest agriculture commodities ...................... 19
Table 22 Overview of Biomass Potential and Emission Reduction Potential ............................................. 20
iv
LIST OF ABBREVIATIONS
BOE Billion Oil Equivalent BPS Central Statistics Agency CDM Clean Development Mechanism CHP Combined Heat and Power COD Chemical Oxygen Demand CPO Crude Palm Oil EFB Empty Fruit Bunches FFB Fresh Fruit Bunches IGCC Integrated Gasification Combined Cycle LHV Lower Heating Value NREL National Renewable Energy Laboratory POME Palm Oil Mill Effluent PLN PT Perusahaan Listrik Negara (Indonesia’s state-own electricity company) RHA Rice Husk Ash UASB Up-flow Anaerobic Sludge Blanket RAN-GRK National Action Plan for Greenhouse Gasses Reduction
1
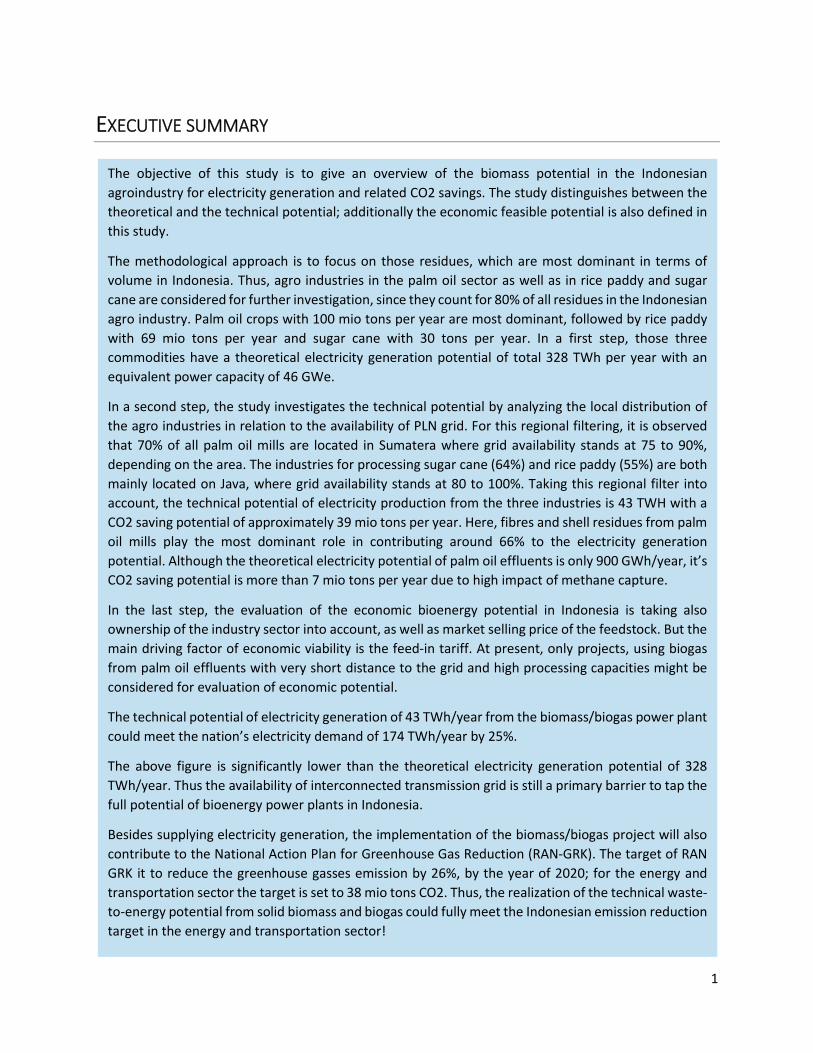
EXECUTIVE SUMMARY
The objective of this study is to give an overview of the biomass potential in the Indonesian
agroindustry for electricity generation and related CO2 savings. The study distinguishes between the
theoretical and the technical potential; additionally the economic feasible potential is also defined in
this study.
The methodological approach is to focus on those residues, which are most dominant in terms of
volume in Indonesia. Thus, agro industries in the palm oil sector as well as in rice paddy and sugar
cane are considered for further investigation, since they count for 80% of all residues in the Indonesian
agro industry. Palm oil crops with 100 mio tons per year are most dominant, followed by rice paddy
with 69 mio tons per year and sugar cane with 30 tons per year. In a first step, those three
commodities have a theoretical electricity generation potential of total 328 TWh per year with an
equivalent power capacity of 46 GWe.
In a second step, the study investigates the technical potential by analyzing the local distribution of
the agro industries in relation to the availability of PLN grid. For this regional filtering, it is observed
that 70% of all palm oil mills are located in Sumatera where grid availability stands at 75 to 90%,
depending on the area. The industries for processing sugar cane (64%) and rice paddy (55%) are both
mainly located on Java, where grid availability stands at 80 to 100%. Taking this regional filter into
account, the technical potential of electricity production from the three industries is 43 TWH with a
CO2 saving potential of approximately 39 mio tons per year. Here, fibres and shell residues from palm
oil mills play the most dominant role in contributing around 66% to the electricity generation
potential. Although the theoretical electricity potential of palm oil effluents is only 900 GWh/year, it’s
CO2 saving potential is more than 7 mio tons per year due to high impact of methane capture.
In the last step, the evaluation of the economic bioenergy potential in Indonesia is taking also
ownership of the industry sector into account, as well as market selling price of the feedstock. But the
main driving factor of economic viability is the feed-in tariff. At present, only projects, using biogas
from palm oil effluents with very short distance to the grid and high processing capacities might be
considered for evaluation of economic potential.
The technical potential of electricity generation of 43 TWh/year from the biomass/biogas power plant
could meet the nation’s electricity demand of 174 TWh/year by 25%.
The above figure is significantly lower than the theoretical electricity generation potential of 328
TWh/year. Thus the availability of interconnected transmission grid is still a primary barrier to tap the
full potential of bioenergy power plants in Indonesia.
Besides supplying electricity generation, the implementation of the biomass/biogas project will also
contribute to the National Action Plan for Greenhouse Gas Reduction (RAN-GRK). The target of RAN
GRK it to reduce the greenhouse gasses emission by 26%, by the year of 2020; for the energy and
transportation sector the target is set to 38 mio tons CO2. Thus, the realization of the technical waste-
to-energy potential from solid biomass and biogas could fully meet the Indonesian emission reduction
target in the energy and transportation sector!

2
CHAPTER I: INTRODUCTION
1.1. BACKGROUND
Although Indonesia produces abundant amounts of biomass feedstock which could be used for renewable energy generation, the current electricity production is still mainly based on fossil fuels such as oil, gas and coal.
Apart from the environmental effects of the fossil-fuel consumption of the 4th most populous country in the world, the budgetary effects are pressing. The country shows an increase of energy demand of 7-10% p.a. (PT PLN, 2013) which, in combination with a rising oil price, is a costly issue for the government. To guarantee a minimum degree of energy security (in 2012 about 76% of the population has access to electricity (Resources, 2013)) energy is strongly subsidized. These factors require the Indonesian government to find different sources of electricity that allow a more cost efficient supply of electricity.
The total installed electricity generation capacity by PT PLN (Persero) has been constantly increasing over the last years, but is still not sufficient to meet the full demand. PLN’s targets foresee an electrification ratio of 90% by 2020. The electricity demand the calendar year 2012 was 174 TWh (PT PLN, 2013).
Table 1 Total installed capacity by PT PLN (Persero)
YEAR 2007 2008 2009 2010 2011
Total Installed Capacity (MW)
22,153 25,987 25,610 32,850 35,254
Source: (Badan Pusat Statistik, 2013)
PLN total installed capacity stands out more than 35 GW up to year 2012.
The Indonesian Government introduced several policy measures aiming to increase private sector
investment into renewable energies to meet the rising demand and increase the electrification of the
country. The central instrument in this array of measures is the feed-in tariff paid for electricity from
renewable sources sold to PLN. For biomass and biogas plants up to 10 MW installed capacity, Ministerial
Regulation No. 4/2012 foresees a price of 975 to 1267.5 IDR/kWh depending on the location of the plant.
Apart from this feed-in tariff, renewable energy IPPs can benefit from tax incentives.
In general a biomass power potential of 50 GWe is assumed for Indonesia (Economics, 2012, p. 2). There
is however no clear breakdown of the different feedstock and technologies used.
1.2. OBJECTIVE
This study aims to give an overview of the resource; technical and economic potentials from biomass
waste available from the Indonesian agroindustry, and the emission reduction potential that would result
from using this biomass for grid-connected electricity generation.

3
1.3. METHODOLOGY
Data for this overview report is taken from online publications by relevant government bodies such as
Ministry of Energy and Mineral Resources (MEMR) and Ministry of Agriculture. In some cases, data is
calculated from Central Statistics Agency (BPS).
The feedstock for biomass based electricity generation mostly stem from the Indonesian agricultural
sector. The focus here does not lie on the plantation of energy crops for electricity generation but on the
utilization of waste and residues from agricultural productions.
Figure 1: Types of biomass potential (own outline based on (NREL, 2013)
A distinction will be made between the resource potential, the technical potential and the economic
potential (NREL, 2013).
The resource potential is classified as the total biomass waste that is available in the Indonesian agro-
industry and the energy content of this biomass waste. The technical potential only considers the share
of biomass that can be processed by technology currently available in Indonesia. Furthermore, focus is
laid on the amount of biomass that is concentrated in easily accessible regions. This concern reflects a
certain required concentration of biomass as well as grid availability. The economic potential finally would
only take into account the amount of biomass which will be economically attractive for the IPP to be used
for electricity generation. At this point, the industry structure, feedstock security and the opportunity cost
of the feedstock should be taken into account.

4
CHAPTER II: BIOMASS RESOURCE POTENTIAL
The following agricultural commodities are produced in Indonesia:
Commodities:
Oil palm (CPO) Cashew nut
Sugar Corn
Rice Wood
Rubber Coffee
Cassava / Tapioca starch Cocoa
Rubber Coconut
Tea Clove
As shown in Table 2 and Figure 2, the largest amounts of agricultural products and potential of solid
biomass residues stem from the oil palm, rice and sugar cane industries. Other important agricultural
sectors are the corn, rubber and tapioca-starch production.
Table 2 Agricultural commodities (resource potential) produced in Indonesia
No Crops Amount
(ton/year) Percentage
1. Palm Oil (FFB) 100,000,000 41 %
2. Rice Paddy 69,000,000 28 %
3. Sugar Cane 30,000,000 12 %
4. Others (Corn, Rubber, Cassava) 47,000,000 19 % Source: (Badan Pusat Statistik, 2013)
Figure 2 Production of Top 3 Crops in Indonesia (2001-2011) (FAO, 2013)
The reason for the amounts of production of the oil palm sector being higher than that of the rice industry
in Figure 2 is due to the fact that the complete fruit is considered while the Central Statistics Agency
(Badan Pusat Statistik/BPS) data only includes the amount of crude palm oil produced. As the bioenergy
production is supposed to be based on residual materials, the amount of fruit produced is more relevant.
This study will therefore concentrate on the assessment of the biomass / gas and emission reduction
potential from the palm oil, rice and sugar cane industries.
5
CHAPTER III: THEORETICAL POTENTIAL
3.1. PALM OIL INDUSTRY
Depending on the units applied, different figures for the amount of available biomass can be found in the
literature. Taking the unit of tons of fresh fruit bunches (FFB) produced as a basis, the overview of the
shares of the different components that arise during crude palm oil production could be seen on the annex
A.
As the only regional data of production amounts of the palm oil industry in Indonesia is available for the
crude palm oil (CPO) production, the shares of the different residues will be calculated based on these
figures and the mass balance.
The POME potential of a typical Indonesian palm oil mill processing 30 to 90 tons of FFB/hour lies around
0.6 m3 / ton FFB (Rauch & Schweinfurth, 2013, p. 5). This figure is in line with the 58.3% mentioned in
Annex A: Mass Balance of Palm Oil Extracts and Residues. The shares named in Table 3 have also been
verified by (Indonesian Oil Palm Research Institute (IOPRI), 2012, p. 24) during an assessment of palm oil
mill in North Sumatra done for GIZ. The exact shares that were reported by the mills studied and the
resulting amounts of residues produced, assuming a total production of FFB of around 100 million ton in
2012 are outlined in Table 3.
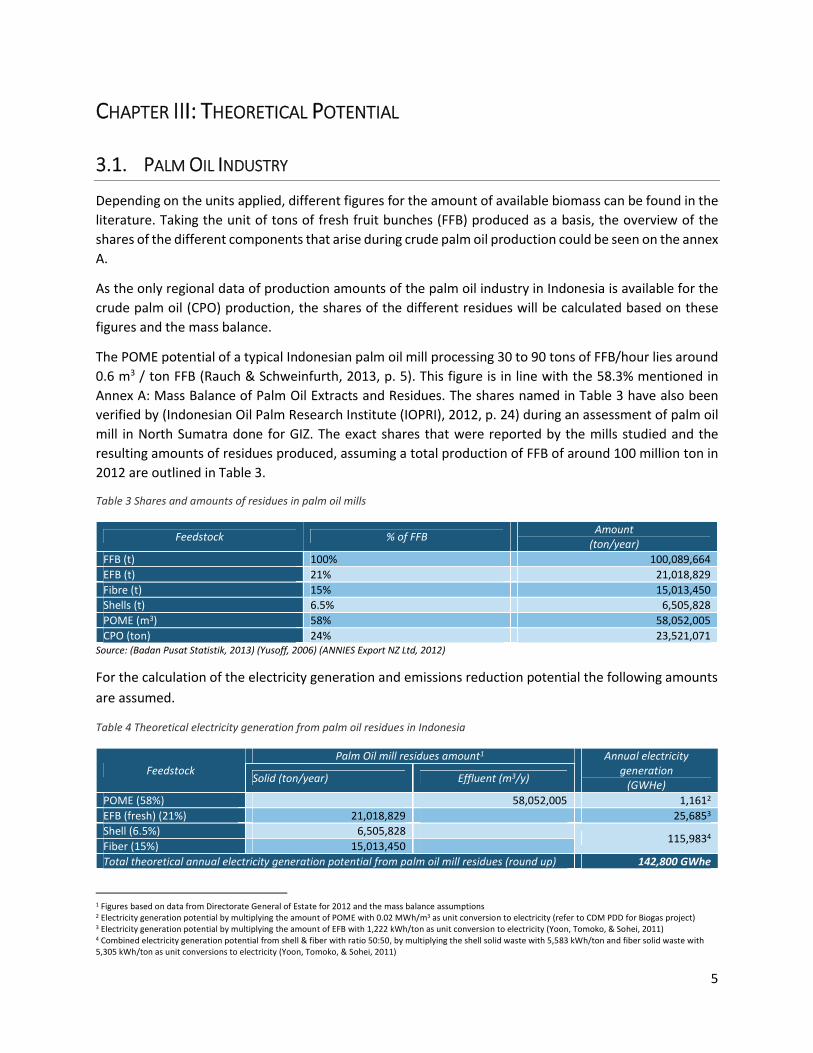
Table 3 Shares and amounts of residues in palm oil mills
Feedstock % of FFB Amount
(ton/year)
FFB (t) 100% 100,089,664
EFB (t) 21% 21,018,829
Fibre (t) 15% 15,013,450
Shells (t) 6.5% 6,505,828
POME (m3) 58% 58,052,005
CPO (ton) 24% 23,521,071 Source: (Badan Pusat Statistik, 2013) (Yusoff, 2006) (ANNIES Export NZ Ltd, 2012)
For the calculation of the electricity generation and emissions reduction potential the following amounts
are assumed.
Table 4 Theoretical electricity generation from palm oil residues in Indonesia
Feedstock Palm Oil mill residues amount1 Annual electricity
generation (GWHe)
Solid (ton/year) Effluent (m3/y)
POME (58%) 58,052,005 1,1612
EFB (fresh) (21%) 21,018,829 25,6853
Shell (6.5%) 6,505,828 115,9834
Fiber (15%) 15,013,450
Total theoretical annual electricity generation potential from palm oil mill residues (round up) 142,800 GWhe
1 Figures based on data from Directorate General of Estate for 2012 and the mass balance assumptions 2 Electricity generation potential by multiplying the amount of POME with 0.02 MWh/m3 as unit conversion to electricity (refer to CDM PDD for Biogas project) 3 Electricity generation potential by multiplying the amount of EFB with 1,222 kWh/ton as unit conversion to electricity (Yoon, Tomoko, & Sohei, 2011) 4 Combined electricity generation potential from shell & fiber with ratio 50:50, by multiplying the shell solid waste with 5,583 kWh/ton and fiber solid waste with 5,305 kWh/ton as unit conversions to electricity (Yoon, Tomoko, & Sohei, 2011)

6
HIGHLIGHT With FFB production amount of 100 million tonnes/year, the total theoretical electricity generation from palm oil mill residue is 142,800 GWh. The highest electricity generation is resulted from combustion of shell and fiber combination which is 115,983 GWh or 82% of the total generation.
3.2. RICE PADDY INDUSTRY
With a paddy production of around 69 million tons in 2012, and increasing production over the past years
and a share of husk of the total production of 20 %, this results in an overall potential for Indonesia of 13
million tons. This amount can provide a heat value of 45,000 GWh which could translate into 700 to 1,600
MWe depending on the technology applied (Kwintkiewicz, 2013, p. 5).
Apart from the rice husk, rice straw which makes up 50% of the total harvest volume can also be used as
fuel (Rauch & Schweinfurth, 2013, p. 8). The Lower Heating Value of rice straw can vary between 12.5 and
16.5 MJ kg -1 depending on the ash content (Gadde, Menke, & Wassmann, 2009, p. 1538).
Table 5 Theoretical electricity generation from rice industry residues in Indonesia
Feedstock Rice industry residues amount5 Annual electricity generation
(GWHe)
Rice husk 13,811,200 45,8266
Rice straw 34,528,063 119,8887
Total theoretical annual electricity generation from rice mill residues (round up) 165,700 GWhe
HIGHLIGHT With paddy production amount of 69 million tonnes/year, the total theoretical electricity generation from rice paddy industry residue is 165,700 GWh. The highest electricity generation is resulted from rice straw feedstock which is 119,888 GWh or 72% of the total generation.
3.3. SUGAR INDUSTRY
The annual sugar cane production in Indonesia has been fluctuating between 24 and 26 million tons over
the past five years (Annex B).
The processing capacity of Indonesian sugar factories ranges between 1,000 to 12,000 tons of sugar
cane per day. The amount of residues in these factories sums up to 320-370 kg of bagasse per ton of
sugar cane (EKONID, 2011, p. 23) (Winrock International, 1991).
5 Based on (Badan Pusat Statistik, 2013) 6 Electricity generation potential by multiplying the amount of rice husk with 3,318 kWh/ton as unit conversion to electricity (Kwintkiewicz, 2013) 7 Electricity generation potential by multiplying the amount of rice straw with 3,472 kWh/ton as unit conversion to electricity (Gadde, Menke, & Wassmann, 2009)

7
Table 6 Theoretical power generation from sugar cane factories residues
Feedstock Sugar cane factories residue amount Annual electricity generation
(GWHe)
Bagasse (32%) 9,752,9608 19,7899
Total theoretical annual electricity generation from rice mill residues (round up) 19,800 GWhe Source: (Directorate General of Estate, n.d.)
HIGHLIGHT
With sugar production amount of 30 million tonnes/year, the total theoretical electricity generation from bagasse as sugar cane factory residue is 19,800 GWh.
3.4 OTHER INDUSTRIES
A brief overview of the biomass potential in other relevant industries will be given in this subsection.
3.4.1 RUBBER RESIDUE
As the second-largest rubber producer worldwide, Indonesia supplies a substantial amount of
rubber to the international market. About 80% of Indonesia’s rubber production is accounted for
by small hold farmers and about 85% of total production is exported (Indonesia Investment, n.d.).
According to data from the Ministry of Agriculture (Directorate General of Estate, n.d.), the total
natural rubber production in 2012 amounted to 3 million tons, which produced from 3.5 million
ha plantations scattered all around Indonesia. Due to this lack of concentration of biomass, larger
grid-connected biomass plants cannot easily secure their feedstock supply and consequently the
technical and economic potential will not be discussed.
Table 7 Theoretical power generation from rubber wood residue
Feedstock Amount
(ton/year) Annual Electricity Generation
(kWh)
Rubber wood residue 41,000,000 33,360 *
Total theoretical annual electricity generation from rubber wood (round up) 33.4 MWh *Source: Directorate of Electricity and Electricity Utilization, 2001 (www.unescap.org_esd_Energy-Security-and-Water-
Resources_energy_renewable_promotion_biomass_seminar_Indonesia)
3.4.2 CASSAVA
Cassava is not included as solid biomass because the tube is used for producing liquid fuel
(bioethanol) while most of the stem is used for establishing new plantation, and the leaves are
used as animal fodder (Prastowo, 2011).
8 Based on sugarcane production 2012 according to (Badan Pusat Statistik, 2013) * 0.32 (share of bagasse) 9 Electricity generation potential by multiplying the amount of bagasse with 2,029 kWh/ton as unit conversion to electricity (ANNIES Export NZ Ltd, 2012)

8
The cassava processing industry, like the palm oil industry, can however use the wastewater from
their processes for biogas generation. The COD level of tapioca starch wastewater is somehow
smaller than that of POME, but still there is some potential with so far 18 of the more than 50
listed companies using anaerobic digestion technology. All these tapioca starch wastewater plants
currently apply tank based reactors (Up-flow Anaerobic Sludge Blanket: UASB). However the other
technology options (covered lagoon or continuous stirred lagoon) which show simpler daily
operations and handling might be applied for upcoming reactor designs. (PT. Biogas Program
International, 2013)
Table 8 Theoretical power generation from cassava processing industry biogas power plant*
Feedstock Amount
(m3/year)
Annual Power Generation (GWh/year)
Tapioca starch plant waste water (32%) 389,255,70010 6,38411
The theoretical annual electricity generation from cassava processing industry (round up) 6,400 GWh *Source: (Badan Pusat Statistik, 2013) (Emission Reduction Calculation for Budi Acid Jaya Tapioca Starch Factory, 2011) (Titiresmi)
(IFAD, 2010) (NC State University, n.d.)
Due to the relatively small industry size, the technical and economic potential of bioenergy from
the tapioca-starch industry are not discussed.
3.4.3 CORN RESIDUE
Indonesia accounted for a production of corn of 19 million tons in 2012 (Badan Pusat Statistik,
2013). Solid residue from corn is corncob with ‘residue to product ratio’ of 0.273 with Calorific
Value of 4451 kcal/kg (Sudrajat, 2004 quoted by (Widodo, 2007)). The energy potential from
corncob is about 55.75 GJ. This energy potential is equivalent with 15.5 MWh12.
Another solid residue from corn is corn stove taken from the plantation. According to Prasetyo
(2002) corn stove potential is 3.46 tonnes/ha with Calorific Value of 4,370 kcal/kg (Sudrajat, 2004).
The energy potential from corn stove is about 66 GJ. This energy potential is equivalent with 18
MWh.
Although there is a high energy potential from corn cob, the utilization of corn residue for
electricity generation would still face some barriers such as the scattered production area and the
low bulk density of corn. Therefore the transportation cost to collect the product may be
expensive (Widodo, 2007). Based on this, the technical and economic potential will not be further
discussed.
10 Based on cassava production 2012 according to (Badan Pusat Statistik, 2013) * 16.1 (conversion factor based on data from Budi Acid Jaya PDD : http://cdm.unfccc.int/filestorage/9/L/6/9L6PQF3YJMB8UVSHCI120AK4ET7OZW/2673%20PDD.pdf?t=MTZ8bjI5M2d4fDDeQLMldRxWLwGBKBcSl4qm ) 11 Feedstock amount * 16.4 kWh/m3 as the electricity generation conversion factor 12 1 GJ is equivalent with 278 kWh : Conversion factor for bioenergy, NC Woody Biomass
9
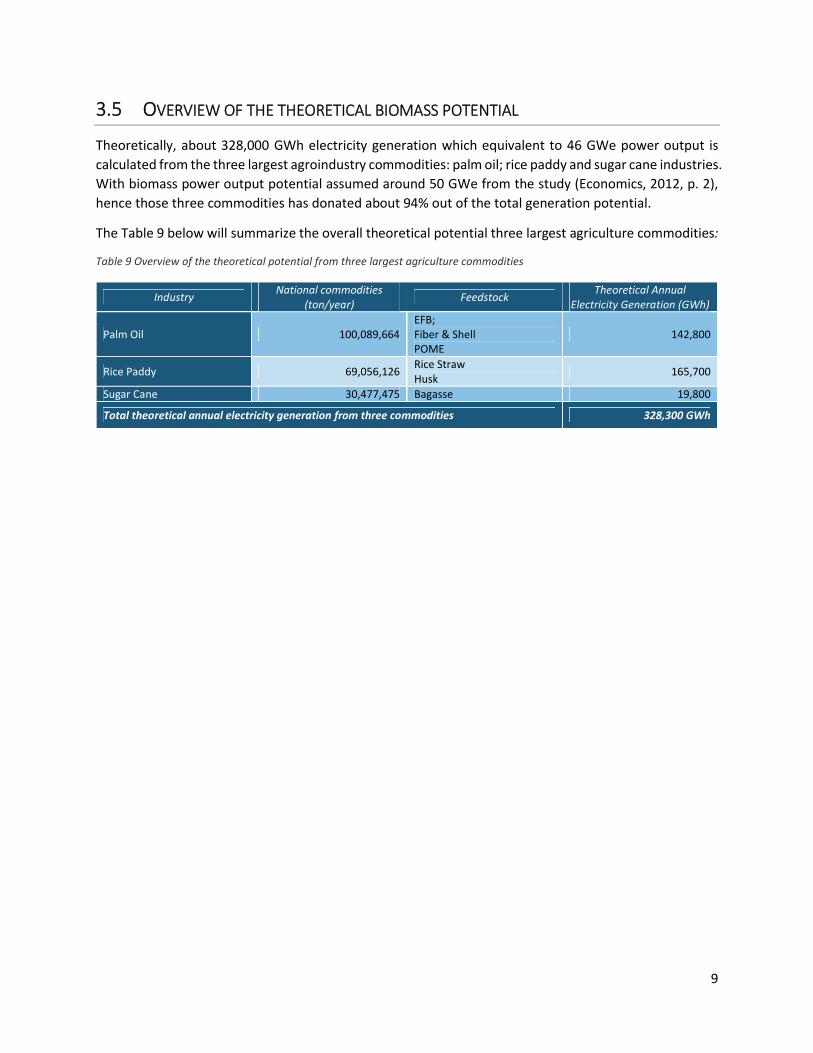
3.5 OVERVIEW OF THE THEORETICAL BIOMASS POTENTIAL
Theoretically, about 328,000 GWh electricity generation which equivalent to 46 GWe power output is
calculated from the three largest agroindustry commodities: palm oil; rice paddy and sugar cane industries.
With biomass power output potential assumed around 50 GWe from the study (Economics, 2012, p. 2),
hence those three commodities has donated about 94% out of the total generation potential.
The Table 9 below will summarize the overall theoretical potential three largest agriculture commodities:
Table 9 Overview of the theoretical potential from three largest agriculture commodities
Industry National commodities
(ton/year) Feedstock
Theoretical Annual Electricity Generation (GWh)
Palm Oil 100,089,664 EFB; Fiber & Shell POME
142,800
Rice Paddy 69,056,126 Rice Straw Husk
165,700
Sugar Cane 30,477,475 Bagasse 19,800
Total theoretical annual electricity generation from three commodities 328,300 GWh

10
CHAPTER IV: BIOMASS/BIOGAS TO ELECTRICITY TECHNOLOGIES AND THEIR
APPLICATION IN INDONESIA
Biomass energy is a suitable fossil fuel replacement for electricity power generation. Different
technologies which can be applied to produce electricity from biomass energy will be shortly described in
this section (IEA, 2007).
1. Biomass co-firing
2. Biomass combined heat and power (CHP)
3. Biomass integrated gasification combined cycle (BIGCC)
4. Anaerobic digestion
Technologies and cost of power and heat generation from biomass depend on feedstock quality, availability and transportation cost, power plant size, conversion into biogas (if any).
4.1 BIOMASS CO-FIRING
Biomass co-firing is the process of replacing part of the fossil fuel supplied to a power station or boiler
with a renewable alternative (Biomass Energy Centre, n.d.)
One of the biomass utilization technology applicable in Indonesia is biomass co-firing with coal. In the
agroindustry this technology is applied i.e. by wood mills to generate electricity.
The share of biomass should not exceed 10% in co-firing systems, as otherwise changes in mills, burners
and dryers are needed. Furthermore, mill owners have to use high-quality biomass to avoid tar production
which can cause slagging and fouling that affects plant reliability and raises costs.
Since only a small portion of biomass could be utilized in co-firing technology, this technology is not
relevant to our study and will not be discussed further.
4.2 BIOMASS COMBINED HEAT AND POWER (CHP)
The production of electricity from biomass resources is most economic when the resulting waste heat is
also captured and used as thermal energy – an approach called combined heat and power or CHP. The
least cost forms of biomass for generating electricity are residues such as sawdust, rice husks, wheat straw,
corn stalks, and bagasse. CHP is a common technology to produce heat and power especially for palm oil
industries in Indonesia.
Biomass can be burned to produce electricity and heat via a steam turbine in dedicated power plants with
typical size from 1 to 100 MW. This technology is used to dispose of large amount of residues and wastes
(e.g bagasse). Plant efficiency ranges between 30% - 34% depending on plant size and feedstock quality
and up to 40% if operated in electricity-only mode.

11
4.3 BIOMASS GASIFICATION
This technology converts biomass into biogas by using fast thermo-chemical processes (e.g. pyrolysis) or
slow anaerobic fermentation. The biogas can be used in combustion engines (10 kW to 10 MW) with
efficiency of some 30%-35%; in gas turbine at higher efficiencies or in highly-efficient combined cycles.
Biomass integrated gasification gas turbines are not yet in commercial use, but their economics is
expected to improve. The first IGCC running on 100% biomass (straw) is operating successfully in Sweden.
Gasification technology could become the state-of-the art technology to utilize the abundant EFB
potential from palm oil industry. By using this technology, palm oil mills could optimize their biogas
production from both POME and EFB feedstock and generate additional income by supplying electricity
to the grid. However, gasification technology has not yet been applied in Indonesia.
4.4 BIOGAS AN-AEROBIC DIGESTION
Agroindustry wastes such as animal manure and liquid waste are usually treated in a set of open lagoons
before discharged into rivers. This wastewater can be used to produce methane by applying an-aerobic
digestion technology in the lagoons.
Biogas can be utilized for power and heat generation. After purification and upgrading, biogas can be used
in heat plants, stationary engines, fed into the natural gas grid, or used as a transport fuel (compressed
natural gas).
Anaerobic digestion to produce biogas is well-applied in Indonesia proven by 46 CDM biogas projects
under the UNFCCC. Biogas plants usually treat Palm Oil Mill Effluent (POME) and tapioca starch waste
water. The most common technology used is the covered lagoon for POME and UASB for tapioca-starch
wastewater.

12
CHAPTER V: TECHNICAL POTENTIAL AND CO2 REDUCTION POTENTIAL
Even though large potential of biomass is available in Indonesia theoretically, biomass and biogas power
plant application is still limited to some industries so far. Biogas technology is applied in the palm oil and
tapioca starch industry to treat the wastewater under the CDM-framework and the palm oil, rice and
sugar industry use solid biomass as feedstock to generate steam and electricity for their own production.
The map below shows the location of the main transmission grids by PLN and the concentration of the
different agricultural products, which are important criteria for the calculation of the technical potential.
Figure 3 PLN Transmission Grids and Biomass Concentration Map
As mentioned above, the location of the main transmission grids by PLN and the concentration of the
different agricultural products are important criteria to narrow-down the theoretical electricity
generation potential into technical electricity generation potential. For further calculation, the biomass
feedstock available on the region with highest concentration of selected biomass type will be used for the
calculation.
The selection of technology will define the efficiency of electricity generation from each of feedstock type.
Some feedstock is difficult to develop due to lack information on the applicable technology. Thus, the
electricity generation efficiency of selected technology will also be an important criteria for technical
calculation. The Figure 4 shows the screening process to calculate the technical electricity generation
potential by considering three (3) important criteria as explained above.

13
Figure 4 Screening process to calculate the technical electricity generation
5.1 PALM OIL INDUSTRY
Palm oil mills already use the solid residues, mainly fibers and fruit kernel shells, for heat and electricity
generation for their own processes. This means most of them are already energy-self-sufficient. The
empty fruit bunches (EFB), which amount to 21 % of the fresh fruit bunches, as well as the POME are only
to a small extent used as fertilizer in the plantations.
Emission reduction potential in CDM projects in Indonesia ranges from 0.06 to 0.12 ton CO2 per ton FFB
(PT. Biogas Program International, 2013). However, these reductions are achieved by methane capture
and subsequent flaring of the biogas. Hence, additional emission reductions can be achieved by
generating electricity from the biogas which can substitute PLN grid-electricity. Emission reduction
potential from electricity production however varies depending on the technology applied.
The map of Palm Oil Mills in Indonesia (ANNIES Export NZ Ltd, 2012) (see Annex D) underlines the
concentration of palm oil mills in Sumatra and Kalimantan. More than 70% of the CPO production is
located in Sumatra, and as there is also an interconnected grid available, the share of CPO production in
Sumatra is used as a basis for the calculation of the technical potential.
THEORETICAL BIOMASS FEEDSTOCK
TECHNICAL BIOMASS WASTE FEEDSTOCK
Regional Biomass Concentration
PLN Interconnection Grid
TECHNICAL ELECTRICITY GENERATION
Energy to electricity conversion unit
subject to feedstock types
Electricity generation efficiency
subject to technology used

14
5.1.1 EFB: FUEL FOR MEDIUM PRESSURE STEAM TURBINE – CHP TECHNOLOGY
Medium Pressure Steam boiler is a closed tank in which water is converted into steam under medium
pressure (40 bar) (ANNIES Export NZ Ltd, 2012). Currently, fiber and shell are combust to produce steam
for heat and electricity power. The application of EFB for steam boiler will replace utilization of shell. The
excess shell then available to be sold as feedstock or it can be used to generate electricity which will give
additional economic revenue when fed into the grid.
Assuming a power generation potential from EFB of 1,222 kWh/ton and an amount of EFB of 21% of
overall FFB production, the table below outlines the technical potential for electricity generation and
emission reduction potential from applying 100% EFB in a medium pressure steam boiler. The application
of 100% EFB is for modelling purpose only since EFB will need to be combusted with other POM residues
on a certain percentage to avoid corrosion of the furnace steel (ANNIES Export NZ Ltd, 2012).
Table 10 Technical power generation potential of EFB feedstock
Parameter Value Unit
FFB (Theoretical Biomass Feedstock) 100,089,664* Ton/year
EFB (Technical Biomass Waste Feedstock) 15,004,15813 Ton/year
Technical Electricity Generation from EFB 4,40114 GWh/year *Source: Ministry of Agriculture, 2013
Table 11 CO2 Emission Reduction potential of EFB feedstock
Parameter Value Unit
Technical Electricity Generation from EFB 4,401 GWh/year
Emission Factor for Sumatera Grid in 2010* 0.748 tCO2/MWh
CO2 Emission Reduction (round-up) 3,300,000 tCO2e/year *Source: http://pasarkarbon.dnpi.go.id/web/index.php/dnacdm/read/23/pembaruan-faktor-emisi-sistem-interkoneksi-tenaga-listrik-2011.html
HIGHLIGHT With technical EFB production of 15 million tonnes/year from palm oil industry, the total technical electricity generation from EFB feedstock is 4,401 GWh/year or 17% of the theoretical generation potential. The Emission Reduction from EFB feedstock is 3,300,000 tCO2e/year.
5.1.2 SHELL AND FIBER USED IN OPTIMIZED HIGH PRESSURE STEAM TURBINE
With 71 million ton/year of FFB technically available for biomass on-grid plant, the potential electricity generation is 14,748 GWh/year. The table below outlines the electricity generation and emission reduction potential from combined shell and fiber co-firing.
13 FFB regional potential from Sumatera Islands (71.38% of National FFB production) * 21% as share of EFB 14 EFB potential * 1,222 kWh/ton EFB as energy to electricity conversion unit * 24% as electricity generation efficiency for MP steam turbine

15
Table 12 Technical power generation potential of Shell & Fiber feedstock
Parameter Value Unit
FFB (Theoretical Biomass Feedstock)* 100,089,664* Ton/year
Shell (Technical Biomass Waste Feedstock) 2,322,07215 Ton/year
Fiber (Technical Biomass Waste Feedstock) 5,358,62816 Ton/year
Technical Electricity Generation from shell and fiber 29,47517 GWh/year *Source: Ministry of Agriculture, 2013
Table 13 CO2 Emission Reduction potential of Shell & Fiber feedstock
Parameter Value Unit
Technical Electricity Generation from Shell & Fiber 29,475 GWh/year
Emission Factor for Sumatera Grid in 2010* 0.748 tCO2/MWh
CO2 Emission Reduction (round-up) 22,050,000 tCO2e/year *Source: http://pasarkarbon.dnpi.go.id/web/index.php/dnacdm/read/23/pembaruan-faktor-emisi-sistem-interkoneksi-tenaga-listrik-2011.html
HIGHLIGHT With technical Shell & Fiber production of 15 million tonnes/year from palm oil industry, the total technical electricity generation from Shell & Fiber feedstock is 29,475 GWh/year or 25% of the theoretical generation potential. The Emission Reduction from EFB feedstock is 22,050,000 tCO2e/year.
5.1.3 BIOGAS POWER PLANT USING POME
There are 646 POMs in Indonesia of which less than 10% applies biogas technology for treating the POME
(PT. Biogas Program International, 2013). The potential of all palm oil mills in Sumatra is calculated below.
Table 14 Technical power generation potential of POME
Parameter Value Unit
FFB (Theoretical Biomass Feedstock)* 100,089,664* Ton/year
POME (Technical Waste water Feedstock) 41,440,05518 m3/year
Biogas (Technical biogas feedstock) 1,160,321,53219 m3/year
Technical Electricity Generation from biogas 939 GWh/year *Source: Ministry of Agriculture, 2013
15 FFB regional potential from Sumatera Islands (71.38% of National FFB production) * 6.5% as share of Shell 16 FFB regional potential from Sumatera Islands (71.38% of National FFB production) * 15% as share of Fiber 17 EFB potential * 5,583 kWh/ton shell (or 5,306 kWh/ton fiber) as energy to electricity conversion unit * 35.6% as electricity generation efficiency for HP steam turbine 18 POME regional potential from Sumatera Islands (71.38% of National FFB production) * 0.58 m3/t FFB as share of POME 19 POME technical potential * 28 m3/m3 POME as conversion unit from POME to biogas production (Annies Waste to Energy Identification
study, 2012)

16
Table 15 CO2 Emission Reduction potential from methane capture & electricity generation of POME feedstock
Parameter Value Unit CO2 Emission Reduction from methane capture (round-up)* 6,580,00020 tCO2e/year
CO2 Emission Reduction from electricity generation (round-up)** 703,00021 tCO2e/year
Emission Factor for Sumatera Grid in 2010* 0.748 tCO2/MWh
Total CO2 Emission Reduction (round-up) 7,283,000 tCO2e/year *Source: UNFCCC methodology for small-scale project (AMS-III.H) & IPCC
**Source: http://pasarkarbon.dnpi.go.id/web/index.php/dnacdm/read/23/pembaruan-faktor-emisi-sistem-interkoneksi-tenaga-listrik-
2011.html
5.1.4 OVERALL TECHNICAL POTENTIAL PALM OIL INDUSTRY
The section 5.1.1 to 5.1.3 above give detailed calculation on the technical potential from each of palm oil biomass feedstock. The Table 16 below will summarize the overall technical potential from palm oil industry:
Table 16 Overall technical potential from palm oil industry
Feedstock Technical Electricity Generation CO2 Emission Reduction
EFB 4,401 GWh/year 3,300,000 tCO2e/year
Shell & Fiber 29,475 GWh/year 22,050,000 tCO2e/year
POME 939 GWh/year 7,283,000 tCO2e/year
Total 34,815 GWh/year 32,633,000 tCO2e/year
HIGHLIGHT The highest electricity generation potential is resulted from combustion of fiber and shell, due to their high calorific values. This combustion model has been implemented by all palm oil mills in Indonesia. While the power generation potential from POME is considerably lower than that of shell and fiber, this option shows the highest emission reduction potential which is due to methane emission capture. In general, the electricity generation potential from palm oil industry is higher than other agroindustry. Hence, the economic potential of palm oil biomass power generation will be discussed further.
5.2 RICE INDUSTRY
Assuming an off-site 2.5 MW medium pressure steam turbine plant as the technology to be applied, a rice
husk input of 3.5 tons per hour or 29,000 tons per year would be needed. If this feedstock demand is to
be supplied by smallholders processing 50-60 tons of paddy/day, around 12 mills need to be contracted
(Kwintkiewicz, 2013).
The rice industry in Indonesia is mostly located in the islands Java, Sumatra, Sulawesi, Kalimantan and
Bali/West Nusa Tenggara (Hasan, Mahlia, & Nur, 2012).
20 POME amount * COD Removal * Methane Production capacity of the waste water * Methane Correction Factor * Global Warming Potential (GWP) of Methane = 41 mio m3 * 0.045 * 0.21 * 0.8 * 21 21 Technical electricity generation from biogas *0.748 tCO2/MWh as Emission Factor for Sumatera Grid

17
More than 50% of the national paddy production is harvested in Java and Bali. These islands have an
integrated grid connection, which is known as JAMALI Grid. With a demand growth of about 9.1% p.a.,
the electricity demand for this grid is relatively high (PT PLN, 2013). Hence, the share of biomass produced
in Java and Bali is taken as the basis for the calculation of the technical potential.
Table 17 Technical electricity generation potential from rice industry
Parameter Value Unit
Rice Paddy (Theoretical Biomass Feedstock)* 69,056,000 Ton/year
Rice Straw (Technical Biomass Feedstock) 19,127,50022 Ton/year
Rice Husk (Technical Biomass Feedstock) 7,651,00023 Ton/year
Technical electricity generation from rice husk (round-up) 5,36224 GWh/year Source: BPS Statistic Data, 2012
Rice straw is not concentrated in the mills hence no study on rice straw potential as biomass power plant
feedstock is available for Indonesia. Hence, this overview study only considered electricity generation
from rice husk.
Table 18 CO2 emission reduction potential from rice husk
Parameter Value Unit
Technical Electricity Generation from Rice Husk 5,362 GWh/year
Emission Factor for JAMALI Grid in 2010* 0.741 tCO2/MWh
CO2 Emission Reduction (round-up) 3,973,000 tCO2e/year *Source: http://pasarkarbon.dnpi.go.id/web/index.php/dnacdm/read/23/pembaruan-faktor-emisi-sistem-interkoneksi-tenaga-listrik-2011.html
HIGHLIGHT The total technical electricity generation potential from rice husk is 5,362 GWh/year or 3.2% from the theoretical potential. Although the technical potential is lower than potential from palm oil industry, rice mill owner might get additional income from selling of Rice Husk Ash (RHA) to other industries. Hence the economic potential from rice industry will be discussed further.
5.3 SUGAR INDUSTRY
The majority of sugar mills is located in Java. This location of mills is in line with the amounts of production
per region. With a sugar production of 1,557,624 tons in 2012 milled from an equivalent of 19.4 million
tons of sugar cane, Java accounts for the main share of 64 % (Directorate General of Estate,
n.d.).Consequently this share will be the basis for the calculation of the technical electricity and emission
reduction potential.
22 Rice Straw regional potential from Java-Bali regions (55.40% of National Rice production) * 50% as share of RS 23 Rice Husk (RH) regional potential from Java – Bali regions (55.40% of National Rice production) * 20% as share of RH 24 RH potential * 3,318 kWh/ton as the conversion unit for Rice Husk
18
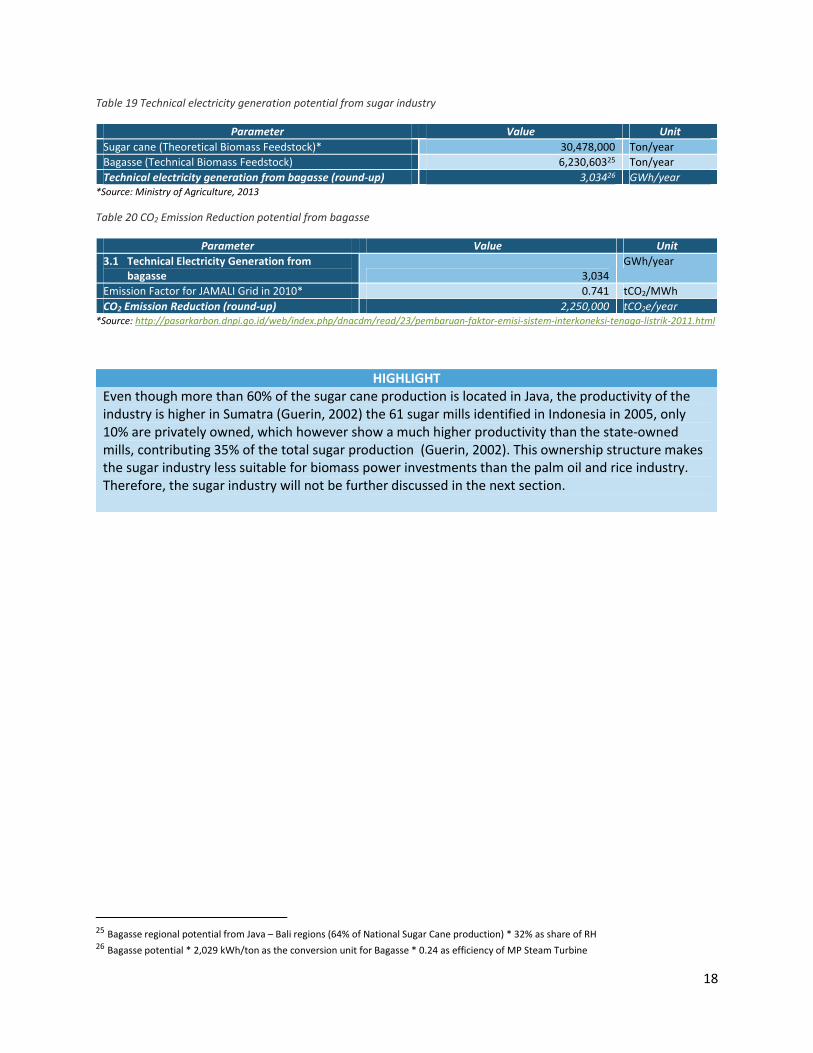
Table 19 Technical electricity generation potential from sugar industry
Parameter Value Unit
Sugar cane (Theoretical Biomass Feedstock)* 30,478,000 Ton/year
Bagasse (Technical Biomass Feedstock) 6,230,60325 Ton/year
Technical electricity generation from bagasse (round-up) 3,03426 GWh/year *Source: Ministry of Agriculture, 2013
Table 20 CO2 Emission Reduction potential from bagasse
Parameter Value Unit
3.1 Technical Electricity Generation from bagasse 3,034
GWh/year
Emission Factor for JAMALI Grid in 2010* 0.741 tCO2/MWh
CO2 Emission Reduction (round-up) 2,250,000 tCO2e/year *Source: http://pasarkarbon.dnpi.go.id/web/index.php/dnacdm/read/23/pembaruan-faktor-emisi-sistem-interkoneksi-tenaga-listrik-2011.html
25 Bagasse regional potential from Java – Bali regions (64% of National Sugar Cane production) * 32% as share of RH 26 Bagasse potential * 2,029 kWh/ton as the conversion unit for Bagasse * 0.24 as efficiency of MP Steam Turbine
HIGHLIGHT Even though more than 60% of the sugar cane production is located in Java, the productivity of the industry is higher in Sumatra (Guerin, 2002) the 61 sugar mills identified in Indonesia in 2005, only 10% are privately owned, which however show a much higher productivity than the state-owned mills, contributing 35% of the total sugar production (Guerin, 2002). This ownership structure makes the sugar industry less suitable for biomass power investments than the palm oil and rice industry. Therefore, the sugar industry will not be further discussed in the next section.

19
5.4 OVERVIEW OF THE TECHNICAL BIOMASS POTENTIAL
The section 5.1 to 5.4 above give detailed technical potential from palm oil; rice paddy and sugar cane industries. Table 21 below summarizes the total technical potential from each industry as below:
Table 21 Overview of the technical potential from three agro-industries:
Industry Feedstock Technical Annual Electricity
generation CO2 Emission Reduction
EFB 4,401 GWh/year 3,300,000 tCO2e/year
Palm Oil Fiber & Shell 29,475 GWh/year 22,050,000 tCO2e/year
POME 939 GWh/year 7,283,000 tCO2e/year
TOTAL PALM OIL 34,815 GWh/year 32,633,000 tCO2e/year
Rice Paddy Rice Husk 5,362 GWh/year 3,973,000 tCO2e/year
Sugar Cane Bagasse 3,034 GWh/year 2,250,000 tCO2e/year
TOTAL FROM ALL INDUSTRIES 43,211 GWh/year 38,856,000 tCO2e/year
HIGHLIGHT Although rice paddy industry has higher theoretical electricity generation potential than the palm oil industry, due to the technology constraint to utilize the risk straw feedstock now the palm oil industry has the highest technical electricity generation potential than the rice paddy industry. The private ownership structure of the palm oil industry and the interconnected Grid availability strengthened the technical potential from this industry.

20
CHAPTER VI: OVERVIEW OF BIOMASS POTENTIAL AND EMISSION REDUCTION
POTENTIAL
The Chapter III and Chapter V above describe the theoretical and technical potentials of biomass feedstock.
The theoretical potential of biomass feedstock is assumed based on the national production data in 2012
available on Central Statistics Agency and Ministry of Agriculture websites.
The technical potential is calculated by considering the location of the main transmission grid by PLN; the
concentration of the different agricultural products; and the electricity generation efficiency of the
selected technology.
The Table 22 below summarize the biomass and Emission Reduction potentials:
Table 22 Overview of Biomass Potential and Emission Reduction Potential
Industry
Theoretical Biomass Waste Potential Technical Potential CO2 Emission Reduction (ER) Potential
Feedstock Type Electricity
Generation (GWh)
Technology use
Net Electricity
Generation (GWh/year)
Methane Avoidance
Electricity Generation
Total ER (thousand
tCO2e/year)
Palm Oil
EFB Solid 25,685 Medium Pressure Steam Turbine
4,401 - 3,300 3,300
Fiber & Shell
Solid 115,983 High Pressure Steam Turbine
29,475 - 22,050 22,050
POME Effluent 1,161 Anaerobic digester
939 6,580 703 7,283
Total 142,829 34,815 6,580 26,053 32,633
Rice Paddy
Rice Husk Solid 165,714 Medium Pressure Steam Turbine
5,362 - 3,973 3,973
Sugar Bagasse Solid 19,789 Medium Pressure Steam Turbine
3,034 - 2,250 2,250
Total theoretical electricity generation output
328,332 GWh/year
= 328
TWh/year
Total technical electricity generation output
43,211 GWh/year
= 43
TWh/year
Total CO2 Emission Reduction (ER) Potential
38,856,000 tCO2e/year
= 0.039 Giga tCO2e/year

21
CHAPTER VII: ECONOMIC POTENTIAL
The economic potential will be evaluated for POME, EFB/Shell/fiber co-firing and rice husk power plants.
This overview study will concentrate on the lowest hanging fruits, therefore this section will evaluate the
immediate economic potential and the repeatability of pilot projects. The sugar industry will not be
covered in this section as first, the electricity generation potential is much lower than in the other
industries and second, the industry structure being predominantly government-owned does not favors
private investment into energy projects.
7.1 RICE INDUSTRY
Rice mill owner could utilize their production residue to supply electricity to PLN under the feed-in tariff
scheme. Rice straw is not yet considered economically attractive due to its emergence in the rice fields
and not concentrated in the mills. Hence, only solid biomass from rice husk should be taken into account
for economic consideration of biomass power plant from rice industry.
Currently the feed-in tariff for biomass plants selling their electricity to PLN is 975 IDR/kWh in Java and
Bali (ESDM, 2012), the islands the technical potential is based on.
Beside income from electricity generation, rice mill owners could generate additional income from selling
Rice Husk Ash (RHA). The combustion of rice husks will afford RHA or Silica which is a valuable resource
that can be marketed as a filler for the concrete industry, for heat insulation in the steel industry or as
filter material in other industries (Kwintkiewicz, 2013, p. 10). The sales of RHA can strongly improve project
economics. Rice husk that is not used internally reached a market price of around 130-150 IDR/kg in
November 2012 (Kwintkiewicz, 2013, p. 7)
The capacity of rice mills in Indonesia is very diverse. It ranges from 4 to 100 tons of paddy/day in small
family owned mills, up to more than 1,000 tonnes of paddy/day in corporate mills. The smaller mills are
in many cases not connected to the grid and feed their power demand with diesel generator, using 400-
450 litres of diesel/day. In these mills the application of rice husk for power generation could reduce diesel
consumption (Kwintkiewicz, 2013, p. 5ff). The only possibility for grid connection, is by in an external plant
buying the rice husk from surrounding mills and generating electricity which will be sold to PLN (Abinanto,
2013) (Kwintkiewicz, 2013).
The main barrier faced by project developers is the low bulk density of rice husk of 70-110 kg/m3. As the
feedstock needs to be transported, project economics will not only depend on the price of the feedstock
but also on the cost for diesel for transport (ANNIES Export NZ Ltd, 2012).
Therefore, rice husk power plants are considered a valuable opportunity for power generation but
considering the difficulty of securing sufficient feedstock supply, this industry is not considered the best
option.

22
7.2 PALM OIL INDUSTRY
As most POMs are already using parts of their biomass for captive power and heat generation, the
economic potential is based on the possibility to feed the generated electricity into the grid and generate
revenues from the sales to PLN. This option is determined by the distance of the mill from the medium
voltage grid27. In a study of the POMs located in North Sumatra (Indonesian Oil Palm Research Institute
(IOPRI), 2012), 21 POMs were assessed in detail28, of which 9 were located closer than 1 km to the medium
voltage grid, 1 is still located closer than 5 km to the grid and 8 POMs did not or could not provide any
information on this. 3 POMs are located more than 5 km away from the medium voltage grid. As became
apparent during interviews with different stakeholders of the IPP sector in Indonesia29, PLN might be open
for negotiations to bear the cost of grid connection of IPPs up to 3-5 km. Any plant that is located further
from the grid would need to provide the connection to the grid at own expenses which decreases project
economics drastically.
Another point of concern for the economics of using POM biomass for electricity generation is the size of
the mill. Assuming an on-site power plant that is only supplied by the biomass of the “parental” POM, this
POM should process at least 30 tons FFB/hour (Heidrich, 2013). The study in North Sumatra found out
that only 3 or 14% of the POMs have a capacity lower than 30 tons FFB/hour (Indonesian Oil Palm Research
Institute (IOPRI), 2012).
Shells, fibers and parts of EFB are already used for captive power generation (EKONID, 2011, p. 65). The
feedstock that is not used for this purpose is sold due to the high market prices especially for shells. These
opportunity cost have to be taken into account when assuming the economic potential. High demand
from other industries (domestic and international) caused rising prices from around 24 to 25 $ per ton in
2006 to around 50 to 60 $ per ton in 2011 for shells (German-Indonesian Chamber of Industry and
Commerce (EKONID), 2011, p. 65). 84% of the POMs in North Sumatra use 50% or more (each group 9
mills) of their shells for captive power generation and only 16 % (3 mills) use less than 50% of shells for
captive power (Indonesian Oil Palm Research Institute (IOPRI), 2012).
27 The low voltage grid is not relevant for feeding in electricity as soon as the plant is bigger than 100kW?! The electricity losses will be too high to be economically feasible. (Personal communication with Thomas Strobel & Alin Pratidina, GIZ, 2013) 28 In total GIZ found 107 POMs located in North Sumatra 29 RE Guidelines Peer Review Summary
Figure 5: Shares of land ownership of palm plantation (EKONID, 2011)
23
Irrespective of the demand for shells from outside the industry, using the full amount for electricity
generation could still be a more valuable option when the electricity is sold to PLN for the fixed FiT. An
assessment based on a GIZ site visit of a POM showed that under a system efficiency of 25% and a FiT of
975 IDR/kWh the economic value of shells would amount to 907 IDR/kg which is higher than the market
value of 700 IDR/kg at that time (Eichelbrönner, 2013)
Due to the large number of POM in Indonesia, which are predominantly privately owned, this industry
offers good opportunities for waste-to-energy project development. Furthermore, due to the location of
the majority of the POM in Sumatra, grid connection is relatively easy. A third factor, underlining the
suitability of the palm oil industry for grid-connected electricity generation is the security of feedstock
supply which is available as residue in the mills.
24
BIBLIOGRAPHY
Abinanto. (2013, October 18). RE Guidelines Peer Review.
ANNIES Export NZ Ltd. (2012). Identification of Potential Pilot Projects for Waste to Energy in Indonesia's
Agroindustry. Jakarta: GIZ.
Badan Pusat Statistik. (2013, October 31). Retrieved December 3, 2013, from
http://www.bps.go.id/eng/tab_sub/view.php?kat=3&tabel=1&daftar=1&id_subyek=54¬ab=
2
Badan Pusat Statistik. (2013). Food Crops. Retrieved December 3, 2013, from
http://www.bps.go.id/eng/tnmn_pgn.php?kat=3
Badan Pusat Statistik. (2013). Plantation. Retrieved December 3, 2013, from
http://www.bps.go.id/eng/menutab.php?kat=3&tabel=1&id_subyek=54
Biomass Energy Centre. (n.d.). Retrieved 2014, from
http://www.biomassenergycentre.org.uk/portal/page?_pageid=75,41182&_dad=portal&_sche
ma=PORTAL
Directorate General of Estate. (n.d.). Sugar Cane Production by Province in Indonesia 2008-2012.
Retrieved January 16, 2014, from http://www.deptan.go.id/infoeksekutif/bun/BUN-
asem2012/Produksi-Tebu.pdf
Economics, I. I. (2012). Study of Renewable Energy Support Mechanisms for Bankable Project. Jakarta,
Indonesia.
Eichelbrönner, M. (2013). Visit Report "Palm Oil Mill" PLTU Listrindo Kencana - Bangka, Indonesia.
Jakarta: GIZ.
EKONID. (2011). Prospects for Biomass Energy Supply in Indonesia - "Waste to Energy Potential in Agro
Industry". Jakarta: German-Indonesian Chamber of Industry and Commerce (EKONID).
Emission Reduction Calculation for Budi Acid Jaya Tapioca Starch Factory (2011).
ESDM. (2012). Ministerial Regulation Number 04/2012 on the Electricity Purchase Price by PT PLN
(Persero) from Power Plants using Small and Medium Scale Renewable Energy or Excess Power.
Jakarta: Minister of Energy and Mineral Resources Republic of Indonesia.
FAOSTAT. (2013). Production - Crops. Retrieved December 3, 2013, from
http://faostat.fao.org/site/567/DesktopDefault.aspx?PageID=567#ancor
Gadde, B., Menke, C., & Wassmann, R. (2009). Rice straw as a renewable energy source in India,
Thailand, and the Philippines: Overall potential and limitations for energy contribution and
greenhouse gas mitigation. Biomass and Bioenergy, 33, 1532-1546.
German-Indonesian Chamber of Industry and Commerce (EKONID). (2011). Prospects for Biomass Energy
Supply in Indonesia - "Waste to Energy Potential in Agro Industry". Jakarta: EKONID.

25
Guerin, B. (2002). How the mighty Indonesian sugar industry fell. [Online]. Retrieved from Asia Times
online.
Hambali, E., Thahar, A., & Komarudin, A. (2010). The Potential of Oil Palm and Rice Biomass as Bioenergy
Feedstock. Jakarta.
Hasan, M., Mahlia, T., & Nur, H. (2012). A review on energy scenario and sustainable energy in
Indonesia. Renewable and Sustainable Energy Reviews(16), 2316-2328.
Heidrich, B. (2013, October 3). RE Guidelines Peer Review.
IEA. (2007). IEA Energy Technology Essentials: Biomass for Power Generation and CHP. Paris: OECD/IEA.
IFAD. (2010). Global Consultation on Cassava as a Potential Bioenergy Crop. Retrieved January 16, 2014,
from http://www.ifad.org/events/cassava/
Indonesia Investment. (n.d.). Indonesia-Investment: Rubber (Natural). Retrieved January 16, 2014, from
http://www.indonesia-investments.com/doing-business/commodities/rubber/item185
Indonesian Oil Palm Research Institute (IOPRI). (2012). Mapping of Palm Oil Mill Waste in North
Sumatra. Jakarta: GIZ.
Kwintkiewicz, C. (2013). Feasibility study for Power Generation in Rice Husk Mills in Indonesia. Jakarta:
Gesellschaft fuer internationale Zusammenarbeit (GIZ) GmbH .
NC State University. (n.d.). Extension Forestry. Retrieved January 16, 2014, from
http://www.ces.ncsu.edu/fore
NREL. (2013). Dynamic Maps, GIS Data & Analysis Tools. Retrieved December 6, 2013, from
http://www.nrel.gov/gis/re_potential.html
PLN. (2013). PLN Statistik. Jakarta: PLN.
Prastowo, B. (2011). Biomass Resource in Indonesia: Indonesia's Solid Biomass Energy Potential. 2011.
PT PLN. (2013, February 7). Power Supply Business Plan (RUPTL) PT PLN (Persero) 2012-2021. Jakarta: PT
PLN. Retrieved January 17, 2014, from http://energy-
indonesia.com/02electrcitylaw/0130213RUPTL.pdf
PT. Biogas Program International. (2013). Benchmarking Performance of Biogas Plants Utilizing Agro-
industry Waste in Indonesia. Jakarta: GIZ.
Rauch, R., & Schweinfurth, A. (2013). Wertschoepfung aus Biomasseabfaellen in Indonesien . Berlin:
Deutsche Gesellschaft fuer internationale Zusammenarbeit (GIZ) GmbH.
Resources, M. o. (2013). prokum.esdm.go.id. Retrieved February 26, 2014, from
http://prokum.esdm.go.id/Publikasi/Statistik/Statistik%20Listrik_2012.pdf
Titiresmi, A. M. (n.d.). Implementation of Anaerobic Process on Wastewater from Tapioca Starch
Industries. Serpong.
Widodo, T. W. (2007). Bio Energi Berbasis Jagung dan Pemanfaatan Limbahnya. Tangerang.

26
Winrock International. (1991). Diversification of Sugar and Palm Oil Industries: Indonesia - Part 1: Survey
of Energy and Product Investment Options. Arlington: USAID.
Yoon, L., Tomoko, I., & Sohei, S. (2011). System analysis for effective use of palm oil waste as energy
resources. Biomass and Bioenergy, 35, 2925-2935.
Yusoff, S. (2006). Renewable energy from palm oil - innovation on effective utilization of waste. Journal
of Cleaner Production, 14, 87-93.

27
ANNEX
ANNEX A: MASS BALANCE OF PALM OIL EXTRACTS AND RESIDUES
Source: (Hambali, Thahar, & Komarudin, 2010)
ANNEX B: INDONESIA SUGAR CANE PRODUCTION IN THE PAST FIVE YEARS
Sugar cane production per calendar year (ton/year)
2003 2008 2009 2010 2011 2012 24,500,000 25,600,000 26,400,000 26,600,000 24,000,000 26,341,600
Source: (FAOSTAT, 2013)

28
ANNEX C: BIOMASS CONVERSION PATHS
Source: (IEA, 2007)
ANNEX D: MAP OF PALM OIL MILLS IN INDONESIA
Source: (ANNIES Export NZ Ltd, 2012)
29
ANNEX E: PERCENTAGE OF PADDY PRODUCTION PER ISLANDS
Source: Ministry of Agriculture, 2013
ANNEX F: MAP OF SUGAR CANE MILLS IN INDONESIA
Source: (ANNIES Export NZ Ltd, 2012)
24%
54%
7%
11% 4%0%
Percentage
Sumatera Java-Bali Kalimantan
Sulawesi Small Islands Papua

Renewable Energy Program Indonesia/ASEANPromotion of Least Cost Renewables in Indonesia (LCORE-INDO)Directorate General for New and Renewable Energy and Energy Conservation (DG NREEEC), 5th Floor Ministry of Energy and Mineral ResourcesJl. Pegangsaan Timur No.1A, CikiniJakarta10320 Indonesia T +6221-8309438 F +6221-8309032 I www.giz.de www.lcore-indonesia.or.id
‘This project is part of the International Climate Initiative (IKI). The German Federal Ministry for the Environment, Nature Conservation, Building and Nuclear Safety (BMUB) supports this initiative on the basis of a decision adopted by the German Bundestag.’