Embed Size (px)
Citation preview
CHAPTER V
CRITERIA FOR INVESTMENT DECISIONS A N D
RISK MANAGEMENT
Though it is acknowledged to be risky, investing in corporate
securities is now considered to be one of the generally accepted options
of savings management. A large chunk of the savings of the country
finds its way to the stock: markets. Investment in corporate securities
offers income in the form of dividend and interest along with capital
appreciation. Judiciously made investment in shares offers liquidity
also. Investing, however, entails risks, but it can be moderated by
rational and prudent investment decisions. Risk management has
become imperative for investment management. In India, the current
gloomy corporate scenario and the extremely volatile capital markets
have brought risk management to the core of investment decisions.
The more astute and clever investors can take the right investment
decisions to produce the extra reward. In this chapter, an attempt is
made to analyse the criteria for investment decisions and how they are
helpful in countering and reducing risks.
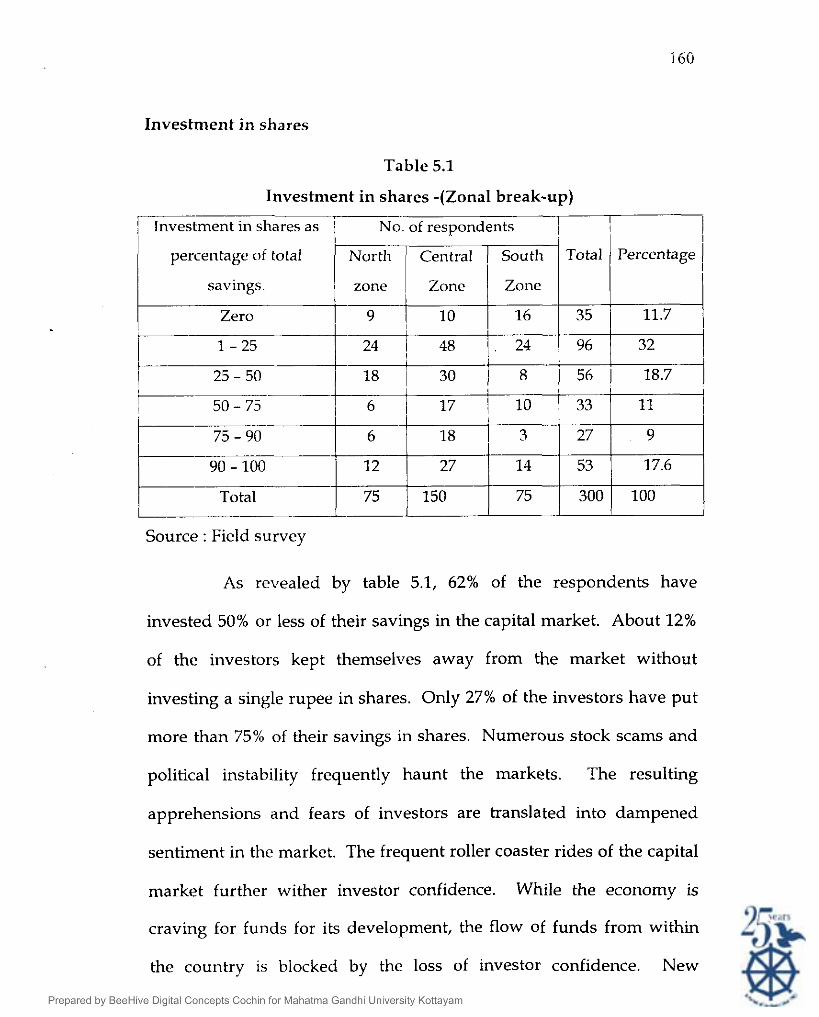
Investment in shares
Table 5.1
Source : Field survey
Investment in shares -(Zonal break-up)
Investment in shares as r No of respondents I/ I
As revealed by table 5.1, 62% of the respondents have
percentage of total
savlngs zone Zone Zone
Zero 9 10 16 35
1 - 25 24 24 96
invested 50% or less of their savings in the capital market. About 12%
Percentage
11.7
32
of the investors kept themselves away from the market without
investing a single rupee in shares. Only 27% of the investors have put
25 - 50 56 j 18.7
more than 75% of their savings in shares. Numerous stock scams and
50 - 75
75 - YO 18 3 27
YO - 100 14 53
Total 150 75 300
political instability frequently haunt the markets. The resulting
11
9
17.6
100
apprehensions and fears of investors are translated into dampened
sentiment in the market. The frequent roller coaster rides of the capital
market further wither investor confidence. While the economy is
craving for funds for its development, the flow of funds from within
the country is blocked by the loss of investor confidence. New
measures are required to improve integrity of the market, enhance its
safety and build investor confidence.
Experience of investors in stock market operations
Experience is of great value, which influences the investment
decisions. Correlation is worked out to find out the relation between
experience of investors and their investment in shares.
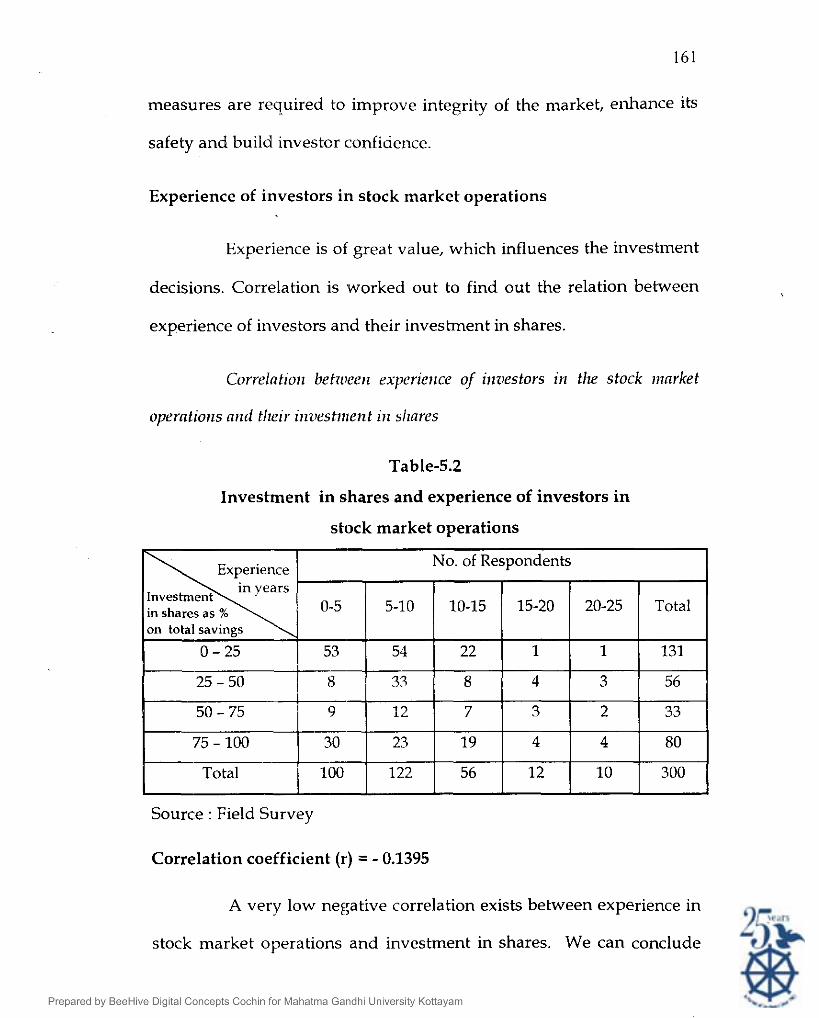
Correlntioll betrcreerz experieilce of inzrestors in the stock iilnrket
operntiorzs nild tlzeir ii~oestnrent ill sl~ares
Table-5.2
Investment in shares and experience of investors in
stock market operations
Source : Field Survey
Correlation coefficient (r) = - 0.1395
A very low negative correlation exists between experience in
stock market operations and investment in shares. We can conclude
that increase in experience will not bring additional investment in
shares. That is, the Indian Capital Market is not providing sufficient
support, encouragement and safety to the investors. The experienced
investors are wary of locking up their savings in the stock market.
Investment in Primary Market and Secondary Market
Primary market is the new issues market (NIM), which helps
the corporate sector to raise funds for their new projects, expansions,
modernisation, etc. The NIM deals with new securities, that is
securities, which are offered to the public for the first time. The
secondary market on the other hand, is a market for old securities, that
is, those, which have already been issued and have been granted stock
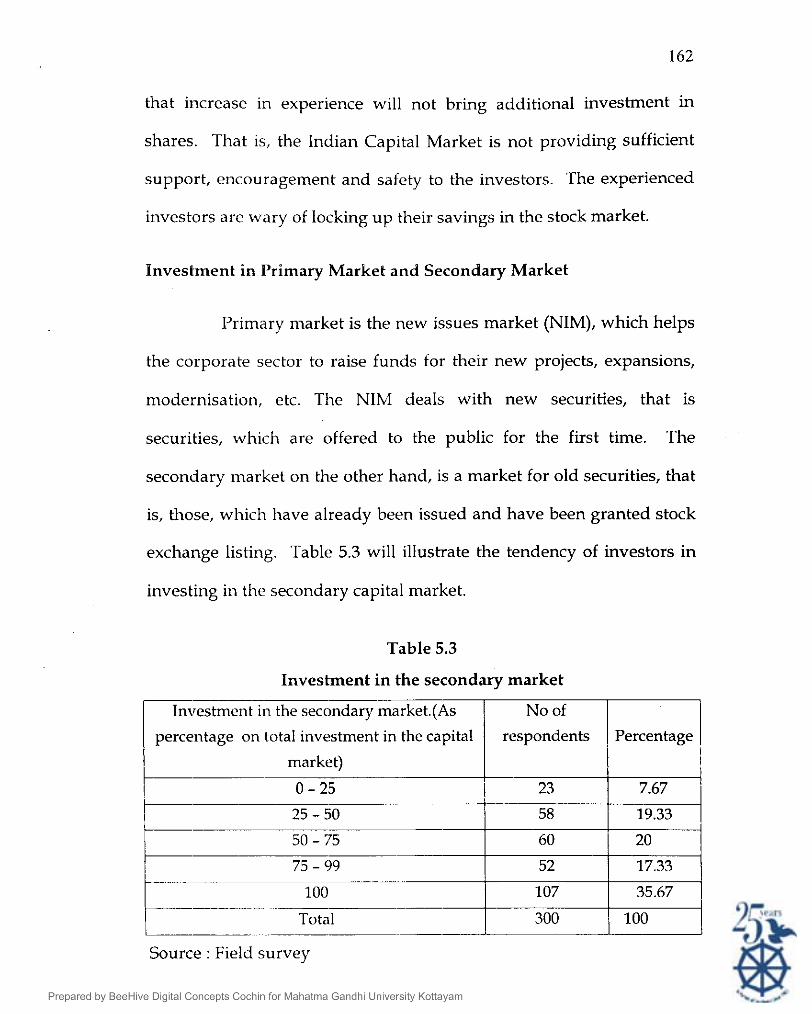
exchange listing. Table 5.3 will illustrate the tendency of investors in
investing in the secondary capital market.
Table 5.3
Source : Field survey
Investment in the secondary market
Investment in the secondary market.(As
percentage on total investment in the capital r market) + No of
respondents Percentage I I
I 0 - 25 1 23 I-P 25 - 5 0 I I 58
7.67
19.33
Seventy three per cent of the investors have directed the major
part (more than 50%) of their inveslent into the secondary market.
This explains their preference to operate in the secondary market rather
than applying for new issues. About 36% of the investors make no
investment in the primary market, as their entire investment is in the
secondary market. This reflects the fading confidence of investors in the
primary market. According to capital market analysts the primary
market is dead. The cause for the debacle is attributable to the low
quality of 1.P.Os (Initial Public Offers) that swamped the capital market
and the unscrupulous promoters who duped the investors by telling
great stories about companies. In the 100 largest issues between 1992
and 1996, 72% of the amount has been lost.' The issue really is of
investors' confidence, which is totally shaken. These days very few
1.P.Os are coming up in the market. These show that immediate
measures are to be taken to review the market.
Debt beats equity in the primaries
Investor interest in equity issues is waning. The trend is
reflected in substantially higher mobilization of funds through debt
issues compared to equity issues during the past few years.
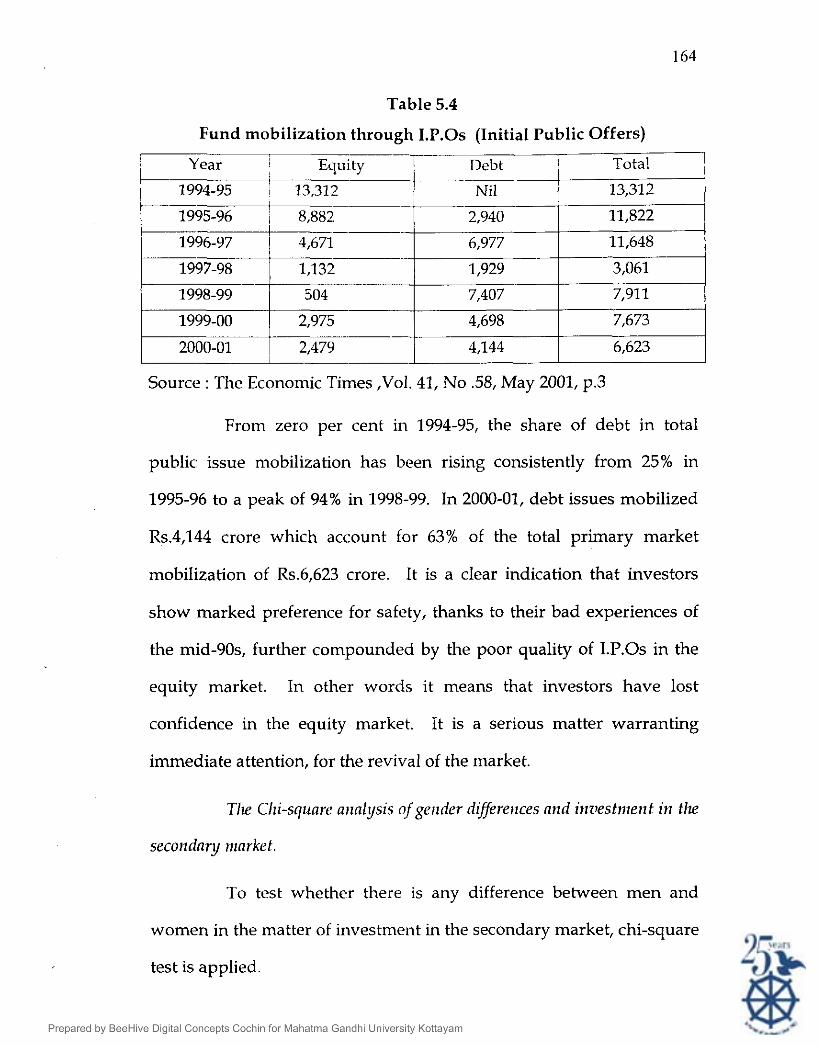
Table 5.4
Fund mobilization through 1.P.Os (Initial Public Offers)
Equity I Debt I Tota! I
1 1994-95 I 13,31Fp ! Nil I 13,312 1
Source : The Economic Times ,Vol. 41, No .58, May 2001, p.3
From zero per cent in 1994-95, the share of debt in total
public issue mobilization has been rising consistently from 25% in
1995-96 to a peak of 94% in 1998-99. In 2000-01, debt issues mobilized
Rs.4,144 crore which account for 63% of the total primary market
mobilization of Rs.6,623 crore. It is a clear indication that investors
show marked preference for safety, thanks to their bad experiences of
the mid-90s, further compounded by the poor quality of I.P.Os in the
equity market. In other words it means that investors have lost
confidence in the equity market. It is a serious matter warranting
immediate attention, for the revival of the market.
Tlle Chi-square arlnlysis ofgerlder diflerences and inz~estnzent in the
secorldary nlnrket.
To test whether there is any difference between men and
women in the matter of investment in the secondary market, chi-square
test is applied.
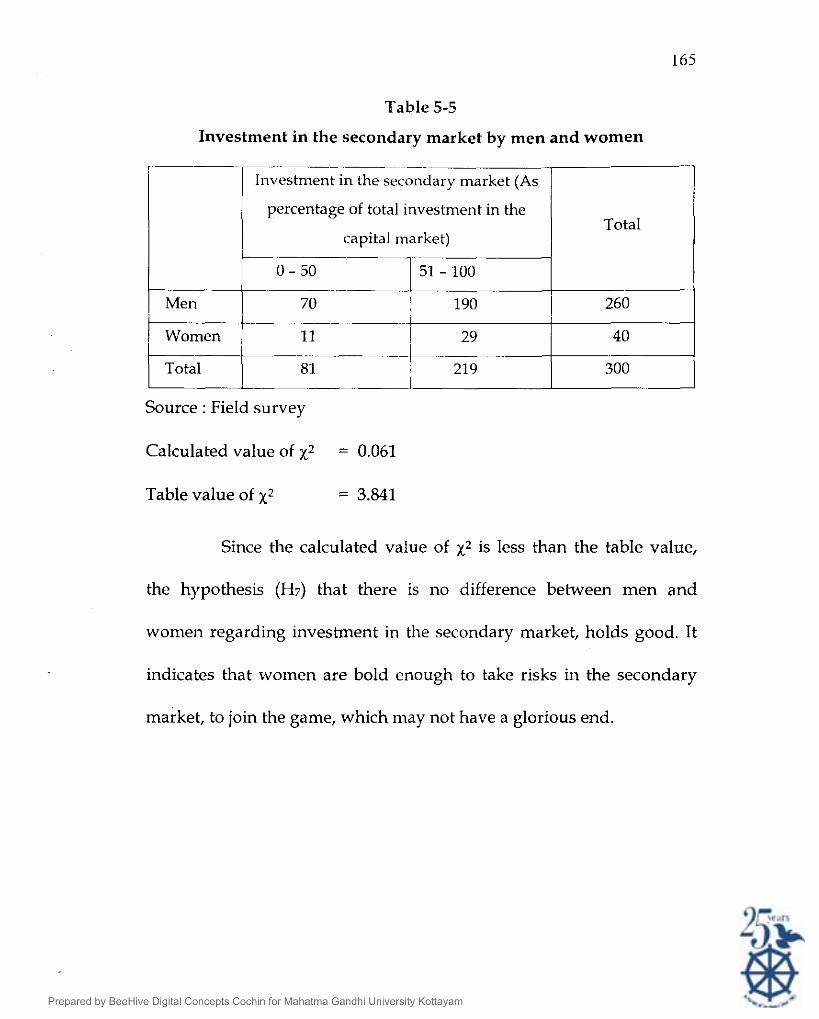
Table 5-5
Investment in the secondary market by men and women
in the secondary market (As
Source : Field survey
1 percentage of total investment in the
capital market)
51 - 100
190
k m e n I 29
21 9
Calculated value of ~2 = 0.061
Total
260
40
300
Table value of ~2 = 3.841
Since the calculated value of ~2 is less than the table value,
the hypothesis (H7) that there is no difference between men and
women regarding investment in the secondary market, holds good. It
indicates that women are bold enough to take risks in the secondary
market, to join the game, which may not have a glorious end.
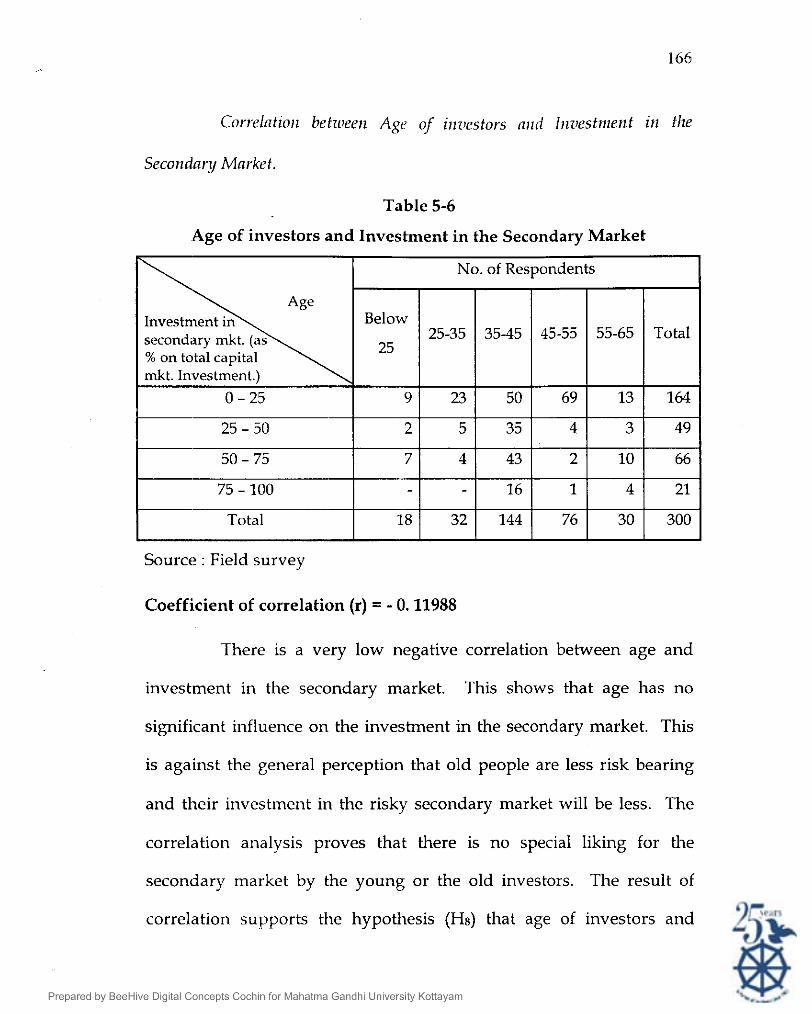
Correlcltioil betroeen Age of illriestors nrrd Inziestnlent in the
Secorzdanj Market.
Table 5-6
Age of investors and Investment in the Secondary Market
Source : Field survey
Coefficient of correlation (r) = - 0.11988
I I I I I I I
There is a very low negative correlation between age and
investment in the secondary market. This shows that age has no
significant influence on the investment in the secondary market. This
is against the general perception that old people are less risk bearing
and their investment in the risky secondary market will be less. The
correlation analysis proves that there is no special liking for the
secondary market by the young or the old investors. The result of
correlation supports the hypothesis (Hs) that age of investors and
Total 30 18 300 32 144 76
investment in the secondary market are independent. Hence the
hypothesis H8 holds good
Attractions of the stock market
Table 5.7
Source : Field survey
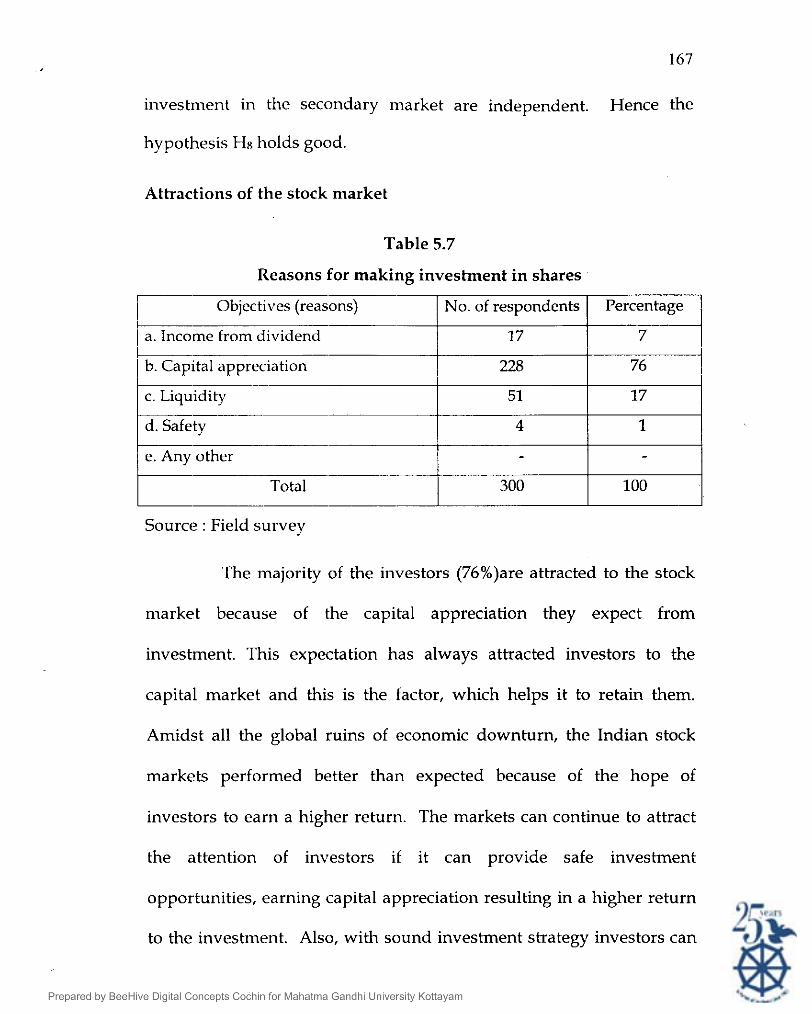
Reasons for making investment in shares
The majority of the investors (76%)are attracted to the stock
market because of the capital appreciation they expect from
investment. This expectation has always attracted investors to the
capital market and this IS the factor, which helps it to retain them.
Amidst all the global ruins of economic downturn, the Indian stock
markets performed better than expected because of the hope of
investors to earn a higher return. The markets can continue to attract
the attention of investors if it can provide safe investment
opportunities, earning capital appreciation resulting in a higher return
to the investment. Also, with sound investment strategy investors can
Percentage
7
76
17
1
-
100
-- Objectives (reasons)
- a. Income from dividend
-- b. Capital appreciation
c. Liquidity -
d. Safety -
e. Any other -
Total
No. of respondents
17
228
51
4
- 300
earn higher returns for which thev need to spend considerable time
and hard work. If the market fails in fulfilling this expectation held by
76% of the investors, they will shy away from the market.
Liquidity of shares attracts 17% of investors to make
investment in shares. Shares are assumed to be liquid assets. But there
are less liquid shares in the market, which are inactive and transacted
rarely because there are no buyers for them. Investors should be cautious
not to get stuck with an investment, which they can't offload at will.
As per table 5.7, only 7% of the investors consider dividend
from shares as their main objective of investment. In the capital
market, most of the investors do not consider dividend as a major
source of income. Safety is the major objective of investment only for
one percent of the investors.
While making investment, capital appreciation becomes the
most important objective while other factors like safety etc. are least
considered. It is a clear indication that the investors are ready to take
risks to a great extent to attain the main objective of capital
appreciation.
Deciding Factors of Investment Decisions
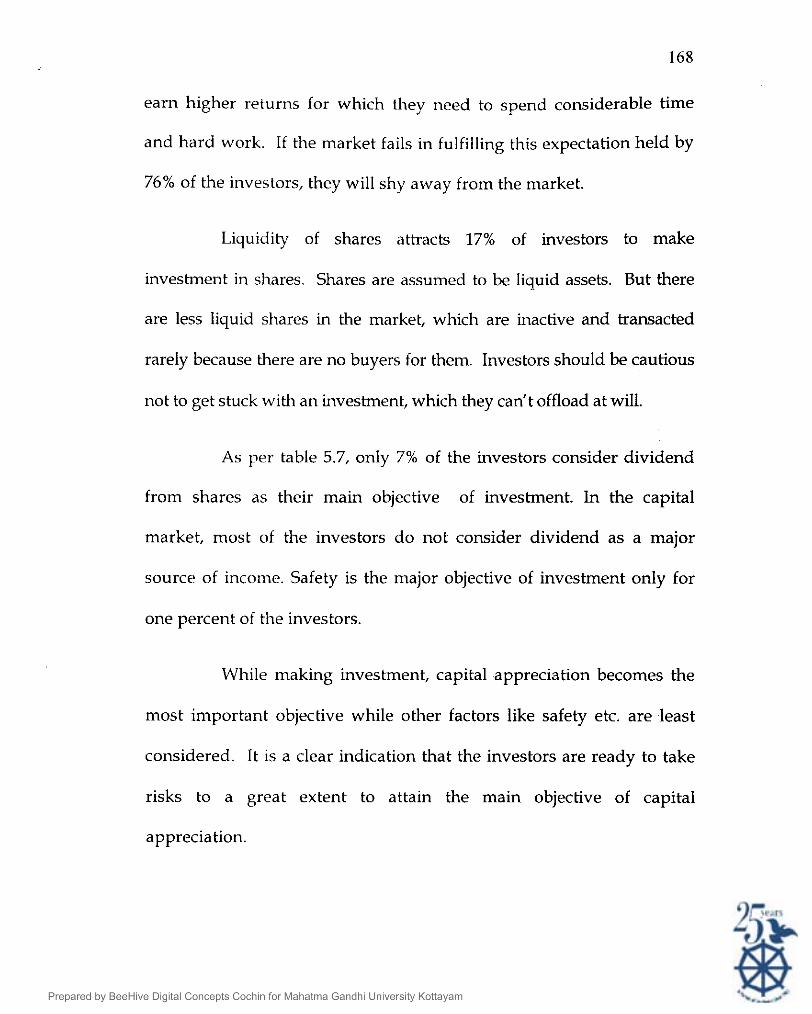
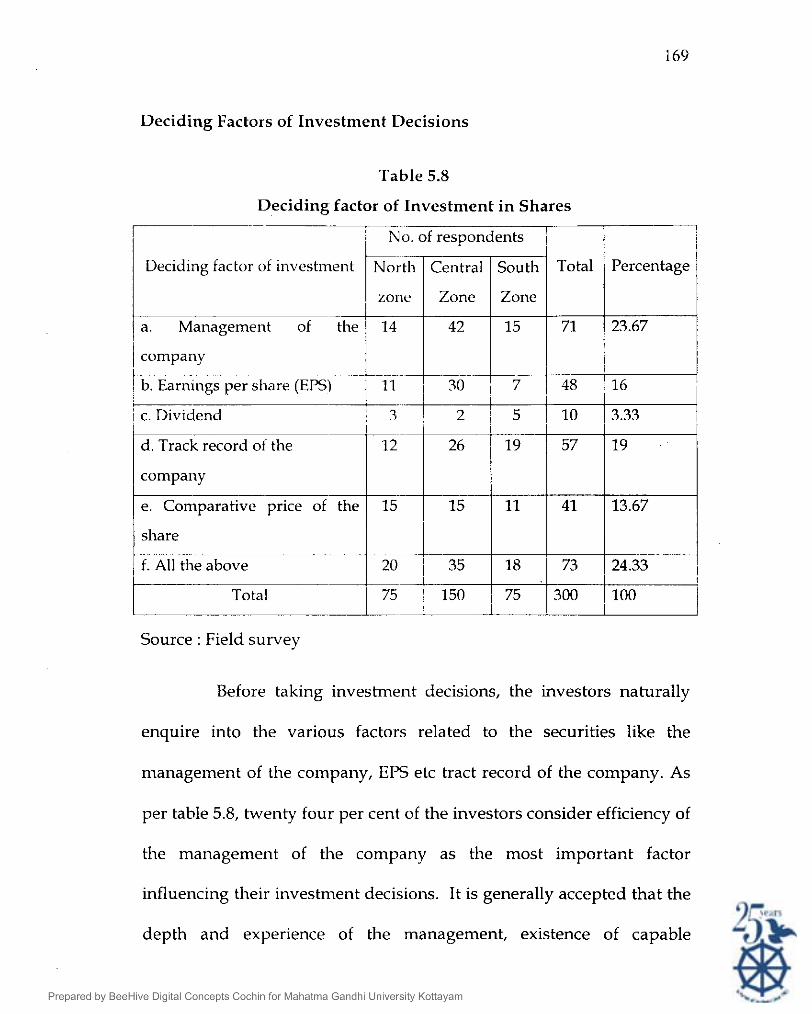
Table 5.8
Deciding factor of Investment in Shares
Source : Field survey
Before taking investment decisions, the investors naturally
enquire into the various factors related to the securities like the
I
Total
71
48
10
57
41
73
300
-- .- --' .-
i No. of respondents I
I
management of the company, EPS etc tract record of the company. As
Deciding factor of investment
- a. Management of the
Percentage
23.67
16
3.33
19
13.67
24.33
per table 5.8, twenty four per cent of the investors consider efficiency of
i
I
the management of the company as the most important factor
100 i
N ~ F G I zone
14
influencing their investment decisions. It is generally accepted that the
company
b. Earnings per share (EPS) 11 1 30 i 7
depth and experience of the management, existence of capable
Central
Zone
42
I
c. Dividend 3
d. Track record of the f company
e. Comparative price o f h e
I share -
f. All the above
Total 1 75
South
Zone
15
I
2 1 5
26
15
35
19
11
18
150 1 75
managerial personnel and their ability to react effectively to changes
- all these affect a firm's risks and its future income. Being aware of
these, investors look at efficiency of management as the most
important deciding factor of investment. Table 5.8 shows that 19%
investors are influenced by track record of the company in making
their investment decision. For 16% of the investors, earning per share is
the most important deciding factor. All these factors together are taken
into account by 24% of' the investors while making investment
decisions. It is interesting to note that dividend is the deciding factor of
the investment only for 3% of the investors.
Table 5.8 explains that investment decision is influenced by
management of the company, E.P.S, dividend, track record of the
company, price of the share etc. But the question whether these
deciding factors are in turn influenced by the experience of investors in
the stock market operations is to be answered. An effort is made to find
out the deciding factor preferred by the experienced investors and the
freshers to the market and whether with experience the preference for
a particular deciding factor increases or decreases. Hence correlation
has been worked out to find out to what extent these deciding factors
are related to the experience of investors in the stock market.
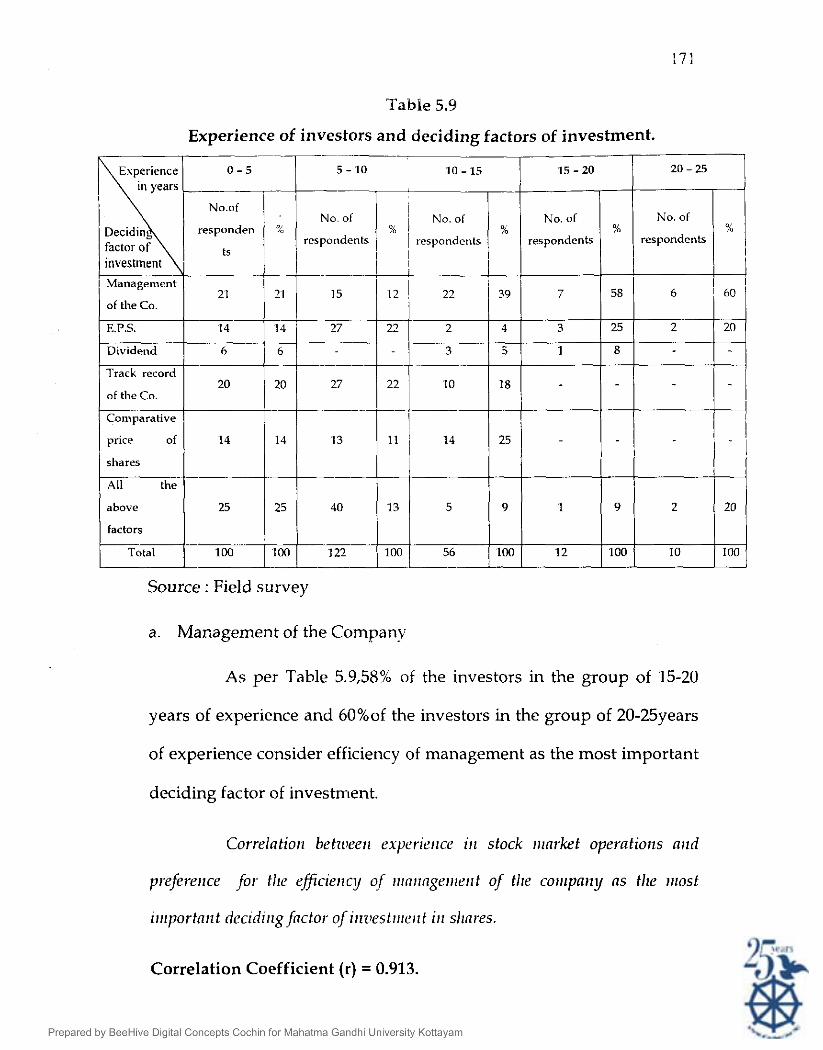
Table 5.9
Source : Field survey
Experience of investors and deciding factors of investment.
responden %
I Management
of the Co.
E.P.S.
Dividend
Track record
of the Co.
Con~parative
price of
shares
All the
a. Management of the Company
above
factors
Total
As per Table 5.9,58% of the investors in the group of 15-20
years of experience and 6O%of the investors in the group of 20-25years
25
1W
of experience consider efficiency of management as the most important
deciding factor of investment.
25
I W
Correlntiorl bekueerl experier~ce I stock rrrnrket operatiorzs nrtd
prefererlce for tlre eficierlcy of rrinringerr~erlt of the corriparly ns the lrlost
40 1 1 3 1 :6 1 9 1 1 1 9 1 ,20 1 2 0 1 122 100 100 12 100 100
Correlation Coefficient (r) = 0.913.
There is almost a perfect positive correlation between
experience and the preference for efficiency of management as the
deciding factor of investment. It proves that those who are experienced
in the stock market operations consider efficiency of management of the
company as a very important factor and with experience, the preference
for this factor increases. This is based on the common belief that the
success of business houses depends on their management and the
business will flourish forever if it is well managed.
b. Earning per share
Correlntion betroeeiz experierzce iiz stock iirnrket operatioizs ntzd the
likiizgfbr the use 0fE.P.S as the factor for ilzuestilzeilt decisiolzs.
Correlation coefficient (r) = 0.286.
A low positive correlation exists between experience in stock
market operations and the preference for E.P.S. as the basis for
investment decision. Thls shows that the experienced investors are
either not aware of the usefulness of E.P.S. for investment decisions or,
are not interested in collecting information related to different
companies for the calculation of E.P.S. But investing requires patience
and hard work to make it successful. As per table 5.9, 25% of the
investors in the group of 15-20yrs experience, prefer E.P.S, as their
deciding factor of investment. It indicates that, even though the liking
for E.I'.S. as the basic factor of investment decisions is not increasing
with experience, it is a widely used investment ratio ,which gives
earnings of a company on a per share basis.
c. Dividend from shares
There are investors who buy shares with the objective of
earning a regular income. Their primary concern is with the
dividends. For such investors dividends play a crucial role in their
investment decisions.
Companies that declare high dividends play a crucial role in
their investment decisions.
Generally, companies that declare high dividends not only
have a poor growth record but also poor growth prospects in the
future. If the bulk of the profits are distributed in the form of
dividends, there may not be any ploughing back of profits for
financing future growth. So growth companies may have a poor
dividend record but their shares are less risky. The investors have to
verify that the declaration of dividend by a company is after setting
apart enough amounts for growth purposes.
Corlrlntioit betroeerz Experience ill Stock Mnrket operntiolzs nild
diz1iderld orz slrnres ns n deciding factor ofii~z~estrizerzt.
Correlation coefficient (r) = - 0.176
There is only a very low negative correlation between
experience and dividend on shares as a deciding factor. Investors from
experience realize that the companies which offer good investment
opportunities have poor dividend records: And with increase in
experience, there is no inc:rease in the application of dividend factor as
a criterion in investment decisions.
d. Track record of the company.
One way to find out whether a company is good or bad is to
look at its past performance. Looking at its track record one can find out
how the company coped with adverse business conditions and whether
the company's management is sufficiently dynamic to warrant
investment.
Correlntion bet~ileen experience of investors in stock market and the
prefereitcefor 'track record ofcon~paities' as basisfor decision making.
Coefficient of correlation (r) = - 0.888.
A very significant negative correlation exists between the
experience of investors and their preference for track record as the
most important factor for investment decision. The track record of
companies is very often traced by the investors who are fresh to the
market. But for experienced investors rather than past records the
future prospects of the company are more important.
e. Price of the shares
Investors can look at various parameters like corporate
fundamentals, commodity prices for commodity based sectors, the
demand and supply situation for secondary or supplier industries and
the economic indicators for the core sectors. But, in a reasonably
efficient market, we believe that, all these filter into the stock price,
which is the reflection of all these. As per table 5.9 twenty-five percent
of the investors in the group having an experience of 10-15 years
consider price of the share as their basic decision making factor.
Correlntior~ bet7oeerl experierlce ofinziestors in the stock nzarket and
prefer~rlce for- 'price' as tlru iilost riilportni~t factor irlflllencing decision on
iirz~estrirei~t iir slrnres.
Correlation coefficient (r) = - 0.588.
The result shows that there is a high negative correlation
between the experience of investors and the preference for 'price' as the
most important deciding factor of investment. The experienced
investors do not find 'price' as a reliable basis for investment decision.
The very premise that stock prices are linked to performance is under
threat. Again, it is a clear indication that our markets are not that
efficient to enable the price to reflect the corporate performance. From
experience investors have realized that, instead of merely comparing the
prices of securities, they should find out whether the price of a share is a
real reflection of the earning capacity and future prospects of the issuer.
f . Considering ail the five factors for investment decisions.
Table 5.8 shows that 24% of the investors consider all these 5
factors (Management of the company, Earnings per share, Dividend,
Track record of the company and Price) together for taking an
investment decision. It is very encouraging as a decision taken based
on all these factors together will naturally be a better one.
Correlntior~ bet7~ee11 experience of itlaestors it1 the stock tliarket and
the preferellcefor. 011 tlzc 5fnctors fog~'t1ler ns hasisfor i~lz~estlilent decisioil.
Correlation coefficient (r) = - 0.5173.
There exists a high negative correlation between experience
and use of all the five factors together for investment decisions. It
indicates that the freshers to the capital market are more interested in
looking at all the factors in tandem for making an investment decision.
With experience, the investors seem to give primary importance to a
single factor.
Type of shares selected by investors
The primary concern of most investors, while investing in
shares is to minimize risk and to maximize return. Their effort in this
venture is reflected in the type of share they select for making
investment. They judge the shares by looking at the volatility, the
income that will be earned or growth prospects. The result of the
response of the respondents to a question as to what type of share they
will choose for investment is disclosed in Table 5.10.
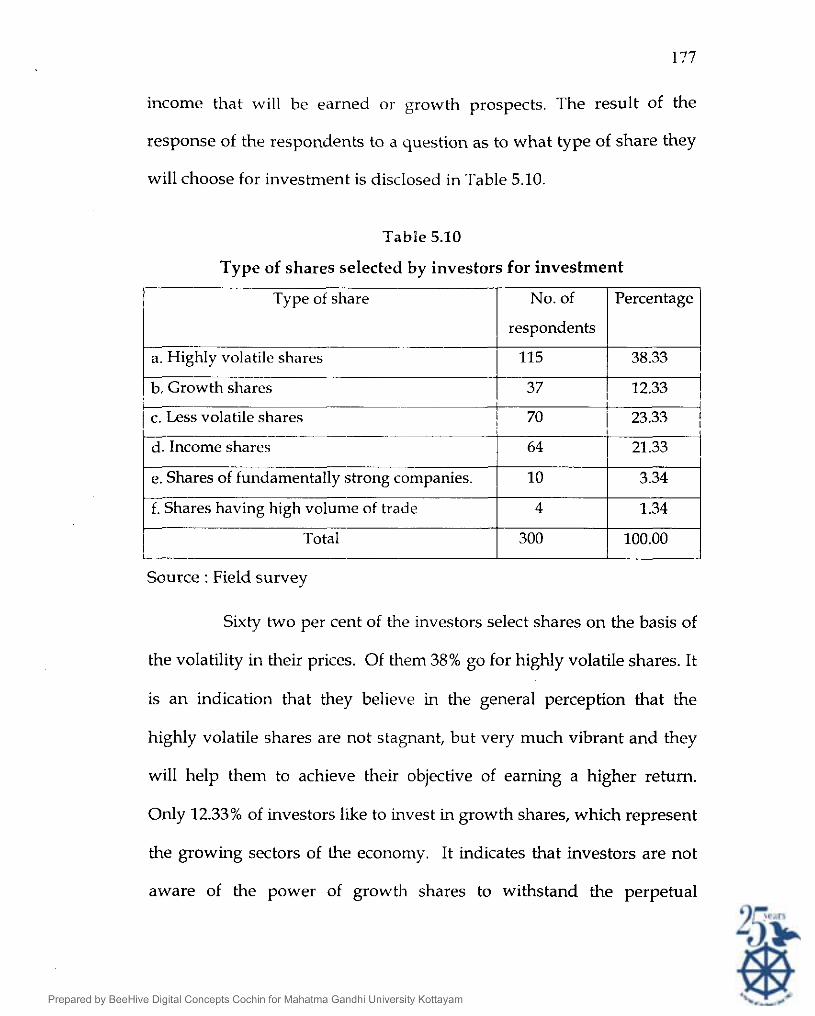
Table 5.10
respondents
a. Highly volatile shares
Type of shares selected by investors for investment
Type of share No. of
t I
~ o t a l I
300 100.00 -
Source : Field survey
Percentage
I I
Sixty two per cent of the investors select shares on the basis of
- b, Growth shares
the volatility in their prices. Of them 38% go for highly volatile shares. It
37 I
is an indication that they believe in the general perception that the
1 12.33 1 -- - c. Less volatile shares 70 1 23.33 1 -- d. Income shares 21.33
- e. Shares of fundamentally strong companies. -- f. Shares having high volume of trade
highly volatile shares are not stagnant, but very much vibrant and they
will help them to achieve their objective of earning a higher return.
Only 12.33% of investors like to invest in growth shares, which represent
the growing sectors of the economy. It indicates that investors are not
aware of the power of growth shares to withstand the perpetual
pressures of depression. Twenty one percent of investors select income
shares as they expect a regular income from their investment.
The selection of shares of fundamentally strong companies
and shares having high volume of trade is by 3. 34% and 1. 34% of the
investors respectively. High volume of trade and fundamentals of a
company are not influencing the investors in Kerala. It is found that
shares of companies having strong fundamentals are capable of
withstanding crises in the stock market. However, the investors have
not realised this factor.
In order to avert risk, the type of share selected by the
beginners in the field of stock market may be different from that of
experienced investors. An effort is made to provide an insight into the
management of risks by experienced and inexperienced investors by
selecting a particular type of share. To achieve that purpose, the
correlation is worked out between experience of investors and the type
of shares selected for investment.

Experience of investors in stock market operations and the type of
shares they prefer to buy.
10-15 15 - 20 20 - 25
No. of NO. o i % NO. of
respondents respondents respondents respondents shares 1. Highly I
26 46 6 50 - 3
25
volatile shares
12 17 5
27 25 2 17 1 10
16 16 10 18 shares
fundamentally 8 6 1 2 1
strong
ror~~panies
I - j trade
I
I -
100 56 100 12 100 10
Source: Field survey
i. Highly volatile shares
As per Table 5.11, 46% of the investors in the group of 10-15
years experience, and 50% of the investors in the group of 15-20 years
of experience prefer to buy highly volatile shares.
Corwlntior~ betrorer~ csjx,r.ie~ice ill stock irlarket operatiotls arid
selectio~i of lliglzly iiolntile slu-rres.
Correlation coefficient (r) = - 0.1456
The correlation is pretty weak which proves that with
increase in experience, there is no corresponding increase or decrease
in the preference for highly volatile shares. From experience, the
investors learn that highly volatile shares are the worst hit when there
is a downturn in the market.
ii. Growth Shares
Growth shares are of such companies, which have a
comparatively higher growth rate than other companies. A growth
company will have a proven record of growth in the past and is likely
to grow in the future also It will have a dynamic and growth-oriented
management. Table 5.11 shows that25% of the investors in the group of
15-20 years of experience like to buy growth shares.
Correlatiorl behoee~l experie~tce I stock 111arket operntiot~s alzd
selectiorz of gro7utli sllnres for iriz~estrriei~t.
Correlation coefficient (r) = - 0.229.
The result shows a low negative correlation between
experience in stock market operations and the selection of growth
shares. Even though growth companies provide excellent investment
opportunities, the result of analysis proves that the experience and
gaining of knowledge do not increase the tendency to buy growth
shares
iii Less Volatile Shares
Correlatiorl betrueerz esperzerzce in share innrket operations nnd t l z
teizdeilcij to buy less z~olntile shares by tlze iizz~esfor.~
Correlation coefficient (r) = - 0.8862
A high degree of negative correlation exists between
experience of investors in share market operations and their preference
for less volatile shares. It is a fact that there is no scope for speculation
in the case of less volatile shares. The result of correlation is indicative
of the general perception that with increase in experience, people tend
to speculate in stocks. Ilence the result supports the hypothesis. (H9)
that with increase in experience people tend to speculate.
iv Income shares
Many investors are keen on receiving a regular income in the
form of dividends. But, on declaring higher dividends, the ploughing
back of profits is constrained and it affects the growth prospects of the
company. So high dividend usually means low capital appreciation.

Correlntioil heizoeerl t/re exyerierlce of irlziestors in the stock iiiarket
nrzd the nppetitefor iiicorrle slrnres
Correlation coefficient (r) = 0.213.
The result of correlation analysis shows that the correlation
between experience of investors and the appetite for income shares is
very low. It is an indication that the investors, from experience come to
know that the declaration of a higher dividend will not have a
permanent impact on capital appreciation which is their main objective
for investment.
Diversion of Funds from the Stock Market
Funds are diverted from the stock market to other avenues of
investment due to many reasons. Data has been analysed to find out to
what extent the diversion of funds from the stock market has taken
place, the reasons for this diversion, and whether the objectives of
investment, type of share selected etc. have any influence on the
diversion of funds from the stock market.
Diversion of funds is a serious problem afflicting the capital
market, which is revealed in table 5.12.
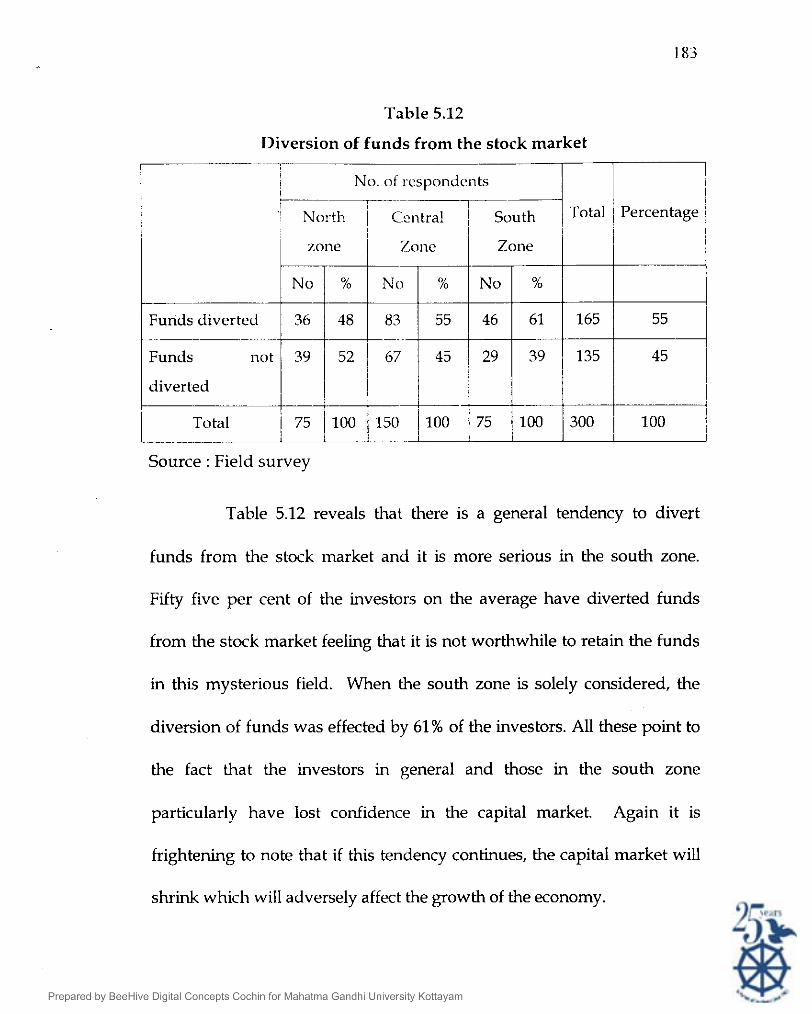
Table 5.12
Diversion of funds from the stock market 7-- - ~
I ! I ! No. o f respondents I I
Zone Zone
No % No '% -
Funds diverted 83 55 46 61 165 55 ..
52 67 45 29 39 135 45
diverted
100 / I 1 I
Source : Field survey
Table 5.12 reveals that there is a general tendency to divert
funds from the stock market and it is more serious in the south zone.
Fifty five per cent of the investors on the average have diverted funds
from the stock market feeling that it is not worthwhile to retain the funds
in this mysterious field. When the south zone is solely considered, the
diversion of funds was effected by 61% of the investors. All these point to
the fact that the investors in general and those in the south zone
particularly have lost confidence in the capital market. Again it is
frightening to note that if this tendency continues, the capital market will
shrink which will adversely affect the growth of the economy.
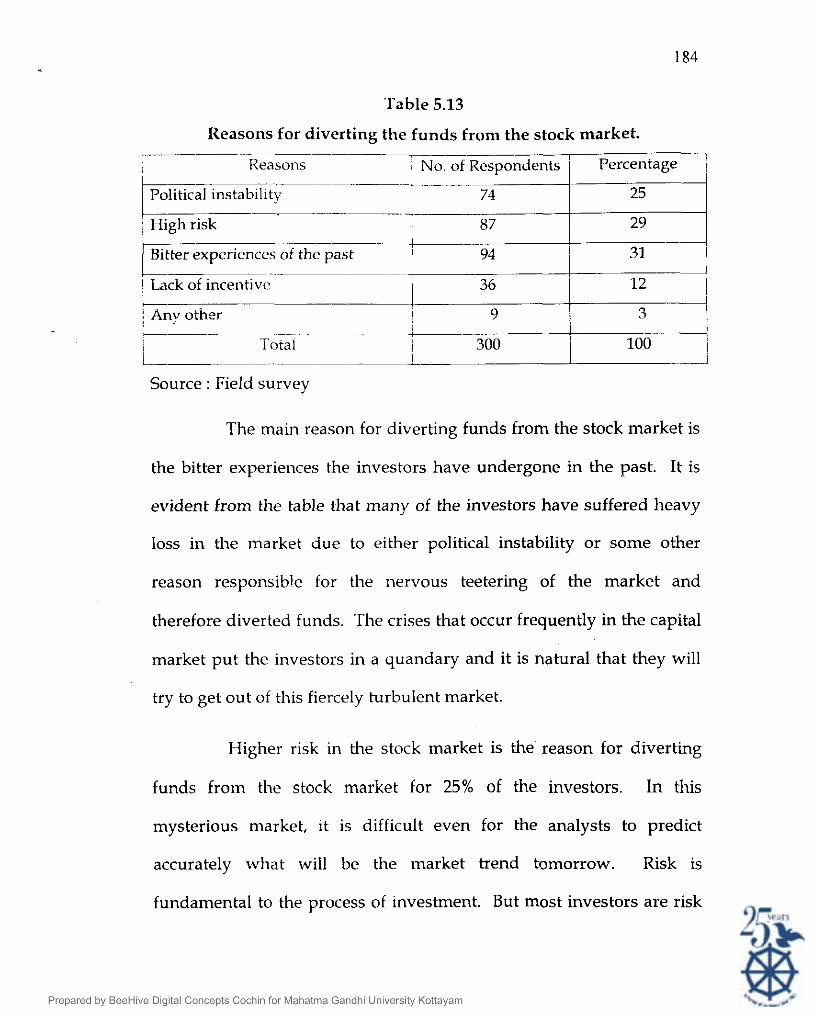
Table 5.13
Reasons for diverting the funds from the stock market. 7- -- --- I Reasons I N o of Respondents / Percentage i
I
of t h e past I 94 31 C- I Lack of incentive + -- ! I i Any other I 9 3 1 I ---- , I Totan 1 I L- - I Source : Field survey
The main reason for diverting funds from the stock market is
the bitter experiences the investors have undergone in the past. It is
evident from the table that many of the investors have suffered heavy
loss in the market due to either political instability or some other
reason responsible for the nervous teetering of the market and
therefore diverted funds. The crises that occur frequently in the capital
market put the investors in a quandary and it is natural that they will
try to get out of this fiercely turbulent market.
Higher risk in the stock market is the reason for diverting
funds from the stock market for 25% of the investors. In this
mysterious market, it is difficult even for the analysts to predict
accurately what will be the market trend tomorrow. Risk is
fundamental to the process of investment. But most investors are risk
averse. It is true that to have a higher return the investors should be
prepared to face greater risks.
Whatever be the reason, it is evident that large amounts are
diverted from the stock market. The stock market is moving nervously
every day, reacting t o the events taking place in and outside the
country. In this context, what is of primary importance is stability in
the market and this is the aspect that has been highlighted by all the
apex chambers
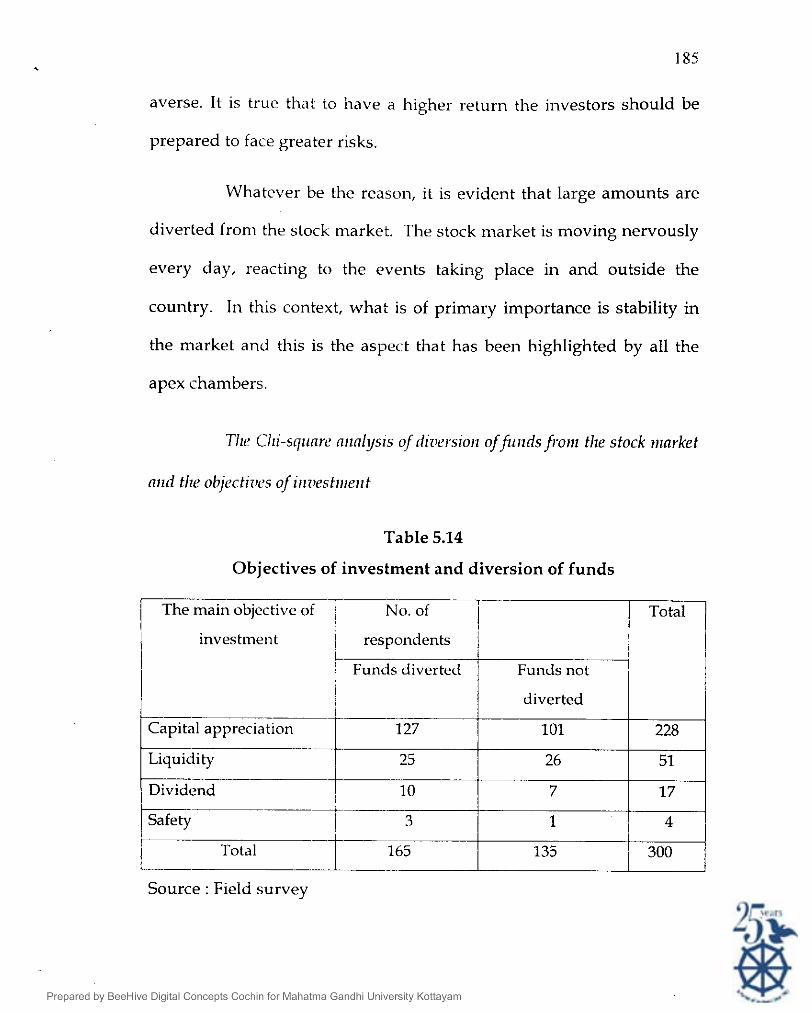
The Clli-square nrlnlysis of diziersiorz o f f t ~ r ~ d s fiDrn the stock nlnrket
Table 5.14
Objectives of investment and diversion of funds
diverted
127 101 228
Liquidity 25 26 51
Dividend 10 7 17
3 1 4
165 135 I 300 I
Source : Field survey
Total
I
I
The main objective of T No. of I I I investment respondents 1 I I I Funcls diverted
I Funds not
186
Table 5.14 shows that out of 228 investors whose main
objective of investment is capital appreciation, 127 (56%) investors have
directed funds fro111 the stock market. It is interesting to note that 75%
of the investors whose main objective is 'safety', have diverted funds.
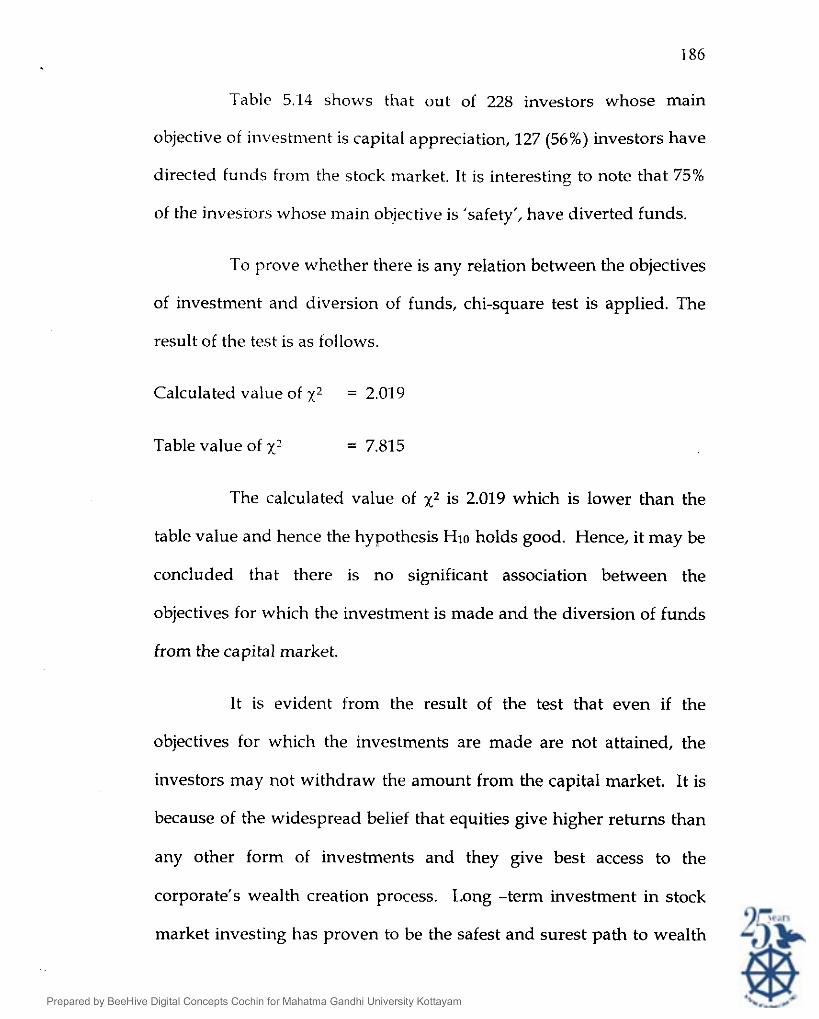
To prove whether there is any relation between the objectives
of investment and diversion of funds, chi-square test is applied. The
result of the test is as follows.
Calculated value of ~2 = 2,019
Table value of ~2 = 7.815
The calculated value of ~2 is 2.019 which is lower than the
table value and hence the hypothesis HIO holds good. Hence, it may be
concluded that there is no significant association between the
objectives for which the investment is made and the diversion of funds
from the capital market.
It is evident from the result of the test that even if the
objectives for which the investments are made are not attained, the
investors may not withdraw the amount from the capital market. It is
because of the widespread belief that equities give higher returns than
any other form of investments and they give best access to the
corporate's wealth creation process. Long -term investment in stock
market investing has proven to be the safest and surest path to wealth
187
creation. Also, the Indian stock markets have been able to maintain the
integrity even in the face of extreme circumstances. It emphasises the
fact that in spite of all the ruins of political instability, the Indian capital
market can not- only retain its existing investors but attract more
investors and entice them to invest in shares if it can offer a well
regulated market in terms of investors' safety.
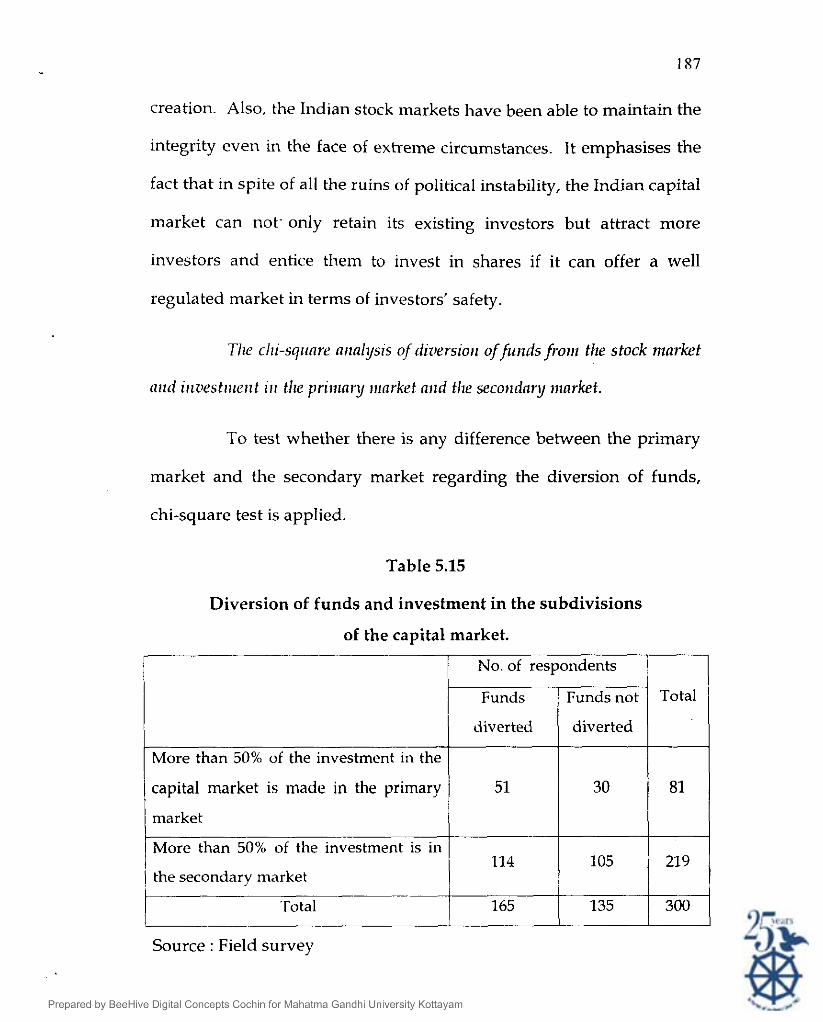
Tlle chi-sqiinre nrzalys~s of diziersioli offuildsfronl the stock nzarket
artd irlz~est~ller~t ill tlle prillmry ~llnrket and t l ~ secot~dnry n~arket.
To test whether there is any difference between the primary
market and the secondary market regarding the diversion of funds,
chi-square test is applied.
Table 5.15
Diversion of funds and investment in the subdivisions
of the capital market. -- / No. of respondents I
1 Funds i Funds not I
diverted diverted
More than 50% of the investment
capital market is made in the primary / 51 1 30 1 81
market I I I More than 50% of the investment is in
the secondary market I I I
114
Total -a-
105
Source : Field survey
135 165
21 9
300
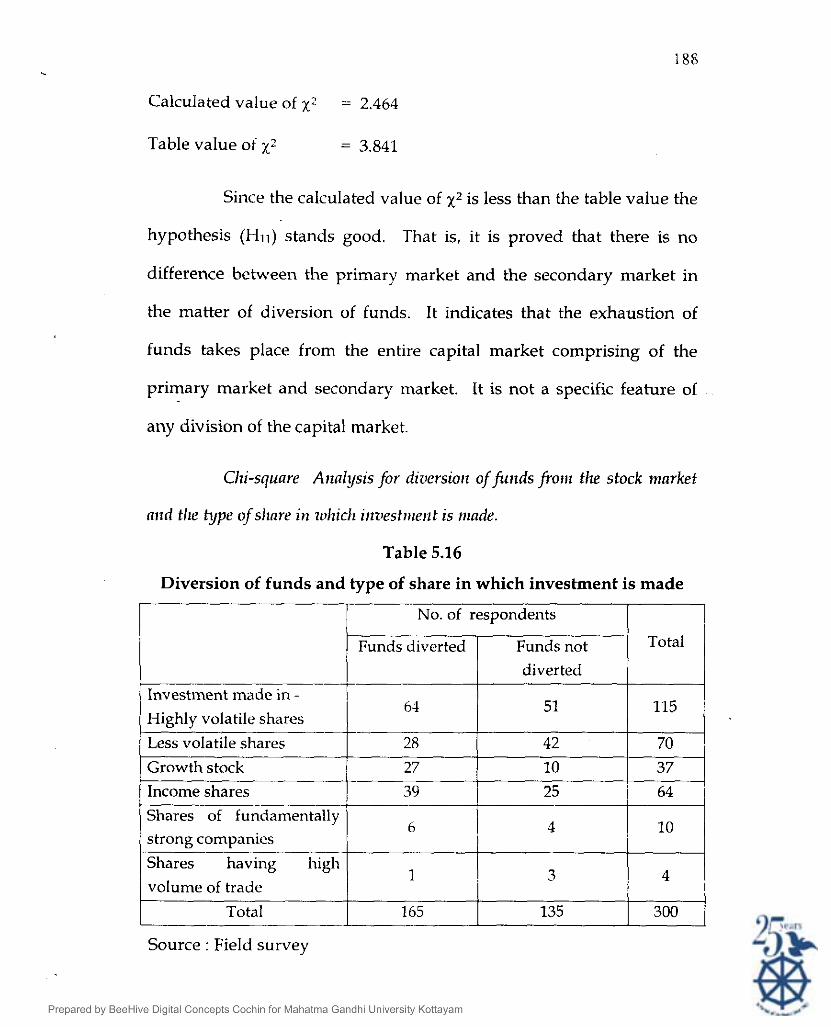
Calculated value of X? = 2.464
Table value of ~2 = 3.841
Since the calculated value of ~2 is less than the table value the
hypothesis (HII) stands good. That is, it is proved that there is no
difference between the primary market and the secondary market in
the matter of diversion of funds. It indicates that the exhaustion of
funds takes place from the entire capital market comprising of the
primary market and secondary market. It is not a specific feature of
any division of the capital market.
Chi-square Ailalysis for diziersiot~ of funds fro111 tlze stock market
n11d the type of slmre i l l zohic1~1 iizz~estitier~t is nlade.
Table 5.16
Diversion of funds and type of share in which investment is made
T T I I No. of respondents
Total Funds diverted
I Investment made in - 61
28
27
39
Funds not diverted
I I
Source :: Field survey
51
42
10
high 1
volume of trade
Total -
165
115
70
37
10 of fundamentally
6
25 1 64 !
4
3
135
strong companies I
4
300
I
Table 5.16 reveals that investors in highly volatile shares are
particularly prone to divert funds from the stock market compared to
the investors in less volatile shares. Fifty six percent of the investors in
highly volatile shares and 40% of the investors in the less volatile
shares divert funds from the stock market. The result of the chi-square
test to prove the relation between the type of shares in which
investment is made and diversion of funds is as follows.
Calculated value ~2 = 13.428
Table value of ~2 = 11.07
Since the calculated value of ~2 is higher than the table value,
the hypothesis H 1 2 that there is no association between diversion of
funds from the stock market and the type of share in which investment
is made, is rejected, that is diversion of funds from the stock market
depends very much on the type of share in which investment is made.
Involvement in speculation
Speculators tend to operate in shares with the short- term
objective of making quick profits out of price fluctuations. Speculation
is usually a short-run phenomenon. A speculator commits his funds to
high risk. He is prepared to take higher risks in order to achieve higher
results. He is interested in market action and price movements. Table
5.17 discloses that 71% of the investors indulge in speculation.
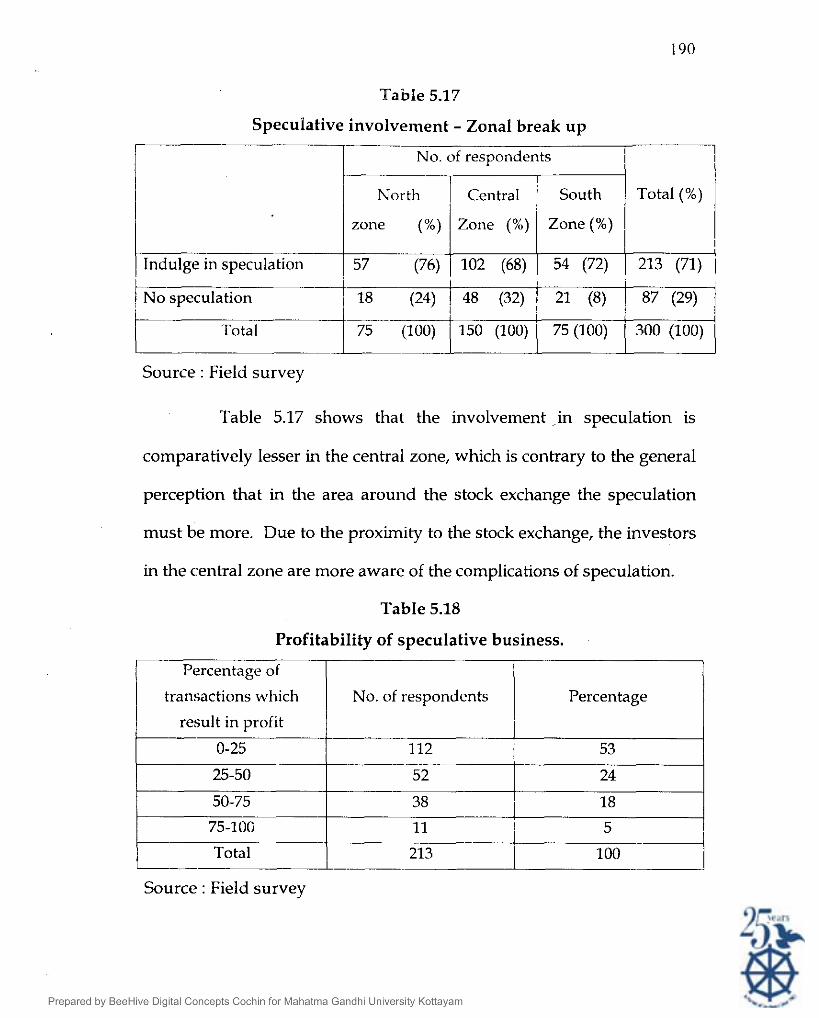
Fable 5.17
Speculative involvement - Zonal break up
No. of respondents
ITZE~I Total (%) 1 I;) 1 zone ('1 1 zone (%) 1 --
Indulge in speculation (76) 102 (68) 54 (72) 213 (71) 1 L- I No speculation
Total
Source : Field survey
Table 5.17 shows that the involvement ,in speculation is
comparatively lesser in the central zone, which is contrary to the general
perception that in the area around the stock exchange the speculation
must be more. Due to the proximity to the stock exchange, the investors
in the central zone are more aware of the complications of speculation.
Table 5.18
Profitability of speculative business.
Percentage of I I I transactions which I No. of respondents I Percentage I
result in profit 4 112 53
Source : Field survey
- Total 213 100
As per table 5.18 fifty three per cent of the investors who
indulge in speculation admit that less than a quarter of their
speculative transactions results in profit. That is 3/4 of the speculative
transactions being them loss. Above 50% of the speculative
transactions result in profit in the case of 23% of the investors who do
speculative business. In other words, most of the speculative
transactions of 77% of the investors result in loss. So the hypothesis
HI^ that most of the speculative business resuslt in loss holds good.
This is a warning to the investors to be cautious and not to go for
quick profit by doing speculative business.
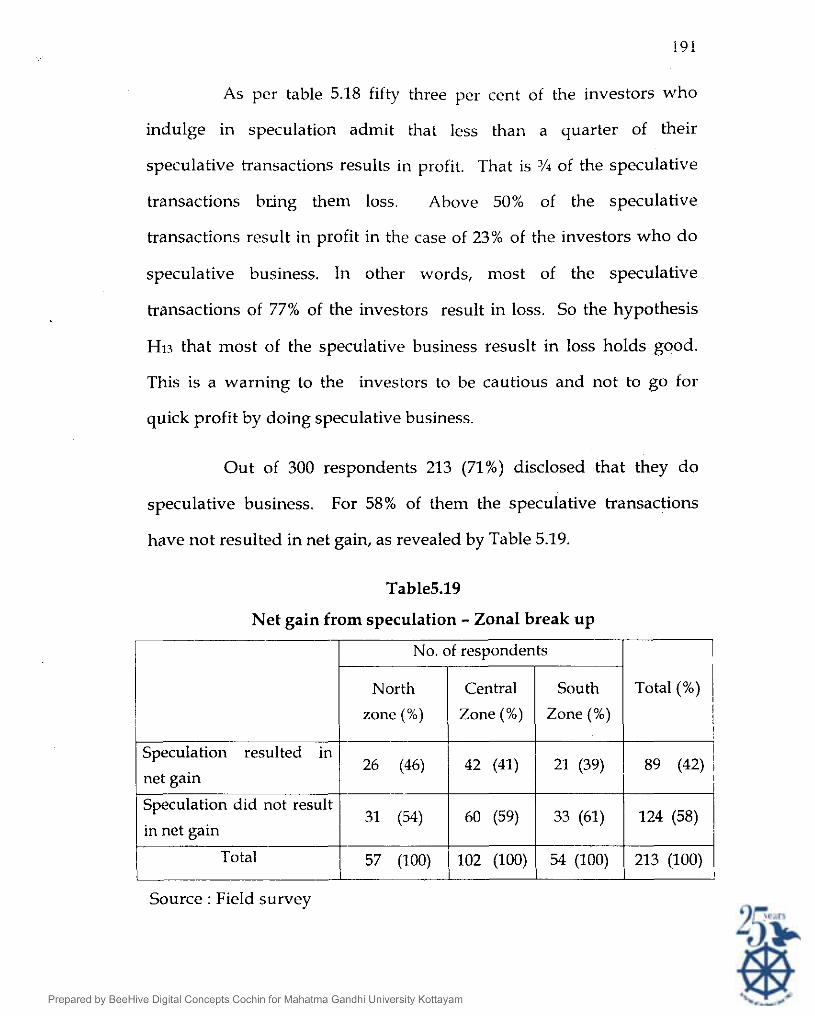
Out of 300 respondents 213 (71%) disclosed that they do
speculative business. For 58% of them the speculative transactions
have not resulted in net gain, as revealed by Table 5.19.
Table5.19
Net gain from speculation - Zonal break up
No. of respondents 1-1 zone (%) Zone (%) Zone (%) Total % ) I 1
Speculation did not result 60 (59) 33 (61) 124 (58) 1
in net gain I
Speculation resulted in 26 (46) 42 (41)
Source : Field survey
I 21 (39) 89 (42)
I I
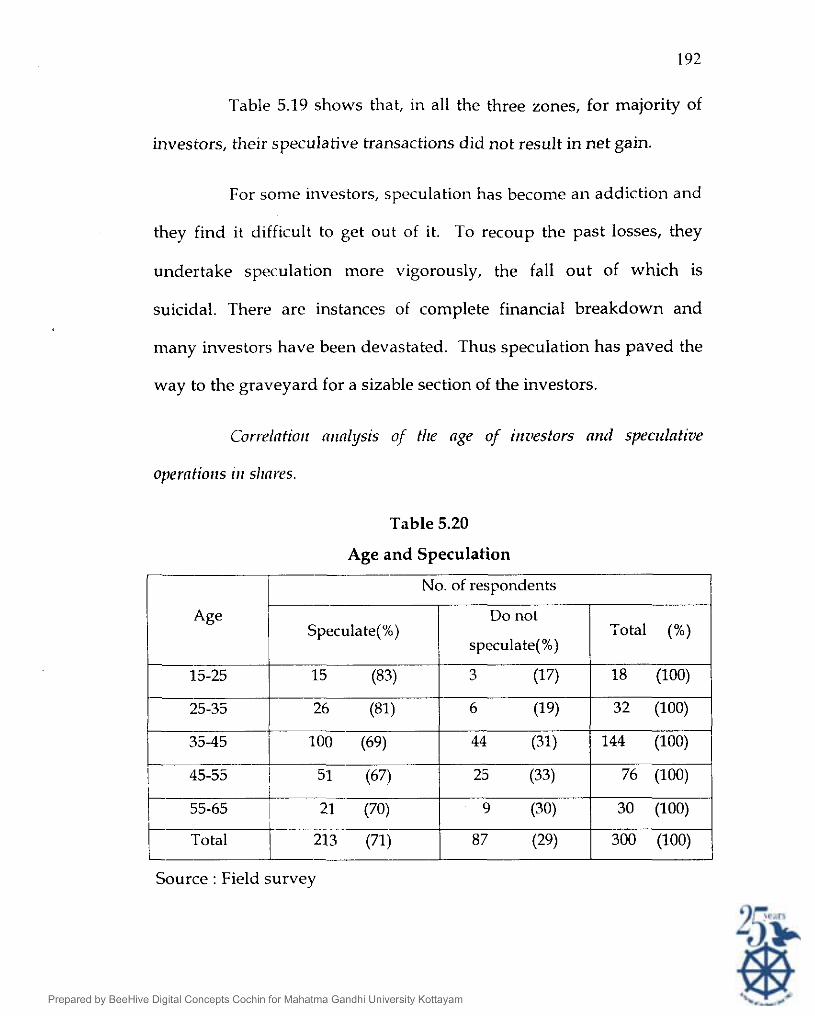
Table 5.19 shows that, in all the three zones, for majority of
investors, their speculative transactions did not result in net gain.
For some investors, speculation has become an addiction and
they find it difficult to get out of it. To recoup the past losses, they
undertake speculation more vigorously, the fall out of which is
suicidal. There are instances of complete financial breakdown and
many investors have been devastated. Thus speculation has paved the
way to the graveyard for a sizable section of the investors.
Correlntiorr nrznlysis of tllr age of irzzlestors arzd speculative
operntiorzs irz sl~rrres.
Table 5.20
Age and Speculation
I I No. of respondents I
Source : Field survey
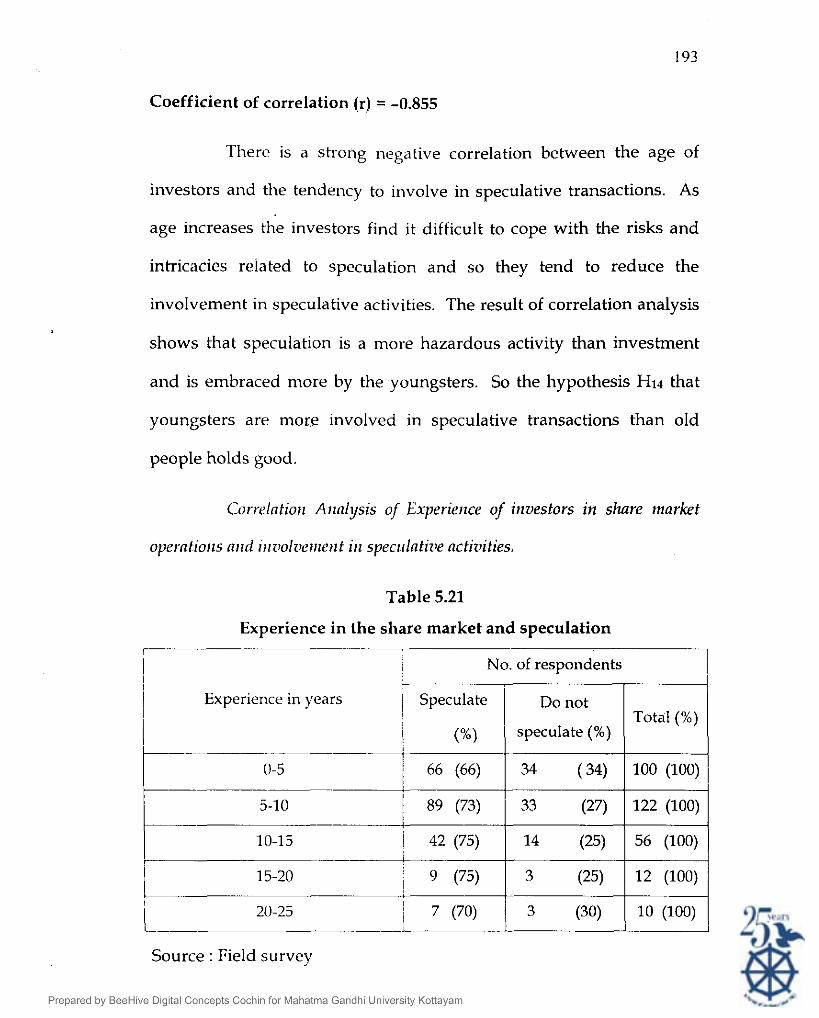
Coefficient of correlation (r) = -0.855
There is a strong negative correlation between the age of
investors and the tendency to involve in speculative transactions. As
age increases the investors find it difficult to cope with the risks and
intricacies related to speculation and so they tend to reduce the
involvement in speculative activities. The result of correlation analysis
shows that speculation is a more hazardous activity than investment
and is embraced more by the youngsters. So the hypothesis Hi4 that
youngsters are more involved in speculative transactions than old
people holds good.
Correlntiorl Arlnlysis of Experience of iilvestors i n slmre ninrket
operntiorls nrld irrr~olz~err~er~t ill spectllntiz~e nctiz~ities.
Table 5.21
Experience in the share market and speculation
No. of respondents I
Source : Field survey
i Experience in years 1 Speculate Do not
1 1 (%) ( speculate (%) Total (%)
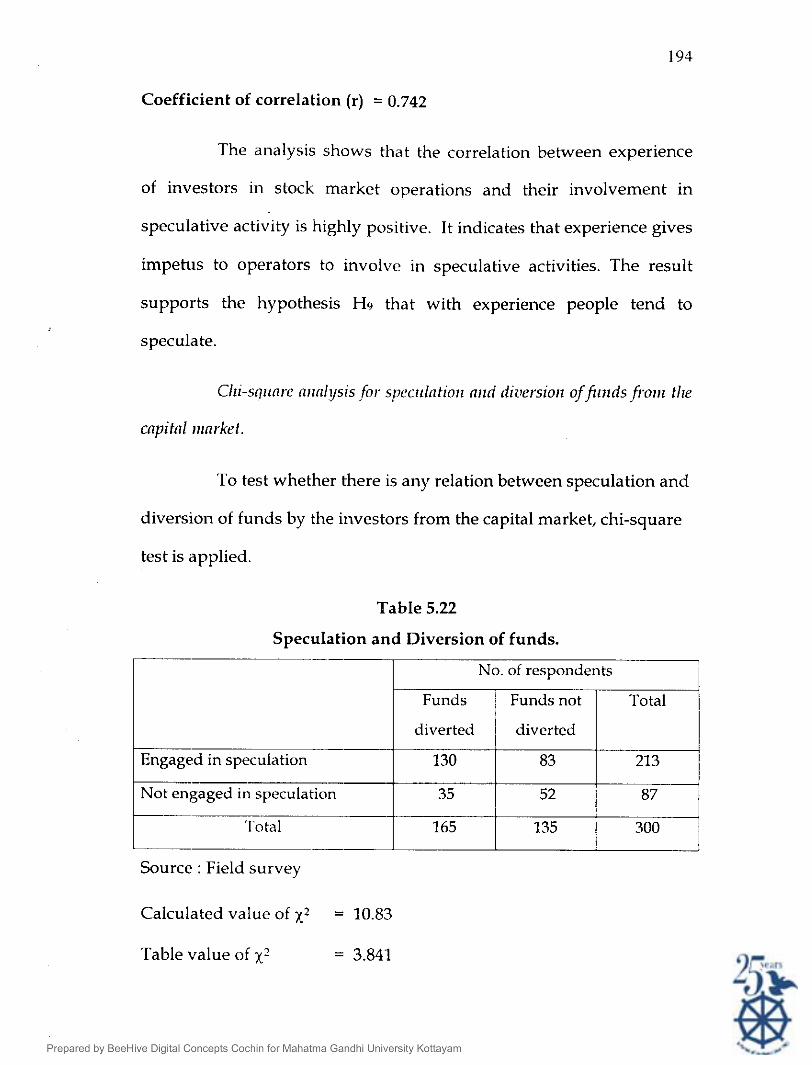
Coefficient of correlation (r) = 0.742
The analysis shows that the correlation between experience
of investors in stock market operations and their involvement in
speculative activity is highly positive. It indicates that experience gives
impetus to operators to involve in speculative activities. The result
supports the hypothesis H9 that with experience people tend to
speculate.
Chi-sqrlnre nr~nlysis for. specr~lntioil nrtd diziersioi~ of f iulds frorr~ tlle
To test whether there is any relation between speculation and
diversion of funds by the investors from the capital market, chi-square
test is applied.
Table 5.22
Speculation and Diversion of funds.
No. of respondents
diverted diverted
- Not engaged in speculation
Total
Source : Field survey
-- I I I
Calculated value of X* = 10.83
Table value of X' = 3.841
Engaged in speculation 130 83 213
The calculated value of X* is greater than the critical value, so
the hypothesis (HIS) is rejected. Hence it is concluded that diversion of
funds from the capital market is verv much dependent on the
involvement in speculative business. Most of the speculative
transactions result in loss which ultimately lead to the diversion of
funds from the stock market.
The prudent investor purchases securities on the genuine
long-term profit expectation. Traditionally, the equity market gives
return over a longer time and in the last few years this aspect has been
totally forgotten. There is predominance of short-term players in the
market, which has changed its colour with every investor coming in for
a quick buck. These short- term players have to realise that speculative
business may result in loss even if they are utmost alert.
The expectation of unrealistic return within too short a
period has encouraged many an investor to involve in speculation at
the cost of even hisjher own capital. The stock markets are notorious
for going up and down sharply in the most unexpected manner. The
position of the investor with short-term gains in mind becomes the
bubble on the whirlpool of speculation which brakes sooner or later.
He finally resorts to transferring the funds to some other avenues of
investment which results in deserting the stock market. This reinforces
the need for the presence of long- term investors who will provide

stability to the market. To retain them in the market, they have to be
educated on making long term investments based on a clear
understanding of the underlying fundamentals. They must
understand that-investing requires caution, patience and hard work
and they must never let greed dominate their decisions.
Despite the risks inherent in common stock, they remain a
popular investment among individual investors. One of the main
reasons for this continuing popularity is the possibility of a spectacular
return. The analysis of data shows that most of the investors in Kerala
invest in corporate securities expecting capital appreciation. It is this
hope, which retains the investors in the capital market. But many of
the investors view the securities market with pre-conceived notions.
Most of their investment decisions are without a clear vision supported
by knowledge and information and quite often they may make
mistakes. After incurring heavy losses they exit the market. It is
evident that new measures are required to fortify confidence in the
investors. Also, investors should not be afraid of the challenges of a
new competitive market place.
Footnotes
1. Manu Bhai Shah, "Primary Market Revival", Tlze Ecoizoii~ic Tiiiles,
April/27,1999.