Embed Size (px)
Citation preview
Earnings Management and Corporate InvestmentDecisions
BRANDON JULIO∗
University of Oregon
YOUNGSUK YOOK†
Federal Reserve Board of Governors
November 2016
ABSTRACT
We investigate the relationship between earnings management through intertemporaltransfers of earnings and the efficiency of corporate investment decisions. Using discre-tionary accruals to measure intertemporal transfers of earnings, we show that earningsmanagement exhibits a concave relationship with the investment sensitivity to invest-ment opportunities as measured by Tobin’s Q. We find that the association is concen-trated among high Q firms. The effect is present among well governed firms, suggestingthat better governed firms manage accruals strategically. The concave relationship sug-gests that the marginal impact of earnings management on investment efficiency decreaseswith the amount of earnings management. Using cases of misreporting that violate theGAAP guidelines, we document that a more severe form of earnings management doesnot improve investment efficiency. Taken together, these results support the view that amoderate amount of earnings management helps improve corporate investment decisionswhile an excessive amount undoes the potential benefit of earnings management.
∗Department of Finance, Lundquist College of Business, University of Oregon, Eugene, OR 97403; e-mail:[email protected]; phone: +1 541 346 4449.
†Federal Reserve Board of Governors, 20th Street and Constitution Avenue NW, Washington, DC 20551;e-mail: [email protected]; phone: +1 202 475 6324. The views expressed in this article are those of theauthors and not necessarily of the Federal Reserve System. We thank Luke Stein and seminar participants atAsian Financial Association International
1. Introduction
This study empirically investigates how the use of intertemporal transfers of earnings af-
fects a firm’s investment policy. Managers’ discretion over accruals, defined as the difference
between earnings and cash flows, allows for such transfer without violating the guidelines
of Generally Accepted Accounting Principles (GAAP). We argue that earnings management,
though often associated with poor corporate governance or fraudulent behavior, can be used
by managers to signal good earnings prospects to investors. In perfect capital markets, accru-
als management is irrelevant since all information is observable and verifiable. However, in
a world with market frictions, accruals management can serve as a tool to help overcome in-
formation asymmetry between the firm and outsiders, improving access to external financing
and internal asset allocation decisions. Managing accruals to obtain external financing, while
sometimes viewed as opportunistic, can facilitate better investment decisions to the extent that
these funds are used to finance value-enhancing projects. Discretion over accruals may allow
internal funds to be allocated for valuable investment projects rather than for real earnings
management: In the absence of managerial discretion over accruals, managers may resort to
value-destructive real earnings management by delaying or foregoing investment, improving
short-term profit at the expense of long-term firm value. According to Graham et al.’s (2005)
survey of over 400 executives, managers candidly admit that they would take real economic
actions such as delaying maintenance or advertising expenditure, and would even give up pos-
itive NPV projects, to meet short-term earnings benchmarks. In this study, we explore whether
strategic earnings management can improve investment decisions. Specifically, we examine
whether the ability to transfer earnings between periods allows managers to better align the
firm’s investment decisions with its investment opportunities.
The 2001-2002 accounting scandals and the subsequent regulatory response have high-
lighted the opportunistic aspect of accruals management, which are typically in violation of
GAAP guidelines. A large body of literature has examined the causes and effects of fraudulent
reporting1. In particular, some studies have stressed the association between aggressive earn-
1For example, see Benish, 1999; Burns and Kedia, 2006; Burns, Kedia, and Lipson, 2010; Efendi, Srivastava,and Swanson, 2007; Plumlee and Yohn, 2010; Wang, Winton, and Yu, 2010; Wilson, 2008.
1
ings management and financial policies including investment decisions. Kedia and Philippon
(2009), for example, document that poorly performing firms overinvest and overstate their
financial statements to mimic their better performing peers. McNichols and Stubben (2008)
document that firms misreporting earnings overinvest during the misreporting period. How-
ever, the prior accounting literature also demonstrates that managerial discretion over accruals
can enhance earnings’ informativeness. Managers can use accruals to signal private infor-
mation about the firm. Discretionary accruals, a discretionary portion of total accruals, help
managers produce a reliable and more timely measure of firm performance than using nondis-
cretionary accruals alone (Dechow, 1994; Dechow, Kothari, and Watts, 1998; Subramanyam,
1996). The signal is quite credible despite managerial discretion over accruals because accru-
als management does not allow for permanent changes in earnings but only for a shift over
time.
We test our prediction by examining the association between the absolute value of discre-
tionary accruals and investment efficiency. Discretionary accruals, estimated using a cross-
sectional version of the modified Jones model and expressed as percentage of lagged assets,
have been used widely to proxy for accounting-based earnings management.2 We evaluate
investment efficiency as the sensitivity of investment expenditures to investment opportuni-
ties as measured by Tobin’s Q. We augment the standard investment specification to allow
for interactions between Q and the absolute value of discretionary accruals. For our analysis,
we consider firms in the Compustat universe between 1989 and 2012 excluding financial and
utility industries. Controlling for Tobin’s Q and cash flows, we find that accruals management
has a concave relationship with the sensitivity of investment to Tobin’s Q. That is, the addi-
tional usage of accruals improves investment decisions to a certain point, beyond which the
investment-Q sensitivity deteriorates. Furthermore, we document that this pattern is mainly
driven by high-Q firms. Despite having more investment opportunities, high-Q firms in our
sample manifest a lower investment-Q sensitivity than low-Q firms. The result highlights the
importance of strategic accruals management by showing that the benefit of accruals manage-
ment is greater for firms with more investment needs.
2For instance, see Bergstresser and Philippon, 2006; Healy and Wahlen, 1999; Teoh, Welch, and Wong,1998a; Teoh, Welch, and Wong, 1998b; Yu, 2008.
2
The concave relationship documented above suggests effects on investment decisions vary
with the amount of earnings management. A modest amount of earnings management is as-
sociated with better investment responses to changing investment opportunities. However,
marginal benefit diminishes with earnings management, suggesting that excessive earnings
management hurts investment efficiency. We further check a case of excessive earnings man-
agement by examining firms misreporting financial statements only to restate in later dates.
Accruals management tends to be modest in nature. First, accruals are managed within the
boundary of GAAP. Second, accruals management requires that the sum of a firm’s income
over all years equal the sum of its cash flows, meaning that managers must at some point in
time reverse any excessive accruals made in the past. On the other hand, misreporting is of-
ten in violation of GAAP and sometimes results in SEC investigations or lawsuits, incurring
large economic costs. Karpoff, Lee and Martin (2008) examine the firms targeted by SEC
enforcement actions for financial misrepresentations and find that the size of lost sales and
higher contracting and financing costs resulting from the earnings manipulation outweigh the
amount inflated by manipulation. Firms that restate their accounting statements in later dates
face tighter loan contract terms including higher spreads, shorter maturities, higher likelihood
of being secured, and more covenant restrictions (Graham, Li, and Qiu, 2008). Given the
relatively large expected costs, value-maximizing managers are not likely to rely on such ag-
gressive earnings management. Consistent with this interpretation, we find misreporting that
leads to restatement in future dates does not improve the investment-Q sensitivity. The results
reinforce the concave relation documented earlier: The cost of earnings management starts
outweighing its benefit beyond a certain level.
One concern in interpreting the results is that unobserved factors may drive accruals man-
agement and the investment-Q association simultaneously, generating a spurious correlation.
We address this concern by employing a difference-in-differences (DID) methodology. This
approach is well suited for attempting to disentangle causality in a quasi-experimental setting.
We compare changes in investment efficiency for a sample of firms subject to an exogenous
reduction in earnings management to changes in investment efficiency for those that were not
affected by the event. Specifically, we examine the effects of earnings management by us-
ing the passage of the Sarbanes-Oxley Act (SOX). Undoubtedly, SOX affected the way firms
3
manage their earnings. SOX was intended to curve earnings management and, indeed, various
studies document significant declines in the accruals management practice in the post-SOX
periods. We select control groups in two different ways. First, we use the pre-SOX years
as the control period and examine within firm variation in investment efficiency around the
enactment of SOX, where firms act as their own controls. Second, for our DID estimation, we
select firms in the United Kingdom and Canada as our control group since SOX influences all
firms in the U.S. (our treatment group). The UK and Canada are considered to have similar
accounting guidelines and practices. In addition, investment expenditures for firms in these
countries follow similar time series patterns as those of the US firms. Our DID regressions
show a large reduction in investment efficiency for US firms around the passage of SOX. This
provides support for the hypothesis that the decline in the use of earnings management after
SOX reduced investment sensitivity to investment opportunities for US firms.
Finally, we examine how well-governed firms view accruals management that can poten-
tially improve investment response to investment opportunities. A recent literature has focused
on the opportunistic aspect of earnings management and has linked earnings management to
poor corporate governance (e.g., Klein, 2002; Agrawal and Chadha, 2005; Cornett, Marcus,
and Tehranian, 2008). However, the size of discretionary accruals alone does not address
the strategic aspect of accruals management that can help secure internal or external funds
necessary for valuable investment projects. A corporate governance mechanism should be de-
signed to deter earnings management intended to manipulate earnings, but should not discour-
age accruals management that can improve resource allocation to finance valuable investment
projects. We test this hypothesis by examining the association between accruals manage-
ment and investment sensitivity to investment opportunities separately for well-governed and
poorly-governed firms. We utilize G-index, E-index, and the presence of three individual pro-
visions (poison pill, classified board, and golden parachutes provisions) to sort firms into two
subgroups. We find that good governance and bad governance groups exhibit a previously doc-
umented concave relation between accrual management and investment-Q sensitivity. Better
governed firms show a stronger association for some of the governance measures. This re-
sult suggests that well-governed firms do not discourage the strategic usage of accruals and
effectively manage accruals in response to their investment opportunities.
4
Overall, our findings highlight the importance of managerial discretion to transfer earn-
ings between periods as a better alternative to real earnings management that sacrifices valu-
able investment projects. Prior literature suggests the effect of accruals on investment deci-
sions can work through both the internal resource allocation channel and external financing
channel. First, accruals allows managers to allocate internal funds for valuable investment
projects rather than for meeting earnings benchmarks, improving internal resource allocation.
Many studies document that firms have been engaging in real earnings management in vari-
ous ways including price discounts, overproduction, delaying R&D investment, reduction of
discretionary expenditures, stock repurchase, and sale of profitable assets.3 The real earnings
management has direct real consequences. Ewert and Wagenhofer (2005) argue that firms
engaging in real earnings management may deviate from normal business practices and thus
experience a decline in their subsequent operating performances. Underperformance follow-
ing seasoned equity offerings is more severe for firms engaging in real management than those
managing accruals (Cohen and Zarowin, 2010). Firms seem to sacrifice employment, R&D,
and other investment to finance EPS-increasing stock repurchases (Almeida et al., 2013).
Second, accruals management can influence investment decisions through the channel
of external financing. Firms seem to manage discretionary accruals to obtain financing as
suggested by abnormally high levels of positive accruals in the periods preceding stock is-
suances (Chen, Gu, and Tang, 2008; DuCharme, 2004; Friedlan, 1994; Shivakumar, 2000;
Teoh, Welch, and Wong, 1998a,b). Bergstresser, Desai, and Rauh (2006) also document in-
creased earnings managements measured by pensions assumptions prior to acquisition activ-
ities. However, this evidence alone does not speak to the role of accruals in the efficiency of
investment decisions. Linck, Netter, and Shu (2013) take a step toward this direction by ex-
amining financially constrained firms with valuable investment projects. They find that these
firms use discretionary accruals to credibly signal positive prospects to raise capital necessary
for the investments.3Dechow and Sloan, 1991; Baber et al., 1991; Bushee, 1998; Roychowdhury, 2006; Hribar et al., 2006;
Cheng, 2004; Almeida et al., 2013; Herrmann et al. 2003; Bartov, 1993; Jackson and Wilcox, 2000; Gunny,2010
5
We also contribute to the recent literature linking real investment decisions to earnings
management. Zhang (2007), Wu, Zhang and Zhang (2010), Arif et. al (2016), among others,
argue that accruals reflect real investment choices of firms. Wu, Zhang, and Zhang (2010) link
the accrual anomaly, where firms with high accruals earn abnormally low returns on average,
to real investment in a Q-theory framework. In their model, discount rates vary negatively
with accruals and investment, therefore predicting lower future returns. Arif et. al (2016)
show that like real investment, accruals decline significantly when economic uncertainty is
high, consistent with the view that accounting accruals and investment are strongly linked.
Our investigation is especially relevant in light of the recent trend of adopting stricter dis-
closure rules: The 2001-2002 accounting scandals and the subsequent passage of SOX likely
increased the expected cost of fraudulent financial reporting. SOX instituted a number of pro-
visions including improving the composition and function of audit committees, CEO and CFO
financial statement certification, restrictions on non audit-related work by the company’s audi-
tors, mandatory audit partner rotation, and an annual report on internal controls. Firms make
choices between accruals management and real activities management (Cohen, Dey, and Lys,
2008; Cohen and Zarowin, 2010; Badertscher, 2011), and the choice depends on their relative
costs (Zang 2012). Because accruals management is easier to detect in nature than real activity
manipulation, the heightened scrutiny post SOX is likely to have increased the relative cost
of accruals management, reducing accounting flexibility in GAAP. In fact, empirical evidence
indicates that accruals management has decreased since the implementation of SOX. Lobo and
Zhou (2010) document lower discretionary accruals post SOX. Koh, Matsumoto, and Rajgopal
(2008) document that the propensity to engage in income-increasing earnings management to
meet or beat earnings benchmarks has declined. Cohen et al. (2008) and Bartov and Cohen
(2009) document that the level of accruals-based earnings management declined in the post-
SOX period while the level of real activities manipulation increased, suggesting a shift from
accruals management to real management. Our examination of the association between accru-
als management and investment decisions has implications for understanding the real benefits
and costs of corporate disclosure policies.
6
2. Data and Methodology
2.1. Accruals
We utilize the absolute value of discretionary accruals as the measure of a moderate earn-
ings management. We consider accruals management moderate for the following two reasons.
First, since the sum of a firm’s income over all years must equal the sum of its cash flows, man-
agers must at some point in time reverse any ”excessive” accruals made in the past. Therefore,
it is unlikely to observe an extreme accruals management that persists over time. Second, an
accruals management is within the boundary of GAAP and therefore is unlikely to be extreme
by definition. In general, an accruals management does not incur severe economic costs as do
earnings managements violating the GAAP, which are often followed by restatements and, in
some cases, SEC investigations or lawsuits.
Total accruals are defined as the difference between earnings and cash flows from opera-
tions and is constructed by subtracting Cash Flow from Operations (Compustat item OANCF)
from Net Income (item NI), scaled by beginning-of-year total assets. We decompose total
accruals to separate the component that are beyond the control of the managers. We estimate
a modified version of Jones model of accruals (Dechow, Sloan, and Sweeney (1995)), which
regresses total accruals on changes in revenue and gross property, plant and equipment (PPE)
to control for changes in nondiscretionary accruals caused by changing conditions. Total ac-
cruals includes changes in working capital accounts, such as accounts receivable, inventory,
and accounts payable that depend on changes in revenues to some degree. Thus revenues are
used to control for the economic environment of the firm because they capture the firms’ op-
erations before managers’ manipulations. Gross PPE is included to control for the portion of
total accruals related to nondiscretionary depreciation expense. To summarize, we estimate
the following model on our sample by each industry group and year4:
TAit = β0 +β11
Ait−1+β2∆REVit +β3PPEit + εit ,
4We utilize Fama-French’s definition of 48 industries
7
where TA is total accruals scaled by the beginning-of-year assets, ∆REV is the change in sales
normalized by beginning assets and PPE is gross property plant and equipment scaled by be-
ginning assets. We then feed these estimates to the following equation to obtain discretionary
accrual (DA).
DAit = TAit−b0−b11
Ait−1−b2(∆REVit−∆RECit)−b3PPEit ,
where b j is the estimated value of β j ( j= 0, 1, 2, 3). DA is essentially the discretionary por-
tion of total accruals expressed as a percentage of the lagged assets. Note that the change in
accounts receivable (∆REC) is subtracted from the change in revenues to allow for the manip-
ulation of credit sales. The original Jones (1991) Model implicitly assumes that discretion is
not exercised over revenues while the modified Jones model (Dechow, Sloan, and Sweeney
(1995)) adjusts the change in revenues for the changes in receivables to control for potential
revenues manipulation. Our results are qualitatively unchanged when we employ the original
Jones model. Throughout the paper, we utilize absolute value of discretionary accruals since
earnings manipulation involves both positive and negative values of accruals.
2.2. Data
We consider all firms between 1989 and 2012 that are available in the merged Center for
Research on Security Prices-Compustat Industrial Annual database. We exclude financial ser-
vices firms, regulated utilities, and firms with book values smaller than $10 million. We also
drop observations with the missing total asset information. These steps result in a sample of
99,528 firm-year observations. The main variables are winsorized at the 1% and 99% level.
Panel A of Table 1 summarizes various firm characteristics. Investment and cash flow are
scaled by beginning-of-year capital measured by property, plant and equipment. The mean
investment rate and mean lagged cash flow are 0.34 and 0.62, respectively. The mean discre-
tionary accrual to total assets ratio (-0.005) is very close to zero as expected, reflecting the
intertemporal nature of accruals management. However, its standard deviation is quite large
with 0.349, highlighting managers’s discretion over intertemporal shifts in the firm’s earning.
8
The absolute value of discretionary accruals is larger with a mean value of 12.2% of total
assets.
Next, corporate governance measures are drawn from Investor Responsibility Research
Center (IRRC), which published detailed listings of corporate governance provisions. We
examine the data between 1990 and 2007 because, after IRRC was acquired by Institutional
Shareholder Services in 2005, a new data collection methodology was implemented in 2007,
making the pre- and post-2007 data incomparable (see Karpoff, Schonlau, and Wehrly (2016)
for additional detail about discontinuity between pre- and post-2007 data). The IRRC tracks
24 corporate provisions including corporate charters and bylaws. Almost all provisions gives
management a tool to resist different types of shareholder activism, such as calling special
meetings, changing the firm’s charter or bylaws, suing the directors, or just replacing them
all at once. They construct G-index by assigning one point for the existence (or absence) of
each provision and summing the points across the 24 provisions. Well-governed firms tend to
have less provisions and, thus, are assigned a lower number of the governance index. For our
sample periods, this index has a mean of 9.05 and standard deviation of 2.75.
We also use E-index obtained from Lucian Bebchuk’s website5. Table 1 shows E-index has
a mean of 2.28 and standard deviation of 1.33. Finally, following Kedia and Philippon (2009),
we select one provision from each of the three groups defined by Gompers et al. excluding the
Voting and State groups.6 Classified board is chosen from the Delay group, Golden parachutes
from the Protection group, and Poison pill from the Other group. Table 1 shows that 53.4% of
our firm-year observations have the Poison Pill provision, 58.6% Classified Board provision,
and 61.3% Golden Parachutes provision.
Panel B reports investment rates for subsamples sorted on lagged Q and |DA |. The sample
is first sorted into four quartiles based on lagged Q, and then each of the four subsamples is
further sorted into four quartiles based on |DA |. Investment rates increase with investment op-
portunities proxied by lagged Q, consistent with the literature. Investment rates also increase
5http://www.law.harvard.edu/faculty/bebchuk/data.shtml6Gompers, Ishii, and Metrick (2003) divides them into five groups: tactics for delaying hostile bidders (De-
lay); voting rights (Voting); director/officer protection (protection); other takeover defenses (Other); and statelaws(State). We dropped Limit Ability to Amend Charter provision from the Voting group because very littlefraction of our sample observations have the provision.
9

monotonically with | DA |, but the magnitude differs across lagged Q quartiles. Investment
rises slowly for low Q quartiles but moves up rapidly for high Q quartiles. For the lowest Q
quartile, for example, investment rates rise only by 0.054, from 0.182 in the lowest |DA | quar-
tile to 0.236 in the highest | DA | quartile. By contrast, for the highest Q quartile, investment
rates leap from 0.480 to 0.648, suggesting that accruals are utilized heavily in conjunction
with investments for firms with strong growth potentials.
3. Test Results
3.1. Baseline Specification
In this section, we investigate our main hypothesis that the accruals management can be
utilized to improve the investment-Q relationship. We augment the standard investment re-
gression specification as follows:
Iit =αi+β1· |DAit |+β2· |DAit | ·Qit−1+β3· |DAit |2 ·Qit−1+β4 ·Qit−1+β5 ·CFit−1+γt +εit ,
where i indexes a firm and t indexes time. The dependent variable is investment scaled by
beginning-of-year capital. | DAit | is the absolute value of discretionary accruals. | DA | ·Qand | DA |2 ·Q are of particular interest because they capture differences in investment-Q sen-
sitivity across firms with a varying degree of accruals management. The quadratic term is
introduced to account for the possibility that the effect of accruals management may not be
linear. Time and firm fixed effects are included. We also replace firm fixed effects with indus-
try fixed effects in some specifications. Our industry definition is drawn from Fama/French’s
classification of 48 industries.
Table 2 reports the estimation results. The first column presents the standard investment
regression result as a benchmark. The second regression allows for the possibility of a linear
relationship between | DA | and the investment-Q sensitivity. The coefficient of | DA | ·Q is
positive and significant, indicating that investment is more sensitive to investment opportuni-
ties when accruals are actively managed. The third regression introduces a quadratic term,
10
| DA |2 ·Q to allow for the possibility that the marginal effect of | DA |2 ·Q may vary with
the size of | DA |. Once the quadratic term is introduced, the coefficient of | DA | ·Q nearly
quadruples from 0.0153 to 0.0590 and the statistical significance also improves. The quadratic
term is negative and statistically significant at the 1% level. The quadratic specification fits
the data better than a linear specification, lending support for the view that moderate accruals
management can improve the investment-Q sensitivity but an extreme usage of accruals can
rather hurt the investment-Q sensitivity. The last column adds cash flow, but the results remain
the same. Also note that the coefficients of Q vary little across the four regressions, suggest-
ing that | DA | adds additional explanatory power to the specification. Overall, the results
support our hypothesis that accruals management helps managers respond to the investment
opportunities more efficiently.
We next investigate whether the association between accruals management and the investments-
Q sensitivity changes with investment opportunities. Panel B of Table 1 shows that investment
increases with | DA | but the size of the increase differs considerably across different Q quar-
tiles. We further examine this dynamics by sorting the sample into two subgroups based on Q
and estimating the baseline specification separately for the two subsamples. Table 3 reports
the estimation results. The first two columns report the benchmark cases without | DA |. The
investment-Q sensitivity seems much higher for the low Q firms. The coefficient for the high
Q subgroup is only 0.0639 while the coefficient for the low Q subgroup is 0.1488, suggest-
ing that high Q firms may have more room for improvement in their investment response to
investment opportunities. The last two regressions present the results of our baseline specifi-
cation. The effect of discretionary accruals is pronounced in the high-Q subgroups as shown
by the linear and quadratic terms of | DA |. These estimates are similar to those in full sample
results (Table 2). As before, marginal increases in | DA | improves the investment-Q sensi-
tivity as long as the size of accruals are moderate. The estimates for the low Q subsample
are quite different. The quadratic term remains negative and significant, but the linear term,
| DA | ·Q, is no longer statistically significant. Overall, the documented association seems to
be mainly driven by high Q firms. This highlights the importance of strategic accruals man-
agement because accruals have bigger effects where they are needed the most. That is, the
effects are more pronounced in the subsample with relatively lower investment-Q sensitivity
11
in the benchmark cases (first two regressions). Furthermore, these firms are the ones with
strong growth potentials, for which investment decisions are especially critical.
3.2. Restatements
The concave relationship documented in the previous section suggests that the marginal
improvement in the investment-Q sensitivity diminishes with the size of discretionary accruals.
To corroborate this result, we consider a more extreme form of earnings management, finan-
cial misreporting that requires restatements in later dates. The degree of misreporting varies
considerably among restating firms from a minor misapplication of accounting principles to
an outright fraud. While accruals management is a legitimate tool that allows managers to
exert discretion over reported earnings across time, misreporting is a clear violation of GAAP,
resulting in SEC investigations or lawsuits in some cases. Because misreporting is more likely
to be driven by opportunistic earnings management, we do not expect such earnings manage-
ment to be associated with improvement in the investment-Q sensibility.
We start with the restatement announcement data provided by the United States General
Accoutring Office (GAO). The data contain announcements made between January 1997 and
June 2006. We then identify the misreporting periods corresponding to the restatement an-
nouncement by reading news articles in FACTIVA. Our final sample covers 2284 restating
firm-year observations between 1996 and 2004. The distribution of misreporting over the
sample period is reported in panel A of Table 4. On average, 6.6% of sample firms misreport
each year to restate their accounting statement in later dates. However, there is a strong time-
series trend in the frequency of misreporting. An incidence of misreporting is relatively rare
in early years with 46 incidences in 1996 and 98 in 1997. However, it gradually increases over
time to reach 421 incidences in 2004.
We modify the baseline investment specification by replacing |DA | with a restate dummy
variable as follows:
Iit = αi +β1 ·Restateit +β2 ·Restateit ·Qit−1 +β3 ·Qit−1 +β4 ·CFit−1 + γt + εit ,
12
where Restate is set to one if misreporting that subsequently results in restatements occurs
in the given firm-year. Note that a quadratic association cannot be tested in this setting be-
cause Restate is an indicator variable. Restate ·Q captures differences in the investment-Q
sensitivity between misreporting firms and non-restating firms. Panel B of Table 4 report the
estimation results. The first column presents a univariate analysis of investment for restating
firms and non-restating firms with year and firm fixed effects. The restate dummy is positive,
but only marginally significant (10%). The next two regressions show that the restate dummy
becomes negative and significant once Restate ·Q, Q, and cash flow are controlled for. The
main variable of interest, Restate ·Q, remains insignificant, suggesting that misreporting does
not facilitate a better alignment between investment and investment opportunities. It appears
that accruals are utilized strategically to improve investment decisions, but that fraudulent
accounting seems to be motivated by rather opportunistic behavior.
3.3. Quasi-Natural Experiment: The Sarbanes-Oxley Act and Earnings
Management
An important concern in the above results showing a strong, concave relationship between
earnings management and investment efficiency is the possible endogeneity coming from the
two choice variables. There could be an omitted variable that drives both investment and
earnings management. An ideal empirical setup would provide exogenous shocks to earnings
management for one group of firms and not for another. A comparison of changes in invest-
ment around the shock for the two groups of firms would yield a better estimate of the effect
of earnings management on investment. In this section, we employ an empirical approach to
address the concerns about possible endogeneity by employing a natural experiment in the
form of the Sarbanes-Oxley Act of 2002.
We examine the effects of earnings management on investment by using the passage
of SOX. SOX instituted a number of provisions including improving the composition and
function of audit committees, CEO and CFO financial statement certification, restrictions on
nonaudit-related work by the companys auditors, mandatory audit partner rotation, and an
annual report on internal controls. Empirical evidence shows that accruals management de-
13
creased quickly and significantly after SOX. Lobo and Zhou (2010) document lower discre-
tionary accruals post SOX. Koh, Matsumoto, and Rajgopal (2008) document that the propen-
sity to engage in income-increasing earnings management to meet or beat earnings bench-
marks has declined. Cohen et al. (2008) and Bartov and Cohen (2009) document that the
level of accruals-based earnings management declined in the post-SOX period while the level
of real activities manipulation increased, suggesting a shift from accruals management to real
management. In our sample, the average amount of discretionary accruals (in absolute value)
was 19.1% of total assets. After the enactment of SOX, the average value of discretionary
accruals fell to 13.2% of assets, representing a 31% decline in the use of discretionary accru-
als. We use this shock to the use of discretionary accruals to examine the impact of earnings
management on investment efficiency.
An important challenge is that the SOX Act was at the national level and hence affected
most firms in the US, complicating the formation of a good control group of firms. To deal
with this complication, we estimate changes in investment efficiency around SOX in two
ways. First, we estimate investment regressions with firm fixed effects and include a post-
SOX dummy variable. In this estimation, the firms in the sample are also the control group,
where the pre-SOX time years represents the control period and the post-SOX years the treat-
ment period. Specifically, we estimate the regression
Iit
Ki,t−1= αi + γt +β1 ·1(SOX)+β2 ·Qi,t−1 +β3Qi,t−1 ·1(SOX)+β4 ·CFi,t−1 + εit ,
where αi and γt are firm and year fixed effects, 1(SOX) is a dummy variable taking a value
of one in the years following the implementation of SOX. The coefficient β1 captures level
changes in investment rates around SOX and β3, the main coefficient of interest, captures
changes in investment sensitivity to Tobin’s Q in the post-SOX period.
The first column of Table 5 reports the estimation results for the post-SOX analysis of
investment efficiency. The coefficient on the interaction between Tobin’s Q and the post-SOX
dummy variable is negative and statistically significant, representing a decline in investment
efficiency following SOX. The value of the coefficient, -0.0227, represents a decline of about
14
27% in investment efficiency following the negative shock to the use of discretionary accruals
after the Sarbanes-Oxley Act.
An alternative approach to comparing investment investment efficiency before and after
SOX within the US is to compare changes in investment for firms affected by SOX to firms that
were not affected around the same time period. To this, we employ a difference-in-differences
(DID) estimator. The DID methodology we employ compares the effect of SOX on groups
affected by the regulation (treatment group) to those that are unaffected (control group). The
inferences are made by calculating the changes in investment levels and efficiency of treatment
firms around the event to the changes around the event for the control firms. We choose to
construct a set of control firms using data from Canada and the United Kingdom, as firms in
these countries tend to be affected by similar economic shocks as firms in the US but were
not subject to the changes brought on by SOX. Assuming that the control firms’ investment
policies are being driven by similar dynamics over time, it will allow us to control for common
economic shocks and also to alleviate potential bias due to other changes in law around SOX
that could have affected the treatment group.
To investigate the effect of SOX on investment efficiency in a DID framework, we estimate
the following regression:
Iit
Ki,t−1=αi+γt +δ·1(SOX)+ν·1(SOX) ·1(i=T )+η·1(SOX) ·1(i=T ) ·Qi,t−1+β1 ·Qi,t−1+β2 ·CFi,t−1+εit ,
where αi and γt are firm and year fixed effects, 1(SOX) is a dummy variable taking a value of one
in the years following the implementation of SOX and zero otherwise, and 1(i=T ) is a dummy
variable set equal to one for firms that belong to the treatment group and zero for firms in the
control group. The coefficient η on the interaction between the two indicator variables and
Tobin’s Q captures the difference-in-differences effect on investment and is the main estimate
of interest in the regression. The coefficient ν picks up the difference-in-differences effect on
investment levels.
15
A challenge with employing the DID methodology around the passage of SOX is that
there are other factors, both observable and unobservable, that may influence investment in
the United States and other countries around the enactment of SOX. The DID regression is
helpful in that it allows for the control of omitted variables that affect the treatment and control
group similarly. However, identification of the causal effect of SOX on investment requires
controlling for other shocks to the treatment group that may be correlated with the timing of
SOX. For example, the decline in investment efficiency around the passage of SOX may have
been more significant for US firms due to different sensitivities to the global business cycle.
We address this and related concerns in a variety of ways. First, we include firm level controls,
particularly Tobin’s Q and cash flow, to control for changing investment opportunities over
time. Second, in robustness checks7, we include industry by year fixed effects to control for
industry/time variation and find similar results.
Before reporting the results, we examine whether the use of Canadian and UK firms are
appropriate to use as controls. An important assumption in the way we construct treatment
and control groups is that the outcome in both groups would follow the same time trend in
the absence of the treatment. While this assumption is very difficult to verify, we can look at
pre-treatment trends to see if investment followed a similar pattern prior to the enactment of
SOX. Figure 1 shows mean investment rates for the two treatment and control groups around
the passage of SOX. The figure shows that investment rates for both treatment and control
firms moved roughly in parallel before the policy change. After the enactment of SOX, the
treatment firms show a slower rate of increase in investment rates compared to firms in Canada
and the UK. Figure 1 supports the assumption that trends in investment rates were similar
prior to the passage of SOX. We also examine changes in the full distribution of investment
for both treatment and control firms. In Figure 2 we plot the kernel densities of investment
rates for both treatment and control firms before and after the policy change. The distribution
of investment rates shifts to the left for the treatment firms but not significantly for the control
firms, suggesting the presence of an effect of SOX on corporate investment. The shift in the
density for the treatment group is statistically significant as the Kolmogorov-Smirnov test for
7Results available upon request.
16

the equality of the distributions is rejected at the 1% level. The figures show that there appears
to be a change in investment for treatment groups compared to control groups.
Columns (2) through (4) of Table 5 report the results of the DID regression. The second
column compares changes in investment efficiency for US firms compared to both UK and
Canadian firms. The coefficient on the interaction term between the treatment effect and
Tobin’s Q is negative and statistically significant with a magnitude of -0.0339, suggesting a
reduction in investment efficiency for US firms around the passage of SOX relative to firms
in Canada and the UK. Columns 3 and 4 repeat the difference-in-difference methodology
separately for Canadian and UK firms as control groups and find similar results. We also
note that the interaction between treatment/control and the SOX dummy is significant and
negative. The negative coefficient of -0.0327 suggests that investment rates were also affected
negatively by the passage of SOX. The magnitudes of changes in investment efficiency relative
to Canadian and UK firms are similar to the magnitude measured in the US only sample
reported in column 1. While the identifying assumptions differ across our approaches, the
results are consistent and lend support to the hypothesis that the decline in the use of earnings
management after SOX reduced investment efficiency for US firms.
3.4. Corporate governance and accruals management
The recent literature has focused on the opportunistic aspect of earnings management and
has linked earnings management to poor corporate governance. Klein (2002) and Agrawal and
Chadha (2005) document that independence of audit committee and corporate board is neg-
atively associated with earnings management and restatement. Kedia and Philippon (2009)
examine restating firms and report that firms with poor governance are more likely to misre-
port accounting statements to restate in later dates. Cornett, Marcus, and Tehranian (2008)
document that the usage of discretionary accruals is reduced by better governance measured
by institutional ownership of shares, institutional investor representation on the board of di-
rectors, and the presence of independent outside directors on the board. Cheng (2008) reports
that a larger board is associated with a smaller variation in accruals. However, these studies fo-
cus on the size of discretionary accruals and do not consider their interaction with investment
17
decisions. The size of discretionary accruals alone does not indicate whether they were used
for fraudulent accounting or to help align investment opportunities with internal or external
resources. While a corporate governance mechanism should be designed to deter account-
ing fraud, it should not discourage strategic management of accruals to the extent that it is
within the GAAP boundary and improves investment efficiency. If the strategic usage of dis-
cretionary accruals can improve investment decisions, we expect to observe the documented
concave relation in well governed firms as well. We test this hypothesis by examining the asso-
ciation between accruals management and investment sensitivity to investment opportunities
separately for well-governed and poorly-governed firms.
We sort the firms into two subgroups based on the degree of corporate governance. Five
measures of governance are employed including the G-index by Gompers, Ishii, and Metrick
(2003), E-index by Bebchuk, Cohen, and Ferrell (2009), and the presence of three individual
provisions (poison pill, classified board, and golden parachutes provisions). The absence of
each of the individual provisions is considered good governance, as the presence of those
provisions weakens the power of the shareholders in favor of managers. Similarly, a firm is
classified as having good governance if the value of G-index is lower than the median of its
distribution. As in Masulis, Wang, and Xie(2007) and Schmidt (2015), low E-index is defined
as those with an E-index smaller than three.
Table 6 summarizes the usage of accruals and other firm characteristics for the two sub-
groups. The first column shows that the differences in total accruals between the two sub-
groups are very small and statistically insignificant across all measures. The second column
reports that the absolute values of discretionary accruals are somewhat different across the
two subgroups. To the extent that these measures capture the quality of governance, better
governed firms tend to have higher absolute values of discretionary accruals. If the usage of
discretionary accruals were motivated exclusively by opportunistic reasons, we would expect
the usage of discretionary accruals to be higher for poorly governed firms. However, it ap-
pears that better governed firms do not discourage the usage of discretionary accruals. These
firms also seem to differ in other dimensions. Well governed firms invest more, have more
investment opportunities proxied by Q, and have more cash flows. The result is consistent
18
with the previous studies documenting a negative correlation between governance measures
and Tobin’s Q (Gompers, Ishii, and Metrick, 2003; Bebchuk, Cohen, and Ferrell, 2009).
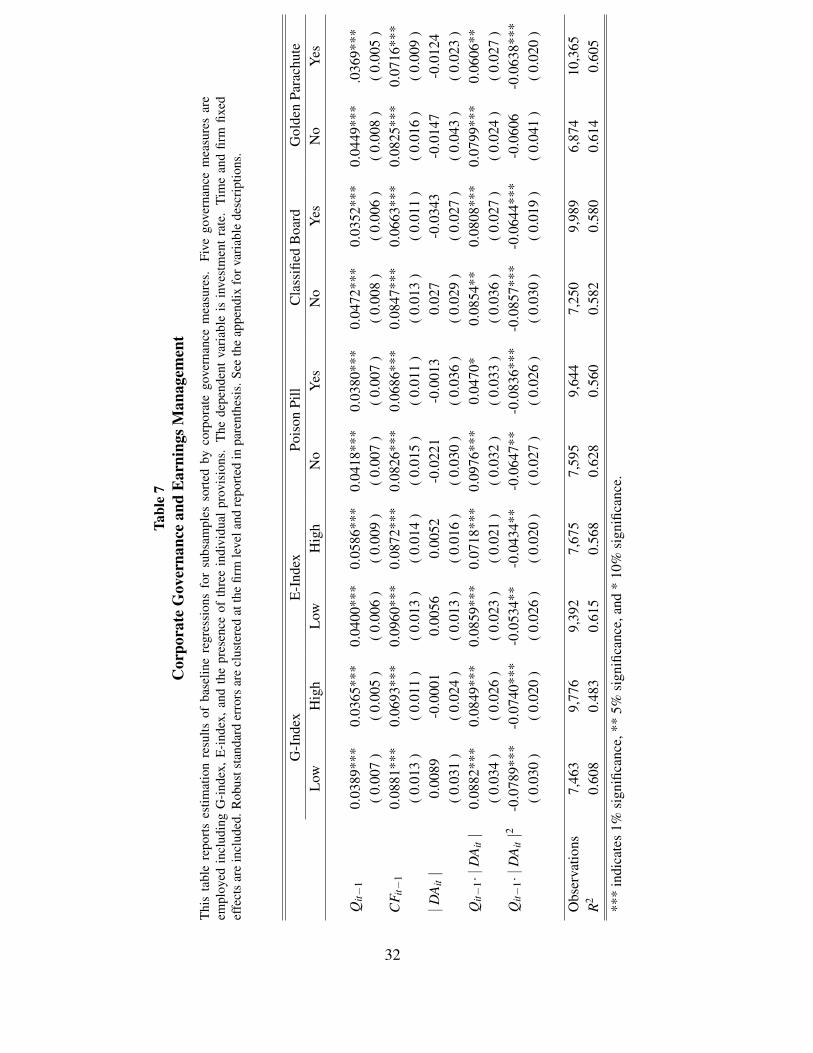
We next conduct a multivariate analysis by estimating the baseline specification for the
two subgroups separately. The first four columns of Table 7 report the regression results
for subgroups formed based on the G-index and E-index. In both cases, both well governed
and poorly governed subgroups show a concave relation between accruals managements and
investment-Q sensitivity. The next three columns sort the firms based on the presence of
each of the individual provisions. The results are similar regardless of which of the three
governance measures is used. A small exception is that when a golden parachute provision
is utilized, the quadratic term is not statistically significant for well governed firms. Overall,
the concave relationship is present for both well-governed and poorly-governed firms. The
evidence is consistent with our view that accruals management can be utilized to enhance the
corporate investment response to investment opportunities.
4. Conclusion
We empirically investigate the relationship between intertemporal transfer of earnings and
the efficiency of corporate investment decisions. Using the absolute value of discretionary
accruals as a measure of such earnings management, we document that earnings management
exhibits a concave relationship with the investment sensitivity to investment opportunities as
measured by Tobin’s Q. We find that the relationship between earnings management and in-
vestment efficieny is concentrated among firms with relatively high investment opportunities.
The effect is present among firms with good corporate governance measures, suggesting that
better governed firms manage accruals strategically. The concave relationship suggests that the
marginal impact of earnings management on investment efficiency decreases with the amount
of earnings management. Using misreporting that leads to restatement in future dates, we
document that a more severe form of earnings management does not improve investment effi-
ciency. We implement a difference-in-differences (DID) methodology to disentangle causality
in a quasi-experimental setting around the passage of the Sarbanes-Oxley Act. We find a large
19

reduction in investment efficiency for US firms (treatment group) relative to those in UK and
Canada (control group) around the passage of SOX. Taken together, these results support the
view that a moderate amount of earnings management helps improve corporate investment
decisions while an excessive amount undoes the potential benefit of earnings management.
20
ReferencesAgrawal, A., Chadha, S., 2005. Corporate Governance and Accounting Scandals, Journalof Law and Economics 48, 371–406.
Almeida, H., Fos, V., and Kronlund, M., 2016, The Real Effects of Share Repurchases, Jour-nal of Financial Economics 119, 168-185.
Arif, S., N. Marshall and T.L. Yohn, 2016, Understanding the relation between accruals andvolatility: A real options-based investment approach, Journal of Accounting and Economics62, 65–86.
Baber, W., Fairfield, P., and Haggard, J., 1991. The effect of concern about reported income ondiscretionary spending decisions: The case of research and development. Accounting Review66, 818-829.
Badertscher, B., 2011, Overvaluation and the Choice of Alternative Earnings ManagementMechanisms, Accounting Review 86, 1491–1518.
Baker, M., Stein, J., and Wurgler, J., 2003, When Does the Market Matter? Stock Pricesand the Investment of Equity-Dependent Firms, Quarterly Journal of Economics 118, 969–1005.
Bartov, E., 1993, The timing of assets sales and earnings manipulation. Accounting Review68, 840–855.
Bartov, E., and Cohen, D., 2009, The numbers game in the pre- and post-Sarbanes-Oxleyeras, Journal of Accounting, Auditing & Finance 24, 505–534.
Bebchuk, L., Cohen, A., Ferrell, A., 2009. What matters in corporate governance? Review ofFinancial Studies 22, 783-827.
Benish, B., 1999, Incentives and Penalties Related to Earnings Overstatements that ViolateGAAP. Accounting Review 74, 425–457.
Bergstresser, D., Philippon, T., 2006, CEO Incentives and Earnings Management, Journalof Financial Economics 80, 511–529.
Bergstresser, D., Desai, M., and Rauh, J., 2006, Earnings Manipulation, Pension Assump-tions and Managerial Investment Decisions, Quarterly Journal of Economics 121, 157–195.
Burns, N., Kedia, S., 2006, The Impact of Performance-Based Compensation on Misreport-
21
ing, Journal of Financial Economics 79, 35–67.
Burns, N., Kedia, S., and Lipson, M., 2010, Institutional Ownership and Monitoring: Evi-dence from Financial Misreporting, Journal of Corporate Finance 16, 443–455.
Bushee, B. 1998, The influence of institutional investors on myopic R&D investment be-havior, Accounting Review 73, 305-333.
Chen, J., Gu, Z., and Tang, Y., 2008, Causes or Consequences? Earnings Management aroundSeasoned Equity Offerings, Working Paper.
Cheng, S., 2004, R&D Expenditures and CEO Compensation, The Accounting Review 79,305–328.
Cheng, S., 2008, Board Size and the Variability of Corporate Performance, Journal of Fi-nancial Economics 87, 157–176.
Cohen, D., Dey, A., and Lys, T., 2008, Real and accrual-based earnings management in thepre- and post-Sarbanes-Oxley periods, Accounting Review 83, 757–787.
Cohen, D., Zarowin, P., 2010, Accrual-based and real earnings management activities aroundseasoned equity offerings, Journal of Accounting and Economics 50, 2–19.
Cornett, M., Marcus, A., and Tehranian, H., 2008, Corporate Governance and Pay-for-Performance:The Impact of Earnings Management, Journal of Financial Economics 87, 357–373.
Dechow, P., 1994, Accounting earnings and cash flows as measures of firm performance:The role of accounting accruals, Journal of Accounting and Economics 18, 3-42.
Dechow, P., Sloan, R., 1991, Executive incentives and the horizon problem: An empiricalinvestigation, Journal of Accounting and Economics 14, 51-89.
Dechow, P., Kothari, S., Watts, R., 1998, The Relation Between Earnings and Cash Flows,Journal of Accounting and Economics 25, 133-168.
Dechow, P., Sloan, R., and Sweeney, A., 1995, Detecting Earnings Management, Account-ing Review 70 No.2, 193–225.
Dechow, P., Sloan, R., and Sweeney, A., 1996, Causes and Consequences of Earnings Manip-ulation: An Analysis of Firms Subject to Enforcement Actions by the SEC, ComptemporaryAccounting Research 13 No.1, 1–36.
Desai, H., Hogan, C., and Wilkins, M., 2006, The Reputational Penalty for Aggressive Ac-
22

counting: Earnings Restatements and Management Turnover, Accounting Review 81, 83–112.
DuCharme, L., Malatesta, P., and Sefcik, S., 2004, Earnings Management, Stock Issues, andShareholder Lawsuits, Journal of Financial Economics 71, 27–49.
Efendi, J., Srivastava, A., and Swanson, E., 2007, Why Do Corporate Managers MisstateFinancial Statements? The Role of Option Compensation and Other Factors, Journal of Fi-nancial Economics 85, 667–708.
Gompers, P., Ishii, J., and Metrick, A., 2003, Corporate Governance and Equity Prices, TheQuarterly Journal of Economics 118, 107-155.
Graham, J., Harvey, C., and Rajgopal, S., 2005, The Economic implications of corporatefinancial reporting, Journal of Accounting and Economics 40, 3–73.
Graham, J., Li, S., and Qiu, J., 2008, Corporate Misreporting and Bank Loan Contracting,Journal of Financial Economics 89, 44–61.
Gunny, K., 2010, The relation between earnings management using real activities manipu-lation and future performance: Evidence from meeting earnings benchmarks, ContemporaryAccounting Research 27, 855–888.
Healy, P., Wahlen, J., 1999, A Review of the Earnings Management Literature and Its Im-plications for Standard Setting, Accounting Horizons 13, 365–383.
Herrmann, D., Inoue, T., and Thomas, W., 2003. The sale of assets to manage earnings inJapan. Journal of Accounting Research 41, 89–108.
Hribar, P. and Collins, D., 2002, Errors in estimating accruals: implications for empiricalresearch, Journal of Accounting Research 40, 105–134.
Hribar, N., Johnson, W., 2006. Stock repurchases as an earnings management device. Journalof Accounting and Economics 41, 3-27.
Jackson, S., Wilcox, W., 2000, Do managers grant sales price reductions to avoid losses anddeclines in earnings and sales? Quarterly Journal of Business and Economics 39, 3-20.
Jones, J., 1991, Earnings Management During Import Relief Investigations, Journal of Ac-counting Research 29 No.2, 193-228.
Karpoff, J., Lee, D., and Martin, G., 2008, The Cost to Firms of Cooking the Books, Journalof Financial and Quantitative Analysis 43, 581–612.
23
Karpoff, J., R. Schonlau, and E. Wehrly. 2016. Do takeover defense indices measure takeoverdeterrence? Working Paper.
Kedia, S., Philippon, T., 2009, The Economics of Fraudulent Accounting, The Review of Fi-nancial Studies 22, 2169–2199.
Klein, A., 2002. Audit committee, board of director characteristics, and earnings manage-ment, Journal of Accounting and Economics 33, 375–400.
Koh, K., Matsumoto, D., and Rajgopal, S., 2008, Meeting or beating analyst expectationsin the post-scandals world: changes in stock market rewards and managerial actions, Contem-porary Accounting Research 25, 1067–98.
Linck, J., Netter, J., and Shu, T., 2013, Can Managers Use Discretionary Accruals to EaseFinancial Constraints? Evidence from Discretionary Accruals Prior to Investment, Account-ing Review 88, 2117–2143.
Lobo, G., Zhou, J., 2010, Changes in discretionary financial reporting behavior followingthe Sarbanes-Oxley act, Journal of Accounting, Auditing and Finance 25, 1-26.
Masulis, R.W., Wang,C., Xie, F., 2007.Corporate governance and acquirer returns. Journalof Finance 62,1851-1889.
McNichols, M., Stubben, S., 2008, Does Earnings Management Affect Firms’ InvestmentDecisions?, Accounting Review 83, 1571-1603.
Palmrose, Z., Richardson, V., and Scholz, S., 2004, Determinants of Market Reactions toRestatement Announcements, Journal of Accounting and Economics 37, 59–89.
Plumlee, M., Yohn, T., 2010. An Analysis of the Underlying Causes Attributed to Restate-ments, Accounting Horizons 24, 41–64
Roychowdhury, S. 2006. Earnings management through real activities manipulation. Jour-nal of Accounting and Economics 42(3): 335-370.
Schmidt, B., 2015. Costs and benefits of friendly boards during mergers and acquisitions.Journal of Financial economics 117, 424-447.
Subramanyam, K., 1996, The pricing of discretionary accruals, Journal of Accounting andEconomics, 1996 22, 249–281.
Teoh, S., Wong, T., 2002, Why New Issues and High-Accrual Firms Underperform: TheRole of Analysts’ Credulity, The Review of Financial Studies 15 No.3, 869–900.
24

Teoh, S., Welch, I., and Wong, T., 1998a, Earnings Management and the Long-Run Mar-ket Performance of Initial Public Offerings, The Journal of Finance 53, 1935–1974.
Teoh, S., Welch, I., and Wong, T., 1988b, Earnings Management and the Underperformanceof Seasoned Equity Offerings, Journal of Financial Economics 50, 63–99.
Wang, T., Winton, A., and Yu, X., 2010, Corporate Fraud and Business Conditions: Evi-dence from IPOs, Journal of Finance 65, 2255–2292.
Wilson, W., 2008, An Empirical Analysis of the Decline in the Information Content of Earn-ings Following Restatements, Accounting Review 83. 519–548.
Wu, J., Zhang, L., and X. Zhang, 2010, The q-theory approach to understanding the accrualanomaly, Journal of Accounting Research, 48, 177–224.
Yu, F., 2008, Analyst Coverage and Earnings Management, Journal of Financial Economics88, 245–271.
Zang, A., 2012, Evidence on the trade-off between real activities manipulation and accrual-based earnings management, Accounting Review 87, 675–703.
Zhang, X, 2007, Accruals, investment, and the accrual anomaly, Accounting Review 82, 1333–1363.
25

Table 1Summary Statistics
Panel A summarizes firm characteristics for our sample between 1989 and 2012. Investment and cash flow arescaled by beginning-of-year capital measured by property, plant and equipment. Discretionary accrual (DA)is a discretionary portion of total accruals, which is defined as net income minus cash flow from operations.DA is estimated by a cross-sectional version of the modified Jones model, expressed as percentage of laggedassets. Corporate governance data cover the period between 1990 and 2007. Panel B reports investment ratesfor subsamples sorted on lagged Q and | DA |. The sample is first sorted into four quartiles based on lagged Q,and then each of the four subsamples is further sorted into four quartiles based on | DA |. See the appendix forvariable descriptions.
Panel A: Firm Characteristics
Variable N Mean Q1 Median Q3 Std. Dev.Firm CharacteristicsInvestment 99,647 0.34 0.11 0.21 0.39 0.42Lagged Q 99,647 1.92 1.05 1.40 2.14 1.56Lagged Cash Flow 99,647 0.62 0.08 0.27 0.65 1.61Leverage 99,647 0.25 0.04 0.20 0.37 0.46Discretionary AccrualsDA 99,647 -0.005 -0.078 -0.005 0.066 0.349| DA | 99,647 0.122 0.022 0.055 0.125 0.204Corporate GovernanceG-Index 17,491 9.05 7.00 9.00 11.00 2.75E-Index 17,491 2.28 1 2 3 1.33Number (%) of firm-year observations with the provisionsPoison Pill 14,084 53.4%Classified Board 15,473 58.6%Golden Parachutes 16,185 61.3%
Panel B: Mean Investment Rates by Lagged Q − | DA | QuartilesLagged Q
| DA | 1st quartile 2nd quartile 3rd quartile 4th quartile1st quartile 0.182 0.238 0.304 0.4802nd quartile 0.189 0.246 0.315 0.4923rd quartile 0.201 0.259 0.341 0.5354th quartile 0.236 0.309 0.407 0.648
26

Table 2Accruals Management and Investment
This table presents estimation results of the baseline specification:
Iit = αi +β1· | DAit |+β2· | DAit | ·Qit−1 +β3· | DAit |2 ·Qit−1 +β4 ·Qit−1 +β5 ·CFit−1 + γt + εit ,
where the dependent variable is investment scaled by beginning-of-year capital. Firm and year fixed effects areincluded. Standard errors are clustered at the firm level and reported in parenthesis.
(1) (2) (3) (4)
Qit−1 0.0751*** 0.0811*** 0.0775*** 0.0664***(0.002) (0.003) (0.003) (0.003)
CFit−1 0.0775*** 0.0778***(0.002) (0.002)
| DAit | 0.0877*** 0.0837*** 0.0731***(0.015) (0.014) (0.014)
Qit−1· | DAit | 0.0153** 0.0590*** 0.0635***(0.007) (0.014) (0.013)
Qit−1· | DAit |2 -0.0427*** -0.0445***(0.012) (0.012)
Constant 0.2337*** 0.2230*** 0.2254*** 0.2055***(0.007) (0.008) (0.008) (0.008)
Observations 99,647 99,647 99,647 99,647R2 0.475 0.439 0.439 0.478
*** indicates 1% significance and ** indicates 5% significance.
27

Table 3Subsample Analysis: High Q vs. Low Q
This table estimates the following baseline specification for two subsamples sorted on Q.
Iit = αi +β1· | DAit |+β2· | DAit | ·Qit−1 +β3· | DAit |2 ·Qit−1 +β4 ·Qit−1 +β5 ·CFit−1 + γt + εit ,
where the dependent variable is investment scaled by beginning-of-year capital. Firm and year fixed effects areincluded. Standard errors are clustered at the firm level and reported in parenthesis.
(1) (2) (3) (4)High Q Low Q High Q Low Q
Qit−1 0.0639*** 0.1488*** 0.0563*** 0.1469***(0.003) (0.010) (0.003) (0.011)
CFit−1 0.0787*** 0.0754*** 0.0790*** 0.0756***(0.003) (0.004) (0.003) (0.005)
| DAit | 0.1051*** 0.069(0.028) (0.050)
Qit−1· | DAit | 0.0513*** 0.061(0.016) (0.052)
Qit−1· | DAit |2 -0.0399*** -0.0719***(0.013) (0.024)
Constant 0.3329*** 0.1023*** 0.2955*** 0.0764***(0.016) (0.012) (0.017) (0.013)
Observations 51,410 51,409 50,412 49,235R2 0.528 0.478 0.529 0.473
*** indicates 1% significance and ** indicates 5% significance.
28
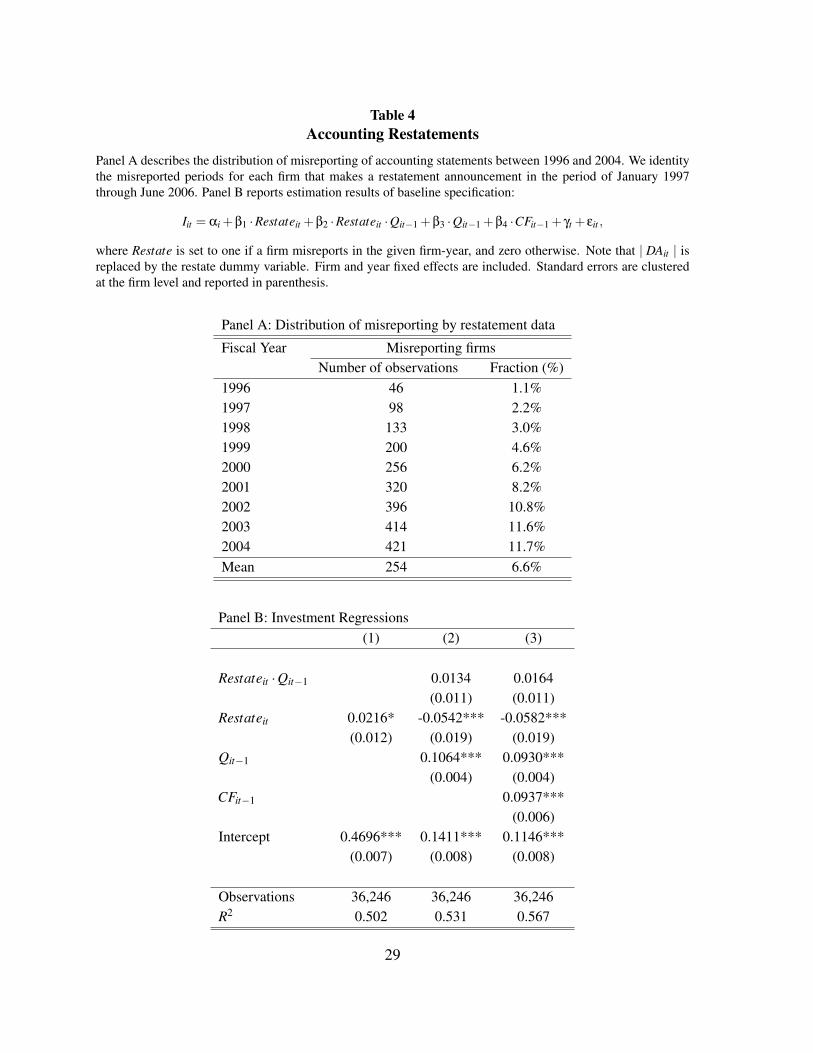
Table 4Accounting Restatements
Panel A describes the distribution of misreporting of accounting statements between 1996 and 2004. We identitythe misreported periods for each firm that makes a restatement announcement in the period of January 1997through June 2006. Panel B reports estimation results of baseline specification:
Iit = αi +β1 ·Restateit +β2 ·Restateit ·Qit−1 +β3 ·Qit−1 +β4 ·CFit−1 + γt + εit ,
where Restate is set to one if a firm misreports in the given firm-year, and zero otherwise. Note that | DAit | isreplaced by the restate dummy variable. Firm and year fixed effects are included. Standard errors are clusteredat the firm level and reported in parenthesis.
Panel A: Distribution of misreporting by restatement data
Fiscal Year Misreporting firmsNumber of observations Fraction (%)
1996 46 1.1%1997 98 2.2%1998 133 3.0%1999 200 4.6%2000 256 6.2%2001 320 8.2%2002 396 10.8%2003 414 11.6%2004 421 11.7%Mean 254 6.6%
Panel B: Investment Regressions(1) (2) (3)
Restateit ·Qit−1 0.0134 0.0164(0.011) (0.011)
Restateit 0.0216* -0.0542*** -0.0582***(0.012) (0.019) (0.019)
Qit−1 0.1064*** 0.0930***(0.004) (0.004)
CFit−1 0.0937***(0.006)
Intercept 0.4696*** 0.1411*** 0.1146***(0.007) (0.008) (0.008)
Observations 36,246 36,246 36,246R2 0.502 0.531 0.567
29
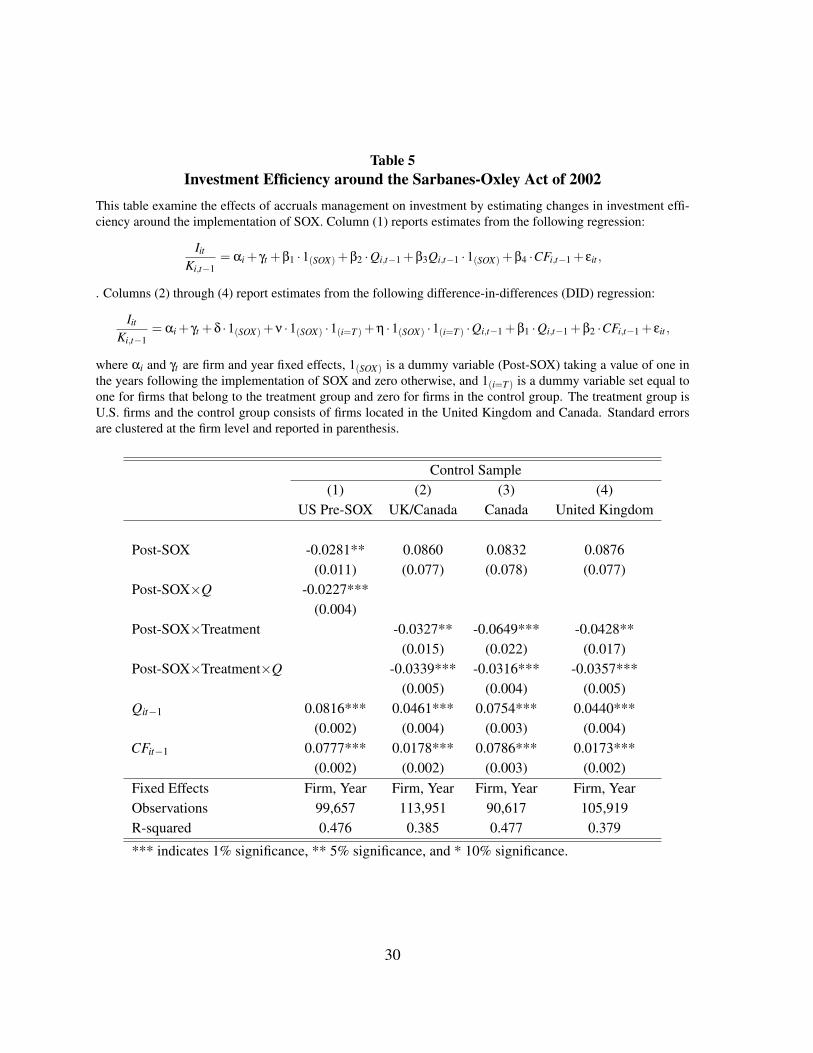
Table 5Investment Efficiency around the Sarbanes-Oxley Act of 2002
This table examine the effects of accruals management on investment by estimating changes in investment effi-ciency around the implementation of SOX. Column (1) reports estimates from the following regression:
Iit
Ki,t−1= αi + γt +β1 ·1(SOX)+β2 ·Qi,t−1 +β3Qi,t−1 ·1(SOX)+β4 ·CFi,t−1 + εit ,
. Columns (2) through (4) report estimates from the following difference-in-differences (DID) regression:
Iit
Ki,t−1= αi + γt +δ ·1(SOX)+ν ·1(SOX) ·1(i=T )+η ·1(SOX) ·1(i=T ) ·Qi,t−1 +β1 ·Qi,t−1 +β2 ·CFi,t−1 + εit ,
where αi and γt are firm and year fixed effects, 1(SOX) is a dummy variable (Post-SOX) taking a value of one inthe years following the implementation of SOX and zero otherwise, and 1(i=T ) is a dummy variable set equal toone for firms that belong to the treatment group and zero for firms in the control group. The treatment group isU.S. firms and the control group consists of firms located in the United Kingdom and Canada. Standard errorsare clustered at the firm level and reported in parenthesis.
Control Sample(1) (2) (3) (4)
US Pre-SOX UK/Canada Canada United Kingdom
Post-SOX -0.0281** 0.0860 0.0832 0.0876(0.011) (0.077) (0.078) (0.077)
Post-SOX×Q -0.0227***(0.004)
Post-SOX×Treatment -0.0327** -0.0649*** -0.0428**(0.015) (0.022) (0.017)
Post-SOX×Treatment×Q -0.0339*** -0.0316*** -0.0357***(0.005) (0.004) (0.005)
Qit−1 0.0816*** 0.0461*** 0.0754*** 0.0440***(0.002) (0.004) (0.003) (0.004)
CFit−1 0.0777*** 0.0178*** 0.0786*** 0.0173***(0.002) (0.002) (0.003) (0.002)
Fixed Effects Firm, Year Firm, Year Firm, Year Firm, YearObservations 99,657 113,951 90,617 105,919R-squared 0.476 0.385 0.477 0.379
*** indicates 1% significance, ** 5% significance, and * 10% significance.
30
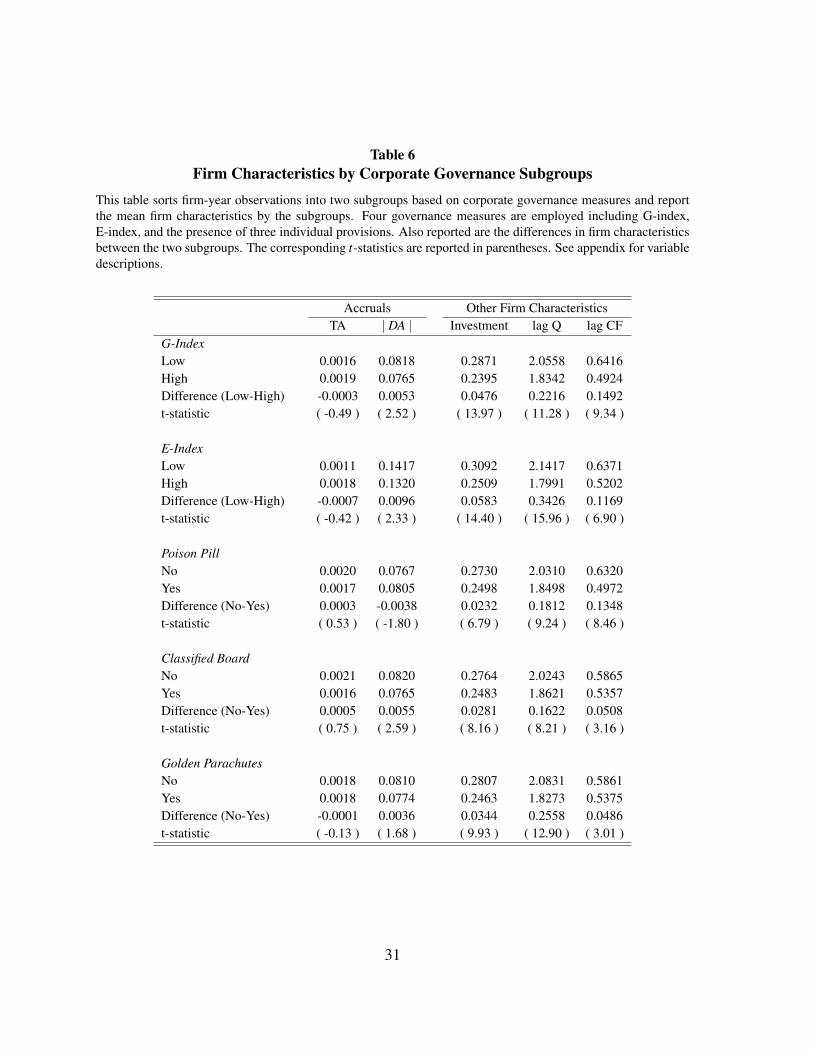
Table 6Firm Characteristics by Corporate Governance Subgroups
This table sorts firm-year observations into two subgroups based on corporate governance measures and reportthe mean firm characteristics by the subgroups. Four governance measures are employed including G-index,E-index, and the presence of three individual provisions. Also reported are the differences in firm characteristicsbetween the two subgroups. The corresponding t-statistics are reported in parentheses. See appendix for variabledescriptions.
Accruals Other Firm CharacteristicsTA | DA | Investment lag Q lag CF
G-IndexLow 0.0016 0.0818 0.2871 2.0558 0.6416High 0.0019 0.0765 0.2395 1.8342 0.4924Difference (Low-High) -0.0003 0.0053 0.0476 0.2216 0.1492t-statistic ( -0.49 ) ( 2.52 ) ( 13.97 ) ( 11.28 ) ( 9.34 )
E-IndexLow 0.0011 0.1417 0.3092 2.1417 0.6371High 0.0018 0.1320 0.2509 1.7991 0.5202Difference (Low-High) -0.0007 0.0096 0.0583 0.3426 0.1169t-statistic ( -0.42 ) ( 2.33 ) ( 14.40 ) ( 15.96 ) ( 6.90 )
Poison PillNo 0.0020 0.0767 0.2730 2.0310 0.6320Yes 0.0017 0.0805 0.2498 1.8498 0.4972Difference (No-Yes) 0.0003 -0.0038 0.0232 0.1812 0.1348t-statistic ( 0.53 ) ( -1.80 ) ( 6.79 ) ( 9.24 ) ( 8.46 )
Classified BoardNo 0.0021 0.0820 0.2764 2.0243 0.5865Yes 0.0016 0.0765 0.2483 1.8621 0.5357Difference (No-Yes) 0.0005 0.0055 0.0281 0.1622 0.0508t-statistic ( 0.75 ) ( 2.59 ) ( 8.16 ) ( 8.21 ) ( 3.16 )
Golden ParachutesNo 0.0018 0.0810 0.2807 2.0831 0.5861Yes 0.0018 0.0774 0.2463 1.8273 0.5375Difference (No-Yes) -0.0001 0.0036 0.0344 0.2558 0.0486t-statistic ( -0.13 ) ( 1.68 ) ( 9.93 ) ( 12.90 ) ( 3.01 )
31
Tabl
e7
Cor
pora
teG
over
nanc
ean
dE
arni
ngsM
anag
emen
tT
his
tabl
ere
port
ses
timat
ion
resu
ltsof
base
line
regr
essi
ons
for
subs
ampl
esso
rted
byco
rpor
ate
gove
rnan
cem
easu
res.
Five
gove
rnan
cem
easu
res
are
empl
oyed
incl
udin
gG
-ind
ex,
E-i
ndex
,an
dth
epr
esen
ceof
thre
ein
divi
dual
prov
isio
ns.
The
depe
nden
tva
riab
leis
inve
stm
ent
rate
.Ti
me
and
firm
fixed
effe
cts
are
incl
uded
.Rob
usts
tand
ard
erro
rsar
ecl
uste
red
atth
efir
mle
vela
ndre
port
edin
pare
nthe
sis.
See
the
appe
ndix
forv
aria
ble
desc
ript
ions
.
G-I
ndex
E-I
ndex
Pois
onPi
llC
lass
ified
Boa
rdG
olde
nPa
rach
ute
Low
Hig
hL
owH
igh
No
Yes
No
Yes
No
Yes
Qit−
10.
0389
***
0.03
65**
*0.
0400
***
0.05
86**
*0.
0418
***
0.03
80**
*0.
0472
***
0.03
52**
*0.
0449
***
.036
9***
(0.0
07)
(0.0
05)
(0.0
06)
(0.0
09)
(0.0
07)
(0.0
07)
(0.0
08)
(0.0
06)
(0.0
08)
(0.0
05)
CF i
t−1
0.08
81**
*0.
0693
***
0.09
60**
*0.
0872
***
0.08
26**
*0.
0686
***
0.08
47**
*0.
0663
***
0.08
25**
*0.
0716
***
(0.0
13)
(0.0
11)
(0.0
13)
(0.0
14)
(0.0
15)
(0.0
11)
(0.0
13)
(0.0
11)
(0.0
16)
(0.0
09)
|DA
it|
0.00
89-0
.000
10.
0056
0.00
52-0
.022
1-0
.001
30.
027
-0.0
343
-0.0
147
-0.0
124
(0.0
31)
(0.0
24)
(0.0
13)
(0.0
16)
(0.0
30)
(0.0
36)
(0.0
29)
(0.0
27)
(0.0
43)
(0.0
23)
Qit−
1·|D
Ait|
0.08
82**
*0.
0849
***
0.08
59**
*0.
0718
***
0.09
76**
*0.
0470
*0.
0854
**0.
0808
***
0.07
99**
*0.
0606
**(0
.034
)(0
.026
)(0
.023
)(0
.021
)(0
.032
)(0
.033
)(0
.036
)(0
.027
)(0
.024
)(0
.027
)Q
it−
1·|D
Ait|2
-0.0
789*
**-0
.074
0***
-0.0
534*
*-0
.043
4**
-0.0
647*
*-0
.083
6***
-0.0
857*
**-0
.064
4***
-0.0
606
-0.0
638*
**(0
.030
)(0
.020
)(0
.026
)(0
.020
)(0
.027
)(0
.026
)(0
.030
)(0
.019
)(0
.041
)(0
.020
)
Obs
erva
tions
7,46
39,
776
9,39
27,
675
7,59
59,
644
7,25
09,
989
6,87
410
,365
R2
0.60
80.
483
0.61
50.
568
0.62
80.
560
0.58
20.
580
0.61
40.
605
***
indi
cate
s1%
sign
ifica
nce,
**5%
sign
ifica
nce,
and
*10
%si
gnifi
canc
e.
32
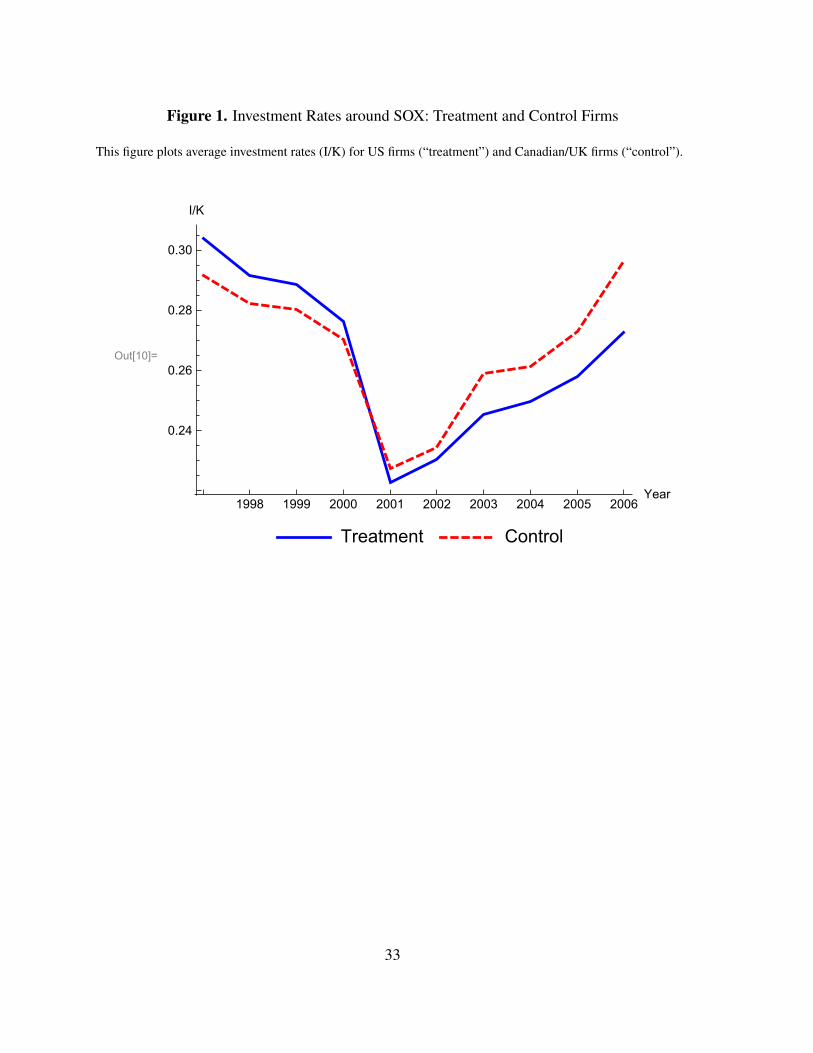
Figure 1. Investment Rates around SOX: Treatment and Control Firms
This figure plots average investment rates (I/K) for US firms (“treatment”) and Canadian/UK firms (“control”).
Out[10]=
1998 1999 2000 2001 2002 2003 2004 2005 2006Year
0.24
0.26
0.28
0.30
I/K
Treatment Control
33
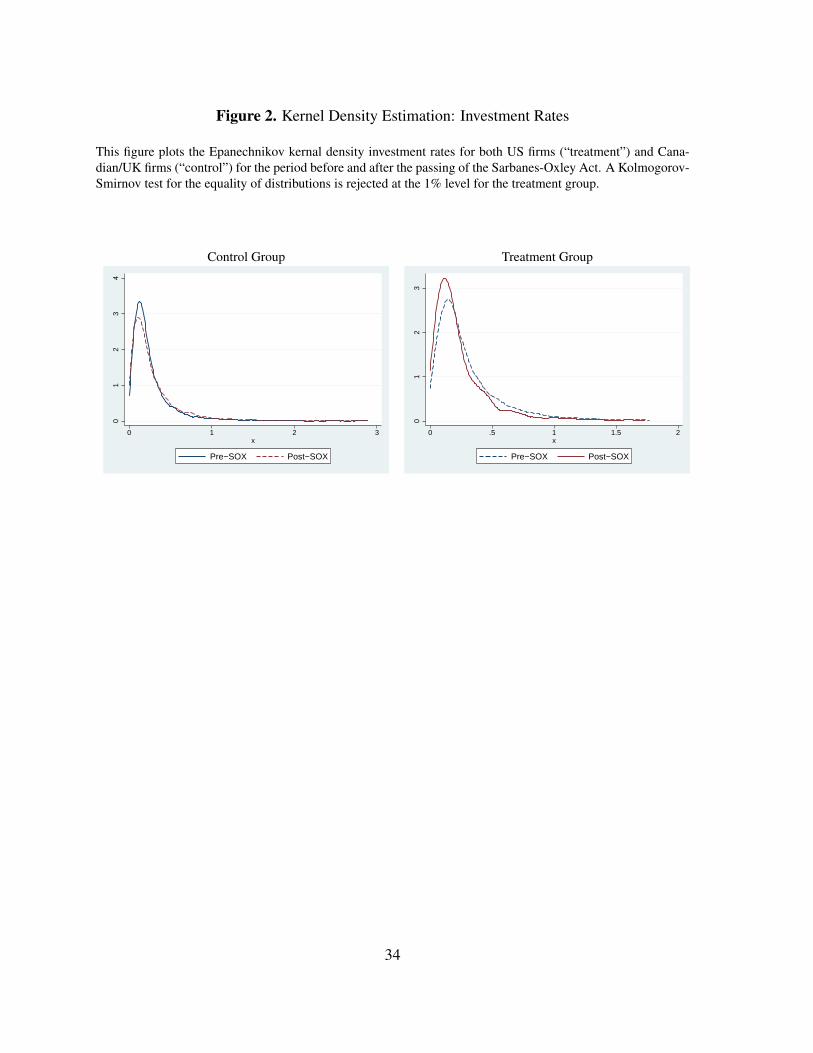
Figure 2. Kernel Density Estimation: Investment Rates
This figure plots the Epanechnikov kernal density investment rates for both US firms (“treatment”) and Cana-dian/UK firms (“control”) for the period before and after the passing of the Sarbanes-Oxley Act. A Kolmogorov-Smirnov test for the equality of distributions is rejected at the 1% level for the treatment group.
Control Group Treatment Group
01
23
4
0 1 2 3x
Pre−SOX Post−SOX
01
23
0 .5 1 1.5 2x
Pre−SOX Post−SOX
34
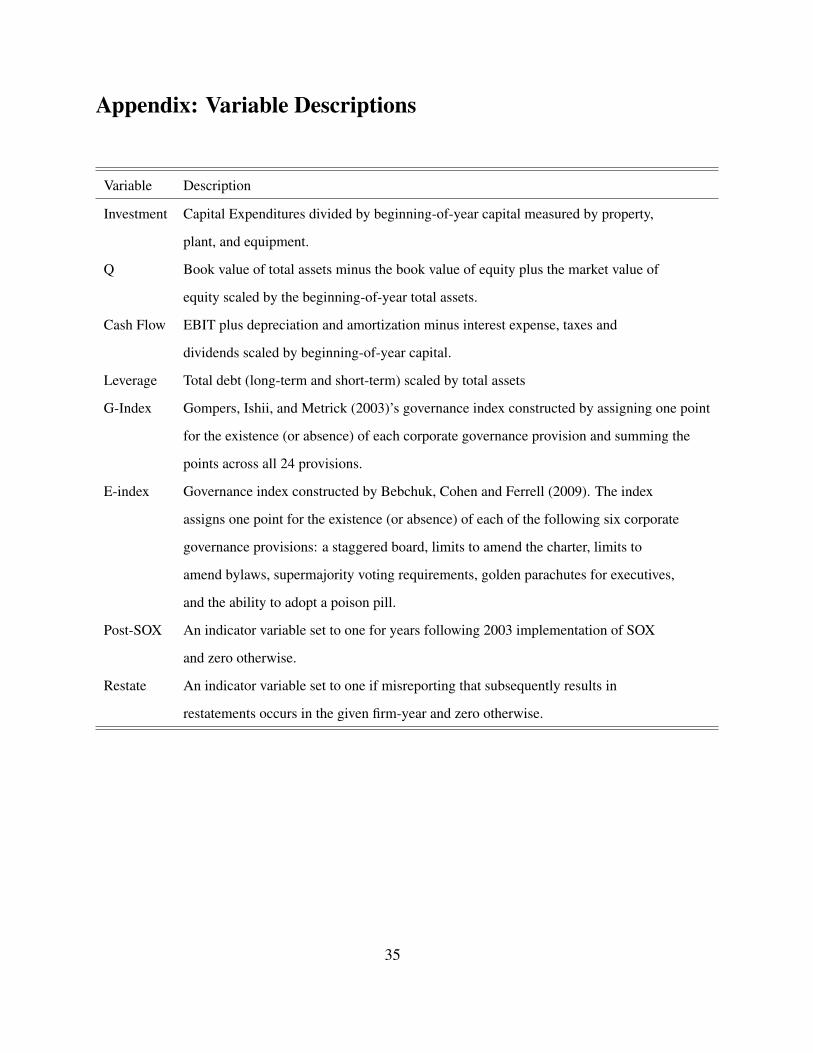
Appendix: Variable Descriptions
Variable Description
Investment Capital Expenditures divided by beginning-of-year capital measured by property,
plant, and equipment.
Q Book value of total assets minus the book value of equity plus the market value of
equity scaled by the beginning-of-year total assets.
Cash Flow EBIT plus depreciation and amortization minus interest expense, taxes and
dividends scaled by beginning-of-year capital.
Leverage Total debt (long-term and short-term) scaled by total assets
G-Index Gompers, Ishii, and Metrick (2003)’s governance index constructed by assigning one point
for the existence (or absence) of each corporate governance provision and summing the
points across all 24 provisions.
E-index Governance index constructed by Bebchuk, Cohen and Ferrell (2009). The index
assigns one point for the existence (or absence) of each of the following six corporate
governance provisions: a staggered board, limits to amend the charter, limits to
amend bylaws, supermajority voting requirements, golden parachutes for executives,
and the ability to adopt a poison pill.
Post-SOX An indicator variable set to one for years following 2003 implementation of SOX
and zero otherwise.
Restate An indicator variable set to one if misreporting that subsequently results in
restatements occurs in the given firm-year and zero otherwise.
35