Embed Size (px)
Citation preview
TM
ecycled paper.
CREDIT SAISON Co., Ltd. Annual Report 2004
N E X TC
RE
DIT
SA
ISO
N C
o., L
td. A
nn
ua
l Re
po
rt 20
04
N E X T
24
18
12
6
-6
0
Net Income (Loss) (left scale)ROE (right scale)
2,000
1,500
1,000
500
0
2.0
1.5
1.0
0.5
0
10
8
6
4
2
0
Total Assets (left scale)ROA (right scale)
250
150
100
50
0
200
00 01 02 03 04 00 01 02 03 0400 01 02 03 04
Financial Highlights
Thousands ofU.S. dollars
Millions of yen % change (Note 3)
2004 2003 2002 2004/2003 2004
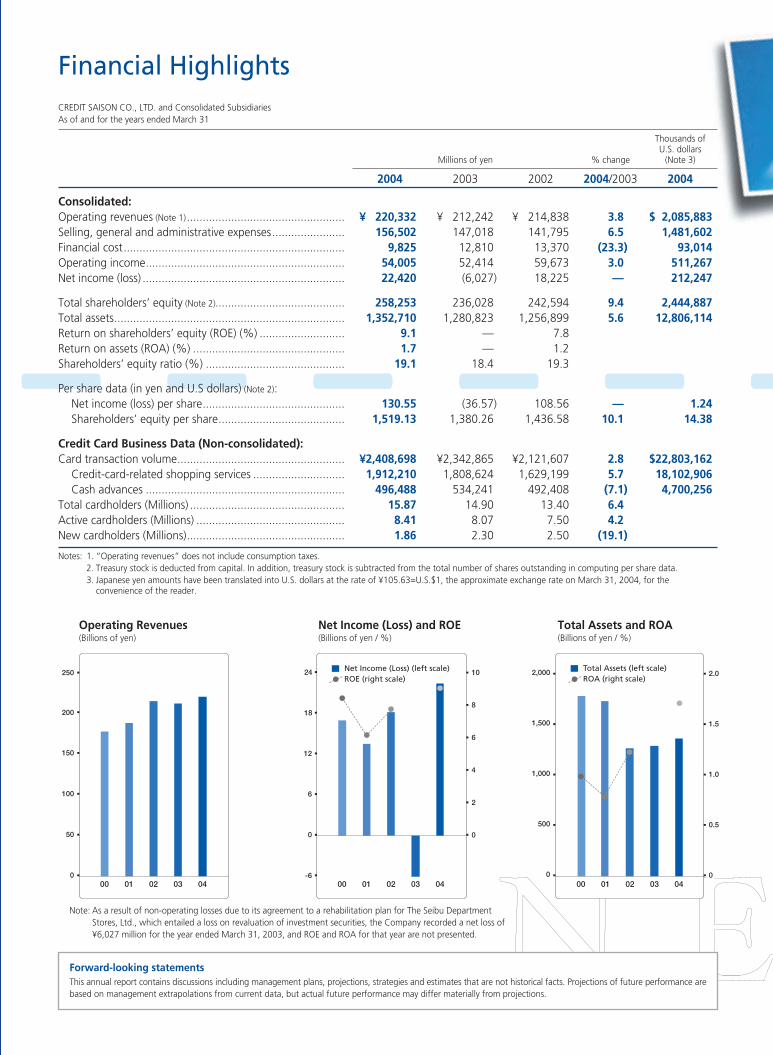
Consolidated:Operating revenues (Note 1).................................................. ¥ 220,332 ¥ 212,242 ¥ 214,838 3.8 $ 2,085,883Selling, general and administrative expenses....................... 156,502 147,018 141,795 6.5 1,481,602Financial cost...................................................................... 9,825 12,810 13,370 (23.3) 93,014Operating income............................................................... 54,005 52,414 59,673 3.0 511,267Net income (loss) ................................................................ 22,420 (6,027) 18,225 — 212,247
Total shareholders’ equity (Note 2)......................................... 258,253 236,028 242,594 9.4 2,444,887Total assets......................................................................... 1,352,710 1,280,823 1,256,899 5.6 12,806,114Return on shareholders’ equity (ROE) (%) ........................... 9.1 — 7.8Return on assets (ROA) (%) ................................................ 1.7 — 1.2Shareholders’ equity ratio (%) ............................................ 19.1 18.4 19.3
Per share data (in yen and U.S dollars) (Note 2):Net income (loss) per share............................................. 130.55 (36.57) 108.56 — 1.24Shareholders’ equity per share........................................ 1,519.13 1,380.26 1,436.58 10.1 14.38
Credit Card Business Data (Non-consolidated):Card transaction volume..................................................... ¥2,408,698 ¥2,342,865 ¥2,121,607 2.8 $22,803,162
Credit-card-related shopping services ............................. 1,912,210 1,808,624 1,629,199 5.7 18,102,906Cash advances ............................................................... 496,488 534,241 492,408 (7.1) 4,700,256
Total cardholders (Millions) ................................................. 15.87 14.90 13.40 6.4Active cardholders (Millions) ............................................... 8.41 8.07 7.50 4.2New cardholders (Millions).................................................. 1.86 2.30 2.50 (19.1)
Forward-looking statementsThis annual report contains discussions including management plans, projections, strategies and estimates that are not historical facts. Projections of future performance arebased on management extrapolations from current data, but actual future performance may differ materially from projections.
CREDIT SAISON CO., LTD. and Consolidated SubsidiariesAs of and for the years ended March 31
Notes: 1. “Operating revenues” does not include consumption taxes.2. Treasury stock is deducted from capital. In addition, treasury stock is subtracted from the total number of shares outstanding in computing per share data.3. Japanese yen amounts have been translated into U.S. dollars at the rate of ¥105.63=U.S.$1, the approximate exchange rate on March 31, 2004, for the
convenience of the reader.
Note: As a result of non-operating losses due to its agreement to a rehabilitation plan for The Seibu Department Stores, Ltd., which entailed a loss on revaluation of investment securities, the Company recorded a net loss of ¥6,027 million for the year ended March 31, 2003, and ROE and ROA for that year are not presented.
Operating Revenues(Billions of yen)
Net Income (Loss) and ROE(Billions of yen / %)
Total Assets and ROA(Billions of yen / %)
H o w
H a v e We
B e e n D o i n g ?
2 0 0 4
目 次
Credit Saison Co., Ltd. 1
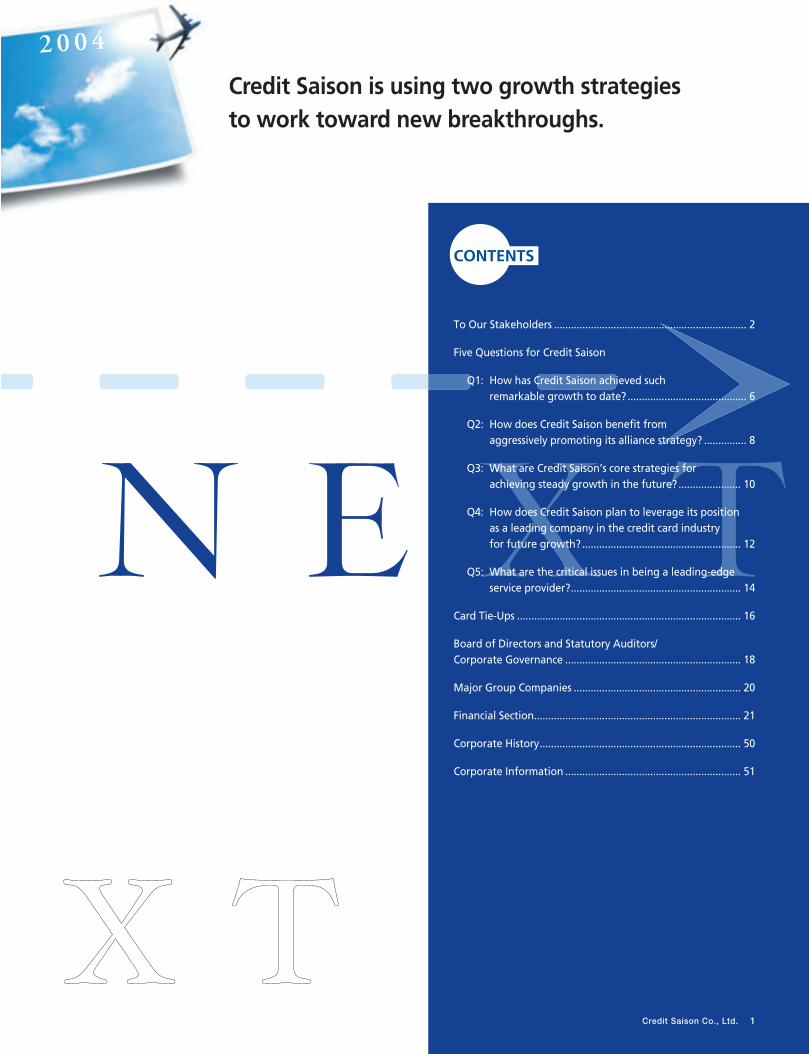
Credit Saison is using two growth strategies to work toward new breakthroughs.
To Our Stakeholders .................................................................... 2
Five Questions for Credit Saison
Q1: How has Credit Saison achieved suchremarkable growth to date? .......................................... 6
Q2: How does Credit Saison benefit from aggressively promoting its alliance strategy? ............... 8
Q3: What are Credit Saison’s core strategies forachieving steady growth in the future? ...................... 10
Q4: How does Credit Saison plan to leverage its position as a leading company in the credit card industry for future growth? ........................................................ 12
Q5: What are the critical issues in being a leading-edge service provider?............................................................ 14
Card Tie-Ups ............................................................................... 16
Board of Directors and Statutory Auditors/Corporate Governance .............................................................. 18
Major Group Companies ........................................................... 20
Financial Section......................................................................... 21
Corporate History....................................................................... 50
Corporate Information .............................................................. 51
CONTENTS

H o w H o w H a v e We H a v e We B e e n D o i n g ?B e e n D o i n g ?
1 9 9 1
1 9 8 8
1 9 9 7
1 9 9 5
Credit Saison’s growth up to now, and what lies ahead Credit Saison is aiming to become the number-one company in the
credit card business by establishing ideas for a new era in the card
business as a leading-edge service provider.
With 15.87 million cardholders and approximately 80 alliance
partners as of March 31, 2004, Credit Saison has gained a position at
the top level among domestic credit card companies.
Credit Saison Group companies share a common philosophy of
pursing customer satisfaction, creating mutual benefits with business
partners, and building a creative, innovative company. By instilling
these concepts and putting them into practice, Credit Saison seeks to
be the number-one company in the credit business.
• Began issuing Saison Visa Card and Saison MasterCard.
• Started the affinity card business.
• Began issuing Saison JCB International Card in cooperation with JCB Co., Ltd.
• Saison American Express Card issued through an affiliation with AMERICAN EXPRESS®.
•

H o w H a v e We B e e n D o i n g ?
1 9 9 9
2 0 0 2
2 0 0 3
• Began issuing credit cards that incorporate bank cash card functions.
• Began a program of bonus points that never expire (SAISON Permanent Points).
• Introduced SAISON CARD MAKER, a speedy, automatic card issuing machine.
• Began issuing the Saison Four Beat Card, a customer-oriented new concept card.
• Began “SAISONPASS” account aggregation service for SAISON CARD holders.
To O u r S t a k e h o l d e r s
To O u r S t a k e h o l d e r s
To O u r
S t a k e h o l d e r s
To O u r S t a k e h o l d e r s T o O u r
S t a k e h o l d e r s
To O u r S t a k e h o l d e r s
T o O u r
S t a k e h o l d e r s
T o O u r
S t a k e h o l d e r s
T o O u r
S t a k e h o l d e r s To O u r
S t a k e h o l d e r s
To O u r S t a k e h o l d e r s2 Credit Saison Co., Ltd.
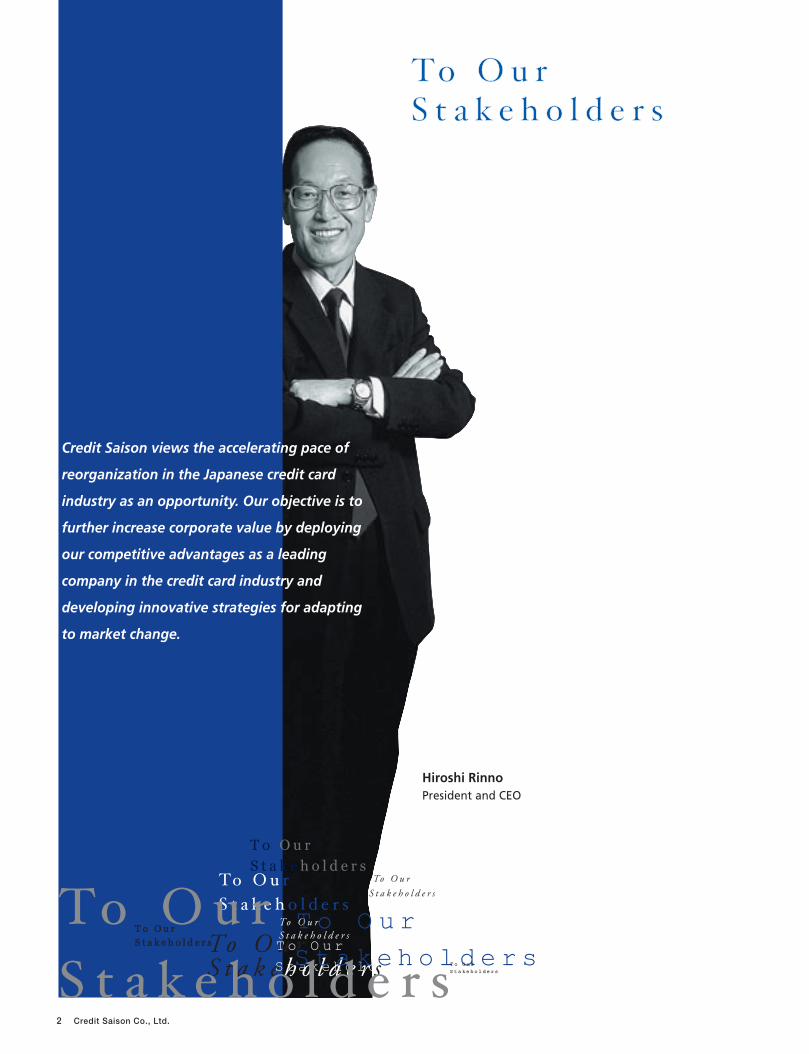
Credit Saison views the accelerating pace of
reorganization in the Japanese credit card
industry as an opportunity. Our objective is to
further increase corporate value by deploying
our competitive advantages as a leading
company in the credit card industry and
developing innovative strategies for adapting
to market change.
Hiroshi RinnoPresident and CEO
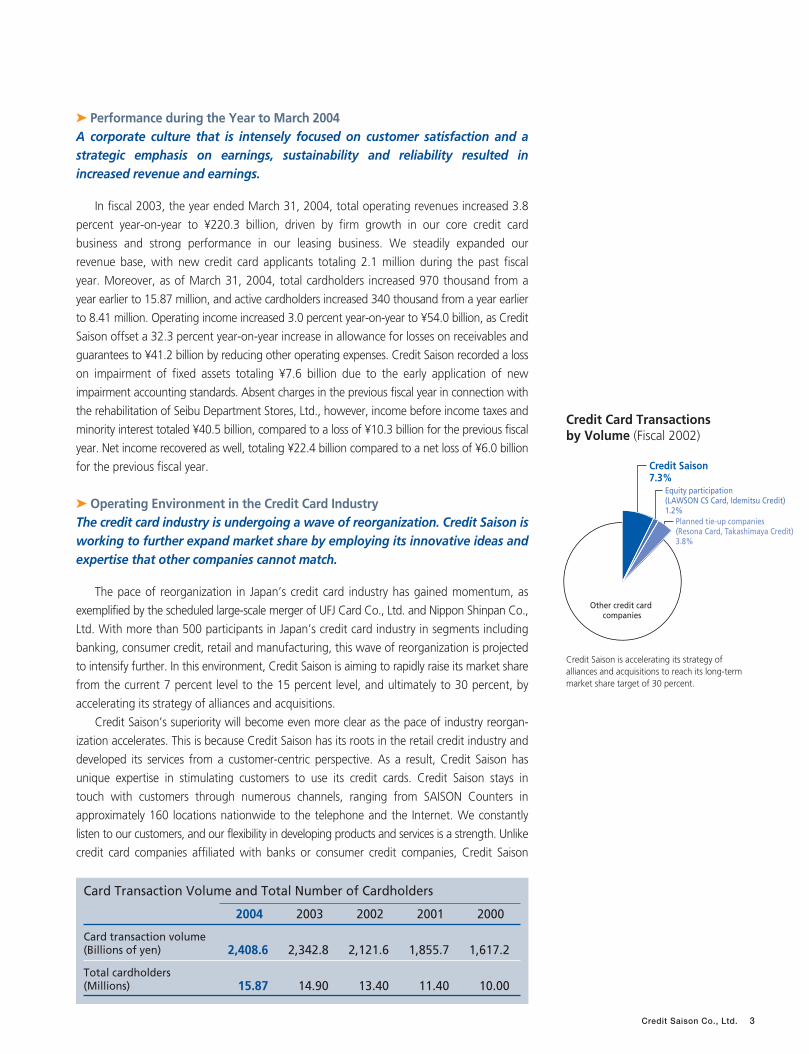
Card Transaction Volume and Total Number of Cardholders
2004 2003 2002 2001 2000
Card transaction volume(Billions of yen) 2,408.6 2,342.8 2,121.6 1,855.7 1,617.2
Total cardholders(Millions) 15.87 14.90 13.40 11.40 10.00
Credit Card Transactions by Volume (Fiscal 2002)
Credit Saison7.3%
Other credit card companies
Equity participation(LAWSON CS Card, Idemitsu Credit)1.2%
Planned tie-up companies(Resona Card, Takashimaya Credit)3.8%
Credit Saison Co., Ltd. 3
Credit Saison is accelerating its strategy ofalliances and acquisitions to reach its long-termmarket share target of 30 percent.
➤ Performance during the Year to March 2004A corporate culture that is intensely focused on customer satisfaction and astrategic emphasis on earnings, sustainability and reliability resulted inincreased revenue and earnings.
In fiscal 2003, the year ended March 31, 2004, total operating revenues increased 3.8
percent year-on-year to ¥220.3 billion, driven by firm growth in our core credit card
business and strong performance in our leasing business. We steadily expanded our
revenue base, with new credit card applicants totaling 2.1 million during the past fiscal
year. Moreover, as of March 31, 2004, total cardholders increased 970 thousand from a
year earlier to 15.87 million, and active cardholders increased 340 thousand from a year earlier
to 8.41 million. Operating income increased 3.0 percent year-on-year to ¥54.0 billion, as Credit
Saison offset a 32.3 percent year-on-year increase in allowance for losses on receivables and
guarantees to ¥41.2 billion by reducing other operating expenses. Credit Saison recorded a loss
on impairment of fixed assets totaling ¥7.6 billion due to the early application of new
impairment accounting standards. Absent charges in the previous fiscal year in connection with
the rehabilitation of Seibu Department Stores, Ltd., however, income before income taxes and
minority interest totaled ¥40.5 billion, compared to a loss of ¥10.3 billion for the previous fiscal
year. Net income recovered as well, totaling ¥22.4 billion compared to a net loss of ¥6.0 billion
for the previous fiscal year.
➤ Operating Environment in the Credit Card IndustryThe credit card industry is undergoing a wave of reorganization. Credit Saison isworking to further expand market share by employing its innovative ideas andexpertise that other companies cannot match.
The pace of reorganization in Japan’s credit card industry has gained momentum, as
exemplified by the scheduled large-scale merger of UFJ Card Co., Ltd. and Nippon Shinpan Co.,
Ltd. With more than 500 participants in Japan’s credit card industry in segments including
banking, consumer credit, retail and manufacturing, this wave of reorganization is projected
to intensify further. In this environment, Credit Saison is aiming to rapidly raise its market share
from the current 7 percent level to the 15 percent level, and ultimately to 30 percent, by
accelerating its strategy of alliances and acquisitions.
Credit Saison’s superiority will become even more clear as the pace of industry reorgan-
ization accelerates. This is because Credit Saison has its roots in the retail credit industry and
developed its services from a customer-centric perspective. As a result, Credit Saison has
unique expertise in stimulating customers to use its credit cards. Credit Saison stays in
touch with customers through numerous channels, ranging from SAISON Counters in
approximately 160 locations nationwide to the telephone and the Internet. We constantly
listen to our customers, and our flexibility in developing products and services is a strength. Unlike
credit card companies affiliated with banks or consumer credit companies, Credit Saison
does not charge annual credit card fees, yet we are consistently more profitable than such
competitors. This is compelling evidence of the value of our approach.
Factors such as reduced spending among consumers have blunted growth in the current
credit card industry, yet we see solid potential for expansion. Credit card use accounts for only
about 8 percent of personal consumption in Japan, which is no more than one-third the level
in the United States, a leader in credit card use. Moreover, the scope of credit card usage is
expanding from shopping to paying for cellular phone bills, communications, travel, utility bills,
medical costs and other expenses. With Japan’s credit card industry continuing to undergo major
changes, Credit Saison is working to expand market share by providing innovative products and
services that leave conventional assumptions and practices far behind.
➤ Two Growth StrategiesCredit Saison is using two growth strategies to work toward new breakthroughs.
Credit Saison aims to be a leading-edge service provider. We are promoting two growth
strategies as avenues to future growth.
The first strategy aims to generate steady growth by maximizing the expertise and brand
strength Credit Saison has created to date. Relentlessly pursuing customer satisfaction
requires Credit Saison to toss out conventional industry paradigms. Credit Saison charges no
annual fee for its credit cards, a completely different approach than relying on annual fees to
generate earnings as other credit card companies do. The SAISON Permanent Point
(“Eikyufumetsu Point” ) bonus point program has eliminated expiration dates. These kinds of
breakthrough programs are the result of Credit Saison’s embrace of constant innovation
and forward thinking that are not restrained by conventional business models.
Our second growth strategy entails aggressively developing strategic alliances to which we
contribute capital, people and expertise as a means of generating further growth. Deploying
our abilities in marketing and credit administration, we have concluded such alliances with
approximately 80 companies to date. In the past, these alliances primarily entailed card
issuance and the provision of new services. Today, however, we are promoting alliances in which
the capital, people and expertise we provide builds an even stronger partnership in jointly issuing
credit cards to our alliance partners’ customers. Progress in the reorganization of the credit card
industry is creating excellent opportunities, and we believe that the timing is perfect to
begin transforming these opportunities into dramatic future growth. This kind of strategic
alliance is based on linking improvement in our alliance partners’ corporate value to
improvement in the corporate value of the Credit Saison Group. We concluded one such alliance
with Takashimaya Co., Ltd. in April 2004. In tandem with prior alliances with The Seibu
Department Stores, Ltd. and Sogo Co., Ltd., this gives Credit Saison strategic alliances with
three of Japan’s five largest department store companies, thus enabling us to expand
opportunities to reach attractive customers. Looking forward, Credit Saison will work to
expand market share by adding partnerships with companies in a wide array of industries to our
alliances with firms in the retail business.
Moreover, we expect these strategic alliances to support our processing business, in
which we provide commissioned credit card administration for our alliance partners’ credit
card operations. This processing business will form the core of our fee business, which will be
a new source of earnings for Credit Saison. Building on relationships with Lawson, Inc. and
Mitsubishi Corporation initiated in 2000, during fiscal 2003 we concluded agreements with
Idemitsu Kosan Co., Ltd. and Resona Holdings, Inc. under which we provide commissioned
credit card administration for their group credit card companies’ operations. We expect
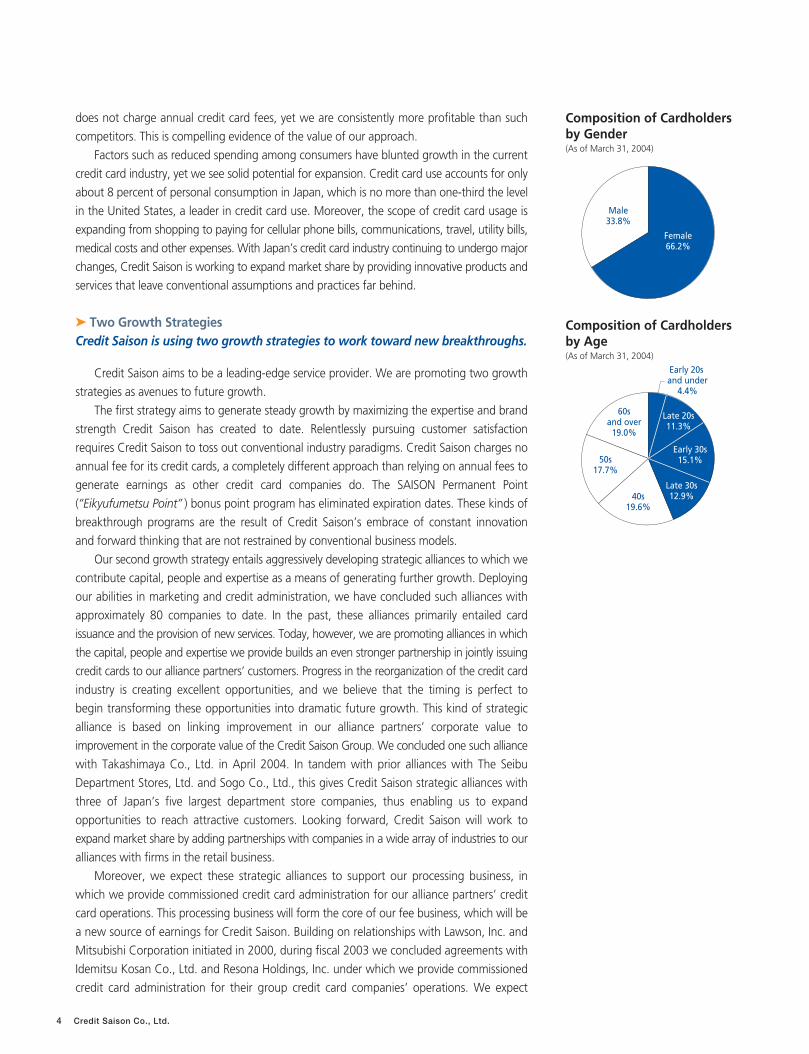
Female66.2%
Male33.8%
Late 20s11.3%
Early 30s15.1%
Early 20s and under
4.4%
Late 30s12.9%40s
19.6%
50s17.7%
60sand over
19.0%
Composition of Cardholders by Gender (As of March 31, 2004)
Composition of Cardholders by Age (As of March 31, 2004)
4 Credit Saison Co., Ltd.
these alliances to contribute several billion yen to earnings in the current fiscal year. Looking
ahead, we will further expand fee businesses to complement our credit card shopping and
cash advance operations in building a well-balanced earnings structure that generates
dramatic growth.
➤ Achieving Sustainable GrowthBased on its original, innovative corporate culture, Credit Saison will use itspersonnel as a core management resource in aiming for profitable growth.
In addition to proactively recruiting women and young people, Credit Saison has intro-
duced an innovative personnel system that emphasizes and deploys the capabilities of
individuals. This system includes allowing newly hired employees that have just graduated
from college to propose their initial salary level, and promoting part-time employees.
Approximately 20 percent of Credit Saison’s department managers in their 30s are women,
compared to an average of 6 percent for all Japanese companies. Moreover, we have
energetically introduced other systems, such as internal interdepartmental projects and the
opportunity for individual employees to propose ideas to management.
As a manager, I have been intent on creating an open, frank and innovative corporate culture
in which age and gender are irrelevant. Encouraging employees to improve themselves
through friendly rivalry is a critical asset in competing successfully, and the dynamic driving Credit
Saison’s progress.
Credit Saison will fully utilize its human and other resources in working to create
mutually beneficial relationships with cardholders and alliance partners as the means to
increase corporate value. This is intimately related to shareholder returns. Credit Saison will
continue to devote itself to becoming a leading-edge service provider that creates new value for
all of its stakeholders.
June 29, 2004
Hiroshi Rinno
President and CEO
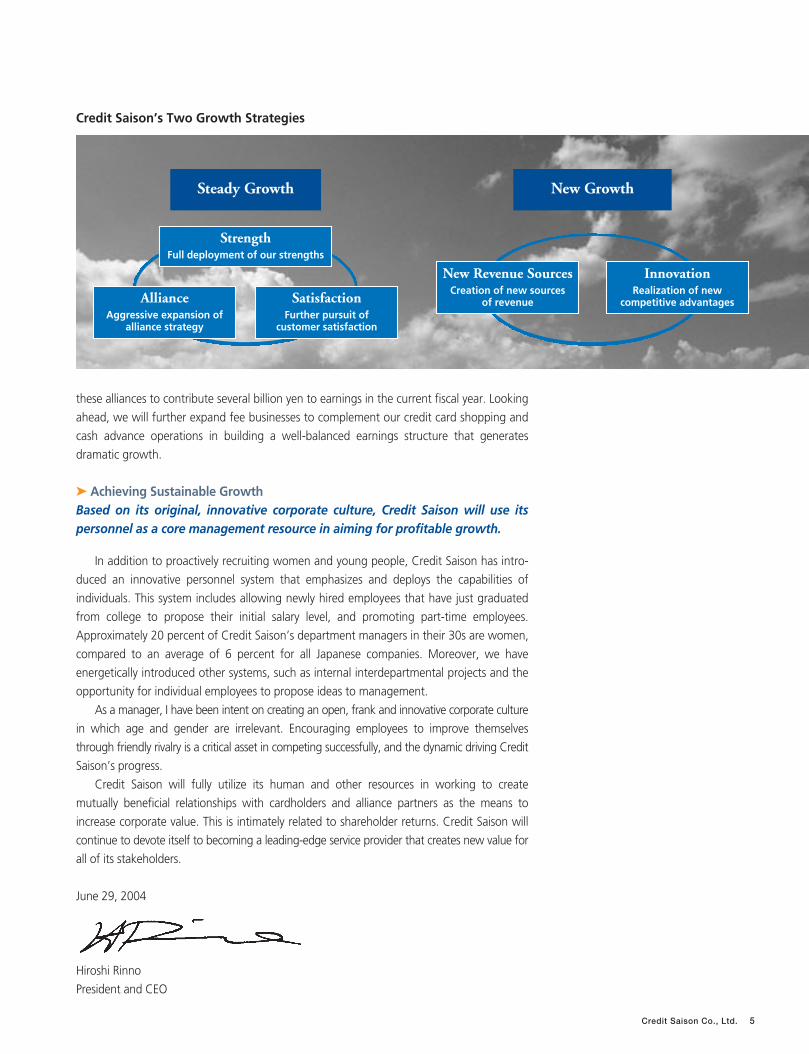
Credit Saison’s Two Growth Strategies
Steady Growth New Growth
StrengthFull deployment of our strengths
AllianceAggressive expansion of
alliance strategy
SatisfactionFurther pursuit of
customer satisfaction
New Revenue SourcesCreation of new sources
of revenue
InnovationRealization of new
competitive advantages
Credit Saison Co., Ltd. 5
?Q1Five Questions for Credit Saison
6 Credit Saison Co., Ltd.
Credit Saison’s brand power has been
built on personalized relationships
with individual customers.
Harumi OkadaBranch Manager, Tokyo BranchSales Division
How has Credit Saison
achieved such remarkable
growth to date?
?S t r e n g t h
S t r e n g t h
Q1
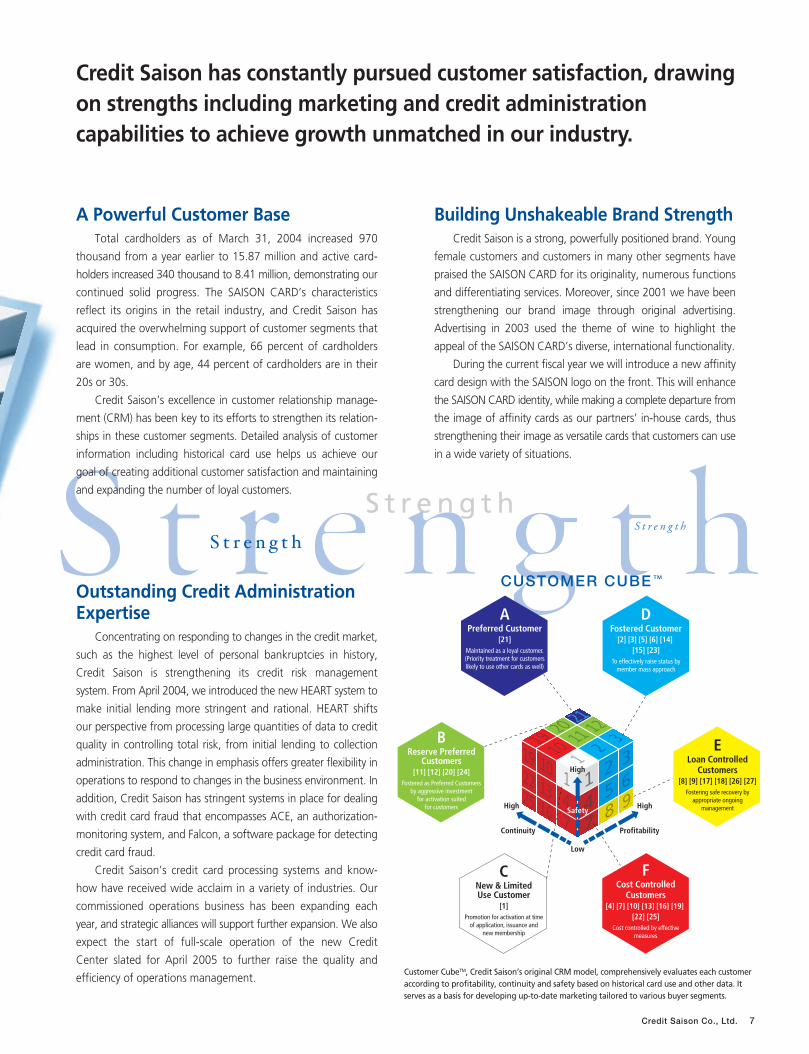
CUSTOMER CUBE TM
S t r e n g t h
HighHigh
Low
Continuity Profitability
APreferred Customer
[21]Maintained as a loyal customer.(Priority treatment for customerslikely to use other cards as well)
DFostered Customer
[2] [3] [5] [6] [14] [15] [23]
To effectively raise status bymember mass approach
FCost Controlled
Customers[4] [7] [10] [13] [16] [19]
[22] [25]Cost controlled by effective
measures
BReserve Preferred
Customers[11] [12] [20] [24]
Fostered as Preferred Customersby aggressive investment
for activation suitedfor customers
CNew & LimitedUse Customer
[1]Promotion for activation at time
of application, issuance andnew membership
ELoan Controlled
Customers[8] [9] [17] [18] [26] [27]
Fostering safe recovery byappropriate ongoing
managementSafety
High
Credit Saison has constantly pursued customer satisfaction, drawingon strengths including marketing and credit administrationcapabilities to achieve growth unmatched in our industry.
A Powerful Customer BaseTotal cardholders as of March 31, 2004 increased 970
thousand from a year earlier to 15.87 million and active card-
holders increased 340 thousand to 8.41 million, demonstrating our
continued solid progress. The SAISON CARD’s characteristics
reflect its origins in the retail industry, and Credit Saison has
acquired the overwhelming support of customer segments that
lead in consumption. For example, 66 percent of cardholders
are women, and by age, 44 percent of cardholders are in their
20s or 30s.
Credit Saison’s excellence in customer relationship manage-
ment (CRM) has been key to its efforts to strengthen its relation-
ships in these customer segments. Detailed analysis of customer
information including historical card use helps us achieve our
goal of creating additional customer satisfaction and maintaining
and expanding the number of loyal customers.
Outstanding Credit AdministrationExpertise
Concentrating on responding to changes in the credit market,
such as the highest level of personal bankruptcies in history,
Credit Saison is strengthening its credit risk management
system. From April 2004, we introduced the new HEART system to
make initial lending more stringent and rational. HEART shifts
our perspective from processing large quantities of data to credit
quality in controlling total risk, from initial lending to collection
administration. This change in emphasis offers greater flexibility in
operations to respond to changes in the business environment. In
addition, Credit Saison has stringent systems in place for dealing
with credit card fraud that encompasses ACE, an authorization-
monitoring system, and Falcon, a software package for detecting
credit card fraud.
Credit Saison’s credit card processing systems and know-
how have received wide acclaim in a variety of industries. Our
commissioned operations business has been expanding each
year, and strategic alliances will support further expansion. We also
expect the start of full-scale operation of the new Credit
Center slated for April 2005 to further raise the quality and
efficiency of operations management.
Building Unshakeable Brand StrengthCredit Saison is a strong, powerfully positioned brand. Young
female customers and customers in many other segments have
praised the SAISON CARD for its originality, numerous functions
and differentiating services. Moreover, since 2001 we have been
strengthening our brand image through original advertising.
Advertising in 2003 used the theme of wine to highlight the
appeal of the SAISON CARD’s diverse, international functionality.
During the current fiscal year we will introduce a new affinity
card design with the SAISON logo on the front. This will enhance
the SAISON CARD identity, while making a complete departure from
the image of affinity cards as our partners’ in-house cards, thus
strengthening their image as versatile cards that customers can use
in a wide variety of situations.
Credit Saison Co., Ltd. 7
Customer CubeTM, Credit Saison’s original CRM model, comprehensively evaluates each customeraccording to profitability, continuity and safety based on historical card use and other data. Itserves as a basis for developing up-to-date marketing tailored to various buyer segments.
?Q2
?Q2
8 Credit Saison Co., Ltd.
Credit Saison’s alliance strategy is an
important business scheme that
creates corporate value.
Shinji YasudaManager, Credit Card Dept.Sales Division
Five Questions for Credit Saison
How does Credit Saison
benefit from aggressively
promoting its alliance
strategy??Q2
?A l l i a n c e
A l l i a n c e
Q2
A l l i a n c e
Building a network through alliances allows us to not only acquireloyal customers, but also to energize card use by providing theoutstanding services of alliance partners to Saison cardholders.
Credit Saison Co., Ltd. 9
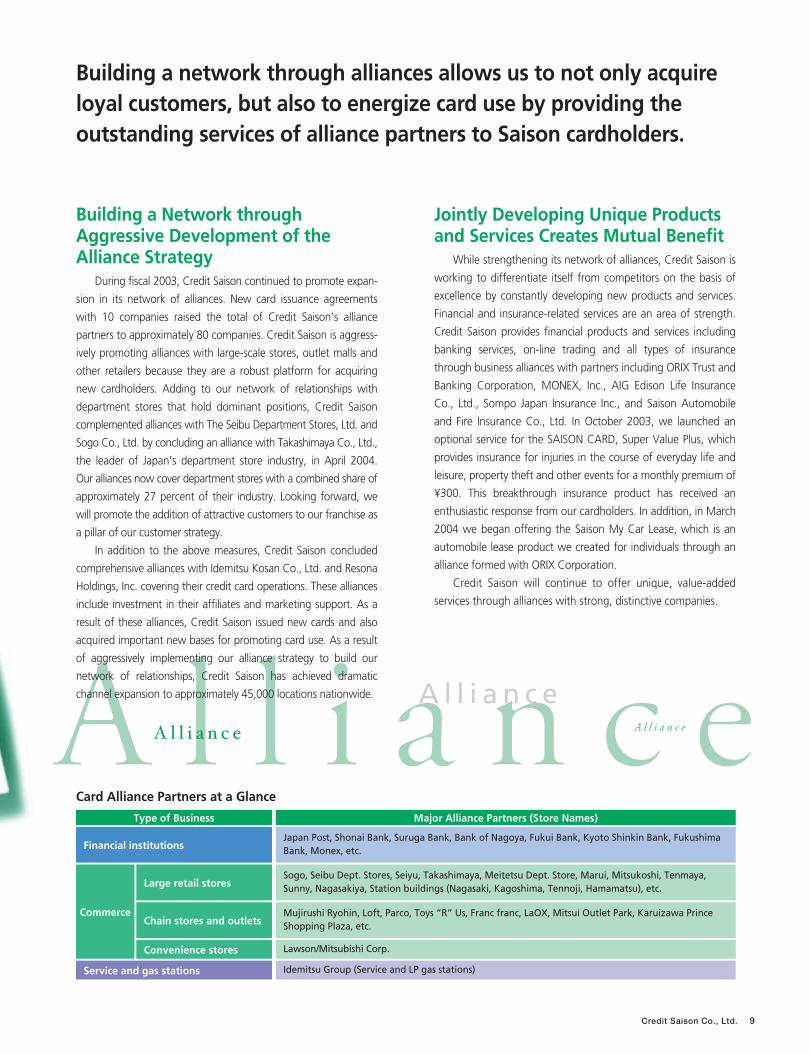
Type of Business Major Alliance Partners (Store Names)
Financial institutionsJapan Post, Shonai Bank, Suruga Bank, Bank of Nagoya, Fukui Bank, Kyoto Shinkin Bank, FukushimaBank, Monex, etc.
Commerce
Large retail storesSogo, Seibu Dept. Stores, Seiyu, Takashimaya, Meitetsu Dept. Store, Marui, Mitsukoshi, Tenmaya,Sunny, Nagasakiya, Station buildings (Nagasaki, Kagoshima, Tennoji, Hamamatsu), etc.
Chain stores and outletsMujirushi Ryohin, Loft, Parco, Toys “R” Us, Franc franc, LaOX, Mitsui Outlet Park, Karuizawa PrinceShopping Plaza, etc.
Convenience stores Lawson/Mitsubishi Corp.
Service and gas stations Idemitsu Group (Service and LP gas stations)
Building a Network throughAggressive Development of theAlliance Strategy
During fiscal 2003, Credit Saison continued to promote expan-
sion in its network of alliances. New card issuance agreements
with 10 companies raised the total of Credit Saison’s alliance
partners to approximately 80 companies. Credit Saison is aggress-
ively promoting alliances with large-scale stores, outlet malls and
other retailers because they are a robust platform for acquiring
new cardholders. Adding to our network of relationships with
department stores that hold dominant positions, Credit Saison
complemented alliances with The Seibu Department Stores, Ltd. and
Sogo Co., Ltd. by concluding an alliance with Takashimaya Co., Ltd.,
the leader of Japan’s department store industry, in April 2004.
Our alliances now cover department stores with a combined share of
approximately 27 percent of their industry. Looking forward, we
will promote the addition of attractive customers to our franchise as
a pillar of our customer strategy.
In addition to the above measures, Credit Saison concluded
comprehensive alliances with Idemitsu Kosan Co., Ltd. and Resona
Holdings, Inc. covering their credit card operations. These alliances
include investment in their affiliates and marketing support. As a
result of these alliances, Credit Saison issued new cards and also
acquired important new bases for promoting card use. As a result
of aggressively implementing our alliance strategy to build our
network of relationships, Credit Saison has achieved dramatic
channel expansion to approximately 45,000 locations nationwide.
Jointly Developing Unique Productsand Services Creates Mutual Benefit
While strengthening its network of alliances, Credit Saison is
working to differentiate itself from competitors on the basis of
excellence by constantly developing new products and services.
Financial and insurance-related services are an area of strength.
Credit Saison provides financial products and services including
banking services, on-line trading and all types of insurance
through business alliances with partners including ORIX Trust and
Banking Corporation, MONEX, Inc., AIG Edison Life Insurance
Co., Ltd., Sompo Japan Insurance Inc., and Saison Automobile
and Fire Insurance Co., Ltd. In October 2003, we launched an
optional service for the SAISON CARD, Super Value Plus, which
provides insurance for injuries in the course of everyday life and
leisure, property theft and other events for a monthly premium of
¥300. This breakthrough insurance product has received an
enthusiastic response from our cardholders. In addition, in March
2004 we began offering the Saison My Car Lease, which is an
automobile lease product we created for individuals through an
alliance formed with ORIX Corporation.
Credit Saison will continue to offer unique, value-added
services through alliances with strong, distinctive companies.
Card Alliance Partners at a Glance
?
Q3Five Questions for Credit Saison
10 Credit Saison Co., Ltd.
In structuring our credit business, we
are always thinking about how to
improve customer satisfaction.
Daisaku OhnoManager, Credit Administration Dept.Operations Division
What are Credit Saison’s
core strategies for
achieving steady growth
in the future?
?S a t i s f a c t i o n
Q3
S a t i s f a c t i o nS a t i s f a c t i o n
Customer satisfaction is the most important issue in achievingsteady growth. We will continue to pursue customer satisfactionwith the goal of expanding transaction volume and the numberof cardholders.
Credit Saison Co., Ltd. 11
Credit Saison’s Decision to IntroduceSAISON Permanent Points
The pursuit of customer satisfaction often requires Credit
Saison to defy conventional industry assumptions. Unlike other
credit card companies, which rely on annual credit card fees to
support earnings, Credit Saison issues cards with no annual fee.
We have also initiated SAISON Permanent Points (“Eikyufumetsu
Point” ), which never expire. The introduction of this revolutionary
program was a result of Credit Saison’s commitment to forward
thinking and innovation, unconstrained by conventional business
models. Customers can collect SAISON Permanent Points for as long
as they choose and exchange them for the items they want at
any time. This program has attracted customer interest, and is a
motivation to become a cardholder that is also linked to active
card use.
Credit Saison is also working to expand opportunities for card
use. The scope of credit card use is expanding from shopping to
paying for cellular phone bills, communications, travel, electronic
toll collection, utility bills, medical costs and other expenses.
Moreover, from April 2004 customers have been able to use
credit cards for purchasing beer from vendors and other purposes
at Seibu Stadium. Wherever customers use their cards, they
receive SAISON Permanent Points. This initiative is therefore a
strength is working to make Saison our cardholders’ main card.
Using Infrastructure and MarketingCapabilities to Strengthen CustomerRelationships
Credit Saison has created SAISON Counters staffed by more
than 1,000 specialists at approximately 160 locations in key cities
throughout Japan. SAISON Counters initiate new cardholder
relationships and also have the important function of collecting direct
feedback on customer requests and needs, which Credit Saison uses
in developing new services.
Credit Saison has also worked to differentiate itself by
creating rapid card issuance systems that can issue a card in
30 minutes. This capability has become a significant strength.
We have installed SAISON STATION information terminals that
can rapidly issue cards at major SAISON Counters nationwide.
Moreover, in addition to SAISON Counters and SAISON CARD
MAKER automated card issuance machines, customers can now
obtain their credit cards from the Shinjuku West Exit Store of
Zero First Co., Ltd., a Marui Group company. We have also
significantly expanded the varieties of cards that can be issued
rapidly in working to enhance our services.
Credit Saison’s infrastructure for satisfying customers will be a
key means of achieving steady growth in the future.
?Q4
?Q4Five Questions for Credit Saison
12 Credit Saison Co., Ltd.
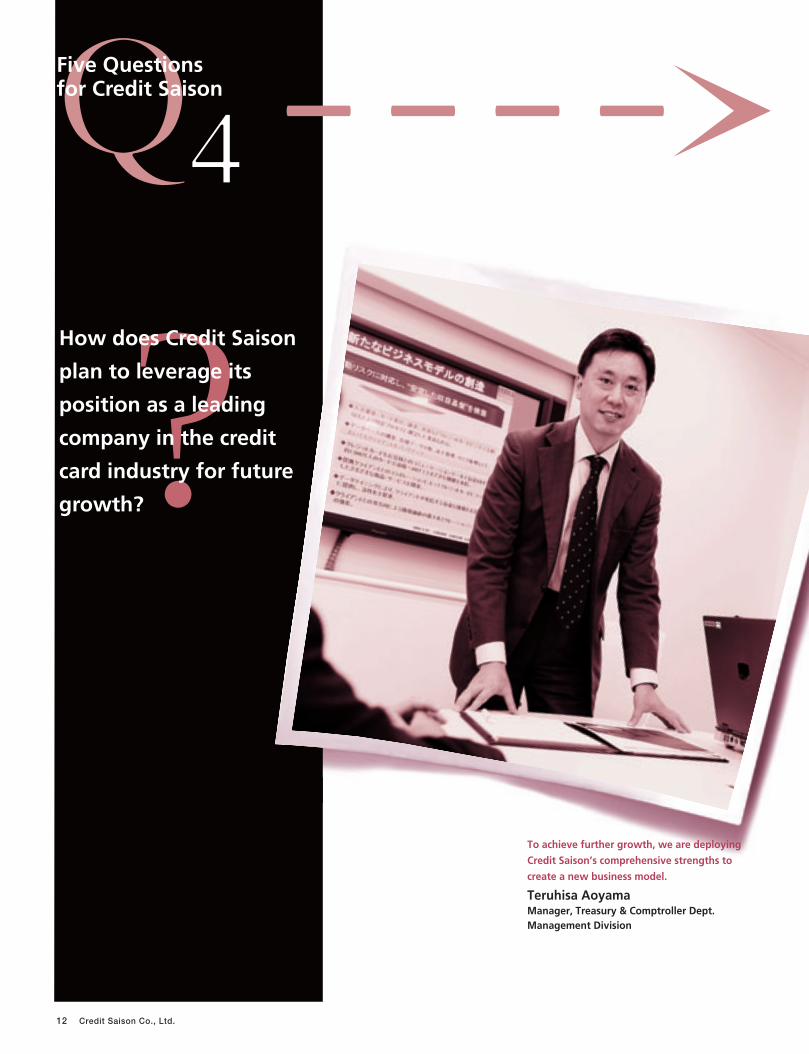
How does Credit Saison
plan to leverage its
position as a leading
company in the credit
card industry for future
growth?
To achieve further growth, we are deploying
Credit Saison’s comprehensive strengths to
create a new business model.
Teruhisa AoyamaManager, Treasury & Comptroller Dept.Management Division
?Q4
N e w R e v e n u e S o u r c e N e w R e v e n u e S o u r c e
N e w R e v e n u e S o u r c e
Credit Saison Co., Ltd. 13
Field Strategies and Services Main Alliance Partners
Processing
• Outsourcing certain administrative processes as well as general credit card businesses such as initial screening, card issuance, billing and payment
• Client support services such as creation of customer databases, data analysis, ongoing credit management and risk management
LAWSON CS Card, Inc.
Idemitsu Credit Co., Ltd.
Resona Card Co., Ltd.
AIC CARD SERVICES, INC.
Fee Business
• Sending a variety of information to customers using credit cards as a communication tool
• Building the fee business and offering differentiated merchandise and service information to approximately 16 million cardholders
Saison Automobile and Fire Insurance Co., Ltd.
AIG Edison Life Insurance Company
Sompo Japan Insurance Inc.
Direct MarketingData Mining (Direct Mail Service)• Promoting active business by providing customers with
useful information sent by clients
Clients
Fee Businesses
We aim to aggressively develop strategic alliances to which wecontribute capital, people and expertise as a source of future growthin order to be a strong, successful company in the twenty-first century.
Construction of New Credit Center toImprove Service Quality and Efficiency
Credit Saison is now constructing a new Credit Center,
which will accommodate 2,000 operators. Our objective is to
raise service quality and reduce the cost of handling 600,000
to 700,000 customer calls each month while also supporting
further smooth expansion in the processing business.
The Credit Center is projected to begin full-scale operations
in April 2005. It will place all employees handling phone calls
from customers in one location, which will enable Credit Saison to
efficiently provide excellent service. In addition, the Credit Center
will include training facilities for thorough operator education.
Credit Saison also recognizes that thorough and appropriate
management of customer information is a critical task. The Credit
Center’s security system has multiple access levels according to
application, and employs a full complement of safety measures
based on integrated circuit (IC) card administration.
Expansion of the Processing Businessinto a Key Fee Business
Credit Saison is using its existing business infrastructure to
create new sources of earnings that mitigate the risk of interest rate
fluctuations. We are concentrating on the processing business
as it allows us to maximize our use of the expertise we have
acquired over many years.
Under the comprehensive alliances we concluded with
Idemitsu Kosan and Resona Holdings during fiscal 2003, Credit
Saison will provide commissioned processing services to Idemitsu
Credit Co., Ltd. and Resona Card Co., Ltd. These services will
cover all aspects of the credit card businesses, from evaluating
creditworthiness prior to initial lending to extending credit and
collection administration. These alliances build on the large-scale
commissioned administration agreement we concluded for credit
cards issued by LAWSON CS Card, Inc. in 2002.
The processing business adds stability to Credit Saison’s
earnings base and will continue to grow. We expect this
business area to expand substantially in the future. Credit
Saison will work to further expand its fee businesses, with the aim
of generating dramatic growth by creating a profit structure
balanced among the credit card shopping, cash advance and
fee businesses.
?Q5
?Q5Five Questions for Credit Saison
14 Credit Saison Co., Ltd.
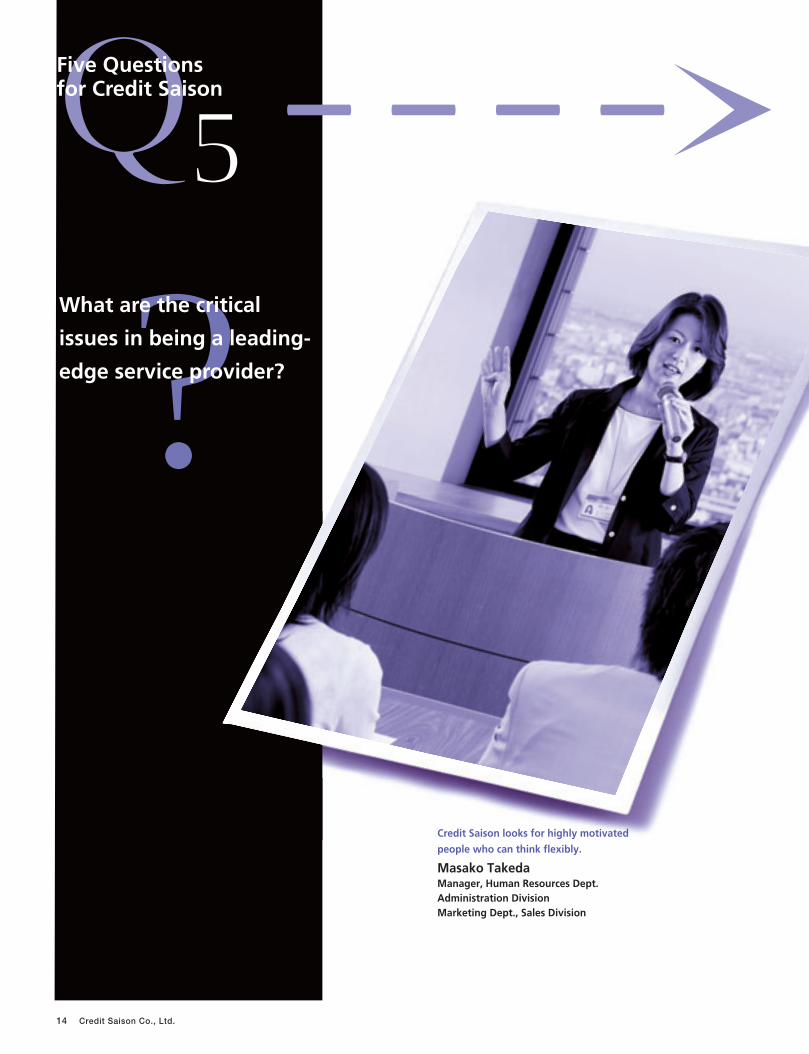
Credit Saison looks for highly motivated
people who can think flexibly.
Masako TakedaManager, Human Resources Dept.Administration DivisionMarketing Dept., Sales Division
What are the critical
issues in being a leading-
edge service provider?
?I n n o v a t i o n
Q5
I n n o v a t i o n
I n n o v a t i o n
An innovative corporate culture and measures that energizeemployees will support Credit Saison’s unique strategies for creatingnew markets and customers through business alliances.
Credit Saison has innovative personnel strategies in place that emphasize thedeployment of the individual capabilities of employees. These includeinterdepartmental projects and the opportunity for individual employees topropose ideas to management, and we continue to develop dynamicmeasures for maintaining an organization that is consistently vital.
Credit Saison Co., Ltd. 15
20–24 3
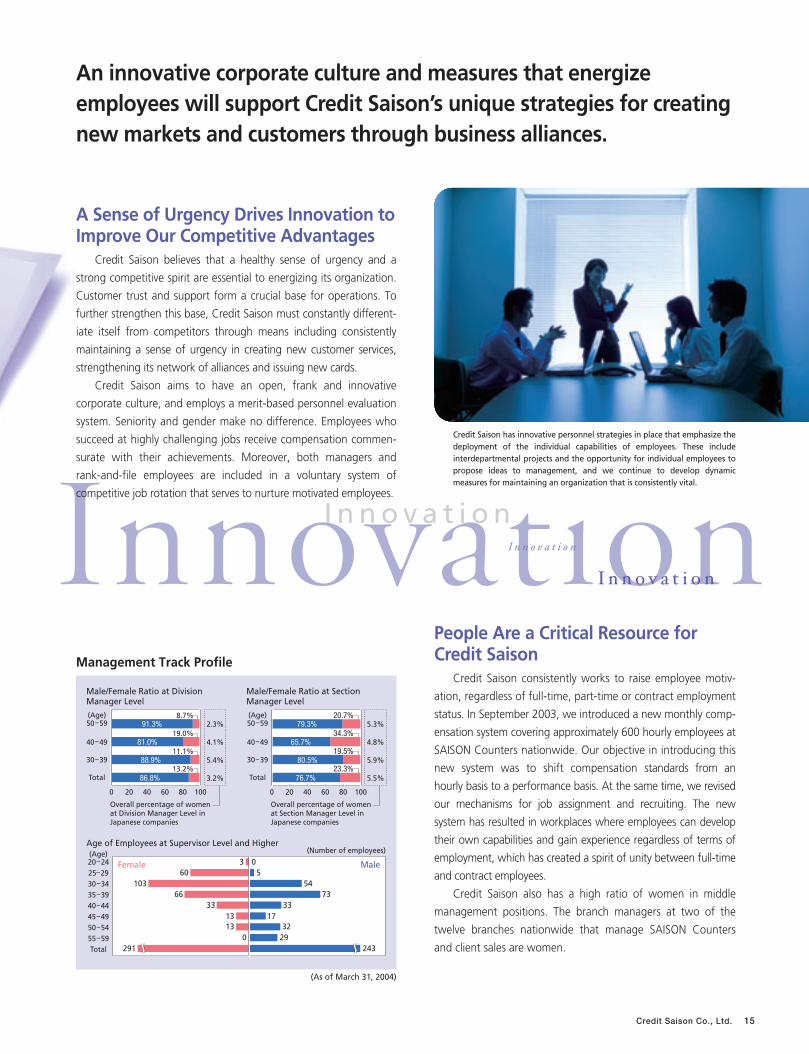
91.3%8.7%
81.0%19.0%
88.9%11.1%
86.8%13.2%
60103
291 243
6633
1313
0
25–2930–3435–3940–4445–4950–5455–59Total
Total
Overall percentage of womenat Division Manager Level in Japanese companies
(Age)
(Age) (Age)50–59
40–49
30–39
2.3%
4.1%
5.4%
3.2%
0 10080604020
Age of Employees at Supervisor Level and Higher
Male/Female Ratio at Division Manager Level
Male/Female Ratio at Section Manager Level
Female Male05
5473
3317
3229
Overall percentage of womenat Section Manager Level in Japanese companies
79.3%20.7%
65.7%34.3%
80.5%19.5%
76.7%23.3%
Total
50–59
40–49
30–39
5.3%
4.8%
5.9%
5.5%
0 10080604020
(Number of employees)
Management Track Profile
(As of March 31, 2004)
People Are a Critical Resource forCredit Saison
Credit Saison consistently works to raise employee motiv-
ation, regardless of full-time, part-time or contract employment
status. In September 2003, we introduced a new monthly comp-
ensation system covering approximately 600 hourly employees at
SAISON Counters nationwide. Our objective in introducing this
new system was to shift compensation standards from an
hourly basis to a performance basis. At the same time, we revised
our mechanisms for job assignment and recruiting. The new
system has resulted in workplaces where employees can develop
their own capabilities and gain experience regardless of terms of
employment, which has created a spirit of unity between full-time
and contract employees.
Credit Saison also has a high ratio of women in middle
management positions. The branch managers at two of the
twelve branches nationwide that manage SAISON Counters
and client sales are women.
A Sense of Urgency Drives Innovation toImprove Our Competitive Advantages
Credit Saison believes that a healthy sense of urgency and a
strong competitive spirit are essential to energizing its organization.
Customer trust and support form a crucial base for operations. To
further strengthen this base, Credit Saison must constantly different-
iate itself from competitors through means including consistently
maintaining a sense of urgency in creating new customer services,
strengthening its network of alliances and issuing new cards.
Credit Saison aims to have an open, frank and innovative
corporate culture, and employs a merit-based personnel evaluation
system. Seniority and gender make no difference. Employees who
succeed at highly challenging jobs receive compensation commen-
surate with their achievements. Moreover, both managers and
rank-and-file employees are included in a voluntary system of
competitive job rotation that serves to nurture motivated employees.
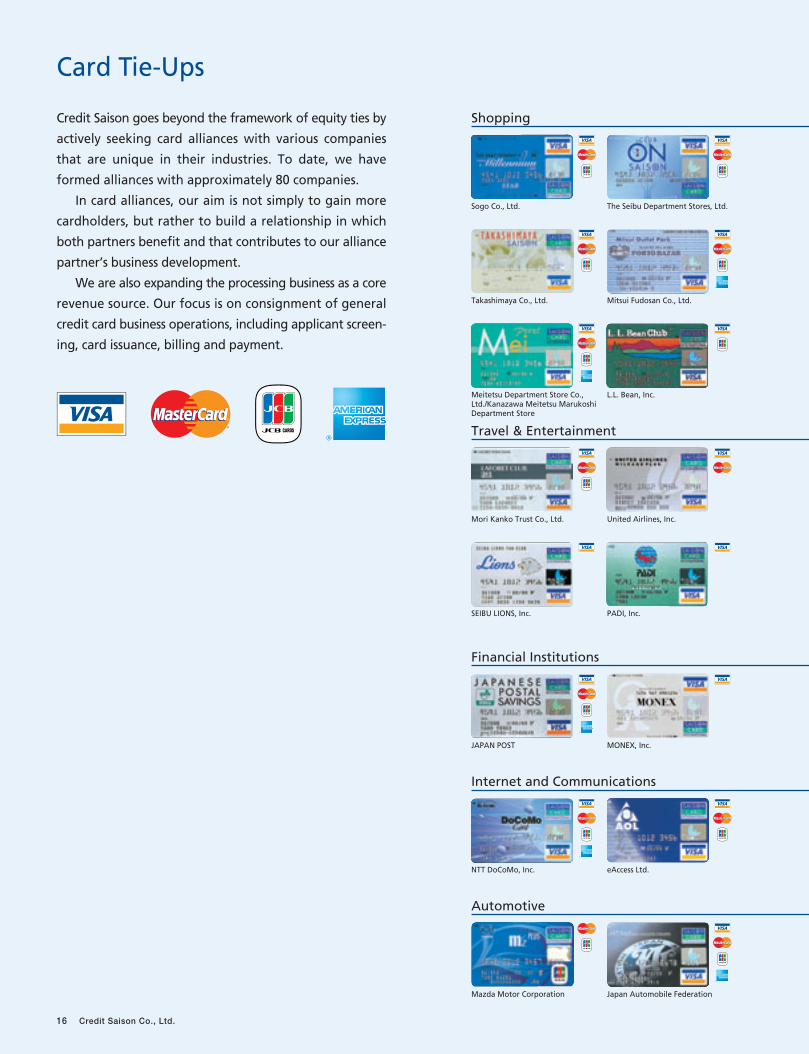
Sogo Co., Ltd. The Seibu Department Stores, Ltd.
Shopping
Card Tie-Ups
16 Credit Saison Co., Ltd.
Credit Saison goes beyond the framework of equity ties by
actively seeking card alliances with various companies
that are unique in their industries. To date, we have
formed alliances with approximately 80 companies.
In card alliances, our aim is not simply to gain more
cardholders, but rather to build a relationship in which
both partners benefit and that contributes to our alliance
partner’s business development.
We are also expanding the processing business as a core
revenue source. Our focus is on consignment of general
credit card business operations, including applicant screen-
ing, card issuance, billing and payment.
Takashimaya Co., Ltd. Mitsui Fudosan Co., Ltd.
Meitetsu Department Store Co.,Ltd./Kanazawa Meitetsu MarukoshiDepartment Store
L.L. Bean, Inc.
Mori Kanko Trust Co., Ltd. United Airlines, Inc.
Travel & Entertainment
SEIBU LIONS, Inc. PADI, Inc.
JAPAN POST MONEX, Inc.
Financial Institutions
NTT DoCoMo, Inc. eAccess Ltd.
Internet and Communications
Mazda Motor Corporation Japan Automobile Federation
Automotive
Credit Saison Co., Ltd. 17
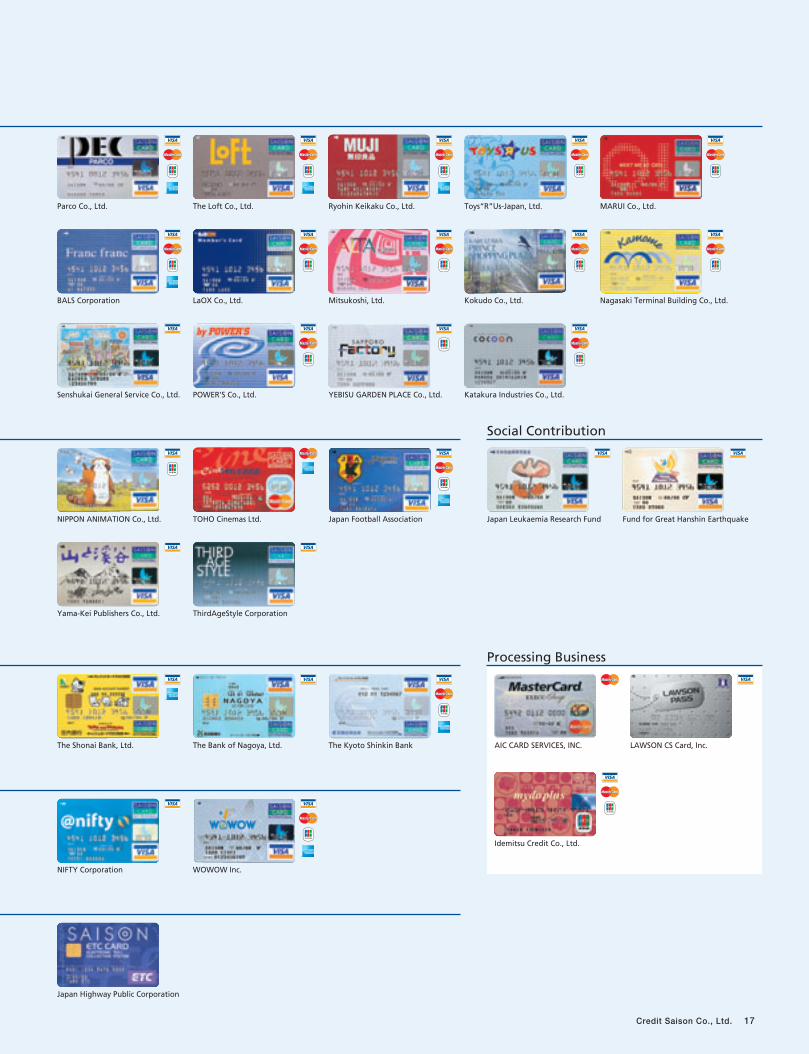
Parco Co., Ltd. The Loft Co., Ltd. Ryohin Keikaku Co., Ltd. Toys“R”Us-Japan, Ltd. MARUI Co., Ltd.
BALS Corporation LaOX Co., Ltd.
Senshukai General Service Co., Ltd. POWER’S Co., Ltd. YEBISU GARDEN PLACE Co., Ltd. Katakura Industries Co., Ltd.
NIPPON ANIMATION Co., Ltd. TOHO Cinemas Ltd. Japan Football Association
Yama-Kei Publishers Co., Ltd. ThirdAgeStyle Corporation
AIC CARD SERVICES, INC.
Processing Business
Idemitsu Credit Co., Ltd.
LAWSON CS Card, Inc.
Japan Leukaemia Research Fund
Social Contribution
Fund for Great Hanshin Earthquake
The Shonai Bank, Ltd. The Bank of Nagoya, Ltd. The Kyoto Shinkin Bank
NIFTY Corporation WOWOW Inc.
Japan Highway Public Corporation
Mitsukoshi, Ltd. Kokudo Co., Ltd. Nagasaki Terminal Building Co., Ltd.

1 2 3 4 5 6 7 8 9 10
President and CEO
Hiroshi Rinno* 10
Executive Vice President
Shiro Yanagihara* 9
General Manager of Strategy Headquarters In charge of Audit Office
Senior Managing Directors
Teruyuki Maekawa* 11
General Manager of Sales DivisionIn charge of Public Relations Office
Atsushige Takahashi 8
General Manager of Business Headquarters
Managing Directors
Toshiharu Yamamoto 12
General Manager of Operations Headquarters
Terutaka Hasuda 7
General Manager of Sales Headquarters
Hiromichi Sato 13
In charge of Credit Guarantee Business Divisionand Loan Division
Hidetoshi Suzuki 6
In charge of Card Division, Sales Planning Divisionand Finance Division
Kazufusa Inada 14
General Manager of Administration DivisionIn charge of Takashimaya Card Dept.
Board of Directors and Statutory Auditors(As of July 31, 2004)
Credit Saison realizes that strengthening supervisory
functions to increase transparency in management and
achieve business objectives is extremely important. The
Company is taking various measures aimed at enhancing
corporate governance.
➤ Organizational Details and Internal Control System The Board of Directors consists of sixteen members who set basic
policies for the Company’s business execution and supervise directors’
execution of their duties.
Credit Saison applies the auditor system with a board of auditors
consisting of four statutory auditors. In accordance with the auditing
policies and division of duties decided by the Board of Auditors, each
auditor conducts rigorous audits by methods including attending
meetings of the Board of Directors and other important meetings,
listening to reports on business from directors and others, reviewing
documents containing important decisions, and examining the
condition of the Company’s business operations and assets.
Credit Saison also appoints one outside director and three outside
auditors to reinforce management check functions. They conduct
supervision and audits with an objective view of the Company’s
management.
In addition, the internal Audit Office conducts audits of
compliance, risk management, internal control systems, governance
and other matters in the organizational operations and business
activities of Credit Saison and its group companies, and makes
evaluations and recommendations based on these audits.
Credit Saison will continue to consider the most suitable
management structure, taking into consideration factors including
international trends and Commercial Code revisions concerning
corporate governance.
18 Credit Saison Co., Ltd.
Corporate Governance
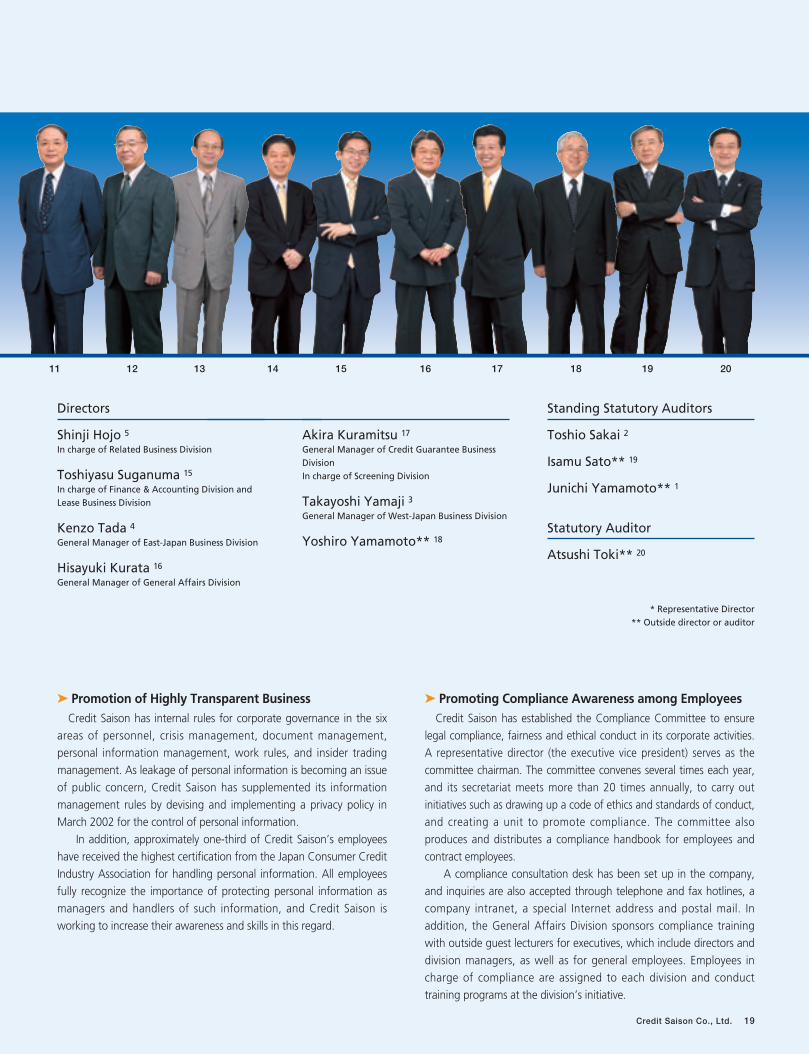
1211 13 14 15 16 17 18 19 20
➤ Promotion of Highly Transparent BusinessCredit Saison has internal rules for corporate governance in the six
areas of personnel, crisis management, document management,
personal information management, work rules, and insider trading
management. As leakage of personal information is becoming an issue
of public concern, Credit Saison has supplemented its information
management rules by devising and implementing a privacy policy in
March 2002 for the control of personal information.
In addition, approximately one-third of Credit Saison’s employees
have received the highest certification from the Japan Consumer Credit
Industry Association for handling personal information. All employees
fully recognize the importance of protecting personal information as
managers and handlers of such information, and Credit Saison is
working to increase their awareness and skills in this regard.
➤ Promoting Compliance Awareness among Employees Credit Saison has established the Compliance Committee to ensure
legal compliance, fairness and ethical conduct in its corporate activities.
A representative director (the executive vice president) serves as the
committee chairman. The committee convenes several times each year,
and its secretariat meets more than 20 times annually, to carry out
initiatives such as drawing up a code of ethics and standards of conduct,
and creating a unit to promote compliance. The committee also
produces and distributes a compliance handbook for employees and
contract employees.
A compliance consultation desk has been set up in the company,
and inquiries are also accepted through telephone and fax hotlines, a
company intranet, a special Internet address and postal mail. In
addition, the General Affairs Division sponsors compliance training
with outside guest lecturers for executives, which include directors and
division managers, as well as for general employees. Employees in
charge of compliance are assigned to each division and conduct
training programs at the division’s initiative.
Directors
Shinji Hojo 5
In charge of Related Business Division
Toshiyasu Suganuma 15
In charge of Finance & Accounting Division andLease Business Division
Kenzo Tada 4
General Manager of East-Japan Business Division
Hisayuki Kurata 16
General Manager of General Affairs Division
Akira Kuramitsu 17
General Manager of Credit Guarantee BusinessDivisionIn charge of Screening Division
Takayoshi Yamaji 3
General Manager of West-Japan Business Division
Yoshiro Yamamoto** 18
Standing Statutory Auditors
Toshio Sakai 2
Isamu Sato** 19
Junichi Yamamoto** 1
Statutory Auditor
Atsushi Toki** 20
* Representative Director** Outside director or auditor
Credit Saison Co., Ltd. 19
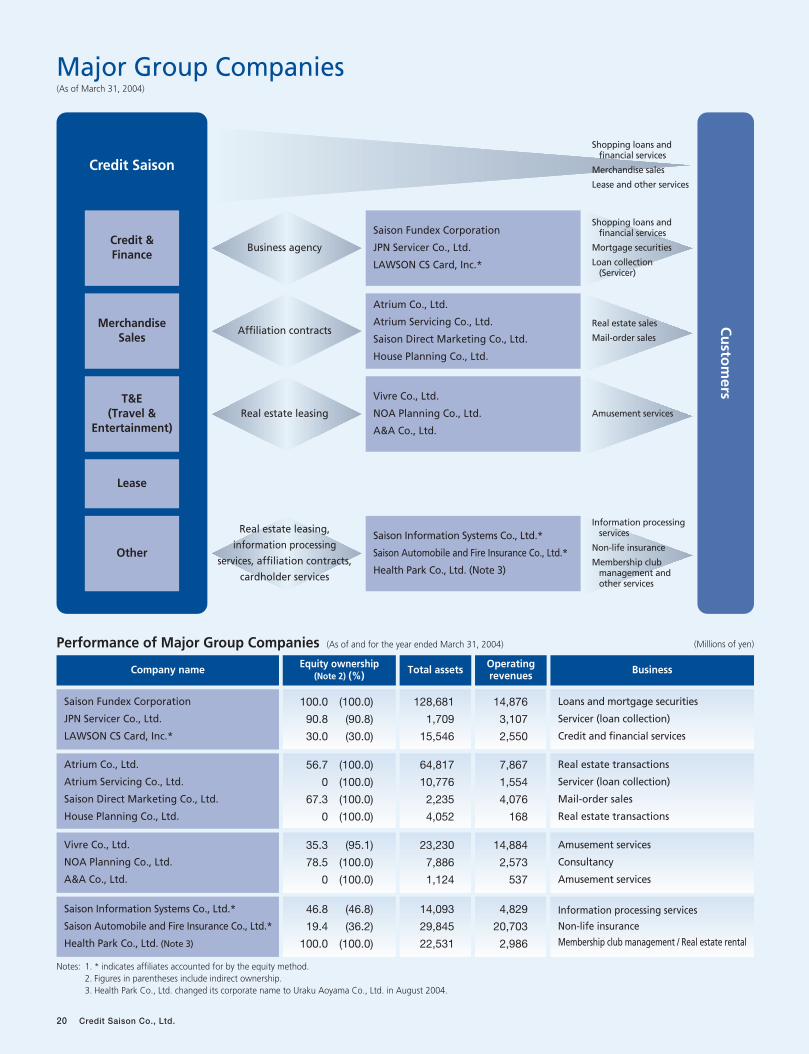
Major Group Companies (As of March 31, 2004)
20 Credit Saison Co., Ltd.
Saison Fundex Corporation
JPN Servicer Co., Ltd.
LAWSON CS Card, Inc.*
Atrium Co., Ltd.
Atrium Servicing Co., Ltd.
Saison Direct Marketing Co., Ltd.
House Planning Co., Ltd.
Vivre Co., Ltd.
NOA Planning Co., Ltd.
A&A Co., Ltd.
Saison Information Systems Co., Ltd.*
Saison Automobile and Fire Insurance Co., Ltd.*
Health Park Co., Ltd. (Note 3)
56.7 (100.0)
0 (100.0)
67.3 (100.0)
0 (100.0)
35.3 (95.1)
78.5 (100.0)
0 (100.0)
46.8 (46.8)
19.4 (36.2)
100.0 (100.0)
Company name Equity ownership(Note 2) (%)
128,681
1,709
15,546
64,817
10,776
2,235
4,052
23,230
7,886
1,124
14,093
29,845
22,531
Total assets
14,876
3,107
2,550
7,867
1,554
4,076
168
14,884
2,573
537
4,829
20,703
2,986
Operatingrevenues
Loans and mortgage securities
Servicer (loan collection)
Credit and financial services
Real estate transactions
Servicer (loan collection)
Mail-order sales
Real estate transactions
Amusement services
Consultancy
Amusement services
Information processing services
Non-life insurance
Membership club management / Real estate rental
Business
Performance of Major Group Companies (As of and for the year ended March 31, 2004) (Millions of yen)
Notes: 1. * indicates affiliates accounted for by the equity method.2. Figures in parentheses include indirect ownership.3. Health Park Co., Ltd. changed its corporate name to Uraku Aoyama Co., Ltd. in August 2004.
100.0 (100.0)
90.8 (90.8)
30.0 (30.0)
Credit &Finance
MerchandiseSales
T&E(Travel &
Entertainment)
Other
Saison Fundex Corporation
JPN Servicer Co., Ltd.
LAWSON CS Card, Inc.*
Atrium Co., Ltd.
Atrium Servicing Co., Ltd.
Saison Direct Marketing Co., Ltd.
House Planning Co., Ltd.
Vivre Co., Ltd.
NOA Planning Co., Ltd.
A&A Co., Ltd.
Saison Information Systems Co., Ltd.*
Saison Automobile and Fire Insurance Co., Ltd.*
Health Park Co., Ltd. (Note 3)
Cu
stom
ers
Shopping loans and financial services
Merchandise sales
Lease and other services
Shopping loans and financial services
Mortgage securities
Loan collection (Servicer)
Business agency
Affiliation contracts
Real estate leasing
Real estate leasing,
information processing
services, affiliation contracts,
cardholder services
Real estate sales
Mail-order sales
Amusement services
Lease
Information processing services
Non-life insurance
Membership club management and other services
Credit Saison
目 次
Financial Section
Credit Saison Co., Ltd. 21
Management’s Discussion and Analysis ................................... 22
Six-year Summary of Selected Financial Data ..................... 22
Consolidated Balance Sheets .................................................... 30
Consolidated Statements of Income ........................................ 32
Consolidated Statements of Shareholders’ Equity.................. 33
Consolidated Statements of Cash Flows .................................. 34
Notes to Consolidated Financial Statements........................... 35
Report of Independent Accountants ....................................... 49
CONTENTS
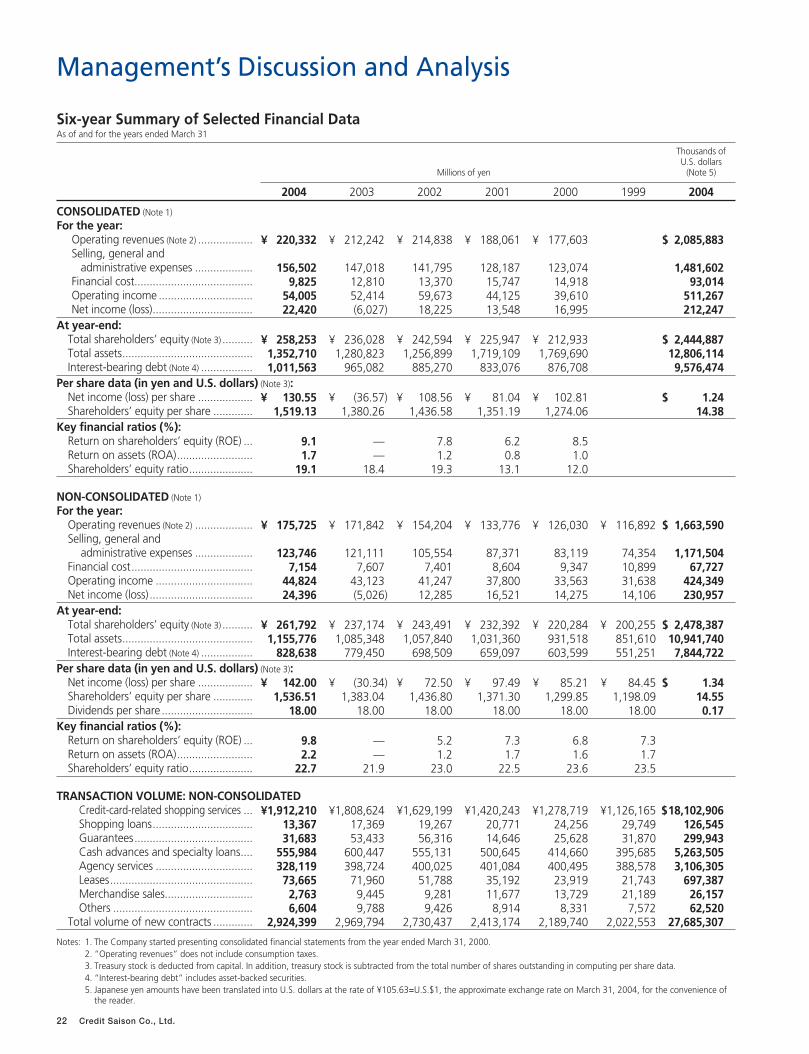
Management’s Discussion and Analysis
Thousands ofU.S. dollars
Millions of yen (Note 5)
2004 2003 2002 2001 2000 1999 2004
CONSOLIDATED (Note 1)
For the year:Operating revenues (Note 2) .................. ¥ 220,332 ¥ 212,242 ¥ 214,838 ¥ 188,061 ¥ 177,603 $ 2,085,883Selling, general and
administrative expenses ................... 156,502 147,018 141,795 128,187 123,074 1,481,602Financial cost....................................... 9,825 12,810 13,370 15,747 14,918 93,014Operating income ............................... 54,005 52,414 59,673 44,125 39,610 511,267Net income (loss)................................. 22,420 (6,027) 18,225 13,548 16,995 212,247
At year-end:Total shareholders’ equity (Note 3) .......... ¥ 258,253 ¥ 236,028 ¥ 242,594 ¥ 225,947 ¥ 212,933 $ 2,444,887Total assets........................................... 1,352,710 1,280,823 1,256,899 1,719,109 1,769,690 12,806,114Interest-bearing debt (Note 4) ................. 1,011,563 965,082 885,270 833,076 876,708 9,576,474
Per share data (in yen and U.S. dollars) (Note 3):Net income (loss) per share .................. ¥ 130.55 ¥ (36.57) ¥ 108.56 ¥ 81.04 ¥ 102.81 $ 1.24Shareholders’ equity per share ............. 1,519.13 1,380.26 1,436.58 1,351.19 1,274.06 14.38
Key financial ratios (%):Return on shareholders’ equity (ROE) ... 9.1 — 7.8 6.2 8.5Return on assets (ROA)......................... 1.7 — 1.2 0.8 1.0Shareholders’ equity ratio..................... 19.1 18.4 19.3 13.1 12.0
NON-CONSOLIDATED (Note 1)
For the year:Operating revenues (Note 2) ................... ¥ 175,725 ¥ 171,842 ¥ 154,204 ¥ 133,776 ¥ 126,030 ¥ 116,892 $ 1,663,590Selling, general and
administrative expenses ................... 123,746 121,111 105,554 87,371 83,119 74,354 1,171,504Financial cost........................................ 7,154 7,607 7,401 8,604 9,347 10,899 67,727Operating income ................................ 44,824 43,123 41,247 37,800 33,563 31,638 424,349Net income (loss).................................. 24,396 (5,026) 12,285 16,521 14,275 14,106 230,957
At year-end:Total shareholders’ equity (Note 3) .......... ¥ 261,792 ¥ 237,174 ¥ 243,491 ¥ 232,392 ¥ 220,284 ¥ 200,255 $ 2,478,387Total assets........................................... 1,155,776 1,085,348 1,057,840 1,031,360 931,518 851,610 10,941,740Interest-bearing debt (Note 4) ................. 828,638 779,450 698,509 659,097 603,599 551,251 7,844,722
Per share data (in yen and U.S. dollars) (Note 3):Net income (loss) per share .................. ¥ 142.00 ¥ (30.34) ¥ 72.50 ¥ 97.49 ¥ 85.21 ¥ 84.45 $ 1.34Shareholders’ equity per share ............. 1,536.51 1,383.04 1,436.80 1,371.30 1,299.85 1,198.09 14.55Dividends per share .............................. 18.00 18.00 18.00 18.00 18.00 18.00 0.17
Key financial ratios (%):Return on shareholders’ equity (ROE) ... 9.8 — 5.2 7.3 6.8 7.3Return on assets (ROA)......................... 2.2 — 1.2 1.7 1.6 1.7Shareholders’ equity ratio..................... 22.7 21.9 23.0 22.5 23.6 23.5
TRANSACTION VOLUME: NON-CONSOLIDATEDCredit-card-related shopping services ... ¥1,912,210 ¥1,808,624 ¥1,629,199 ¥1,420,243 ¥1,278,719 ¥1,126,165 $18,102,906Shopping loans................................. 13,367 17,369 19,267 20,771 24,256 29,749 126,545Guarantees....................................... 31,683 53,433 56,316 14,646 25,628 31,870 299,943Cash advances and specialty loans.... 555,984 600,447 555,131 500,645 414,660 395,685 5,263,505Agency services ................................ 328,119 398,724 400,025 401,084 400,495 388,578 3,106,305Leases............................................... 73,665 71,960 51,788 35,192 23,919 21,743 697,387Merchandise sales............................. 2,763 9,445 9,281 11,677 13,729 21,189 26,157Others .............................................. 6,604 9,788 9,426 8,914 8,331 7,572 62,520
Total volume of new contracts ............. 2,924,399 2,969,794 2,730,437 2,413,174 2,189,740 2,022,553 27,685,307
22 Credit Saison Co., Ltd.
Notes: 1. The Company started presenting consolidated financial statements from the year ended March 31, 2000.2. “Operating revenues” does not include consumption taxes.3. Treasury stock is deducted from capital. In addition, treasury stock is subtracted from the total number of shares outstanding in computing per share data.4. “Interest-bearing debt” includes asset-backed securities.5. Japanese yen amounts have been translated into U.S. dollars at the rate of ¥105.63=U.S.$1, the approximate exchange rate on March 31, 2004, for the convenience of
the reader.
Six-year Summary of Selected Financial DataAs of and for the years ended March 31
Credit Saison Co., Ltd. 23
The Credit Saison Group generates operating revenues in five
segments: Credit and Finance, Merchandise Sales, T&E (Travel and
Entertainment), Lease and Other. Credit and Finance is the largest of these
segments. It consists primarily of the consumer credit businesses of
credit cards and loans to individuals, and accounted for approximately 80
percent of operating revenues in the year ended March 31, 2004. The
Credit Saison Group began reporting Lease as a separate segment
beginning with the year ended March 31, 2004 because of its
increasing importance in consolidated results.
Operating revenues consist primarily of fees from affiliated stores
generated by credit card and installment purchases, and customer fees
generated by revolving accounts, card cash advance transactions and
various loans.
Operating expenses consist primarily of advertising expenses, losses
on accounts receivable, personnel expenses, fees and financial costs.
Advertising and personnel expenses represent a significant percentage of
operating expenses. These costs are directly related to acquiring new
cardholders to generate future revenue growth.
Changes in the Scope of ConsolidationDuring the year ended March 31, 2004, the Credit Saison Group
added two companies to the scope of consolidation — Health Park
Co., Ltd. and Atrium Servicing Co., Ltd. — and removed two comp-
anies, bringing the number of consolidated subsidiaries to 10. Health Park
Co., Ltd. was created as a separate company on April 1, 2003. Credit
Saison Co., Ltd. transferred the assets and liabilities associated with its real
estate leasing business to the new company. Atrium Servicing Co.,
Ltd. is a servicing agent that specializes in buying non-performing
mortgage-backed loans and buildings used to collateralize loans,
adding value to these assets and then selling them. A special meeting of
shareholders on May 15, 2003 resolved to dissolve United Vacations Japan
Inc., which operated in the travel business. The liquidation was
completed as of March 31, 2004. In addition, Vivre Co., Ltd. merged with
Lira Corporation on March 31, 2004.
Analysis of Income StatementsDuring the year ended March 31, 2004, although mild deflation-
ary conditions continued, the decline in personal income halted, and
the employment situation and consumer sentiment rallied. Amid
these conditions, signs of recovery in personal consumption became
apparent from the third quarter, reflecting the improvement in
employment conditions and consumer attitudes. On the other hand, in the
credit card industry, the Credit Saison Group’s core area of business, the
reorganization of the retail financial services industry began in earnest and
contributed to a challenging competitive environment.
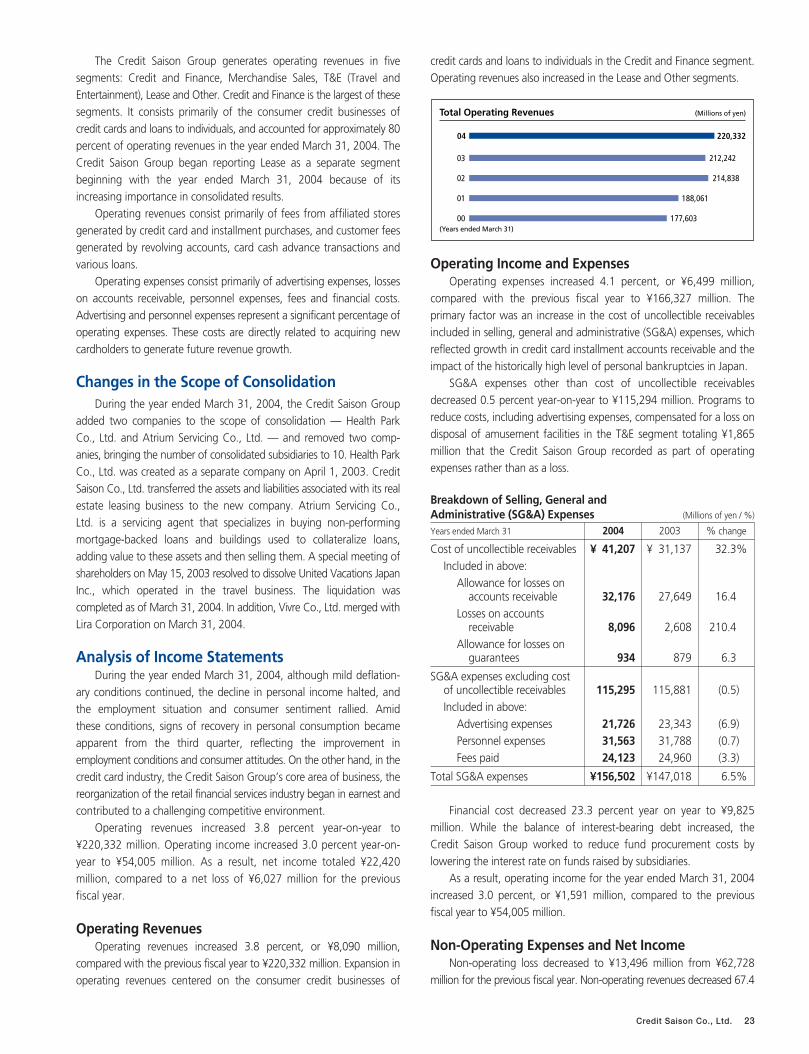
Operating revenues increased 3.8 percent year-on-year to
¥220,332 million. Operating income increased 3.0 percent year-on-
year to ¥54,005 million. As a result, net income totaled ¥22,420
million, compared to a net loss of ¥6,027 million for the previous
fiscal year.
Operating RevenuesOperating revenues increased 3.8 percent, or ¥8,090 million,
compared with the previous fiscal year to ¥220,332 million. Expansion in
operating revenues centered on the consumer credit businesses of
credit cards and loans to individuals in the Credit and Finance segment.
Operating revenues also increased in the Lease and Other segments.
Operating Income and ExpensesOperating expenses increased 4.1 percent, or ¥6,499 million,
compared with the previous fiscal year to ¥166,327 million. The
primary factor was an increase in the cost of uncollectible receivables
included in selling, general and administrative (SG&A) expenses, which
reflected growth in credit card installment accounts receivable and the
impact of the historically high level of personal bankruptcies in Japan.
SG&A expenses other than cost of uncollectible receivables
decreased 0.5 percent year-on-year to ¥115,294 million. Programs to
reduce costs, including advertising expenses, compensated for a loss on
disposal of amusement facilities in the T&E segment totaling ¥1,865
million that the Credit Saison Group recorded as part of operating
expenses rather than as a loss.
Breakdown of Selling, General and Administrative (SG&A) Expenses (Millions of yen / %)
Years ended March 31 2004 2003 % change
Cost of uncollectible receivables ¥ 41,207 ¥ 31,137 32.3%
Included in above:
Allowance for losses on accounts receivable 32,176 27,649 16.4
Losses on accountsreceivable 8,096 2,608 210.4
Allowance for losses on guarantees 934 879 6.3
SG&A expenses excluding costof uncollectible receivables 115,295 115,881 (0.5)
Included in above:
Advertising expenses 21,726 23,343 (6.9)
Personnel expenses 31,563 31,788 (0.7)
Fees paid 24,123 24,960 (3.3)
Total SG&A expenses ¥156,502 ¥147,018 6.5%
Financial cost decreased 23.3 percent year on year to ¥9,825
million. While the balance of interest-bearing debt increased, the
Credit Saison Group worked to reduce fund procurement costs by
lowering the interest rate on funds raised by subsidiaries.
As a result, operating income for the year ended March 31, 2004
increased 3.0 percent, or ¥1,591 million, compared to the previous
fiscal year to ¥54,005 million.
Non-Operating Expenses and Net IncomeNon-operating loss decreased to ¥13,496 million from ¥62,728
million for the previous fiscal year. Non-operating revenues decreased 67.4
Total Operating Revenues (Millions of yen)
00 177,603
03 212,242
02 214,838
188,06101
04 220,332
(Years ended March 31)
24 Credit Saison Co., Ltd.
percent year-on-year to ¥1,992 million because the Credit Saison
Group reduced proceeds from sales of investment securities. Non-
operating expenses decreased 77.5 percent year-on-year to ¥15,488
million, due largely to substantial decreases in loss on evaluation of
investment securities and in other non-operating expenses, both
primarily in connection with the rehabilitation of The Seibu Department
Stores, Ltd. The Credit Saison Group, however, implemented new
impairment accounting standards during the past fiscal year, which
resulted in impairment loss of property and equipment, other assets
totaling ¥7,570 million.
Income before income taxes totaled ¥40,509 million, compared to a
loss before income taxes totaling ¥10,314 million for the previous
fiscal year. Provision for income taxes increased to ¥18,022 million
from ¥4,107 million for the previous fiscal year. Consequently, net
income totaled ¥22,420 million, compared to a net loss of ¥6,027
million for the previous fiscal year. Net income per share totaled
¥130.55.
Shareholder Returns PolicyDividend Policy
The Credit Saison Group considers strengthening its corporate
structure and working to achieve sustainable growth in its businesses
to be critical to increasing shareholder value. The Credit Saison
Group’s fundamental policy regarding distribution of profits is to
secure sufficient internal capital resources for the above purposes
while providing appropriate, stable and sustainable dividends to
shareholders.
Dividends per ShareBased on the above dividend policy, cash dividends totaled ¥18.00 per
share for the year ended March 31, 2004, unchanged from the
previous fiscal year. In addition, the Credit Saison Group distributed
SAISON Permanent Points to shareholders who are SAISON CARD
cardholders in proportion to the number of shares held.
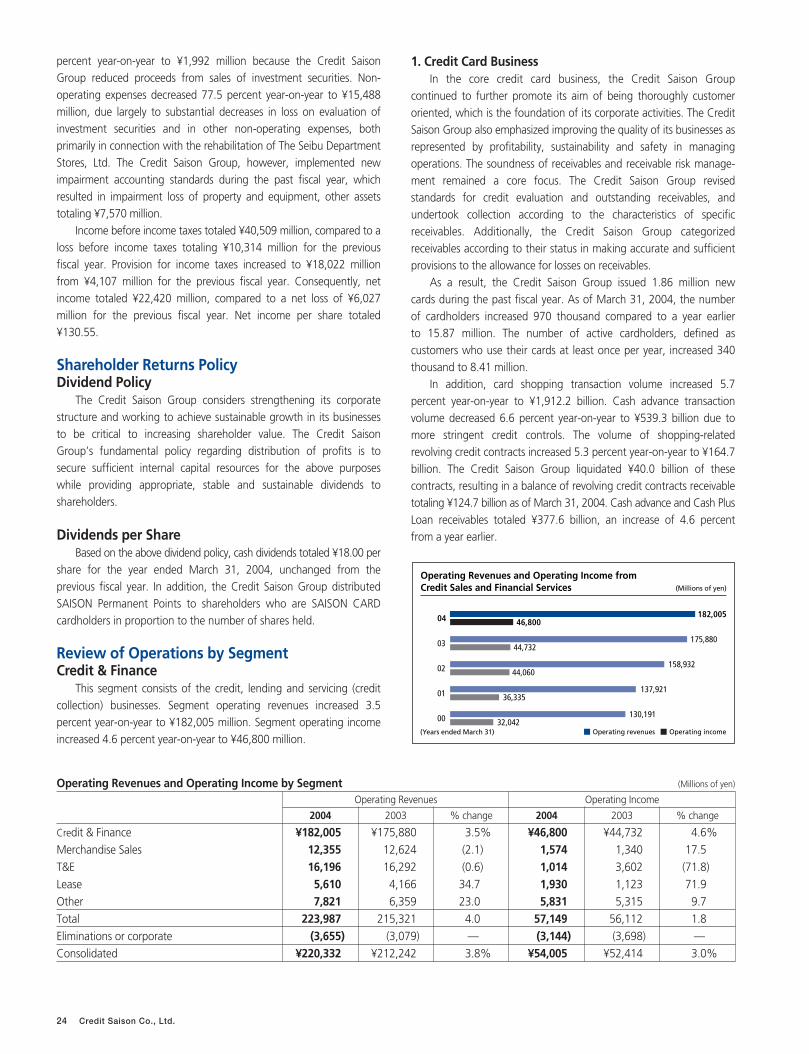
Review of Operations by SegmentCredit & Finance
This segment consists of the credit, lending and servicing (credit
collection) businesses. Segment operating revenues increased 3.5
percent year-on-year to ¥182,005 million. Segment operating income
increased 4.6 percent year-on-year to ¥46,800 million.
1. Credit Card BusinessIn the core credit card business, the Credit Saison Group
continued to further promote its aim of being thoroughly customer
oriented, which is the foundation of its corporate activities. The Credit
Saison Group also emphasized improving the quality of its businesses as
represented by profitability, sustainability and safety in managing
operations. The soundness of receivables and receivable risk manage-
ment remained a core focus. The Credit Saison Group revised
standards for credit evaluation and outstanding receivables, and
undertook collection according to the characteristics of specific
receivables. Additionally, the Credit Saison Group categorized
receivables according to their status in making accurate and sufficient
provisions to the allowance for losses on receivables.
As a result, the Credit Saison Group issued 1.86 million new
cards during the past fiscal year. As of March 31, 2004, the number
of cardholders increased 970 thousand compared to a year earlier
to 15.87 million. The number of active cardholders, defined as
customers who use their cards at least once per year, increased 340
thousand to 8.41 million.
In addition, card shopping transaction volume increased 5.7
percent year-on-year to ¥1,912.2 billion. Cash advance transaction
volume decreased 6.6 percent year-on-year to ¥539.3 billion due to
more stringent credit controls. The volume of shopping-related
revolving credit contracts increased 5.3 percent year-on-year to ¥164.7
billion. The Credit Saison Group liquidated ¥40.0 billion of these
contracts, resulting in a balance of revolving credit contracts receivable
totaling ¥124.7 billion as of March 31, 2004. Cash advance and Cash Plus
Loan receivables totaled ¥377.6 billion, an increase of 4.6 percent
from a year earlier.
Operating Revenues and Operating Income by Segment (Millions of yen)
Operating Revenues Operating Income
2004 2003 % change 2004 2003 % change
Credit & Finance ¥182,005 ¥175,880 3.5% ¥46,800 ¥44,732 4.6%
Merchandise Sales 12,355 12,624 (2.1) 1,574 1,340 17.5
T&E 16,196 16,292 (0.6) 1,014 3,602 (71.8)
Lease 5,610 4,166 34.7 1,930 1,123 71.9
Other 7,821 6,359 23.0 5,831 5,315 9.7
Total 223,987 215,321 4.0 57,149 56,112 1.8
Eliminations or corporate (3,655) (3,079) — (3,144) (3,698) —
Consolidated ¥220,332 ¥212,242 3.8% ¥54,005 ¥52,414 3.0%
Operating Revenues and Operating Income from Credit Sales and Financial Services (Millions of yen)
04 182,00546,800
00 130,19132,042
02 158,93244,060
01 36,335137,921
03 175,88044,732
(Years ended March 31) Operating revenues Operating income
Credit Saison Co., Ltd. 25
Key Initiatives in the Credit Card Business during the Fiscal YearEnded March 31, 2004
Alliance Network Expansion and Acquisition of Cardholders
◆ Alliance Network ExpansionThe Credit Saison Group added 10 companies as alliance
partners during the past fiscal year, bringing the total number of
alliance partners to 76 companies.
◆ Brand Awareness and DiffusionThe third generation of advertisements featuring a wine motif
that expresses the diverse, international functions of the SAISON
CARD ran during the fiscal year.
◆ Measures to Stimulate Card UsageWe changed the name of our point program that allows
customers to collect points that never expire and use them
whenever they want from SAISON Dream to SAISON Permanent
Points (“Eikyufumetsu Point” ). We also substantially changed
the selection of items customers can obtain by redeeming
points. In connection with this initiative, we placed further stress
on presenting the message “SAISON CARD: Use It Forever” to
stimulate card use.
◆ Alliance with JTB Corp.We concluded an alliance with JTB Corp. and created a new tour
catalog, Saison Tabimonogatari, to add further to the travel
services we offer to cardholders.
Strengthening Our Business Foundation
◆ Building a System for Rapidly Issuing the SAISON CARDThe Credit Saison Group installed SAISON STATION information
terminals that permit rapid application and issuance of cards at key
SAISON Counters nationwide. In addition to SAISON Counters and
SAISON CARD MAKER automated card issuing machines, we
increased the number of locations at which people can obtain cards
by starting to issue the SAISON CARD at the Shinjuku Station West
Exit store of Zero First Co., Ltd., a group company of Marui Co.,
Ltd. In addition, we enhanced service by significantly expanding the
types of cards that can be issued rapidly.
◆ IT Network Implementation and ExpansionThe Credit Saison Group invested in the transition to a front-end
processor (FEP) that connects to an external network operated
jointly by four large credit card companies, the introduction of a new
credit evaluation system, and higher speed and bandwidth for
the network linking operating locations.
◆ Enhancing Customer Management SystemsTo handle expansion in the credit business, the Credit Saison
Group revised its customer management system to strengthen
scalability, flexibility and efficiency.
New Developments and Initiatives
◆ Comprehensive Alliance with the Card Division of Idemitsu Kosan Co., Ltd.The Credit Saison Group took a 50 percent equity stake in
Idemitsu Credit Co., Ltd., a joint venture established on October 1,
2003. The Credit Saison Group has been commissioned to
handle the card administration operations, which represents a
new source of earnings in the fee business. The Credit Saison
Group will provide its know-how and make full use of the
linkage with Idemitsu Kosan’s 6,000 service stations nationwide to
expand the number of cardholders and stimulate card use.
◆ Strategic Capital and Operating Alliance with Resona Holdings, Inc.The Credit Saison Group and Resona Holdings moved to further
strengthen the credit card operations of both companies by
concluding a strategic capital and operating alliance. The Resona
Group holding company will merge its three credit card
companies, and the Credit Saison Group plans to take an equity
stake in the new company that will result from the merger. The
Credit Saison Group will jointly develop the cards the new
company will issue, and has been commissioned to handle its
card administration operations, which will contribute to expans-
ion in fee business.
2. Card Loan BusinessThe Credit Saison Group provides card loans through the C-Plan Card
and Cash Reserve Card dedicated loan cards. The number of loan
cards issued increased 10.3 percent year-on-year to 170 thousand,
and the balance of card loans receivable increased 17.7 percent year-on-
year to ¥53,925 million.
3. Other Consumer LoansIn addition to card loans, the Credit Saison Group provides a
variety of unsecured consumer loans. These include the Member’s
Loan for SAISON CARD cardholders. Other consumer loans receivable
increased 24.4 percent year-on-year to ¥49,386 million.
4. Credit Guarantee BusinessThe Credit Saison Group uses close relationships spanning sales
and administration in alliances with financial institutions to concentrate
on acquiring quality contracts. Credit guarantee transaction volume,
however, decreased 40.7 percent year-on-year to ¥31.7 billion due to the
challenging business environment.
5. Servicer (Credit Collection) BusinessLicensed by the Minister of Justice, the Credit Saison Group
provides commissioned collection services for a broad spectrum of
debt receivables ranging from those in initial delinquency to those that
have been written off. This business has been expanding steadily, and the
Credit Saison Group has been working to raise the efficiency of credit
collection operations in ways such as installing a new credit collection
administration system to maintain a high collection rate.
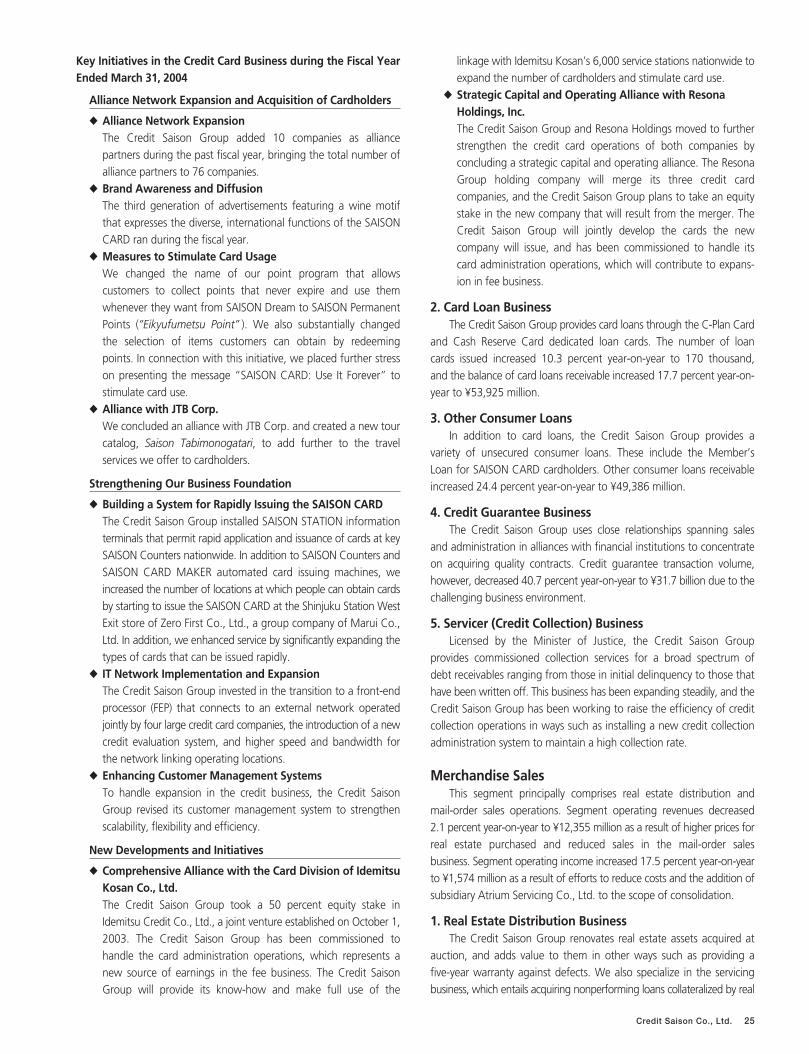
Merchandise SalesThis segment principally comprises real estate distribution and
mail-order sales operations. Segment operating revenues decreased
2.1 percent year-on-year to ¥12,355 million as a result of higher prices for
real estate purchased and reduced sales in the mail-order sales
business. Segment operating income increased 17.5 percent year-on-year
to ¥1,574 million as a result of efforts to reduce costs and the addition of
subsidiary Atrium Servicing Co., Ltd. to the scope of consolidation.
1. Real Estate Distribution BusinessThe Credit Saison Group renovates real estate assets acquired at
auction, and adds value to them in other ways such as providing a
five-year warranty against defects. We also specialize in the servicing
business, which entails acquiring nonperforming loans collateralized by real
26 Credit Saison Co., Ltd.
estate and real estate that collateralized such loans, adding value to
them and then selling them. The Credit Saison Group also focuses
on building and marketing properties in central Tokyo, where the
property turnover rate is high.
2. Mail-Order Sales BusinessThe Credit Saison Group issued new catalogs eight times during the
fiscal year and enhanced programs for promoting sales to SAISON
CARD cardholders while also working to improve the profit structure of
this business by reducing expenses. Sales decreased year-on-year,
however, because intense price competition reduced unit sales prices.
T&EThis segment comprises the travel business and the amusement
business. Segment operating revenues decreased 0.6 percent year-on-year
to ¥16,196 million, and segment operating income decreased 71.8
percent year-on-year to ¥1,014 million. During the fiscal year ended
March 31, 2004, the Credit Saison Group dissolved the subsidiary that
handled the travel business, United Vacations Japan Inc., and incurred
increased expenses in the amusement business for the construction of
new facilities. In addition, the Credit Saison Group reclassified loss on
disposal of amusement facilities as part of operating expenses rather
than as a loss.
1. Travel BusinessA special meeting of shareholders on May 15, 2003 resolved to
dissolve United Vacations Japan Inc. Dissolution was completed as of
March 31, 2004.
2. Amusement BusinessThe amusement industry is moving toward larger, higher-grade
facilities and competition is intensifying. In this challenging environment, the
Credit Saison Group promoted cost reductions and worked to create
sound, safe and comfortable amusement facilities that meet local needs.
LeaseThe Credit Saison Group began reporting Lease as a separate
segment beginning with the year ended March 31, 2004 because of its
increasing importance in consolidated results. Lease operations were
formerly included in the Other segment.
While the overall leasing market continued to contract during the past
fiscal year, lease transaction volume increased 2.4 percent year-on-
year to a record ¥73.6 billion. Segment operating revenues increased
34.7 percent year-on-year to ¥5,610 million, and segment operating
income increased 71.9 percent year-on-year to ¥1,930 million. Amid
the increasing popularity of mobile communications and broadband,
the Credit Saison Group emphasized small-ticket vendor leases,
particularly in the communication and business equipment sectors.
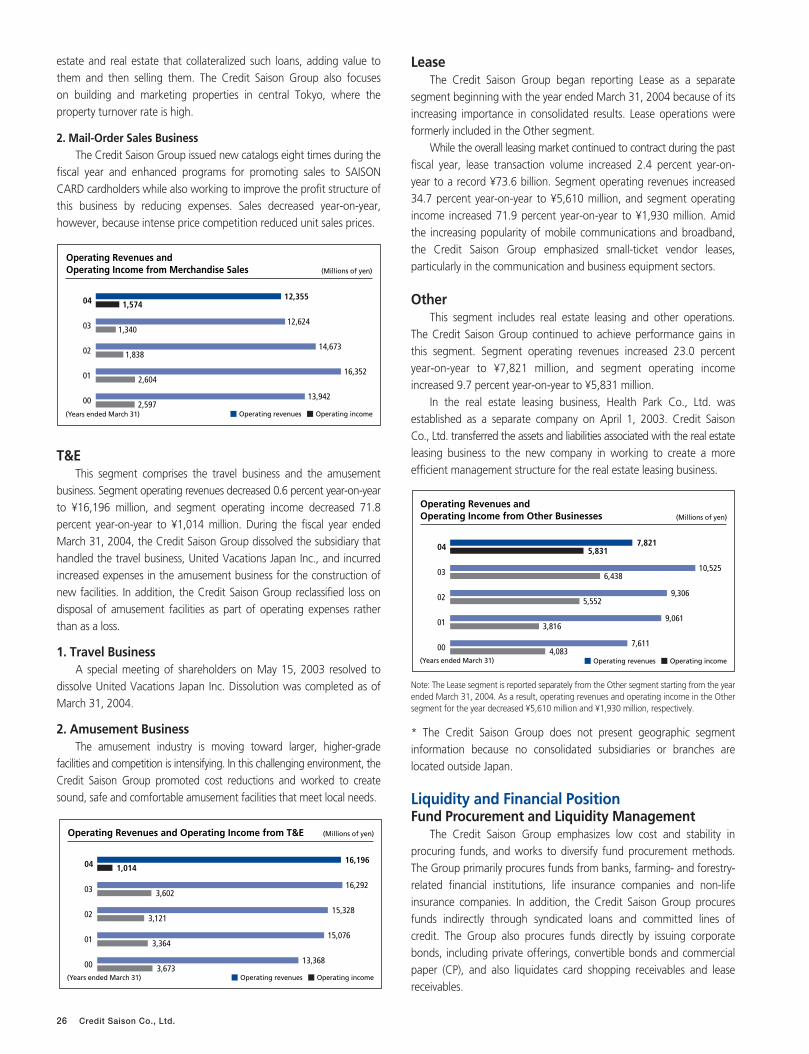
OtherThis segment includes real estate leasing and other operations.
The Credit Saison Group continued to achieve performance gains in
this segment. Segment operating revenues increased 23.0 percent
year-on-year to ¥7,821 million, and segment operating income
increased 9.7 percent year-on-year to ¥5,831 million.
In the real estate leasing business, Health Park Co., Ltd. was
established as a separate company on April 1, 2003. Credit Saison
Co., Ltd. transferred the assets and liabilities associated with the real estate
leasing business to the new company in working to create a more
efficient management structure for the real estate leasing business.
Note: The Lease segment is reported separately from the Other segment starting from the yearended March 31, 2004. As a result, operating revenues and operating income in the Othersegment for the year decreased ¥5,610 million and ¥1,930 million, respectively.
* The Credit Saison Group does not present geographic segment
information because no consolidated subsidiaries or branches are
located outside Japan.
Liquidity and Financial PositionFund Procurement and Liquidity Management
The Credit Saison Group emphasizes low cost and stability in
procuring funds, and works to diversify fund procurement methods.
The Group primarily procures funds from banks, farming- and forestry-
related financial institutions, life insurance companies and non-life
insurance companies. In addition, the Credit Saison Group procures
funds indirectly through syndicated loans and committed lines of
credit. The Group also procures funds directly by issuing corporate
bonds, including private offerings, convertible bonds and commercial
paper (CP), and also liquidates card shopping receivables and lease
receivables.
Operating Revenues and Operating Income from Merchandise Sales (Millions of yen)
04 12,3551,574
00 13,9422,597
02 14,6731,838
01 2,60416,352
03 12,6241,340
(Years ended March 31) Operating revenues Operating income
Operating Revenues and Operating Income from T&E (Millions of yen)
04 16,1961,014
00 13,3683,673
02 15,3283,121
01 3,36415,076
03 16,2923,602
(Years ended March 31) Operating revenues Operating income
Operating Revenues and Operating Income from Other Businesses (Millions of yen)
04 7,8215,831
00 7,6114,083
02 9,3065,552
01 3,8169,061
03 10,5256,438
(Years ended March 31) Operating revenues Operating income
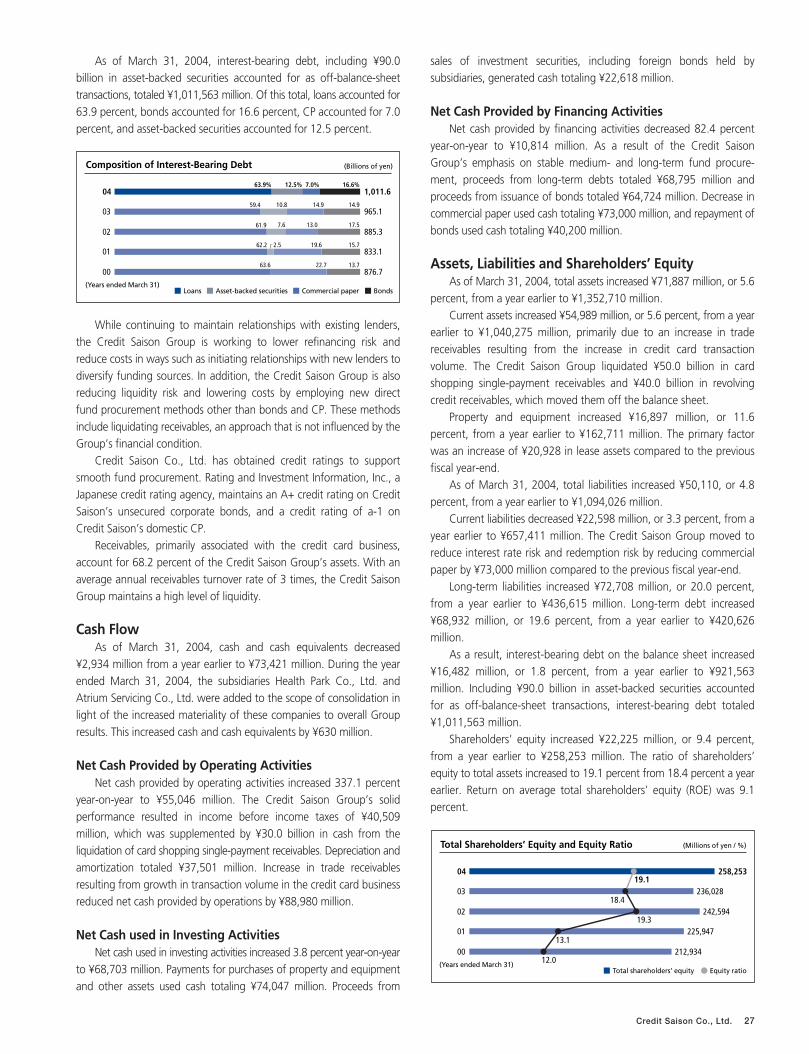
Credit Saison Co., Ltd. 27
As of March 31, 2004, interest-bearing debt, including ¥90.0
billion in asset-backed securities accounted for as off-balance-sheet
transactions, totaled ¥1,011,563 million. Of this total, loans accounted for
63.9 percent, bonds accounted for 16.6 percent, CP accounted for 7.0
percent, and asset-backed securities accounted for 12.5 percent.
While continuing to maintain relationships with existing lenders,
the Credit Saison Group is working to lower refinancing risk and
reduce costs in ways such as initiating relationships with new lenders to
diversify funding sources. In addition, the Credit Saison Group is also
reducing liquidity risk and lowering costs by employing new direct
fund procurement methods other than bonds and CP. These methods
include liquidating receivables, an approach that is not influenced by the
Group’s financial condition.
Credit Saison Co., Ltd. has obtained credit ratings to support
smooth fund procurement. Rating and Investment Information, Inc., a
Japanese credit rating agency, maintains an A+ credit rating on Credit
Saison’s unsecured corporate bonds, and a credit rating of a-1 on
Credit Saison’s domestic CP.
Receivables, primarily associated with the credit card business,
account for 68.2 percent of the Credit Saison Group’s assets. With an
average annual receivables turnover rate of 3 times, the Credit Saison
Group maintains a high level of liquidity.
Cash FlowAs of March 31, 2004, cash and cash equivalents decreased
¥2,934 million from a year earlier to ¥73,421 million. During the year
ended March 31, 2004, the subsidiaries Health Park Co., Ltd. and
Atrium Servicing Co., Ltd. were added to the scope of consolidation in
light of the increased materiality of these companies to overall Group
results. This increased cash and cash equivalents by ¥630 million.
Net Cash Provided by Operating ActivitiesNet cash provided by operating activities increased 337.1 percent
year-on-year to ¥55,046 million. The Credit Saison Group’s solid
performance resulted in income before income taxes of ¥40,509
million, which was supplemented by ¥30.0 billion in cash from the
liquidation of card shopping single-payment receivables. Depreciation and
amortization totaled ¥37,501 million. Increase in trade receivables
resulting from growth in transaction volume in the credit card business
reduced net cash provided by operations by ¥88,980 million.
Net Cash used in Investing ActivitiesNet cash used in investing activities increased 3.8 percent year-on-year
to ¥68,703 million. Payments for purchases of property and equipment
and other assets used cash totaling ¥74,047 million. Proceeds from
sales of investment securities, including foreign bonds held by
subsidiaries, generated cash totaling ¥22,618 million.
Net Cash Provided by Financing ActivitiesNet cash provided by financing activities decreased 82.4 percent
year-on-year to ¥10,814 million. As a result of the Credit Saison
Group’s emphasis on stable medium- and long-term fund procure-
ment, proceeds from long-term debts totaled ¥68,795 million and
proceeds from issuance of bonds totaled ¥64,724 million. Decrease in
commercial paper used cash totaling ¥73,000 million, and repayment of
bonds used cash totaling ¥40,200 million.
Assets, Liabilities and Shareholders’ EquityAs of March 31, 2004, total assets increased ¥71,887 million, or 5.6
percent, from a year earlier to ¥1,352,710 million.
Current assets increased ¥54,989 million, or 5.6 percent, from a year
earlier to ¥1,040,275 million, primarily due to an increase in trade
receivables resulting from the increase in credit card transaction
volume. The Credit Saison Group liquidated ¥50.0 billion in card
shopping single-payment receivables and ¥40.0 billion in revolving
credit receivables, which moved them off the balance sheet.
Property and equipment increased ¥16,897 million, or 11.6
percent, from a year earlier to ¥162,711 million. The primary factor
was an increase of ¥20,928 in lease assets compared to the previous
fiscal year-end.
As of March 31, 2004, total liabilities increased ¥50,110, or 4.8
percent, from a year earlier to ¥1,094,026 million.
Current liabilities decreased ¥22,598 million, or 3.3 percent, from a
year earlier to ¥657,411 million. The Credit Saison Group moved to
reduce interest rate risk and redemption risk by reducing commercial
paper by ¥73,000 million compared to the previous fiscal year-end.
Long-term liabilities increased ¥72,708 million, or 20.0 percent,
from a year earlier to ¥436,615 million. Long-term debt increased
¥68,932 million, or 19.6 percent, from a year earlier to ¥420,626
million.
As a result, interest-bearing debt on the balance sheet increased
¥16,482 million, or 1.8 percent, from a year earlier to ¥921,563
million. Including ¥90.0 billion in asset-backed securities accounted
for as off-balance-sheet transactions, interest-bearing debt totaled
¥1,011,563 million.
Shareholders’ equity increased ¥22,225 million, or 9.4 percent,
from a year earlier to ¥258,253 million. The ratio of shareholders’
equity to total assets increased to 19.1 percent from 18.4 percent a year
earlier. Return on average total shareholders’ equity (ROE) was 9.1
percent.
Composition of Interest-Bearing Debt (Billions of yen)
(Years ended March 31)Loans Asset-backed securities BondsCommercial paper
00 876.7
833.101
02 885.3
03 965.1
04 1,011.663.9% 12.5% 7.0% 16.6%
59.4 10.8 14.9 14.9
61.9 7.6 13.0 17.5
62.2 2.5 19.6 15.7
63.6 22.7 13.7
Total Shareholders’ Equity and Equity Ratio (Millions of yen / %)
(Years ended March 31)Total shareholders’ equity Equity ratio
00 212,93412.0
225,9470113.1
02 242,59419.3
03 236,02818.4
04 258,25319.1
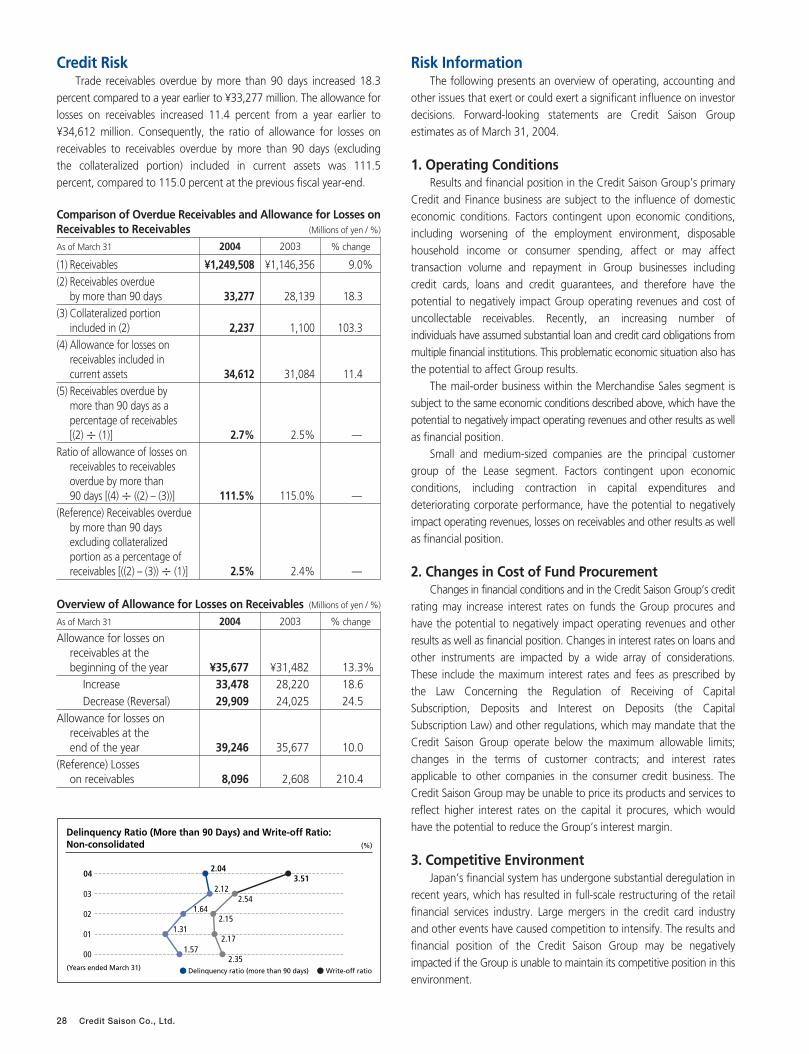
28 Credit Saison Co., Ltd.
Credit RiskTrade receivables overdue by more than 90 days increased 18.3
percent compared to a year earlier to ¥33,277 million. The allowance for
losses on receivables increased 11.4 percent from a year earlier to
¥34,612 million. Consequently, the ratio of allowance for losses on
receivables to receivables overdue by more than 90 days (excluding
the collateralized portion) included in current assets was 111.5
percent, compared to 115.0 percent at the previous fiscal year-end.
Comparison of Overdue Receivables and Allowance for Losses onReceivables to Receivables (Millions of yen / %)
As of March 31 2004 2003 % change
(1) Receivables ¥1,249,508 ¥1,146,356 9.0%
(2) Receivables overdue by more than 90 days 33,277 28,139 18.3
(3) Collateralized portion included in (2) 2,237 1,100 103.3
(4) Allowance for losses on receivables included in current assets 34,612 31,084 11.4
(5) Receivables overdue by more than 90 days as a percentage of receivables [(2) ÷ (1)] 2.7% 2.5% —
Ratio of allowance of losses on receivables to receivables overdue by more than 90 days [(4) ÷ ((2) – (3))] 111.5% 115.0% —
(Reference) Receivables overdue by more than 90 days excluding collateralized portion as a percentage of receivables [((2) – (3)) ÷ (1)] 2.5% 2.4% —
Overview of Allowance for Losses on Receivables (Millions of yen / %)
As of March 31 2004 2003 % change
Allowance for losses on receivables at the beginning of the year ¥35,677 ¥31,482 13.3%
Increase 33,478 28,220 18.6
Decrease (Reversal) 29,909 24,025 24.5
Allowance for losses on receivables at the end of the year 39,246 35,677 10.0
(Reference) Losses on receivables 8,096 2,608 210.4
Risk InformationThe following presents an overview of operating, accounting and
other issues that exert or could exert a significant influence on investor
decisions. Forward-looking statements are Credit Saison Group
estimates as of March 31, 2004.
1. Operating ConditionsResults and financial position in the Credit Saison Group’s primary
Credit and Finance business are subject to the influence of domestic
economic conditions. Factors contingent upon economic conditions,
including worsening of the employment environment, disposable
household income or consumer spending, affect or may affect
transaction volume and repayment in Group businesses including
credit cards, loans and credit guarantees, and therefore have the
potential to negatively impact Group operating revenues and cost of
uncollectable receivables. Recently, an increasing number of
individuals have assumed substantial loan and credit card obligations from
multiple financial institutions. This problematic economic situation also has
the potential to affect Group results.
The mail-order business within the Merchandise Sales segment is
subject to the same economic conditions described above, which have the
potential to negatively impact operating revenues and other results as well
as financial position.
Small and medium-sized companies are the principal customer
group of the Lease segment. Factors contingent upon economic
conditions, including contraction in capital expenditures and
deteriorating corporate performance, have the potential to negatively
impact operating revenues, losses on receivables and other results as well
as financial position.
2. Changes in Cost of Fund ProcurementChanges in financial conditions and in the Credit Saison Group’s credit
rating may increase interest rates on funds the Group procures and
have the potential to negatively impact operating revenues and other
results as well as financial position. Changes in interest rates on loans and
other instruments are impacted by a wide array of considerations.
These include the maximum interest rates and fees as prescribed by
the Law Concerning the Regulation of Receiving of Capital
Subscription, Deposits and Interest on Deposits (the Capital
Subscription Law) and other regulations, which may mandate that the
Credit Saison Group operate below the maximum allowable limits;
changes in the terms of customer contracts; and interest rates
applicable to other companies in the consumer credit business. The
Credit Saison Group may be unable to price its products and services to
reflect higher interest rates on the capital it procures, which would
have the potential to reduce the Group’s interest margin.
3. Competitive EnvironmentJapan’s financial system has undergone substantial deregulation in
recent years, which has resulted in full-scale restructuring of the retail
financial services industry. Large mergers in the credit card industry
and other events have caused competition to intensify. The results and
financial position of the Credit Saison Group may be negatively
impacted if the Group is unable to maintain its competitive position in this
environment.
Delinquency Ratio (More than 90 Days) and Write-off Ratio: Non-consolidated (%)
(Years ended March 31) Delinquency ratio (more than 90 days) Write-off ratio
00 2.351.57
2.1701 1.31
02 2.151.64
03 2.542.12
04 3.512.04
Credit Saison Co., Ltd. 29
4. Unfavorable Performance among Primary Alliance PartnersIn the credit card business, the Credit Saison Group has
agreements including affinity card and member store contracts with
numerous companies and organizations. Unfavorable performance
among these alliance partners has the potential to negatively impact the
Credit Saison Group’s performance and financial position. For
example, the Credit Saison Group acquires approximately 70 percent of
new cardholders through the outlets of alliance partners in the
retailing industry. Reduced ability to attract customers or lower sales
among these companies has the potential to negatively impact the
Credit Saison Group’s operating revenues.
In addition, the Credit Saison Group has capital relationships with a
number of its alliance partners. Unfavorable performance among such
alliance partners has the potential to incur impairment losses on
investment securities in the Credit Saison Group’s portfolio.
5. System Operation ProblemsThe Credit Saison Group relies heavily on computer systems and
communication networks in numerous aspects of its main businesses,
including the credit card business. A number of situations could
compromise the Credit Saison Group’s sales capabilities, damage its
credibility and cause other problems that would have the potential to
negatively impact the Credit Saison Group’s performance and financial
position. These situations include Group and counterparty system
inoperability resulting from temporary system overload due to factors such
as system errors or spikes in access caused by Group or counterparty
hardware or software problems; breakdown in communication
networks resulting from factors including natural disasters and
accidents; and illegal or inappropriate system operation.
6. Leakage of Personal Information and Other IssuesThe Credit Saison Group maintains a large volume of personal
information concerning its cardholders and others, and implements
appropriate controls throughout the Group. However, incidents such as
leakage or illegal use of this information would damage the Credit
Saison Group’s credibility and cause other problems that would have the
potential to negatively impact the Credit Saison Group’s performance and
financial position.
7. Regulatory ChangesThe Credit Saison Group operates in accordance with current
regulations and the risks that result from these regulations. The
Group’s businesses are subject to the Installment Sales Law, the
Money-Lending Business Control and Regulation Law, the Capital
Subscription Law and other laws. Amendments to or changes in the
interpretation of these laws in the future would have the potential to
negatively impact the Credit Saison Group’s operations, performance and
financial position. The type, content and degree of potential regulatory
revisions are difficult to predict, and the Credit Saison Group has no
control over their potential impact on its operations.
Recently, regulatory changes have had a material impact on the
Credit Saison Group’s performance. Issues include, but are not limited to,
amendments to the Civil Rehabilitation Law, the Practicing Attorney
Law and the Judicial Scrivener Law as well as changes in small-claims
receivership proceedings resulting from revisions to bankruptcy
proceedings. Amendments to related statutes and proceedings have
increased the options available for restructuring debt, and are directly
related to increased losses on receivables in the credit and financial
industries. In addition, the number of cases has been increasing in
which debtors paying a rate of interest in excess of the upper limit
specified by the Interest Rate Restriction Law file claims seeking
recovery of excessive profit from lenders. While this trend has not had a
material impact on the operations of the Credit Saison Group,
increased ease of access to legal recourse may exert a material impact in
the future. A related phenomenon is the increasing number of
attorneys that is resulting from reform of the legal system, and this
may have a material impact of the Credit Saison Group’s performance in
the future.
8. Impairment Loss of Property and Equipment and Revaluation LossesA material decline in the fair value of the Credit Saison Group’s land
and buildings, or a projected decline in operating income in businesses
employing such assets that is not deemed to be temporary, will incur
impairment losses that have the potential to negatively impact the
Credit Saison Group’s results and financial position. Moreover, a
material decline in the fair value of investment securities and
investments and loans to affiliates, or unfavorable performance
among investees, has the potential to incur revaluation losses.
9. Retirement Benefit ObligationsA decrease in the fair value of the assets in the pension plans of the
Credit Saison Group and changes in the actuarial assumptions used to
calculate retirement benefit obligations have the potential to
negatively impact the Credit Saison Group’s results and financial
position.
Outlook for the Year Ending March 31, 2005The Credit Saison Group is working to increase the services it
provides to support various customer lifestyles, and is stimulating
customer card use by energetically promoting innovation based on a
thorough commitment to customer satisfaction. The Group is also
developing strategies for adapting to market changes in working to
increase corporate and shareholder value.
Based on the above, the Credit Saison Group’s consolidated
performance objectives for the year ending March 31, 2005 are
operating revenues of ¥237.0 billion, operating income of ¥58.0 billion and
net income of ¥31.5 billion. Credit Saison Co. Ltd.’s non-consolidated
performance objectives for the year ending March 31, 2005 are
operating revenues of ¥189.0 billion, operating income of ¥46.5 billion and
net income of ¥27.0 billion.
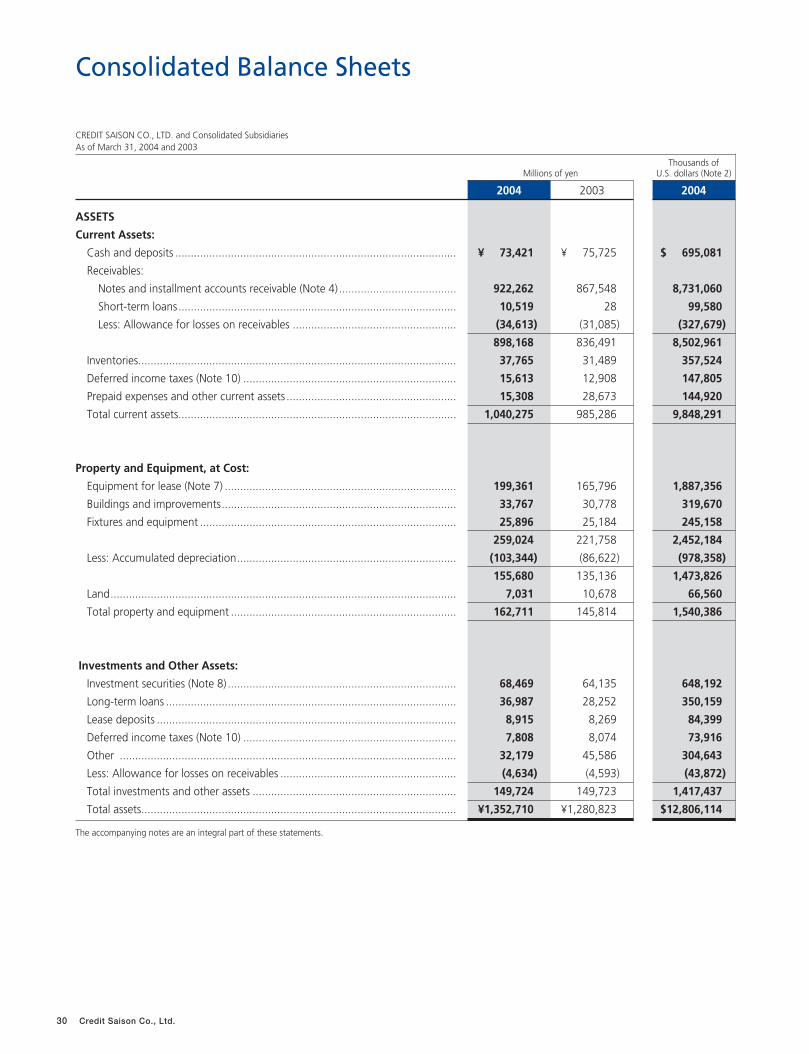
Consolidated Balance Sheets
30 Credit Saison Co., Ltd.
CREDIT SAISON CO., LTD. and Consolidated SubsidiariesAs of March 31, 2004 and 2003
Thousands ofMillions of yen U.S. dollars (Note 2)
2004 2003 2004
ASSETS
Current Assets:
Cash and deposits ........................................................................................... ¥ 73,421 ¥ 75,725 $ 695,081
Receivables:
Notes and installment accounts receivable (Note 4) ...................................... 922,262 867,548 8,731,060
Short-term loans.......................................................................................... 10,519 28 99,580
Less: Allowance for losses on receivables ..................................................... (34,613) (31,085) (327,679)
................................................................................................................ 898,168 836,491 8,502,961
Inventories....................................................................................................... 37,765 31,489 357,524
Deferred income taxes (Note 10) ..................................................................... 15,613 12,908 147,805
Prepaid expenses and other current assets ....................................................... 15,308 28,673 144,920
Total current assets.......................................................................................... 1,040,275 985,286 9,848,291
Property and Equipment, at Cost:
Equipment for lease (Note 7) ........................................................................... 199,361 165,796 1,887,356
Buildings and improvements............................................................................ 33,767 30,778 319,670
Fixtures and equipment ................................................................................... 25,896 25,184 245,158
................................................................................................................ 259,024 221,758 2,452,184
Less: Accumulated depreciation....................................................................... (103,344) (86,622) (978,358)
................................................................................................................ 155,680 135,136 1,473,826
Land................................................................................................................ 7,031 10,678 66,560
Total property and equipment ......................................................................... 162,711 145,814 1,540,386
Investments and Other Assets:
Investment securities (Note 8) .......................................................................... 68,469 64,135 648,192
Long-term loans .............................................................................................. 36,987 28,252 350,159
Lease deposits ................................................................................................. 8,915 8,269 84,399
Deferred income taxes (Note 10) ..................................................................... 7,808 8,074 73,916
Other ............................................................................................................. 32,179 45,586 304,643
Less: Allowance for losses on receivables ......................................................... (4,634) (4,593) (43,872)
Total investments and other assets .................................................................. 149,724 149,723 1,417,437
Total assets...................................................................................................... ¥1,352,710 ¥1,280,823 $12,806,114
The accompanying notes are an integral part of these statements.
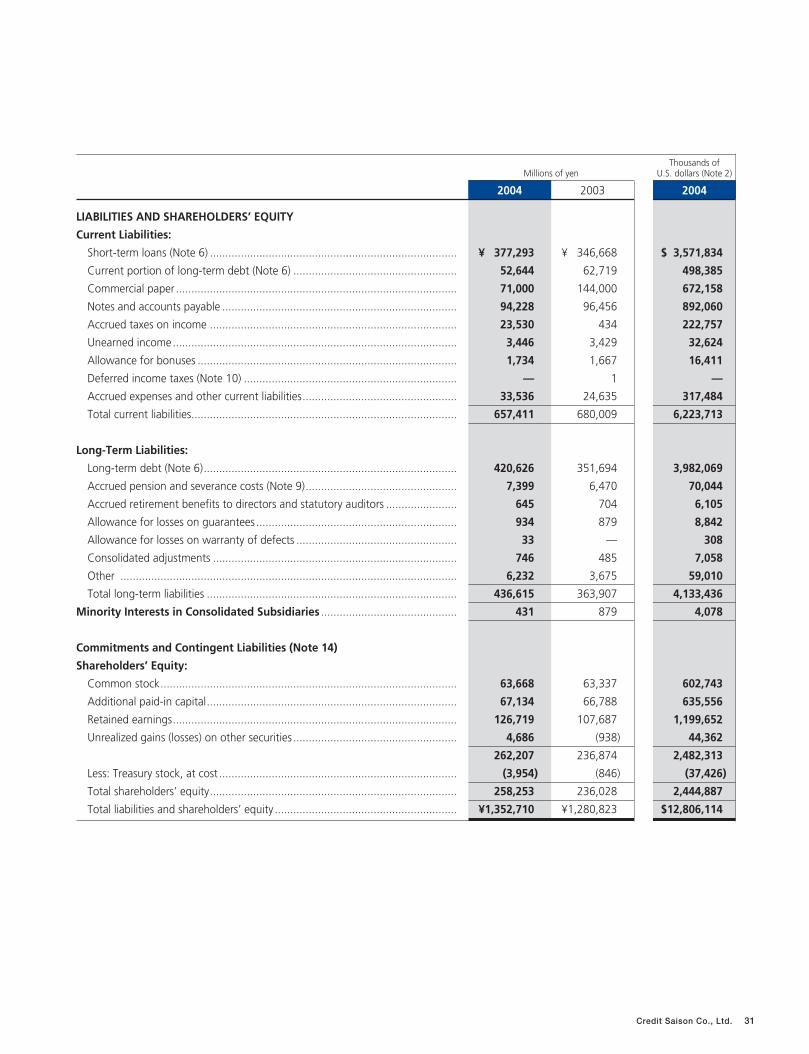
Credit Saison Co., Ltd. 31
Thousands ofMillions of yen U.S. dollars (Note 2)
2004 2003 2004
LIABILITIES AND SHAREHOLDERS’ EQUITY
Current Liabilities:
Short-term loans (Note 6) ................................................................................ ¥ 377,293 ¥ 346,668 $ 3,571,834
Current portion of long-term debt (Note 6) ..................................................... 52,644 62,719 498,385
Commercial paper ........................................................................................... 71,000 144,000 672,158
Notes and accounts payable ............................................................................ 94,228 96,456 892,060
Accrued taxes on income ................................................................................ 23,530 434 222,757
Unearned income............................................................................................ 3,446 3,429 32,624
Allowance for bonuses .................................................................................... 1,734 1,667 16,411
Deferred income taxes (Note 10) ..................................................................... — 1 —
Accrued expenses and other current liabilities.................................................. 33,536 24,635 317,484
Total current liabilities...................................................................................... 657,411 680,009 6,223,713
Long-Term Liabilities:
Long-term debt (Note 6).................................................................................. 420,626 351,694 3,982,069
Accrued pension and severance costs (Note 9)................................................. 7,399 6,470 70,044
Accrued retirement benefits to directors and statutory auditors ....................... 645 704 6,105
Allowance for losses on guarantees ................................................................. 934 879 8,842
Allowance for losses on warranty of defects .................................................... 33 — 308
Consolidated adjustments ............................................................................... 746 485 7,058
Other ............................................................................................................. 6,232 3,675 59,010
Total long-term liabilities ................................................................................. 436,615 363,907 4,133,436
Minority Interests in Consolidated Subsidiaries ............................................ 431 879 4,078
Commitments and Contingent Liabilities (Note 14)
Shareholders’ Equity:
Common stock................................................................................................ 63,668 63,337 602,743
Additional paid-in capital................................................................................. 67,134 66,788 635,556
Retained earnings............................................................................................ 126,719 107,687 1,199,652
Unrealized gains (losses) on other securities ..................................................... 4,686 (938) 44,362
................................................................................................................ 262,207 236,874 2,482,313
Less: Treasury stock, at cost ............................................................................. (3,954) (846) (37,426)
Total shareholders’ equity................................................................................ 258,253 236,028 2,444,887
Total liabilities and shareholders’ equity ........................................................... ¥1,352,710 ¥1,280,823 $12,806,114
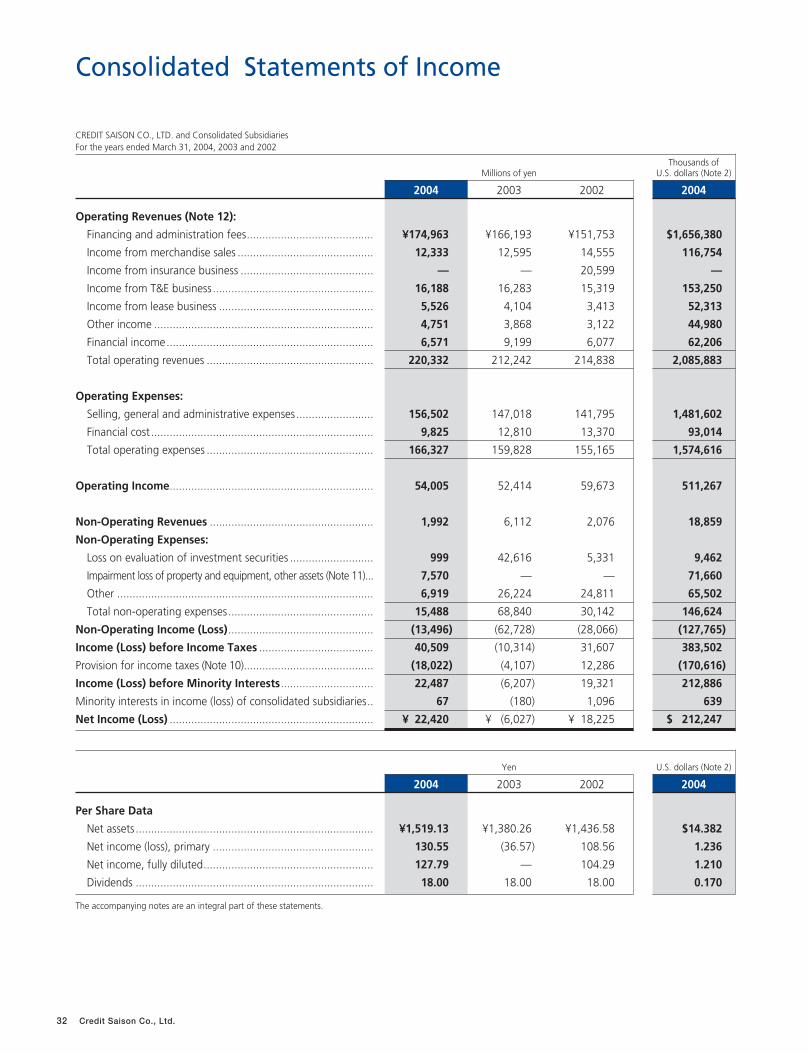
Consolidated Statements of Income
32 Credit Saison Co., Ltd.
CREDIT SAISON CO., LTD. and Consolidated Subsidiaries For the years ended March 31, 2004, 2003 and 2002
Thousands ofMillions of yen U.S. dollars (Note 2)
2004 2003 2002 2004
Operating Revenues (Note 12):
Financing and administration fees......................................... ¥174,963 ¥166,193 ¥151,753 $1,656,380
Income from merchandise sales ............................................ 12,333 12,595 14,555 116,754
Income from insurance business ........................................... — — 20,599 —
Income from T&E business.................................................... 16,188 16,283 15,319 153,250
Income from lease business .................................................. 5,526 4,104 3,413 52,313
Other income ....................................................................... 4,751 3,868 3,122 44,980
Financial income................................................................... 6,571 9,199 6,077 62,206
Total operating revenues ...................................................... 220,332 212,242 214,838 2,085,883
Operating Expenses:
Selling, general and administrative expenses......................... 156,502 147,018 141,795 1,481,602
Financial cost ........................................................................ 9,825 12,810 13,370 93,014
Total operating expenses ...................................................... 166,327 159,828 155,165 1,574,616
Operating Income.................................................................. 54,005 52,414 59,673 511,267
Non-Operating Revenues ..................................................... 1,992 6,112 2,076 18,859
Non-Operating Expenses:
Loss on evaluation of investment securities ........................... 999 42,616 5,331 9,462
Impairment loss of property and equipment, other assets (Note 11)... 7,570 — — 71,660
Other ................................................................................... 6,919 26,224 24,811 65,502
Total non-operating expenses............................................... 15,488 68,840 30,142 146,624
Non-Operating Income (Loss)............................................... (13,496) (62,728) (28,066) (127,765)
Income (Loss) before Income Taxes ..................................... 40,509 (10,314) 31,607 383,502
Provision for income taxes (Note 10).......................................... (18,022) (4,107) 12,286 (170,616)
Income (Loss) before Minority Interests.............................. 22,487 (6,207) 19,321 212,886
Minority interests in income (loss) of consolidated subsidiaries.. 67 (180) 1,096 639
Net Income (Loss) .................................................................. ¥ 22,420 ¥ (6,027) ¥ 18,225 $ 212,247
Yen U.S. dollars (Note 2)
2004 2003 2002 2004
Per Share Data
Net assets............................................................................. ¥1,519.13 ¥1,380.26 ¥1,436.58 $14.382
Net income (loss), primary .................................................... 130.55 (36.57) 108.56 1.236
Net income, fully diluted....................................................... 127.79 — 104.29 1.210
Dividends ............................................................................. 18.00 18.00 18.00 0.170
The accompanying notes are an integral part of these statements.
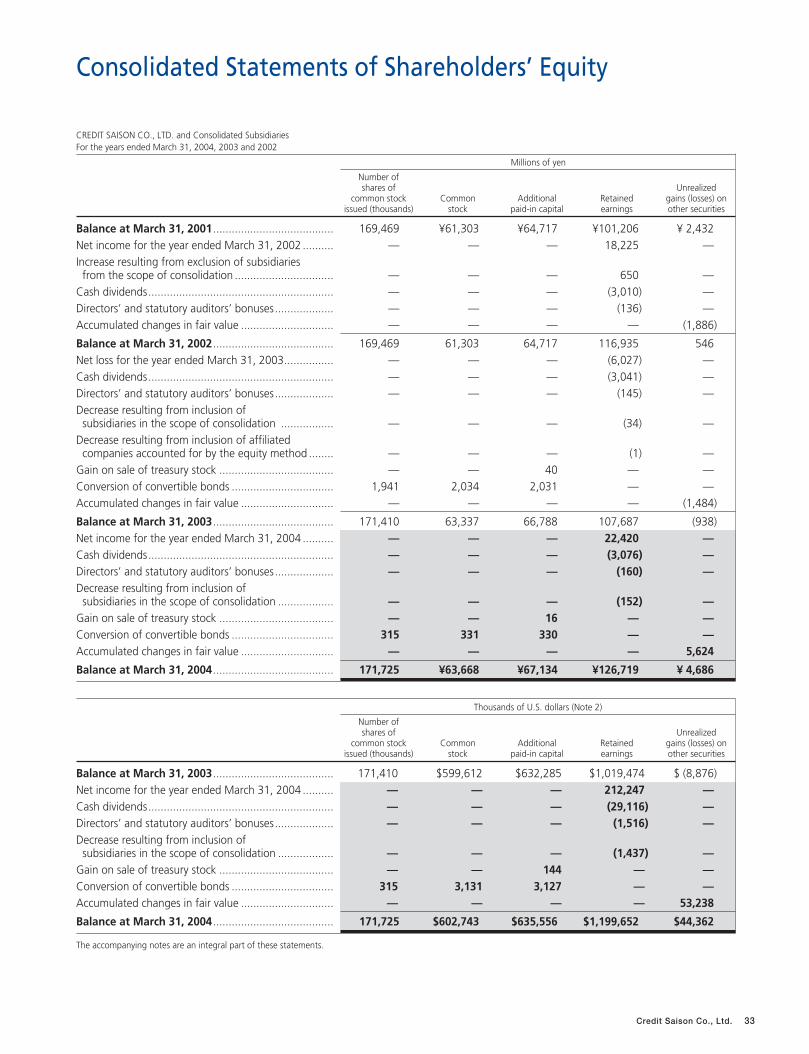
Consolidated Statements of Shareholders’ Equity
Credit Saison Co., Ltd. 33
CREDIT SAISON CO., LTD. and Consolidated SubsidiariesFor the years ended March 31, 2004, 2003 and 2002
Millions of yen
Number ofshares of Unrealized
common stock Common Additional Retained gains (losses) onissued (thousands) stock paid-in capital earnings other securities
Balance at March 31, 2001 ....................................... 169,469 ¥61,303 ¥64,717 ¥101,206 ¥ 2,432Net income for the year ended March 31, 2002 .......... — — — 18,225 —Increase resulting from exclusion of subsidiaries from the scope of consolidation ................................ — — — 650 —
Cash dividends............................................................ — — — (3,010) —Directors’ and statutory auditors’ bonuses................... — — — (136) —Accumulated changes in fair value .............................. — — — — (1,886)
Balance at March 31, 2002 ....................................... 169,469 61,303 64,717 116,935 546Net loss for the year ended March 31, 2003................ — — — (6,027) —Cash dividends............................................................ — — — (3,041) —Directors’ and statutory auditors’ bonuses................... — — — (145) —Decrease resulting from inclusion of subsidiaries in the scope of consolidation ................. — — — (34) —
Decrease resulting from inclusion of affiliatedcompanies accounted for by the equity method ........ — — — (1) —
Gain on sale of treasury stock ..................................... — — 40 — —Conversion of convertible bonds ................................. 1,941 2,034 2,031 — —Accumulated changes in fair value .............................. — — — — (1,484)
Balance at March 31, 2003 ....................................... 171,410 63,337 66,788 107,687 (938)Net income for the year ended March 31, 2004 .......... — — — 22,420 —Cash dividends............................................................ — — — (3,076) —Directors’ and statutory auditors’ bonuses................... — — — (160) —Decrease resulting from inclusion of subsidiaries in the scope of consolidation .................. — — — (152) —
Gain on sale of treasury stock ..................................... — — 16 — —Conversion of convertible bonds ................................. 315 331 330 — —Accumulated changes in fair value .............................. — — — — 5,624
Balance at March 31, 2004 ....................................... 171,725 ¥63,668 ¥67,134 ¥126,719 ¥ 4,686
Thousands of U.S. dollars (Note 2)
Number ofshares of Unrealized
common stock Common Additional Retained gains (losses) onissued (thousands) stock paid-in capital earnings other securities
Balance at March 31, 2003 ....................................... 171,410 $599,612 $632,285 $1,019,474 $ (8,876)Net income for the year ended March 31, 2004 .......... — — — 212,247 —Cash dividends............................................................ — — — (29,116) —Directors’ and statutory auditors’ bonuses................... — — — (1,516) —Decrease resulting from inclusion of subsidiaries in the scope of consolidation .................. — — — (1,437) —
Gain on sale of treasury stock ..................................... — — 144 — —Conversion of convertible bonds ................................. 315 3,131 3,127 — —Accumulated changes in fair value .............................. — — — — 53,238
Balance at March 31, 2004 ....................................... 171,725 $602,743 $635,556 $1,199,652 $44,362
The accompanying notes are an integral part of these statements.
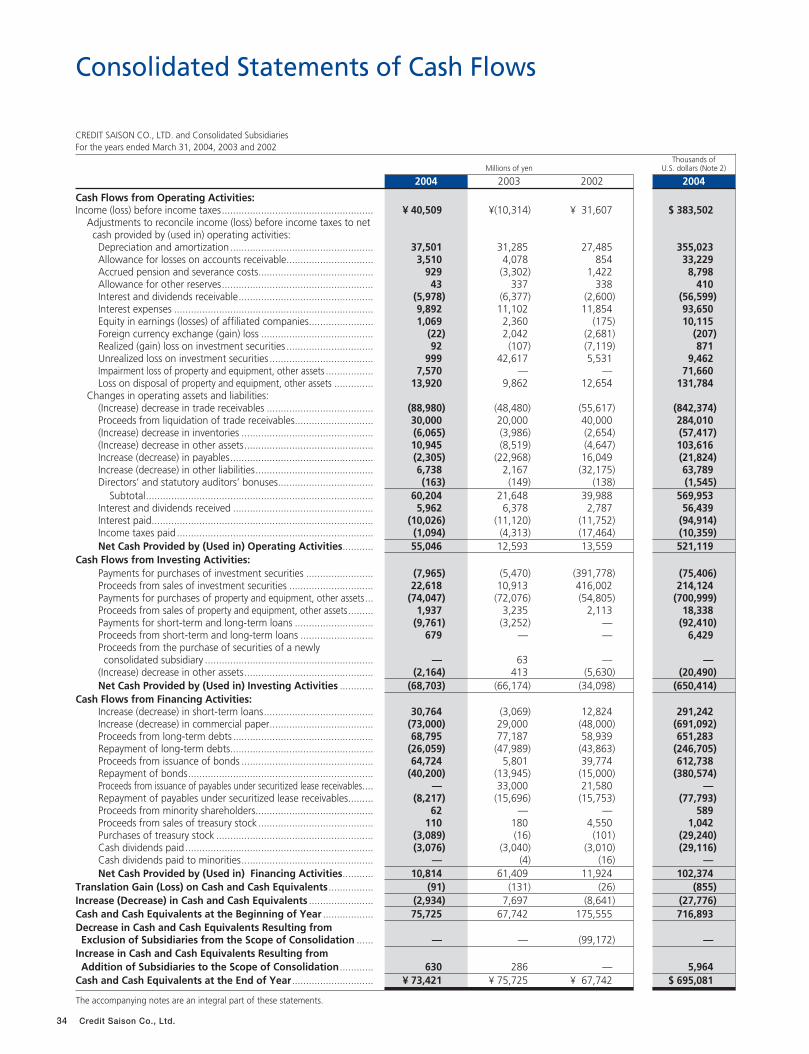
Consolidated Statements of Cash Flows
34 Credit Saison Co., Ltd.
CREDIT SAISON CO., LTD. and Consolidated SubsidiariesFor the years ended March 31, 2004, 2003 and 2002
Thousands ofMillions of yen U.S. dollars (Note 2)
2004 2003 2002 2004
Cash Flows from Operating Activities:Income (loss) before income taxes...................................................... ¥ 40,509 ¥(10,314) ¥ 31,607 $ 383,502
Adjustments to reconcile income (loss) before income taxes to net cash provided by (used in) operating activities:
Depreciation and amortization ................................................... 37,501 31,285 27,485 355,023Allowance for losses on accounts receivable............................... 3,510 4,078 854 33,229Accrued pension and severance costs......................................... 929 (3,302) 1,422 8,798Allowance for other reserves...................................................... 43 337 338 410Interest and dividends receivable................................................ (5,978) (6,377) (2,600) (56,599)Interest expenses ....................................................................... 9,892 11,102 11,854 93,650Equity in earnings (losses) of affiliated companies....................... 1,069 2,360 (175) 10,115Foreign currency exchange (gain) loss ........................................ (22) 2,042 (2,681) (207)Realized (gain) loss on investment securities ............................... 92 (107) (7,119) 871Unrealized loss on investment securities ..................................... 999 42,617 5,531 9,462Impairment loss of property and equipment, other assets ................. 7,570 — — 71,660Loss on disposal of property and equipment, other assets .............. 13,920 9,862 12,654 131,784
Changes in operating assets and liabilities:(Increase) decrease in trade receivables ...................................... (88,980) (48,480) (55,617) (842,374)Proceeds from liquidation of trade receivables............................ 30,000 20,000 40,000 284,010(Increase) decrease in inventories ............................................... (6,065) (3,986) (2,654) (57,417)(Increase) decrease in other assets.............................................. 10,945 (8,519) (4,647) 103,616Increase (decrease) in payables................................................... (2,305) (22,968) 16,049 (21,824)Increase (decrease) in other liabilities.......................................... 6,738 2,167 (32,175) 63,789Directors’ and statutory auditors’ bonuses.................................. (163) (149) (138) (1,545)
Subtotal................................................................................. 60,204 21,648 39,988 569,953Interest and dividends received .................................................. 5,962 6,378 2,787 56,439Interest paid............................................................................... (10,026) (11,120) (11,752) (94,914)Income taxes paid ...................................................................... (1,094) (4,313) (17,464) (10,359)Net Cash Provided by (Used in) Operating Activities........... 55,046 12,593 13,559 521,119
Cash Flows from Investing Activities:Payments for purchases of investment securities ........................ (7,965) (5,470) (391,778) (75,406)Proceeds from sales of investment securities .............................. 22,618 10,913 416,002 214,124Payments for purchases of property and equipment, other assets... (74,047) (72,076) (54,805) (700,999)Proceeds from sales of property and equipment, other assets......... 1,937 3,235 2,113 18,338Payments for short-term and long-term loans ............................ (9,761) (3,252) — (92,410)Proceeds from short-term and long-term loans .......................... 679 — — 6,429Proceeds from the purchase of securities of a newlyconsolidated subsidiary ............................................................ — 63 — —
(Increase) decrease in other assets.............................................. (2,164) 413 (5,630) (20,490)Net Cash Provided by (Used in) Investing Activities ............ (68,703) (66,174) (34,098) (650,414)
Cash Flows from Financing Activities:Increase (decrease) in short-term loans....................................... 30,764 (3,069) 12,824 291,242Increase (decrease) in commercial paper..................................... (73,000) 29,000 (48,000) (691,092)Proceeds from long-term debts .................................................. 68,795 77,187 58,939 651,283Repayment of long-term debts................................................... (26,059) (47,989) (43,863) (246,705)Proceeds from issuance of bonds ............................................... 64,724 5,801 39,774 612,738Repayment of bonds.................................................................. (40,200) (13,945) (15,000) (380,574)Proceeds from issuance of payables under securitized lease receivables.... — 33,000 21,580 —Repayment of payables under securitized lease receivables......... (8,217) (15,696) (15,753) (77,793)Proceeds from minority shareholders.......................................... 62 — — 589Proceeds from sales of treasury stock ......................................... 110 180 4,550 1,042Purchases of treasury stock ........................................................ (3,089) (16) (101) (29,240)Cash dividends paid ................................................................... (3,076) (3,040) (3,010) (29,116)Cash dividends paid to minorities............................................... — (4) (16) —Net Cash Provided by (Used in) Financing Activities........... 10,814 61,409 11,924 102,374
Translation Gain (Loss) on Cash and Cash Equivalents................ (91) (131) (26) (855)Increase (Decrease) in Cash and Cash Equivalents ....................... (2,934) 7,697 (8,641) (27,776)Cash and Cash Equivalents at the Beginning of Year .................. 75,725 67,742 175,555 716,893Decrease in Cash and Cash Equivalents Resulting fromExclusion of Subsidiaries from the Scope of Consolidation ...... — — (99,172) —
Increase in Cash and Cash Equivalents Resulting fromAddition of Subsidiaries to the Scope of Consolidation............ 630 286 — 5,964
Cash and Cash Equivalents at the End of Year............................. ¥ 73,421 ¥ 75,725 ¥ 67,742 $ 695,081
The accompanying notes are an integral part of these statements.
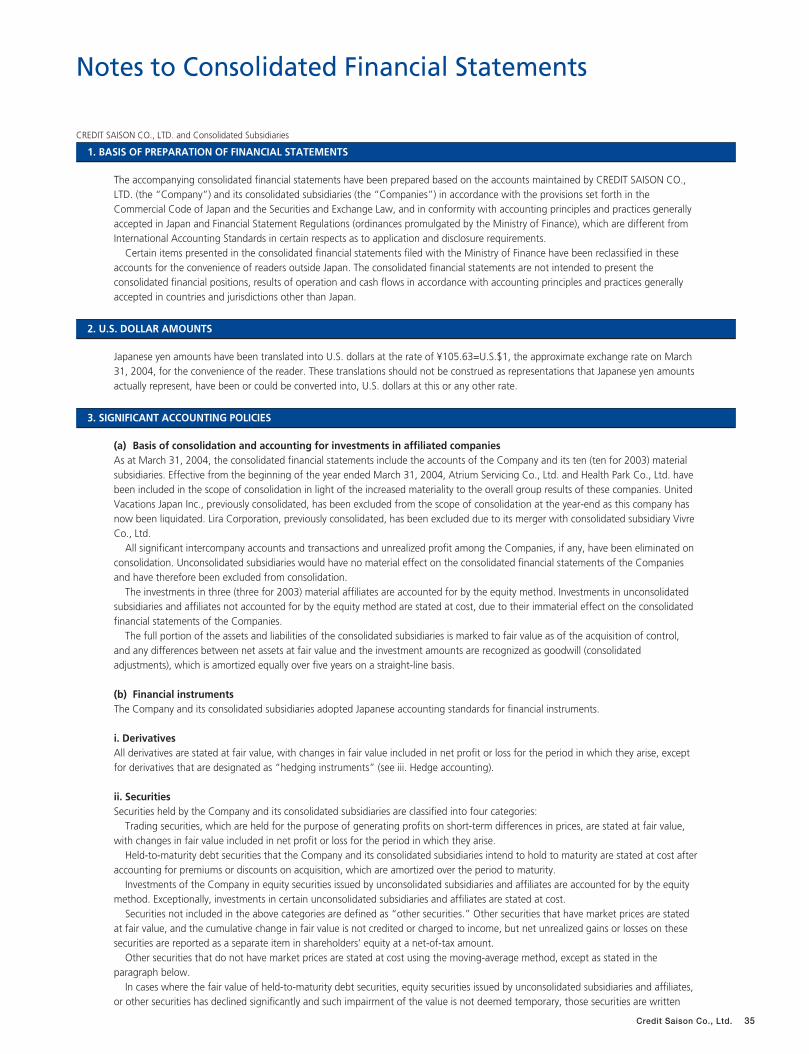
Notes to Consolidated Financial Statements
Credit Saison Co., Ltd. 35
CREDIT SAISON CO., LTD. and Consolidated Subsidiaries
1. BASIS OF PREPARATION OF FINANCIAL STATEMENTS
The accompanying consolidated financial statements have been prepared based on the accounts maintained by CREDIT SAISON CO.,LTD. (the “Company”) and its consolidated subsidiaries (the “Companies”) in accordance with the provisions set forth in theCommercial Code of Japan and the Securities and Exchange Law, and in conformity with accounting principles and practices generallyaccepted in Japan and Financial Statement Regulations (ordinances promulgated by the Ministry of Finance), which are different fromInternational Accounting Standards in certain respects as to application and disclosure requirements.
Certain items presented in the consolidated financial statements filed with the Ministry of Finance have been reclassified in theseaccounts for the convenience of readers outside Japan. The consolidated financial statements are not intended to present theconsolidated financial positions, results of operation and cash flows in accordance with accounting principles and practices generallyaccepted in countries and jurisdictions other than Japan.
2. U.S. DOLLAR AMOUNTS
Japanese yen amounts have been translated into U.S. dollars at the rate of ¥105.63=U.S.$1, the approximate exchange rate on March31, 2004, for the convenience of the reader. These translations should not be construed as representations that Japanese yen amountsactually represent, have been or could be converted into, U.S. dollars at this or any other rate.
3. SIGNIFICANT ACCOUNTING POLICIES
(a) Basis of consolidation and accounting for investments in affiliated companiesAs at March 31, 2004, the consolidated financial statements include the accounts of the Company and its ten (ten for 2003) materialsubsidiaries. Effective from the beginning of the year ended March 31, 2004, Atrium Servicing Co., Ltd. and Health Park Co., Ltd. havebeen included in the scope of consolidation in light of the increased materiality to the overall group results of these companies. UnitedVacations Japan Inc., previously consolidated, has been excluded from the scope of consolidation at the year-end as this company hasnow been liquidated. Lira Corporation, previously consolidated, has been excluded due to its merger with consolidated subsidiary VivreCo., Ltd.
All significant intercompany accounts and transactions and unrealized profit among the Companies, if any, have been eliminated onconsolidation. Unconsolidated subsidiaries would have no material effect on the consolidated financial statements of the Companiesand have therefore been excluded from consolidation.
The investments in three (three for 2003) material affiliates are accounted for by the equity method. Investments in unconsolidatedsubsidiaries and affiliates not accounted for by the equity method are stated at cost, due to their immaterial effect on the consolidatedfinancial statements of the Companies.
The full portion of the assets and liabilities of the consolidated subsidiaries is marked to fair value as of the acquisition of control,and any differences between net assets at fair value and the investment amounts are recognized as goodwill (consolidatedadjustments), which is amortized equally over five years on a straight-line basis.
(b) Financial instrumentsThe Company and its consolidated subsidiaries adopted Japanese accounting standards for financial instruments.
i. DerivativesAll derivatives are stated at fair value, with changes in fair value included in net profit or loss for the period in which they arise, exceptfor derivatives that are designated as “hedging instruments” (see iii. Hedge accounting).
ii. SecuritiesSecurities held by the Company and its consolidated subsidiaries are classified into four categories:
Trading securities, which are held for the purpose of generating profits on short-term differences in prices, are stated at fair value,with changes in fair value included in net profit or loss for the period in which they arise.
Held-to-maturity debt securities that the Company and its consolidated subsidiaries intend to hold to maturity are stated at cost afteraccounting for premiums or discounts on acquisition, which are amortized over the period to maturity.
Investments of the Company in equity securities issued by unconsolidated subsidiaries and affiliates are accounted for by the equitymethod. Exceptionally, investments in certain unconsolidated subsidiaries and affiliates are stated at cost.
Securities not included in the above categories are defined as “other securities.” Other securities that have market prices are statedat fair value, and the cumulative change in fair value is not credited or charged to income, but net unrealized gains or losses on thesesecurities are reported as a separate item in shareholders’ equity at a net-of-tax amount.
Other securities that do not have market prices are stated at cost using the moving-average method, except as stated in theparagraph below.
In cases where the fair value of held-to-maturity debt securities, equity securities issued by unconsolidated subsidiaries and affiliates,or other securities has declined significantly and such impairment of the value is not deemed temporary, those securities are written
36 Credit Saison Co., Ltd.
down to fair value, and the resulting loss is included in net profit or loss for the period.All other securities are presented as “non-current.”
iii. Hedge accounting The derivatives designed as hedging instruments by the Company are principally interest rate swaps and currency swaps. The related
hedged items are bank loans and debt securities issued by the Company.The Company has a policy to utilize the above hedging instruments to reduce the Company’s exposure to the risk of interest rate
fluctuation and foreign currency exchange rate fluctuation. Thus, the Company’s purchases of the hedging instruments are limited to,at maximum, the amounts of the hedged items.
Interest rate swap contracts are used as a hedge and meet certain hedging requirements. The amount to be paid or received underthe interest rate swap contract is added to or deducted from the interest on the assets or liabilities for which the swap contract wasexecuted.
The Company evaluates the effectiveness of its hedging activities by reference to the accumulated gain or loss on the hedginginstruments and the related hedged items from the commencement of the hedges.
(c) InventoriesMerchandise is stated at cost determined principally by the specific identification method.
Supplies are stated at cost determined principally by the latest purchase cost method.
(d) Depreciation of property and equipment Depreciation of property and equipment is computed principally by the straight-line method over the estimated useful lives of theassets, except for equipment for lease, which is depreciated over the lease term.
Buildings on leased land subject to limited-term lease agreements for business purposes are required to be demolished and the landrequired to be returned as vacant lots upon the expiration of terms under the lease agreements. Accordingly, effective from the yearended March 31, 2003, the Company changed the useful life of said buildings from that prescribed by the tax laws of Japan to thatprescribed by the said agreements. As a result, depreciation expenses for the year ended March 31, 2003, increased by the ¥523million, resulting in a decrease of ¥75 million in operating income and an increase ¥523 million in a loss before income taxes, ascompared with the amounts in which a loss would have been reported if the same useful lives had been applied consistently. Resultanteffects on segment information are described in the relevant sections of this report.
(e) Leased properties Finance leases are accounted for as operating leases, except where the lease is deemed to transfer ownership of the leased property tothe lessee at the end of lease term.
(f) Allowance for losses on accounts receivables Receivables are classified into four risk categories: bankrupt, doubtful, substandard and normal.
The Companies individually provide a specific reserve for bankrupt and doubtful receivables based on the fair value of any underlyingcollateral.
The Companies provide collectively a general reserve for substandard and normal receivables, applying a ratio determined based onthe Companies’ loan loss experience.
(g) Allowance for losses on guaranteesAllowance for losses on guarantees is provided for potential losses arising from the Companies’ guarantee obligations of customers’liabilities (personal loans to individuals from the banks with which the Companies have guarantee service arrangements).
The allowance is provided at an amount determined by applying the ratio of the Company’s loss experience to the balance ofguarantees outstanding at each year-end.
(h) Allowance for losses on warranty of defectsAllowance for losses on warranty of defects is provided for the potential repair costs on sold real estate (detached houses and store-combined houses) due to the Companies‘ warranty of defects. The allowance is provided at the amount estimated based on the pastexperience of repair costs.
( j ) Allowance for bonuses The Company records the amount that it expects to pay for employee bonuses for the year in the allowance for bonuses.
(k) Accrued pension and severance costsThe Companies have funded contributory pension plans which provide for a lump-sum payment or pension payments for life after theage of 60, at the option of retiring employees with at least 20 years of participation in the plan. Those employees retiring with morethan 5 years but less than 20 years of participation are entitled to a lump-sum payment.
Credit Saison Co., Ltd. 37
Unfunded past service cost and actuarial differences of the plans are being amortized over a period of nine to eleven years for thefiscal years ended March 31, 2004 and 2003 (four to eleven years for the fiscal year ended March 31, 2002), within the averageremaining service period at the time of occurrence. Amortization of unfunded past service cost and amortization of actuarialdifferences start from occurrence and from the following fiscal year, respectively.
( l ) Accrued retirement benefits to directors and statutory auditors Directors and statutory auditors customarily receive lump-sum payments upon termination of services, subject to shareholders’ approval.
The Companies provide for retirement allowances in an amount equal to the total benefits calculated based on the unfundedretirement plan for the directors and statutory auditors.
(m) Income taxes The Company adopted deferred tax accounting in conformity with Japanese accounting standards. As required by the standards,deferred tax assets and liabilities are recorded based on the temporary differences between the financial statements and the tax basesof assets and liabilities.
(n) Appropriation of retained earnings Cash dividends and bonuses to directors and statutory auditors are recorded in the financial year that a proposed appropriation ofretained earnings is approved by the General Meeting of Shareholders of the Company.
(o) Changes in presentation of loss on disposal of property and equipment, other assetsFormerly, loss on disposal of casino machines held by the consolidated subsidiary operating T&E business was included in non-operating expenses in the consolidated statements of income. Considering recent frequent occurrence of replacement of the machines,the loss is included in selling, general and administrative expenses in the consolidated statements of income, effective from the yearended March 31, 2004. As a result, operating income decreased by ¥1,865 million (US$17,658 thousand) for the year ended March31, 2004, but had no effect on income before income taxes.
(p) Impairment loss of property and equipment, other assetsEffective from the year ended March 31, 2004, the Companies adopted “Accounting Standard for Impairment of Fixed Assets.” Thestandard requires that fixed assets be reviewed for impairment whenever events or changes in circumstances indicate material changein the carrying amount of an asset. Impairment loss on property and equipment and other assets amounted to ¥7,570 million(US$71,660 thousand) for the year ended March 31, 2004 and was recorded as a non-operating expense.
(q) Treasury stock and reversal of capital and legal reservesEffective from the year ended March 31, 2003, the Companies adopted the Statement of Financial Accounting Standard No. 1,“Accounting for Treasury Stock and Reversal of Capital and Legal Reserves,” issued by the Accounting Standards Board of Japan.However, the effect on net losses for the year of adopting this new statement was immaterial.
In accordance with the revisions to the regulations concerning consolidated financial statements, shareholders’ equity and theconsolidated statements of shareholders’ equity for the 2003 and 2004 consolidated financial years were prepared pursuant to therevised regulations. As a result, the portion corresponding to the parent company’s interest (422,047 shares, ¥636 million) of thetreasury stock held by subsidiaries (537,640 shares, ¥810 million), which was deducted from shareholders’ equity in the 2002consolidated financial year, is included in treasury stock and deducted from shareholders’ equity, and the portion corresponding tominority shareholders’ interest (115,593 shares, ¥174 million) of the same is deducted from minority shareholders’ interest, bothfrom 2003.
The portion corresponding to the reporting company’s interest (90,453 shares, ¥189 million) of its stock held by the companiesaccounted for by the equity method (190,950 shares, ¥401 million at the end of 2003) is included in treasury stock and deducted fromshareholders’ equity.
(r) Net income per shareEffective from the year ended March 31, 2003, the Company adopted the Statement of Financial Accounting Standard No. 2,“Earnings per Share,” issued by the Accounting Standards Board of Japan. Prior to adopting the new statement, net income (loss) pershare was calculated based on the net income (loss) shown on the consolidated statements of income. The net income (loss) per sharecalculation, therefore, excluded bonuses to directors and statutory auditors, since under the Japanese Commercial Code, these wererecognized as an appropriation of retained earnings in the consolidated statements of shareholders’ equity, rather than as expenses inthe consolidated statements of income. However, the new statement requires that net income (loss) should be adjusted by deductingbonuses paid to directors and statutory auditors as well as the payment of dividends to shareholders of preferred stocks to berecognized as an appropriation of retained earnings, from net income shown in the consolidated statements of income, and thecalculation of net income (loss) per share be made on that adjusted net income (loss) basis. Net loss per share for the year ended March31, 2003, calculated using the previous method and under the new statement is ¥36.65 and ¥36.57, respectively.
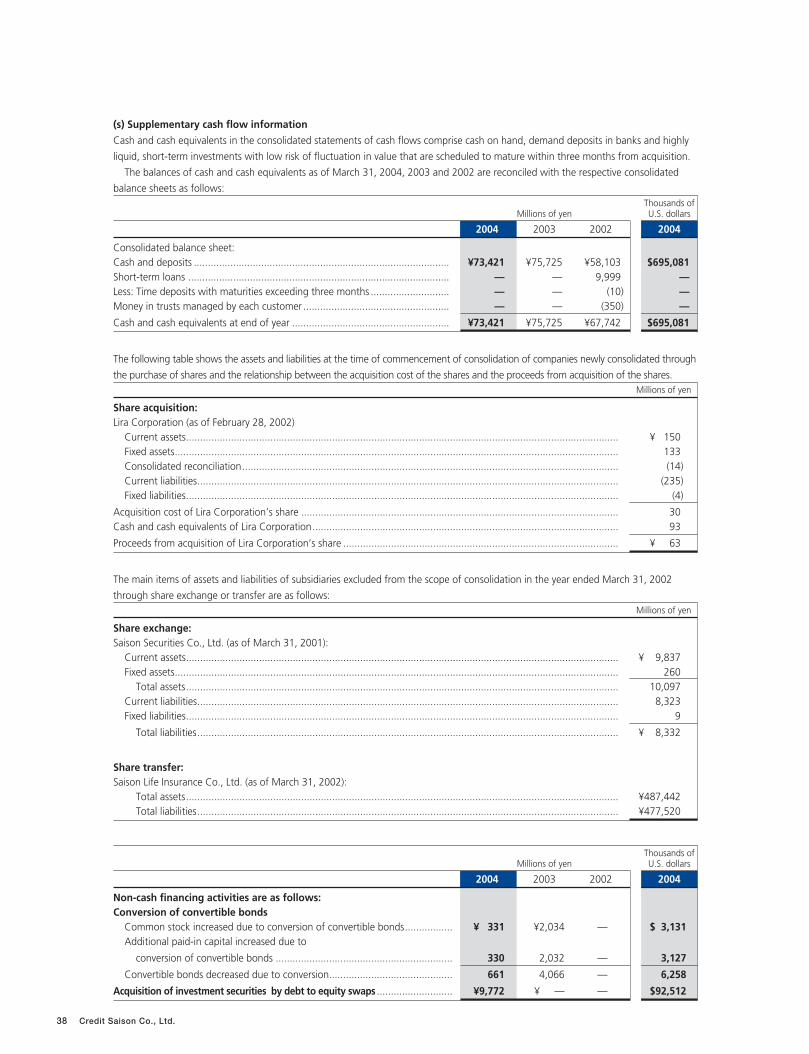
38 Credit Saison Co., Ltd.
(s) Supplementary cash flow information
Cash and cash equivalents in the consolidated statements of cash flows comprise cash on hand, demand deposits in banks and highly
liquid, short-term investments with low risk of fluctuation in value that are scheduled to mature within three months from acquisition.
The balances of cash and cash equivalents as of March 31, 2004, 2003 and 2002 are reconciled with the respective consolidated
balance sheets as follows:Thousands of
Millions of yen U.S. dollars
2004 2003 2002 2004
Consolidated balance sheet:Cash and deposits ........................................................................................... ¥73,421 ¥75,725 ¥58,103 $695,081Short-term loans ............................................................................................. — — 9,999 —Less: Time deposits with maturities exceeding three months ............................ — — (10) —Money in trusts managed by each customer .................................................... — — (350) —
Cash and cash equivalents at end of year ........................................................ ¥73,421 ¥75,725 ¥67,742 $695,081
The following table shows the assets and liabilities at the time of commencement of consolidation of companies newly consolidated through
the purchase of shares and the relationship between the acquisition cost of the shares and the proceeds from acquisition of the shares.Millions of yen
Share acquisition:Lira Corporation (as of February 28, 2002)
Current assets.......................................................................................................................................................... ¥ 150 Fixed assets.............................................................................................................................................................. 133 Consolidated reconciliation...................................................................................................................................... (14)Current liabilities...................................................................................................................................................... (235)Fixed liabilities.......................................................................................................................................................... (4)
Acquisition cost of Lira Corporation’s share ................................................................................................................. 30Cash and cash equivalents of Lira Corporation............................................................................................................. 93
Proceeds from acquisition of Lira Corporation’s share .................................................................................................. ¥ 63
The main items of assets and liabilities of subsidiaries excluded from the scope of consolidation in the year ended March 31, 2002
through share exchange or transfer are as follows:Millions of yen
Share exchange:Saison Securities Co., Ltd. (as of March 31, 2001):
Current assets.......................................................................................................................................................... ¥ 9,837Fixed assets.............................................................................................................................................................. 260
Total assets.......................................................................................................................................................... 10,097Current liabilities...................................................................................................................................................... 8,323Fixed liabilities.......................................................................................................................................................... 9
Total liabilities...................................................................................................................................................... ¥ 8,332
Share transfer:Saison Life Insurance Co., Ltd. (as of March 31, 2002):
Total assets.......................................................................................................................................................... ¥487,442Total liabilities...................................................................................................................................................... ¥477,520
Thousands of Millions of yen U.S. dollars
2004 2003 2002 2004
Non-cash financing activities are as follows:Conversion of convertible bonds
Common stock increased due to conversion of convertible bonds................. ¥ 331 ¥2,034 — $ 3,131Additional paid-in capital increased due to
conversion of convertible bonds ............................................................... 330 2,032 — 3,127
Convertible bonds decreased due to conversion............................................ 661 4,066 — 6,258
Acquisition of investment securities by debt to equity swaps ........................... ¥9,772 ¥ — — $92,512
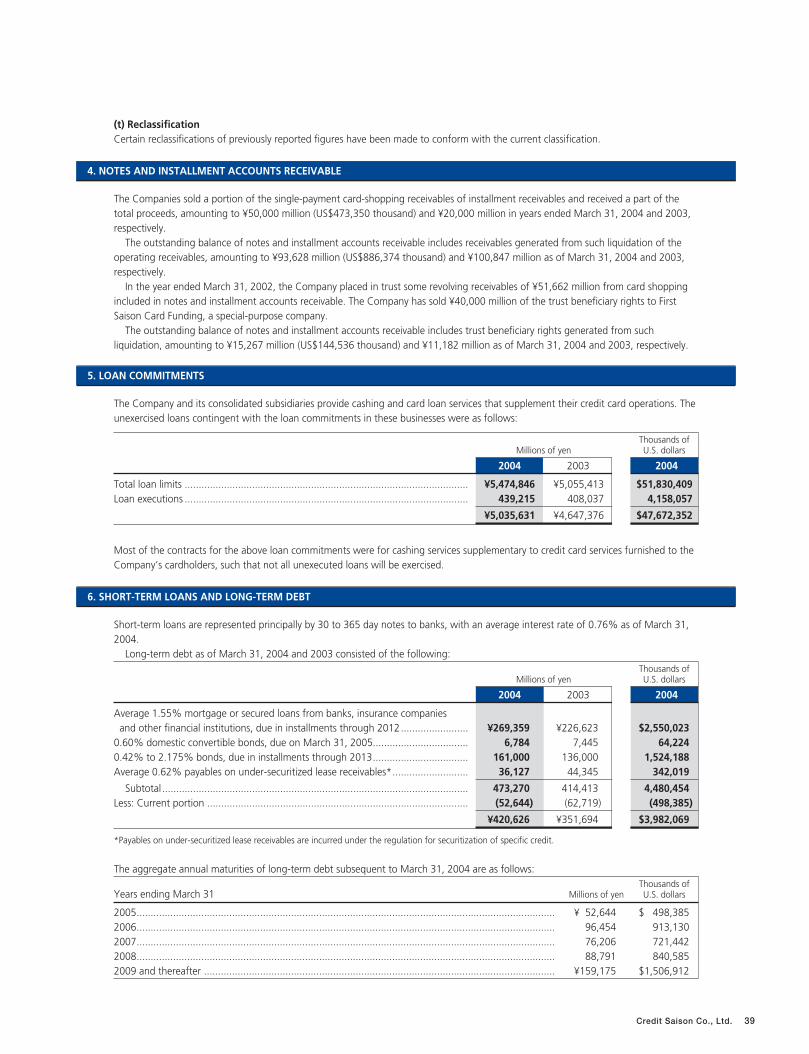
(t) ReclassificationCertain reclassifications of previously reported figures have been made to conform with the current classification.
4. NOTES AND INSTALLMENT ACCOUNTS RECEIVABLE
The Companies sold a portion of the single-payment card-shopping receivables of installment receivables and received a part of thetotal proceeds, amounting to ¥50,000 million (US$473,350 thousand) and ¥20,000 million in years ended March 31, 2004 and 2003,respectively.
The outstanding balance of notes and installment accounts receivable includes receivables generated from such liquidation of theoperating receivables, amounting to ¥93,628 million (US$886,374 thousand) and ¥100,847 million as of March 31, 2004 and 2003,respectively.
In the year ended March 31, 2002, the Company placed in trust some revolving receivables of ¥51,662 million from card shoppingincluded in notes and installment accounts receivable. The Company has sold ¥40,000 million of the trust beneficiary rights to FirstSaison Card Funding, a special-purpose company.
The outstanding balance of notes and installment accounts receivable includes trust beneficiary rights generated from suchliquidation, amounting to ¥15,267 million (US$144,536 thousand) and ¥11,182 million as of March 31, 2004 and 2003, respectively.
5. LOAN COMMITMENTS
The Company and its consolidated subsidiaries provide cashing and card loan services that supplement their credit card operations. Theunexercised loans contingent with the loan commitments in these businesses were as follows:
Thousands of Millions of yen U.S. dollars
2004 2003 2004
Total loan limits ..................................................................................................... ¥5,474,846 ¥5,055,413 $51,830,409Loan executions ..................................................................................................... 439,215 408,037 4,158,057
...................................................................................................................... ¥5,035,631 ¥4,647,376 $47,672,352
Most of the contracts for the above loan commitments were for cashing services supplementary to credit card services furnished to theCompany’s cardholders, such that not all unexecuted loans will be exercised.
6. SHORT-TERM LOANS AND LONG-TERM DEBT
Short-term loans are represented principally by 30 to 365 day notes to banks, with an average interest rate of 0.76% as of March 31,2004.
Long-term debt as of March 31, 2004 and 2003 consisted of the following:Thousands of
Millions of yen U.S. dollars
2004 2003 2004
Average 1.55% mortgage or secured loans from banks, insurance companies and other financial institutions, due in installments through 2012........................ ¥269,359 ¥226,623 $2,550,023
0.60% domestic convertible bonds, due on March 31, 2005.................................. 6,784 7,445 64,2240.42% to 2.175% bonds, due in installments through 2013.................................. 161,000 136,000 1,524,188Average 0.62% payables on under-securitized lease receivables*........................... 36,127 44,345 342,019
Subtotal ............................................................................................................. 473,270 414,413 4,480,454Less: Current portion ............................................................................................. (52,644) (62,719) (498,385)
...................................................................................................................... ¥420,626 ¥351,694 $3,982,069
*Payables on under-securitized lease receivables are incurred under the regulation for securitization of specific credit.
The aggregate annual maturities of long-term debt subsequent to March 31, 2004 are as follows:Thousands of
Years ending March 31 Millions of yen U.S. dollars
2005..................................................................................................................................................... ¥ 52,644 $ 498,3852006..................................................................................................................................................... 96,454 913,1302007..................................................................................................................................................... 76,206 721,4422008..................................................................................................................................................... 88,791 840,5852009 and thereafter ............................................................................................................................. ¥159,175 $1,506,912
Credit Saison Co., Ltd. 39
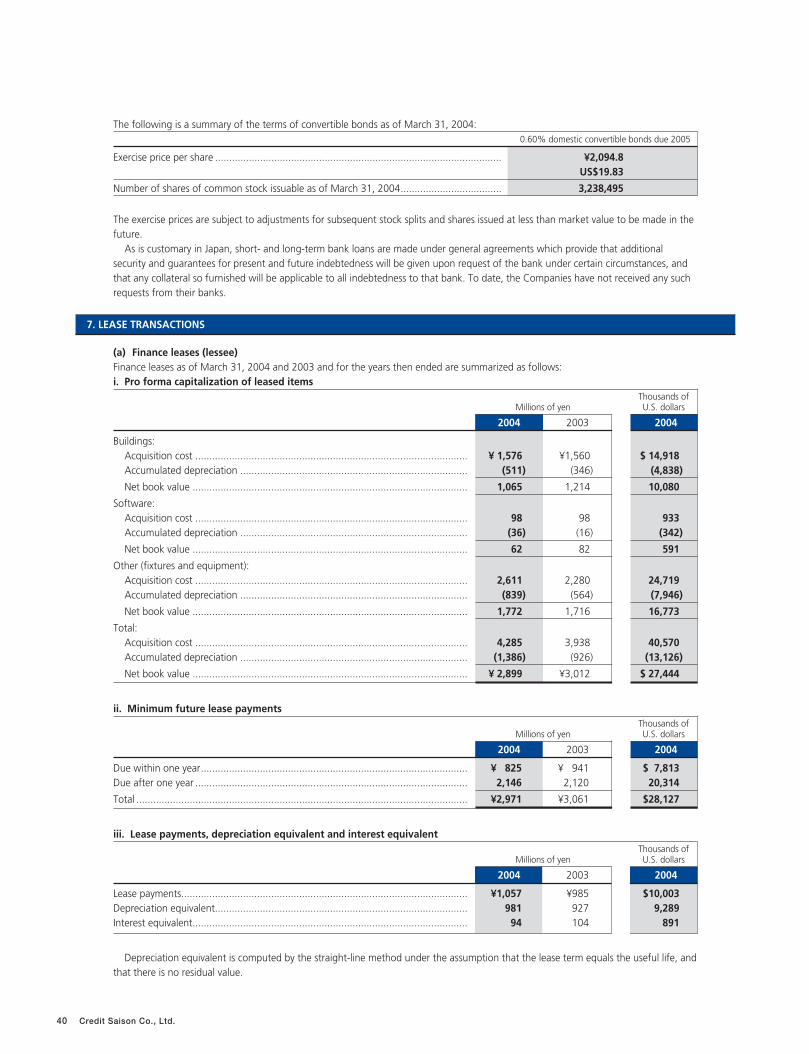
40 Credit Saison Co., Ltd.
The following is a summary of the terms of convertible bonds as of March 31, 2004:0.60% domestic convertible bonds due 2005
Exercise price per share ...................................................................................................... ¥2,094.8.................................................................................................................................. US$19.83
Number of shares of common stock issuable as of March 31, 2004.................................... 3,238,495
The exercise prices are subject to adjustments for subsequent stock splits and shares issued at less than market value to be made in thefuture.
As is customary in Japan, short- and long-term bank loans are made under general agreements which provide that additionalsecurity and guarantees for present and future indebtedness will be given upon request of the bank under certain circumstances, andthat any collateral so furnished will be applicable to all indebtedness to that bank. To date, the Companies have not received any suchrequests from their banks.
7. LEASE TRANSACTIONS
(a) Finance leases (lessee)Finance leases as of March 31, 2004 and 2003 and for the years then ended are summarized as follows:i. Pro forma capitalization of leased items
Thousands of Millions of yen U.S. dollars
2004 2003 2004
Buildings:Acquisition cost ................................................................................................. ¥ 1,576 ¥1,560 $ 14,918Accumulated depreciation ................................................................................. (511) (346) (4,838)
Net book value .................................................................................................. 1,065 1,214 10,080
Software:Acquisition cost ................................................................................................. 98 98 933Accumulated depreciation ................................................................................. (36) (16) (342)
Net book value .................................................................................................. 62 82 591
Other (fixtures and equipment):Acquisition cost ................................................................................................. 2,611 2,280 24,719Accumulated depreciation ................................................................................. (839) (564) (7,946)
Net book value .................................................................................................. 1,772 1,716 16,773
Total:Acquisition cost ................................................................................................. 4,285 3,938 40,570Accumulated depreciation ................................................................................. (1,386) (926) (13,126)
Net book value .................................................................................................. ¥ 2,899 ¥3,012 $ 27,444
ii. Minimum future lease paymentsThousands of
Millions of yen U.S. dollars
2004 2003 2004
Due within one year............................................................................................... ¥ 825 ¥ 941 $ 7,813Due after one year ................................................................................................. 2,146 2,120 20,314
Total ...................................................................................................................... ¥2,971 ¥3,061 $28,127
iii. Lease payments, depreciation equivalent and interest equivalentThousands of
Millions of yen U.S. dollars
2004 2003 2004
Lease payments...................................................................................................... ¥1,057 ¥985 $10,003Depreciation equivalent.......................................................................................... 981 927 9,289Interest equivalent.................................................................................................. 94 104 891
Depreciation equivalent is computed by the straight-line method under the assumption that the lease term equals the useful life, andthat there is no residual value.
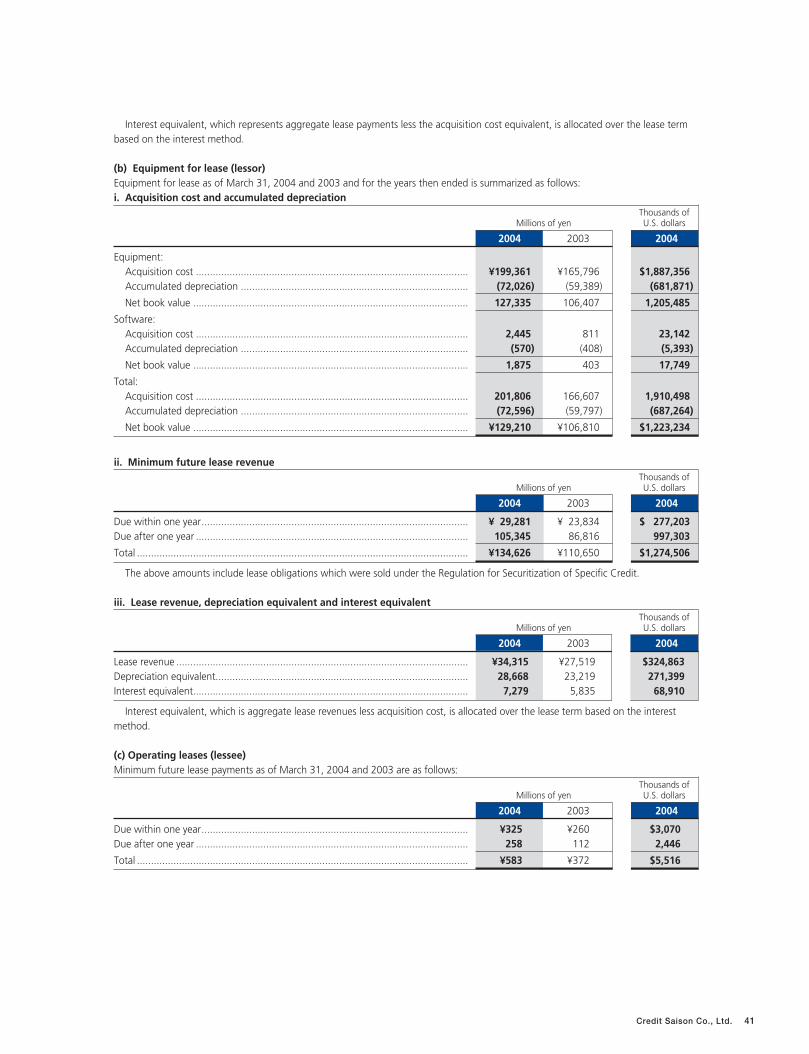
Interest equivalent, which represents aggregate lease payments less the acquisition cost equivalent, is allocated over the lease termbased on the interest method.
(b) Equipment for lease (lessor)Equipment for lease as of March 31, 2004 and 2003 and for the years then ended is summarized as follows:i. Acquisition cost and accumulated depreciation
Thousands of Millions of yen U.S. dollars
2004 2003 2004
Equipment:Acquisition cost ................................................................................................. ¥199,361 ¥165,796 $1,887,356Accumulated depreciation ................................................................................. (72,026) (59,389) (681,871)
Net book value .................................................................................................. 127,335 106,407 1,205,485
Software:Acquisition cost ................................................................................................. 2,445 811 23,142Accumulated depreciation ................................................................................. (570) (408) (5,393)
Net book value .................................................................................................. 1,875 403 17,749
Total:Acquisition cost ................................................................................................. 201,806 166,607 1,910,498Accumulated depreciation ................................................................................. (72,596) (59,797) (687,264)
Net book value .................................................................................................. ¥129,210 ¥106,810 $1,223,234
ii. Minimum future lease revenueThousands of
Millions of yen U.S. dollars
2004 2003 2004
Due within one year............................................................................................... ¥ 29,281 ¥ 23,834 $ 277,203Due after one year ................................................................................................. 105,345 86,816 997,303
Total ...................................................................................................................... ¥134,626 ¥110,650 $1,274,506
The above amounts include lease obligations which were sold under the Regulation for Securitization of Specific Credit.
iii. Lease revenue, depreciation equivalent and interest equivalentThousands of
Millions of yen U.S. dollars
2004 2003 2004
Lease revenue ........................................................................................................ ¥34,315 ¥27,519 $324,863Depreciation equivalent.......................................................................................... 28,668 23,219 271,399Interest equivalent.................................................................................................. 7,279 5,835 68,910
Interest equivalent, which is aggregate lease revenues less acquisition cost, is allocated over the lease term based on the interestmethod.
(c) Operating leases (lessee)Minimum future lease payments as of March 31, 2004 and 2003 are as follows:
Thousands of Millions of yen U.S. dollars
2004 2003 2004
Due within one year............................................................................................... ¥325 ¥260 $3,070Due after one year ................................................................................................. 258 112 2,446
Total ...................................................................................................................... ¥583 ¥372 $5,516
Credit Saison Co., Ltd. 41
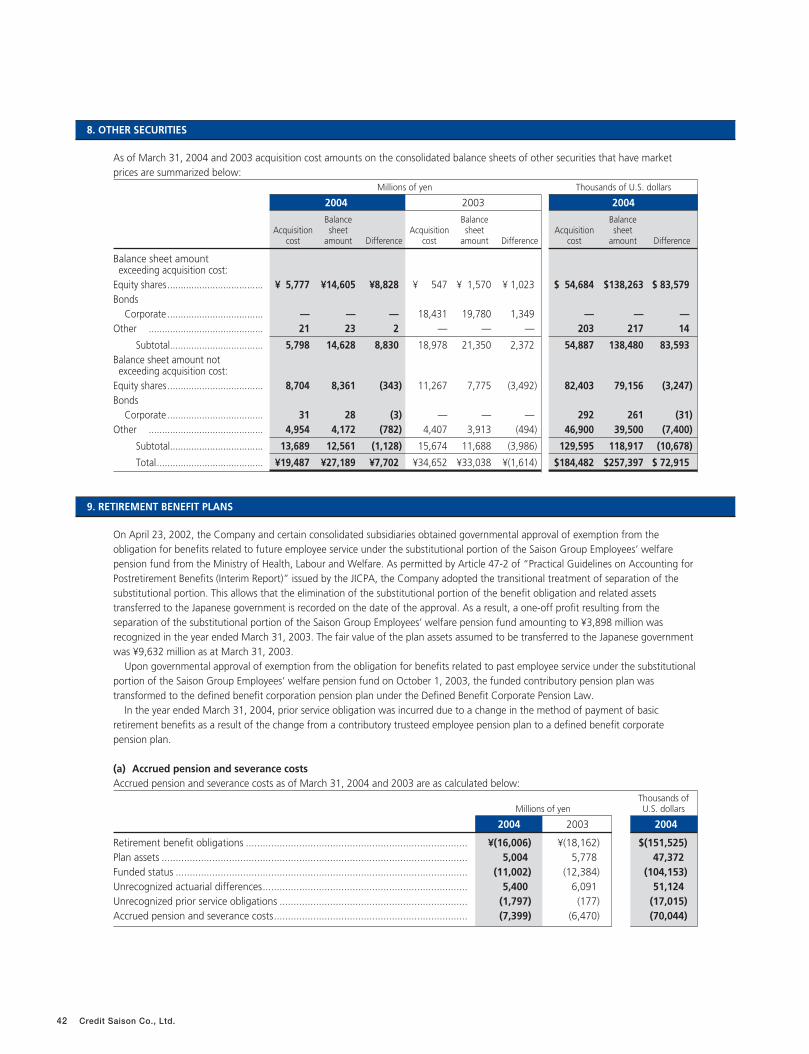
42 Credit Saison Co., Ltd.
8. OTHER SECURITIES
As of March 31, 2004 and 2003 acquisition cost amounts on the consolidated balance sheets of other securities that have marketprices are summarized below:
Millions of yen Thousands of U.S. dollars
2004 2003 2004
Balance Balance BalanceAcquisition sheet Acquisition sheet Acquisition sheet
cost amount Difference cost amount Difference cost amount Difference
Balance sheet amountexceeding acquisition cost:
Equity shares.................................... ¥ 5,777 ¥14,605 ¥8,828 ¥ 547 ¥ 1,570 ¥ 1,023 $ 54,684 $138,263 $ 83,579Bonds
Corporate .................................... — — — 18,431 19,780 1,349 — — —Other ........................................... 21 23 2 — — — 203 217 14
Subtotal................................... 5,798 14,628 8,830 18,978 21,350 2,372 54,887 138,480 83,593Balance sheet amount not exceeding acquisition cost:
Equity shares.................................... 8,704 8,361 (343) 11,267 7,775 (3,492) 82,403 79,156 (3,247)Bonds
Corporate .................................... 31 28 (3) — — — 292 261 (31)Other ........................................... 4,954 4,172 (782) 4,407 3,913 (494) 46,900 39,500 (7,400)
Subtotal................................... 13,689 12,561 (1,128) 15,674 11,688 (3,986) 129,595 118,917 (10,678)
Total........................................ ¥19,487 ¥27,189 ¥7,702 ¥34,652 ¥33,038 ¥(1,614) $184,482 $257,397 $ 72,915
9. RETIREMENT BENEFIT PLANS
On April 23, 2002, the Company and certain consolidated subsidiaries obtained governmental approval of exemption from theobligation for benefits related to future employee service under the substitutional portion of the Saison Group Employees’ welfarepension fund from the Ministry of Health, Labour and Welfare. As permitted by Article 47-2 of “Practical Guidelines on Accounting forPostretirement Benefits (Interim Report)” issued by the JICPA, the Company adopted the transitional treatment of separation of thesubstitutional portion. This allows that the elimination of the substitutional portion of the benefit obligation and related assetstransferred to the Japanese government is recorded on the date of the approval. As a result, a one-off profit resulting from theseparation of the substitutional portion of the Saison Group Employees’ welfare pension fund amounting to ¥3,898 million wasrecognized in the year ended March 31, 2003. The fair value of the plan assets assumed to be transferred to the Japanese governmentwas ¥9,632 million as at March 31, 2003.
Upon governmental approval of exemption from the obligation for benefits related to past employee service under the substitutionalportion of the Saison Group Employees’ welfare pension fund on October 1, 2003, the funded contributory pension plan wastransformed to the defined benefit corporation pension plan under the Defined Benefit Corporate Pension Law.
In the year ended March 31, 2004, prior service obligation was incurred due to a change in the method of payment of basicretirement benefits as a result of the change from a contributory trusteed employee pension plan to a defined benefit corporatepension plan.
(a) Accrued pension and severance costsAccrued pension and severance costs as of March 31, 2004 and 2003 are as calculated below:
Thousands of Millions of yen U.S. dollars
2004 2003 2004
Retirement benefit obligations ............................................................................... ¥(16,006) ¥(18,162) $(151,525)Plan assets ............................................................................................................. 5,004 5,778 47,372Funded status ........................................................................................................ (11,002) (12,384) (104,153)Unrecognized actuarial differences......................................................................... 5,400 6,091 51,124Unrecognized prior service obligations ................................................................... (1,797) (177) (17,015)Accrued pension and severance costs..................................................................... (7,399) (6,470) (70,044)
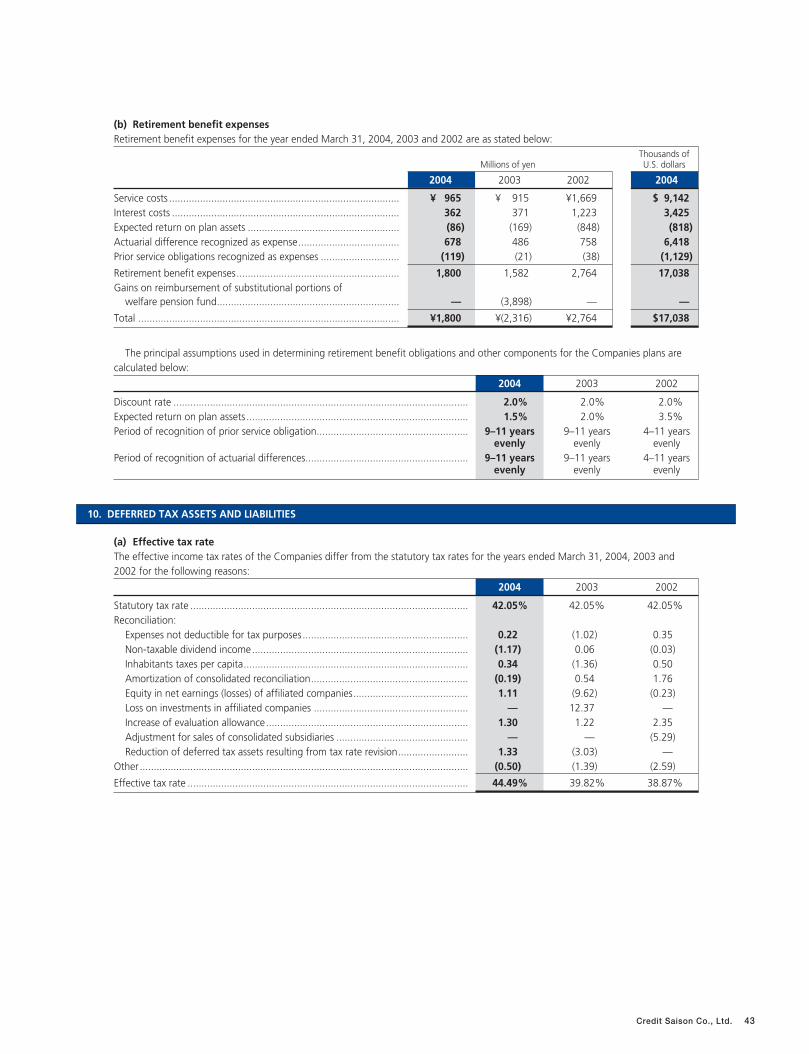
Credit Saison Co., Ltd. 43
(b) Retirement benefit expensesRetirement benefit expenses for the year ended March 31, 2004, 2003 and 2002 are as stated below:
Thousands of Millions of yen U.S. dollars
2004 2003 2002 2004
Service costs .................................................................................. ¥ 965 ¥ 915 ¥1,669 $ 9,142Interest costs ................................................................................. 362 371 1,223 3,425Expected return on plan assets ...................................................... (86) (169) (848) (818)Actuarial difference recognized as expense.................................... 678 486 758 6,418Prior service obligations recognized as expenses ............................ (119) (21) (38) (1,129)
Retirement benefit expenses.......................................................... 1,800 1,582 2,764 17,038Gains on reimbursement of substitutional portions of
welfare pension fund................................................................. — (3,898) — —
Total ............................................................................................. ¥1,800 ¥(2,316) ¥2,764 $17,038
The principal assumptions used in determining retirement benefit obligations and other components for the Companies plans arecalculated below:
2004 2003 2002
Discount rate ......................................................................................................... 2.0% 2.0% 2.0%Expected return on plan assets ............................................................................... 1.5% 2.0% 3.5%Period of recognition of prior service obligation...................................................... 9–11 years 9–11 years 4–11 years
evenly evenly evenlyPeriod of recognition of actuarial differences.......................................................... 9–11 years 9–11 years 4–11 years
evenly evenly evenly
10. DEFERRED TAX ASSETS AND LIABILITIES
(a) Effective tax rateThe effective income tax rates of the Companies differ from the statutory tax rates for the years ended March 31, 2004, 2003 and2002 for the following reasons:
2004 2003 2002
Statutory tax rate ................................................................................................... 42.05% 42.05% 42.05%Reconciliation:
Expenses not deductible for tax purposes........................................................... 0.22 (1.02) 0.35 Non-taxable dividend income............................................................................. (1.17) 0.06 (0.03)Inhabitants taxes per capita................................................................................ 0.34 (1.36) 0.50 Amortization of consolidated reconciliation........................................................ (0.19) 0.54 1.76 Equity in net earnings (losses) of affiliated companies......................................... 1.11 (9.62) (0.23)Loss on investments in affiliated companies ....................................................... — 12.37 —Increase of evaluation allowance........................................................................ 1.30 1.22 2.35Adjustment for sales of consolidated subsidiaries ............................................... — — (5.29)Reduction of deferred tax assets resulting from tax rate revision......................... 1.33 (3.03) —
Other ..................................................................................................................... (0.50) (1.39) (2.59)
Effective tax rate .................................................................................................... 44.49% 39.82% 38.87%
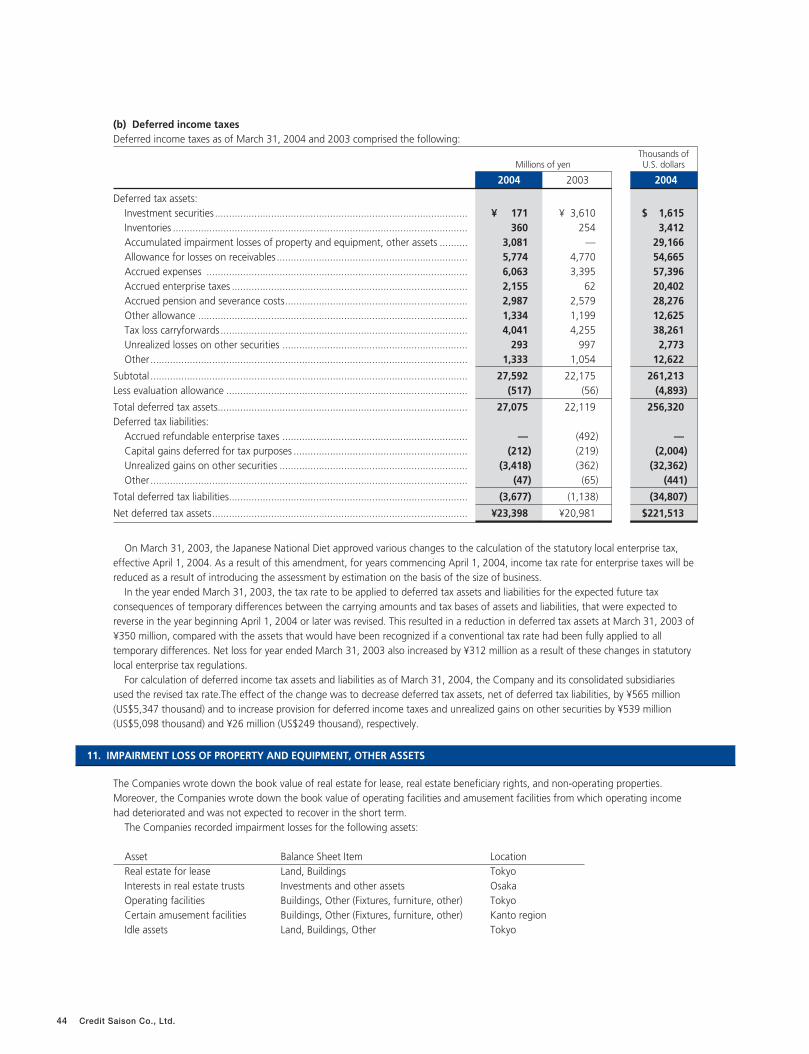
44 Credit Saison Co., Ltd.
(b) Deferred income taxesDeferred income taxes as of March 31, 2004 and 2003 comprised the following:
Thousands of Millions of yen U.S. dollars
2004 2003 2004
Deferred tax assets:Investment securities .......................................................................................... ¥ 171 ¥ 3,610 $ 1,615Inventories ......................................................................................................... 360 254 3,412Accumulated impairment losses of property and equipment, other assets .......... 3,081 — 29,166Allowance for losses on receivables .................................................................... 5,774 4,770 54,665Accrued expenses ............................................................................................. 6,063 3,395 57,396Accrued enterprise taxes .................................................................................... 2,155 62 20,402Accrued pension and severance costs................................................................. 2,987 2,579 28,276Other allowance ................................................................................................ 1,334 1,199 12,625Tax loss carryforwards........................................................................................ 4,041 4,255 38,261Unrealized losses on other securities .................................................................. 293 997 2,773Other................................................................................................................. 1,333 1,054 12,622
Subtotal ................................................................................................................. 27,592 22,175 261,213Less evaluation allowance ...................................................................................... (517) (56) (4,893)
Total deferred tax assets......................................................................................... 27,075 22,119 256,320Deferred tax liabilities:
Accrued refundable enterprise taxes .................................................................. — (492) —Capital gains deferred for tax purposes .............................................................. (212) (219) (2,004)Unrealized gains on other securities ................................................................... (3,418) (362) (32,362)Other................................................................................................................. (47) (65) (441)
Total deferred tax liabilities..................................................................................... (3,677) (1,138) (34,807)
Net deferred tax assets........................................................................................... ¥23,398 ¥20,981 $221,513
On March 31, 2003, the Japanese National Diet approved various changes to the calculation of the statutory local enterprise tax,effective April 1, 2004. As a result of this amendment, for years commencing April 1, 2004, income tax rate for enterprise taxes will bereduced as a result of introducing the assessment by estimation on the basis of the size of business.
In the year ended March 31, 2003, the tax rate to be applied to deferred tax assets and liabilities for the expected future taxconsequences of temporary differences between the carrying amounts and tax bases of assets and liabilities, that were expected toreverse in the year beginning April 1, 2004 or later was revised. This resulted in a reduction in deferred tax assets at March 31, 2003 of¥350 million, compared with the assets that would have been recognized if a conventional tax rate had been fully applied to alltemporary differences. Net loss for year ended March 31, 2003 also increased by ¥312 million as a result of these changes in statutorylocal enterprise tax regulations.
For calculation of deferred income tax assets and liabilities as of March 31, 2004, the Company and its consolidated subsidiariesused the revised tax rate.The effect of the change was to decrease deferred tax assets, net of deferred tax liabilities, by ¥565 million(US$5,347 thousand) and to increase provision for deferred income taxes and unrealized gains on other securities by ¥539 million(US$5,098 thousand) and ¥26 million (US$249 thousand), respectively.
11. IMPAIRMENT LOSS OF PROPERTY AND EQUIPMENT, OTHER ASSETS
The Companies wrote down the book value of real estate for lease, real estate beneficiary rights, and non-operating properties.Moreover, the Companies wrote down the book value of operating facilities and amusement facilities from which operating incomehad deteriorated and was not expected to recover in the short term.
The Companies recorded impairment losses for the following assets:
Asset Balance Sheet Item LocationReal estate for lease Land, Buildings TokyoInterests in real estate trusts Investments and other assets OsakaOperating facilities Buildings, Other (Fixtures, furniture, other) TokyoCertain amusement facilities Buildings, Other (Fixtures, furniture, other) Kanto regionIdle assets Land, Buildings, Other Tokyo
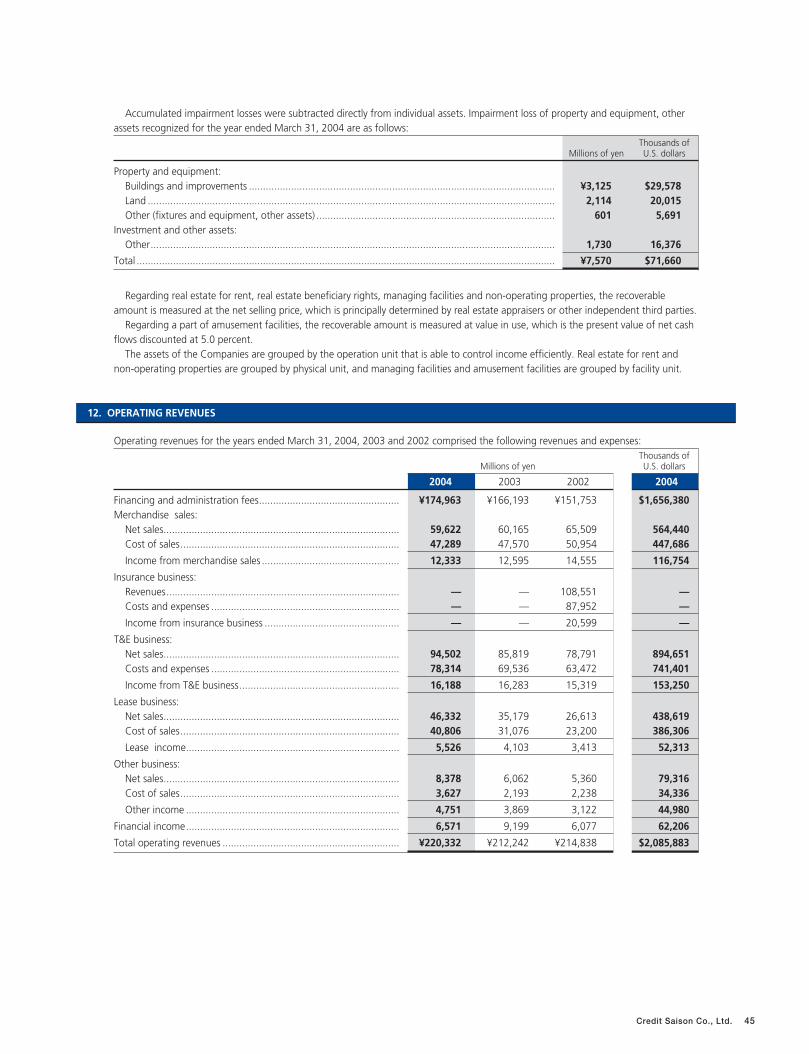
Credit Saison Co., Ltd. 45
Accumulated impairment losses were subtracted directly from individual assets. Impairment loss of property and equipment, otherassets recognized for the year ended March 31, 2004 are as follows:
Thousands of Millions of yen U.S. dollars
Property and equipment:Buildings and improvements ............................................................................................................. ¥3,125 $29,578Land ................................................................................................................................................. 2,114 20,015Other (fixtures and equipment, other assets) ..................................................................................... 601 5,691
Investment and other assets: Other................................................................................................................................................ 1,730 16,376
Total ..................................................................................................................................................... ¥7,570 $71,660
Regarding real estate for rent, real estate beneficiary rights, managing facilities and non-operating properties, the recoverableamount is measured at the net selling price, which is principally determined by real estate appraisers or other independent third parties.
Regarding a part of amusement facilities, the recoverable amount is measured at value in use, which is the present value of net cashflows discounted at 5.0 percent.
The assets of the Companies are grouped by the operation unit that is able to control income efficiently. Real estate for rent andnon-operating properties are grouped by physical unit, and managing facilities and amusement facilities are grouped by facility unit.
12. OPERATING REVENUES
Operating revenues for the years ended March 31, 2004, 2003 and 2002 comprised the following revenues and expenses:Thousands of
Millions of yen U.S. dollars
2004 2003 2002 2004
Financing and administration fees.................................................. ¥174,963 ¥166,193 ¥151,753 $1,656,380Merchandise sales:
Net sales.................................................................................... 59,622 60,165 65,509 564,440Cost of sales.............................................................................. 47,289 47,570 50,954 447,686
Income from merchandise sales ................................................. 12,333 12,595 14,555 116,754
Insurance business:Revenues................................................................................... — — 108,551 —Costs and expenses ................................................................... — — 87,952 —
Income from insurance business ................................................ — — 20,599 —
T&E business:Net sales.................................................................................... 94,502 85,819 78,791 894,651Costs and expenses ................................................................... 78,314 69,536 63,472 741,401
Income from T&E business......................................................... 16,188 16,283 15,319 153,250
Lease business:Net sales.................................................................................... 46,332 35,179 26,613 438,619Cost of sales.............................................................................. 40,806 31,076 23,200 386,306
Lease income............................................................................ 5,526 4,103 3,413 52,313
Other business:Net sales.................................................................................... 8,378 6,062 5,360 79,316Cost of sales.............................................................................. 3,627 2,193 2,238 34,336
Other income ............................................................................ 4,751 3,869 3,122 44,980
Financial income............................................................................ 6,571 9,199 6,077 62,206
Total operating revenues ............................................................... ¥220,332 ¥212,242 ¥214,838 $2,085,883
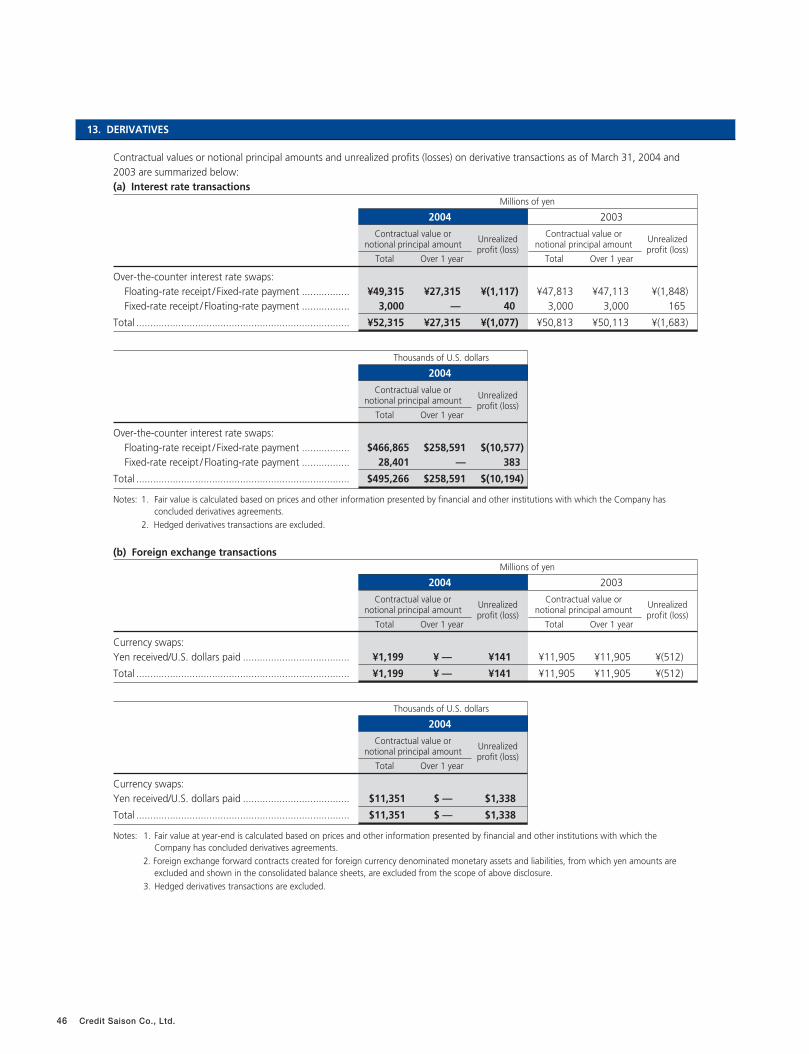
46 Credit Saison Co., Ltd.
13. DERIVATIVES
Contractual values or notional principal amounts and unrealized profits (losses) on derivative transactions as of March 31, 2004 and2003 are summarized below:(a) Interest rate transactions
Millions of yen
2004 2003
Contractual value or Unrealized Contractual value or Unrealizednotional principal amount profit (loss) notional principal amount profit (loss)Total Over 1 year Total Over 1 year
Over-the-counter interest rate swaps:Floating-rate receipt / Fixed-rate payment ................. ¥49,315 ¥27,315 ¥(1,117) ¥47,813 ¥47,113 ¥(1,848)Fixed-rate receipt / Floating-rate payment ................. 3,000 — 40 3,000 3,000 165
Total ............................................................................ ¥52,315 ¥27,315 ¥(1,077) ¥50,813 ¥50,113 ¥(1,683)
Thousands of U.S. dollars
2004
Contractual value or Unrealized notional principal amount profit (loss)Total Over 1 year
Over-the-counter interest rate swaps:Floating-rate receipt / Fixed-rate payment ................. $466,865 $258,591 $(10,577)Fixed-rate receipt / Floating-rate payment ................. 28,401 — 383
Total ............................................................................ $495,266 $258,591 $(10,194)
Notes: 1. Fair value is calculated based on prices and other information presented by financial and other institutions with which the Company has concluded derivatives agreements.
2. Hedged derivatives transactions are excluded.
(b) Foreign exchange transactionsMillions of yen
2004 2003
Contractual value or Unrealized Contractual value or Unrealizednotional principal amount profit (loss) notional principal amount profit (loss)Total Over 1 year Total Over 1 year
Currency swaps:Yen received/U.S. dollars paid ...................................... ¥1,199 ¥ — ¥141 ¥11,905 ¥11,905 ¥(512)
Total ............................................................................ ¥1,199 ¥ — ¥141 ¥11,905 ¥11,905 ¥(512)
Thousands of U.S. dollars
2004
Contractual value or Unrealized notional principal amount profit (loss)Total Over 1 year
Currency swaps:Yen received/U.S. dollars paid ...................................... $11,351 $ — $1,338
Total ............................................................................ $11,351 $ — $1,338
Notes: 1. Fair value at year-end is calculated based on prices and other information presented by financial and other institutions with which the Company has concluded derivatives agreements.
2. Foreign exchange forward contracts created for foreign currency denominated monetary assets and liabilities, from which yen amounts are excluded and shown in the consolidated balance sheets, are excluded from the scope of above disclosure.
3. Hedged derivatives transactions are excluded.
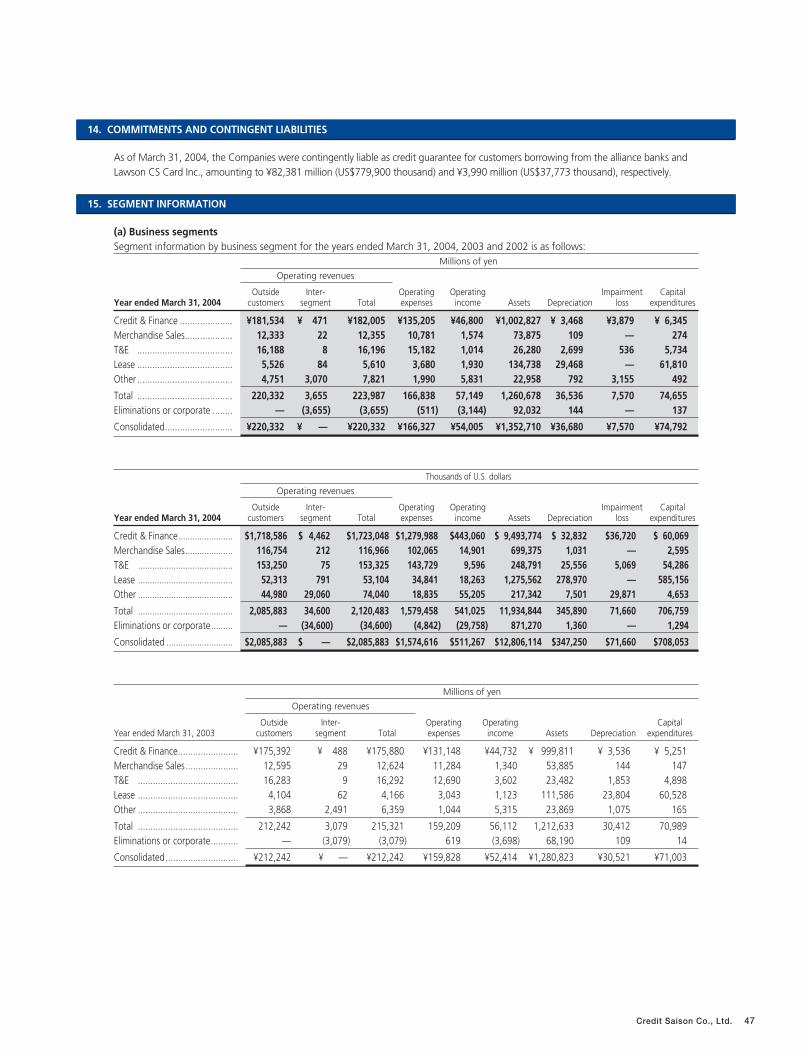
Credit Saison Co., Ltd. 47
14. COMMITMENTS AND CONTINGENT LIABILITIES
As of March 31, 2004, the Companies were contingently liable as credit guarantee for customers borrowing from the alliance banks andLawson CS Card Inc., amounting to ¥82,381 million (US$779,900 thousand) and ¥3,990 million (US$37,773 thousand), respectively.
15. SEGMENT INFORMATION
(a) Business segmentsSegment information by business segment for the years ended March 31, 2004, 2003 and 2002 is as follows:
Millions of yen
Operating revenues
Outside Inter- Operating Operating Impairment CapitalYear ended March 31, 2004 customers segment Total expenses income Assets Depreciation loss expenditures
Credit & Finance ..................... ¥181,534 ¥ 471 ¥182,005 ¥135,205 ¥46,800 ¥1,002,827 ¥ 3,468 ¥3,879 ¥ 6,345 Merchandise Sales................... 12,333 22 12,355 10,781 1,574 73,875 109 — 274 T&E ...................................... 16,188 8 16,196 15,182 1,014 26,280 2,699 536 5,734 Lease ...................................... 5,526 84 5,610 3,680 1,930 134,738 29,468 — 61,810 Other ...................................... 4,751 3,070 7,821 1,990 5,831 22,958 792 3,155 492
Total ...................................... 220,332 3,655 223,987 166,838 57,149 1,260,678 36,536 7,570 74,655Eliminations or corporate ........ — (3,655) (3,655) (511) (3,144) 92,032 144 — 137
Consolidated........................... ¥220,332 ¥ — ¥220,332 ¥166,327 ¥54,005 ¥1,352,710 ¥36,680 ¥7,570 ¥74,792
Thousands of U.S. dollars
Operating revenues
Outside Inter- Operating Operating Impairment CapitalYear ended March 31, 2004 customers segment Total expenses income Assets Depreciation loss expenditures
Credit & Finance....................... $1,718,586 $ 4,462 $1,723,048 $1,279,988 $443,060 $ 9,493,774 $ 32,832 $36,720 $ 60,069Merchandise Sales.................... 116,754 212 116,966 102,065 14,901 699,375 1,031 — 2,595T&E ........................................ 153,250 75 153,325 143,729 9,596 248,791 25,556 5,069 54,286Lease ........................................ 52,313 791 53,104 34,841 18,263 1,275,562 278,970 — 585,156Other ........................................ 44,980 29,060 74,040 18,835 55,205 217,342 7,501 29,871 4,653
Total ........................................ 2,085,883 34,600 2,120,483 1,579,458 541,025 11,934,844 345,890 71,660 706,759Eliminations or corporate ......... — (34,600) (34,600) (4,842) (29,758) 871,270 1,360 — 1,294
Consolidated ............................ $2,085,883 $ — $2,085,883 $1,574,616 $511,267 $12,806,114 $347,250 $71,660 $708,053
Millions of yen
Operating revenues
Outside Inter- Operating Operating CapitalYear ended March 31, 2003 customers segment Total expenses income Assets Depreciation expenditures
Credit & Finance........................ ¥175,392 ¥ 488 ¥175,880 ¥131,148 ¥44,732 ¥ 999,811 ¥ 3,536 ¥ 5,251Merchandise Sales..................... 12,595 29 12,624 11,284 1,340 53,885 144 147T&E ........................................ 16,283 9 16,292 12,690 3,602 23,482 1,853 4,898Lease ........................................ 4,104 62 4,166 3,043 1,123 111,586 23,804 60,528Other ........................................ 3,868 2,491 6,359 1,044 5,315 23,869 1,075 165
Total ........................................ 212,242 3,079 215,321 159,209 56,112 1,212,633 30,412 70,989Eliminations or corporate........... — (3,079) (3,079) 619 (3,698) 68,190 109 14
Consolidated............................. ¥212,242 ¥ — ¥212,242 ¥159,828 ¥52,414 ¥1,280,823 ¥30,521 ¥71,003
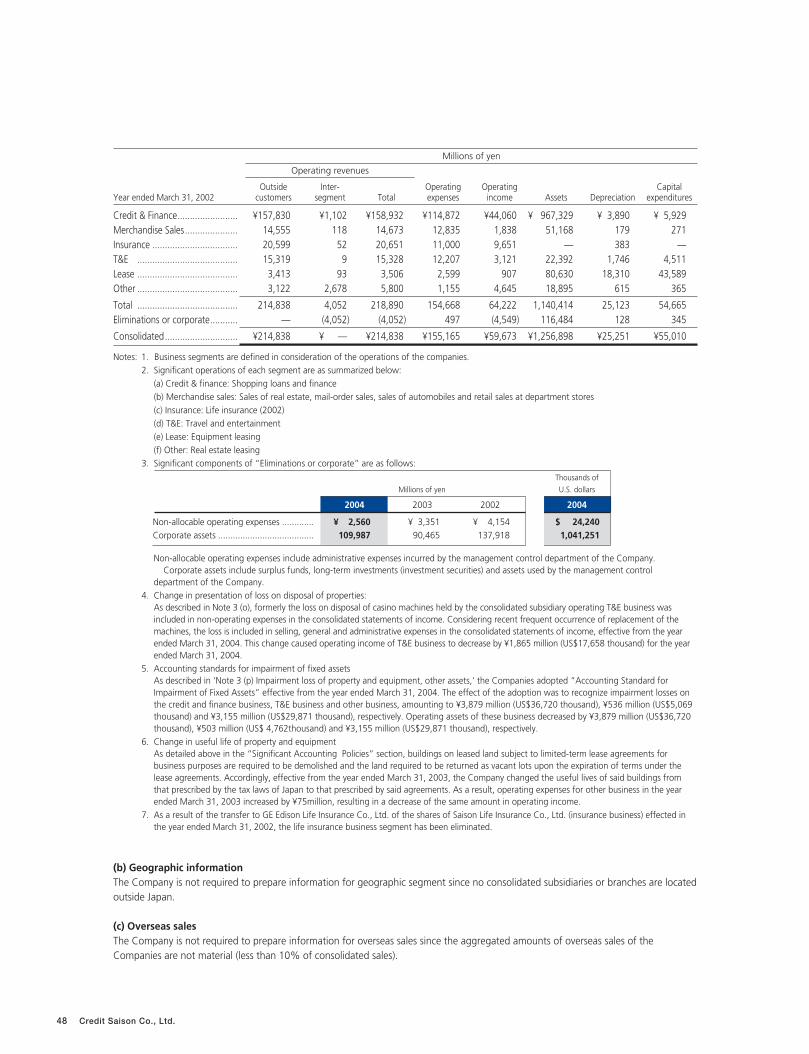
48 Credit Saison Co., Ltd.
Millions of yen
Operating revenues
Outside Inter- Operating Operating CapitalYear ended March 31, 2002 customers segment Total expenses income Assets Depreciation expenditures
Credit & Finance........................ ¥157,830 ¥1,102 ¥158,932 ¥114,872 ¥44,060 ¥ 967,329 ¥ 3,890 ¥ 5,929Merchandise Sales..................... 14,555 118 14,673 12,835 1,838 51,168 179 271Insurance .................................. 20,599 52 20,651 11,000 9,651 — 383 —T&E ........................................ 15,319 9 15,328 12,207 3,121 22,392 1,746 4,511Lease ........................................ 3,413 93 3,506 2,599 907 80,630 18,310 43,589Other ........................................ 3,122 2,678 5,800 1,155 4,645 18,895 615 365
Total ........................................ 214,838 4,052 218,890 154,668 64,222 1,140,414 25,123 54,665Eliminations or corporate........... — (4,052) (4,052) 497 (4,549) 116,484 128 345
Consolidated............................. ¥214,838 ¥ — ¥214,838 ¥155,165 ¥59,673 ¥1,256,898 ¥25,251 ¥55,010
Notes: 1. Business segments are defined in consideration of the operations of the companies.2. Significant operations of each segment are as summarized below:
(a) Credit & finance: Shopping loans and finance(b) Merchandise sales: Sales of real estate, mail-order sales, sales of automobiles and retail sales at department stores(c) Insurance: Life insurance (2002)(d) T&E: Travel and entertainment(e) Lease: Equipment leasing(f) Other: Real estate leasing
3. Significant components of “Eliminations or corporate” are as follows:
Thousands of
Millions of yen U.S. dollars
2004 2003 2002 2004
Non-allocable operating expenses ............. ¥ 2,560 ¥ 3,351 ¥ 4,154 $ 24,240Corporate assets ....................................... 109,987 90,465 137,918 1,041,251
Non-allocable operating expenses include administrative expenses incurred by the management control department of the Company.Corporate assets include surplus funds, long-term investments (investment securities) and assets used by the management control
department of the Company.4. Change in presentation of loss on disposal of properties:
As described in Note 3 (o), formerly the loss on disposal of casino machines held by the consolidated subsidiary operating T&E business wasincluded in non-operating expenses in the consolidated statements of income. Considering recent frequent occurrence of replacement of themachines, the loss is included in selling, general and administrative expenses in the consolidated statements of income, effective from the yearended March 31, 2004. This change caused operating income of T&E business to decrease by ¥1,865 million (US$17,658 thousand) for the yearended March 31, 2004.
5. Accounting standards for impairment of fixed assetsAs described in ‘Note 3 (p) Impairment loss of property and equipment, other assets,‘ the Companies adopted “Accounting Standard for Impairment of Fixed Assets” effective from the year ended March 31, 2004. The effect of the adoption was to recognize impairment losses on the credit and finance business, T&E business and other business, amounting to ¥3,879 million (US$36,720 thousand), ¥536 million (US$5,069 thousand) and ¥3,155 million (US$29,871 thousand), respectively. Operating assets of these business decreased by ¥3,879 million (US$36,720 thousand), ¥503 million (US$ 4,762thousand) and ¥3,155 million (US$29,871 thousand), respectively.
6. Change in useful life of property and equipmentAs detailed above in the “Significant Accounting Policies” section, buildings on leased land subject to limited-term lease agreements for business purposes are required to be demolished and the land required to be returned as vacant lots upon the expiration of terms under the lease agreements. Accordingly, effective from the year ended March 31, 2003, the Company changed the useful lives of said buildings from that prescribed by the tax laws of Japan to that prescribed by said agreements. As a result, operating expenses for other business in the year ended March 31, 2003 increased by ¥75million, resulting in a decrease of the same amount in operating income.
7. As a result of the transfer to GE Edison Life Insurance Co., Ltd. of the shares of Saison Life Insurance Co., Ltd. (insurance business) effected in the year ended March 31, 2002, the life insurance business segment has been eliminated.
(b) Geographic informationThe Company is not required to prepare information for geographic segment since no consolidated subsidiaries or branches are locatedoutside Japan.
(c) Overseas salesThe Company is not required to prepare information for overseas sales since the aggregated amounts of overseas sales of theCompanies are not material (less than 10% of consolidated sales).
Report of Independent Accountants
To the Board of Directors and Shareholders of
CREDIT SAISON CO., LTD.
We have audited the accompanying consolidated balance sheets of CREDIT SAISON CO., LTD. and its
consolidated subsidiaries as of March 31, 2004 and 2003, and the related consolidated statements of
income, shareholders’ equity, and cash flows for the three years in the period ended March 31,2004, all
expressed in Japanese Yen. These consolidated financial statements are the responsibility of the Company’s
management. Our responsibility is to express an opinion on these consolidated financial statements based
on our audits.
We conducted our audits in accordance with auditing standards generally accepted in Japan. These
standards require that we plan and perform the audit to obtain reasonable assurance about whether the
consolidated financial statements are free of material misstatement. An audit includes examining, on a test
basis, evidence supporting the amounts and disclosures in the consolidated financial statements. An audit
also includes assessing the accounting principles used and significant estimates made by management, as
well as evaluating the overall consolidated financial statement presentation. We believe that our audits
provide a reasonable basis for our opinion.
In our opinion, the consolidated financial statements referred to above present fairly, in all material respects,
the consolidated financial position of CREDIT SAISON CO., LTD. and its consolidated subsidiaries as of
March 31, 2004 and 2003, and the consolidated results of their operations and their cash flows for the three
years then ended in conformity with accounting principles generally accepted in Japan.
As described in Note 3, the consolidated subsidiary operating T&E business changed the classification of
loss on disposal of casino machines from non-operating expenses to selling, general and administrative
expenses in the consolidated statements of income, effective from the year ended March 31, 2004.
As described in Note 3, CREDIT SAISON CO., LTD. and its consolidated subsidiaries have adopted the new
Japanese accounting standards for impairment of fixed assets from the year ended March 31, 2004.
The amounts expressed in U.S. dollars, which are provided solely for the convenience of the reader, have
been translated on the basis set forth in Note 2 to the accompanying consolidated financial statements.
ChuoAoyama PricewaterhouseCoopers
Tokyo, Japan
June 29, 2004
Credit Saison Co., Ltd. 49
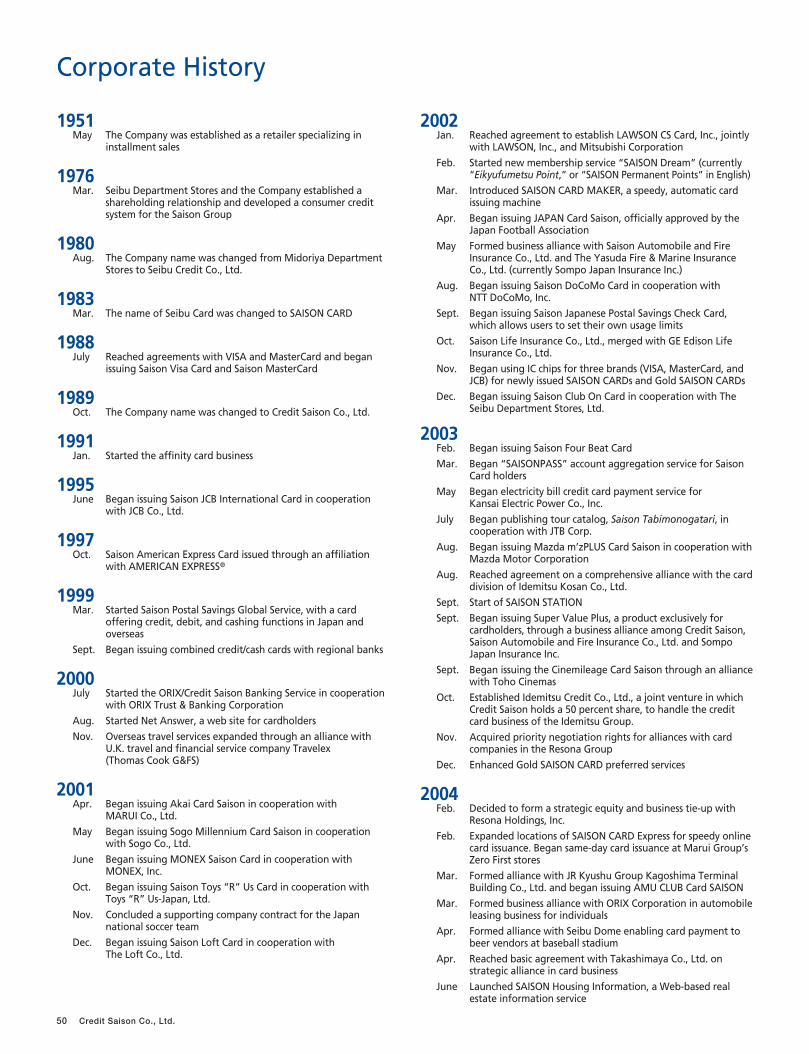
Corporate History
1951May The Company was established as a retailer specializing in
installment sales
1976Mar. Seibu Department Stores and the Company established a
shareholding relationship and developed a consumer credit system for the Saison Group
1980Aug. The Company name was changed from Midoriya Department
Stores to Seibu Credit Co., Ltd.
1983Mar. The name of Seibu Card was changed to SAISON CARD
1988July Reached agreements with VISA and MasterCard and began
issuing Saison Visa Card and Saison MasterCard
1989Oct. The Company name was changed to Credit Saison Co., Ltd.
1991Jan. Started the affinity card business
1995June Began issuing Saison JCB International Card in cooperation
with JCB Co., Ltd.
1997Oct. Saison American Express Card issued through an affiliation
with AMERICAN EXPRESS®
1999Mar. Started Saison Postal Savings Global Service, with a card
offering credit, debit, and cashing functions in Japan and overseas
Sept. Began issuing combined credit/cash cards with regional banks
2000July Started the ORIX/Credit Saison Banking Service in cooperation
with ORIX Trust & Banking Corporation
Aug. Started Net Answer, a web site for cardholders
Nov. Overseas travel services expanded through an alliance with U.K. travel and financial service company Travelex (Thomas Cook G&FS)
2001Apr. Began issuing Akai Card Saison in cooperation with
MARUI Co., Ltd.
May Began issuing Sogo Millennium Card Saison in cooperation with Sogo Co., Ltd.
June Began issuing MONEX Saison Card in cooperation with MONEX, Inc.
Oct. Began issuing Saison Toys “R” Us Card in cooperation with Toys “R” Us-Japan, Ltd.
Nov. Concluded a supporting company contract for the Japan national soccer team
Dec. Began issuing Saison Loft Card in cooperation with The Loft Co., Ltd.
2002Jan. Reached agreement to establish LAWSON CS Card, Inc., jointly
with LAWSON, Inc., and Mitsubishi Corporation
Feb. Started new membership service “SAISON Dream” (currently “Eikyufumetsu Point,” or “SAISON Permanent Points” in English)
Mar. Introduced SAISON CARD MAKER, a speedy, automatic card issuing machine
Apr. Began issuing JAPAN Card Saison, officially approved by the Japan Football Association
May Formed business alliance with Saison Automobile and Fire Insurance Co., Ltd. and The Yasuda Fire & Marine Insurance Co., Ltd. (currently Sompo Japan Insurance Inc.)
Aug. Began issuing Saison DoCoMo Card in cooperation with NTT DoCoMo, Inc.
Sept. Began issuing Saison Japanese Postal Savings Check Card, which allows users to set their own usage limits
Oct. Saison Life Insurance Co., Ltd., merged with GE Edison Life Insurance Co., Ltd.
Nov. Began using IC chips for three brands (VISA, MasterCard, and JCB) for newly issued SAISON CARDs and Gold SAISON CARDs
Dec. Began issuing Saison Club On Card in cooperation with The Seibu Department Stores, Ltd.
2003Feb. Began issuing Saison Four Beat Card
Mar. Began “SAISONPASS” account aggregation service for Saison Card holders
May Began electricity bill credit card payment service for Kansai Electric Power Co., Inc.
July Began publishing tour catalog, Saison Tabimonogatari, in cooperation with JTB Corp.
Aug. Began issuing Mazda m’zPLUS Card Saison in cooperation with Mazda Motor Corporation
Aug. Reached agreement on a comprehensive alliance with the card division of Idemitsu Kosan Co., Ltd.
Sept. Start of SAISON STATION
Sept. Began issuing Super Value Plus, a product exclusively for cardholders, through a business alliance among Credit Saison, Saison Automobile and Fire Insurance Co., Ltd. and Sompo Japan Insurance Inc.
Sept. Began issuing the Cinemileage Card Saison through an alliance with Toho Cinemas
Oct. Established Idemitsu Credit Co., Ltd., a joint venture in which Credit Saison holds a 50 percent share, to handle the creditcard business of the Idemitsu Group.
Nov. Acquired priority negotiation rights for alliances with card companies in the Resona Group
Dec. Enhanced Gold SAISON CARD preferred services
2004Feb. Decided to form a strategic equity and business tie-up with
Resona Holdings, Inc.
Feb. Expanded locations of SAISON CARD Express for speedy online card issuance. Began same-day card issuance at Marui Group’s Zero First stores
Mar. Formed alliance with JR Kyushu Group Kagoshima Terminal Building Co., Ltd. and began issuing AMU CLUB Card SAISON
Mar. Formed business alliance with ORIX Corporation in automobile leasing business for individuals
Apr. Formed alliance with Seibu Dome enabling card payment to beer vendors at baseball stadium
Apr. Reached basic agreement with Takashimaya Co., Ltd. on strategic alliance in card business
June Launched SAISON Housing Information, a Web-based real estate information service
50 Credit Saison Co., Ltd.
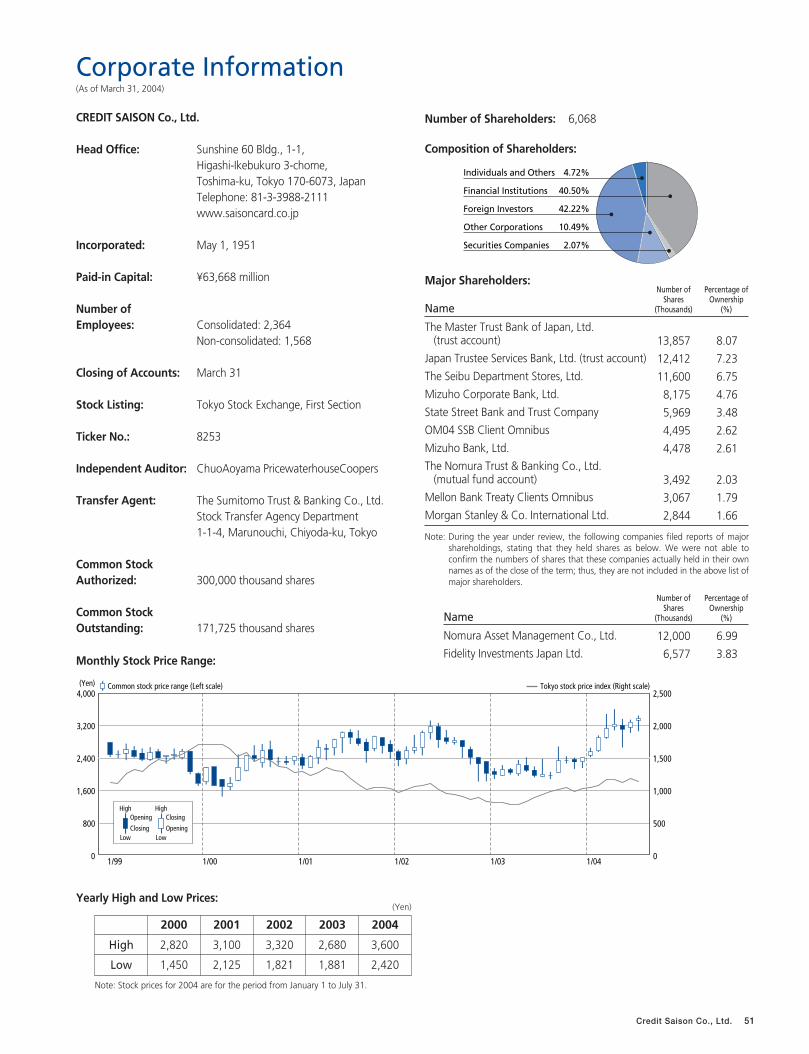
Corporate Information (As of March 31, 2004)
Credit Saison Co., Ltd. 51
CREDIT SAISON Co., Ltd.
Head Office: Sunshine 60 Bldg., 1-1, Higashi-Ikebukuro 3-chome,Toshima-ku, Tokyo 170-6073, JapanTelephone: 81-3-3988-2111www.saisoncard.co.jp
Incorporated: May 1, 1951
Paid-in Capital: ¥63,668 million
Number of Employees: Consolidated: 2,364
Non-consolidated: 1,568
Closing of Accounts: March 31
Stock Listing: Tokyo Stock Exchange, First Section
Ticker No.: 8253
Independent Auditor: ChuoAoyama PricewaterhouseCoopers
Transfer Agent: The Sumitomo Trust & Banking Co., Ltd.Stock Transfer Agency Department1-1-4, Marunouchi, Chiyoda-ku, Tokyo
Common StockAuthorized: 300,000 thousand shares
Common Stock Outstanding: 171,725 thousand shares
Monthly Stock Price Range:
Number of Shareholders: 6,068
Composition of Shareholders:
Major Shareholders:Number of Percentage of
Shares OwnershipName (Thousands) (%)
The Master Trust Bank of Japan, Ltd.(trust account) 13,857 8.07
Japan Trustee Services Bank, Ltd. (trust account) 12,412 7.23
The Seibu Department Stores, Ltd. 11,600 6.75
Mizuho Corporate Bank, Ltd. 8,175 4.76
State Street Bank and Trust Company 5,969 3.48
OM04 SSB Client Omnibus 4,495 2.62
Mizuho Bank, Ltd. 4,478 2.61
The Nomura Trust & Banking Co., Ltd. (mutual fund account) 3,492 2.03
Mellon Bank Treaty Clients Omnibus 3,067 1.79
Morgan Stanley & Co. International Ltd. 2,844 1.66
Note: During the year under review, the following companies filed reports of major shareholdings, stating that they held shares as below. We were not able to confirm the numbers of shares that these companies actually held in their own names as of the close of the term; thus, they are not included in the above list of major shareholders.
Number of Percentage of Shares Ownership
Name (Thousands) (%)
Nomura Asset Management Co., Ltd. 12,000 6.99
Fidelity Investments Japan Ltd. 6,577 3.83
Individuals and Others
Financial Institutions
Foreign Investors
Other Corporations
Securities Companies
4.72%
40.50%
42.22%
10.49%
2.07%
0
800
1,600
2,400
3,200
4,000
0
500
1,000
1,500
2,000
2,500(Yen)
1/99 1/00 1/01 1/02 1/03 1/04
Common stock price range (Left scale) Tokyo stock price index (Right scale)
Opening
Closing
High
Low
Closing
Opening
High
Low
Yearly High and Low Prices:(Yen)
2000 2001 2002 2003 2004
High 2,820 3,100 3,320 2,680 3,600
Low 1,450 2,125 1,821 1,881 2,420
Note: Stock prices for 2004 are for the period from January 1 to July 31.
Sunshine 60 Bldg., 1-1, Higashi-Ikebukuro 3-chome,Toshima-ku, Tokyo 170-6073, Japan
Telephone: 81-3-3988-2111www.saisoncard.co.jp
TM
Printed in Japan with soy ink on recycled paper.
CR
ED
IT S
AIS
ON
Co
., Ltd
. An
nu
al R
ep
ort 2
00
4