Embed Size (px)
Citation preview
CORPORATE STRATEGY 2005 CREDIT SAISON CO., LTD.
AGENDA
Ⅱ.Explanation of Revisionsto Perforation Estimates
◆Overview of Business for First Half of FY 2005
Ⅰ.Overview of Business
◆Management Strategy for FY 2005The figures contained in this document, which describe the outlook of business etc, are projected calculations based on conclusions and suppositions according to the information currently available to us. Future actual business results may differ substantially from the projections described here due to the inherent uncertainty of such conclusions and suppositions, as well as variable factors such as future business operations and/or economic conditions.
CORPORATE STRATEGY 2005 CREDIT SAISON CO., LTD.
HalfHalf--Year Financial Report Year Financial Report for FY 2005for FY 2005
CORPORATE STRATEGY 2005 CREDIT SAISON CO., LTD.
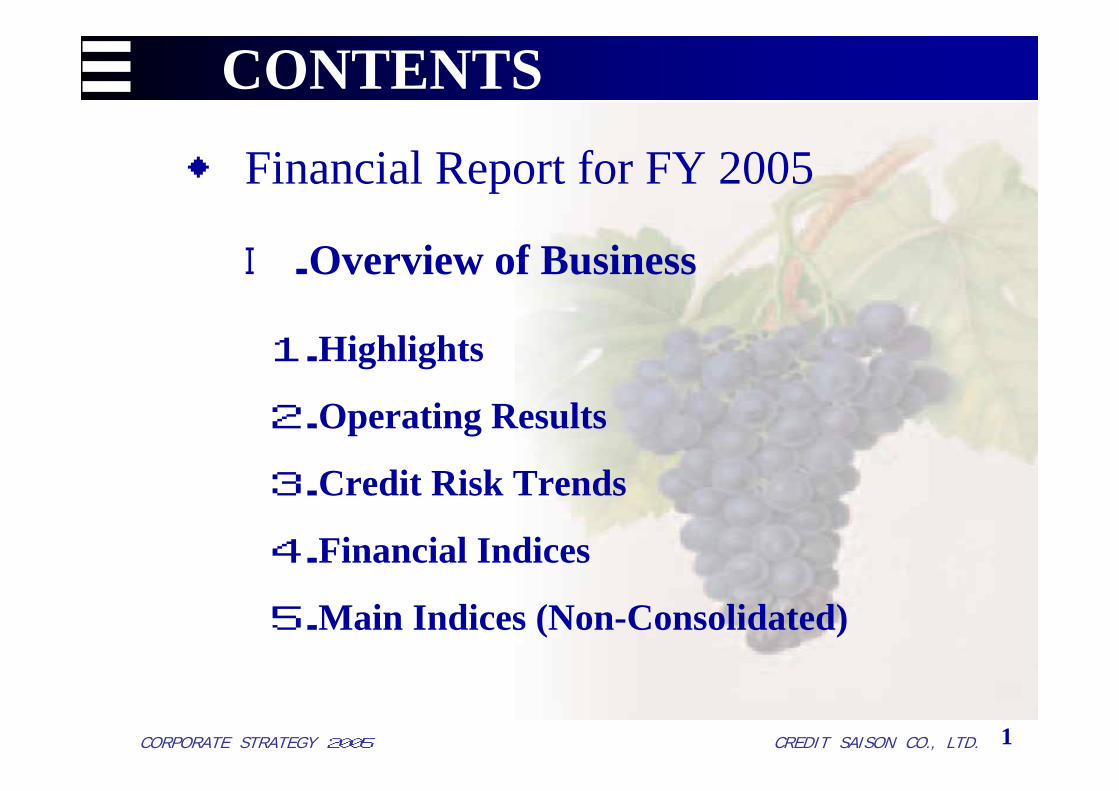
CONTENTS
1
◆ Financial Report for FY 2005
Ⅰ.Overview of Business
1.Highlights
2.Operating Results
3.Credit Risk Trends
4.Financial Indices
5.Main Indices (Non-Consolidated)
CORPORATE STRATEGY 2005 CREDIT SAISON CO., LTD. 2
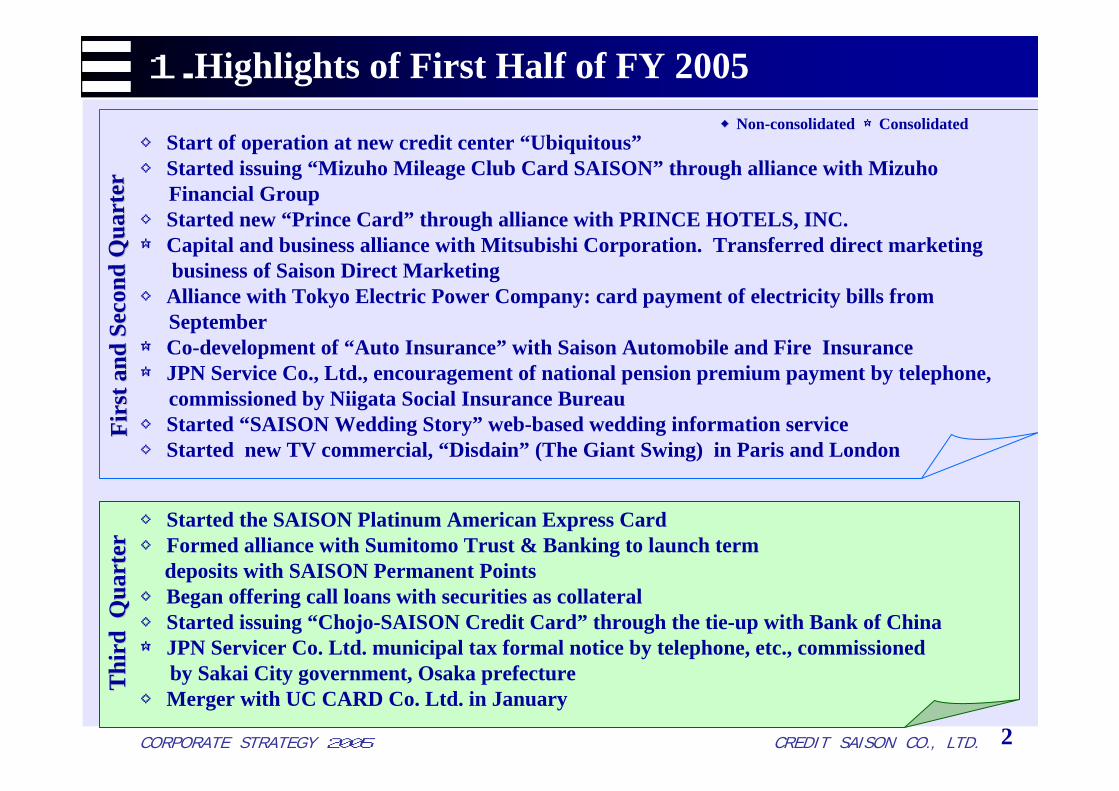
◇ Started the SAISON Platinum American Express Card ◇ Formed alliance with Sumitomo Trust & Banking to launch term
deposits with SAISON Permanent Points◇ Began offering call loans with securities as collateral ◇ Started issuing “Chojo-SAISON Credit Card” through the tie-up with Bank of China ☆ JPN Servicer Co. Ltd. municipal tax formal notice by telephone, etc., commissioned
by Sakai City government, Osaka prefecture ◇Merger with UC CARD Co. Ltd. in January
◇ Start of operation at new credit center “Ubiquitous”◇ Started issuing “Mizuho Mileage Club Card SAISON” through alliance with Mizuho
Financial Group◇ Started new “Prince Card” through alliance with PRINCE HOTELS, INC. ☆ Capital and business alliance with Mitsubishi Corporation. Transferred direct marketing
business of Saison Direct Marketing◇ Alliance with Tokyo Electric Power Company: card payment of electricity bills from
September☆ Co-development of “Auto Insurance” with Saison Automobile and Fire Insurance ☆ JPN Service Co., Ltd., encouragement of national pension premium payment by telephone,
commissioned by Niigata Social Insurance Bureau ◇ Started “SAISON Wedding Story” web-based wedding information service◇ Started new TV commercial, “Disdain” (The Giant Swing) in Paris and London
Firs
t and
Sec
ond
Qua
rter
Firs
t and
Sec
ond
Qua
rter
Thi
rd Q
uart
erT
hird
Qua
rter
◆Non-consolidated ☆Consolidated
1.Highlights of First Half of FY 2005
CORPORATE STRATEGY 2005 CREDIT SAISON CO., LTD. 3
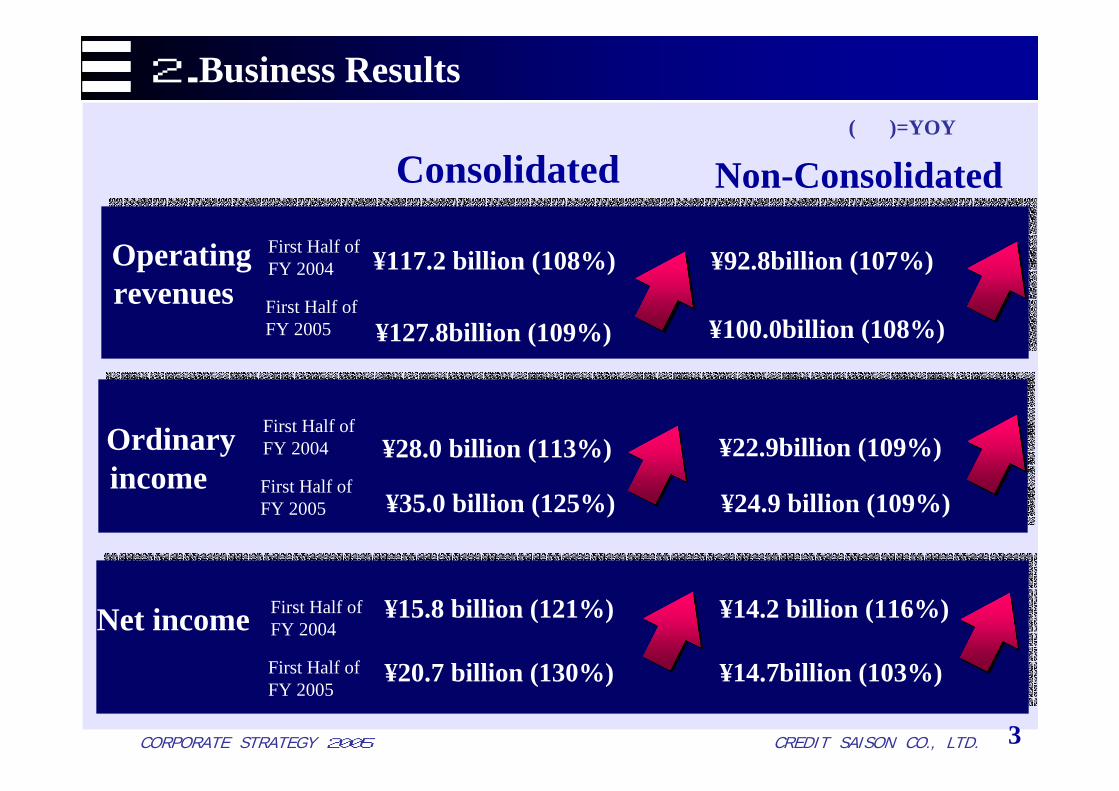
Operating revenues
¥117.2 billion (108%) ¥92.8billion (107%)
¥127.8billion (109%) ¥100.0billion (108%)
First Half of FY 2004
First Half of FY 2005
Ordinary income
¥22.9billion (109%)
¥24.9 billion (109%)¥35.0 billion (125%)
¥28.0 billion (113%)First Half of FY 2004
First Half of FY 2005
¥15.8 billion (121%)Net income ¥14.2 billion (116%)
¥20.7 billion (130%) ¥14.7billion (103%)
First Half of FY 2004
First Half of FY 2005
2.Business Results
Non-ConsolidatedConsolidated( )=YOY

CORPORATE STRATEGY 2005 CREDIT SAISON CO., LTD.
(百万円)
4
13.6%33.629.69.0%127.8117.2Consolidated
-(2.0)(1.6)-(0.6)(0.7)Intercorptransactions
14.1%35.631.28.8%128.3118.0Total
△ 37.7%1.32.1△34.3%2.63.9Others
2.5%1.51.515.1%3.83.3Lease
9.1%3.93.616.3%8.47.2Real estate
113.9%1.20.57.5%8.88.2Entertainment
17.8%27.723.59.9%104.795.3Credit & Finance
YOYFirst Half of FY 2005
First Half of FY 2004YOYFirst Half of
FY 2005First Half of FY 2004
Operating incomeOperating revenuesUnits: Billion yen %
Results by Business Segment
CORPORATE STRATEGY 2005 CREDIT SAISON CO., LTD.
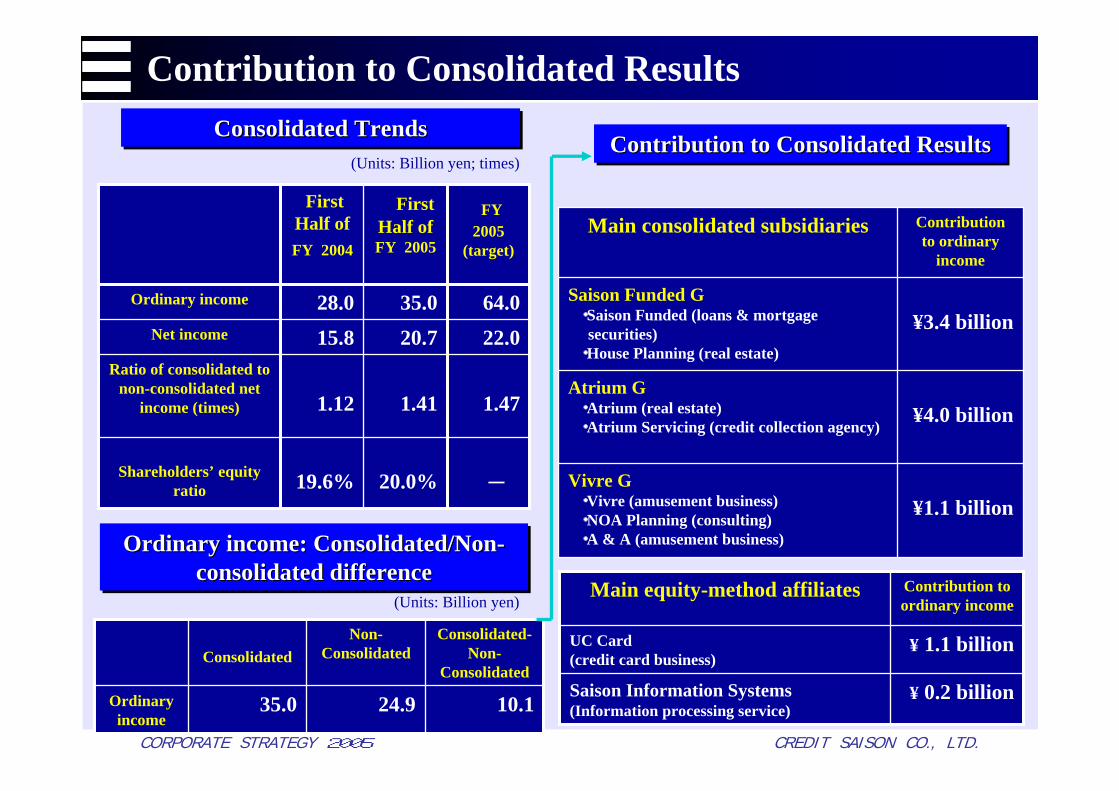
Consolidated TrendsConsolidated TrendsConsolidated Trends
¥ 1.1 billion UC Card(credit card business)
¥ 0.2 billionSaison Information Systems (Information processing service)
Contribution to ordinary income
Main equity-method affiliates
Ordinary income: Consolidated/Non-consolidated difference
Ordinary income: Consolidated/NonOrdinary income: Consolidated/Non--consolidated differenceconsolidated difference
-20.0%19.6%Shareholders’ equity ratio
1.471.411.12
Ratio of consolidated to non-consolidated net
income (times)
22.020.715.8Net income
64.035.028.0Ordinary income
FY 2005
(target)
First Half of FY 2005
First Half of FY 2004
(Units: Billion yen; times)
¥1.1 billionVivre G・Vivre (amusement business)・NOA Planning (consulting)・A & A (amusement business)
Contribution to ordinary
income
Main consolidated subsidiaries
¥4.0 billionAtrium G・Atrium (real estate)・Atrium Servicing (credit collection agency)
¥3.4 billionSaison Funded G・Saison Funded (loans & mortgage
securities)・House Planning (real estate)
10.124.935.0Ordinary income
Consolidated-Non-
Consolidated
Non-ConsolidatedConsolidated
(Units: Billion yen)
Contribution to Consolidated ResultsContribution to Consolidated ResultsContribution to Consolidated Results
Contribution to Consolidated Results
CORPORATE STRATEGY 2005 CREDIT SAISON CO., LTD.
74.3
79.9
85.2
86.6
87
88.7
92.8
97.4
100
103
11.0
0
50
100
150
200
250
300
FY2001 FY2002 FY2003 FY2004 FY2005(projected)
Revised numberSecond half-yearFirst half-year
99.6
115.2
105.3
106.9
109.3
112.0
117.2
123.2
127.8
124.2
14.0
0
50
100
150
200
250
300
FY2001 FY2002 FY2003 FY2004 FY2005(projected)
Revised numberSecond half-yearFirst half-year
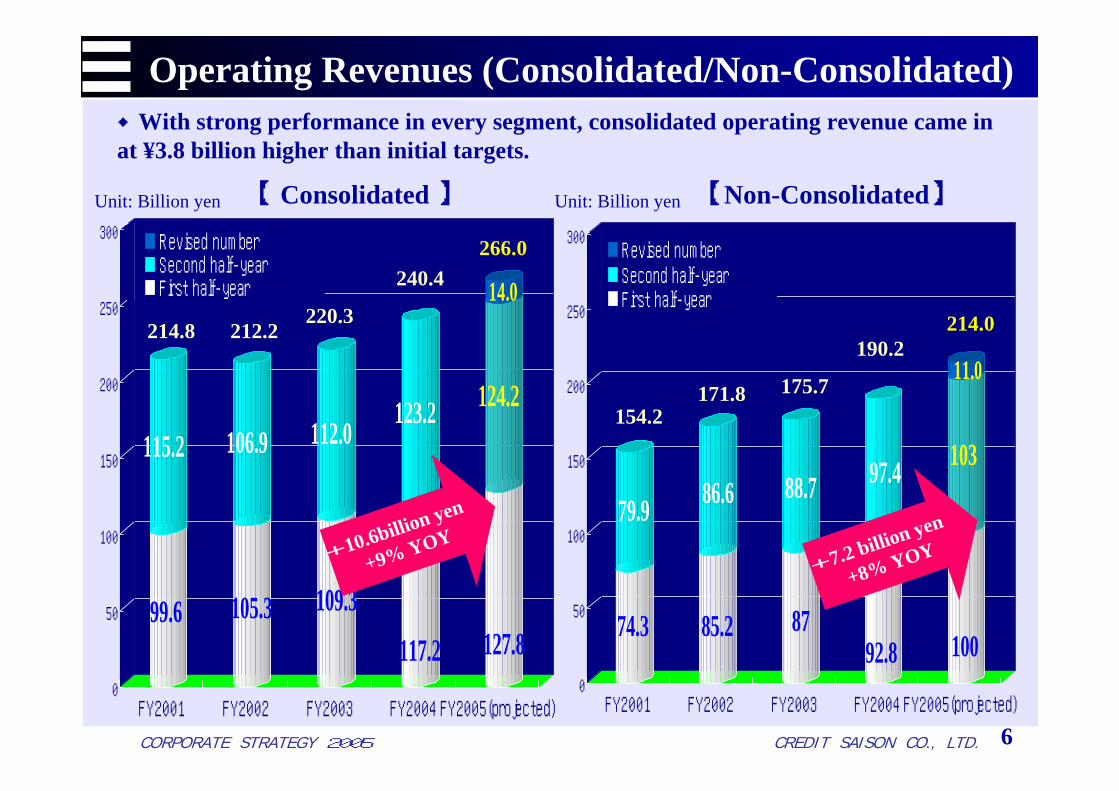
◆With strong performance in every segment, consolidated operating revenue came in at ¥3.8 billion higher than initial targets.
154.2171.8 175.7
214.0190.2
266.0
214.8 212.2220.3
240.4
6
Operating Revenues (Consolidated/Non-Consolidated)
Unit: Billion yen Unit: Billion yen【 Consolidated 】 【Non-Consolidated】
+10.6billion yen
+9% YOY+7.2 billion yen
+8% YOY
CORPORATE STRATEGY 2005 CREDIT SAISON CO., LTD.
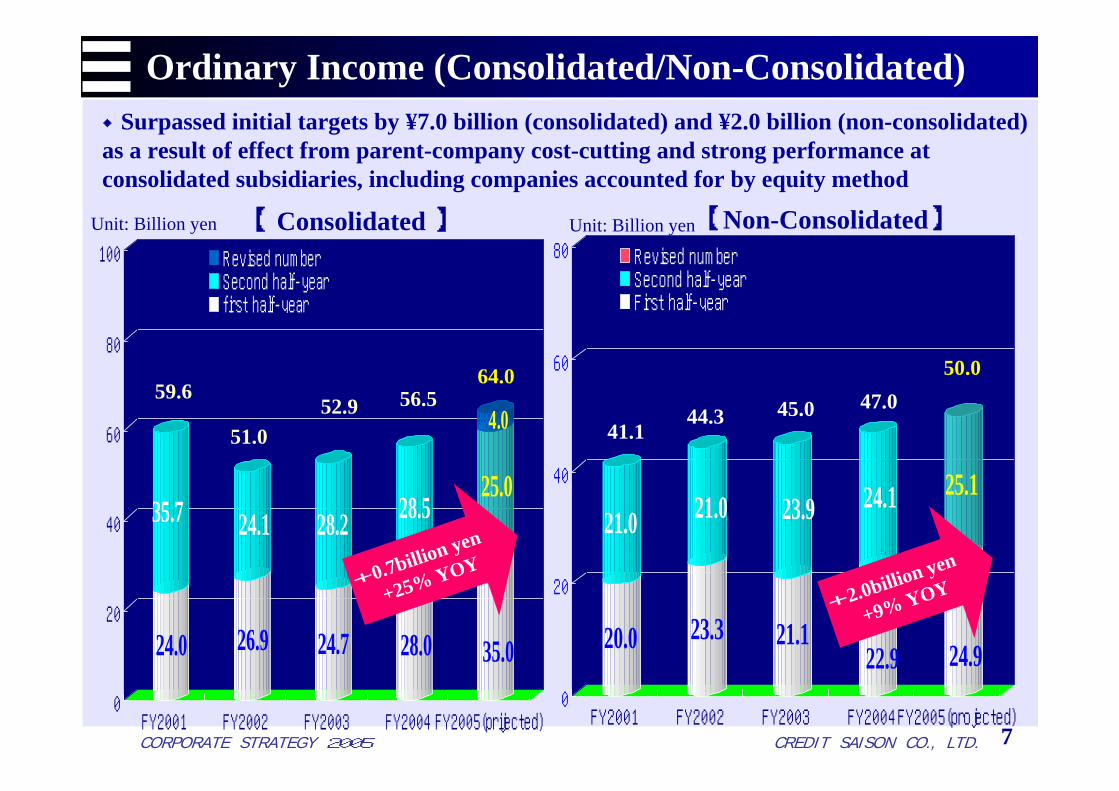
◆Surpassed initial targets by ¥7.0 billion (consolidated) and ¥2.0 billion (non-consolidated) as a result of effect from parent-company cost-cutting and strong performance at consolidated subsidiaries, including companies accounted for by equity method
20.0
21.0
23.3
21.0
21.1
23.9
22.9
24.1
24.9
25.1
0
20
40
60
80
FY2001 FY2002 FY2003 FY2004FY2005(projected)
Revised numberSecond half-yearFirst half-year
41.144.3 45.0
50.047.0
24.0
35.7
26.9
24.1
24.7
28.2
28.0
28.5
35.0
25.0
4.0
0
20
40
60
80
100
FY2001 FY2002 FY2003 FY2004 FY2005(prijected)
Revised numberSecond half-yearfirst half-year
59.6
51.052.9
64.056.5
7
Ordinary Income (Consolidated/Non-Consolidated)
Unit: Billion yen Unit: Billion yen【 Consolidated 】 【Non-Consolidated】
+0.7billion yen
+25% YOY
+2.0billion yen
+9% YOY
CORPORATE STRATEGY 2005 CREDIT SAISON CO., LTD.
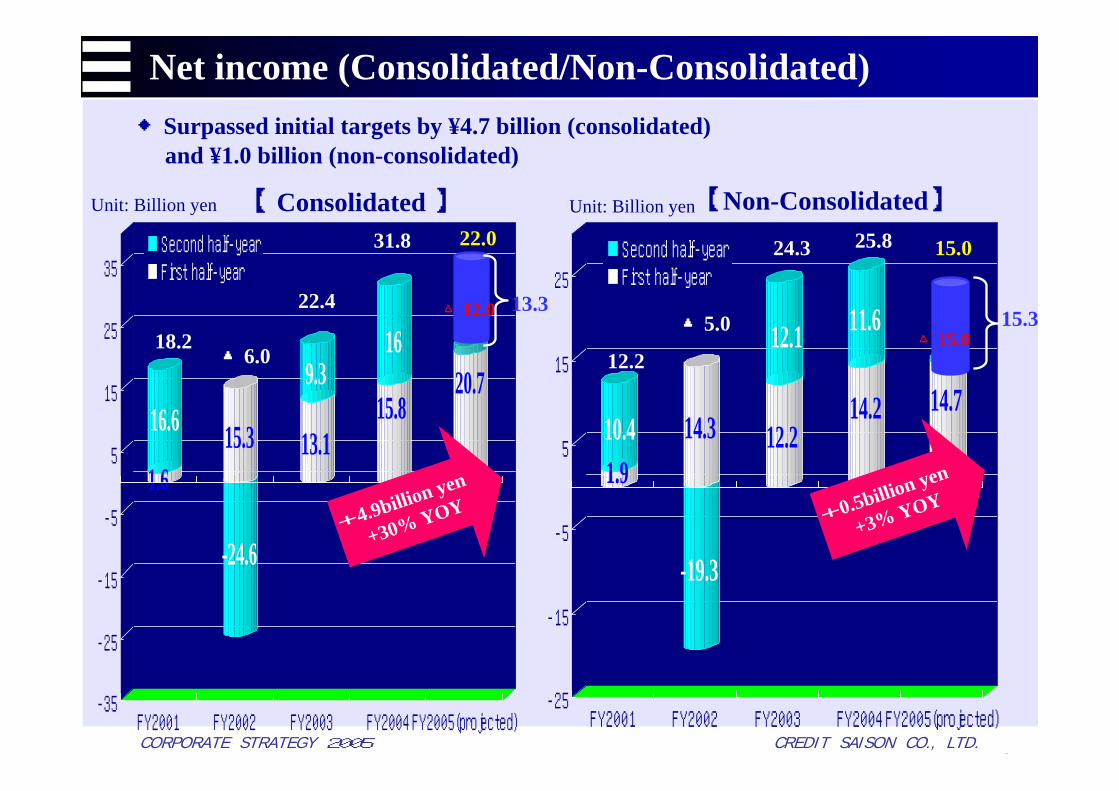
◆Surpassed initial targets by ¥4.7 billion (consolidated)and ¥1.0 billion (non-consolidated)
1.910.4 14.3
-19.3
12.2
12.1
14.2
11.6
14.7
-25
-15
-5
5
15
25
FY2001 FY2002 FY2003 FY2004 FY2005(projected)
Second half-yearFirst half-year
15.0
12.2
▲5.0
24.3 25.8
1.6
16.6 15.3
-24.6
13.1
9.315.8
1620.7
-35
-25
-15
-5
5
15
25
35
FY2001 FY2002 FY2003 FY2004 FY2005(projected)
Second half-yearFirst half-year
▲6.0
22.0
22.4
18.2
31.8
8
△12.0△15.0
13.315.3
Net income (Consolidated/Non-Consolidated)
+4.9billion yen
+30% YOY +0.5billion yen
+3% YOY
Unit: Billion yen Unit: Billion yen【 Consolidated 】 【Non-Consolidated】
CORPORATE STRATEGY 2005 CREDIT SAISON CO., LTD.
1.55%
2.50%
1.97%
1.0%
1.2%
1.4%
1.6%
1.8%
2.0%
2.2%
2.4%
2.6%
2.8%
FY2001 FY2003 Sep 2005
9
2.34%2.48%
2.41%
1.0%
1.2%
1.4%
1.6%
1.8%
2.0%
2.2%
2.4%
2.6%
2.8%
FY2003 FY2004 Sep 2005
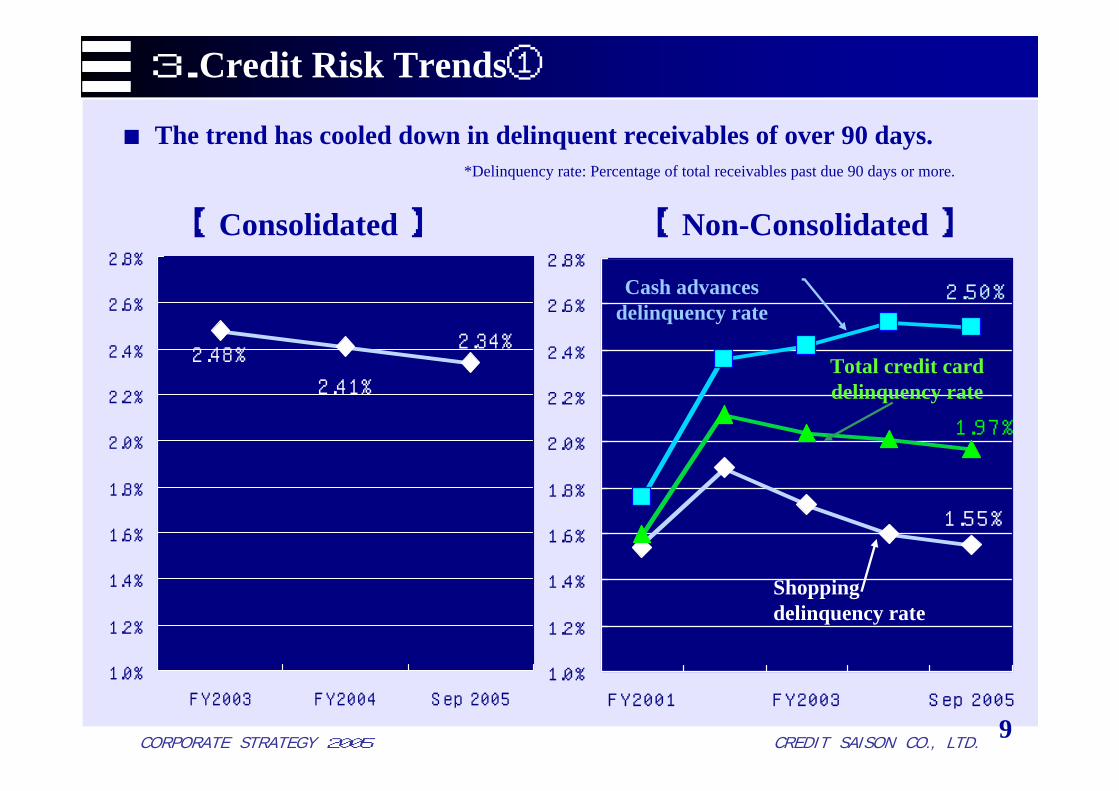
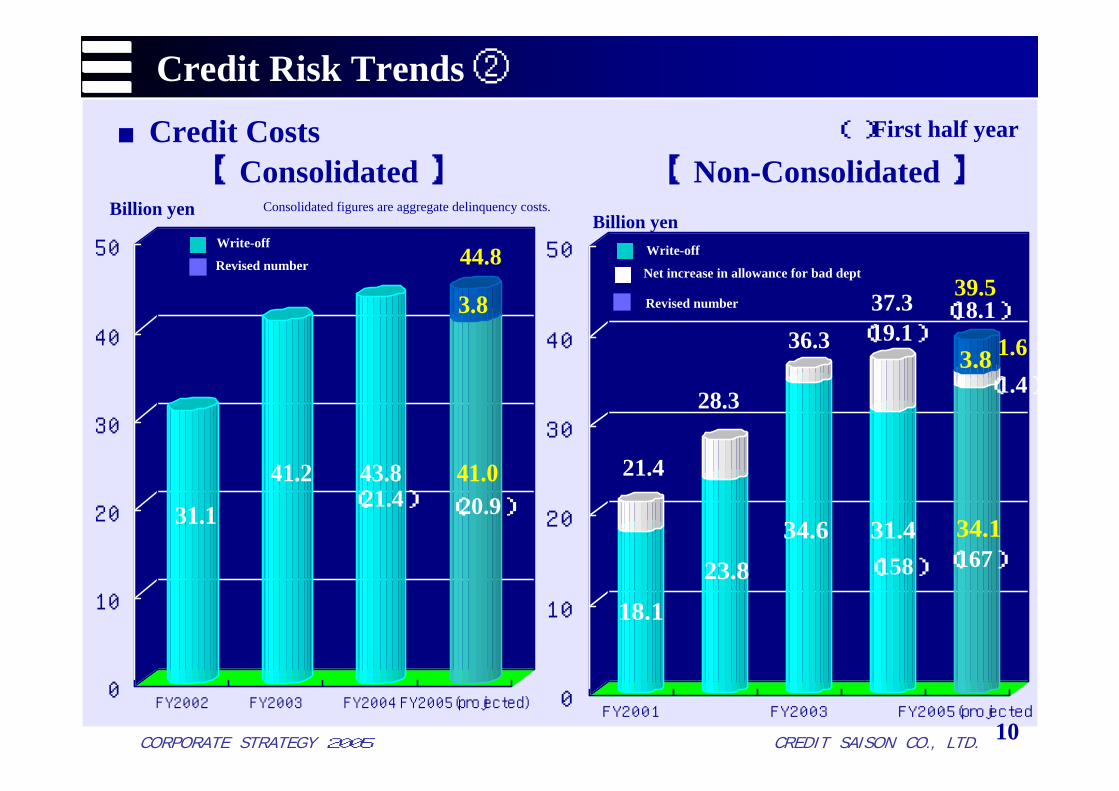
3.Credit Risk Trends①
*Delinquency rate: Percentage of total receivables past due 90 days or more.
■The trend has cooled down in delinquent receivables of over 90 days.
【 Non-Consolidated 】【 Consolidated 】
Shopping delinquency rate
Cash advances delinquency rate
Total credit card delinquency rate
CORPORATE STRATEGY 2005 CREDIT SAISON CO., LTD.
18.123.8
34.6 31.4 34.1
3.8
0
10
20
30
40
50
FY2001 FY2003 FY2005(projected
31.1
41.2 43.8 41.0
3.8
0
10
20
30
40
50
FY2002 FY2003 FY2004 FY2005(projected)
21.4
28.3
10
37.336.3
39.544.8
(19.1)
(21.4)
(158)
(20.9)
(167)
1.6
( )First half year
(1.4)
(18.1)
Credit Risk Trends ②
Billion yenBillion yen
【 Consolidated 】 【 Non-Consolidated 】■Credit Costs
Consolidated figures are aggregate delinquency costs.
Write-off
Net increase in allowance for bad dept
Revised number
Write-off
Revised number
CORPORATE STRATEGY 2005 CREDIT SAISON CO., LTD.
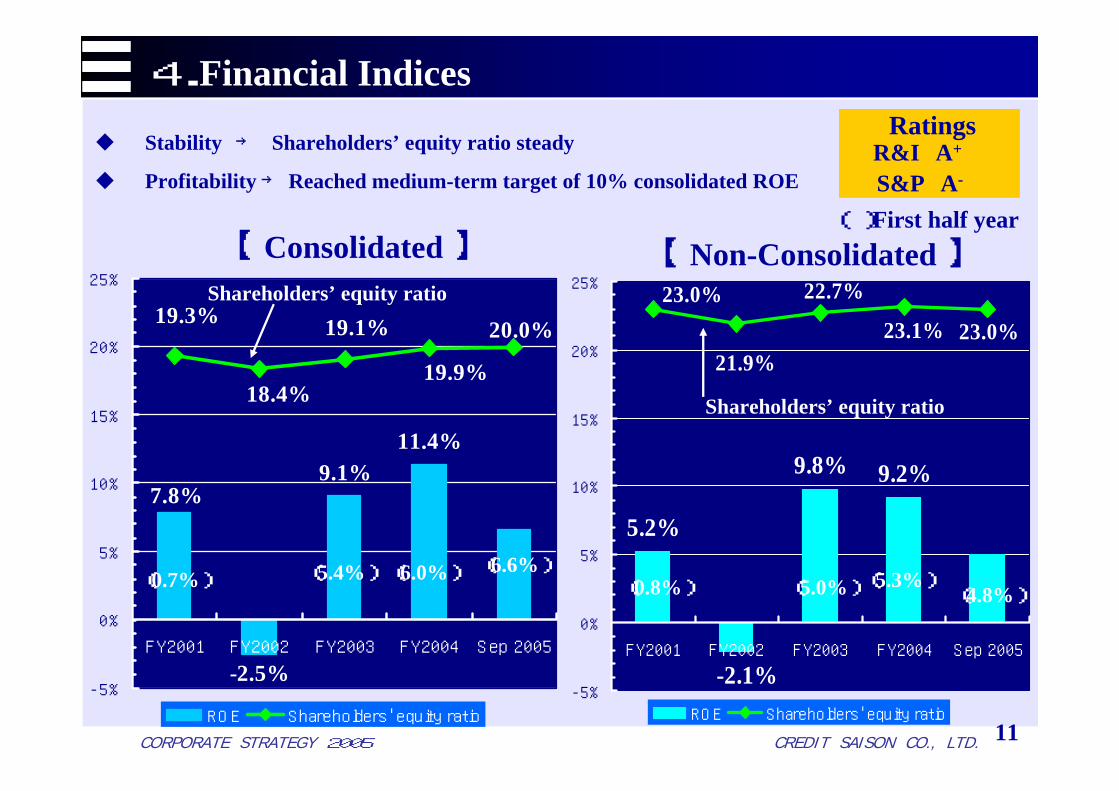
株主資本比率
9.1%11.4%
-2.5%
7.8%
20.0%19.3%
18.4%19.9%
19.1%
-5%
0%
5%
10%
15%
20%
25%
FY2001 FY2002 FY2003 FY2004 Sep 2005
ROE Shareholders' equity ratio
9.2%9.8%
-2.1%
5.2%
23.0%23.0%
21.9%23.1%
22.7%
-5%
0%
5%
10%
15%
20%
25%
FY2001 FY2002 FY2003 FY2004 Sep 2005
ROE Shareholders' equity ratio11
(0.7%) (5.4%) (6.0%) (6.6%)(0.8%) (5.0%) (5.3%)
(4.8%)
( )First half year【 Consolidated 】
Stability → Shareholders’ equity ratio steady
Profitability → Reached medium-term target of 10% consolidated ROE
RatingsR&I A+
S&P A-
4.Financial Indices
【 Non-Consolidated 】Shareholders’ equity ratio
Shareholders’ equity ratio
CORPORATE STRATEGY 2005 CREDIT SAISON CO., LTD. 12
22%
16%
10%
52%
18%
19%
13%
50%
19%
9%
15%
57%
18%
6%
16%
60%
19%
6%
15%
60%
17%
9%
14%
60%
0%
20%
40%
60%
80%
100%
'01 '02 '03 '04 '05.9 '05(projected)
Corporate Bond CP Securitization Dept
15%
15%
11%
59%
17%
7%
12%
64%
16%
5%
13%
66%
17%
5%12%
66%
0%
20%
40%
60%
80%
100%
'02 '03 '04 '05.9
Corporate Bond CP Securitization Dept
Funding Structure ①
【 Consolidated 】 【 Non-Consolidated 】
CORPORATE STRATEGY 2005 CREDIT SAISON CO., LTD. 13
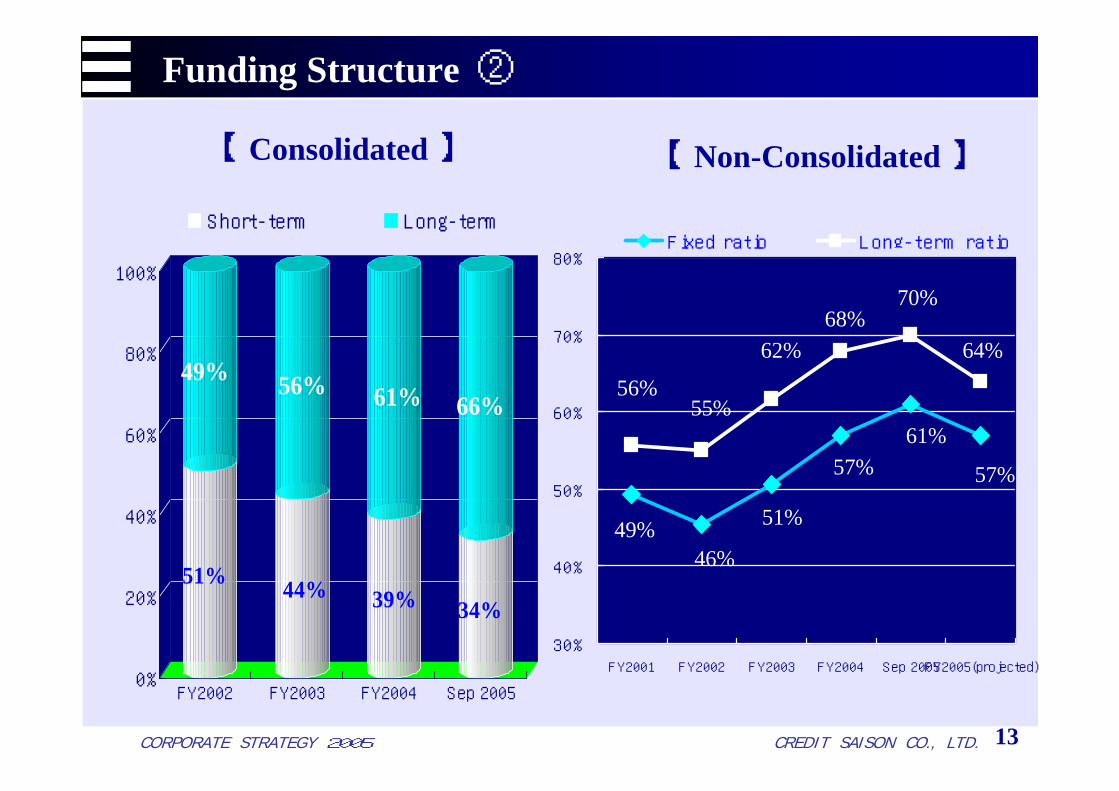
57%
61%57%
49%46%
51%
64%
70%68%
56%55%
62%
30%
40%
50%
60%
70%
80%
FY2001 FY2002 FY2003 FY2004 Sep 2005FY2005(projected)
Fixed ratio Long-term ratio
51%
49%
44%
56%
39%
61%
34%
66%
0%
20%
40%
60%
80%
100%
FY2002 FY2003 FY2004 Sep 2005
Short-term Long-term
Funding Structure ②
【 Non-Consolidated 】【 Consolidated 】
CORPORATE STRATEGY 2005 CREDIT SAISON CO., LTD. 14
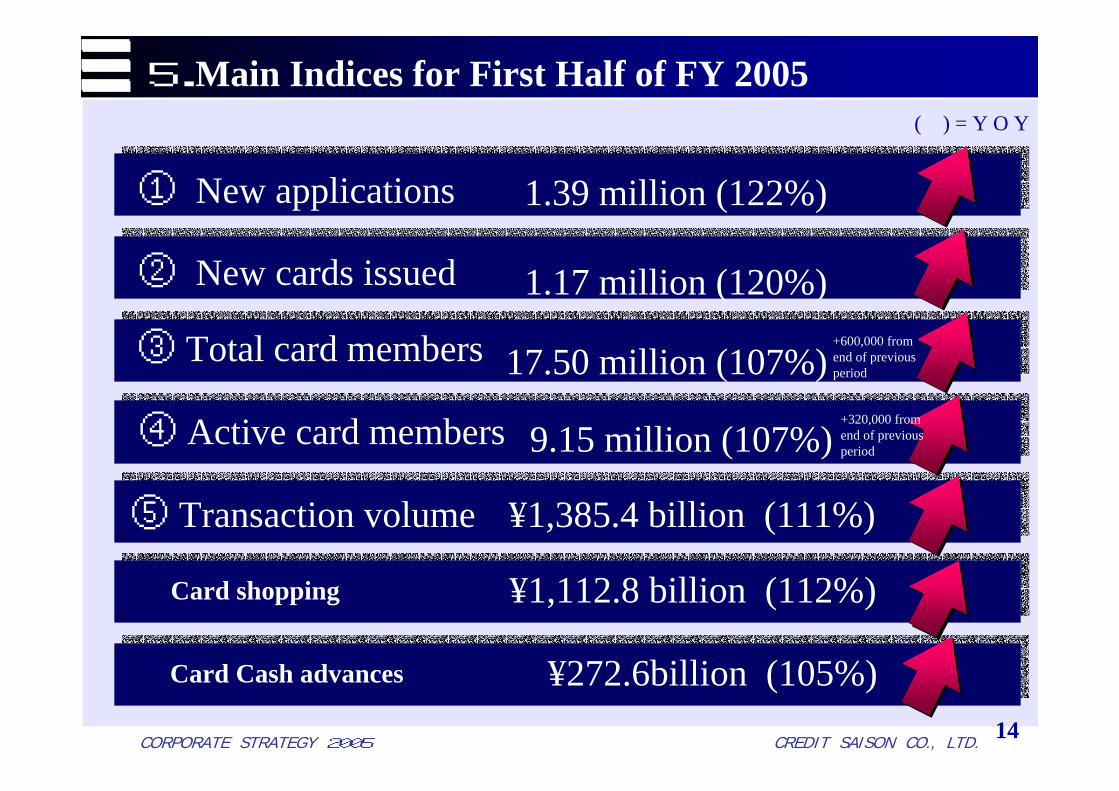
5.Main Indices for First Half of FY 2005 ( ) = Y O Y
① New applications 1.39 million (122%)
② New cards issued 1.17 million (120%)
③ Total card members 17.50 million (107%)+600,000 from end of previous period
④ Active card members 9.15 million (107%)+320,000 from end of previous period
⑤ Transaction volume ¥1,385.4 billion (111%)
Card shopping ¥1,112.8 billion (112%)
Card Cash advances ¥272.6billion (105%)
CORPORATE STRATEGY 2005 CREDIT SAISON CO., LTD.
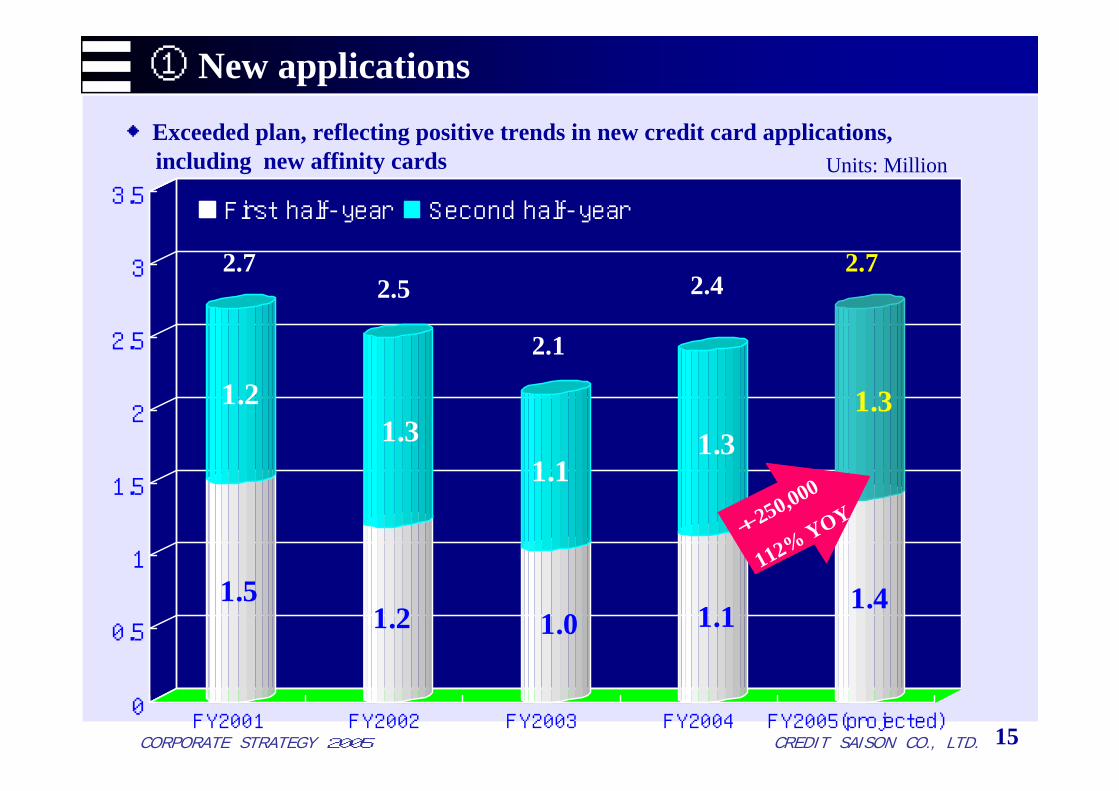
1.5
1.2
1.2
1.3
1.0
1.1
1.1
1.3
1.4
1.3
0
0.5
1
1.5
2
2.5
3
3.5
FY2001 FY2002 FY2003 FY2004 FY2005(projected)
First half-year Second half-year
◆Exceeded plan, reflecting positive trends in new credit card applications, including new affinity cards
2.72.5 2.4
2.1
2.7
15
① New applications
Units: Million
+250,000
112% YOY

CORPORATE STRATEGY 2005 CREDIT SAISON CO., LTD.
◆Nearly in line with plan, reflecting steady new card applications.
1.4
1.2
1.1
1.2
0.9
0.9
1.0
1.2
1.2
1.2
0
0.5
1
1.5
2
2.5
3
FY2001 FY2002 FY2003 FY2004 FY2005(projected)
First half-year Second half-year
2.1
2.52.3
1.9
2.4
16
② New cards issued
+190,000
119% YOY
Units: Million
CORPORATE STRATEGY 2005 CREDIT SAISON CO., LTD.
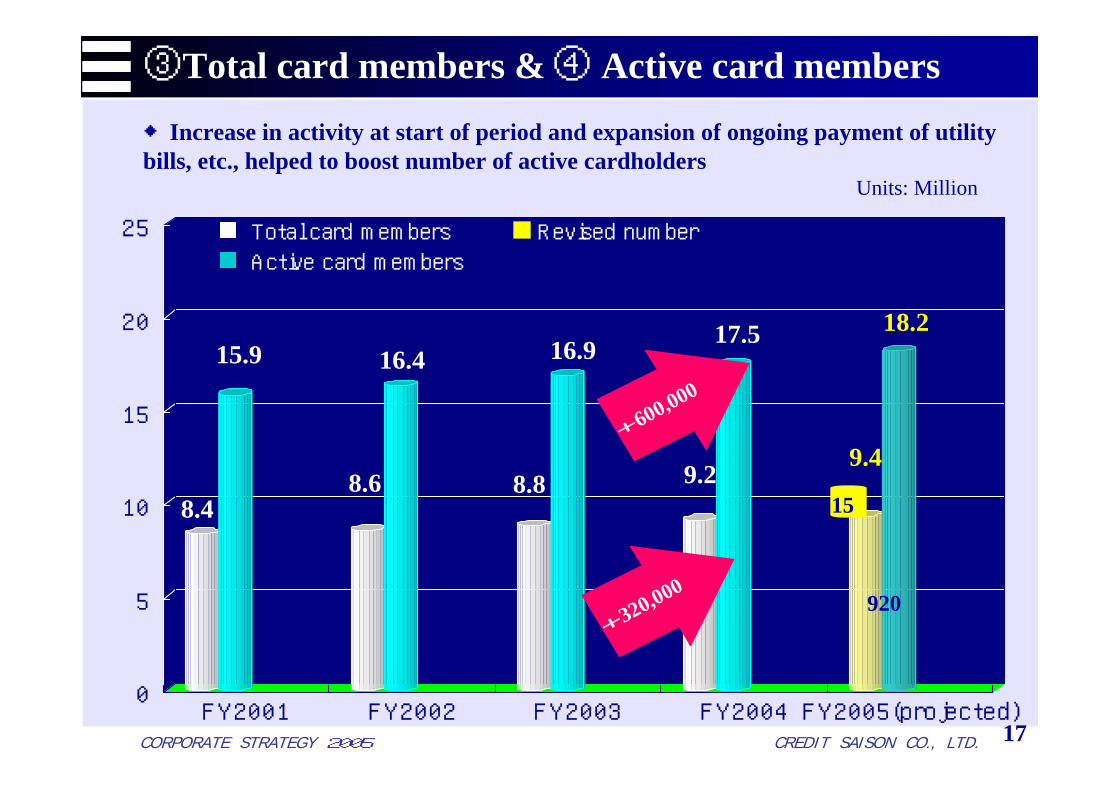
8.4
15.9
8.6
16.4
8.8
16.9
9.2
17.5
9.4
18.2
0
5
10
15
20
25
FY2001 FY2002 FY2003 FY2004 FY2005(projected)
◆Increase in activity at start of period and expansion of ongoing payment of utility bills, etc., helped to boost number of active cardholders
Total card members
Active card members
17
15
Revised number
920
③Total card members & ④ Active card members
Units: Million
+320,000
+600,000
CORPORATE STRATEGY 2005 CREDIT SAISON CO., LTD.
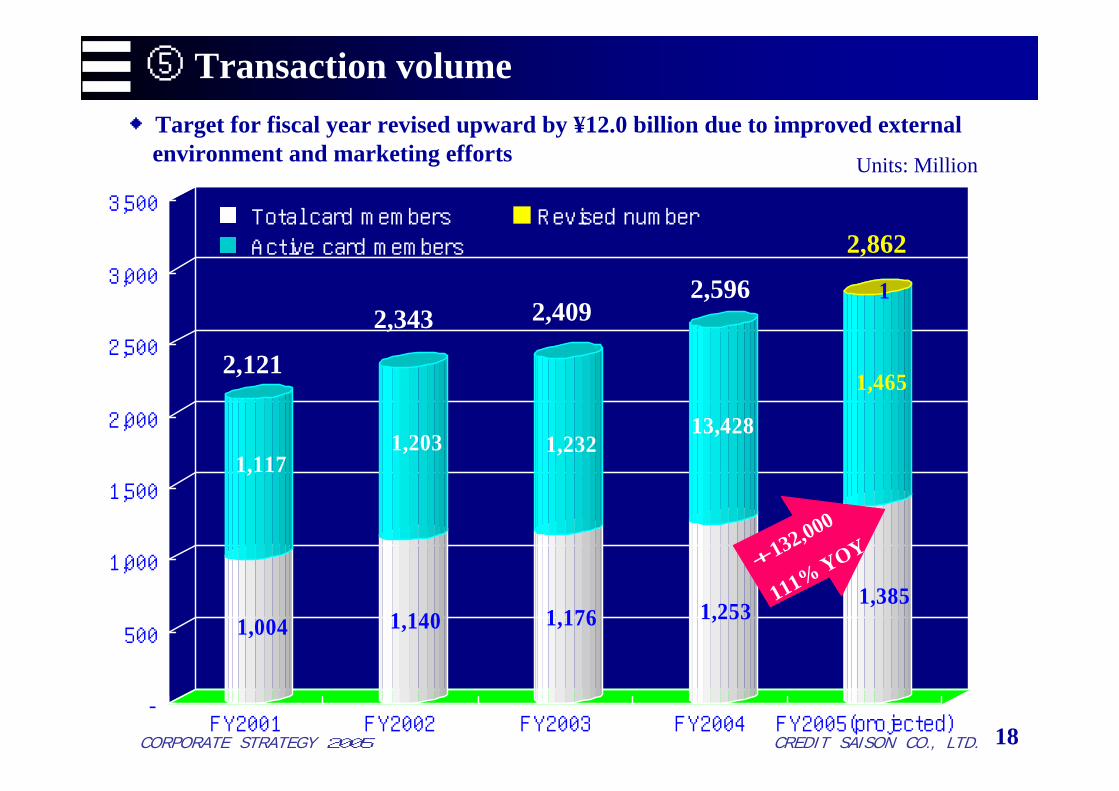
1,004
1,117
1,140
1,203
1,176
1,232
1,253
13,428
1,385
1,465
1
-
500
1,000
1,500
2,000
2,500
3,000
3,500
FY2001 FY2002 FY2003 FY2004 FY2005(projected)
◆Target for fiscal year revised upward by ¥12.0 billion due to improved external environment and marketing efforts
2,121
2,343 2,4092,596
2,862
18
⑤ Transaction volume
Units: Million
Total card members
Active card members
Revised number
+132,000
111% YOY

CORPORATE STRATEGY 2005 CREDIT SAISON CO., LTD.
3,776
1,647
40
3,753
30
1,305
40
3,841
30
1,37640
4,035
301,435
40
4,130
30
1,470
2040
0
100
200
300
400
500
600
700
800
Mar 04 Sep 04 Mar 05 Sep 05 Mar06(projected)
◆Minor adjustment in full-year target due to adjustment of card transaction volume
542 617 629592575
19
△30
Cash advance ABS (Cash advance)
ABS (Shopping) Revised number
⑥ Credit loan outstanding
Units: Million
+194,000
105% YOY
+59,000
104% YOY

CORPORATE STRATEGY 2005 CREDIT SAISON CO., LTD.
Ⅱ.Explanation of Revisions to Performance Estimates
15
50
214
22
64
266
Revised forecast
30
50
203
34
60
252
Previous forecast
・ Trade repay of UC CARD
・ Loss on reorganization of
consolidated subsidiary
―
・ three-month contribution
of UC CARD
・Trade repay ouch CARD・Subsidiary firm resulted of
satisfactory
・Subsidiary firm resulted of
satisfactory・Equity in income of affiliates
・three-month contribution of UC CARD
・Subsidiary firm resulted of
satisfactory
Reason for the Revision of the Performance
Forecasts
△15
-
11
△12
40
14
Amount of change
20
■Explanation of Revisions to Performance EstimatesN
on-C
onso
lidat
ed
Con
solid
ated
Units: Million
Operating revenues
Ordinary income
Net incomeOperating revenuesOrdinary income
Net income
CORPORATE STRATEGY 2005 CREDIT SAISON CO., LTD.
Management Strategies FY 2005Management Strategies FY 2005
CORPORATE STRATEGY 2005 CREDIT SAISON CO., LTD.
CONTENTS◆ Management Strategies FY 2005Management Strategies FY 2005
21
1. Using Alliances to Stimulate the Card Business
2. New Growth Drivers
3. The Group’s Full Power and Future Initiatives
CORPORATE STRATEGY 2005 CREDIT SAISON CO., LTD.
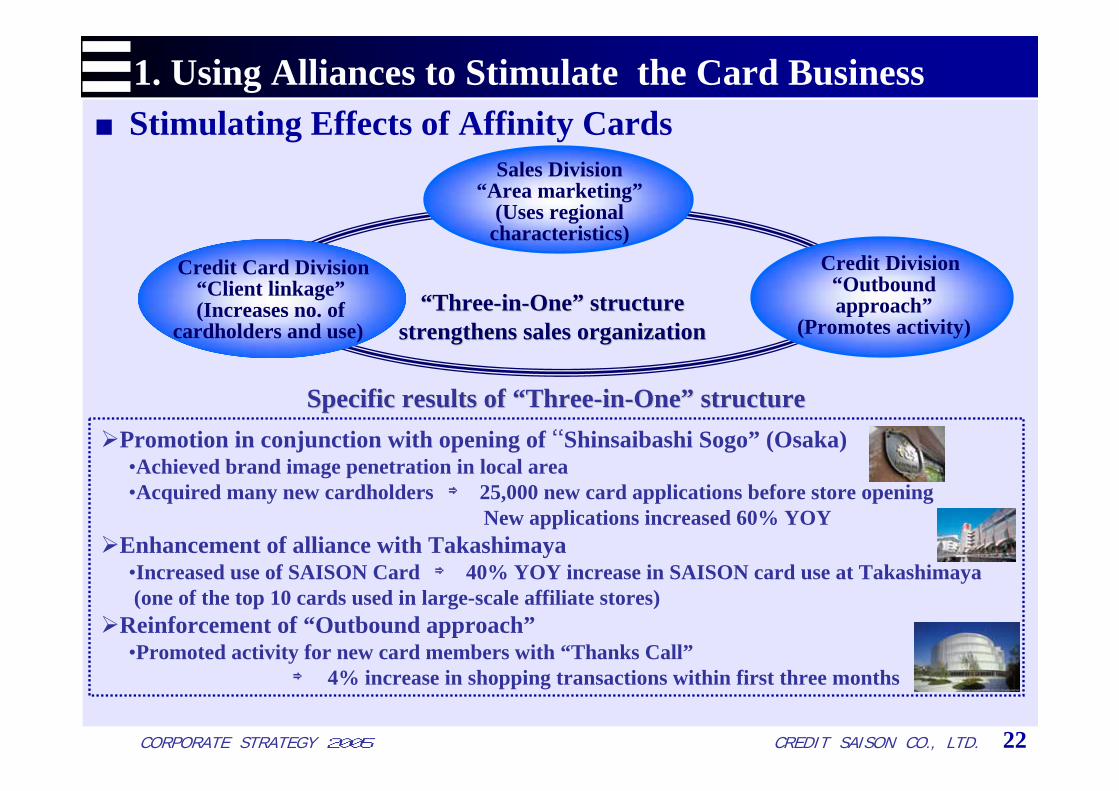
1. Using Alliances to Stimulate the Card Business■Stimulating Effects of Affinity Cards
22
Promotion in conjunction with opening of “Shinsaibashi Sogo” (Osaka)•Achieved brand image penetration in local area•Acquired many new cardholders ⇒ 25,000 new card applications before store opening
New applications increased 60% YOYEnhancement of alliance with Takashimaya•Increased use of SAISON Card ⇒ 40% YOY increase in SAISON card use at Takashimaya (one of the top 10 cards used in large-scale affiliate stores)
Reinforcement of “Outbound approach”•Promoted activity for new card members with “Thanks Call”
⇒ 4% increase in shopping transactions within first three months
““ThreeThree--inin--OneOne”” structurestructurestrengthens sales organizationstrengthens sales organization
Sales Division“Area marketing”
(Uses regional characteristics)
Credit Card Division“Client linkage”(Increases no. of
cardholders and use)
Credit Division“Outbound approach”
(Promotes activity)
Specific results of Specific results of ““ThreeThree--inin--OneOne”” structurestructure
CORPORATE STRATEGY 2005 CREDIT SAISON CO., LTD.
Use of credit card to pay mobile phone bills
Number of users: approx. 800,000 membersUsage rate (proportion of active cardholders): approx. 9% Phone companies: NTT DoCoMo, KDDI, Tu-ka Cellular, au, Vodafone,
WILLCOM
1. Using Alliances to Stimulate the Card Business■Becoming No. 1 Card to Activate Card Use
23
Amount charged monthly
Yearly account value
Number of cardholders using card for recurring payments (utility fees, mobile phone bills, newspaper subscriptions, cardholders’ insurance premiums)
Recurring payment users: 1,320,000 members (+ members 45% YOY )
Usage ratio (proportion of active cardholders): 14% (+ members 4% YOY)
¥38,000
¥463,000
¥45,000
¥546,000
¥7,000
¥83,000
Six-month period before using recurring payment
Six-month period after commencing use
Effect
Recurring payment useRecurring payment use
Effect on card use (comparison of use six months before to six months after commencement)
Note: Figures exclude charges for mobile phone use.
(as of Sept. 2005)
↑
↑
CORPORATE STRATEGY 2005 CREDIT SAISON CO., LTD.
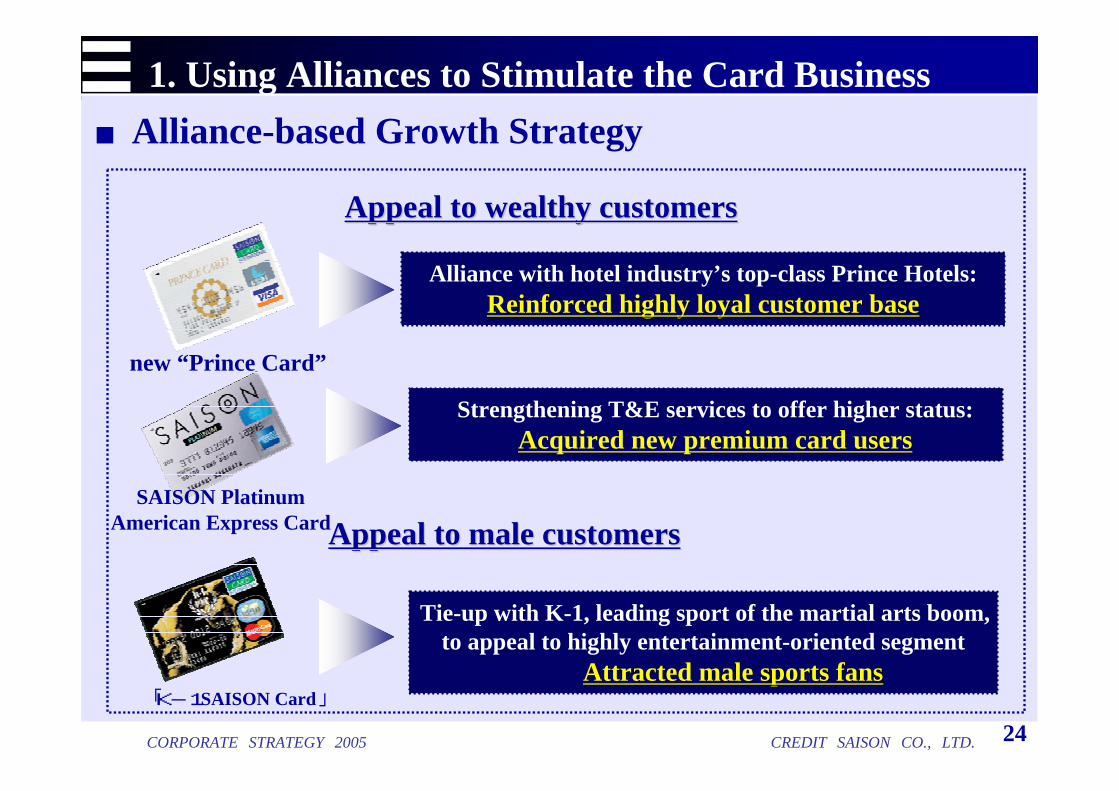
1. Using Alliances to Stimulate the Card Business■Alliance-based Growth Strategy
24
Appeal to wealthy customersAppeal to wealthy customers
Appeal to male customersAppeal to male customers
Alliance with hotel industry’s top-class Prince Hotels: Reinforced highly loyal customer baseReinforced highly loyal customer base
Strengthening T&E services to offer higher status: Acquired new premium card users
Tie-up with K-1, leading sport of the martial arts boom, to appeal to highly entertainment-oriented segment
Attracted male sports fansAttracted male sports fans
new “Prince Card”
SAISON Platinum American Express Card
「K-1SAISON Card」
CORPORATE STRATEGY 2005 CREDIT SAISON CO., LTD.
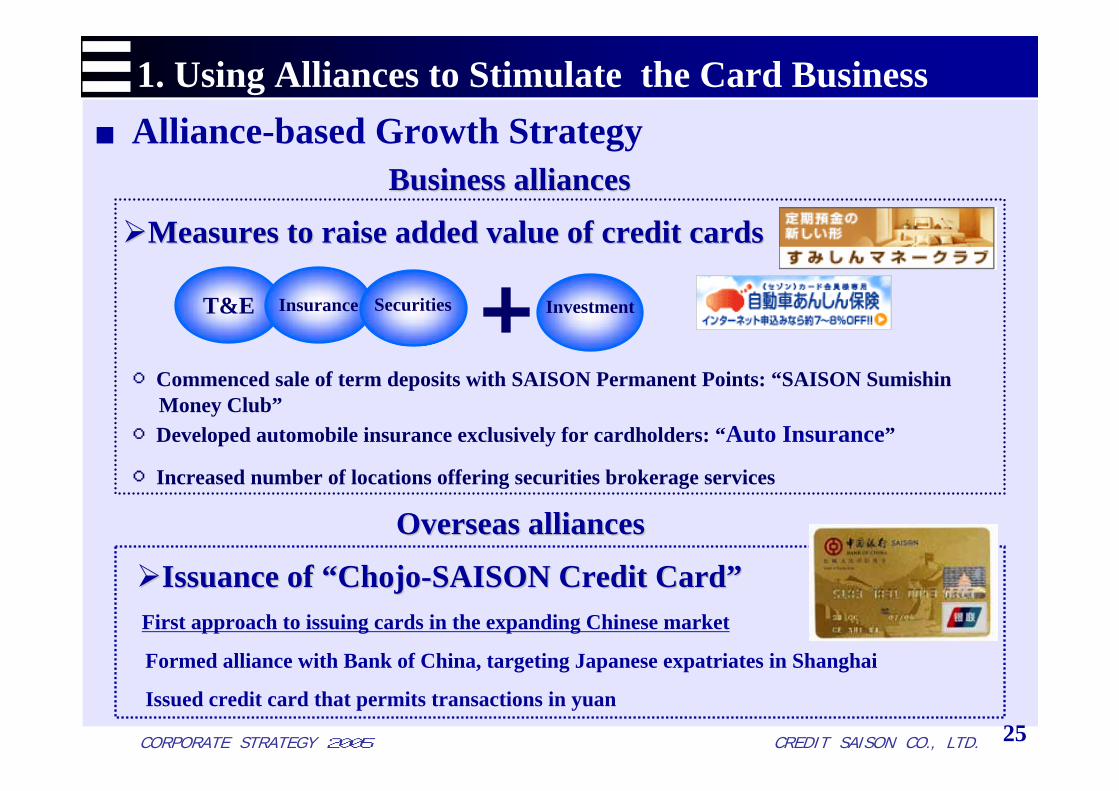
1. Using Alliances to Stimulate the Card Business■Alliance-based Growth Strategy
25
First approach to issuing cards in the expanding Chinese market
Formed alliance with Bank of China, targeting Japanese expatriates in Shanghai
Issued credit card that permits transactions in yuan
Business alliancesBusiness alliances
Overseas alliancesOverseas alliances
Measures to raise added value of credit cardsMeasures to raise added value of credit cards
Issuance of Issuance of ““ChojoChojo--SAISON Credit CardSAISON Credit Card””
T&E Insurance Securities Investment
○Commenced sale of term deposits with SAISON Permanent Points: “SAISON Sumishin Money Club”
○Developed automobile insurance exclusively for cardholders: “Auto Insurance”
○Increased number of locations offering securities brokerage services
CORPORATE STRATEGY 2005 CREDIT SAISON CO., LTD.
Customer segment
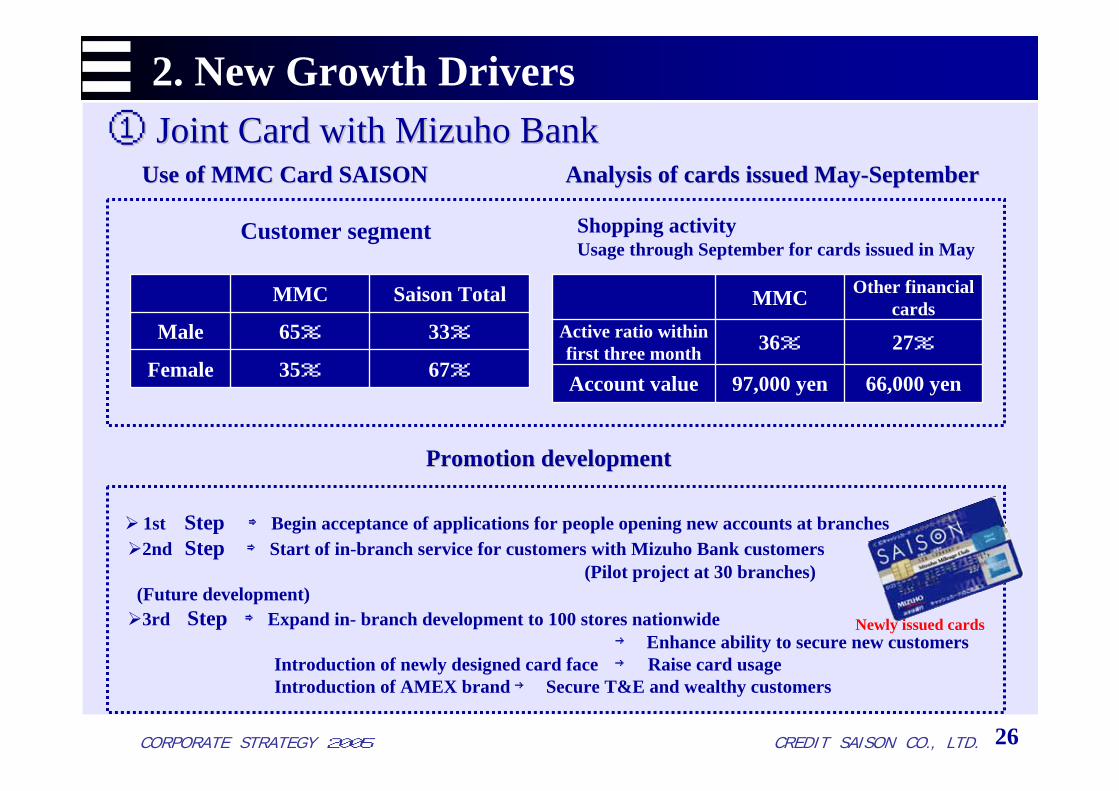
①① Joint Card with Joint Card with Mizuho BankMizuho Bank2. New Growth Drivers
33%65%Male
35%
MMC
67%Female
Saison Total
26
Use of MMC Card SAISON Analysis of cards iUse of MMC Card SAISON Analysis of cards issued Mayssued May--SeptemberSeptember
1st Step ⇒ Begin acceptance of applications for people opening new accounts at branches2nd Step ⇒ Start of in-branch service for customers with Mizuho Bank customers
(Pilot project at 30 branches) (Future development)3rd Step ⇒ Expand in- branch development to 100 stores nationwide
→ Enhance ability to secure new customersIntroduction of newly designed card face → Raise card usage Introduction of AMEX brand → Secure T&E and wealthy customers
Promotion developmentPromotion development
Newly issued cards
27%36%Active ratio within first three month
97,000 yen
MMC
66,000 yenAccount value
Other financial cards
Shopping activityUsage through September for cards issued in May
CORPORATE STRATEGY 2005 CREDIT SAISON CO., LTD.
2. New Growth Drivers
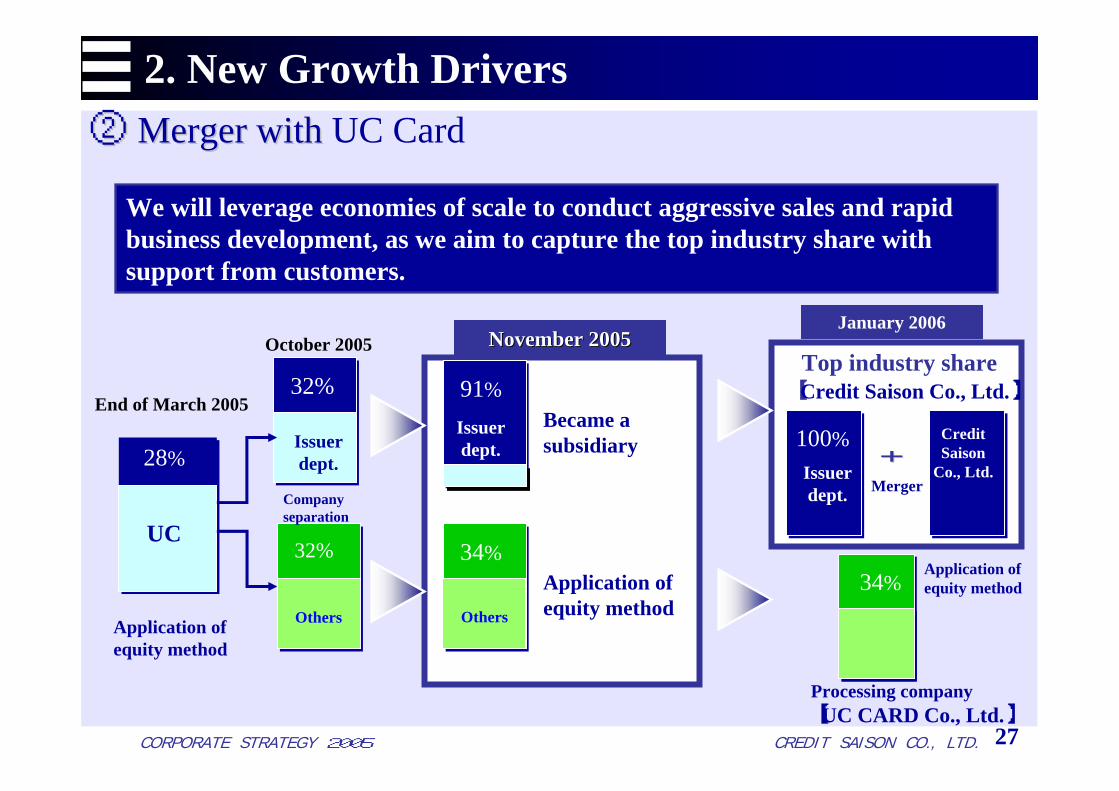
27
28%
32%
32%
Issuer dept.
Others
100%
34%
Merger
Processing company【UC CARD Co., Ltd.】
Application of equity method
Company separation
UC
91%
Issuer dept.
34%
Others
Became a subsidiary
Application of equity method
November 2005November 2005January 2006
End of March 2005
October 2005
②② Merger with Merger with UC Card
We will leverage economies of scale to conduct aggressive sales and rapid business development, as we aim to capture the top industry share with support from customers.
++Credit Saison
Co., Ltd.
Top industry share【Credit Saison Co., Ltd.】
Application of equity method
Issuer dept.
CORPORATE STRATEGY 2005 CREDIT SAISON CO., LTD.
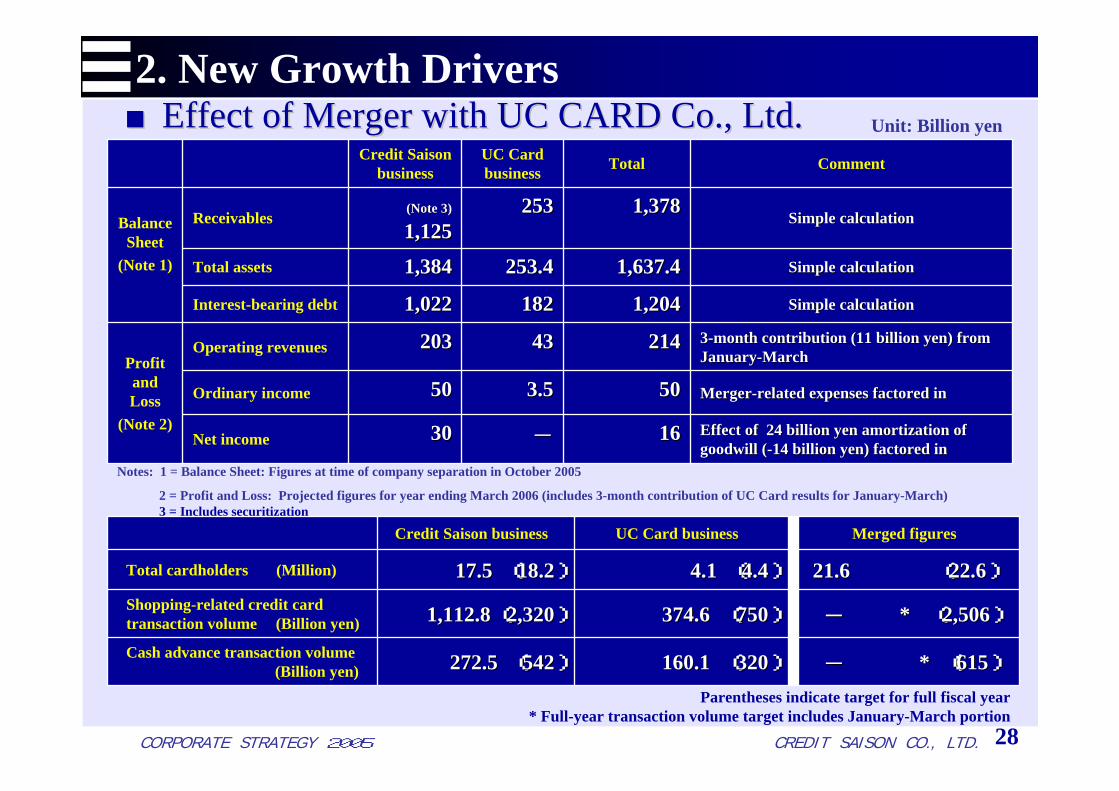
■■Effect of Merger with UC CARD Co., Ltd.Effect of Merger with UC CARD Co., Ltd.2. New Growth Drivers
Net income
Ordinary income
Operating revenues
Interest-bearing debt
Total assets
Receivables
MergerMerger--related expenses factored inrelated expenses factored in50503.53.55050
33--month contribution (11 billion yen) from month contribution (11 billion yen) from JanuaryJanuary--MarchMarch
2142144343203203Profit and Loss
(Note 2)
Simple calculationSimple calculation1,2041,2041821821,0221,022
Simple calculationSimple calculation1,637.41,637.4253.4253.41,3841,384
Simple calculationSimple calculation1,3781,378253253(Note 3)(Note 3)
1,1251,125Balance Sheet
(Note 1)
Effect of 24 billion yen amortization of Effect of 24 billion yen amortization of goodwill (goodwill (--14 billion yen) factored in14 billion yen) factored in
Comment
1616--3030
TotalUC Card business
Credit Saison business
28
Notes: 1 = Balance Sheet: Figures at time of company separation in October 2005
2 = Profit and Loss: Projected figures for year ending March 2006 (includes 3-month contribution of UC Card results for January-March)3 = Includes securitization
Unit: Billion yen
21.621.6 ((22.622.6))4.14.1 ((4.44.4))17.517.5 ((18.218.2))Total cardholders (Million)
-- * * ((615615))160.1 160.1 ((320320))272.5272.5 ((542542))Cash advance transaction volume(Billion yen)
-- * * ((2,5062,506))374.6 374.6 ((750750))1,112.8 1,112.8 ((2,3202,320))Shopping-related credit card transaction volume (Billion yen)
Merged figuresUC Card businessCredit Saison business
Parentheses indicate target for full fiscal year * Full-year transaction volume target includes January-March portion
CORPORATE STRATEGY 2005 CREDIT SAISON CO., LTD.
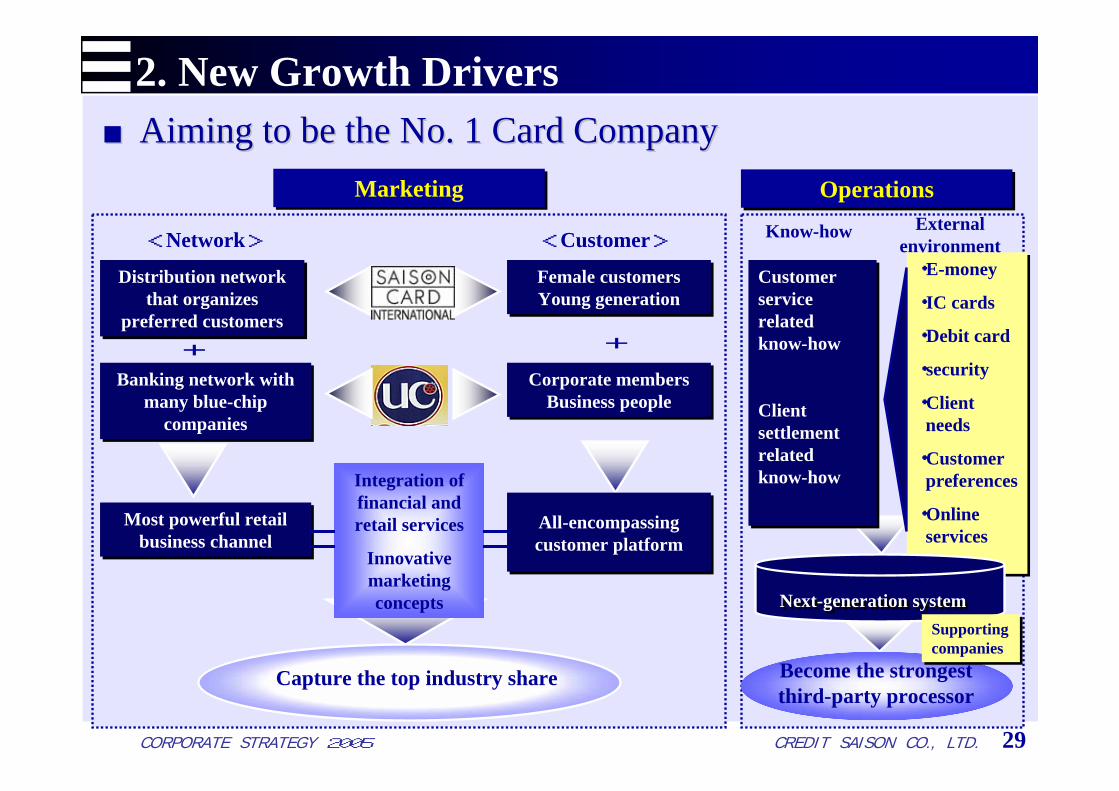
■■Aiming to be the No. 1 Card CompanyAiming to be the No. 1 Card Company2. New Growth Drivers
29
Distribution network that organizes
preferred customers
Distribution network that organizes
preferred customers
MarketingMarketing
Female customersYoung generationFemale customersYoung generation
Integration of financial and retail services
Innovative marketing concepts
Banking network with many blue-chip
companies
Banking network with many blue-chip
companies
Corporate membersBusiness people
Corporate membersBusiness people
Most powerful retail business channel
Most powerful retail business channel
All-encompassing customer platformAll-encompassing customer platform
+ +
<Customer><Network>
OperationsOperations
Customer service related know-how
Client settlement related know-how
Customer service related know-how
Client settlement related know-how
・E-money
・IC cards
・Debit card
・security
・Client needs
・Customer preferences
・Online services
・E-money
・IC cards
・Debit card
・security
・Client needs
・Customer preferences
・Online services
Capture the top industry share Become the strongest third-party processor
External environment
Know-how
Next-generation systemNext-generation systemSupporting companiesSupporting companies
CORPORATE STRATEGY 2005 CREDIT SAISON CO., LTD.
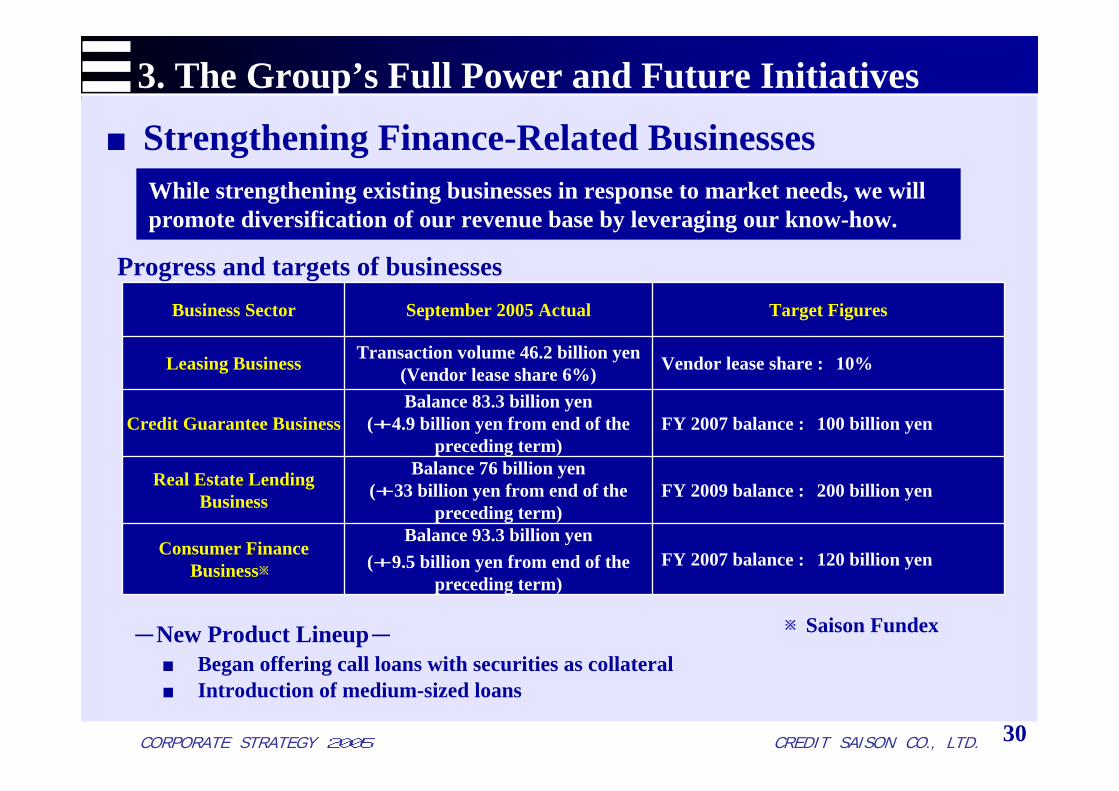
3. The Group’s Full Power and Future Initiatives
Progress and targets of businesses
■Strengthening Finance-Related Businesses
※Saison Fundex
Target FiguresSeptember 2005 ActualBusiness Sector
Balance 93.3 billion yen(+9.5 billion yen from end of the
preceding term)
Balance 76 billion yen(+33 billion yen from end of the
preceding term)
Balance 83.3 billion yen(+4.9 billion yen from end of the
preceding term)
Transaction volume 46.2 billion yen(Vendor lease share 6%)
FY 2007 balance : 120 billion yenConsumer Finance Business※
FY 2009 balance : 200 billion yenReal Estate Lending Business
FY 2007 balance : 100 billion yenCredit Guarantee Business
Vendor lease share : 10%Leasing Business
-New Product Lineup-■ Began offering call loans with securities as collateral ■ Introduction of medium-sized loans
30
While strengthening existing businesses in response to market needs, we will promote diversification of our revenue base by leveraging our know-how.
CORPORATE STRATEGY 2005 CREDIT SAISON CO., LTD.
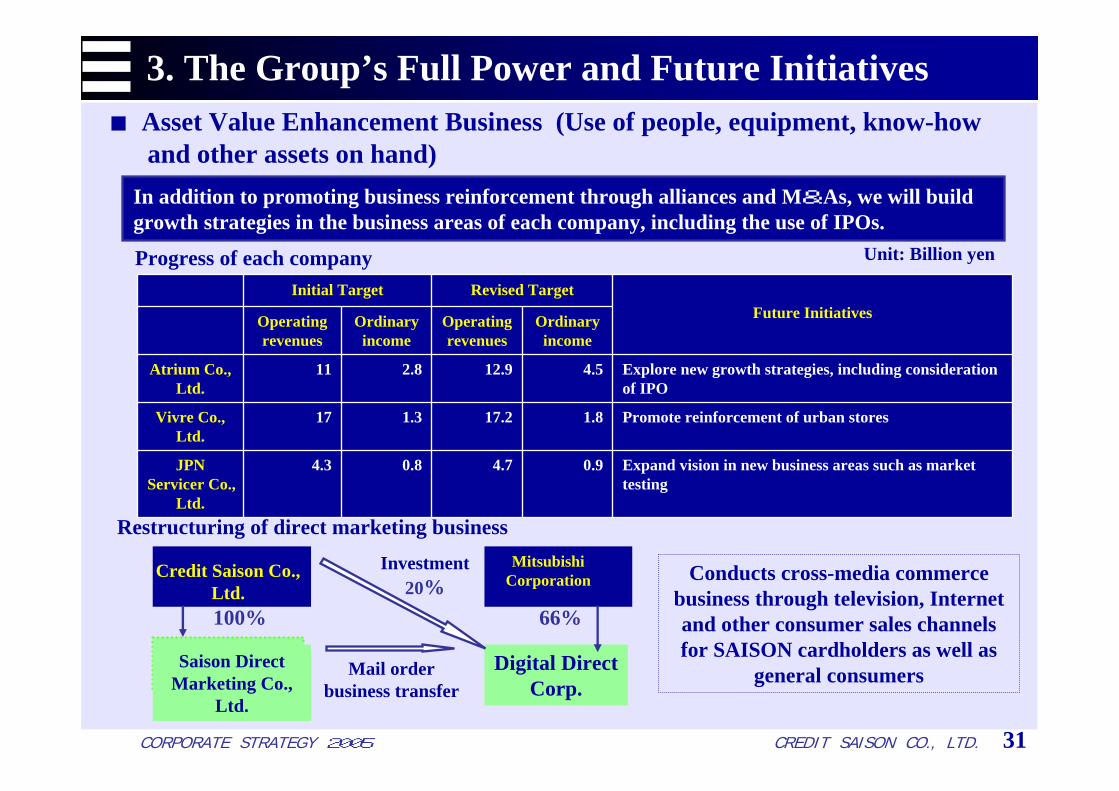
3. The Group’s Full Power and Future Initiatives■Asset Value Enhancement Business (Use of people, equipment, know-how
and other assets on hand)
31
In addition to promoting business reinforcement through alliances and M&As, we will build growth strategies in the business areas of each company, including the use of IPOs.
Progress of each company
Expand vision in new business areas such as market testing
0.94.70.84.3JPN Servicer Co.,
Ltd.
Promote reinforcement of urban stores1.817.21.317Vivre Co., Ltd.
Explore new growth strategies, including consideration of IPO
4.512.92.811Atrium Co.,Ltd.
Ordinary income
Operating revenues
Ordinaryincome
Operating revenues
Future InitiativesRevised TargetInitial Target
Restructuring of direct marketing business
Conducts cross-media commerce business through television, Internet and other consumer sales channels for SAISON cardholders as well as
general consumers
Credit Saison Co.,Ltd.
Saison Direct Marketing Co.,
Ltd.
Mitsubishi Corporation
Digital Direct Corp.
Investment 20%
Mail order business transfer
66%100%
Unit: Billion yen
CORPORATE STRATEGY 2005 CREDIT SAISON CO., LTD.
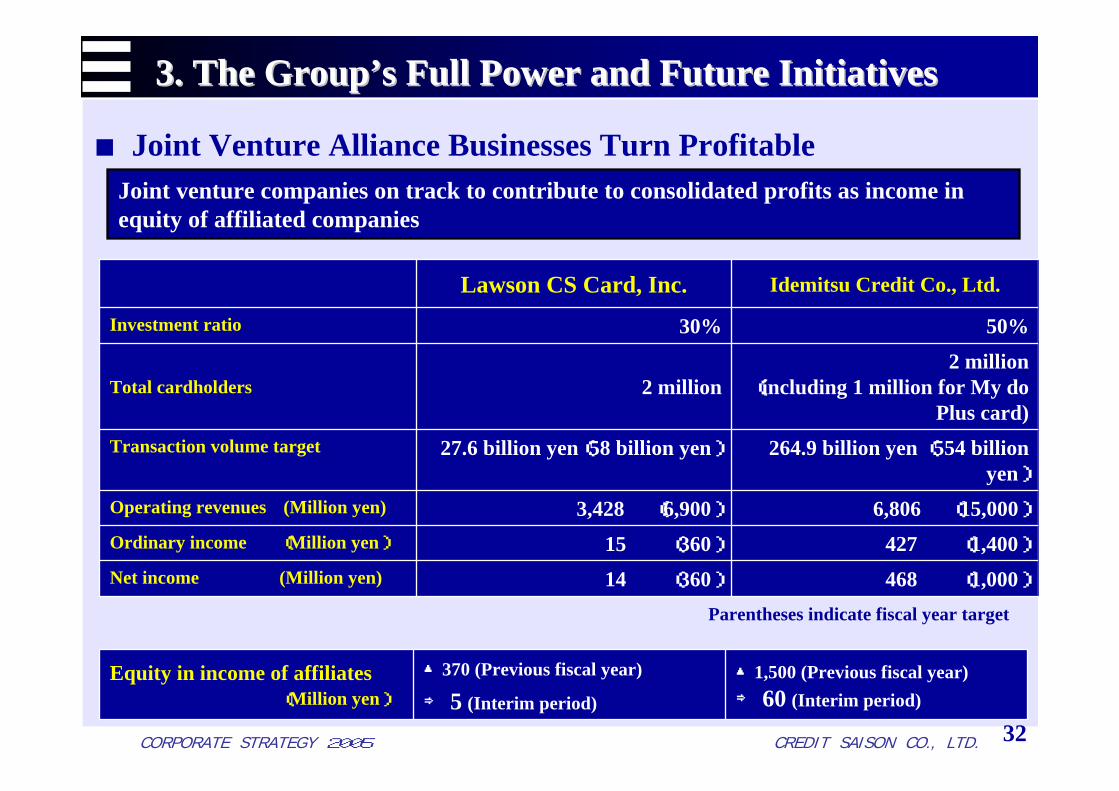
3. The Group3. The Group’’s Full Power and Future Initiativess Full Power and Future Initiatives
■Joint Venture Alliance Businesses Turn Profitable
32
468 (1,000)14 (360)Net income (Million yen)
50%30%Investment ratio
6,806 (15,000)3,428 (6,900)Operating revenues (Million yen)
264.9 billion yen (554 billion yen)
27.6 billion yen(58 billion yen)Transaction volume target
2 million (including 1 million for My do
Plus card)2 million Total cardholders
427 (1,400)15 (360)Ordinary income (Million yen)
Idemitsu Credit Co., Ltd.Lawson CS Card, Inc.
▲1,500 (Previous fiscal year)⇒ 60 (Interim period)
▲370 (Previous fiscal year)
⇒ 5 (Interim period)Equity in income of affiliates
(Million yen)
Joint venture companies on track to contribute to consolidated profits as income in equity of affiliated companies
Parentheses indicate fiscal year target