Embed Size (px)
Citation preview

COORDINATING RESEARCH COUNCIL INC 3650 MANSELL ROADSUITE 140ALPHARETTA GA 30022
CRC Report No E-23-9 Chicago Year 7
On-Road Remote Sensing of Automobile Emissions in the Chicago
Area Year 7 September 2006
Final Report
February 2007
On-Road Remote Sensing of Automobile Emissions in the Chicago Area Year 7 September 2006 Gary A Bishop Ryan Stadtmuller and Donald H Stedman Department of Chemistry and Biochemistry University of Denver Denver CO 80208 February 2007 Prepared for Coordinating Research Council Inc 3650 Mansell Road Suite 140 Alpharetta Georgia 30022 Contract No E-23-9
On-Road Remote Sensing in the Chicago Area Year 7 2
On-Road Remote Sensing in the Chicago Area Year 7 3
EXECUTIVE SUMMARY
The University of Denver has completed the nine years of a multi-year remote sensing study in the Chicago area with measurements made in September of 1997 through 2000 2002 2004 and 2006 The remote sensor used in this study is capable of measuring the ratios of CO HC and NO to CO2 in motor vehicle exhaust From these ratios we calculate the percent concentrations of CO CO2 HC and NO in the exhaust that would be observed by a tailpipe probe corrected for water and any excess oxygen not involved in combustion Mass emissions per mass or volume of fuel can also be determined The system used in this study was configured to determine the speed and acceleration of the vehicle and was accompanied by a video system to record the license plate of the vehicle The seventh campaign of this study involved fieldwork on September 12 - 15 2006 conducted at the on-ramp from Algonquin Rd to eastbound I-290 in northwest Chicago For the 2006 measurements a database was compiled containing 22200 records for which the State of Illinois provided makes and model year information All of these records contain valid measurements for at least CO and CO2 A total of 22149 records contain valid measurements of CO HC and NO The database as well as others compiled by the University of Denver can be found at wwwfeatbiochemduedu
The mean CO HC and NO emissions for the fleet measured in the seventh year of this study were 013 (161 gkg) 58 ppm (when a 10ppm offset is removed 22 gkg) and 125 ppm (18 gkg) respectively Compared to the means measured in 1997 of 045 (558 gkg) 130 ppm (when a 80ppm offset is removed 53 gkg) and 400 ppm (55 gkg) these are overall reductions of 71 for CO 55 for HC and 69 for NO It is also notable that these reductions have occurred while the fleet has aged more than half a model year during this time Some of the larger than normal drop in NO emissions this year may related to the cool and damp weather we had during the measurements this year (see Appendix C)
The fleet emissions observed at the site in Chicago exhibited a skewed distribution with most of the total emissions contributed by a small percentage of the measurements The skewness of the measurement distribution has markedly increased since 1997 when half of the emissions for CO HC and NO were from 67 132 and 112 of the measurements In 2006 half of the emissions for CO HC and NO were from 32 26 and 46 of the measurements This is a result of adding progressively lower emitting vehicles with each model year since 1997 and those vehicles maintaining those low emissions longer than prior models Fleet emission levels for all three species continue to decline each year and there is emerging evidence that emission levels are better controlled during accelerations and decelerations as well The NO emissions continue to show a steady decline at all VSP loads
Having collected seven data sets over a nine year period at the same time and location it is possible to show the ldquodeteriorationrdquo of specific model year fleets from one year to the next When we restrict the fleet to only those model years observed during the first measurements in 1997 the 1983-1997 model year vehicles have had rather flat emissions with age counter to the traditionally expected view of emissions deterioration Another way of phrasing this is that the
On-Road Remote Sensing in the Chicago Area Year 7 4
fleet fraction of gross emitters first seen in 1997 has remained the same for that model year grouping even though that original fleet has aged nine years and the remainder of that original fleet numbers on 4238 It is unlikely that IM or fuel programs are the reason for this observation Continuing studies at the same site and at non IM non special fuels sites should allow further insight to be gained as to the extent that IM programs and special fuels contribute to reducing motor vehicle fleet emissions deterioration compared with fleet turnover
On-Road Remote Sensing in the Chicago Area Year 7 5
INTRODUCTION
Many cities in the United States are in violation of the air quality standards established by the Environmental Protection Agency (EPA) Carbon monoxide (CO) levels become elevated primarily due to direct emission of the gas and ground-level ozone a major component of urban smog is produced by the photochemical reaction of nitrogen oxides (NOx) and hydrocarbons (HC) As of 2002 on-road vehicles were estimated to be the single largest source for the major atmospheric pollutants contributing 82 of the CO 45 of the VOCs and 56 of the NOx to the national emission inventory1
For a description of the internal combustion engine and causes of pollutants in the exhaust see Heywood2 Properly operating modern vehicles with three-way catalysts are capable of partially (or completely) converting engine-out CO HC and NO emissions to CO2 H2O and N2
Control measures to decrease mobile source emissions in non-attainment areas include inspection and maintenance (IM) programs reformulated and oxygenated fuel mandates and transportation control measures but the degree of effectiveness of these measures is still uncertain Many areas remain in non-attainment and with the new 8 hour ozone standards introduced by the EPA in 1997 many locations still violating the standard may have great difficulty reaching attainment3
The remote sensor used in this study was developed at the University of Denver for measuring the pollutants in motor vehicle exhaust and has previously been described in the literature45 The instrument consists of a non-dispersive infrared (IR) component for detecting carbon monoxide carbon dioxide (CO2) and hydrocarbons and a dispersive ultraviolet (UV) spectrometer for measuring nitric oxide The source and detector units are positioned on opposite sides of the road in a bi-static arrangement Colinear beams of IR and UV light are passed across the roadway into the IR detection unit and are then focused onto a dichroic beam splitter which serves to separate the beams into their IR and UV components The IR light is then passed onto a spinning polygon mirror which spreads the light across the four infrared detectors CO CO2 HC and reference
The UV light is reflected off the surface of the beam splitter and is focused into the end of a quartz fiber-optic cable which transmits the light to a UV spectrometer The UV unit is then capable of quantifying nitric oxide by measuring an absorbance band at 2265 nm in the UV spectrum and comparing it to a calibration spectrum in the same region
The exhaust plume path length and density of the observed plume are highly variable from vehicle to vehicle and are dependent upon among other things the height of the vehiclersquos exhaust pipe wind and turbulence behind the vehicle For these reasons the remote sensor only directly measures ratios of CO HC or NO to CO2 The ratios of CO HC or NO to CO2 termed Q Qrsquo and Qrsquorsquo respectively are constant for a given exhaust plume and on their own are useful parameters for describing a hydrocarbon combustion system This study reports measured emissions as CO HC and NO in the exhaust gas corrected for water and excess oxygen not used in combustion The HC measurement is a factor of two smaller than an equivalent measurement by an FID instrument6 Thus in order to calculate mass emissions as described
On-Road Remote Sensing in the Chicago Area Year 7 6
below the HC values must first be multiplied by 20 assuming that the fuel used is regular gasoline These percent emissions can be directly converted into mass emissions by the equations shown below
gm COgallon = 5506bullCO(15 + 0285bullCO + 287bullHC) gm HCgallon = 8644bullHC(15 + 0285bullCO + 287bullHC) gm NOgallon = 5900bullNO(15 + 0285bullCO + 287bullHC)
These equations indicate that the relationship between concentrations of emissions to mass of emissions is quite linear especially for CO and NO and at low concentrations for HC Thus the percent difference in emissions calculated from the concentrations of pollutants reported here is equivalent to a difference calculated from masses
Another useful conversion is from percent emissions to grams pollutant per kilogram (gkg) of fuel This conversion is achieved directly by first converting the pollutant ratio readings to the moles of pollutant per mole of carbon in the exhaust from the following equation
moles pollutant = pollutant = __ (pollutantCO2) __ = (Q2QrsquoQrdquo) moles C CO + CO2 + 3HC (COCO2) + 1 + 3(HCCO2) Q+1+6Qrsquo
Next moles of pollutant are converted to grams by multiplying by molecular weight (eg 44 gmole for HC since propane is measured) and the moles of carbon in the exhaust are converted to kilograms by multiplying (the denominator) by 0014 kg of fuel per mole of carbon in fuel assuming gasoline is stoichiometrically CH2 Again the HCCO2 ratio must use two times the reported HC (see above) because the equation depends upon carbon mass balance and the NDIR HC reading is about half a total carbon FID reading6
Quality assurance calibrations are performed twice daily in the field unless observed voltage readings or meteorological changes are judged to warrant more frequent calibrations A puff of gas containing certified amounts of CO CO2 propane and NO is released into the instrumentrsquos path and the measured ratios from the instrument are then compared to those certified by the cylinder manufacturer (Praxair) These calibrations account for day-to-day variations in instrument sensitivity and variations in ambient CO2 levels caused by local sources atmospheric pressure and instrument path length Since propane is used to calibrate the instrument all hydrocarbon measurements reported by the remote sensor are reported as propane equivalents
Studies sponsored by the California Air Resources Board and General Motors Research Laboratories have shown that the remote sensor is capable of CO measurements that are correct to within plusmn5 of the values reported by an on-board gas analyzer and within plusmn15 for HC78 The NO channel used in this study has been extensively tested by the University of Denver but we are still awaiting the opportunity to participate in an extensive blind study and instrument intercomparison to have it independently validated Tests involving a late-model low-emitting vehicle indicate a detection limit (3σ) of 25 ppm for NO with an error measurement of plusmn5 of the reading at higher concentrations Appendix A gives a list of criteria for valid or invalid data
On-Road Remote Sensing in the Chicago Area Year 7 7
The remote sensor is accompanied by a video system to record a freeze-frame image of the license plate of each vehicle measured The emissions information for the vehicle as well as a time and date stamp is also recorded on the video image The images are stored on videotape so that license plate information may be incorporated into the emissions database during post-processing A device to measure the speed and acceleration of vehicles driving past the remote sensor was also used in this study The system consists of a pair of infrared emitters and detectors (Banner Industries) which generate a pair of infrared beams passing across the road six feet apart and approximately two feet above the surface Vehicle speed is calculated from the time that passes between the front of the vehicle blocking the first and the second beam To measure vehicle acceleration a second speed is determined from the time that passes between the rear of the vehicle unblocking the first and the second beam From these two speeds and the time difference between the two speed measurements acceleration is calculated and reported in mphs Appendix B defines the database format used for the data set
The purpose of this report is to describe the remote sensing measurements made in the Chicago area in the fall of 2006 under CRC Contract No E-23-4 Measurements were made on four consecutive weekdays from Tuesday September 12 to Friday September 15 between the hours of 900 am and 700 pm The measurement location used in this study was the on-ramp from Algonquin Rd to eastbound I-290 (SH 53) in northwest Chicago The equipment was installed on the ramp similarly to the remote sensing measurement studies conducted in the previous years utilizing paint markings made on the road Although I-290 is officially designated as an eastwest thoroughfare traffic is actually traveling in a northsouth direction at Algonquin Rd A map of the measurement location is shown in Figure 1 and a photograph of the site in Figure 2 The on-ramp serves both eastbound and westbound traffic on Algonquin Rd via a traffic light controlled intersection Appendix C gives temperature and humidity data for the 1997 1998 1999 2000 2002 2004 and 2006 studies from Chicago OrsquoHare International Airport located approximately six miles southeast of the measurement site This is the seventh campaign in a nine year study to characterize motor vehicle emissions and deterioration in the Chicago area
RESULTS AND DISCUSSION
Following the four days of data collection in September of 2006 the videotapes were read for license plate identification Plates that appeared to be in state and readable were sent to the State of Illinois to have the vehicle make and model year determined The resulting database contained 22200 records with make and model year information and valid measurements for at least CO and CO2 The database and all previous databases compiled for CRC E-23-4 campaigns can be found at wwwfeatbiochemduedu Most of these records also contain valid measurements for HC and NO as well The validity of the attempted measurements is summarized in Table 1 The table describes the data reduction process beginning with the number of attempted measurements and ending with the number of records containing both valid emissions measurements and vehicle registration information An attempted measurement is defined as a beam block followed by a half second of data collection If the data collection period is interrupted by another beam block from a close following vehicle the measurement attempt is aborted and an attempt is made
On-Road Remote Sensing in the Chicago Area Year 7 8
Algonquin RdSH 62
1 Winnebago 2 Detector 3 Light Source 4 SpeedAccel Sensors 5 Generator 6 Video Camera 7 Road Cones 8 Shoulder Work Ahead Sign
1
2
3
4
5
6
7
4
I-290
SH
53
east
boun
d co
llect
or la
nes
N
8
Figure 1 Area map of the on-ramp from Algonquin Road to eastbound I-290 in northwest Chicago showing remote sensor configuration and safety equipment
On-Road Remote Sensing in the Chicago Area Year 7 9
Table 1 Validity Summary
CO HC NO Attempted Measurements 28057
Valid Measurements Percent of Attempts
25906 923
25838 921
25897 923
Submitted Plates Percent of Attempts
Percent of Valid Measurements
22929 817 885
22885 816 886
22920 817 885
Matched Plates Percent of Attempts
Percent of Valid Measurements Percent of Submitted Plates
22200 791 857 968
22158 790 858 968
22191 791 857 968
Figure 2 A photograph looking east at the Algonquin Rd monitoring site and remote sensing setup
On-Road Remote Sensing in the Chicago Area Year 7 10
at measuring the second vehicle In this case the beam block from the first vehicle is not recorded as an attempted measurement Invalid measurement attempts arise when the vehicle plume is highly diluted or the reported error in the ratio of the pollutant to CO2 exceeds a preset limit (See Appendix A) The greatest loss of data in this process occurs during the plate reading process when out-of-state vehicles and vehicles with unreadable plates (obscured missing dealer out of camera field of view) are omitted from the database
Table 2 provides an analysis of the number of vehicles that were measured repeatedly and the number of times they were measured Of the 22200 records used in this analysis 10572 (48) were contributed by vehicles measured once and the remaining 11628 (52) records were from vehicles measured at least twice A look at the distribution of measurements for vehicles measured five or more times showed that low or negligible emitters had more normally distributed emission measurements while higher emitters had more skewed distributions of measurement values For example of the 70 vehicles that had five or more valid CO measurements only two had mean COgt1 (14 and 15 respectively) These two vehiclesrsquo calculated variances in their measurements were 06 and 115 while the average variance in the measurements of the other 68 vehicles was 006 This observation is expected in view of the known large variability in the emissions of high emitting vehicles regardless of the emission testing method9
Table 3 is the data summary included are summaries of all previous remote sensing databases collected by the University of Denver at the I-290 and Algonquin Rd site These other measurements were conducted in September of 1997 1998 1999 2000 2002 and 2004
Mean fleet emissions continue to decrease at the Algonquin Rd site and the change in mean model year lagged the amount of elapsed time As noted in previous years the percentage of emissions from the dirtiest 10 of the measurements continues to increase which is consistent with the observation that newer vehicles remain lower emitting longer than previous models Afternoon traffic levels in 2006 were similar to the higher volumes observed in 1997 - 2000 and 2004 These higher traffic volumes increase the number of observed accelerations brought about by congestion on the ramp during the afternoon
Table 2 Number of measurements of repeat vehicles
Number of Times Measured Number of Vehicles Percent of Measurements 1 10572 476 2 2306 208 3 1309 177 4 674 121 5 45 10 6 18 05 7 4 01
gt7 3 02
On-Road Remote Sensing in the Chicago Area Year 7 11
The average HC values here have been adjusted to remove an artificial offset in the measurements This offset restricted to the HC channel has been reported in earlier CRC E-23-4 reports Calculation of the offset is accomplished by computing the mode and means of the newest model year vehicles and assuming that these vehicles emit negligible levels of hydrocarbons using the lowest of either of these values as the offset The offset adjustment subtracts this value from all of the hydrocarbon data Since we assume the cleanest vehicles to emit little hydrocarbons such an approximation will only err slightly towards clean because the true offset will be a value somewhat less than the average of the cleanest model year and make This adjustment facilitates comparisons with the other E-23 sites and or different collection years for the same site The offset correction has been performed here and later in other analyses where indicated
Figure 3 shows the distribution of CO HC and NO emissions by percent category from the data collected in Chicago in 2006 The black bars show the percentage of the fleet in a given emission category and the shaded bars show the percentage of the total emissions contributed in that
Table 3 Data summary
Study Year 1997 1998 1999 2000 2002 2004 2006 Mean CO () (gkg of fuel)
045 (558)
039 (490)
035 (442)
026 (328)
023 (289)
017 (215)
013 (161)
Median CO () 014 015 009 005 007 004 002 Percent of Total CO from Dirtiest 10 of the Fleet 602 602 630 691 680 701 777
Mean HC (ppm) (gkg of fuel) Offset (ppm)
130 (53) 80
130 (53) 120
109 (45) 70
94 (39) 60
80 (32) 10
72 (28) 20
58 (22) 10
Median HC (ppm) 50 50 50 40 40 30 30 Percent of Total HC from Dirtiest 10 of the Fleet 438 575 473 483 656 876 960
Mean NO (ppm) (gkg of fuel)
400 (55)
405 (57)
378 (53)
316 (45)
262 (37)
236 (33)
125 (18)
Median NO (ppm) 160 140 121 79 52 39 14 Percent of Total NO from Dirtiest 10 of the Fleet 466 468 511 552 600 639 735
Mean Model Year 19927 19936 19943 19949 19974 19992 20010 Mean Speed (mph) 251 247 258 245 242 243 239
Mean Acceleration (mphs) 01 08 02 05 -04 04 04 Mean VSP (kwtonne)
Slope (degrees) 53 15deg
93 15deg
60 15deg
79 15deg
-69 10deg
60 10deg
59 10deg
Indicates values that have been HC offset corrected as described in text
On-Road Remote Sensing in the Chicago Area Year 7 12
100
75
50
25
0
Perc
ent o
f T
otal
1 2 3 4 5 6 7 8 9 10 11 12 12+
CO Category
Percent of Vehicles Percent of Emissions
100
75
50
25
0
Perc
ent o
f T
otal
002 004 006 008 010 012 014 016 018 020 022 024 024+
HC Category100
75
50
25
0
Perc
ent o
f T
otal
005 010 015 020 025 030 035 040 045 050 055 060 060+
NO Category
Figure 3 Emissions distribution showing the percentage of the fleet in a given emissions category (black bars) and the percentage of the total emissions contributed by the given category (shaded bars)
On-Road Remote Sensing in the Chicago Area Year 7 13
category This figure illustrates the skewed nature of automobile emissions showing that the lowest emission category is occupied by no less than 83 of the measurements (for HC) and as much as 97 of the measurements (for CO) The fact that the cleanest 97 of the measurements is responsible for only 54 of the CO emissions further demonstrates how the emissions picture can be dominated by a small number of high-emitting vehicles The skewed distribution was also seen during the other years of the study in Chicago and is represented by the consistent high values of percent of total emissions from the dirtiest 10 of the fleet (See Table 3)
The inverse relationship between vehicle emissions and model year is shown in Figure 4 for data collected during each of the seven campaigns The HC data have been offset adjusted here The NO emissions are now becoming more like the CO and HC plots where the newest model year vehicle show little or no emissions deterioration indicating that the reduction capabilities of modern catalyst are lasting longer The NO emissions vs model year now take between thirteen and fourteen model years before they level out This ldquoleveling outrdquo phenomenon has been observed previously510 and it has been proposed that the tendency for older vehicles to lose compression and operate under fuel-rich conditions negates the tendency for poor maintenance and catalyst deterioration to result in continually increasing NO emissions with age
There are small upward spikes in HC and NO emissions for the 2007 model year vehicles in this data set but not for CO In past data sets this increase in emissions by the newest vehicles has been suggested to be due to a plate-matching artifact A second observation is that the downward emissions trend with model year appears to be leveling out for all three species albeit at very low emission levels This again could be the result of limitations in emissions control systems andor we are running into the noise limits of the detector and its ability to measure a true zero The NO emissions measured this year are dramatically lower than previous years Some of this reduction may be attributable to the cool and damp weather that we experienced this year (see Appendix C)
As originally shown by Ashbaugh et al11 vehicle emissions by model year with each model year divided into emission quintiles were plotted for data collected in 2006 This resulted in the plots shown in Figures 5 - 7 The bars in the top graphs represent the mean emissions for each quintile The middle graphs give the fraction of the fleet for each model year The bottom graphs are a product of the first two graphs and display the fraction of the total emissions by quintiles and model year The bottom graphs illustrates that while older vehicles generally have higher mean emissions their lack of numbers mean they are less important in the overall air quality picture The bottom graphs also illustrate that the cleanest 60 of the measurements regardless of model year make an essentially negligible contribution to the total emissions The large accumulations of negative emissions in the first two quintiles are the result of ever decreasing emission levels Our instrument is designed such that when measuring a true zero emission plume half of the readings will be negative and half will be positive As the lowest emitting segments of the fleets continue to dive toward zero emissions the negative emission readings will continue to grow toward half of the measurements For HC the newest model years are nearly at that stage now
On-Road Remote Sensing in the Chicago Area Year 7 14
200
175
150
125
100
75
50
25
0
Mea
n gC
Ok
g 1997 1998 1999 2000 2002 2004 2006
25
20
15
10
5
0
Mea
n gH
Ck
g
15
10
5
0
Mea
n gN
Ok
g
200620042002200019981996199419921990198819861984
Model Year
Figure 4 Mean vehicle emissions illustrated as a function of model year HC data have been offset adjusted as described in the text
On-Road Remote Sensing in the Chicago Area Year 7 15
-25
25
75
125
175
225
275
gCO
kg
Fuel
1990
1991
1992
1993
1994
1995
1996
1997
1998
1999
2000
2001
2002
2003
2004
2005
2006
2007 1s
t 2nd 3r
d 4th 5t
h
Model Year
Quintile
0
002
004
006
008
01
012
1990
1991
1992
1993
1994
1995
1996
1997
1998
1999
2000
2001
2002
2003
2004
2005
2006
2007
Model Year
Frac
tion
of F
leet
-1012345678
Frac
tion
of T
otal
CO
1990
1991
1992
1993
1994
1995
1996
1997
1998
1999
2000
2001
2002
2003
2004
2005
2006
2007 1s
t 2nd 3r
d 4th 5t
h
Model Year
Quintile
Figure 5 2006 CO emissions by model year and quintile (top) fleet distribution (middle) and their product showing the total fractional CO emissions by model year and quintile (bottom)
On-Road Remote Sensing in the Chicago Area Year 7 16
-15-10-505
101520253035
gHC
kg
Fuel
1990
1991
1992
1993
1994
1995
1996
1997
1998
1999
2000
2001
2002
2003
2004
2005
2006
2007 1st 2nd 3r
d 4th 5t
h
Model Year
Quintile
0
002
004
006
008
01
012
1990
1991
1992
1993
1994
1995
1996
1997
1998
1999
2000
2001
2002
2003
2004
2005
2006
2007
Model Year
Frac
tion
of F
leet
-15
-10
-05
00
05
10
15
Frac
tion
of T
otal
HC
1990
1991
1992
1993
1994
1995
1996
1997
1998
1999
2000
2001
2002
2003
2004
2005
2006
2007 1st 2n
d 3rd 4t
h 5th
Model Year
Quintile
Figure 6 2006 HC emissions by model year and quintile (top) fleet distribution (middle) and their product showing the total fractional HC emissions by model year and quintile (bottom)
On-Road Remote Sensing in the Chicago Area Year 7 17
-5
0
5
10
15
20
25
30gN
Ok
g Fu
el
1990
1991
1992
1993
1994
1995
1996
1997
1998
1999
2000
2001
2002
2003
2004
2005
2006
2007 1st 2n
d 3rd 4t
h 5th
Model Year
Quintile
0
002
004
006
008
01
012
1990
1991
1992
1993
1994
1995
1996
1997
1998
1999
2000
2001
2002
2003
2004
2005
2006
2007
Model Year
Frac
tion
of F
leet
-01
0001
02
03
04
0506
07
Frac
tion
of T
otal
NO
1990
1991
1992
1993
1994
1995
1996
1997
1998
1999
2000
2001
2002
2003
2004
2005
2006
2007 1st 2n
d 3rd 4t
h 5th
Model Year
Quintile
Figure 7 2006 NO emissions by model year and quintile (top) fleet distribution (middle) and their product showing the total fractional NO emissions by model year and quintile (bottom)
On-Road Remote Sensing in the Chicago Area Year 7 18
Figures 5 - 7 can also be used to get a picture of federal compliance standards The on-road data are measured as mass emissions per kg of fuel It is not possible to determine mass emissions per mile for each vehicle because the instantaneous gasoline consumption (kgmile) is not known An approximate comparison with the fleet average emissions shown in Figures 5 - 7 can however be carried out To make this comparison we assume a fuel density of 075 kgL and an average gas mileage for all model years of 23mpg The Tier 1 100000 mile standards for CO HC and NO are 42 031 and 06 gmmi respectively With the above assumptions these correspond to 34 25 and 49 gmkg respectively Inspection of the top graphs in Figures 5 - 7 shows that significant fractions especially of the newer vehicles are measured with on-road emissions well below these standards Also note that the means in Table 3 are also well below these standards although the fleet average age is only approximately 5 years
An equation for determining the instantaneous power of an on-road vehicle has been proposed by Jimenez12 which takes the form
VSP = 439bullsin(slope)bullv + 022bullvbulla + 00954bullv + 00000272bullv3
where VSP is the vehicle specific power in kWmetric tonne slope is the slope of the roadway (in degrees) v is vehicle speed in mph and a is vehicle acceleration in mphs Derived from dynamometer studies and necessarily an approximation the first term represents the work required to climb the gradient the second term is the f = ma work to accelerate the vehicle the third is an estimated friction term and the fourth term represents aerodynamic resistance Using this equation vehicle specific power was calculated for all measurements in each of the seven yearrsquos databases This equation in common with all dynamometer studies does not include any load effects arising from road curvature The emissions data were binned according to vehicle specific power and illustrated in Figure 8 All of the specific power bins contain at least 100 measurements and the HC data have been offset adjusted
As expected NO emissions show a positive dependence on vehicle specific power and while the data are similar to the previous years there is a noticeable downward trend in all three emissions All three species emissions are lower and in general are showing less dependence on specific power than previous years The error bars included in the plot are standard errors of the mean calculated from the daily averages These uncertainties were generated for these γ-distributed data sets by applying the central limit theorem Each dayrsquos average emission for a given VSP bin was assumed an independent measurement of the emissions at that VSP Normal statistics were then applied to these daily averages
Using VSP it is possible to reduce the influence of driving behavior from the mean vehicle emissions Table 4 shows the mean emissions from all vehicles in the 1997 1998 1999 2000 2002 2004 and 2006 databases with specific powers between ndash5 and 20 kwtonne Note that these emissions do not vary considerably from the mean emissions for the entire databases as shown in Table 3 Also shown in Table 4 are the mean emissions for the 1998 1999 2000 2002 2004 and 2006 databases adjusted for vehicle specific power to match the 1997 VSP distribution
On-Road Remote Sensing in the Chicago Area Year 7 19
75
50
25
0
gCO
kg
7000
6000
5000
4000
3000
2000
1000
0
Vehicles
15
10
5
0
gHC
kg
(C3)
7000
6000
5000
4000
3000
2000
1000
0
Vehicles
1997
1998 1999 2000 2002 2004 2006 2006 Vehicles
10
8
6
4
2
0
gNO
kg
-30 -25 -20 -15 -10 -5 0 5 10 15 20 25 30
VSP (kwtonne)
7000
6000
5000
4000
3000
2000
1000
0
Vehicles
Figure 8 Vehicle emissions as a function of vehicle specific power for all of the Chicago E-23 data sets Error bars are standard errors of the mean calculated from daily samples The solid line without markers is the vehicle count profile for the 2006 data set
On-Road Remote Sensing in the Chicago Area Year 7 20
This correction is accomplished by applying the mean vehicle emissions for each VSP bin (between ndash5 and 20 kwtonne) from a certain yearrsquos measurements to the vehicle distribution by vehicle specific power for each bin from 1997 A sample calculation for the vehicle specific power adjusted mean NO emissions is shown in Appendix D It should be noted here that VSP values for all of the years of measurement in Chicago were recalculated using the most recent VSP equation during the generation of this current report Readers may notice slight discrepancies in the averaged values from earlier reports
Because all VSP data are adjusted to the 1997 vehicle frequency distribution by VSP bin the 1997 adjusted values are the same as the measured values except for the HC data that include an extra calculation to adjust for the yearly HC offset Each measurement yearrsquos adjusted values for HC in Table 4 include this additional adjustment In the case of CO and NO the decrease in average emissions with time shows less noise than the HC data The higher noise in the VSP adjusted HC emissions data is a direct reflection of the year to year changes in the calculated HC offsets
A similar normalization can be applied to a fleet of specific model year vehicles to track deterioration provided we use as a baseline only the model years measured in 1997 A sample calculation for the model year adjusted mean NO emissions is shown in Appendix E Table 5 shows the mean emissions for all vehicles from model year 1983 to 1997 as measured in each of the seven years Applying the vehicle frequency distribution by model year from 1997 to the mean emissions by model year from the later studies yields the model year adjusted fleet emissions The calculation indicates that though some of the measured decrease in fleet average emissions is due to fleet turnover the emissions of even the older model years (1983-1997) measured previously seem to have not increased significantly The lack of emissions deterioration over a growing period of time is likely the result of a large number of factors and not just the imposition of reformulated fuels as discussed in previous CRC reports and as observed on-road by Kirchstetter et al13 We surmise however that we may be beginning to observe the effect whereby the best maintained 1983-1997 vehicles last longer than their
Table 4 Vehicle specific power adjusted fleet emissions (-5 to 20 kwtonne only) with standard errors of the means calculated using daily averages
Means 1997
measured (adjusted)
1998 measured (adjusted)
1999 measured (adjusted)
2000 measured (adjusted)
2002 measured (adjusted)
2004 measured (adjusted)
2006 measured (adjusted)
gCOkg 534 plusmn 10 (534 plusmn 10)
472 plusmn 13 (512 plusmn 14)
437 plusmn 23 (433 plusmn 23)
322 plusmn 09 (331 plusmn 09)
277 plusmn 12 (273 plusmn 12)
214 plusmn 08 ( 214 plusmn 08)
157 plusmn 09 (157 plusmn 09)
gHCkga 82 plusmn 02 (49 plusmn 02)
92 plusmn 06 (59 plusmn 04)
69 plusmn 05 (40 plusmn 03)
30 plusmn 02 (40 plusmn 03)
33 plusmn 03 (27 plusmn 02)
37 plusmn 03 (29 plusmn 03)
27 plusmn 05 (23 plusmn 05)
gNOkg 55 plusmn 03 (55 plusmn 03)
56 plusmn 01 (49 plusmn 01)
52 plusmn 03 (52 plusmn 03)
44 plusmn 02 (40 plusmn 02)
39 plusmn 02 (41 plusmn 02)
33 plusmn 01 (32 plusmn 01)
17 plusmn 01 (17 plusmn 01)
aHC adjusted emissions are offset corrected as described in the text
On-Road Remote Sensing in the Chicago Area Year 7 21
neglected counterparts The fact that this fleet is now about one quarter the size it was when measured in 1997 makes this hypothesis at least somewhat plausible
Vehicle deterioration can also be illustrated by Figure 9 which shows the mean emissions of the 1984 to 2006 model year fleet as a function of vehicle age The first point for most model years was measured in 1997 the second point in 1998 etc The HC offset has been subtracted here as well Vehicle age was defined as the difference between the year of measurement and the vehicle model year Two features of this analysis stand out The first is the gap between the 1996 and newer model year vehicles and the older fleets There were significant changes in the motor vehicle emissions regulations for the 1996 most notably the introduction of two additional oxygen sensors to monitor catalyst efficiency as part of the OBDII monitoring system These additional oxygen sensors allow the manufacturers to correct for any drift that occurs with the manifold oxygen sensor that is used to maintain the enginersquos air to fuel ratio setting14 This seems to be reflected in a noticeable gap between 1995 and older vehicles and 1996 and newer vehicles shown in Figure 9
The second feature common to much of the E-23 data is that each model year shows very little deterioration with age but each model year has higher emissions than its newer neighbor The various analyses of the data presented up to this point suggest small increases in emissions from the previous years even when model year adjustments were made to remove effects of fleet turnover This lack of the expected deterioration also shows up clearly in Figure 9 Only the NO plot in Figure 9 shows the traditional view of emissions deterioration where fleet emissions creep upwards with age However even the NO plot only shows this trend for about fifteen years at which time emissions level out and then decrease after that Are we wrong to expect fleet average deterioration by age or are there factors at work suppressing the deterioration that would otherwise be observed
Table 5 Model year adjusted fleet emissions (MY 1983-1997 only) Errors are standard errors of the means calculated from the daily means
Means 1997
measured (adjusted)
1998 measured (adjusted)
1999 measured (adjusted)
2000 measured (adjusted)
2002 measured (adjusted)
2004 measured (adjusted)
2006 measured (adjusted)
gCOkg 530 plusmn 09 (530 plusmn 09)
520 plusmn 08 (533 plusmn 08)
538 plusmn 19 (571 plusmn 20)
464 plusmn 14 (512 plusmn 16)
506 plusmn 20 (568 plusmn 22)
463 plusmn 19 (533 plusmn 21)
462 plusmn 21 (528 plusmn 24)
gHCkga 81 plusmn 02 (48 plusmn 02)
49 plusmn 12 (50 plusmn 06)
50 plusmn 06 (54 plusmn 04)
51 plusmn 03 (56 plusmn 04)
54 plusmn 05 (63 plusmn 05)
57 plusmn 04 (74 plusmn 06)
62 plusmn 13 (76 plusmn 15)
gNOkg 56 plusmn 03 (56 plusmn 03)
63 plusmn 01 (64 plusmn 01)
66 plusmn 03 (68 plusmn 03)
62 plusmn 02 (66 plusmn 02)
64 plusmn 03 (70 plusmn 03)
70 plusmn 03 (77 plusmn 03)
49 plusmn 03 (57 plusmn 04)
Number of
Vehicles 18251 19319 16639 13394 9372 6220 4238
aHC emissions are offset corrected for all of the years adjusted data
On-Road Remote Sensing in the Chicago Area Year 7 22
150
100
50
0
gC
Ok
g
25
20
15
10
5
0
gHC
kg
12
10
8
6
4
2
0
gNO
kg
20151050Age (years)
1984 1985 1986 1987 1988 1989 1990 1991 1992 1993 1994 1995 1996 1997 1998 1999 2000 2001 2002 2003 2004 2005 2006
Figure 9 Mean vehicle emissions as a function of age shown by model year
On-Road Remote Sensing in the Chicago Area Year 7 23
We can imagine several programs and processes that may contribute to the overall fleet emissions the Chicago area IM program the use of reformulated gasoline and the ldquonaturalrdquo loss of the least well maintained vehicles as fleetrsquos age The enhanced IM program was phased in during calendar years 1999 and 2000 If the IM program were effective it would produce some but not all of the observed results In fact an analysis of the IM effect was conducted in the Year 3 report15 when a fraction of the measured vehicles had undergone IM testing suggested CO and HC benefits of 71 plusmn 22 and 135 plusmn 58 respectively relative to Illinoisrsquos previous idle program The fact that the same emissions behavior is seen in the newest model years that are not subject to IM until their fifth model year indicates that IM effectiveness is certainly not the whole story It is also difficult to construct a story whereby fuel changes could somehow stop vehicle emissions deterioration
Another use of the on-road remote sensing data is to predict the effectiveness with which high emitter identification for one pollutant actually predicts high emissions for another pollutant One can look at the high CO emitters (as defined as the top emissions decile) and calculate what percentage of these are also high emitting for HC for example This type of analysis would allow a calculation of the maximum HC emission benefits resulting from fixing all high CO emitters To this extent we have analyzed our data to determine what percent of the top decile of measurements of one pollutant is also in the top decile for another pollutant These data are in Table 6 included in the analysis are only those readings that have valid readings for all three pollutants The column heading is the pollutant whose top decile is being analyzed and the values indicate the percentage of the fleet that is high emitting for the pollutants in the column and row headings The values where the column and row headings are the same indicate the percentage that is high emitting in the one pollutant only The ldquoAllrdquo row gives the percentage of the readings that are high emitting in all three pollutants Thus the table shows that 21 of the measurements are in the top decile for both HC and CO 13 of the measurements are high emitting for CO and NO 57 of the measurements are high CO emitters only
The preceding analysis gives the percent of vehicle overlap but does not directly give emissions overlap In order to assess the overlap one must convert the Table 6 values to percent of emissions This number is a maximum because the normal variability of emissions readings particularly from high emitters9 has not been included in this analysis Table 7 shows that identification of the 57 of the measurements that are high emitting for CO only would identify an overall 358 of total measured on-road CO More efficiently identification of the 21 high CO and HC measurements accounts for more than a quarter of the total CO and HC emissions from these data
Table 6 Percent of all measurements that are high emitting
Top 10 Decile CO HC NO CO 57 21 13 HC 21 63 07 NO 13 07 71 All 09
On-Road Remote Sensing in the Chicago Area Year 7 24
Most vehicles are low emitting and show little emissions variability when measured more than once Vehicles that have one high reading often have other readings that vary widely9 This effect has also been observed from multiple FTP and IM240 tests The evidence from pullover studies in California is that even one high reading identifies vehicles that have a gt90 probability of failing an alternative IM test if performed immediately16 These vehicles also have a high probability of showing evidence of tampered or defective emission control equipment717 Because of this variability in the emissions of broken cars the emissions distribution obtained from any snapshot of fleet emissions (remote sensing or annual IM testing) is bound to be more skewed than were one able to monitor the emissions of all vehicles at all times This phenomenon does not affect the means measured by these snapshots but it does imply that the overlap and high emitter fractions in the tables above would show less skewness were one able to fully characterize all vehicles and their variability
In the manner described in the Phoenix Year 2 report18 instrument noise was measured by looking at the slope of the negative portion of the log plots Such plots were constructed for the three pollutants Linear regression gave best fit lines whose slopes correspond to the inverse of the Laplace factor which describes the noise present in the measurements This factor must be viewed in relation to the average measurement for the particular pollutant to obtain a description of noise The Laplace factors were 43 48 and 03 for CO HC and NO respectively These values indicate standard deviations of 60 gkg (005) 67 gkg (162 ppm) and 04 gkg (35 ppm) for individual measurements of CO HC and NO respectively These values indicate minimal relative noise in measurements of CO and NO and a small but significant amount of noise in the HC measurements In terms of uncertainty in average values reported here the numbers are reduced by a factor of the square root of the number of measurements For example with averages of 100 measurements which is the low limit for number of measurements per bin the uncertainty reduces by a factor of 10 Thus the uncertainties in the averages reduce to 06 gkg 07 gkg and 004 gkg respectively
CONCLUSIONS
The University of Denver has completed the seventh campaign of a multi-year remote sensing study of motor vehicle emissions and deterioration in the Chicago area with measurements made in 1997 through 2000 2002 2004 and in 2006 A database was compiled containing 22200 records for which the State of Illinois provided makes and model year information All of these records contained valid measurements for at least CO and CO2 and 21149 records contained valid measurements for HC and NO as well
Table 7 Percent of total emissions from high emitting vehicles
Top 10 Decile CO HC NO CO 358 274 70 HC 279 530 48 NO 90 51 511 All 75 104 83
On-Road Remote Sensing in the Chicago Area Year 7 25
The mean CO HC and NO emissions for the fleet measured in this study was 013 (161 gkg) 58 ppm (when a 10ppm offset is removed 22 gkg) and 125 ppm (18 gkg) respectively The fleet emissions observed at the site in Chicago exhibited a skewed distribution with most of the total emissions contributed by a relatively small percentage of the measurements Emission levels for all three species continue to decline and there is some evidence that levels are better controlled across a wider VSP range than past fleets The CO and HC emissions are remarkably flat over the plusmn20 kwtonne VSP range and the NO emissions are showing a steady decline in emission levels particularly at the higher VSP loads
Having collected seven data sets over a nine year period at the same time and location it is possible to show the ldquodeteriorationrdquo of specific model year fleets from one year to the next When we restrict the fleet to only those model years observed during the first measurements in 1997 the 1983-1997 model year vehicles have had rather flat emissions with age counter to the traditionally expected view of emissions deterioration Another way of phrasing this is that the fleet fraction of gross emitters first seen in 1997 has remained the same even though that original fleet has aged nine years and only one quarter of the original fleet size is no longer observed in the current measurements It is unlikely that IM or fuel programs are the reason for this observation Continuing studies at the same site and at non IM non special fuels sites should allow further insight to be gained as to the extent IM programs and special fuels contribute to reducing motor vehicle fleet emissions deterioration compared with fleet turnover Data are available at wwwfeatbiochemduedu for the seven measurement campaigns in Chicago and for other measurement campaigns undertaken by the University of Denver
ACKNOWLEDGEMENTS
The successful outcome of this project would not be possible without the assistance of Mr Joe Kuta in the Illinois Department of Transportation Division of Highways District 1 Regional Permits Office Mr Don Wilson in the Illinois Secretary of States Office and Mrs Annette Bishop whose plate reading skills are phenomenal Comments from the various reviewers of this report were also invaluable
On-Road Remote Sensing in the Chicago Area Year 7 26
On-Road Remote Sensing in the Chicago Area Year 7 27
LITERATURE CITED 1 National Air Quality and Emissions Trends Report 2003 Special Studies Edition United
States Environmental Protection Agency Research Triangle Park NC 2003 EPA-454R-03-005
2 Heywood JB Internal Combustion Engine Fundamentals McGraw-Hill New York 1988
3 Lefohn AS Shadwick DS Ziman SD Environ Sci Technol 1998 32 276A
4 Bishop GA Stedman DH Acc Chem Res 1996 29 489
5 Popp PJ Bishop GA Stedman DH J Air amp Waste Manage Assoc 1999 49 1463
6 Singer BC Harley RA Littlejohn D Ho J Vo T Environ Sci Technol 1998 27 3241
7 Lawson DR Groblicki PJ Stedman DH Bishop GA Guenther PL J Air amp Waste Manage Assoc 1990 40 1096
8 Ashbaugh LL Lawson DR Bishop GA Guenther PL Stedman DH Stephens RD Groblicki PJ Parikh JS Johnson BJ Haung SC In PM10 Standards and Nontraditional Particulate Source Controls Chow JC Ono DM Eds AWMA Pittsburgh PA 1992 Vol II pp 720-739
9 Bishop GA Stedman DH Ashbaugh L J Air Waste Manage Assoc 1996 46 667-675
10 Zhang Y Stedman DH Bishop GA Guenther PL Beaton SP Peterson JE Environ Sci Technol 1993 27 1885
11 Ashbaugh LL Croes BE Fujita EM Lawson DR Presented at 13th North American Motor Vehicle Emissions Control Conference 1990
12 Jimenez JL McClintock P McRae GJ Nelson DD Zahniser MS In Proceedings of the 9th CRC On-Road Vehicle Emissions Workshop CA 1999
13 Kirchstetter TW Singer BC Harley RA Kendall GR Traverse M Environ Sci Technol 1999 33 318
14 White V A Javaherian H Internal Combustion Engine AirFuel Ratio Regulation US Patent 5392598 issued 28 February 1995
15 Pokharel SS Bishop GA Stedman DH On-Road Remote Sensing of Automobile Emissions in the Chicago Area Year 3 Final report CRC Contract E-23-4 2000
16 Burnette A Manne G In Proceedings of the 16th CRC On-Road Vehicle Emissions Workshop CA 2006
On-Road Remote Sensing in the Chicago Area Year 7 28
17 Remote Sensing Device High Emitter Identification with Confirmatory Roadside Inspection Bureau of Automotive Repair Engineering and Research Branch Final Report 2001-06 2001
18 Pokharel SS Bishop GA Stedman DH On-Road Remote Sensing of Automobile Emissions in the Phoenix Area Year 2 Final report CRC Contract E-23-4 2000
On-Road Remote Sensing in the Chicago Area Year 7 29
ACRONYMS
CO ndash Carbon monoxide CO2 ndash Carbon dioxide CRC ndash Coordinating Research Council EPA ndash Environmental Protection Agency FID ndash Flame Ionization Detector HC ndash Hydrocarbons IM ndash Inspection and Maintenance IR - Infrared MY- Model Year NDIR ndash Non-Dispersive Infrared NO ndash Nitric Oxide SH53 ndash State Highway 53 UV - Ultraviolet VSP ndash Vehicle Specific Power
On-Road Remote Sensing in the Chicago Area Year 7 30
On-Road Remote Sensing in the Chicago Area Year 7 31
APPENDIX A FEAT criteria to render a reading ldquoinvalidrdquo or not measured
Not measured 1) beam block and unblock and then block again with less than 05 seconds clear to the rear
Often caused by elevated pickups and trailers causing a ldquorestartrdquo and renewed attempt to measure exhaust The restart number appears in the database
2) vehicle which drives completely through during the 04 seconds ldquothinkingrdquo time (relatively rare)
Invalid 1) Insufficient plume to rear of vehicle relative to cleanest air observed in front or in the rear at
least five 10ms averages gt025 CO2 in 8 cm path length Often HD diesel trucks bicycles 2) too much error on COCO2 slope equivalent to +20 for CO gt10 02CO for
COlt10 3) reported CO lt-1 or gt21 All gases invalid in these cases 4) too much error on HCCO2 slope equivalent to +20 for HC gt2500ppm propane 500ppm
propane for HC lt2500ppm 5) reported HC lt-1000ppm propane or gt40000ppm HC ldquoinvalidrdquo 6) too much error on NOCO2 slope equivalent to +20 for NOgt1500ppm 300ppm for
NOlt1500ppm 7) reported NOlt-700ppm or gt7000ppm NO ldquoinvalidrdquo SpeedAcceleration valid only if at least two blocks and two unblocks in the time buffer and all blocks occur before all unblocks on each sensor and the number of blocks and unblocks is equal on each sensor and 100mphgtspeedgt5mph and 14mphsgtaccelgt-13mphs and there are no restarts or there is one restart and exactly two blocks and unblocks in the time buffer
On-Road Remote Sensing in the Chicago Area Year 7 32
On-Road Remote Sensing in the Chicago Area Year 7 33
APPENDIX B Explanation of the ill_2006dbf database
The ill_2006dbf is a Microsoft Foxpro database file and can be opened by any version of MS Foxpro or Filemaker Pro regardless of platform and MS Access The following is an explanation of the data fields found in this database
License Illinois license plate
Date Date of measurement in standard format
Time Time of measurement in standard format
Percent_co Carbon monoxide concentration in percent
Co_err Standard error of the carbon monoxide measurement
Percent_hc Hydrocarbon concentration (propane equivalents) in percent
Hc_err Standard error of the hydrocarbon measurement
Percent_no Nitric oxide concentration in percent
No_err Standard error of the nitric oxide measurement
Percent_co2 Carbon dioxide concentration in percent
Co2_err Standard error of the carbon dioxide measurement
Opacity Opacity measurement in percent
Opac_err Standard error of the opacity measurement
Restart Number of times data collection is interrupted and restarted by a close-following vehicle or the rear wheels of tractor trailer
Hc_flag Indicates a valid hydrocarbon measurement by a ldquoVrdquo invalid by an ldquoXrdquo
No_flag Indicates a valid nitric oxide measurement by a ldquoVrdquo invalid by an ldquoXrdquo
Opac_flag Indicates a valid opacity measurement by a ldquoVrdquo invalid by an ldquoXrdquo Max_co2 Reports the highest absolute concentration of carbon dioxide measured by the
remote sensor indicates the strength of the observed plume
Speed_flag Indicates a valid speed measurement by a ldquoVrdquo an invalid by an ldquoXrdquo and slow speed (excluded from the data analysis) by an ldquoSrdquo
Speed Measured speed of the vehicle in mph
Accel Measured acceleration of the vehicle in mphs
Ref_factor Reference detector voltage Used along with ldquoCO2_factorrdquo to observe calibration shifts
CO2_factor CO2 detector voltage Used along with ldquoRef_factorrdquo to observe calibration shifts Lic_type Indicates license plate type 0 (standard passenger plate) 1 (anything but
passenger plates) and 2 (temporary) This field should not be used to distinguish cars from trucks as the plate type is not always indicative of the vehicle
On-Road Remote Sensing in the Chicago Area Year 7 34
Exp_month Indicates the month the current registration expires
Exp_year Indicates the year the current registration expires
Vin Vehicle identification number
Year Model year of the vehicle
Make Manufacturer of the vehicle
Body_style Type of vehicle
Address Indicates the city state and zip code of the registrantrsquos address
Owner_code Illinois DMV ownership codes (1 ndash individual 2 ndash multiple individuals same last name 3 ndash multiple individuals different last names 4 ndash corporate owner 5 ndash combined corporate and individual 6 ndash multiple corporate ownership 7 ndash local government 8 ndash state government and 9 ndash Federal government)
Make_abrv Abbreviated manufacturer
On-Road Remote Sensing in the Chicago Area Year 7 35
APPENDIX C Temperature and Humidity Data from Chicago OrsquoHare Int Airport
Date (1997) Sept 15 Sept 16 Sept 17 Sept 18 Sept 19
Hour T (degF) RH () T (degF) RH () T (degF) RH () T (degF) RH () T (degF) RH ()
0700 64 100 68 87 68 81 64 78 71 84 0800 69 78 71 84 69 70 71 68 - - 0900 73 68 75 73 71 61 75 57 77 76
1000 75 68 78 71 75 46 77 46 78 73 1100 78 61 80 66 77 39 78 44 80 73 1200 80 57 84 60 78 38 82 36 82 69 1300 80 57 82 62 80 32 82 36 80 73
1400 80 57 84 60 80 29 82 36 77 76 1500 80 62 84 58 80 29 82 32 73 87 1600 78 66 82 58 80 27 80 32 71 93
1700 75 73 82 58 78 32 78 38 71 100 1800 73 78 80 68 78 38 77 39 71 93
Date (1998)
Sept 21 Sept 22 Sept 23 Sept 24
Hour T (degF) RH () T (degF) RH () T (degF) RH () T (degF) RH () 0700 57 66 57 80 51 68 53 89 0800 59 62 62 72 55 54 55 83
0900 60 59 62 72 59 51 57 77 1000 64 51 64 67 60 49 59 72 1100 64 55 66 56 62 42 60 77 1200 64 55 62 67 64 39 64 72
1300 66 48 62 67 64 39 64 72 1400 64 60 64 60 64 36 66 67 1500 64 62 64 51 66 34 64 72
1600 64 62 62 60 66 36 64 72 1700 62 67 62 55 62 51 64 78 1800 62 67 59 53 55 61 62 83
Date (1999) Sept 20 Sept 21 Sept 22 Sept 23
Hour T (degF) RH () T (degF) RH () T (degF) RH () T (degF) RH ()
0700 54 87 48 89 46 80 54 65 0800 55 80 49 80 54 56 58 56 0900 57 75 53 74 59 43 62 51
1000 60 62 57 67 63 37 70 42 1100 62 56 57 64 66 34 74 36 1200 62 52 59 58 66 33 77 31 1300 60 53 60 58 71 33 78 31
1400 60 50 59 56 72 32 79 31 1500 63 43 60 53 72 33 80 31 1600 62 43 59 58 72 33 78 36
1700 59 51 57 62 71 35 77 37 1800 58 60 55 69 67 40 75 40
On-Road Remote Sensing in the Chicago Area Year 7 36
Date (2000)
Sept 11 Sept 12 Sept 13 Sept 14
Hour T (degF) RH () T (degF) RH () T (degF) RH () T (degF) RH () 0800 76 85 63 76 62 60 64 96 0900 79 79 65 70 66 50 63 93 1000 82 71 67 59 69 47 60 96 1100 84 66 68 53 71 44 65 81 1200 87 61 69 45 74 41 68 63 1300 77 73 71 41 76 39 70 53 1400 74 78 71 47 77 36 73 38 1500 66 95 70 46 78 36 72 38 1600 67 95 70 47 79 34 72 44 1700 68 89 68 47 77 36 71 42 1800 69 84 66 49 73 48 67 47 1900 69 87 64 52 64 70 64 52
Date (2002)
Sept 16 Sept 17 Sept 18 Sept 19 Sept 20 Hour T (degF) RH () T (degF) RH () T (degF) RH () T (degF) RH () T (degF) RH ()
0700 57 90 60 84 62 100 73 96 71 94 0800 63 70 66 72 64 93 74 94 70 100 0900 67 55 71 63 68 87 75 94 70 100
1000 69 55 74 60 70 76 76 91 70 100 1100 70 53 75 52 72 73 77 90 71 96 1200 72 50 77 50 72 79 76 97 70 90 1300 73 44 76 52 75 79 79 88 69 87
1400 75 40 79 47 78 74 79 82 69 90 1500 75 42 79 42 79 74 78 85 69 87 1600 76 39 77 45 79 74 78 79 69 87
1700 74 41 74 52 78 74 79 77 69 84 1800 67 57 73 57 77 79 77 79 67 87
Date (2004)
Sept 20 Sept 21 Sept 22 Sept 23 Hour T (degF) RH () T (degF) RH () T (degF) RH () T (degF) RH () 0800 63 54 67 61 69 57 70 61 0900 67 47 72 46 73 50 75 50 1000 71 42 75 37 76 43 79 44 1100 72 41 77 35 78 37 80 39 1200 74 38 80 34 78 37 81 38 1300 76 33 80 34 80 35 83 37 1400 77 28 81 32 80 35 84 35 1500 78 29 82 28 78 40 84 32 1600 77 30 81 30 80 38 84 33 1700 75 39 80 33 76 43 82 34 1800 71 49 70 55 68 63 78 39 1900 67 59 67 59 70 57 76 42
On-Road Remote Sensing in the Chicago Area Year 7 37
Date (2006)
Sept 12 Sept 13 Sept 14 Sept 15
Hour T (degF) RH () T (degF) RH () T (degF) RH () T (degF) RH ()
0751 67 93 60 93 64 70 65 87 0851 68 93 60 93 66 70 69 76 0951 68 90 61 93 68 68 72 66 1051 68 97 61 90 71 61 72 59 1151 68 97 62 84 71 64 77 52 1251 70 90 62 87 71 64 75 52 1351 70 87 63 84 71 61 77 50 1451 71 84 62 87 72 57 78 47 1551 68 93 63 81 71 61 74 60 1651 66 90 63 81 69 66 73 64 1751 65 90 63 81 67 68 71 68 1851 65 90 62 81 65 75 69 76
On-Road Remote Sensing in the Chicago Area Year 7 38
On-Road Remote Sensing in the Chicago Area Year 7 39
APPENDIX D Calculation of Vehicle Specific Power Adjusted Vehicle Emissions 1997 (Measured) VSP Bin Mean NO (ppm) No of Measurements Total Emissions -5 236 225 53200
0 224 1609 360090 5 307 4985 1531000 10 431 6146 2648020 15 548 2624 1438060 20 590 456 269180 16045 6299550 Mean NO (ppm) 393
1998 (Measured) VSP Bin Mean NO (ppm) No of Measurements Total Emissions -5 233 137 31951 0 239 784 187394 5 265 3613 956613 10 385 6685 2576433 15 475 6012 2856195 20 483 2392 1156320 19623 7764906 Mean NO (ppm) 396
1998 (Adjusted) VSP Bin lsquo98 Mean NO (ppm) lsquo97 No of Meas Total Emissions -5 233 225 52474 0 239 1609 384588 5 265 4985 1319877 10 385 6146 2368700 15 475 2624 1246616 20 483 456 220436 16045 5592691 Mean NO (ppm) 349
Note that the Mean NO readings listed here have been rounded to the nearest ppm values which results in the Total Emissions column appearing to not be a direct multiplication product The -5 to 20 kwtonne bins are chosen to preclude any ldquooff-cyclerdquo emissions The object of this adjustment is to have the 1998 fleetrsquos emissions calculated as if they drove (VSP wise) like the 1997 fleet This is accomplished by first binning and averaging the 1997 and 1998 data (the top two tables) We then combine the mean NO values from the 1998 fleet with the numerical VSP bin distribution from the 1997 fleet in the bottom table The product of these two columns is summed and the sum total emissions are divided by the number of 1997 vehicles to produce the 1998 adjusted mean NO average For this example it shows that the 1998 fleet when driven like the 1997 fleet has lower NO emissions than the 1997 fleet
On-Road Remote Sensing in the Chicago Area Year 7 40
On-Road Remote Sensing in the Chicago Area Year 7 41
APPENDIX E Calculation of Model Year Adjusted Fleet Emissions
1997 (Measured) Model Year Mean NO (ppm) No of Measurements Total Emissions 83 690 398 274620
84 720 223 160560 85 680 340 231200 86 670 513 343710 87 690 588 405720 88 650 734 477100 89 610 963 587430 90 540 962 519480 91 500 1133 566500 92 450 1294 582300 93 460 1533 705180 94 370 1883 696710 95 340 2400 816000 96 230 2275 523250 97 150 2509 376350 17748 7266110 Mean NO (ppm) 409
1998 (Measured) Model Year Mean NO (ppm) No of Measurements Total Emissions 83 740 371 274540 84 741 191 141531 85 746 331 246926 86 724 472 341728 87 775 557 431675 88 754 835 629590 89 687 1036 711732 90 687 1136 780432 91 611 1266 773526 92 538 1541 829058 93 543 1816 986088 94 418 2154 900372 95 343 2679 918897 96 220 2620 576400 97 177 3166 560382 20171 9102877 Mean NO (ppm) 451
1998 (Adjusted) Model Year lsquo98 Mean NO (ppm) lsquo97 No of Meas Total Emissions 83 740 398 294520 84 741 223 165243 85 746 340 253640 86 724 513 371412 87 775 588 455700 88 754 734 553436 89 687 963 661581 90 687 962 660894 91 611 1133 692263 92 538 1294 696172 93 543 1533 832419 94 418 1883 787094 95 343 2400 823200 96 220 2275 500500 97 177 2509 444093 17748 8192167 Mean NO (ppm) 462
On-Road Remote Sensing in the Chicago Area Year 7 42
On-Road Remote Sensing in the Chicago Area Year 7 43
APPENDIX F Field Calibration Record
1997
Date Time CO Cal Factor HC Cal Factor NO Cal Factor 915 935 142 135 107 915 1430 126 118 094 916 920 133 125 102 916 1240 112 108 086 917 810 139 127 111 917 1155 119 112 097 918 815 149 141 120 918 1230 115 110 086 919 1100 124 116 095
1998
Date Time CO Cal Factor HC Cal Factor NO Cal Factor 921 815 138 126 121 921 1300 131 117 115 922 740 148 136 146 922 1140 126 115 127 923 800 164 152 126 923 1045 132 125 113 924 900 146 133 141 924 1230 130 119 112
1999
Date Time CO Cal Factor HC Cal Factor NO Cal Factor 920 950 132 105 121 920 1430 125 099 115 921 815 145 119 146 921 1030 133 107 127 922 830 147 113 132 922 1110 122 101 1201 923 815 146 116 141 923 1030 125 097 112
On-Road Remote Sensing in the Chicago Area Year 7 44
2000
Date Time CO Cal Factor HC Cal Factor NO Cal Factor 911 850 122 094 122 911 1120 112 087 110 911 1805 128 098 135 912 835 129 099 149 913 810 141 111 138 913 1035 118 094 113 914 825 136 103 149 914 1025 135 107 149 914 1235 119 093 125
2002
Date Time CO Cal Factor HC Cal Factor NO Cal Factor 916 1110 135 107 159 917 935 152 119 182 917 1200 135 107 146 918 900 151 119 167 918 1245 136 107 144 919 920 159 131 160 919 1235 139 116 140 920 1230 131 117 168
2004
Date Time CO Cal Factor HC Cal Factor NO Cal Factor 920 900 166 145 147 920 1115 137 114 126 921 845 158 132 135 921 1110 131 111 119 922 800 177 150 158 922 1000 139 119 123 923 800 224 166 187 923 1000 143 122 127
On-Road Remote Sensing in the Chicago Area Year 7 45
2006
Date Time CO Cal Factor HC Cal Factor NO Cal Factor 912 905 169 141 152 913 1000 158 130 151 913 1150 175 138 148 913 1350 148 120 119 914 800 159 130 141 914 1100 143 119 122 915 800 232 191 235 915 930 169 142 156 915 1115 146 122 131
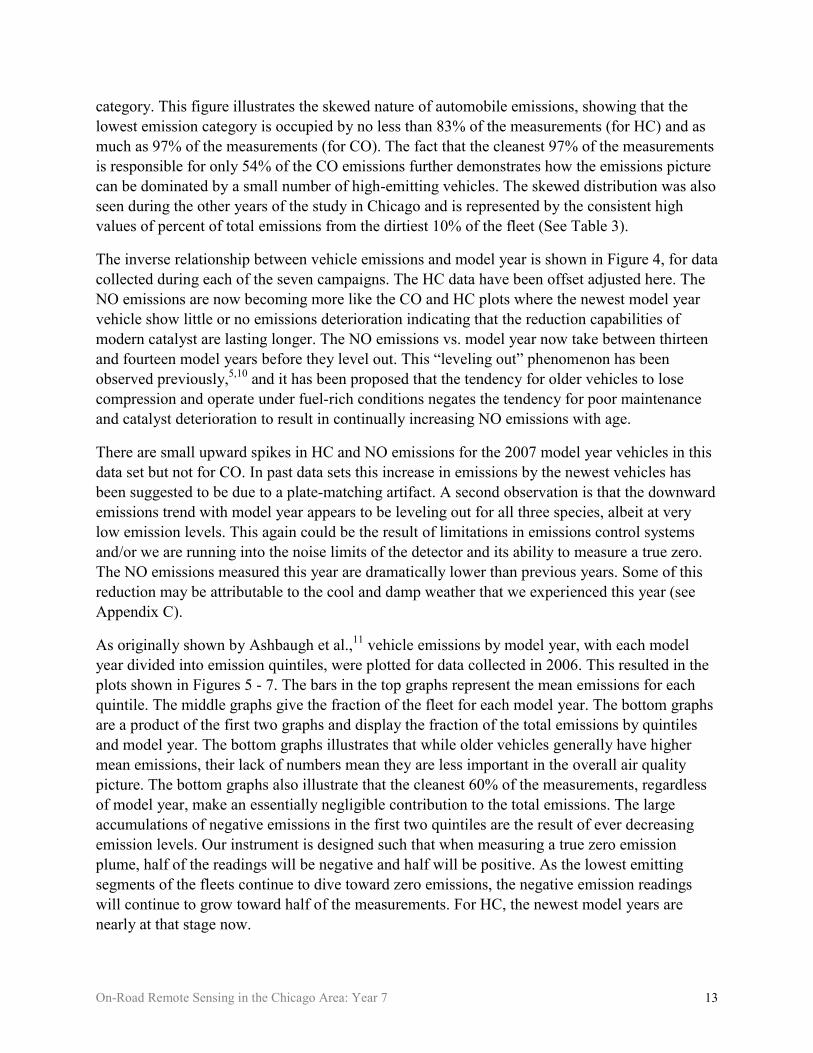
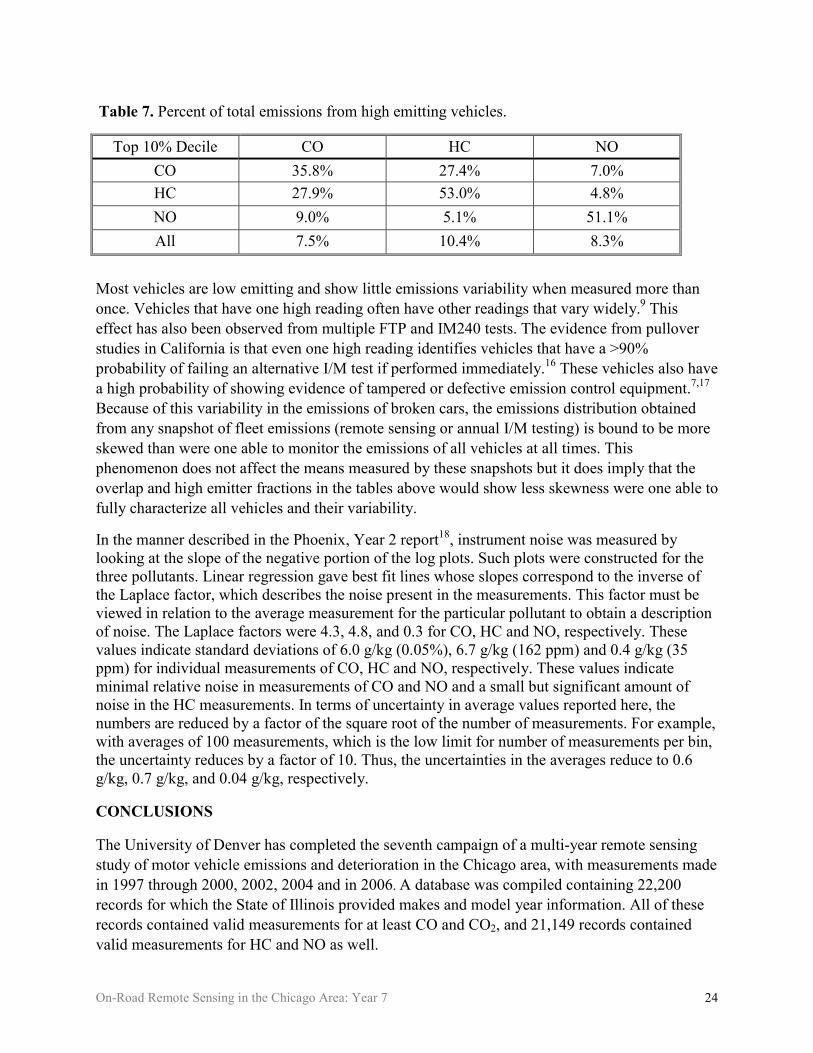

On-Road Remote Sensing in the Chicago Area Year 7 45
2006
Date Time CO Cal Factor HC Cal Factor NO Cal Factor 912 905 169 141 152 913 1000 158 130 151 913 1150 175 138 148 913 1350 148 120 119 914 800 159 130 141 914 1100 143 119 122 915 800 232 191 235 915 930 169 142 156 915 1115 146 122 131