Embed Size (px)
Citation preview
Crash Heat Maps ........................................................................................................................................... A-2
Simulation Report for I-205 Interchange Ramps ........................................................................... A-11
Simulation Report for 82nd Ave / Johnson Creek Blvd (Existing Conditions). ................... A-21
Simulation Report for 82nd Ave / Johnson Creek Blvd (with Project #1030). ................... A-76
Highway Capacity Manual (HCM) Report for 82nd Ave (Ped. Enhancements, Existing) A-131
Highway Capacity Manual (HCM) Report for 82nd Ave (Ped. Enhancements, 90 Sec.) .. A-142
Appendix Memorandum: Task 3.2 MMA Additional Needed Infrastructure Page A-1
Crash Heat Maps
Appendix Memorandum: Task 3.2 MMA Additional Needed Infrastructure Page A-2
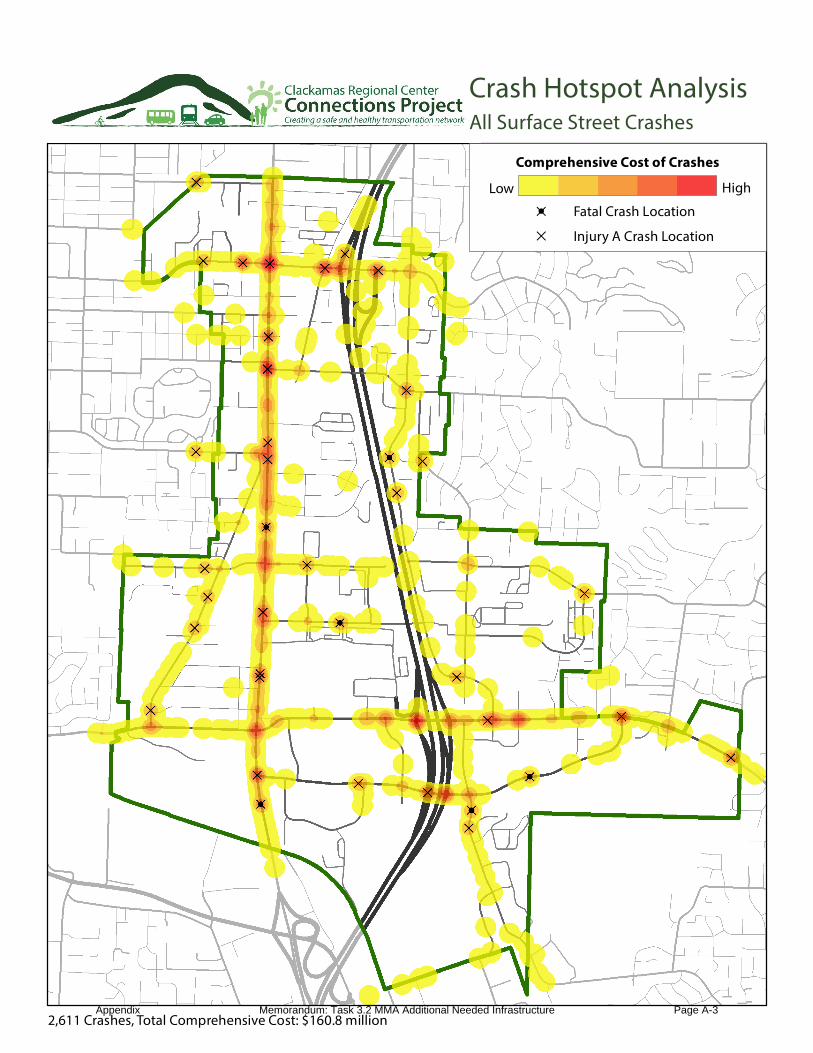
Crash Hotspot AnalysisAll Surface Street Crashes
Comprehensive Cost of Crashes
HighLow
Fatal Crash Location
Injury A Crash LocationD
D!
2,611 Crashes, Total Comprehensive Cost: $160.8 millionAppendix Memorandum: Task 3.2 MMA Additional Needed Infrastructure Page A-3
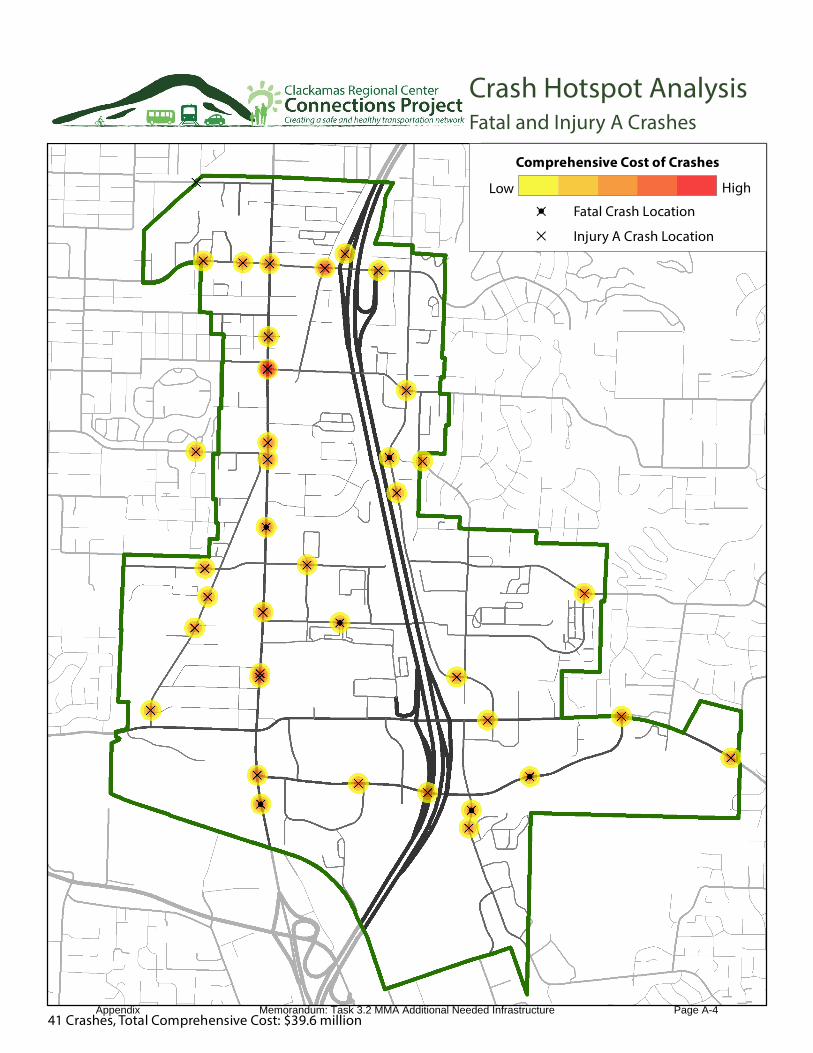
Crash Hotspot AnalysisFatal and Injury A Crashes
Comprehensive Cost of Crashes
HighLow
Fatal Crash Location
Injury A Crash LocationD
D!
41 Crashes, Total Comprehensive Cost: $39.6 millionAppendix Memorandum: Task 3.2 MMA Additional Needed Infrastructure Page A-4
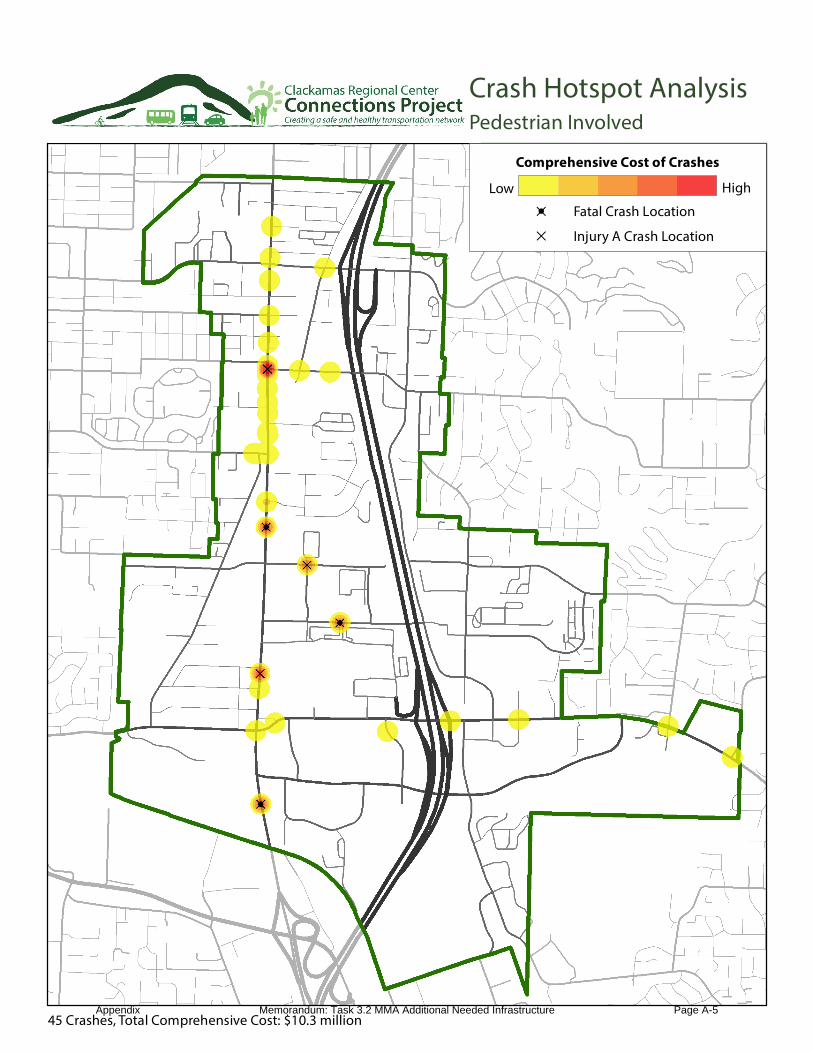
Crash Hotspot AnalysisPedestrian Involved
Comprehensive Cost of Crashes
HighLow
Fatal Crash Location
Injury A Crash LocationD
D!
45 Crashes, Total Comprehensive Cost: $10.3 millionAppendix Memorandum: Task 3.2 MMA Additional Needed Infrastructure Page A-5

Crash Hotspot AnalysisBicycle Involved
Comprehensive Cost of Crashes
HighLow
Fatal Crash Location
Injury A Crash LocationD
D!
39 Crashes, Total Comprehensive Cost: $3.8 millionAppendix Memorandum: Task 3.2 MMA Additional Needed Infrastructure Page A-6
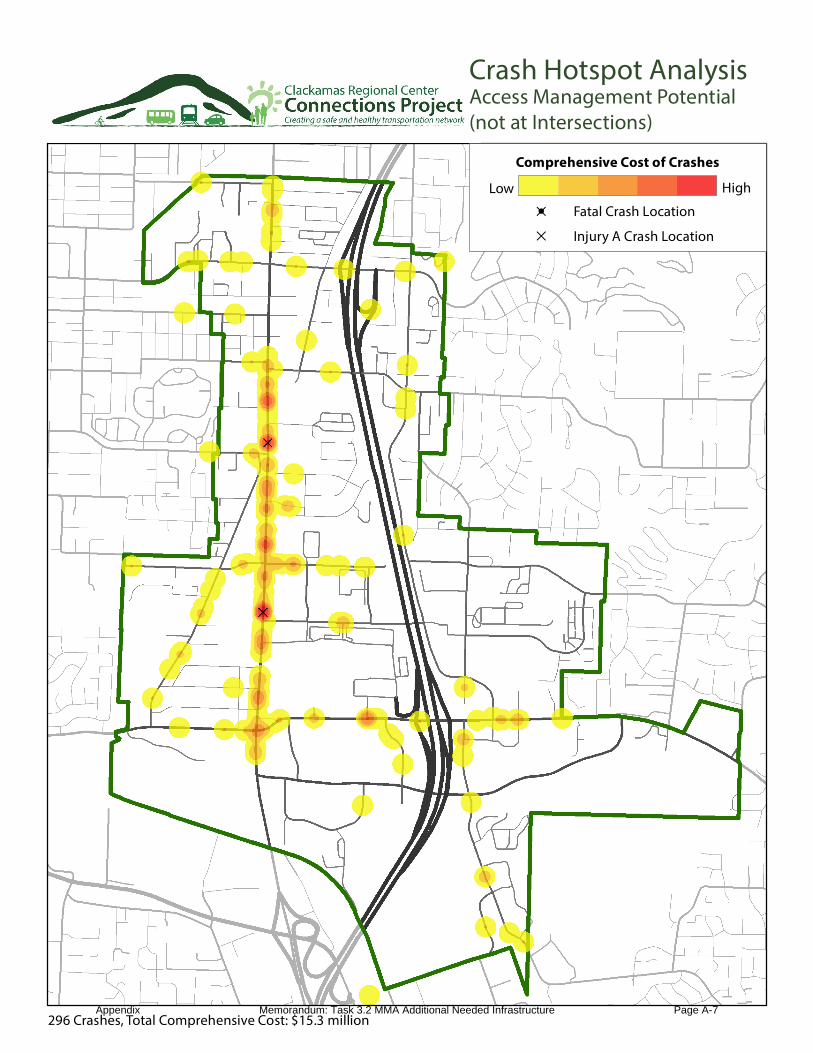
Crash Hotspot AnalysisAccess Management Potential (not at Intersections)
Comprehensive Cost of Crashes
HighLow
Fatal Crash Location
Injury A Crash LocationD
D!
296 Crashes, Total Comprehensive Cost: $15.3 millionAppendix Memorandum: Task 3.2 MMA Additional Needed Infrastructure Page A-7
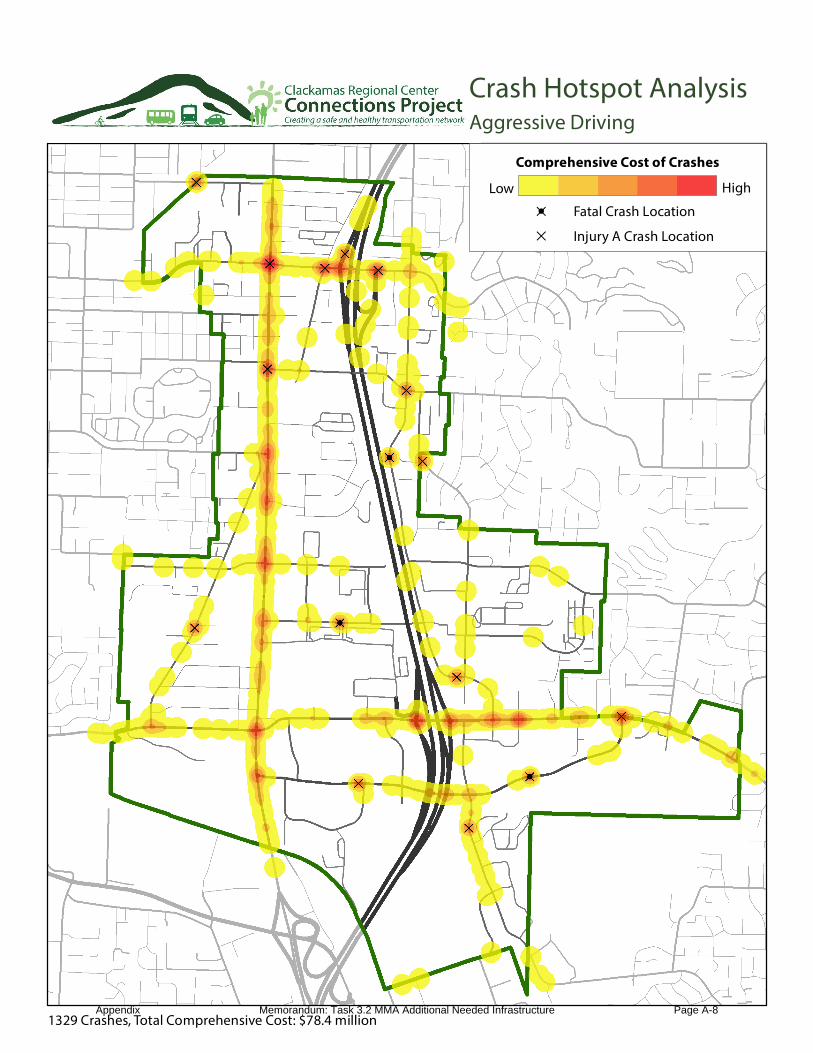
Crash Hotspot AnalysisAggressive Driving
Comprehensive Cost of Crashes
HighLow
Fatal Crash Location
Injury A Crash LocationD
D!
1329 Crashes, Total Comprehensive Cost: $78.4 millionAppendix Memorandum: Task 3.2 MMA Additional Needed Infrastructure Page A-8
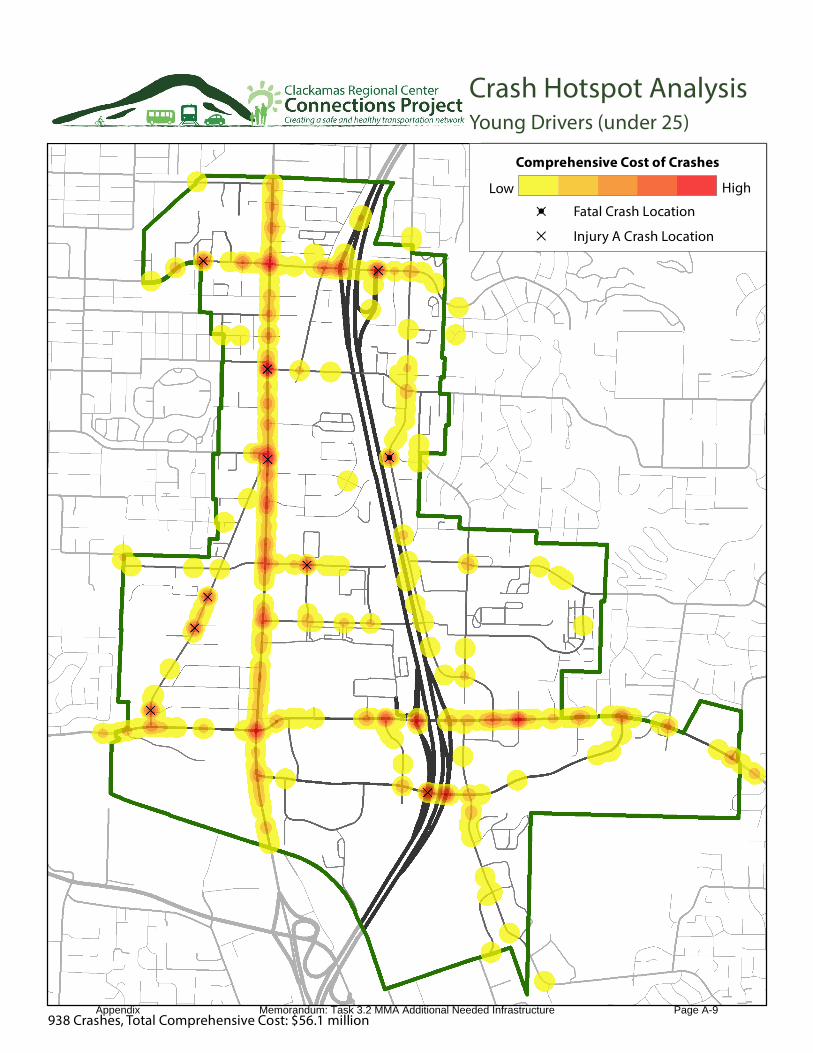
Crash Hotspot AnalysisYoung Drivers (under 25)
Comprehensive Cost of Crashes
HighLow
Fatal Crash Location
Injury A Crash LocationD
D!
938 Crashes, Total Comprehensive Cost: $56.1 millionAppendix Memorandum: Task 3.2 MMA Additional Needed Infrastructure Page A-9
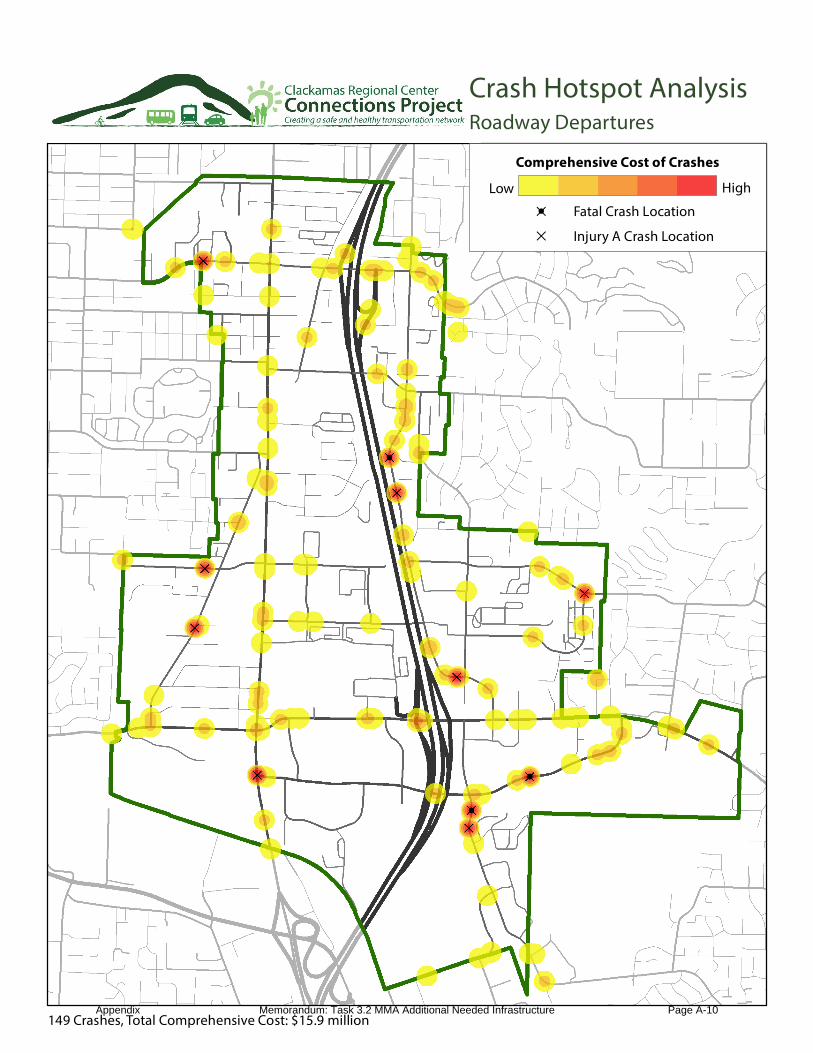
Crash Hotspot AnalysisRoadway Departures
Comprehensive Cost of Crashes
HighLow
Fatal Crash Location
Injury A Crash LocationD
D!
149 Crashes, Total Comprehensive Cost: $15.9 millionAppendix Memorandum: Task 3.2 MMA Additional Needed Infrastructure Page A-10
Simulation Report for I-205 Interchange Ramps
Appendix Memorandum: Task 3.2 MMA Additional Needed Infrastructure Page A-11
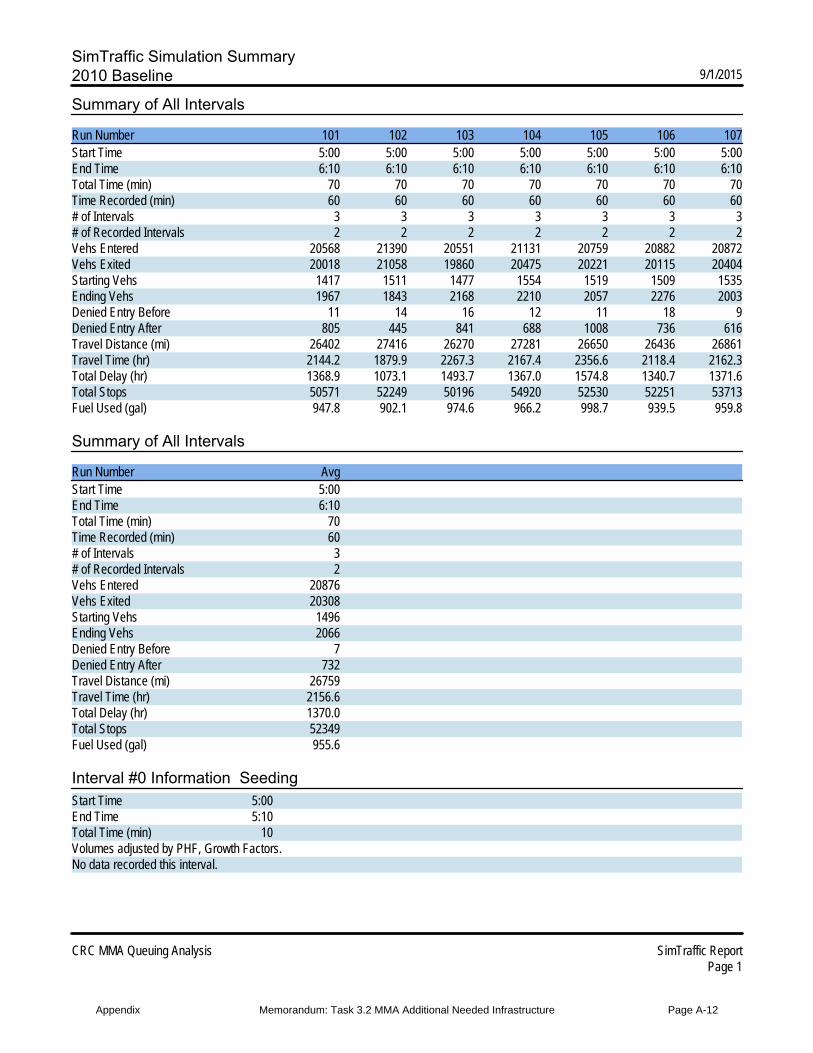
SimTraffic Simulation Summary2010 Baseline 9/1/2015
CRC MMA Queuing Analysis SimTraffic ReportPage 1
Summary of All Intervals
Run Number 101 102 103 104 105 106 107Start Time 5:00 5:00 5:00 5:00 5:00 5:00 5:00End Time 6:10 6:10 6:10 6:10 6:10 6:10 6:10Total Time (min) 70 70 70 70 70 70 70Time Recorded (min) 60 60 60 60 60 60 60# of Intervals 3 3 3 3 3 3 3# of Recorded Intervals 2 2 2 2 2 2 2Vehs Entered 20568 21390 20551 21131 20759 20882 20872Vehs Exited 20018 21058 19860 20475 20221 20115 20404Starting Vehs 1417 1511 1477 1554 1519 1509 1535Ending Vehs 1967 1843 2168 2210 2057 2276 2003Denied Entry Before 11 14 16 12 11 18 9Denied Entry After 805 445 841 688 1008 736 616Travel Distance (mi) 26402 27416 26270 27281 26650 26436 26861Travel Time (hr) 2144.2 1879.9 2267.3 2167.4 2356.6 2118.4 2162.3Total Delay (hr) 1368.9 1073.1 1493.7 1367.0 1574.8 1340.7 1371.6Total Stops 50571 52249 50196 54920 52530 52251 53713Fuel Used (gal) 947.8 902.1 974.6 966.2 998.7 939.5 959.8
Summary of All Intervals
Run Number AvgStart Time 5:00End Time 6:10Total Time (min) 70Time Recorded (min) 60# of Intervals 3# of Recorded Intervals 2Vehs Entered 20876Vehs Exited 20308Starting Vehs 1496Ending Vehs 2066Denied Entry Before 7Denied Entry After 732Travel Distance (mi) 26759Travel Time (hr) 2156.6Total Delay (hr) 1370.0Total Stops 52349Fuel Used (gal) 955.6
Interval #0 Information SeedingStart Time 5:00End Time 5:10Total Time (min) 10Volumes adjusted by PHF, Growth Factors.No data recorded this interval.
Appendix Memorandum: Task 3.2 MMA Additional Needed Infrastructure Page A-12
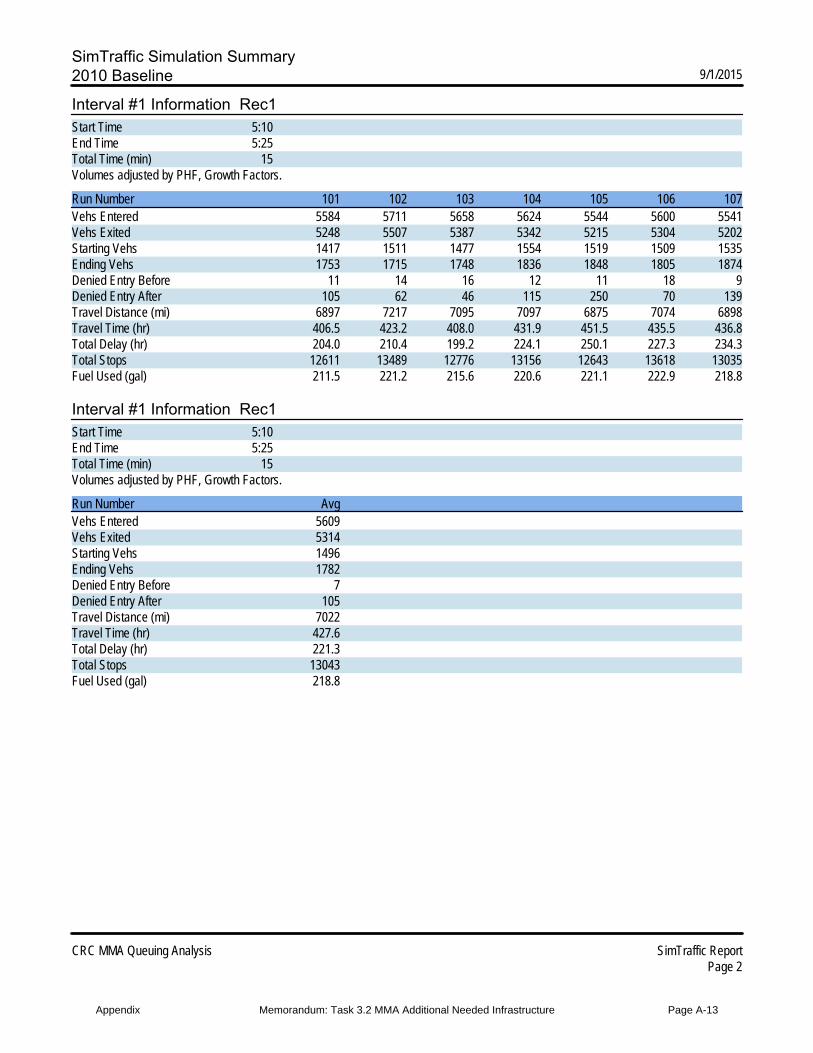
SimTraffic Simulation Summary2010 Baseline 9/1/2015
CRC MMA Queuing Analysis SimTraffic ReportPage 2
Interval #1 Information Rec1Start Time 5:10End Time 5:25Total Time (min) 15Volumes adjusted by PHF, Growth Factors.
Run Number 101 102 103 104 105 106 107Vehs Entered 5584 5711 5658 5624 5544 5600 5541Vehs Exited 5248 5507 5387 5342 5215 5304 5202Starting Vehs 1417 1511 1477 1554 1519 1509 1535Ending Vehs 1753 1715 1748 1836 1848 1805 1874Denied Entry Before 11 14 16 12 11 18 9Denied Entry After 105 62 46 115 250 70 139Travel Distance (mi) 6897 7217 7095 7097 6875 7074 6898Travel Time (hr) 406.5 423.2 408.0 431.9 451.5 435.5 436.8Total Delay (hr) 204.0 210.4 199.2 224.1 250.1 227.3 234.3Total Stops 12611 13489 12776 13156 12643 13618 13035Fuel Used (gal) 211.5 221.2 215.6 220.6 221.1 222.9 218.8
Interval #1 Information Rec1Start Time 5:10End Time 5:25Total Time (min) 15Volumes adjusted by PHF, Growth Factors.
Run Number AvgVehs Entered 5609Vehs Exited 5314Starting Vehs 1496Ending Vehs 1782Denied Entry Before 7Denied Entry After 105Travel Distance (mi) 7022Travel Time (hr) 427.6Total Delay (hr) 221.3Total Stops 13043Fuel Used (gal) 218.8
Appendix Memorandum: Task 3.2 MMA Additional Needed Infrastructure Page A-13
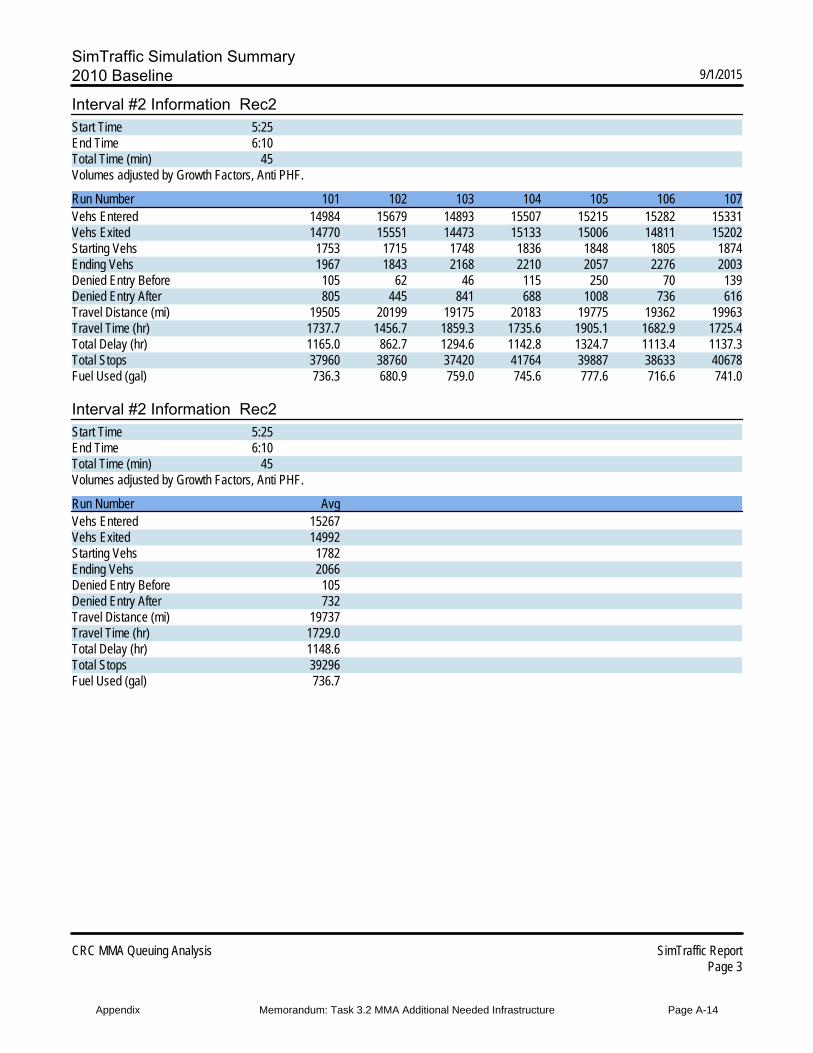
SimTraffic Simulation Summary2010 Baseline 9/1/2015
CRC MMA Queuing Analysis SimTraffic ReportPage 3
Interval #2 Information Rec2Start Time 5:25End Time 6:10Total Time (min) 45Volumes adjusted by Growth Factors, Anti PHF.
Run Number 101 102 103 104 105 106 107Vehs Entered 14984 15679 14893 15507 15215 15282 15331Vehs Exited 14770 15551 14473 15133 15006 14811 15202Starting Vehs 1753 1715 1748 1836 1848 1805 1874Ending Vehs 1967 1843 2168 2210 2057 2276 2003Denied Entry Before 105 62 46 115 250 70 139Denied Entry After 805 445 841 688 1008 736 616Travel Distance (mi) 19505 20199 19175 20183 19775 19362 19963Travel Time (hr) 1737.7 1456.7 1859.3 1735.6 1905.1 1682.9 1725.4Total Delay (hr) 1165.0 862.7 1294.6 1142.8 1324.7 1113.4 1137.3Total Stops 37960 38760 37420 41764 39887 38633 40678Fuel Used (gal) 736.3 680.9 759.0 745.6 777.6 716.6 741.0
Interval #2 Information Rec2Start Time 5:25End Time 6:10Total Time (min) 45Volumes adjusted by Growth Factors, Anti PHF.
Run Number AvgVehs Entered 15267Vehs Exited 14992Starting Vehs 1782Ending Vehs 2066Denied Entry Before 105Denied Entry After 732Travel Distance (mi) 19737Travel Time (hr) 1729.0Total Delay (hr) 1148.6Total Stops 39296Fuel Used (gal) 736.7
Appendix Memorandum: Task 3.2 MMA Additional Needed Infrastructure Page A-14
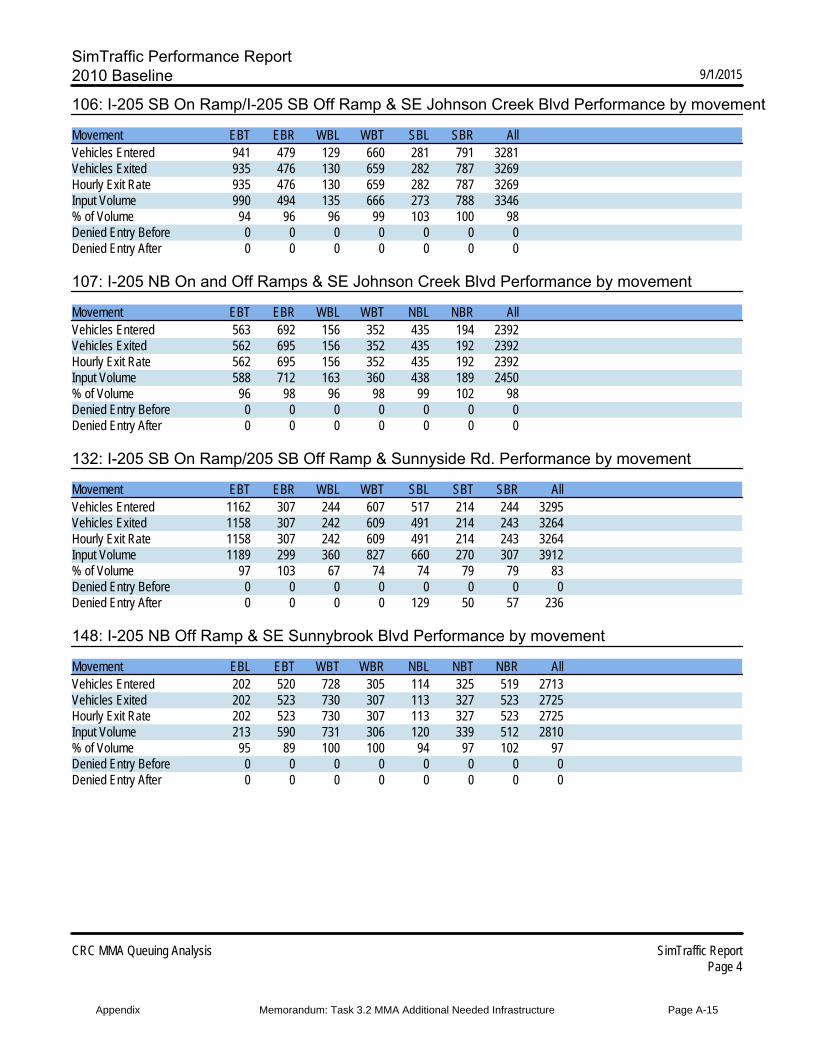
SimTraffic Performance Report2010 Baseline 9/1/2015
CRC MMA Queuing Analysis SimTraffic ReportPage 4
106: I-205 SB On Ramp/I-205 SB Off Ramp & SE Johnson Creek Blvd Performance by movement
Movement EBT EBR WBL WBT SBL SBR AllVehicles Entered 941 479 129 660 281 791 3281Vehicles Exited 935 476 130 659 282 787 3269Hourly Exit Rate 935 476 130 659 282 787 3269Input Volume 990 494 135 666 273 788 3346% of Volume 94 96 96 99 103 100 98Denied Entry Before 0 0 0 0 0 0 0Denied Entry After 0 0 0 0 0 0 0
107: I-205 NB On and Off Ramps & SE Johnson Creek Blvd Performance by movement
Movement EBT EBR WBL WBT NBL NBR AllVehicles Entered 563 692 156 352 435 194 2392Vehicles Exited 562 695 156 352 435 192 2392Hourly Exit Rate 562 695 156 352 435 192 2392Input Volume 588 712 163 360 438 189 2450% of Volume 96 98 96 98 99 102 98Denied Entry Before 0 0 0 0 0 0 0Denied Entry After 0 0 0 0 0 0 0
132: I-205 SB On Ramp/205 SB Off Ramp & Sunnyside Rd. Performance by movement
Movement EBT EBR WBL WBT SBL SBT SBR AllVehicles Entered 1162 307 244 607 517 214 244 3295Vehicles Exited 1158 307 242 609 491 214 243 3264Hourly Exit Rate 1158 307 242 609 491 214 243 3264Input Volume 1189 299 360 827 660 270 307 3912% of Volume 97 103 67 74 74 79 79 83Denied Entry Before 0 0 0 0 0 0 0 0Denied Entry After 0 0 0 0 129 50 57 236
148: I-205 NB Off Ramp & SE Sunnybrook Blvd Performance by movement
Movement EBL EBT WBT WBR NBL NBT NBR AllVehicles Entered 202 520 728 305 114 325 519 2713Vehicles Exited 202 523 730 307 113 327 523 2725Hourly Exit Rate 202 523 730 307 113 327 523 2725Input Volume 213 590 731 306 120 339 512 2810% of Volume 95 89 100 100 94 97 102 97Denied Entry Before 0 0 0 0 0 0 0 0Denied Entry After 0 0 0 0 0 0 0 0
Appendix Memorandum: Task 3.2 MMA Additional Needed Infrastructure Page A-15
SimTraffic Performance Report2010 Baseline 9/1/2015
CRC MMA Queuing Analysis SimTraffic ReportPage 5
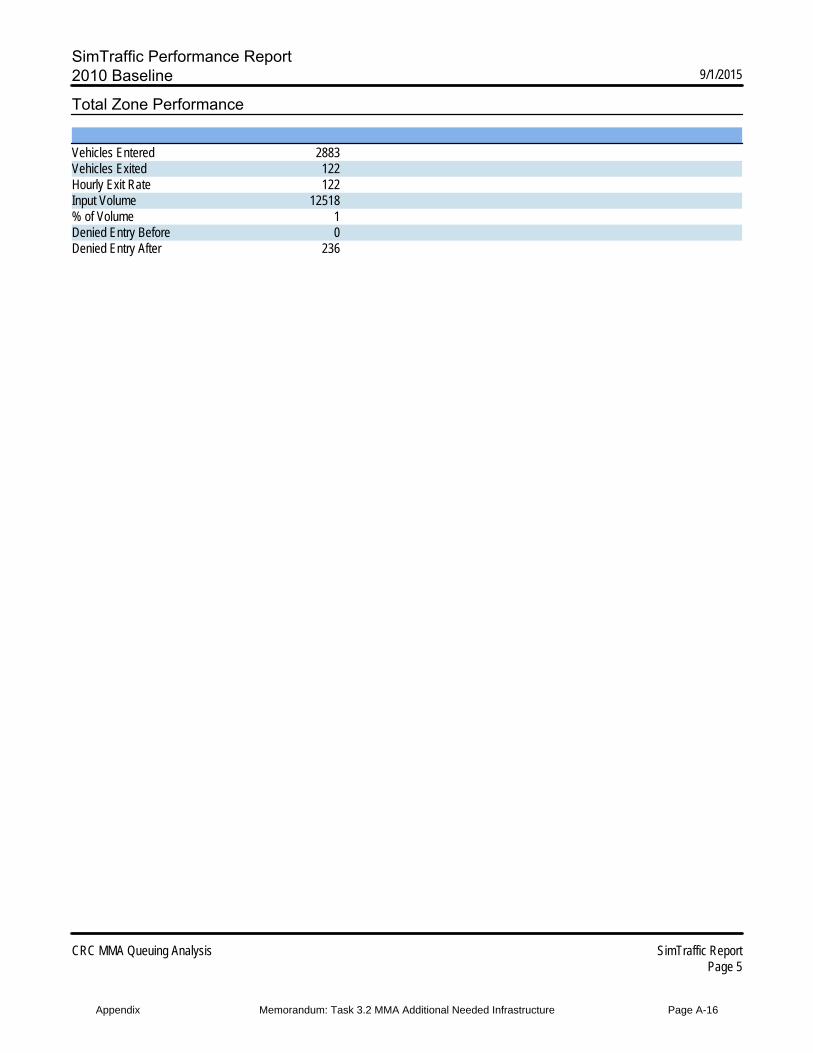
Total Zone Performance
Vehicles Entered 2883Vehicles Exited 122Hourly Exit Rate 122Input Volume 12518% of Volume 1Denied Entry Before 0Denied Entry After 236
Appendix Memorandum: Task 3.2 MMA Additional Needed Infrastructure Page A-16

Queuing and Blocking Report2010 Baseline 9/1/2015
CRC MMA Queuing Analysis SimTraffic ReportPage 6
Intersection: 106: I-205 SB On Ramp/I-205 SB Off Ramp & SE Johnson Creek Blvd
Movement EB EB EB WB WB WB SB SBDirections Served T T R L T T L RMaximum Queue (ft) 221 266 145 183 244 216 475 836Average Queue (ft) 90 184 20 99 120 93 274 44495th Queue (ft) 199 300 93 167 204 168 514 930Link Distance (ft) 219 219 219 618 618 2112Upstream Blk Time (%) 0 8 0Queuing Penalty (veh) 2 39 0Storage Bay Dist (ft) 170 400Storage Blk Time (%) 2 3 0 19Queuing Penalty (veh) 6 4 1 51
Intersection: 107: I-205 NB On and Off Ramps & SE Johnson Creek Blvd
Movement EB EB EB WB WB WB NB NB NBDirections Served T T R L T T L L RMaximum Queue (ft) 173 190 245 194 175 124 235 220 126Average Queue (ft) 84 83 118 110 58 42 139 136 5495th Queue (ft) 153 157 206 182 126 92 211 199 97Link Distance (ft) 618 618 618 579 579 2271Upstream Blk Time (%)Queuing Penalty (veh)Storage Bay Dist (ft) 180 450 450Storage Blk Time (%) 2Queuing Penalty (veh) 4
Intersection: 132: I-205 SB On Ramp/205 SB Off Ramp & Sunnyside Rd.
Movement EB EB EB EB WB WB WB SB SB SB SBDirections Served T T T R L T T L LT T RMaximum Queue (ft) 265 201 178 163 204 621 621 650 1126 1110 650Average Queue (ft) 112 79 78 27 202 601 269 631 1043 1005 18295th Queue (ft) 226 170 155 103 211 678 685 728 1325 1376 591Link Distance (ft) 501 501 501 501 601 601 1091 1091Upstream Blk Time (%) 44 5 63 42Queuing Penalty (veh) 259 32 0 0Storage Bay Dist (ft) 180 450 450Storage Blk Time (%) 78 0 87 88 16Queuing Penalty (veh) 311 0 402 291 50
Appendix Memorandum: Task 3.2 MMA Additional Needed Infrastructure Page A-17
Queuing and Blocking Report2010 Baseline 9/1/2015
CRC MMA Queuing Analysis SimTraffic ReportPage 7
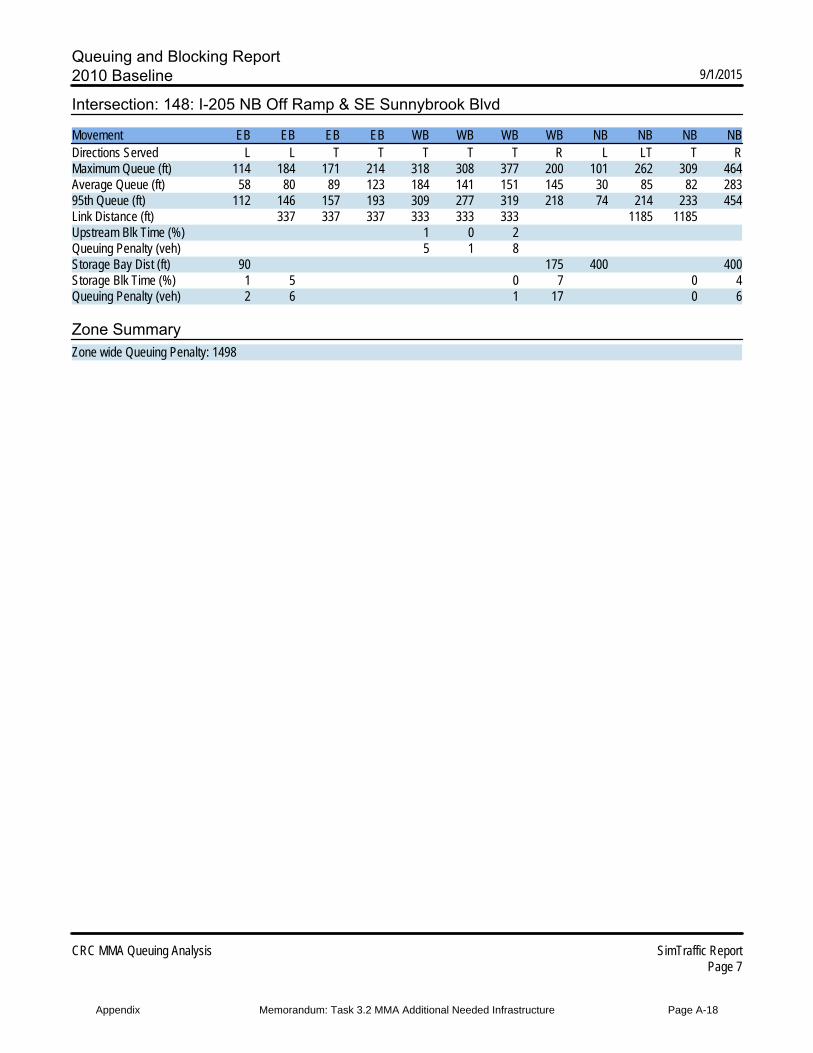
Intersection: 148: I-205 NB Off Ramp & SE Sunnybrook Blvd
Movement EB EB EB EB WB WB WB WB NB NB NB NBDirections Served L L T T T T T R L LT T RMaximum Queue (ft) 114 184 171 214 318 308 377 200 101 262 309 464Average Queue (ft) 58 80 89 123 184 141 151 145 30 85 82 28395th Queue (ft) 112 146 157 193 309 277 319 218 74 214 233 454Link Distance (ft) 337 337 337 333 333 333 1185 1185Upstream Blk Time (%) 1 0 2Queuing Penalty (veh) 5 1 8Storage Bay Dist (ft) 90 175 400 400Storage Blk Time (%) 1 5 0 7 0 4Queuing Penalty (veh) 2 6 1 17 0 6
Zone SummaryZone wide Queuing Penalty: 1498
Appendix Memorandum: Task 3.2 MMA Additional Needed Infrastructure Page A-18
Actuated Signals, Observed Splits2010 Baseline 9/1/2015
CRC MMA Queuing Analysis SimTraffic ReportPage 8
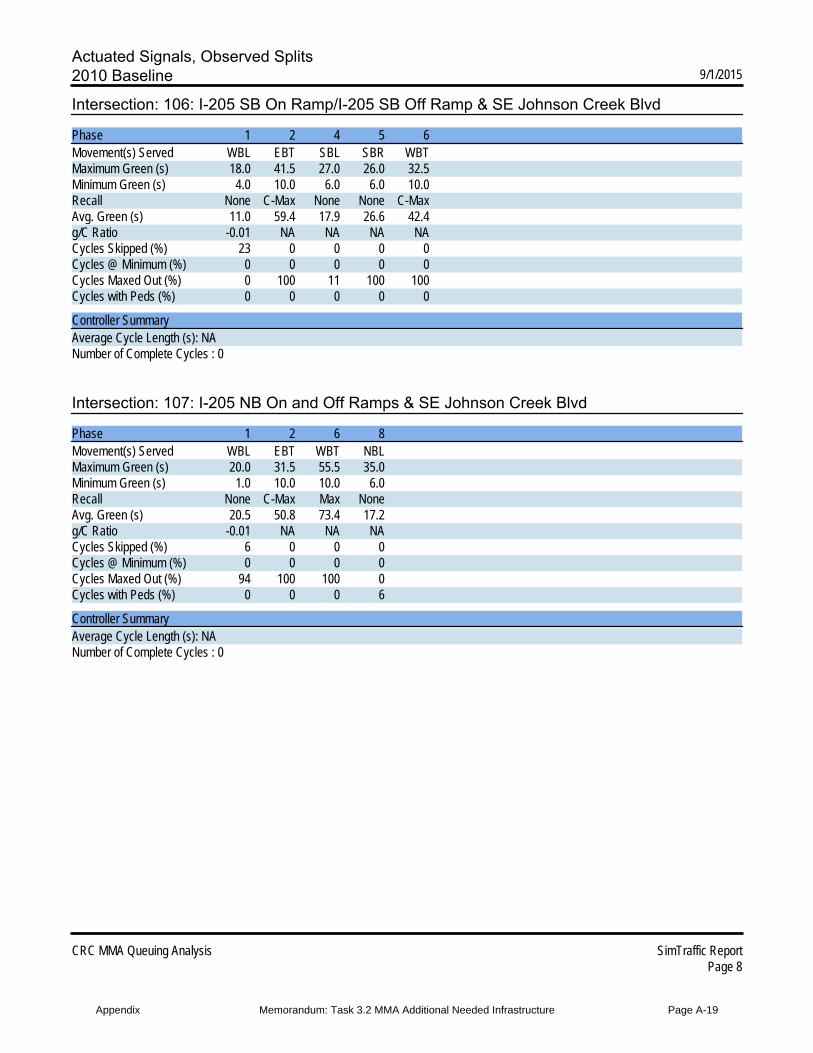
Intersection: 106: I-205 SB On Ramp/I-205 SB Off Ramp & SE Johnson Creek Blvd
Phase 1 2 4 5 6Movement(s) Served WBL EBT SBL SBR WBTMaximum Green (s) 18.0 41.5 27.0 26.0 32.5Minimum Green (s) 4.0 10.0 6.0 6.0 10.0Recall None C-Max None None C-MaxAvg. Green (s) 11.0 59.4 17.9 26.6 42.4g/C Ratio -0.01 NA NA NA NACycles Skipped (%) 23 0 0 0 0Cycles @ Minimum (%) 0 0 0 0 0Cycles Maxed Out (%) 0 100 11 100 100Cycles with Peds (%) 0 0 0 0 0
Controller SummaryAverage Cycle Length (s): NANumber of Complete Cycles : 0
Intersection: 107: I-205 NB On and Off Ramps & SE Johnson Creek Blvd
Phase 1 2 6 8Movement(s) Served WBL EBT WBT NBLMaximum Green (s) 20.0 31.5 55.5 35.0Minimum Green (s) 1.0 10.0 10.0 6.0Recall None C-Max Max NoneAvg. Green (s) 20.5 50.8 73.4 17.2g/C Ratio -0.01 NA NA NACycles Skipped (%) 6 0 0 0Cycles @ Minimum (%) 0 0 0 0Cycles Maxed Out (%) 94 100 100 0Cycles with Peds (%) 0 0 0 6
Controller SummaryAverage Cycle Length (s): NANumber of Complete Cycles : 0
Appendix Memorandum: Task 3.2 MMA Additional Needed Infrastructure Page A-19
Actuated Signals, Observed Splits2010 Baseline 9/1/2015
CRC MMA Queuing Analysis SimTraffic ReportPage 9
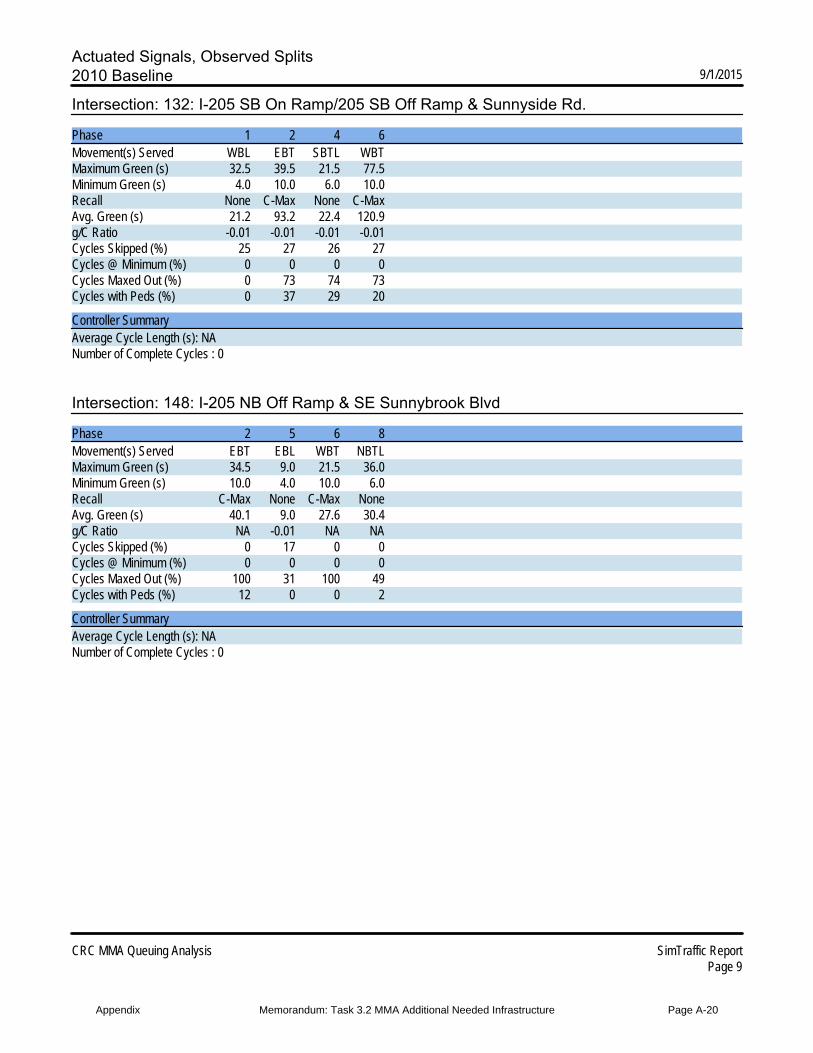
Intersection: 132: I-205 SB On Ramp/205 SB Off Ramp & Sunnyside Rd.
Phase 1 2 4 6Movement(s) Served WBL EBT SBTL WBTMaximum Green (s) 32.5 39.5 21.5 77.5Minimum Green (s) 4.0 10.0 6.0 10.0Recall None C-Max None C-MaxAvg. Green (s) 21.2 93.2 22.4 120.9g/C Ratio -0.01 -0.01 -0.01 -0.01Cycles Skipped (%) 25 27 26 27Cycles @ Minimum (%) 0 0 0 0Cycles Maxed Out (%) 0 73 74 73Cycles with Peds (%) 0 37 29 20
Controller SummaryAverage Cycle Length (s): NANumber of Complete Cycles : 0
Intersection: 148: I-205 NB Off Ramp & SE Sunnybrook Blvd
Phase 2 5 6 8Movement(s) Served EBT EBL WBT NBTLMaximum Green (s) 34.5 9.0 21.5 36.0Minimum Green (s) 10.0 4.0 10.0 6.0Recall C-Max None C-Max NoneAvg. Green (s) 40.1 9.0 27.6 30.4g/C Ratio NA -0.01 NA NACycles Skipped (%) 0 17 0 0Cycles @ Minimum (%) 0 0 0 0Cycles Maxed Out (%) 100 31 100 49Cycles with Peds (%) 12 0 0 2
Controller SummaryAverage Cycle Length (s): NANumber of Complete Cycles : 0
Appendix Memorandum: Task 3.2 MMA Additional Needed Infrastructure Page A-20
Simulation Report for 82nd Ave / Johnson Creek Blvd (Existing Conditions)
Appendix Memorandum: Task 3.2 MMA Additional Needed Infrastructure Page A-21
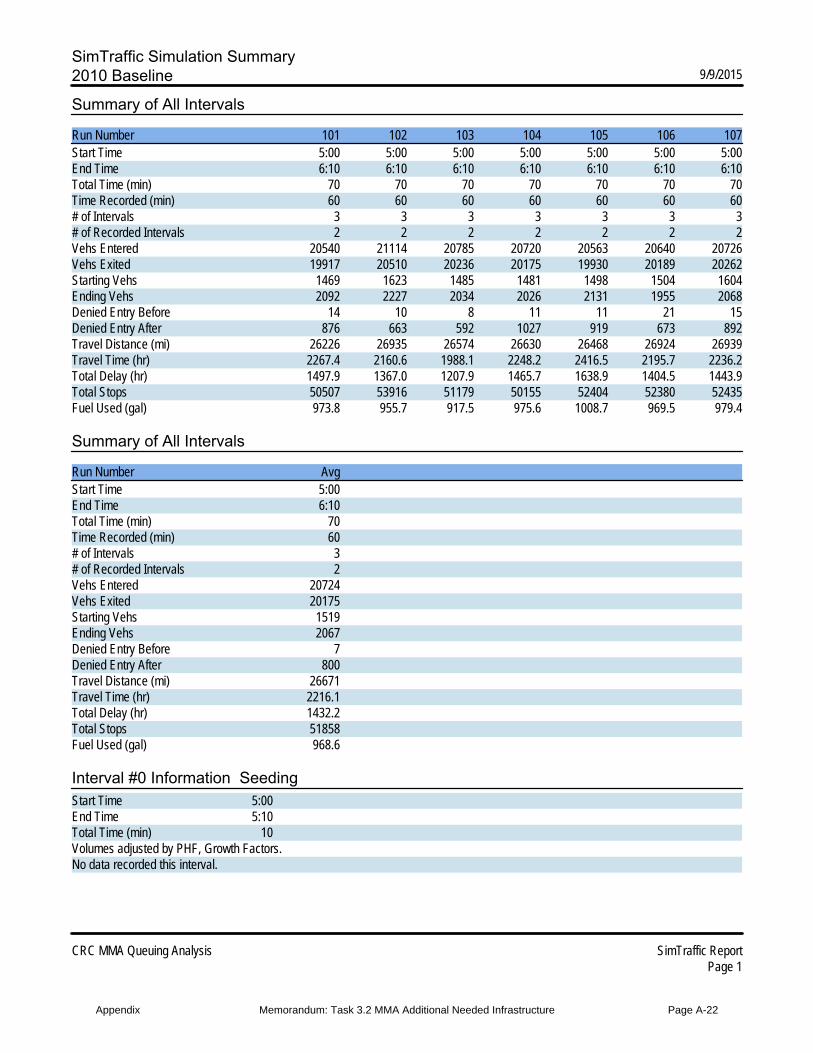
SimTraffic Simulation Summary2010 Baseline 9/9/2015
CRC MMA Queuing Analysis SimTraffic ReportPage 1
Summary of All Intervals
Run Number 101 102 103 104 105 106 107Start Time 5:00 5:00 5:00 5:00 5:00 5:00 5:00End Time 6:10 6:10 6:10 6:10 6:10 6:10 6:10Total Time (min) 70 70 70 70 70 70 70Time Recorded (min) 60 60 60 60 60 60 60# of Intervals 3 3 3 3 3 3 3# of Recorded Intervals 2 2 2 2 2 2 2Vehs Entered 20540 21114 20785 20720 20563 20640 20726Vehs Exited 19917 20510 20236 20175 19930 20189 20262Starting Vehs 1469 1623 1485 1481 1498 1504 1604Ending Vehs 2092 2227 2034 2026 2131 1955 2068Denied Entry Before 14 10 8 11 11 21 15Denied Entry After 876 663 592 1027 919 673 892Travel Distance (mi) 26226 26935 26574 26630 26468 26924 26939Travel Time (hr) 2267.4 2160.6 1988.1 2248.2 2416.5 2195.7 2236.2Total Delay (hr) 1497.9 1367.0 1207.9 1465.7 1638.9 1404.5 1443.9Total Stops 50507 53916 51179 50155 52404 52380 52435Fuel Used (gal) 973.8 955.7 917.5 975.6 1008.7 969.5 979.4
Summary of All Intervals
Run Number AvgStart Time 5:00End Time 6:10Total Time (min) 70Time Recorded (min) 60# of Intervals 3# of Recorded Intervals 2Vehs Entered 20724Vehs Exited 20175Starting Vehs 1519Ending Vehs 2067Denied Entry Before 7Denied Entry After 800Travel Distance (mi) 26671Travel Time (hr) 2216.1Total Delay (hr) 1432.2Total Stops 51858Fuel Used (gal) 968.6
Interval #0 Information SeedingStart Time 5:00End Time 5:10Total Time (min) 10Volumes adjusted by PHF, Growth Factors.No data recorded this interval.
Appendix Memorandum: Task 3.2 MMA Additional Needed Infrastructure Page A-22
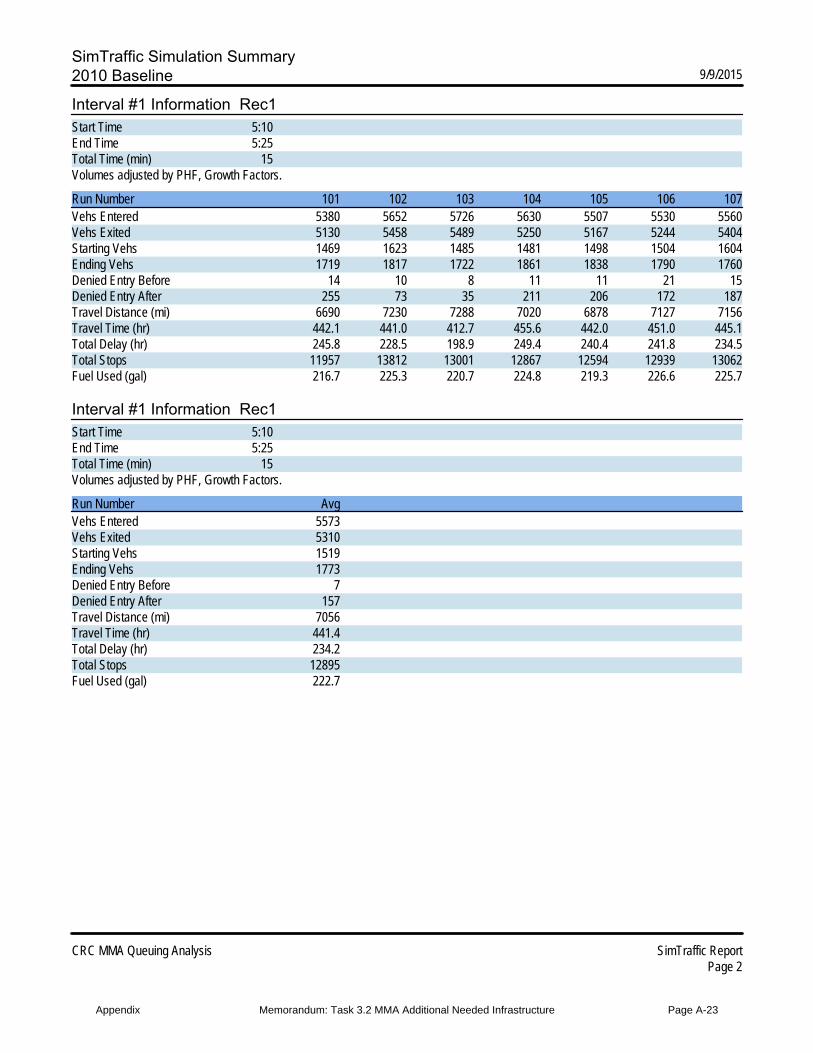
SimTraffic Simulation Summary2010 Baseline 9/9/2015
CRC MMA Queuing Analysis SimTraffic ReportPage 2
Interval #1 Information Rec1Start Time 5:10End Time 5:25Total Time (min) 15Volumes adjusted by PHF, Growth Factors.
Run Number 101 102 103 104 105 106 107Vehs Entered 5380 5652 5726 5630 5507 5530 5560Vehs Exited 5130 5458 5489 5250 5167 5244 5404Starting Vehs 1469 1623 1485 1481 1498 1504 1604Ending Vehs 1719 1817 1722 1861 1838 1790 1760Denied Entry Before 14 10 8 11 11 21 15Denied Entry After 255 73 35 211 206 172 187Travel Distance (mi) 6690 7230 7288 7020 6878 7127 7156Travel Time (hr) 442.1 441.0 412.7 455.6 442.0 451.0 445.1Total Delay (hr) 245.8 228.5 198.9 249.4 240.4 241.8 234.5Total Stops 11957 13812 13001 12867 12594 12939 13062Fuel Used (gal) 216.7 225.3 220.7 224.8 219.3 226.6 225.7
Interval #1 Information Rec1Start Time 5:10End Time 5:25Total Time (min) 15Volumes adjusted by PHF, Growth Factors.
Run Number AvgVehs Entered 5573Vehs Exited 5310Starting Vehs 1519Ending Vehs 1773Denied Entry Before 7Denied Entry After 157Travel Distance (mi) 7056Travel Time (hr) 441.4Total Delay (hr) 234.2Total Stops 12895Fuel Used (gal) 222.7
Appendix Memorandum: Task 3.2 MMA Additional Needed Infrastructure Page A-23
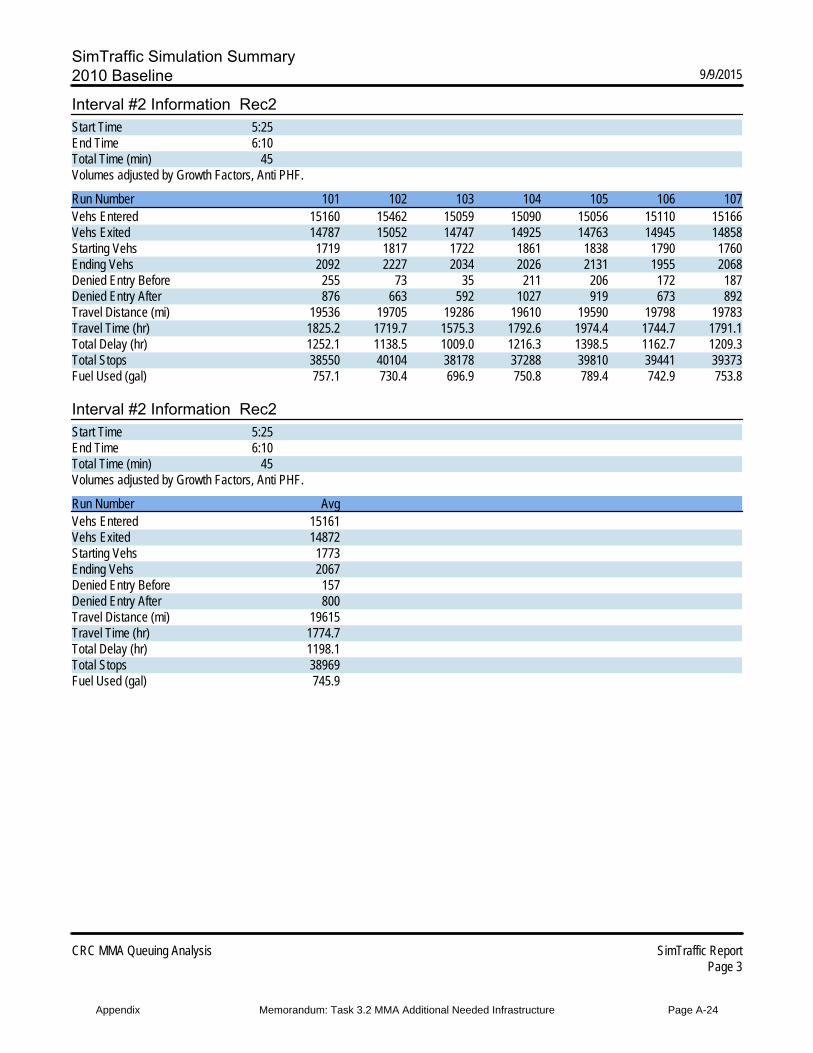
SimTraffic Simulation Summary2010 Baseline 9/9/2015
CRC MMA Queuing Analysis SimTraffic ReportPage 3
Interval #2 Information Rec2Start Time 5:25End Time 6:10Total Time (min) 45Volumes adjusted by Growth Factors, Anti PHF.
Run Number 101 102 103 104 105 106 107Vehs Entered 15160 15462 15059 15090 15056 15110 15166Vehs Exited 14787 15052 14747 14925 14763 14945 14858Starting Vehs 1719 1817 1722 1861 1838 1790 1760Ending Vehs 2092 2227 2034 2026 2131 1955 2068Denied Entry Before 255 73 35 211 206 172 187Denied Entry After 876 663 592 1027 919 673 892Travel Distance (mi) 19536 19705 19286 19610 19590 19798 19783Travel Time (hr) 1825.2 1719.7 1575.3 1792.6 1974.4 1744.7 1791.1Total Delay (hr) 1252.1 1138.5 1009.0 1216.3 1398.5 1162.7 1209.3Total Stops 38550 40104 38178 37288 39810 39441 39373Fuel Used (gal) 757.1 730.4 696.9 750.8 789.4 742.9 753.8
Interval #2 Information Rec2Start Time 5:25End Time 6:10Total Time (min) 45Volumes adjusted by Growth Factors, Anti PHF.
Run Number AvgVehs Entered 15161Vehs Exited 14872Starting Vehs 1773Ending Vehs 2067Denied Entry Before 157Denied Entry After 800Travel Distance (mi) 19615Travel Time (hr) 1774.7Total Delay (hr) 1198.1Total Stops 38969Fuel Used (gal) 745.9
Appendix Memorandum: Task 3.2 MMA Additional Needed Infrastructure Page A-24
SimTraffic Performance Report2010 Baseline 9/9/2015
CRC MMA Queuing Analysis SimTraffic ReportPage 4
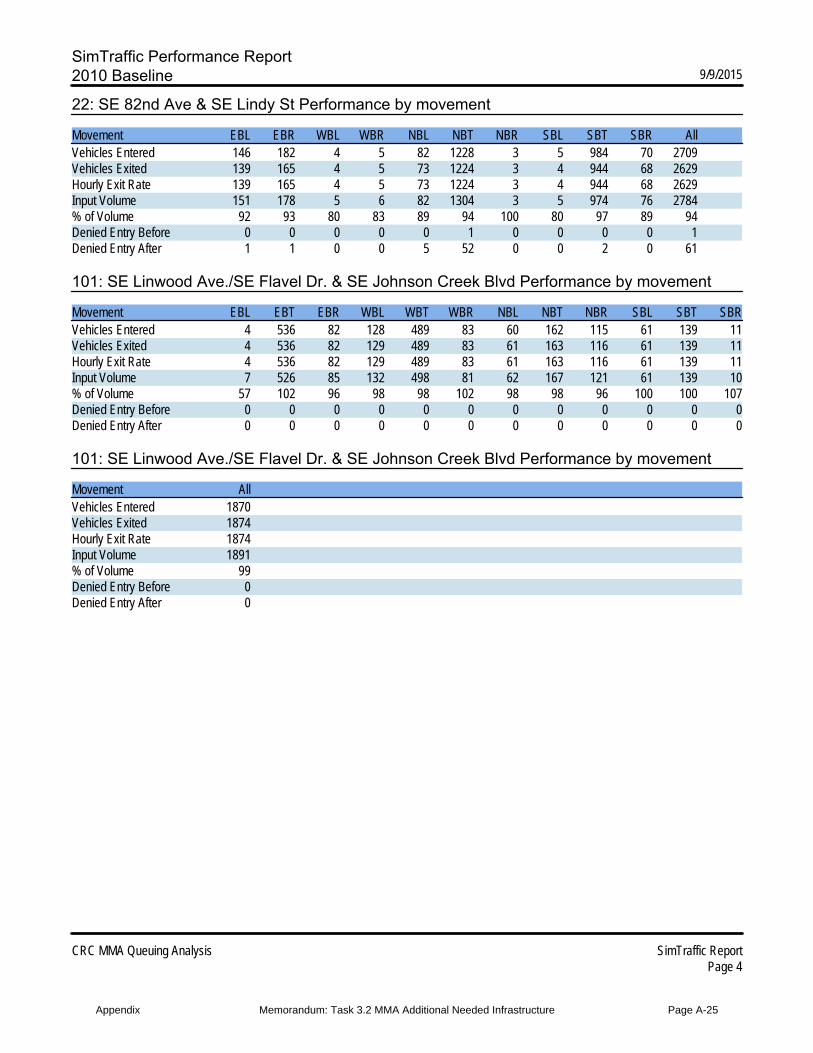
22: SE 82nd Ave & SE Lindy St Performance by movement
Movement EBL EBR WBL WBR NBL NBT NBR SBL SBT SBR AllVehicles Entered 146 182 4 5 82 1228 3 5 984 70 2709Vehicles Exited 139 165 4 5 73 1224 3 4 944 68 2629Hourly Exit Rate 139 165 4 5 73 1224 3 4 944 68 2629Input Volume 151 178 5 6 82 1304 3 5 974 76 2784% of Volume 92 93 80 83 89 94 100 80 97 89 94Denied Entry Before 0 0 0 0 0 1 0 0 0 0 1Denied Entry After 1 1 0 0 5 52 0 0 2 0 61
101: SE Linwood Ave./SE Flavel Dr. & SE Johnson Creek Blvd Performance by movement
Movement EBL EBT EBR WBL WBT WBR NBL NBT NBR SBL SBT SBRVehicles Entered 4 536 82 128 489 83 60 162 115 61 139 11Vehicles Exited 4 536 82 129 489 83 61 163 116 61 139 11Hourly Exit Rate 4 536 82 129 489 83 61 163 116 61 139 11Input Volume 7 526 85 132 498 81 62 167 121 61 139 10% of Volume 57 102 96 98 98 102 98 98 96 100 100 107Denied Entry Before 0 0 0 0 0 0 0 0 0 0 0 0Denied Entry After 0 0 0 0 0 0 0 0 0 0 0 0
101: SE Linwood Ave./SE Flavel Dr. & SE Johnson Creek Blvd Performance by movement
Movement AllVehicles Entered 1870Vehicles Exited 1874Hourly Exit Rate 1874Input Volume 1891% of Volume 99Denied Entry Before 0Denied Entry After 0
Appendix Memorandum: Task 3.2 MMA Additional Needed Infrastructure Page A-25
SimTraffic Performance Report2010 Baseline 9/9/2015
CRC MMA Queuing Analysis SimTraffic ReportPage 5
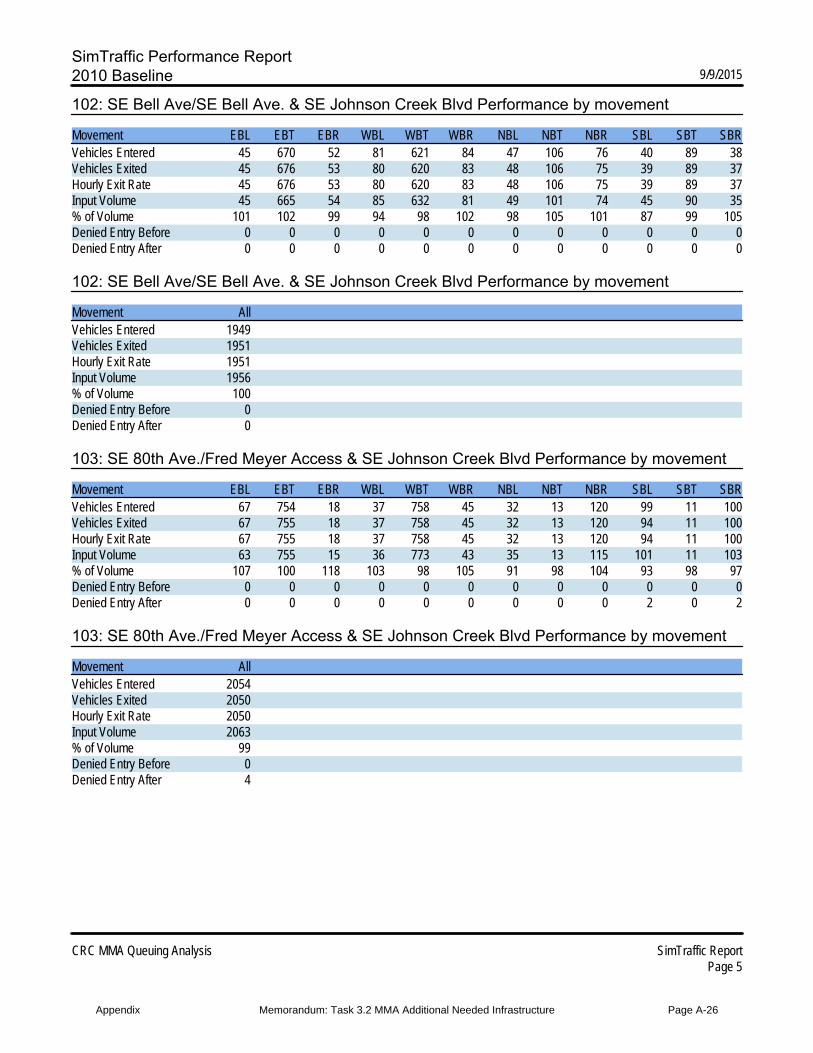
102: SE Bell Ave/SE Bell Ave. & SE Johnson Creek Blvd Performance by movement
Movement EBL EBT EBR WBL WBT WBR NBL NBT NBR SBL SBT SBRVehicles Entered 45 670 52 81 621 84 47 106 76 40 89 38Vehicles Exited 45 676 53 80 620 83 48 106 75 39 89 37Hourly Exit Rate 45 676 53 80 620 83 48 106 75 39 89 37Input Volume 45 665 54 85 632 81 49 101 74 45 90 35% of Volume 101 102 99 94 98 102 98 105 101 87 99 105Denied Entry Before 0 0 0 0 0 0 0 0 0 0 0 0Denied Entry After 0 0 0 0 0 0 0 0 0 0 0 0
102: SE Bell Ave/SE Bell Ave. & SE Johnson Creek Blvd Performance by movement
Movement AllVehicles Entered 1949Vehicles Exited 1951Hourly Exit Rate 1951Input Volume 1956% of Volume 100Denied Entry Before 0Denied Entry After 0
103: SE 80th Ave./Fred Meyer Access & SE Johnson Creek Blvd Performance by movement
Movement EBL EBT EBR WBL WBT WBR NBL NBT NBR SBL SBT SBRVehicles Entered 67 754 18 37 758 45 32 13 120 99 11 100Vehicles Exited 67 755 18 37 758 45 32 13 120 94 11 100Hourly Exit Rate 67 755 18 37 758 45 32 13 120 94 11 100Input Volume 63 755 15 36 773 43 35 13 115 101 11 103% of Volume 107 100 118 103 98 105 91 98 104 93 98 97Denied Entry Before 0 0 0 0 0 0 0 0 0 0 0 0Denied Entry After 0 0 0 0 0 0 0 0 0 2 0 2
103: SE 80th Ave./Fred Meyer Access & SE Johnson Creek Blvd Performance by movement
Movement AllVehicles Entered 2054Vehicles Exited 2050Hourly Exit Rate 2050Input Volume 2063% of Volume 99Denied Entry Before 0Denied Entry After 4
Appendix Memorandum: Task 3.2 MMA Additional Needed Infrastructure Page A-26
SimTraffic Performance Report2010 Baseline 9/9/2015
CRC MMA Queuing Analysis SimTraffic ReportPage 6
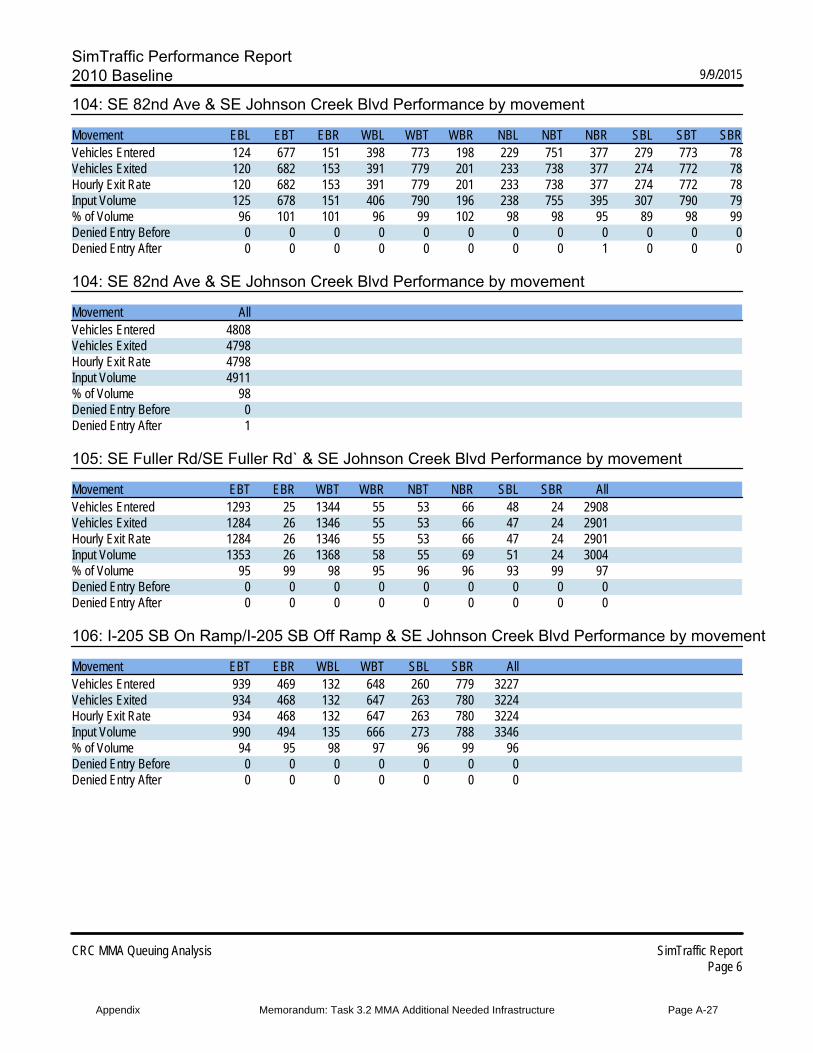
104: SE 82nd Ave & SE Johnson Creek Blvd Performance by movement
Movement EBL EBT EBR WBL WBT WBR NBL NBT NBR SBL SBT SBRVehicles Entered 124 677 151 398 773 198 229 751 377 279 773 78Vehicles Exited 120 682 153 391 779 201 233 738 377 274 772 78Hourly Exit Rate 120 682 153 391 779 201 233 738 377 274 772 78Input Volume 125 678 151 406 790 196 238 755 395 307 790 79% of Volume 96 101 101 96 99 102 98 98 95 89 98 99Denied Entry Before 0 0 0 0 0 0 0 0 0 0 0 0Denied Entry After 0 0 0 0 0 0 0 0 1 0 0 0
104: SE 82nd Ave & SE Johnson Creek Blvd Performance by movement
Movement AllVehicles Entered 4808Vehicles Exited 4798Hourly Exit Rate 4798Input Volume 4911% of Volume 98Denied Entry Before 0Denied Entry After 1
105: SE Fuller Rd/SE Fuller Rd` & SE Johnson Creek Blvd Performance by movement
Movement EBT EBR WBT WBR NBT NBR SBL SBR AllVehicles Entered 1293 25 1344 55 53 66 48 24 2908Vehicles Exited 1284 26 1346 55 53 66 47 24 2901Hourly Exit Rate 1284 26 1346 55 53 66 47 24 2901Input Volume 1353 26 1368 58 55 69 51 24 3004% of Volume 95 99 98 95 96 96 93 99 97Denied Entry Before 0 0 0 0 0 0 0 0 0Denied Entry After 0 0 0 0 0 0 0 0 0
106: I-205 SB On Ramp/I-205 SB Off Ramp & SE Johnson Creek Blvd Performance by movement
Movement EBT EBR WBL WBT SBL SBR AllVehicles Entered 939 469 132 648 260 779 3227Vehicles Exited 934 468 132 647 263 780 3224Hourly Exit Rate 934 468 132 647 263 780 3224Input Volume 990 494 135 666 273 788 3346% of Volume 94 95 98 97 96 99 96Denied Entry Before 0 0 0 0 0 0 0Denied Entry After 0 0 0 0 0 0 0
Appendix Memorandum: Task 3.2 MMA Additional Needed Infrastructure Page A-27
SimTraffic Performance Report2010 Baseline 9/9/2015
CRC MMA Queuing Analysis SimTraffic ReportPage 7
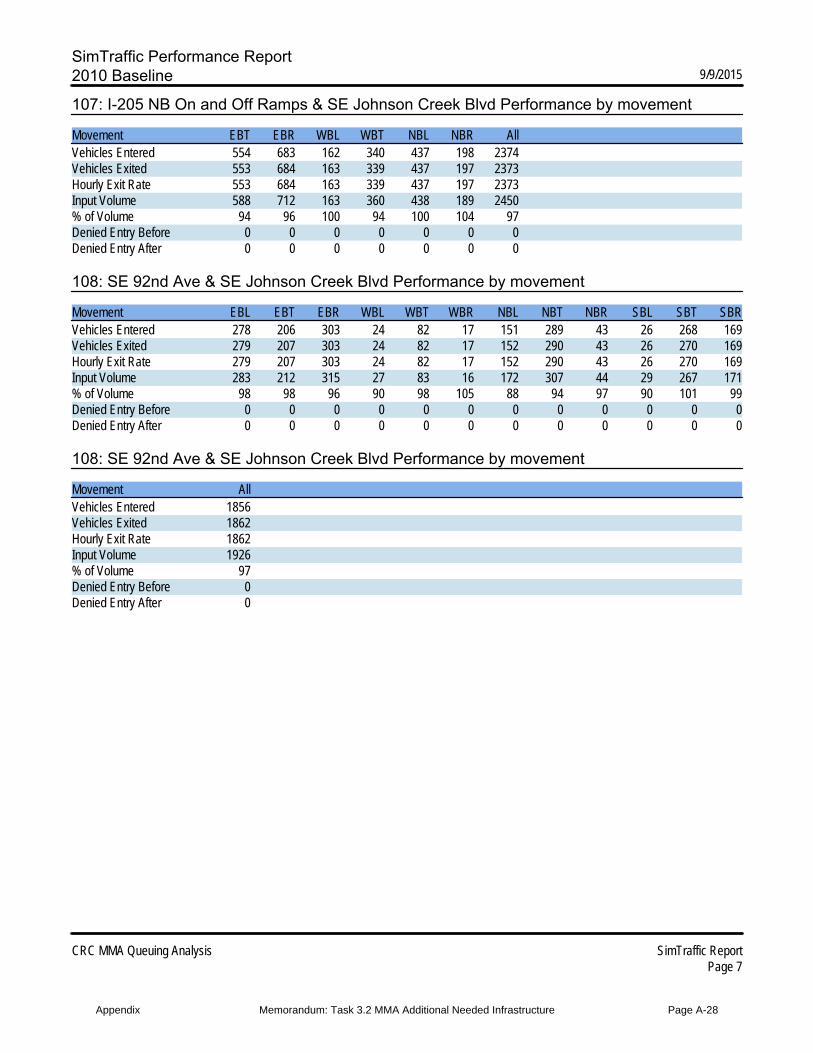
107: I-205 NB On and Off Ramps & SE Johnson Creek Blvd Performance by movement
Movement EBT EBR WBL WBT NBL NBR AllVehicles Entered 554 683 162 340 437 198 2374Vehicles Exited 553 684 163 339 437 197 2373Hourly Exit Rate 553 684 163 339 437 197 2373Input Volume 588 712 163 360 438 189 2450% of Volume 94 96 100 94 100 104 97Denied Entry Before 0 0 0 0 0 0 0Denied Entry After 0 0 0 0 0 0 0
108: SE 92nd Ave & SE Johnson Creek Blvd Performance by movement
Movement EBL EBT EBR WBL WBT WBR NBL NBT NBR SBL SBT SBRVehicles Entered 278 206 303 24 82 17 151 289 43 26 268 169Vehicles Exited 279 207 303 24 82 17 152 290 43 26 270 169Hourly Exit Rate 279 207 303 24 82 17 152 290 43 26 270 169Input Volume 283 212 315 27 83 16 172 307 44 29 267 171% of Volume 98 98 96 90 98 105 88 94 97 90 101 99Denied Entry Before 0 0 0 0 0 0 0 0 0 0 0 0Denied Entry After 0 0 0 0 0 0 0 0 0 0 0 0
108: SE 92nd Ave & SE Johnson Creek Blvd Performance by movement
Movement AllVehicles Entered 1856Vehicles Exited 1862Hourly Exit Rate 1862Input Volume 1926% of Volume 97Denied Entry Before 0Denied Entry After 0
Appendix Memorandum: Task 3.2 MMA Additional Needed Infrastructure Page A-28
SimTraffic Performance Report2010 Baseline 9/9/2015
CRC MMA Queuing Analysis SimTraffic ReportPage 8
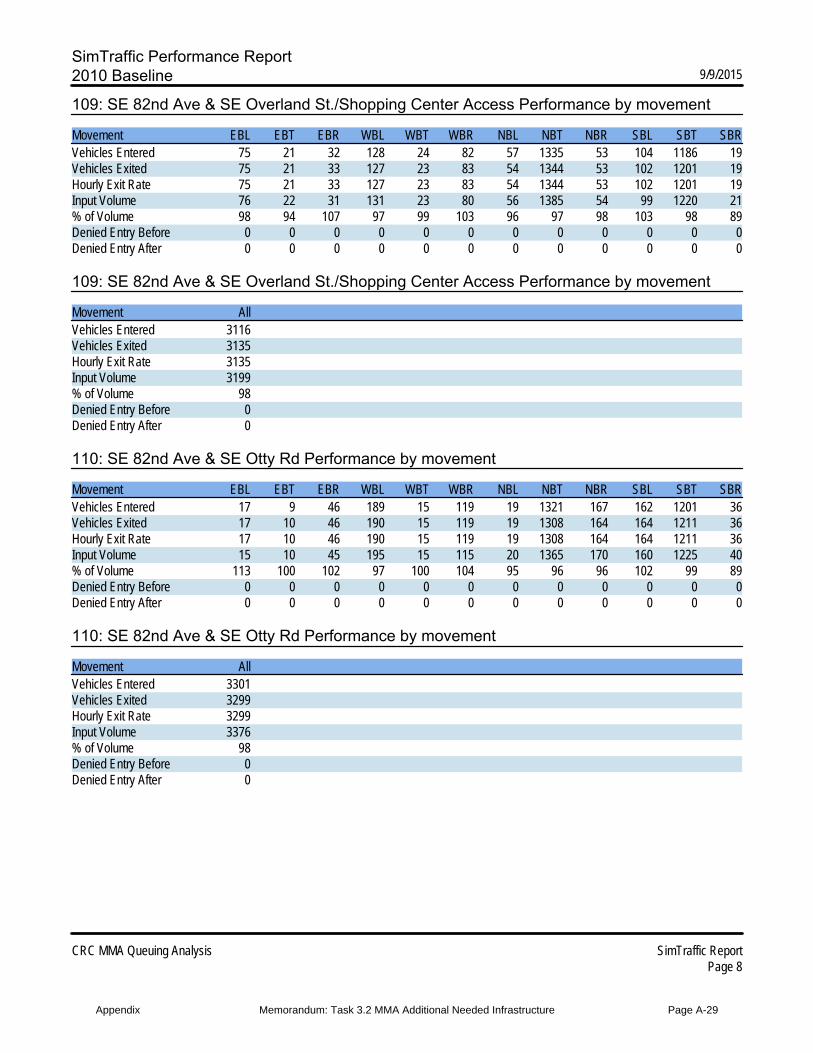
109: SE 82nd Ave & SE Overland St./Shopping Center Access Performance by movement
Movement EBL EBT EBR WBL WBT WBR NBL NBT NBR SBL SBT SBRVehicles Entered 75 21 32 128 24 82 57 1335 53 104 1186 19Vehicles Exited 75 21 33 127 23 83 54 1344 53 102 1201 19Hourly Exit Rate 75 21 33 127 23 83 54 1344 53 102 1201 19Input Volume 76 22 31 131 23 80 56 1385 54 99 1220 21% of Volume 98 94 107 97 99 103 96 97 98 103 98 89Denied Entry Before 0 0 0 0 0 0 0 0 0 0 0 0Denied Entry After 0 0 0 0 0 0 0 0 0 0 0 0
109: SE 82nd Ave & SE Overland St./Shopping Center Access Performance by movement
Movement AllVehicles Entered 3116Vehicles Exited 3135Hourly Exit Rate 3135Input Volume 3199% of Volume 98Denied Entry Before 0Denied Entry After 0
110: SE 82nd Ave & SE Otty Rd Performance by movement
Movement EBL EBT EBR WBL WBT WBR NBL NBT NBR SBL SBT SBRVehicles Entered 17 9 46 189 15 119 19 1321 167 162 1201 36Vehicles Exited 17 10 46 190 15 119 19 1308 164 164 1211 36Hourly Exit Rate 17 10 46 190 15 119 19 1308 164 164 1211 36Input Volume 15 10 45 195 15 115 20 1365 170 160 1225 40% of Volume 113 100 102 97 100 104 95 96 96 102 99 89Denied Entry Before 0 0 0 0 0 0 0 0 0 0 0 0Denied Entry After 0 0 0 0 0 0 0 0 0 0 0 0
110: SE 82nd Ave & SE Otty Rd Performance by movement
Movement AllVehicles Entered 3301Vehicles Exited 3299Hourly Exit Rate 3299Input Volume 3376% of Volume 98Denied Entry Before 0Denied Entry After 0
Appendix Memorandum: Task 3.2 MMA Additional Needed Infrastructure Page A-29
SimTraffic Performance Report2010 Baseline 9/9/2015
CRC MMA Queuing Analysis SimTraffic ReportPage 9
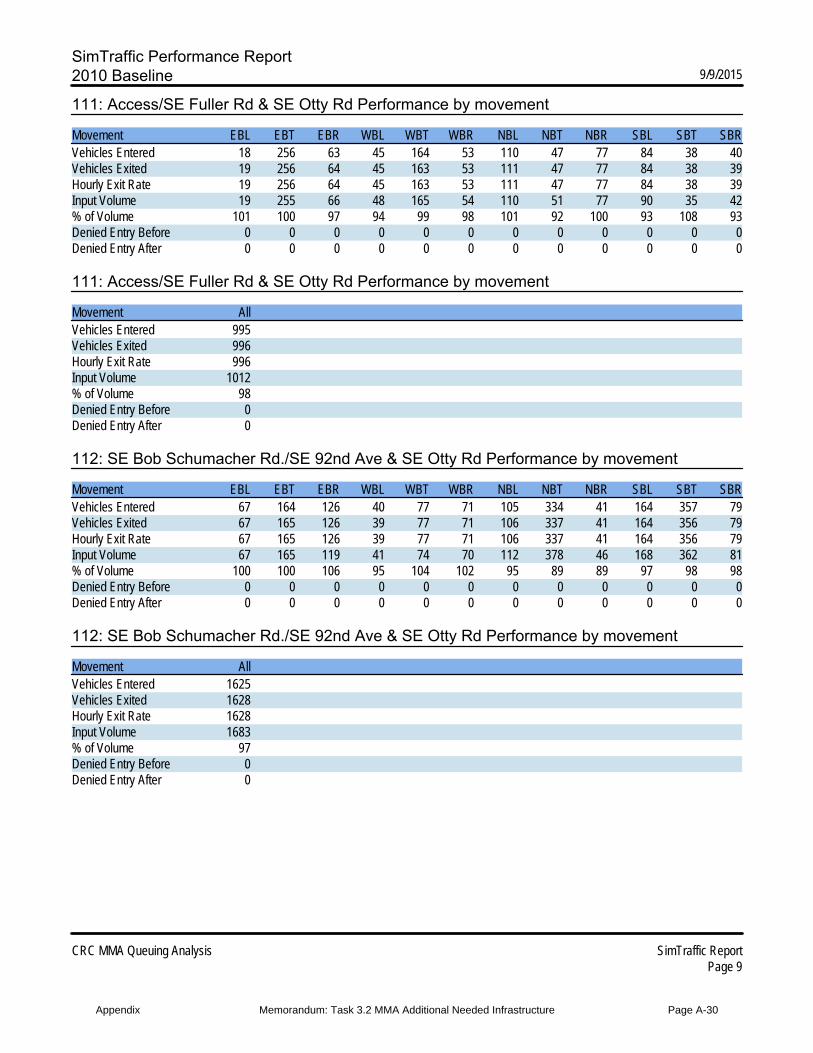
111: Access/SE Fuller Rd & SE Otty Rd Performance by movement
Movement EBL EBT EBR WBL WBT WBR NBL NBT NBR SBL SBT SBRVehicles Entered 18 256 63 45 164 53 110 47 77 84 38 40Vehicles Exited 19 256 64 45 163 53 111 47 77 84 38 39Hourly Exit Rate 19 256 64 45 163 53 111 47 77 84 38 39Input Volume 19 255 66 48 165 54 110 51 77 90 35 42% of Volume 101 100 97 94 99 98 101 92 100 93 108 93Denied Entry Before 0 0 0 0 0 0 0 0 0 0 0 0Denied Entry After 0 0 0 0 0 0 0 0 0 0 0 0
111: Access/SE Fuller Rd & SE Otty Rd Performance by movement
Movement AllVehicles Entered 995Vehicles Exited 996Hourly Exit Rate 996Input Volume 1012% of Volume 98Denied Entry Before 0Denied Entry After 0
112: SE Bob Schumacher Rd./SE 92nd Ave & SE Otty Rd Performance by movement
Movement EBL EBT EBR WBL WBT WBR NBL NBT NBR SBL SBT SBRVehicles Entered 67 164 126 40 77 71 105 334 41 164 357 79Vehicles Exited 67 165 126 39 77 71 106 337 41 164 356 79Hourly Exit Rate 67 165 126 39 77 71 106 337 41 164 356 79Input Volume 67 165 119 41 74 70 112 378 46 168 362 81% of Volume 100 100 106 95 104 102 95 89 89 97 98 98Denied Entry Before 0 0 0 0 0 0 0 0 0 0 0 0Denied Entry After 0 0 0 0 0 0 0 0 0 0 0 0
112: SE Bob Schumacher Rd./SE 92nd Ave & SE Otty Rd Performance by movement
Movement AllVehicles Entered 1625Vehicles Exited 1628Hourly Exit Rate 1628Input Volume 1683% of Volume 97Denied Entry Before 0Denied Entry After 0
Appendix Memorandum: Task 3.2 MMA Additional Needed Infrastructure Page A-30
SimTraffic Performance Report2010 Baseline 9/9/2015
CRC MMA Queuing Analysis SimTraffic ReportPage 10
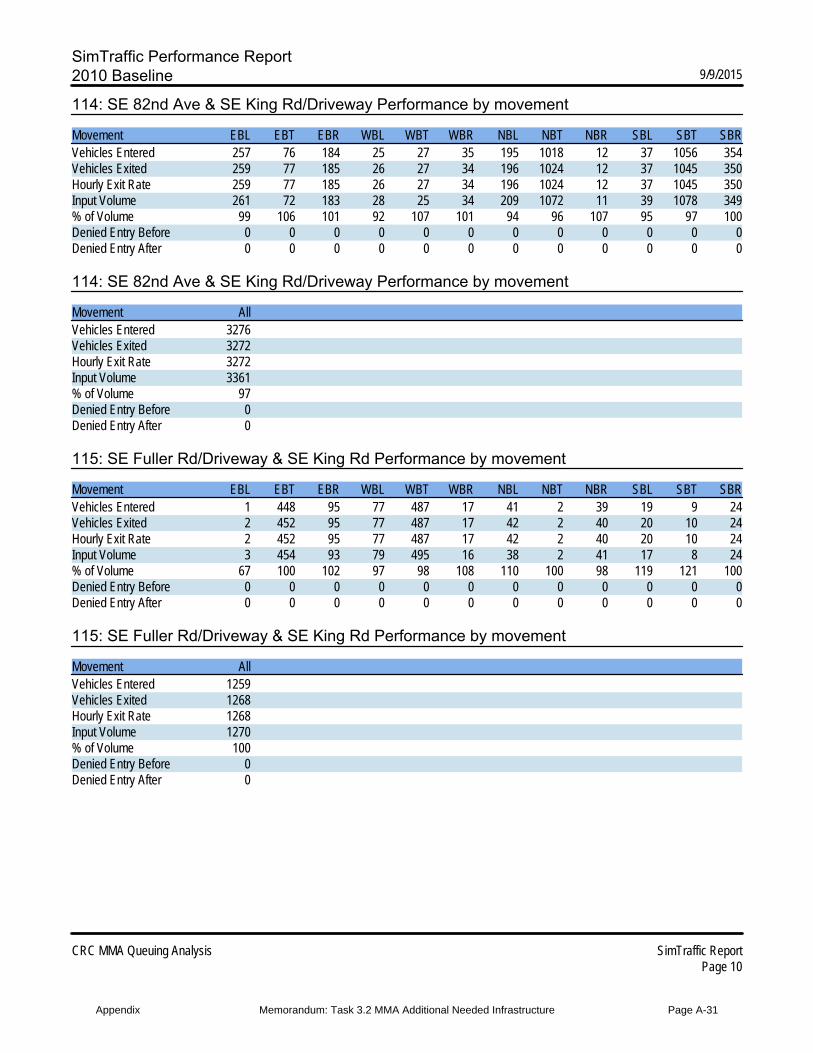
114: SE 82nd Ave & SE King Rd/Driveway Performance by movement
Movement EBL EBT EBR WBL WBT WBR NBL NBT NBR SBL SBT SBRVehicles Entered 257 76 184 25 27 35 195 1018 12 37 1056 354Vehicles Exited 259 77 185 26 27 34 196 1024 12 37 1045 350Hourly Exit Rate 259 77 185 26 27 34 196 1024 12 37 1045 350Input Volume 261 72 183 28 25 34 209 1072 11 39 1078 349% of Volume 99 106 101 92 107 101 94 96 107 95 97 100Denied Entry Before 0 0 0 0 0 0 0 0 0 0 0 0Denied Entry After 0 0 0 0 0 0 0 0 0 0 0 0
114: SE 82nd Ave & SE King Rd/Driveway Performance by movement
Movement AllVehicles Entered 3276Vehicles Exited 3272Hourly Exit Rate 3272Input Volume 3361% of Volume 97Denied Entry Before 0Denied Entry After 0
115: SE Fuller Rd/Driveway & SE King Rd Performance by movement
Movement EBL EBT EBR WBL WBT WBR NBL NBT NBR SBL SBT SBRVehicles Entered 1 448 95 77 487 17 41 2 39 19 9 24Vehicles Exited 2 452 95 77 487 17 42 2 40 20 10 24Hourly Exit Rate 2 452 95 77 487 17 42 2 40 20 10 24Input Volume 3 454 93 79 495 16 38 2 41 17 8 24% of Volume 67 100 102 97 98 108 110 100 98 119 121 100Denied Entry Before 0 0 0 0 0 0 0 0 0 0 0 0Denied Entry After 0 0 0 0 0 0 0 0 0 0 0 0
115: SE Fuller Rd/Driveway & SE King Rd Performance by movement
Movement AllVehicles Entered 1259Vehicles Exited 1268Hourly Exit Rate 1268Input Volume 1270% of Volume 100Denied Entry Before 0Denied Entry After 0
Appendix Memorandum: Task 3.2 MMA Additional Needed Infrastructure Page A-31
SimTraffic Performance Report2010 Baseline 9/9/2015
CRC MMA Queuing Analysis SimTraffic ReportPage 11
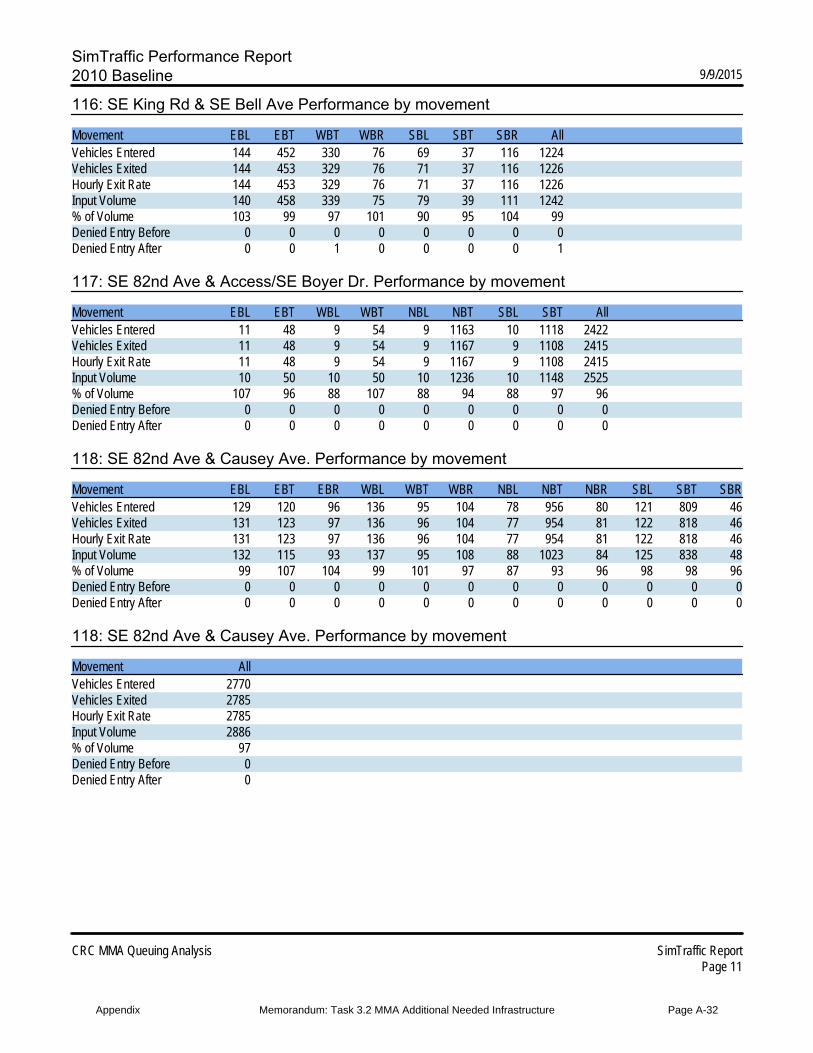
116: SE King Rd & SE Bell Ave Performance by movement
Movement EBL EBT WBT WBR SBL SBT SBR AllVehicles Entered 144 452 330 76 69 37 116 1224Vehicles Exited 144 453 329 76 71 37 116 1226Hourly Exit Rate 144 453 329 76 71 37 116 1226Input Volume 140 458 339 75 79 39 111 1242% of Volume 103 99 97 101 90 95 104 99Denied Entry Before 0 0 0 0 0 0 0 0Denied Entry After 0 0 1 0 0 0 0 1
117: SE 82nd Ave & Access/SE Boyer Dr. Performance by movement
Movement EBL EBT WBL WBT NBL NBT SBL SBT AllVehicles Entered 11 48 9 54 9 1163 10 1118 2422Vehicles Exited 11 48 9 54 9 1167 9 1108 2415Hourly Exit Rate 11 48 9 54 9 1167 9 1108 2415Input Volume 10 50 10 50 10 1236 10 1148 2525% of Volume 107 96 88 107 88 94 88 97 96Denied Entry Before 0 0 0 0 0 0 0 0 0Denied Entry After 0 0 0 0 0 0 0 0 0
118: SE 82nd Ave & Causey Ave. Performance by movement
Movement EBL EBT EBR WBL WBT WBR NBL NBT NBR SBL SBT SBRVehicles Entered 129 120 96 136 95 104 78 956 80 121 809 46Vehicles Exited 131 123 97 136 96 104 77 954 81 122 818 46Hourly Exit Rate 131 123 97 136 96 104 77 954 81 122 818 46Input Volume 132 115 93 137 95 108 88 1023 84 125 838 48% of Volume 99 107 104 99 101 97 87 93 96 98 98 96Denied Entry Before 0 0 0 0 0 0 0 0 0 0 0 0Denied Entry After 0 0 0 0 0 0 0 0 0 0 0 0
118: SE 82nd Ave & Causey Ave. Performance by movement
Movement AllVehicles Entered 2770Vehicles Exited 2785Hourly Exit Rate 2785Input Volume 2886% of Volume 97Denied Entry Before 0Denied Entry After 0
Appendix Memorandum: Task 3.2 MMA Additional Needed Infrastructure Page A-32
SimTraffic Performance Report2010 Baseline 9/9/2015
CRC MMA Queuing Analysis SimTraffic ReportPage 12
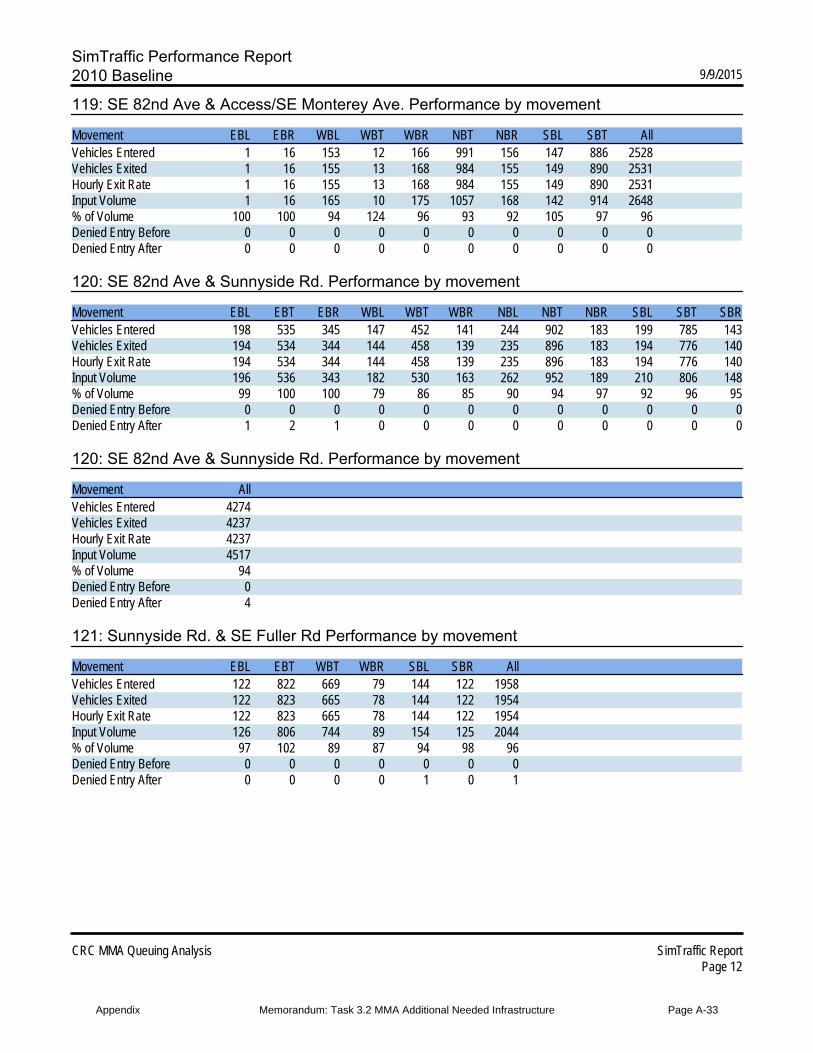
119: SE 82nd Ave & Access/SE Monterey Ave. Performance by movement
Movement EBL EBR WBL WBT WBR NBT NBR SBL SBT AllVehicles Entered 1 16 153 12 166 991 156 147 886 2528Vehicles Exited 1 16 155 13 168 984 155 149 890 2531Hourly Exit Rate 1 16 155 13 168 984 155 149 890 2531Input Volume 1 16 165 10 175 1057 168 142 914 2648% of Volume 100 100 94 124 96 93 92 105 97 96Denied Entry Before 0 0 0 0 0 0 0 0 0 0Denied Entry After 0 0 0 0 0 0 0 0 0 0
120: SE 82nd Ave & Sunnyside Rd. Performance by movement
Movement EBL EBT EBR WBL WBT WBR NBL NBT NBR SBL SBT SBRVehicles Entered 198 535 345 147 452 141 244 902 183 199 785 143Vehicles Exited 194 534 344 144 458 139 235 896 183 194 776 140Hourly Exit Rate 194 534 344 144 458 139 235 896 183 194 776 140Input Volume 196 536 343 182 530 163 262 952 189 210 806 148% of Volume 99 100 100 79 86 85 90 94 97 92 96 95Denied Entry Before 0 0 0 0 0 0 0 0 0 0 0 0Denied Entry After 1 2 1 0 0 0 0 0 0 0 0 0
120: SE 82nd Ave & Sunnyside Rd. Performance by movement
Movement AllVehicles Entered 4274Vehicles Exited 4237Hourly Exit Rate 4237Input Volume 4517% of Volume 94Denied Entry Before 0Denied Entry After 4
121: Sunnyside Rd. & SE Fuller Rd Performance by movement
Movement EBL EBT WBT WBR SBL SBR AllVehicles Entered 122 822 669 79 144 122 1958Vehicles Exited 122 823 665 78 144 122 1954Hourly Exit Rate 122 823 665 78 144 122 1954Input Volume 126 806 744 89 154 125 2044% of Volume 97 102 89 87 94 98 96Denied Entry Before 0 0 0 0 0 0 0Denied Entry After 0 0 0 0 1 0 1
Appendix Memorandum: Task 3.2 MMA Additional Needed Infrastructure Page A-33
SimTraffic Performance Report2010 Baseline 9/9/2015
CRC MMA Queuing Analysis SimTraffic ReportPage 13
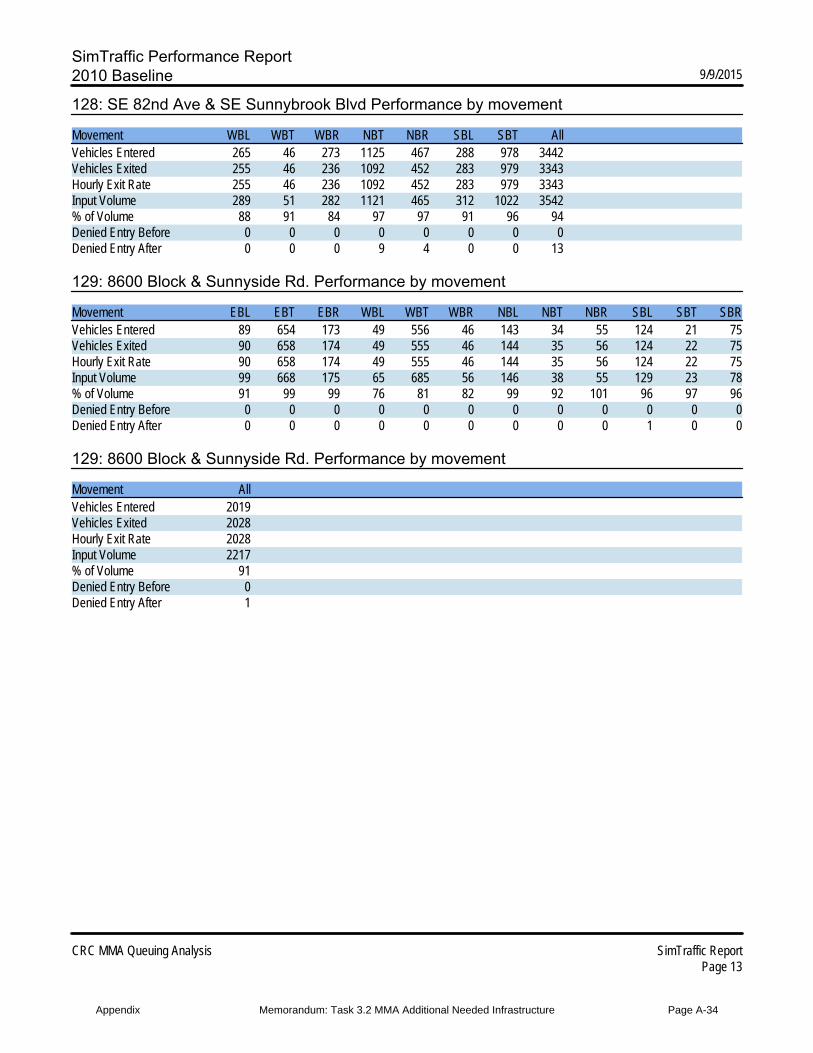
128: SE 82nd Ave & SE Sunnybrook Blvd Performance by movement
Movement WBL WBT WBR NBT NBR SBL SBT AllVehicles Entered 265 46 273 1125 467 288 978 3442Vehicles Exited 255 46 236 1092 452 283 979 3343Hourly Exit Rate 255 46 236 1092 452 283 979 3343Input Volume 289 51 282 1121 465 312 1022 3542% of Volume 88 91 84 97 97 91 96 94Denied Entry Before 0 0 0 0 0 0 0 0Denied Entry After 0 0 0 9 4 0 0 13
129: 8600 Block & Sunnyside Rd. Performance by movement
Movement EBL EBT EBR WBL WBT WBR NBL NBT NBR SBL SBT SBRVehicles Entered 89 654 173 49 556 46 143 34 55 124 21 75Vehicles Exited 90 658 174 49 555 46 144 35 56 124 22 75Hourly Exit Rate 90 658 174 49 555 46 144 35 56 124 22 75Input Volume 99 668 175 65 685 56 146 38 55 129 23 78% of Volume 91 99 99 76 81 82 99 92 101 96 97 96Denied Entry Before 0 0 0 0 0 0 0 0 0 0 0 0Denied Entry After 0 0 0 0 0 0 0 0 0 1 0 0
129: 8600 Block & Sunnyside Rd. Performance by movement
Movement AllVehicles Entered 2019Vehicles Exited 2028Hourly Exit Rate 2028Input Volume 2217% of Volume 91Denied Entry Before 0Denied Entry After 1
Appendix Memorandum: Task 3.2 MMA Additional Needed Infrastructure Page A-34
SimTraffic Performance Report2010 Baseline 9/9/2015
CRC MMA Queuing Analysis SimTraffic ReportPage 14
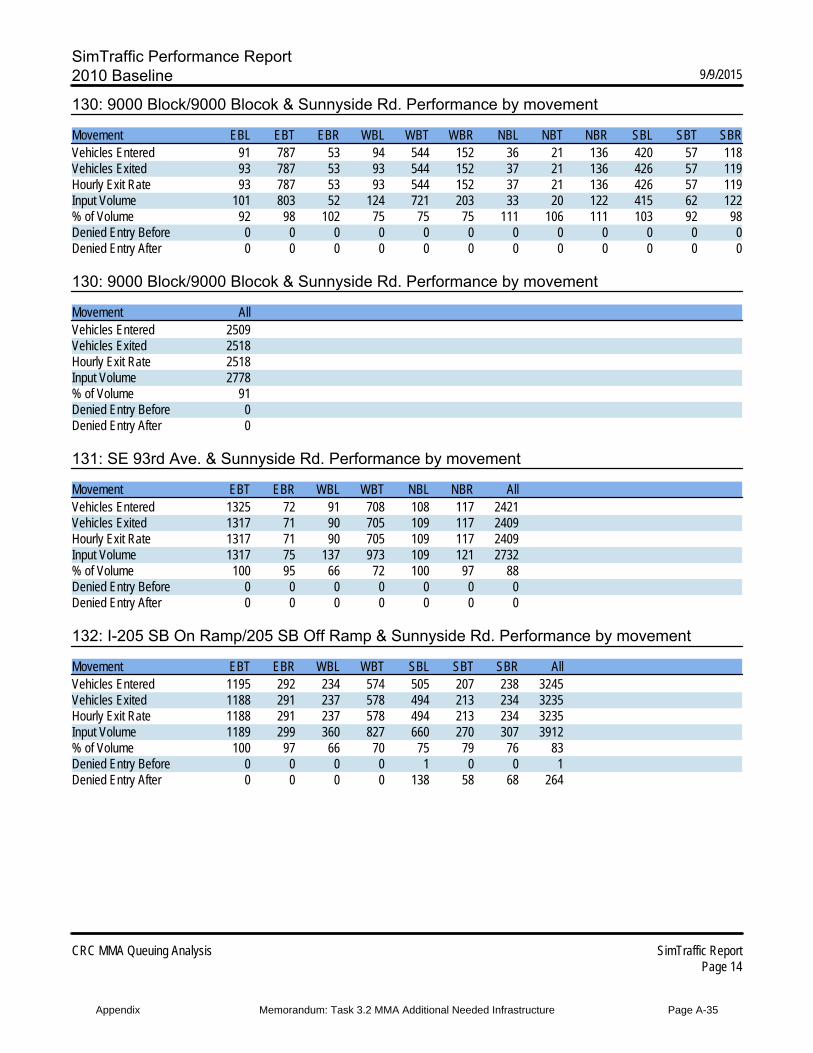
130: 9000 Block/9000 Blocok & Sunnyside Rd. Performance by movement
Movement EBL EBT EBR WBL WBT WBR NBL NBT NBR SBL SBT SBRVehicles Entered 91 787 53 94 544 152 36 21 136 420 57 118Vehicles Exited 93 787 53 93 544 152 37 21 136 426 57 119Hourly Exit Rate 93 787 53 93 544 152 37 21 136 426 57 119Input Volume 101 803 52 124 721 203 33 20 122 415 62 122% of Volume 92 98 102 75 75 75 111 106 111 103 92 98Denied Entry Before 0 0 0 0 0 0 0 0 0 0 0 0Denied Entry After 0 0 0 0 0 0 0 0 0 0 0 0
130: 9000 Block/9000 Blocok & Sunnyside Rd. Performance by movement
Movement AllVehicles Entered 2509Vehicles Exited 2518Hourly Exit Rate 2518Input Volume 2778% of Volume 91Denied Entry Before 0Denied Entry After 0
131: SE 93rd Ave. & Sunnyside Rd. Performance by movement
Movement EBT EBR WBL WBT NBL NBR AllVehicles Entered 1325 72 91 708 108 117 2421Vehicles Exited 1317 71 90 705 109 117 2409Hourly Exit Rate 1317 71 90 705 109 117 2409Input Volume 1317 75 137 973 109 121 2732% of Volume 100 95 66 72 100 97 88Denied Entry Before 0 0 0 0 0 0 0Denied Entry After 0 0 0 0 0 0 0
132: I-205 SB On Ramp/205 SB Off Ramp & Sunnyside Rd. Performance by movement
Movement EBT EBR WBL WBT SBL SBT SBR AllVehicles Entered 1195 292 234 574 505 207 238 3245Vehicles Exited 1188 291 237 578 494 213 234 3235Hourly Exit Rate 1188 291 237 578 494 213 234 3235Input Volume 1189 299 360 827 660 270 307 3912% of Volume 100 97 66 70 75 79 76 83Denied Entry Before 0 0 0 0 1 0 0 1Denied Entry After 0 0 0 0 138 58 68 264
Appendix Memorandum: Task 3.2 MMA Additional Needed Infrastructure Page A-35
SimTraffic Performance Report2010 Baseline 9/9/2015
CRC MMA Queuing Analysis SimTraffic ReportPage 15
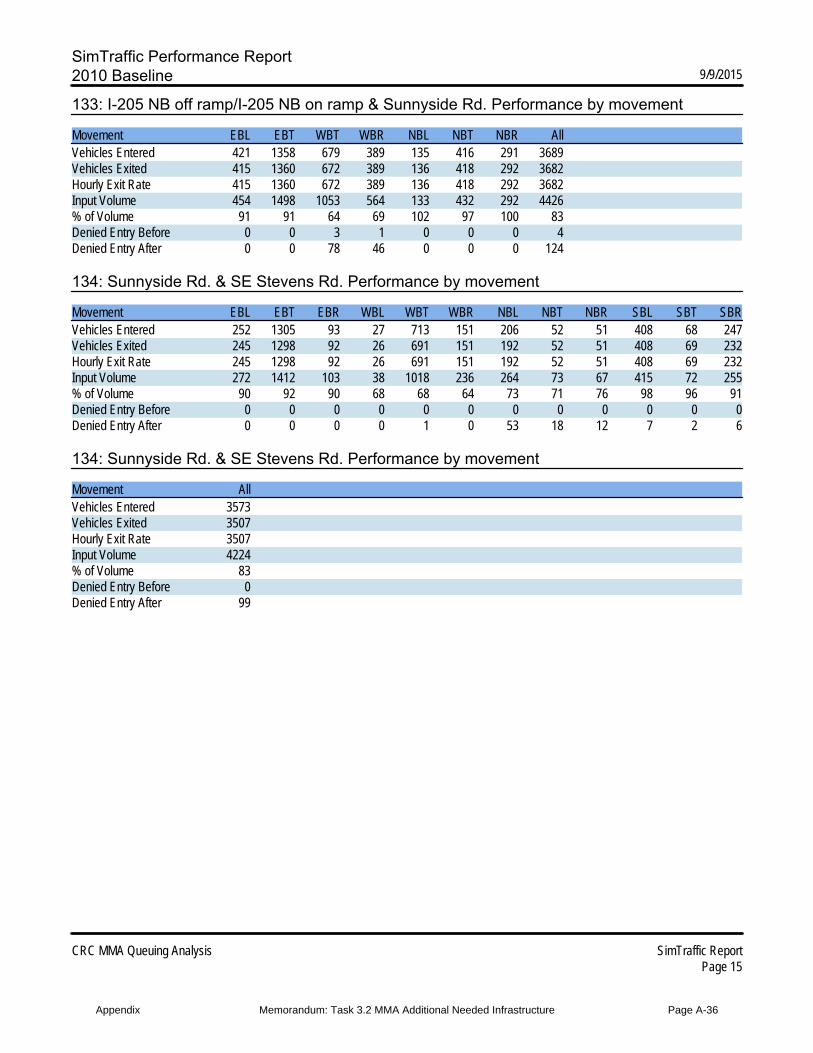
133: I-205 NB off ramp/I-205 NB on ramp & Sunnyside Rd. Performance by movement
Movement EBL EBT WBT WBR NBL NBT NBR AllVehicles Entered 421 1358 679 389 135 416 291 3689Vehicles Exited 415 1360 672 389 136 418 292 3682Hourly Exit Rate 415 1360 672 389 136 418 292 3682Input Volume 454 1498 1053 564 133 432 292 4426% of Volume 91 91 64 69 102 97 100 83Denied Entry Before 0 0 3 1 0 0 0 4Denied Entry After 0 0 78 46 0 0 0 124
134: Sunnyside Rd. & SE Stevens Rd. Performance by movement
Movement EBL EBT EBR WBL WBT WBR NBL NBT NBR SBL SBT SBRVehicles Entered 252 1305 93 27 713 151 206 52 51 408 68 247Vehicles Exited 245 1298 92 26 691 151 192 52 51 408 69 232Hourly Exit Rate 245 1298 92 26 691 151 192 52 51 408 69 232Input Volume 272 1412 103 38 1018 236 264 73 67 415 72 255% of Volume 90 92 90 68 68 64 73 71 76 98 96 91Denied Entry Before 0 0 0 0 0 0 0 0 0 0 0 0Denied Entry After 0 0 0 0 1 0 53 18 12 7 2 6
134: Sunnyside Rd. & SE Stevens Rd. Performance by movement
Movement AllVehicles Entered 3573Vehicles Exited 3507Hourly Exit Rate 3507Input Volume 4224% of Volume 83Denied Entry Before 0Denied Entry After 99
Appendix Memorandum: Task 3.2 MMA Additional Needed Infrastructure Page A-36
SimTraffic Performance Report2010 Baseline 9/9/2015
CRC MMA Queuing Analysis SimTraffic ReportPage 16
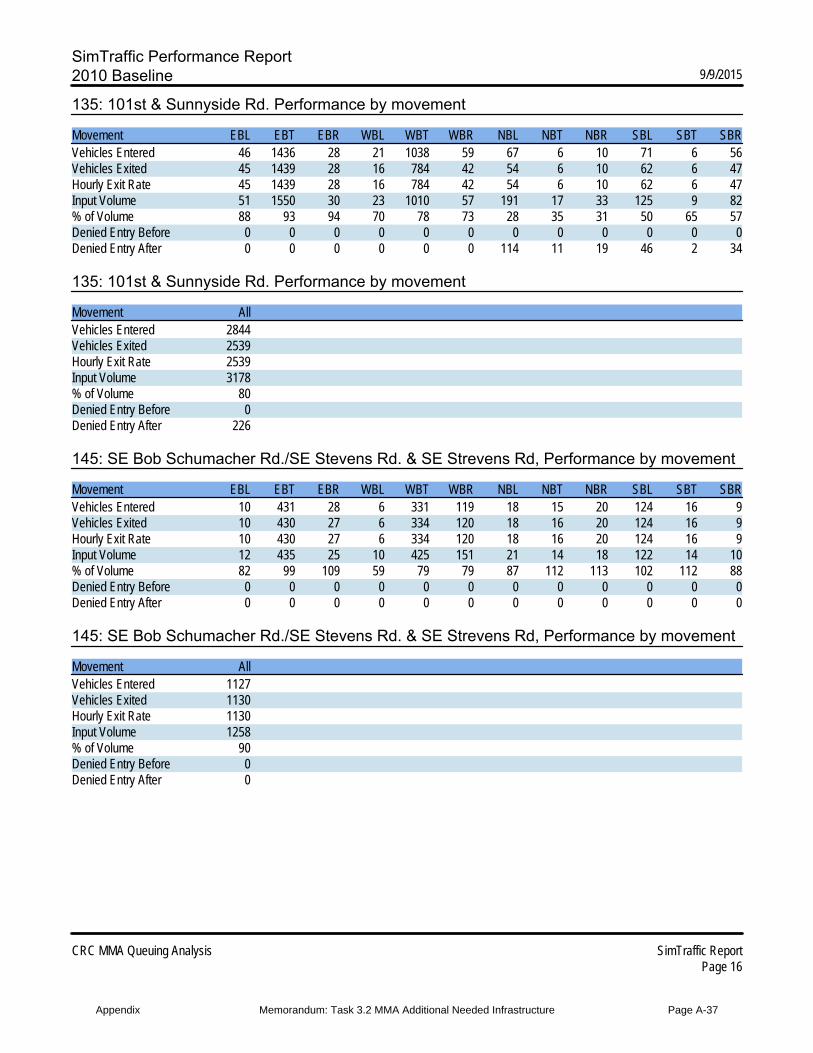
135: 101st & Sunnyside Rd. Performance by movement
Movement EBL EBT EBR WBL WBT WBR NBL NBT NBR SBL SBT SBRVehicles Entered 46 1436 28 21 1038 59 67 6 10 71 6 56Vehicles Exited 45 1439 28 16 784 42 54 6 10 62 6 47Hourly Exit Rate 45 1439 28 16 784 42 54 6 10 62 6 47Input Volume 51 1550 30 23 1010 57 191 17 33 125 9 82% of Volume 88 93 94 70 78 73 28 35 31 50 65 57Denied Entry Before 0 0 0 0 0 0 0 0 0 0 0 0Denied Entry After 0 0 0 0 0 0 114 11 19 46 2 34
135: 101st & Sunnyside Rd. Performance by movement
Movement AllVehicles Entered 2844Vehicles Exited 2539Hourly Exit Rate 2539Input Volume 3178% of Volume 80Denied Entry Before 0Denied Entry After 226
145: SE Bob Schumacher Rd./SE Stevens Rd. & SE Strevens Rd, Performance by movement
Movement EBL EBT EBR WBL WBT WBR NBL NBT NBR SBL SBT SBRVehicles Entered 10 431 28 6 331 119 18 15 20 124 16 9Vehicles Exited 10 430 27 6 334 120 18 16 20 124 16 9Hourly Exit Rate 10 430 27 6 334 120 18 16 20 124 16 9Input Volume 12 435 25 10 425 151 21 14 18 122 14 10% of Volume 82 99 109 59 79 79 87 112 113 102 112 88Denied Entry Before 0 0 0 0 0 0 0 0 0 0 0 0Denied Entry After 0 0 0 0 0 0 0 0 0 0 0 0
145: SE Bob Schumacher Rd./SE Stevens Rd. & SE Strevens Rd, Performance by movement
Movement AllVehicles Entered 1127Vehicles Exited 1130Hourly Exit Rate 1130Input Volume 1258% of Volume 90Denied Entry Before 0Denied Entry After 0
Appendix Memorandum: Task 3.2 MMA Additional Needed Infrastructure Page A-37
SimTraffic Performance Report2010 Baseline 9/9/2015
CRC MMA Queuing Analysis SimTraffic ReportPage 17
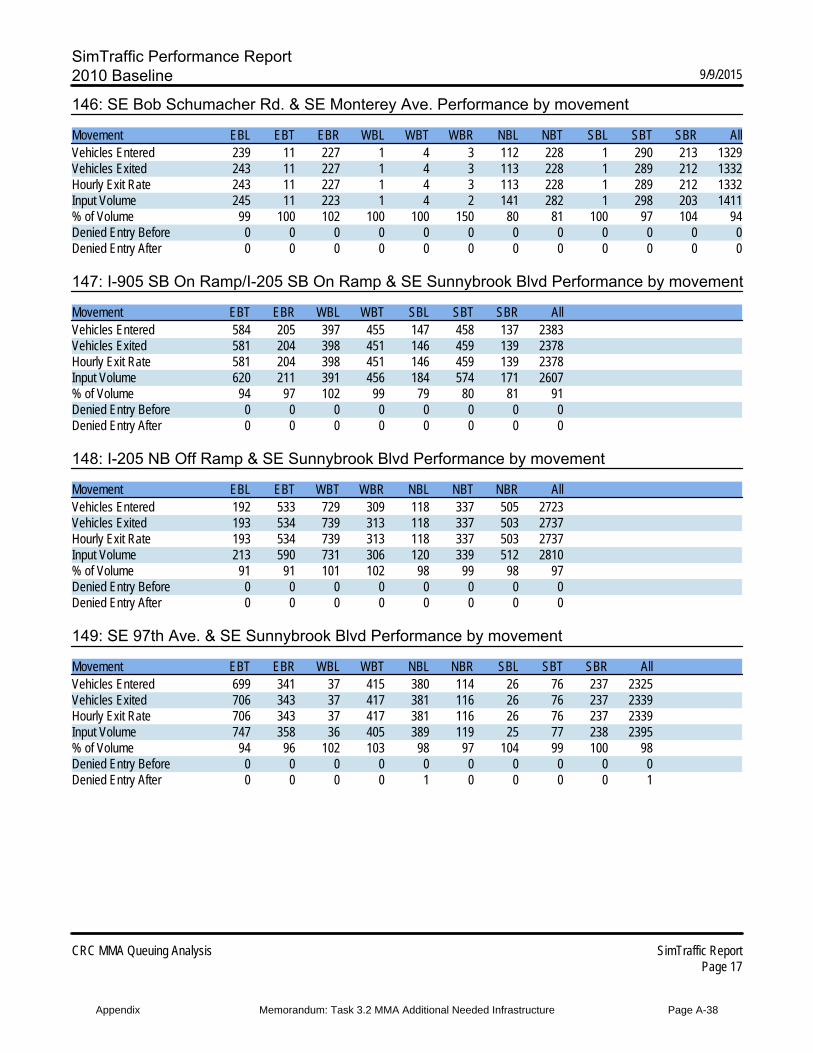
146: SE Bob Schumacher Rd. & SE Monterey Ave. Performance by movement
Movement EBL EBT EBR WBL WBT WBR NBL NBT SBL SBT SBR AllVehicles Entered 239 11 227 1 4 3 112 228 1 290 213 1329Vehicles Exited 243 11 227 1 4 3 113 228 1 289 212 1332Hourly Exit Rate 243 11 227 1 4 3 113 228 1 289 212 1332Input Volume 245 11 223 1 4 2 141 282 1 298 203 1411% of Volume 99 100 102 100 100 150 80 81 100 97 104 94Denied Entry Before 0 0 0 0 0 0 0 0 0 0 0 0Denied Entry After 0 0 0 0 0 0 0 0 0 0 0 0
147: I-905 SB On Ramp/I-205 SB On Ramp & SE Sunnybrook Blvd Performance by movement
Movement EBT EBR WBL WBT SBL SBT SBR AllVehicles Entered 584 205 397 455 147 458 137 2383Vehicles Exited 581 204 398 451 146 459 139 2378Hourly Exit Rate 581 204 398 451 146 459 139 2378Input Volume 620 211 391 456 184 574 171 2607% of Volume 94 97 102 99 79 80 81 91Denied Entry Before 0 0 0 0 0 0 0 0Denied Entry After 0 0 0 0 0 0 0 0
148: I-205 NB Off Ramp & SE Sunnybrook Blvd Performance by movement
Movement EBL EBT WBT WBR NBL NBT NBR AllVehicles Entered 192 533 729 309 118 337 505 2723Vehicles Exited 193 534 739 313 118 337 503 2737Hourly Exit Rate 193 534 739 313 118 337 503 2737Input Volume 213 590 731 306 120 339 512 2810% of Volume 91 91 101 102 98 99 98 97Denied Entry Before 0 0 0 0 0 0 0 0Denied Entry After 0 0 0 0 0 0 0 0
149: SE 97th Ave. & SE Sunnybrook Blvd Performance by movement
Movement EBT EBR WBL WBT NBL NBR SBL SBT SBR AllVehicles Entered 699 341 37 415 380 114 26 76 237 2325Vehicles Exited 706 343 37 417 381 116 26 76 237 2339Hourly Exit Rate 706 343 37 417 381 116 26 76 237 2339Input Volume 747 358 36 405 389 119 25 77 238 2395% of Volume 94 96 102 103 98 97 104 99 100 98Denied Entry Before 0 0 0 0 0 0 0 0 0 0Denied Entry After 0 0 0 0 1 0 0 0 0 1
Appendix Memorandum: Task 3.2 MMA Additional Needed Infrastructure Page A-38
SimTraffic Performance Report2010 Baseline 9/9/2015
CRC MMA Queuing Analysis SimTraffic ReportPage 18
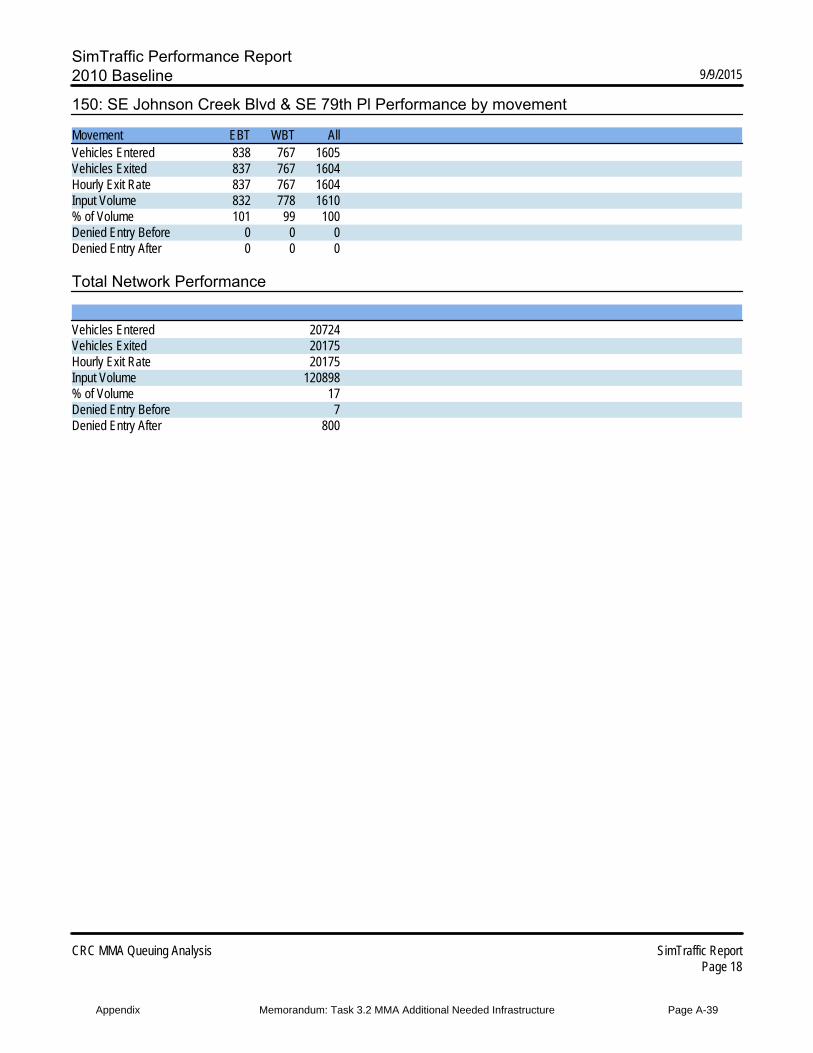
150: SE Johnson Creek Blvd & SE 79th Pl Performance by movement
Movement EBT WBT AllVehicles Entered 838 767 1605Vehicles Exited 837 767 1604Hourly Exit Rate 837 767 1604Input Volume 832 778 1610% of Volume 101 99 100Denied Entry Before 0 0 0Denied Entry After 0 0 0
Total Network Performance
Vehicles Entered 20724Vehicles Exited 20175Hourly Exit Rate 20175Input Volume 120898% of Volume 17Denied Entry Before 7Denied Entry After 800
Appendix Memorandum: Task 3.2 MMA Additional Needed Infrastructure Page A-39
Arterial Level of Service2010 Baseline 9/9/2015
CRC MMA Queuing Analysis SimTraffic ReportPage 19
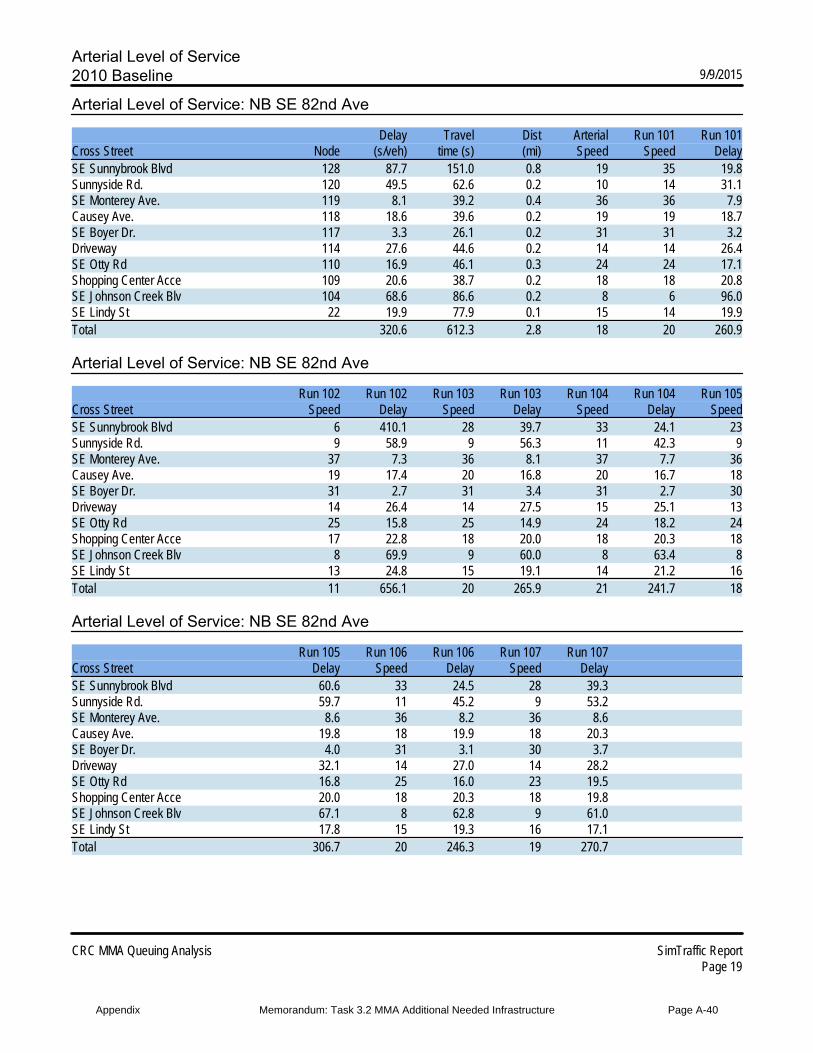
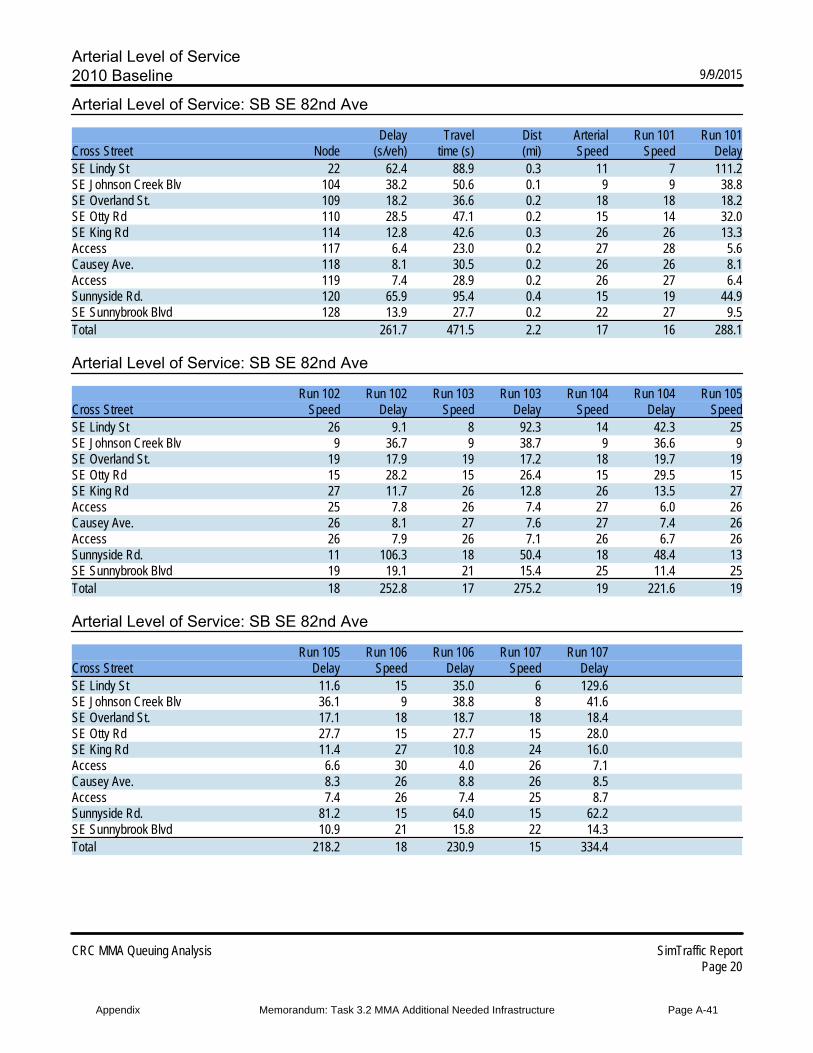
Arterial Level of Service: NB SE 82nd Ave
Delay Travel Dist Arterial Run 101 Run 101Cross Street Node (s/veh) time (s) (mi) Speed Speed DelaySE Sunnybrook Blvd 128 87.7 151.0 0.8 19 35 19.8Sunnyside Rd. 120 49.5 62.6 0.2 10 14 31.1SE Monterey Ave. 119 8.1 39.2 0.4 36 36 7.9Causey Ave. 118 18.6 39.6 0.2 19 19 18.7SE Boyer Dr. 117 3.3 26.1 0.2 31 31 3.2Driveway 114 27.6 44.6 0.2 14 14 26.4SE Otty Rd 110 16.9 46.1 0.3 24 24 17.1Shopping Center Acce 109 20.6 38.7 0.2 18 18 20.8SE Johnson Creek Blv 104 68.6 86.6 0.2 8 6 96.0SE Lindy St 22 19.9 77.9 0.1 15 14 19.9Total 320.6 612.3 2.8 18 20 260.9
Arterial Level of Service: NB SE 82nd Ave
Run 102 Run 102 Run 103 Run 103 Run 104 Run 104 Run 105Cross Street Speed Delay Speed Delay Speed Delay SpeedSE Sunnybrook Blvd 6 410.1 28 39.7 33 24.1 23Sunnyside Rd. 9 58.9 9 56.3 11 42.3 9SE Monterey Ave. 37 7.3 36 8.1 37 7.7 36Causey Ave. 19 17.4 20 16.8 20 16.7 18SE Boyer Dr. 31 2.7 31 3.4 31 2.7 30Driveway 14 26.4 14 27.5 15 25.1 13SE Otty Rd 25 15.8 25 14.9 24 18.2 24Shopping Center Acce 17 22.8 18 20.0 18 20.3 18SE Johnson Creek Blv 8 69.9 9 60.0 8 63.4 8SE Lindy St 13 24.8 15 19.1 14 21.2 16Total 11 656.1 20 265.9 21 241.7 18
Arterial Level of Service: NB SE 82nd Ave
Run 105 Run 106 Run 106 Run 107 Run 107Cross Street Delay Speed Delay Speed DelaySE Sunnybrook Blvd 60.6 33 24.5 28 39.3Sunnyside Rd. 59.7 11 45.2 9 53.2SE Monterey Ave. 8.6 36 8.2 36 8.6Causey Ave. 19.8 18 19.9 18 20.3SE Boyer Dr. 4.0 31 3.1 30 3.7Driveway 32.1 14 27.0 14 28.2SE Otty Rd 16.8 25 16.0 23 19.5Shopping Center Acce 20.0 18 20.3 18 19.8SE Johnson Creek Blv 67.1 8 62.8 9 61.0SE Lindy St 17.8 15 19.3 16 17.1Total 306.7 20 246.3 19 270.7
Appendix Memorandum: Task 3.2 MMA Additional Needed Infrastructure Page A-40
Arterial Level of Service2010 Baseline 9/9/2015
CRC MMA Queuing Analysis SimTraffic ReportPage 20
Arterial Level of Service: SB SE 82nd Ave
Delay Travel Dist Arterial Run 101 Run 101Cross Street Node (s/veh) time (s) (mi) Speed Speed DelaySE Lindy St 22 62.4 88.9 0.3 11 7 111.2SE Johnson Creek Blv 104 38.2 50.6 0.1 9 9 38.8SE Overland St. 109 18.2 36.6 0.2 18 18 18.2SE Otty Rd 110 28.5 47.1 0.2 15 14 32.0SE King Rd 114 12.8 42.6 0.3 26 26 13.3Access 117 6.4 23.0 0.2 27 28 5.6Causey Ave. 118 8.1 30.5 0.2 26 26 8.1Access 119 7.4 28.9 0.2 26 27 6.4Sunnyside Rd. 120 65.9 95.4 0.4 15 19 44.9SE Sunnybrook Blvd 128 13.9 27.7 0.2 22 27 9.5Total 261.7 471.5 2.2 17 16 288.1
Arterial Level of Service: SB SE 82nd Ave
Run 102 Run 102 Run 103 Run 103 Run 104 Run 104 Run 105Cross Street Speed Delay Speed Delay Speed Delay SpeedSE Lindy St 26 9.1 8 92.3 14 42.3 25SE Johnson Creek Blv 9 36.7 9 38.7 9 36.6 9SE Overland St. 19 17.9 19 17.2 18 19.7 19SE Otty Rd 15 28.2 15 26.4 15 29.5 15SE King Rd 27 11.7 26 12.8 26 13.5 27Access 25 7.8 26 7.4 27 6.0 26Causey Ave. 26 8.1 27 7.6 27 7.4 26Access 26 7.9 26 7.1 26 6.7 26Sunnyside Rd. 11 106.3 18 50.4 18 48.4 13SE Sunnybrook Blvd 19 19.1 21 15.4 25 11.4 25Total 18 252.8 17 275.2 19 221.6 19
Arterial Level of Service: SB SE 82nd Ave
Run 105 Run 106 Run 106 Run 107 Run 107Cross Street Delay Speed Delay Speed DelaySE Lindy St 11.6 15 35.0 6 129.6SE Johnson Creek Blv 36.1 9 38.8 8 41.6SE Overland St. 17.1 18 18.7 18 18.4SE Otty Rd 27.7 15 27.7 15 28.0SE King Rd 11.4 27 10.8 24 16.0Access 6.6 30 4.0 26 7.1Causey Ave. 8.3 26 8.8 26 8.5Access 7.4 26 7.4 25 8.7Sunnyside Rd. 81.2 15 64.0 15 62.2SE Sunnybrook Blvd 10.9 21 15.8 22 14.3Total 218.2 18 230.9 15 334.4
Appendix Memorandum: Task 3.2 MMA Additional Needed Infrastructure Page A-41
Arterial Level of Service2010 Baseline 9/9/2015
CRC MMA Queuing Analysis SimTraffic ReportPage 21
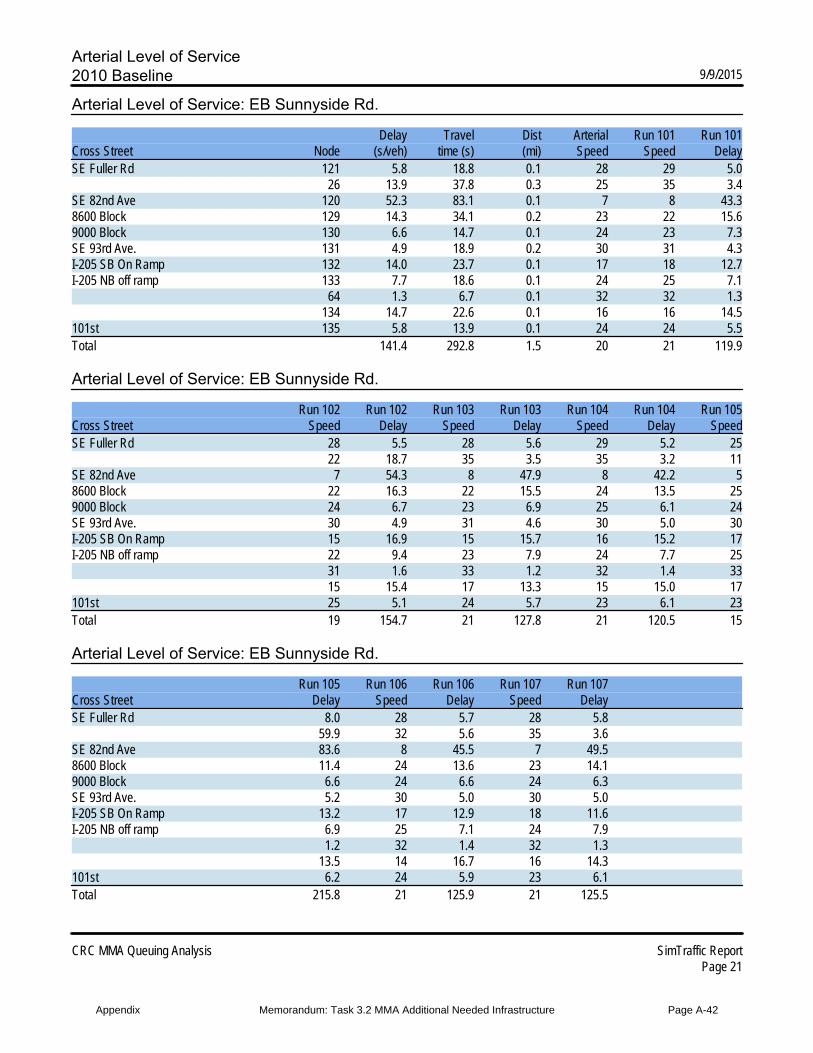
Arterial Level of Service: EB Sunnyside Rd.
Delay Travel Dist Arterial Run 101 Run 101Cross Street Node (s/veh) time (s) (mi) Speed Speed DelaySE Fuller Rd 121 5.8 18.8 0.1 28 29 5.0
26 13.9 37.8 0.3 25 35 3.4SE 82nd Ave 120 52.3 83.1 0.1 7 8 43.38600 Block 129 14.3 34.1 0.2 23 22 15.69000 Block 130 6.6 14.7 0.1 24 23 7.3SE 93rd Ave. 131 4.9 18.9 0.2 30 31 4.3I-205 SB On Ramp 132 14.0 23.7 0.1 17 18 12.7I-205 NB off ramp 133 7.7 18.6 0.1 24 25 7.1
64 1.3 6.7 0.1 32 32 1.3134 14.7 22.6 0.1 16 16 14.5
101st 135 5.8 13.9 0.1 24 24 5.5Total 141.4 292.8 1.5 20 21 119.9
Arterial Level of Service: EB Sunnyside Rd.
Run 102 Run 102 Run 103 Run 103 Run 104 Run 104 Run 105Cross Street Speed Delay Speed Delay Speed Delay SpeedSE Fuller Rd 28 5.5 28 5.6 29 5.2 25
22 18.7 35 3.5 35 3.2 11SE 82nd Ave 7 54.3 8 47.9 8 42.2 58600 Block 22 16.3 22 15.5 24 13.5 259000 Block 24 6.7 23 6.9 25 6.1 24SE 93rd Ave. 30 4.9 31 4.6 30 5.0 30I-205 SB On Ramp 15 16.9 15 15.7 16 15.2 17I-205 NB off ramp 22 9.4 23 7.9 24 7.7 25
31 1.6 33 1.2 32 1.4 3315 15.4 17 13.3 15 15.0 17
101st 25 5.1 24 5.7 23 6.1 23Total 19 154.7 21 127.8 21 120.5 15
Arterial Level of Service: EB Sunnyside Rd.
Run 105 Run 106 Run 106 Run 107 Run 107Cross Street Delay Speed Delay Speed DelaySE Fuller Rd 8.0 28 5.7 28 5.8
59.9 32 5.6 35 3.6SE 82nd Ave 83.6 8 45.5 7 49.58600 Block 11.4 24 13.6 23 14.19000 Block 6.6 24 6.6 24 6.3SE 93rd Ave. 5.2 30 5.0 30 5.0I-205 SB On Ramp 13.2 17 12.9 18 11.6I-205 NB off ramp 6.9 25 7.1 24 7.9
1.2 32 1.4 32 1.313.5 14 16.7 16 14.3
101st 6.2 24 5.9 23 6.1Total 215.8 21 125.9 21 125.5
Appendix Memorandum: Task 3.2 MMA Additional Needed Infrastructure Page A-42
Arterial Level of Service2010 Baseline 9/9/2015
CRC MMA Queuing Analysis SimTraffic ReportPage 22
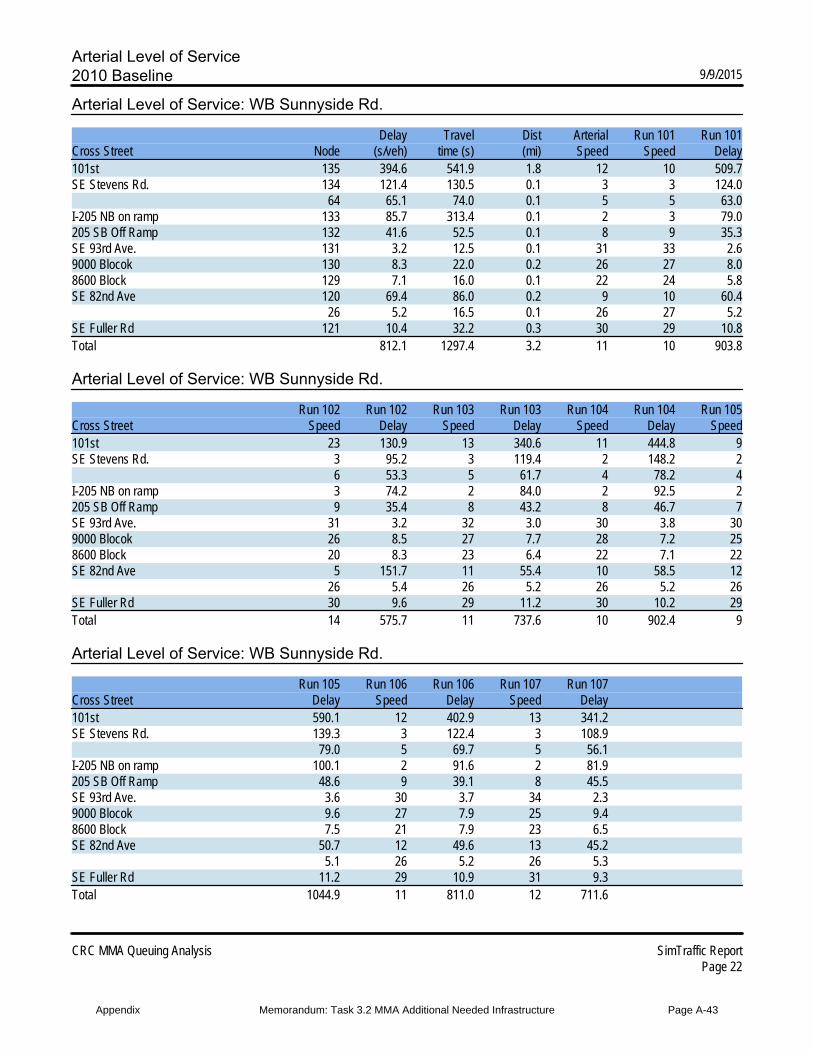
Arterial Level of Service: WB Sunnyside Rd.
Delay Travel Dist Arterial Run 101 Run 101Cross Street Node (s/veh) time (s) (mi) Speed Speed Delay101st 135 394.6 541.9 1.8 12 10 509.7SE Stevens Rd. 134 121.4 130.5 0.1 3 3 124.0
64 65.1 74.0 0.1 5 5 63.0I-205 NB on ramp 133 85.7 313.4 0.1 2 3 79.0205 SB Off Ramp 132 41.6 52.5 0.1 8 9 35.3SE 93rd Ave. 131 3.2 12.5 0.1 31 33 2.69000 Blocok 130 8.3 22.0 0.2 26 27 8.08600 Block 129 7.1 16.0 0.1 22 24 5.8SE 82nd Ave 120 69.4 86.0 0.2 9 10 60.4
26 5.2 16.5 0.1 26 27 5.2SE Fuller Rd 121 10.4 32.2 0.3 30 29 10.8Total 812.1 1297.4 3.2 11 10 903.8
Arterial Level of Service: WB Sunnyside Rd.
Run 102 Run 102 Run 103 Run 103 Run 104 Run 104 Run 105Cross Street Speed Delay Speed Delay Speed Delay Speed101st 23 130.9 13 340.6 11 444.8 9SE Stevens Rd. 3 95.2 3 119.4 2 148.2 2
6 53.3 5 61.7 4 78.2 4I-205 NB on ramp 3 74.2 2 84.0 2 92.5 2205 SB Off Ramp 9 35.4 8 43.2 8 46.7 7SE 93rd Ave. 31 3.2 32 3.0 30 3.8 309000 Blocok 26 8.5 27 7.7 28 7.2 258600 Block 20 8.3 23 6.4 22 7.1 22SE 82nd Ave 5 151.7 11 55.4 10 58.5 12
26 5.4 26 5.2 26 5.2 26SE Fuller Rd 30 9.6 29 11.2 30 10.2 29Total 14 575.7 11 737.6 10 902.4 9
Arterial Level of Service: WB Sunnyside Rd.
Run 105 Run 106 Run 106 Run 107 Run 107Cross Street Delay Speed Delay Speed Delay101st 590.1 12 402.9 13 341.2SE Stevens Rd. 139.3 3 122.4 3 108.9
79.0 5 69.7 5 56.1I-205 NB on ramp 100.1 2 91.6 2 81.9205 SB Off Ramp 48.6 9 39.1 8 45.5SE 93rd Ave. 3.6 30 3.7 34 2.39000 Blocok 9.6 27 7.9 25 9.48600 Block 7.5 21 7.9 23 6.5SE 82nd Ave 50.7 12 49.6 13 45.2
5.1 26 5.2 26 5.3SE Fuller Rd 11.2 29 10.9 31 9.3Total 1044.9 11 811.0 12 711.6
Appendix Memorandum: Task 3.2 MMA Additional Needed Infrastructure Page A-43
Queuing and Blocking Report2010 Baseline 9/9/2015
CRC MMA Queuing Analysis SimTraffic ReportPage 23
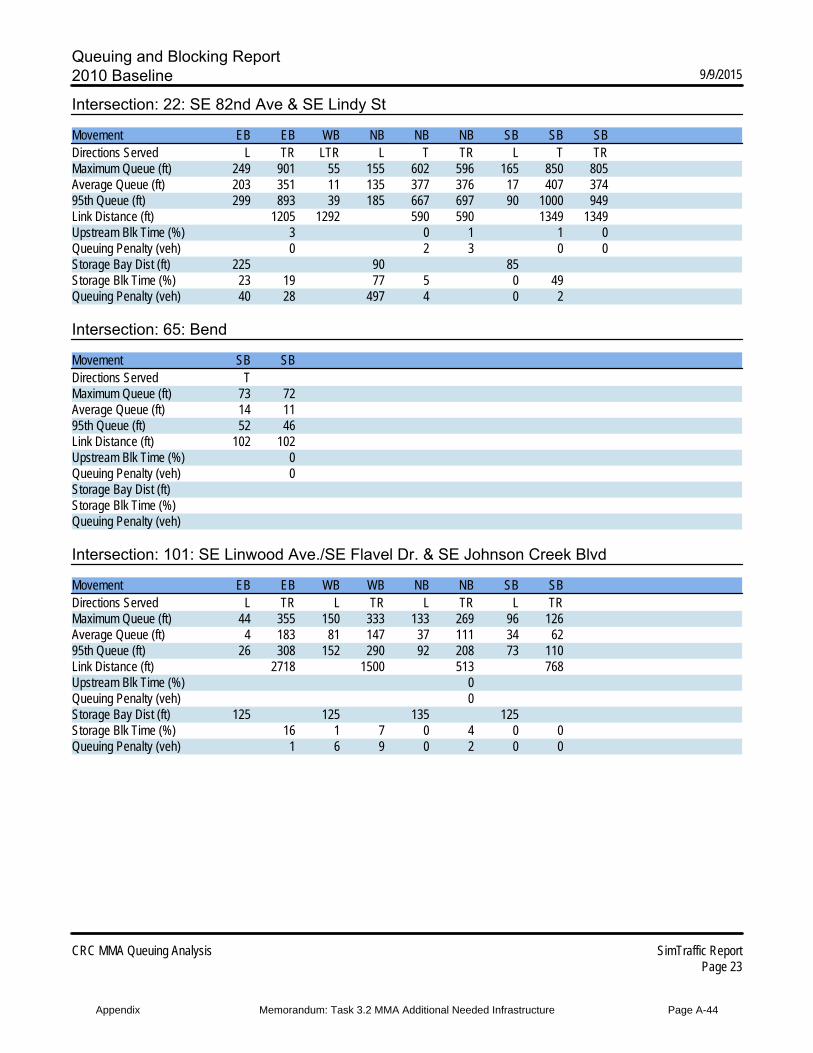
Intersection: 22: SE 82nd Ave & SE Lindy St
Movement EB EB WB NB NB NB SB SB SBDirections Served L TR LTR L T TR L T TRMaximum Queue (ft) 249 901 55 155 602 596 165 850 805Average Queue (ft) 203 351 11 135 377 376 17 407 37495th Queue (ft) 299 893 39 185 667 697 90 1000 949Link Distance (ft) 1205 1292 590 590 1349 1349Upstream Blk Time (%) 3 0 1 1 0Queuing Penalty (veh) 0 2 3 0 0Storage Bay Dist (ft) 225 90 85Storage Blk Time (%) 23 19 77 5 0 49Queuing Penalty (veh) 40 28 497 4 0 2
Intersection: 65: Bend
Movement SB SBDirections Served TMaximum Queue (ft) 73 72Average Queue (ft) 14 1195th Queue (ft) 52 46Link Distance (ft) 102 102Upstream Blk Time (%) 0Queuing Penalty (veh) 0Storage Bay Dist (ft)Storage Blk Time (%)Queuing Penalty (veh)
Intersection: 101: SE Linwood Ave./SE Flavel Dr. & SE Johnson Creek Blvd
Movement EB EB WB WB NB NB SB SBDirections Served L TR L TR L TR L TRMaximum Queue (ft) 44 355 150 333 133 269 96 126Average Queue (ft) 4 183 81 147 37 111 34 6295th Queue (ft) 26 308 152 290 92 208 73 110Link Distance (ft) 2718 1500 513 768Upstream Blk Time (%) 0Queuing Penalty (veh) 0Storage Bay Dist (ft) 125 125 135 125Storage Blk Time (%) 16 1 7 0 4 0 0Queuing Penalty (veh) 1 6 9 0 2 0 0
Appendix Memorandum: Task 3.2 MMA Additional Needed Infrastructure Page A-44
Queuing and Blocking Report2010 Baseline 9/9/2015
CRC MMA Queuing Analysis SimTraffic ReportPage 24
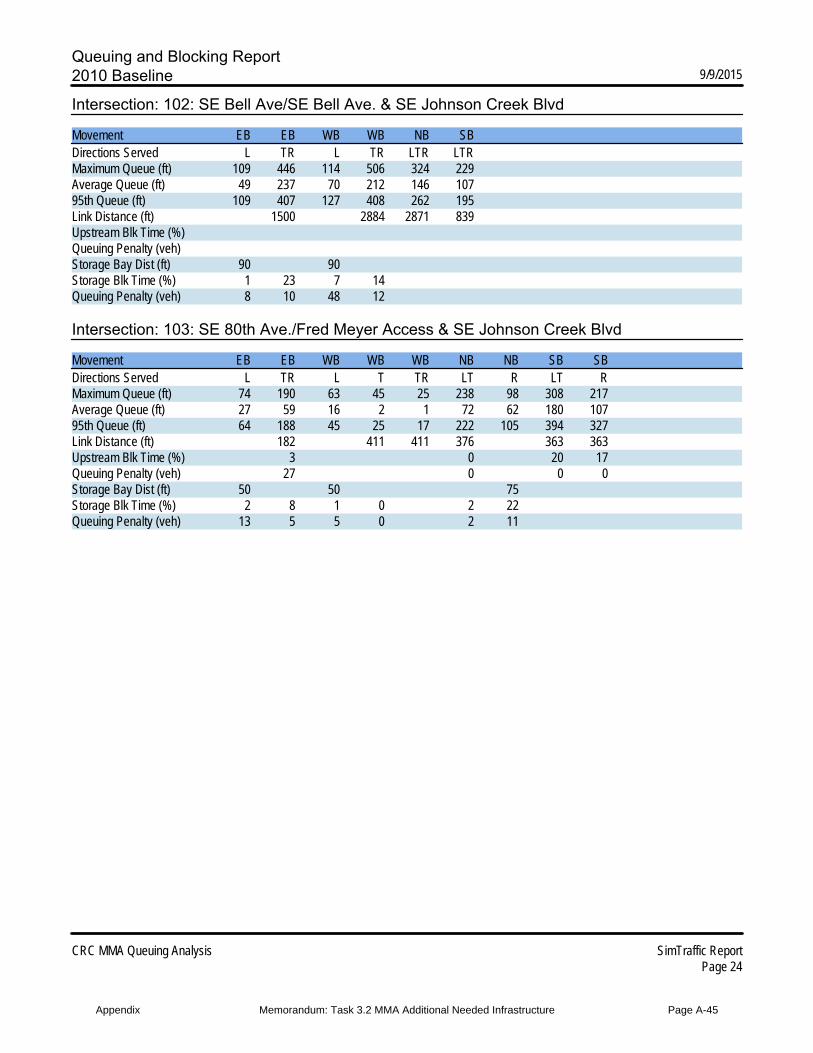
Intersection: 102: SE Bell Ave/SE Bell Ave. & SE Johnson Creek Blvd
Movement EB EB WB WB NB SBDirections Served L TR L TR LTR LTRMaximum Queue (ft) 109 446 114 506 324 229Average Queue (ft) 49 237 70 212 146 10795th Queue (ft) 109 407 127 408 262 195Link Distance (ft) 1500 2884 2871 839Upstream Blk Time (%)Queuing Penalty (veh)Storage Bay Dist (ft) 90 90Storage Blk Time (%) 1 23 7 14Queuing Penalty (veh) 8 10 48 12
Intersection: 103: SE 80th Ave./Fred Meyer Access & SE Johnson Creek Blvd
Movement EB EB WB WB WB NB NB SB SBDirections Served L TR L T TR LT R LT RMaximum Queue (ft) 74 190 63 45 25 238 98 308 217Average Queue (ft) 27 59 16 2 1 72 62 180 10795th Queue (ft) 64 188 45 25 17 222 105 394 327Link Distance (ft) 182 411 411 376 363 363Upstream Blk Time (%) 3 0 20 17Queuing Penalty (veh) 27 0 0 0Storage Bay Dist (ft) 50 50 75Storage Blk Time (%) 2 8 1 0 2 22Queuing Penalty (veh) 13 5 5 0 2 11
Appendix Memorandum: Task 3.2 MMA Additional Needed Infrastructure Page A-45
Queuing and Blocking Report2010 Baseline 9/9/2015
CRC MMA Queuing Analysis SimTraffic ReportPage 25
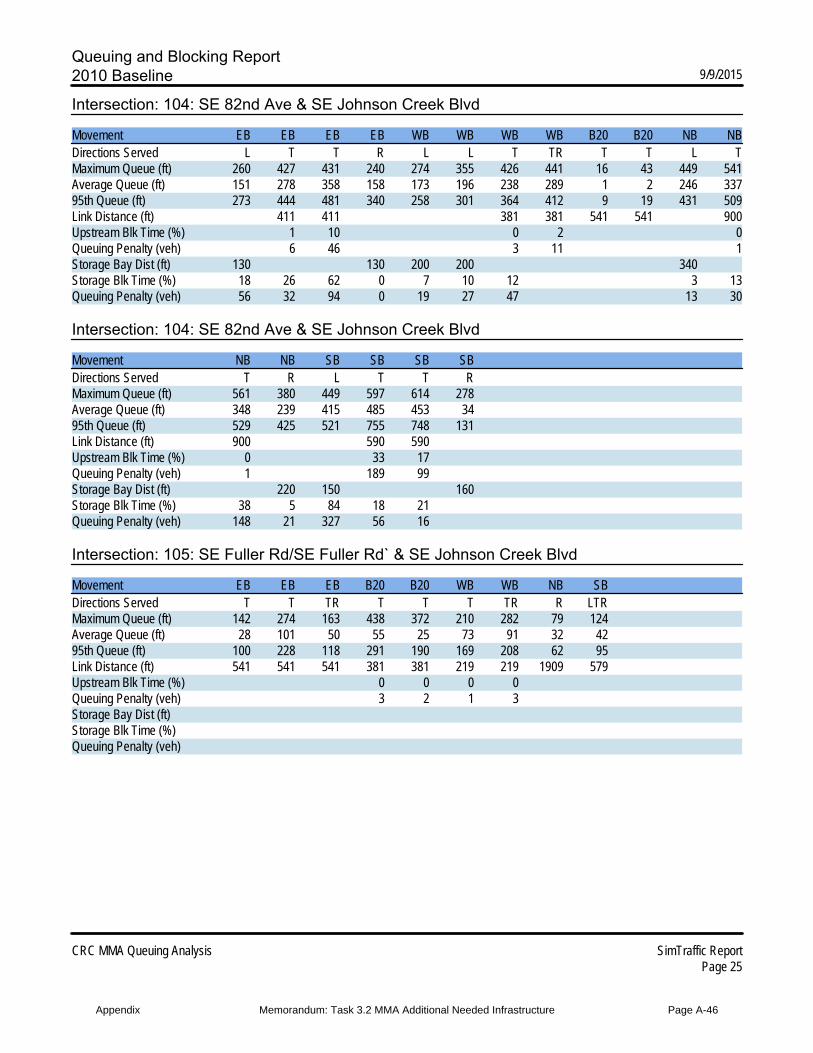
Intersection: 104: SE 82nd Ave & SE Johnson Creek Blvd
Movement EB EB EB EB WB WB WB WB B20 B20 NB NBDirections Served L T T R L L T TR T T L TMaximum Queue (ft) 260 427 431 240 274 355 426 441 16 43 449 541Average Queue (ft) 151 278 358 158 173 196 238 289 1 2 246 33795th Queue (ft) 273 444 481 340 258 301 364 412 9 19 431 509Link Distance (ft) 411 411 381 381 541 541 900Upstream Blk Time (%) 1 10 0 2 0Queuing Penalty (veh) 6 46 3 11 1Storage Bay Dist (ft) 130 130 200 200 340Storage Blk Time (%) 18 26 62 0 7 10 12 3 13Queuing Penalty (veh) 56 32 94 0 19 27 47 13 30
Intersection: 104: SE 82nd Ave & SE Johnson Creek Blvd
Movement NB NB SB SB SB SBDirections Served T R L T T RMaximum Queue (ft) 561 380 449 597 614 278Average Queue (ft) 348 239 415 485 453 3495th Queue (ft) 529 425 521 755 748 131Link Distance (ft) 900 590 590Upstream Blk Time (%) 0 33 17Queuing Penalty (veh) 1 189 99Storage Bay Dist (ft) 220 150 160Storage Blk Time (%) 38 5 84 18 21Queuing Penalty (veh) 148 21 327 56 16
Intersection: 105: SE Fuller Rd/SE Fuller Rd` & SE Johnson Creek Blvd
Movement EB EB EB B20 B20 WB WB NB SBDirections Served T T TR T T T TR R LTRMaximum Queue (ft) 142 274 163 438 372 210 282 79 124Average Queue (ft) 28 101 50 55 25 73 91 32 4295th Queue (ft) 100 228 118 291 190 169 208 62 95Link Distance (ft) 541 541 541 381 381 219 219 1909 579Upstream Blk Time (%) 0 0 0 0Queuing Penalty (veh) 3 2 1 3Storage Bay Dist (ft)Storage Blk Time (%)Queuing Penalty (veh)
Appendix Memorandum: Task 3.2 MMA Additional Needed Infrastructure Page A-46
Queuing and Blocking Report2010 Baseline 9/9/2015
CRC MMA Queuing Analysis SimTraffic ReportPage 26
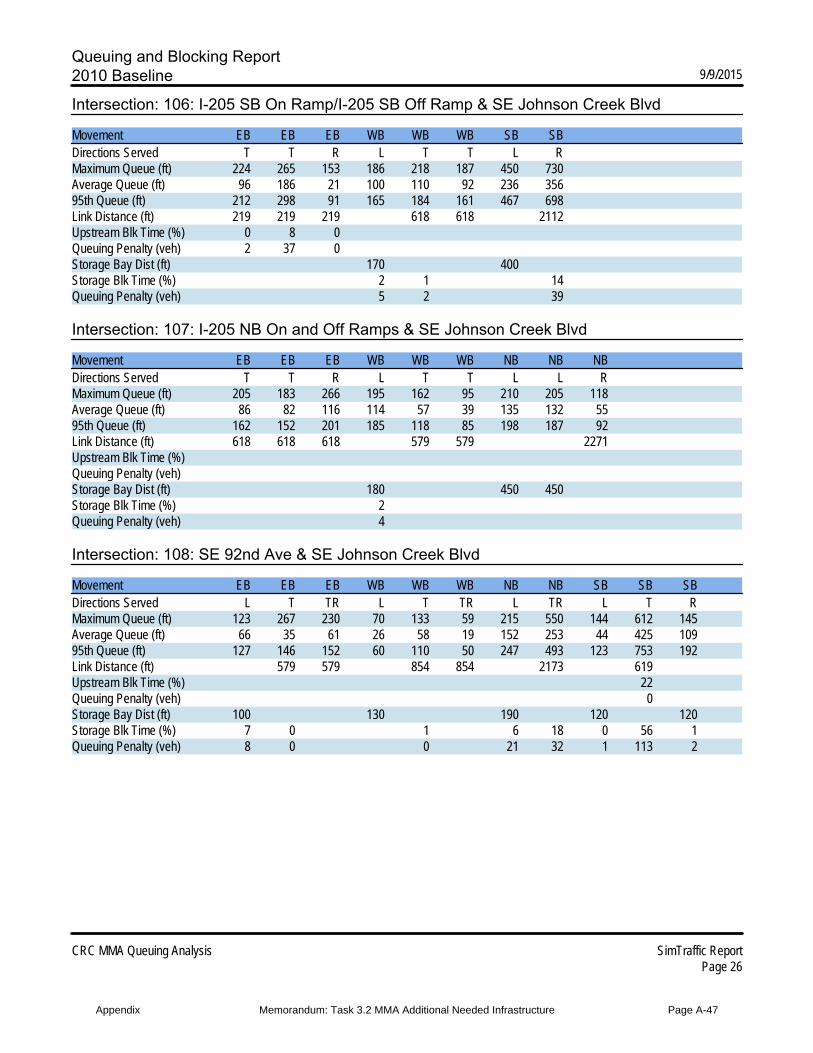
Intersection: 106: I-205 SB On Ramp/I-205 SB Off Ramp & SE Johnson Creek Blvd
Movement EB EB EB WB WB WB SB SBDirections Served T T R L T T L RMaximum Queue (ft) 224 265 153 186 218 187 450 730Average Queue (ft) 96 186 21 100 110 92 236 35695th Queue (ft) 212 298 91 165 184 161 467 698Link Distance (ft) 219 219 219 618 618 2112Upstream Blk Time (%) 0 8 0Queuing Penalty (veh) 2 37 0Storage Bay Dist (ft) 170 400Storage Blk Time (%) 2 1 14Queuing Penalty (veh) 5 2 39
Intersection: 107: I-205 NB On and Off Ramps & SE Johnson Creek Blvd
Movement EB EB EB WB WB WB NB NB NBDirections Served T T R L T T L L RMaximum Queue (ft) 205 183 266 195 162 95 210 205 118Average Queue (ft) 86 82 116 114 57 39 135 132 5595th Queue (ft) 162 152 201 185 118 85 198 187 92Link Distance (ft) 618 618 618 579 579 2271Upstream Blk Time (%)Queuing Penalty (veh)Storage Bay Dist (ft) 180 450 450Storage Blk Time (%) 2Queuing Penalty (veh) 4
Intersection: 108: SE 92nd Ave & SE Johnson Creek Blvd
Movement EB EB EB WB WB WB NB NB SB SB SBDirections Served L T TR L T TR L TR L T RMaximum Queue (ft) 123 267 230 70 133 59 215 550 144 612 145Average Queue (ft) 66 35 61 26 58 19 152 253 44 425 10995th Queue (ft) 127 146 152 60 110 50 247 493 123 753 192Link Distance (ft) 579 579 854 854 2173 619Upstream Blk Time (%) 22Queuing Penalty (veh) 0Storage Bay Dist (ft) 100 130 190 120 120Storage Blk Time (%) 7 0 1 6 18 0 56 1Queuing Penalty (veh) 8 0 0 21 32 1 113 2
Appendix Memorandum: Task 3.2 MMA Additional Needed Infrastructure Page A-47
Queuing and Blocking Report2010 Baseline 9/9/2015
CRC MMA Queuing Analysis SimTraffic ReportPage 27
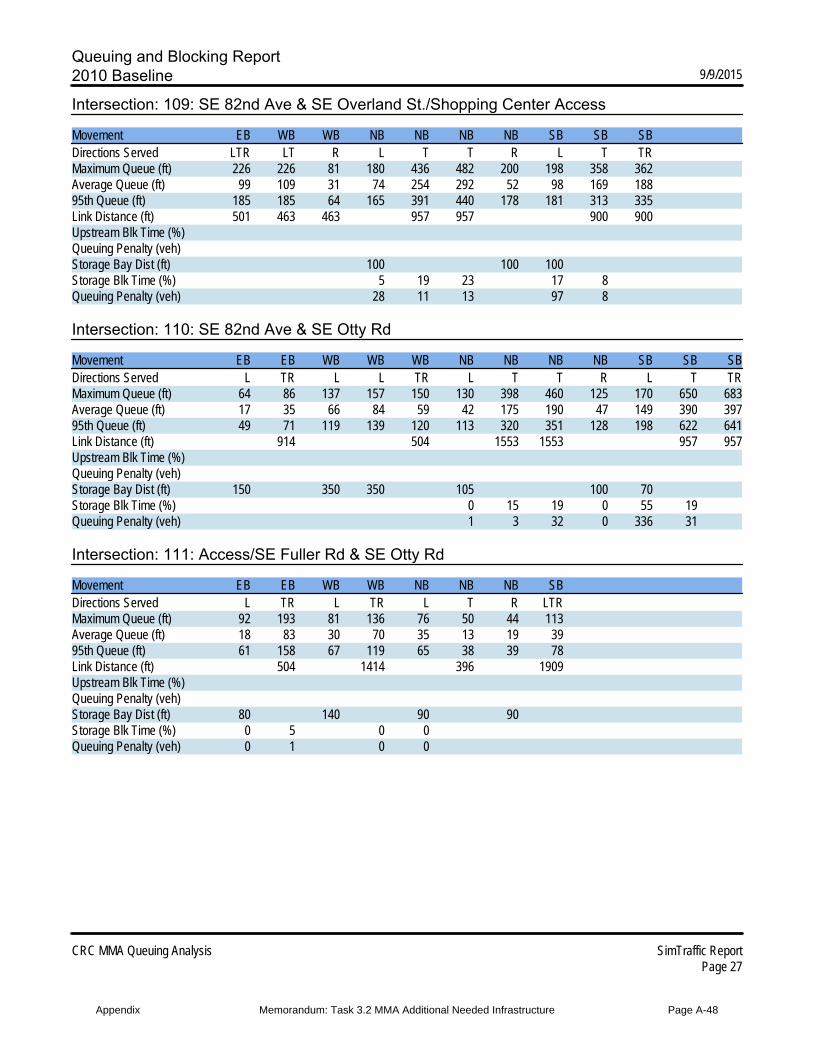
Intersection: 109: SE 82nd Ave & SE Overland St./Shopping Center Access
Movement EB WB WB NB NB NB NB SB SB SBDirections Served LTR LT R L T T R L T TRMaximum Queue (ft) 226 226 81 180 436 482 200 198 358 362Average Queue (ft) 99 109 31 74 254 292 52 98 169 18895th Queue (ft) 185 185 64 165 391 440 178 181 313 335Link Distance (ft) 501 463 463 957 957 900 900Upstream Blk Time (%)Queuing Penalty (veh)Storage Bay Dist (ft) 100 100 100Storage Blk Time (%) 5 19 23 17 8Queuing Penalty (veh) 28 11 13 97 8
Intersection: 110: SE 82nd Ave & SE Otty Rd
Movement EB EB WB WB WB NB NB NB NB SB SB SBDirections Served L TR L L TR L T T R L T TRMaximum Queue (ft) 64 86 137 157 150 130 398 460 125 170 650 683Average Queue (ft) 17 35 66 84 59 42 175 190 47 149 390 39795th Queue (ft) 49 71 119 139 120 113 320 351 128 198 622 641Link Distance (ft) 914 504 1553 1553 957 957Upstream Blk Time (%)Queuing Penalty (veh)Storage Bay Dist (ft) 150 350 350 105 100 70Storage Blk Time (%) 0 15 19 0 55 19Queuing Penalty (veh) 1 3 32 0 336 31
Intersection: 111: Access/SE Fuller Rd & SE Otty Rd
Movement EB EB WB WB NB NB NB SBDirections Served L TR L TR L T R LTRMaximum Queue (ft) 92 193 81 136 76 50 44 113Average Queue (ft) 18 83 30 70 35 13 19 3995th Queue (ft) 61 158 67 119 65 38 39 78Link Distance (ft) 504 1414 396 1909Upstream Blk Time (%)Queuing Penalty (veh)Storage Bay Dist (ft) 80 140 90 90Storage Blk Time (%) 0 5 0 0Queuing Penalty (veh) 0 1 0 0
Appendix Memorandum: Task 3.2 MMA Additional Needed Infrastructure Page A-48
Queuing and Blocking Report2010 Baseline 9/9/2015
CRC MMA Queuing Analysis SimTraffic ReportPage 28
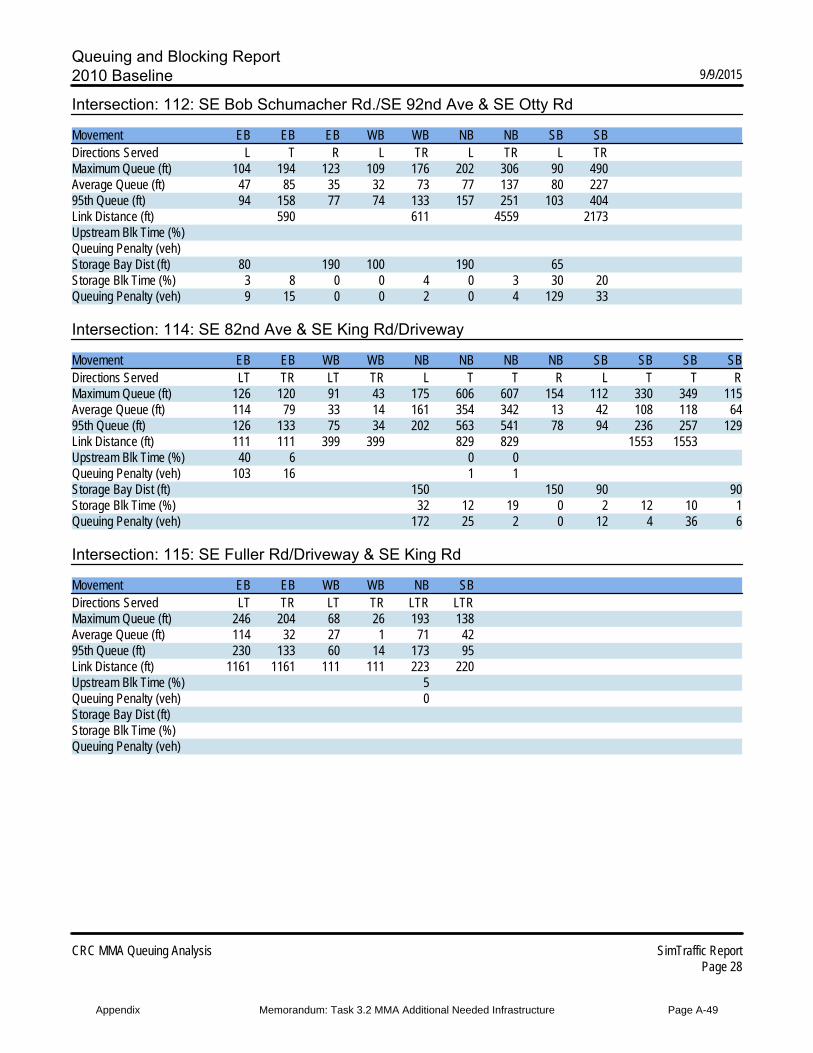
Intersection: 112: SE Bob Schumacher Rd./SE 92nd Ave & SE Otty Rd
Movement EB EB EB WB WB NB NB SB SBDirections Served L T R L TR L TR L TRMaximum Queue (ft) 104 194 123 109 176 202 306 90 490Average Queue (ft) 47 85 35 32 73 77 137 80 22795th Queue (ft) 94 158 77 74 133 157 251 103 404Link Distance (ft) 590 611 4559 2173Upstream Blk Time (%)Queuing Penalty (veh)Storage Bay Dist (ft) 80 190 100 190 65Storage Blk Time (%) 3 8 0 0 4 0 3 30 20Queuing Penalty (veh) 9 15 0 0 2 0 4 129 33
Intersection: 114: SE 82nd Ave & SE King Rd/Driveway
Movement EB EB WB WB NB NB NB NB SB SB SB SBDirections Served LT TR LT TR L T T R L T T RMaximum Queue (ft) 126 120 91 43 175 606 607 154 112 330 349 115Average Queue (ft) 114 79 33 14 161 354 342 13 42 108 118 6495th Queue (ft) 126 133 75 34 202 563 541 78 94 236 257 129Link Distance (ft) 111 111 399 399 829 829 1553 1553Upstream Blk Time (%) 40 6 0 0Queuing Penalty (veh) 103 16 1 1Storage Bay Dist (ft) 150 150 90 90Storage Blk Time (%) 32 12 19 0 2 12 10 1Queuing Penalty (veh) 172 25 2 0 12 4 36 6
Intersection: 115: SE Fuller Rd/Driveway & SE King Rd
Movement EB EB WB WB NB SBDirections Served LT TR LT TR LTR LTRMaximum Queue (ft) 246 204 68 26 193 138Average Queue (ft) 114 32 27 1 71 4295th Queue (ft) 230 133 60 14 173 95Link Distance (ft) 1161 1161 111 111 223 220Upstream Blk Time (%) 5Queuing Penalty (veh) 0Storage Bay Dist (ft)Storage Blk Time (%)Queuing Penalty (veh)
Appendix Memorandum: Task 3.2 MMA Additional Needed Infrastructure Page A-49
Queuing and Blocking Report2010 Baseline 9/9/2015
CRC MMA Queuing Analysis SimTraffic ReportPage 29
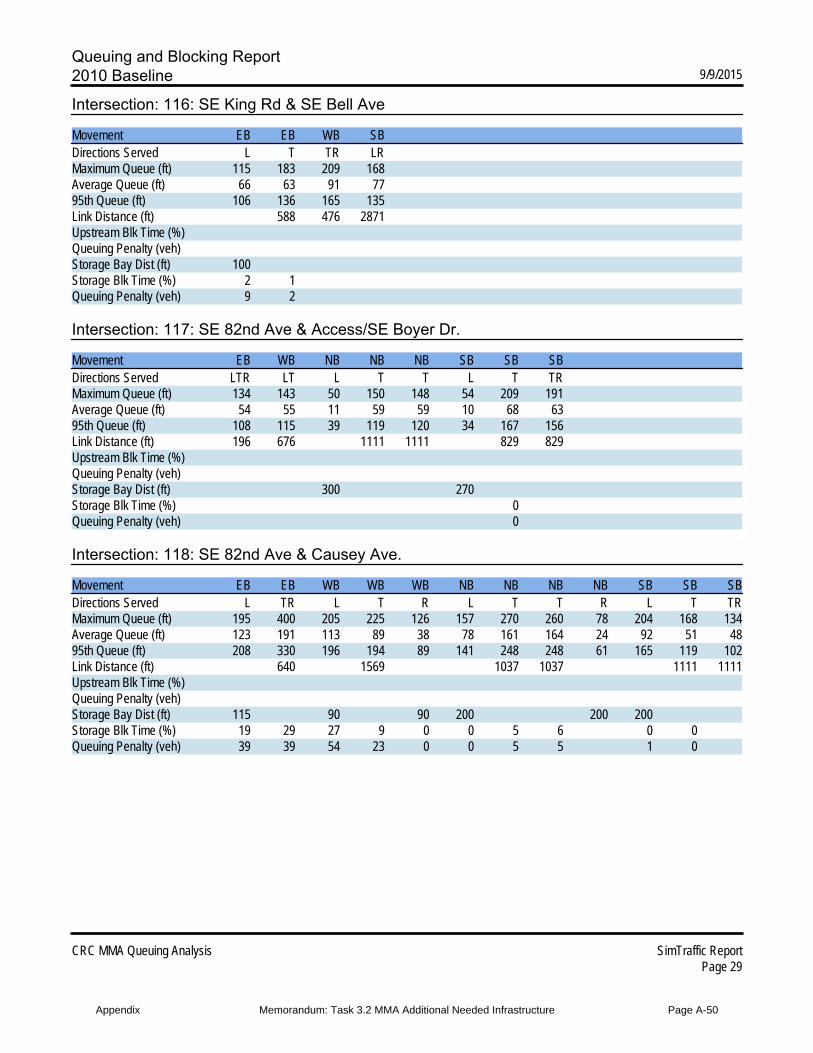
Intersection: 116: SE King Rd & SE Bell Ave
Movement EB EB WB SBDirections Served L T TR LRMaximum Queue (ft) 115 183 209 168Average Queue (ft) 66 63 91 7795th Queue (ft) 106 136 165 135Link Distance (ft) 588 476 2871Upstream Blk Time (%)Queuing Penalty (veh)Storage Bay Dist (ft) 100Storage Blk Time (%) 2 1Queuing Penalty (veh) 9 2
Intersection: 117: SE 82nd Ave & Access/SE Boyer Dr.
Movement EB WB NB NB NB SB SB SBDirections Served LTR LT L T T L T TRMaximum Queue (ft) 134 143 50 150 148 54 209 191Average Queue (ft) 54 55 11 59 59 10 68 6395th Queue (ft) 108 115 39 119 120 34 167 156Link Distance (ft) 196 676 1111 1111 829 829Upstream Blk Time (%)Queuing Penalty (veh)Storage Bay Dist (ft) 300 270Storage Blk Time (%) 0Queuing Penalty (veh) 0
Intersection: 118: SE 82nd Ave & Causey Ave.
Movement EB EB WB WB WB NB NB NB NB SB SB SBDirections Served L TR L T R L T T R L T TRMaximum Queue (ft) 195 400 205 225 126 157 270 260 78 204 168 134Average Queue (ft) 123 191 113 89 38 78 161 164 24 92 51 4895th Queue (ft) 208 330 196 194 89 141 248 248 61 165 119 102Link Distance (ft) 640 1569 1037 1037 1111 1111Upstream Blk Time (%)Queuing Penalty (veh)Storage Bay Dist (ft) 115 90 90 200 200 200Storage Blk Time (%) 19 29 27 9 0 0 5 6 0 0Queuing Penalty (veh) 39 39 54 23 0 0 5 5 1 0
Appendix Memorandum: Task 3.2 MMA Additional Needed Infrastructure Page A-50
Queuing and Blocking Report2010 Baseline 9/9/2015
CRC MMA Queuing Analysis SimTraffic ReportPage 30
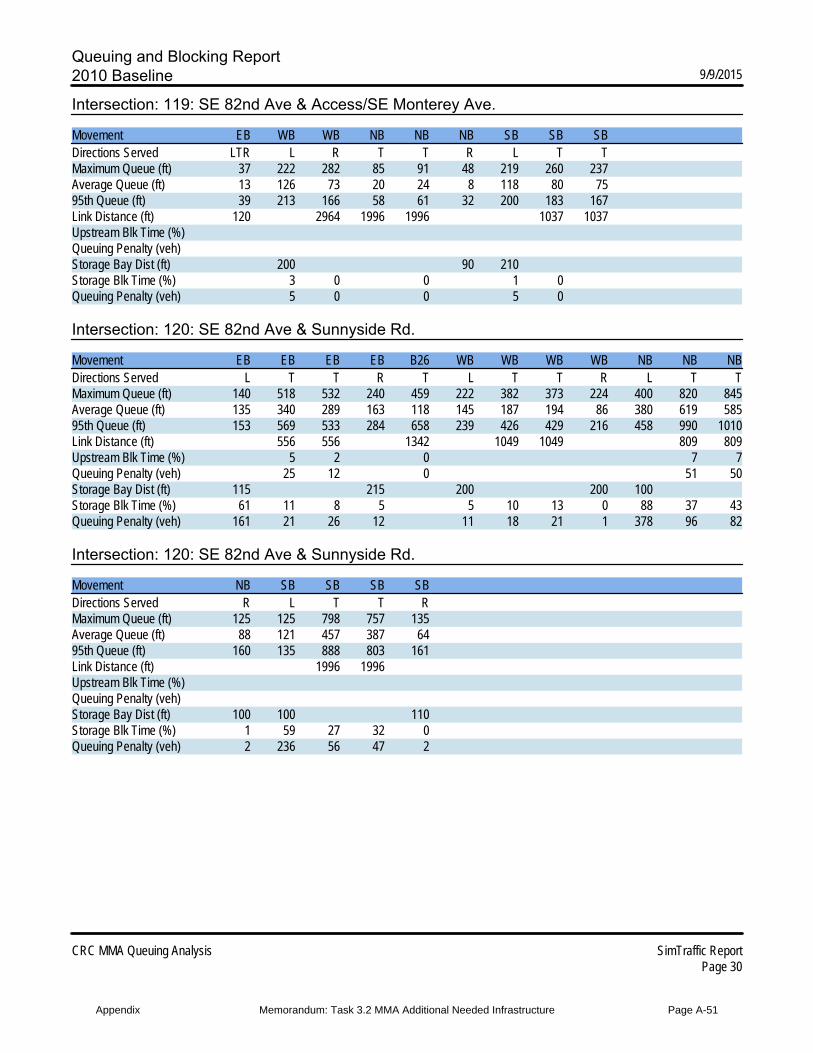
Intersection: 119: SE 82nd Ave & Access/SE Monterey Ave.
Movement EB WB WB NB NB NB SB SB SBDirections Served LTR L R T T R L T TMaximum Queue (ft) 37 222 282 85 91 48 219 260 237Average Queue (ft) 13 126 73 20 24 8 118 80 7595th Queue (ft) 39 213 166 58 61 32 200 183 167Link Distance (ft) 120 2964 1996 1996 1037 1037Upstream Blk Time (%)Queuing Penalty (veh)Storage Bay Dist (ft) 200 90 210Storage Blk Time (%) 3 0 0 1 0Queuing Penalty (veh) 5 0 0 5 0
Intersection: 120: SE 82nd Ave & Sunnyside Rd.
Movement EB EB EB EB B26 WB WB WB WB NB NB NBDirections Served L T T R T L T T R L T TMaximum Queue (ft) 140 518 532 240 459 222 382 373 224 400 820 845Average Queue (ft) 135 340 289 163 118 145 187 194 86 380 619 58595th Queue (ft) 153 569 533 284 658 239 426 429 216 458 990 1010Link Distance (ft) 556 556 1342 1049 1049 809 809Upstream Blk Time (%) 5 2 0 7 7Queuing Penalty (veh) 25 12 0 51 50Storage Bay Dist (ft) 115 215 200 200 100Storage Blk Time (%) 61 11 8 5 5 10 13 0 88 37 43Queuing Penalty (veh) 161 21 26 12 11 18 21 1 378 96 82
Intersection: 120: SE 82nd Ave & Sunnyside Rd.
Movement NB SB SB SB SBDirections Served R L T T RMaximum Queue (ft) 125 125 798 757 135Average Queue (ft) 88 121 457 387 6495th Queue (ft) 160 135 888 803 161Link Distance (ft) 1996 1996Upstream Blk Time (%)Queuing Penalty (veh)Storage Bay Dist (ft) 100 100 110Storage Blk Time (%) 1 59 27 32 0Queuing Penalty (veh) 2 236 56 47 2
Appendix Memorandum: Task 3.2 MMA Additional Needed Infrastructure Page A-51
Queuing and Blocking Report2010 Baseline 9/9/2015
CRC MMA Queuing Analysis SimTraffic ReportPage 31
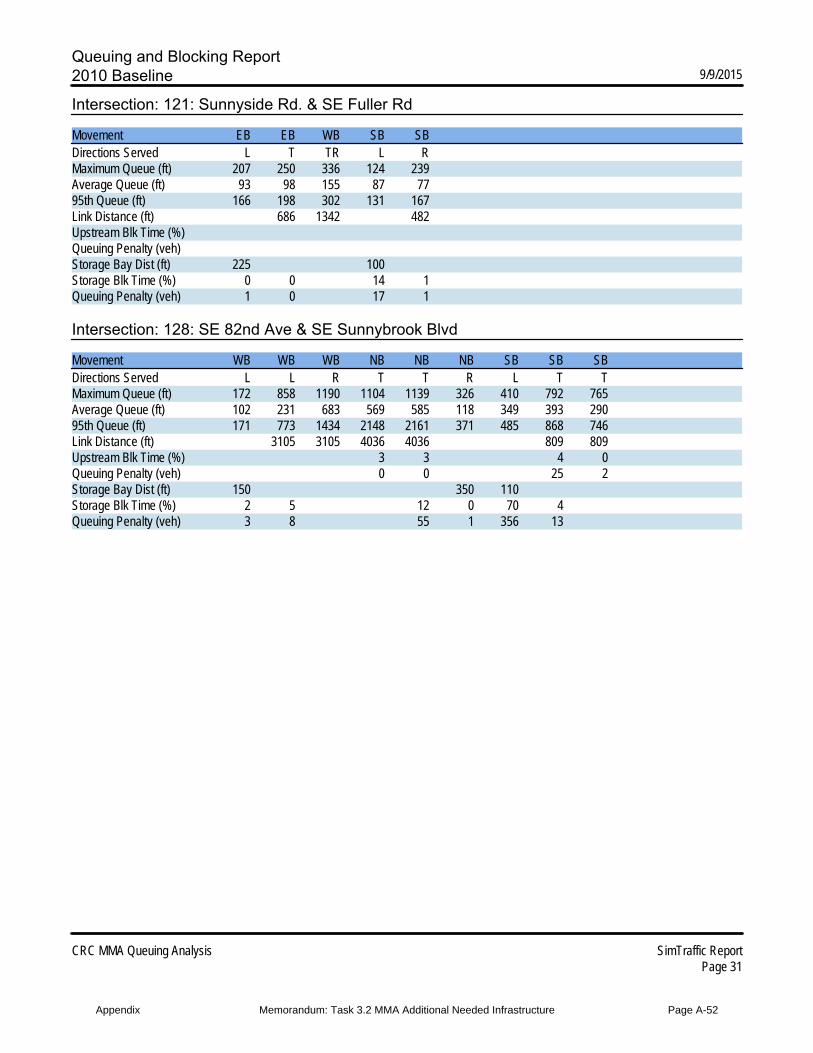
Intersection: 121: Sunnyside Rd. & SE Fuller Rd
Movement EB EB WB SB SBDirections Served L T TR L RMaximum Queue (ft) 207 250 336 124 239Average Queue (ft) 93 98 155 87 7795th Queue (ft) 166 198 302 131 167Link Distance (ft) 686 1342 482Upstream Blk Time (%)Queuing Penalty (veh)Storage Bay Dist (ft) 225 100Storage Blk Time (%) 0 0 14 1Queuing Penalty (veh) 1 0 17 1
Intersection: 128: SE 82nd Ave & SE Sunnybrook Blvd
Movement WB WB WB NB NB NB SB SB SBDirections Served L L R T T R L T TMaximum Queue (ft) 172 858 1190 1104 1139 326 410 792 765Average Queue (ft) 102 231 683 569 585 118 349 393 29095th Queue (ft) 171 773 1434 2148 2161 371 485 868 746Link Distance (ft) 3105 3105 4036 4036 809 809Upstream Blk Time (%) 3 3 4 0Queuing Penalty (veh) 0 0 25 2Storage Bay Dist (ft) 150 350 110Storage Blk Time (%) 2 5 12 0 70 4Queuing Penalty (veh) 3 8 55 1 356 13
Appendix Memorandum: Task 3.2 MMA Additional Needed Infrastructure Page A-52
Queuing and Blocking Report2010 Baseline 9/9/2015
CRC MMA Queuing Analysis SimTraffic ReportPage 32
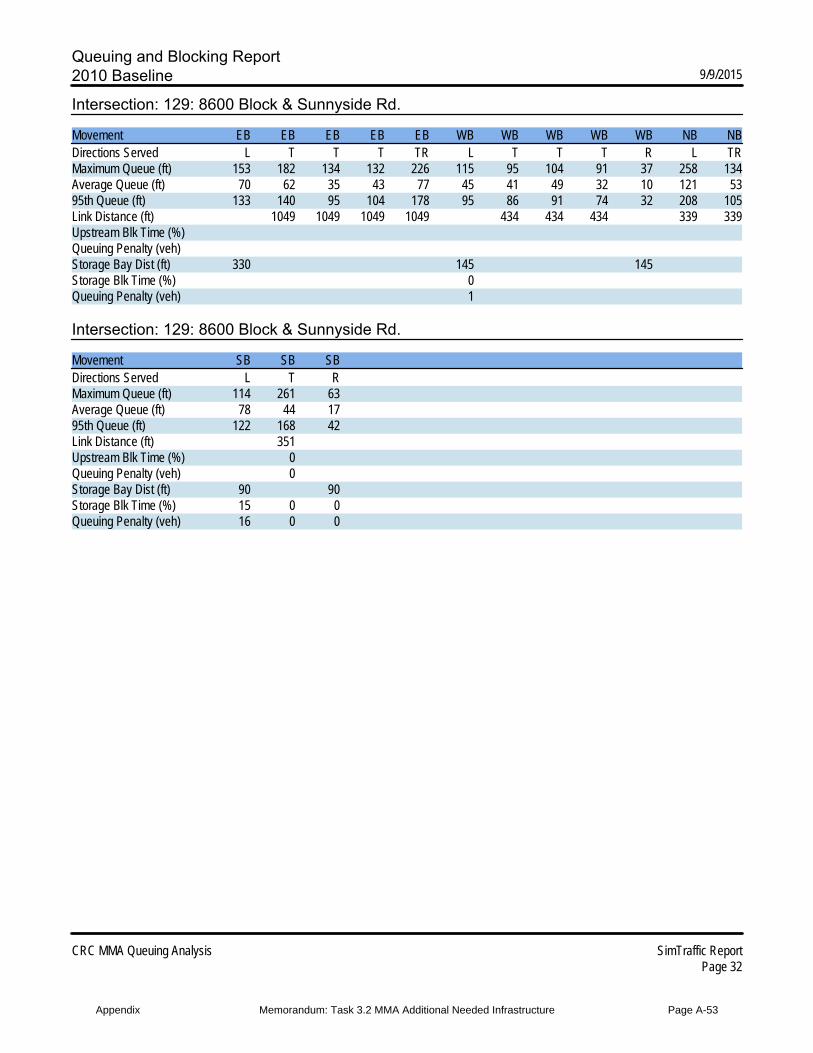
Intersection: 129: 8600 Block & Sunnyside Rd.
Movement EB EB EB EB EB WB WB WB WB WB NB NBDirections Served L T T T TR L T T T R L TRMaximum Queue (ft) 153 182 134 132 226 115 95 104 91 37 258 134Average Queue (ft) 70 62 35 43 77 45 41 49 32 10 121 5395th Queue (ft) 133 140 95 104 178 95 86 91 74 32 208 105Link Distance (ft) 1049 1049 1049 1049 434 434 434 339 339Upstream Blk Time (%)Queuing Penalty (veh)Storage Bay Dist (ft) 330 145 145Storage Blk Time (%) 0Queuing Penalty (veh) 1
Intersection: 129: 8600 Block & Sunnyside Rd.
Movement SB SB SBDirections Served L T RMaximum Queue (ft) 114 261 63Average Queue (ft) 78 44 1795th Queue (ft) 122 168 42Link Distance (ft) 351Upstream Blk Time (%) 0Queuing Penalty (veh) 0Storage Bay Dist (ft) 90 90Storage Blk Time (%) 15 0 0Queuing Penalty (veh) 16 0 0
Appendix Memorandum: Task 3.2 MMA Additional Needed Infrastructure Page A-53
Queuing and Blocking Report2010 Baseline 9/9/2015
CRC MMA Queuing Analysis SimTraffic ReportPage 33
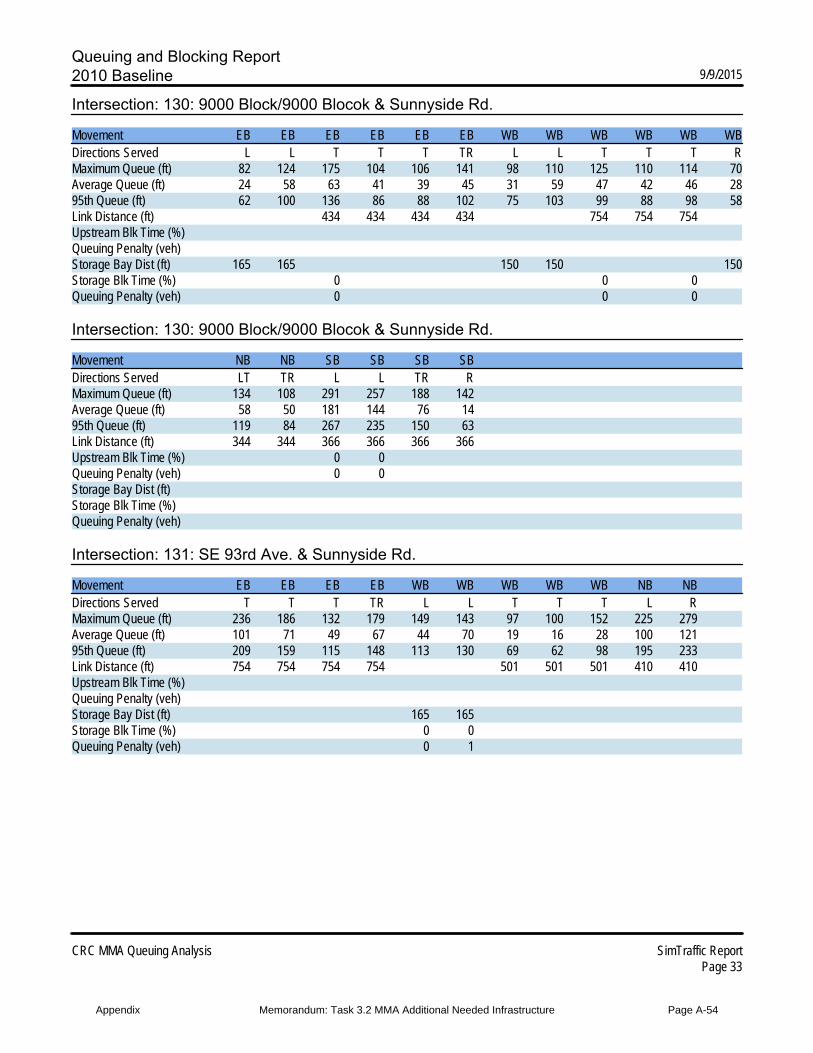
Intersection: 130: 9000 Block/9000 Blocok & Sunnyside Rd.
Movement EB EB EB EB EB EB WB WB WB WB WB WBDirections Served L L T T T TR L L T T T RMaximum Queue (ft) 82 124 175 104 106 141 98 110 125 110 114 70Average Queue (ft) 24 58 63 41 39 45 31 59 47 42 46 2895th Queue (ft) 62 100 136 86 88 102 75 103 99 88 98 58Link Distance (ft) 434 434 434 434 754 754 754Upstream Blk Time (%)Queuing Penalty (veh)Storage Bay Dist (ft) 165 165 150 150 150Storage Blk Time (%) 0 0 0Queuing Penalty (veh) 0 0 0
Intersection: 130: 9000 Block/9000 Blocok & Sunnyside Rd.
Movement NB NB SB SB SB SBDirections Served LT TR L L TR RMaximum Queue (ft) 134 108 291 257 188 142Average Queue (ft) 58 50 181 144 76 1495th Queue (ft) 119 84 267 235 150 63Link Distance (ft) 344 344 366 366 366 366Upstream Blk Time (%) 0 0Queuing Penalty (veh) 0 0Storage Bay Dist (ft)Storage Blk Time (%)Queuing Penalty (veh)
Intersection: 131: SE 93rd Ave. & Sunnyside Rd.
Movement EB EB EB EB WB WB WB WB WB NB NBDirections Served T T T TR L L T T T L RMaximum Queue (ft) 236 186 132 179 149 143 97 100 152 225 279Average Queue (ft) 101 71 49 67 44 70 19 16 28 100 12195th Queue (ft) 209 159 115 148 113 130 69 62 98 195 233Link Distance (ft) 754 754 754 754 501 501 501 410 410Upstream Blk Time (%)Queuing Penalty (veh)Storage Bay Dist (ft) 165 165Storage Blk Time (%) 0 0Queuing Penalty (veh) 0 1
Appendix Memorandum: Task 3.2 MMA Additional Needed Infrastructure Page A-54

Queuing and Blocking Report2010 Baseline 9/9/2015
CRC MMA Queuing Analysis SimTraffic ReportPage 34
Intersection: 132: I-205 SB On Ramp/205 SB Off Ramp & Sunnyside Rd.
Movement EB EB EB EB WB WB WB SB SB SB SBDirections Served T T T R L T T L LT T RMaximum Queue (ft) 285 250 200 136 205 622 618 650 1118 1120 650Average Queue (ft) 115 82 83 26 202 608 295 639 1073 1059 18695th Queue (ft) 232 179 162 99 208 619 719 696 1288 1324 589Link Distance (ft) 501 501 501 501 601 601 1091 1091Upstream Blk Time (%) 46 10 69 46Queuing Penalty (veh) 275 59 0 0Storage Bay Dist (ft) 180 450 450Storage Blk Time (%) 82 0 90 89 5Queuing Penalty (veh) 324 0 415 292 17
Intersection: 133: I-205 NB off ramp/I-205 NB on ramp & Sunnyside Rd.
Movement EB EB EB EB WB WB WB B64 B64 B64 NB NBDirections Served L L T T T T R T T T L LTMaximum Queue (ft) 162 174 465 370 342 324 219 488 490 489 164 130Average Queue (ft) 141 150 140 55 317 219 39 439 386 168 76 6195th Queue (ft) 184 195 385 204 341 405 148 594 646 527 146 113Link Distance (ft) 601 601 251 251 251 454 454 454 1290Upstream Blk Time (%) 0 87 27 1 56 24 8Queuing Penalty (veh) 1 429 134 5 274 118 39Storage Bay Dist (ft) 150 150 295Storage Blk Time (%) 11 23 0Queuing Penalty (veh) 85 174 0
Intersection: 133: I-205 NB off ramp/I-205 NB on ramp & Sunnyside Rd.
Movement NBDirections Served RMaximum Queue (ft) 316Average Queue (ft) 15895th Queue (ft) 275Link Distance (ft) 1290Upstream Blk Time (%)Queuing Penalty (veh)Storage Bay Dist (ft)Storage Blk Time (%)Queuing Penalty (veh)
Appendix Memorandum: Task 3.2 MMA Additional Needed Infrastructure Page A-55
Queuing and Blocking Report2010 Baseline 9/9/2015
CRC MMA Queuing Analysis SimTraffic ReportPage 35
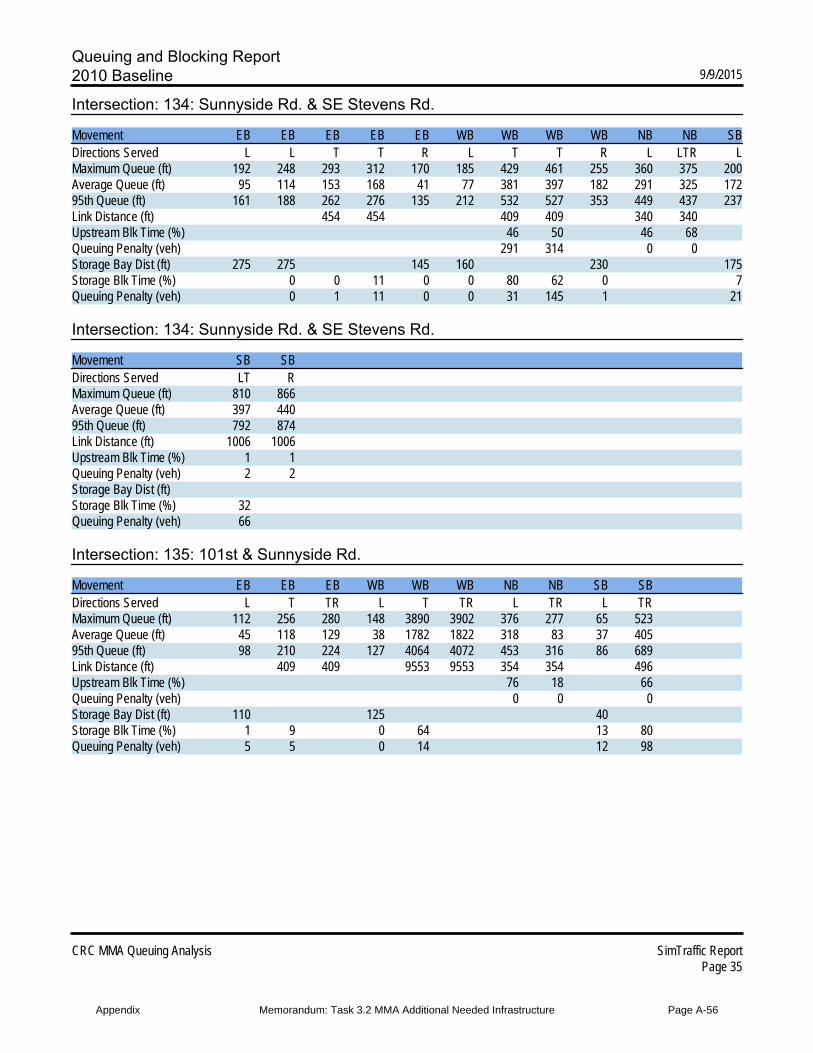
Intersection: 134: Sunnyside Rd. & SE Stevens Rd.
Movement EB EB EB EB EB WB WB WB WB NB NB SBDirections Served L L T T R L T T R L LTR LMaximum Queue (ft) 192 248 293 312 170 185 429 461 255 360 375 200Average Queue (ft) 95 114 153 168 41 77 381 397 182 291 325 17295th Queue (ft) 161 188 262 276 135 212 532 527 353 449 437 237Link Distance (ft) 454 454 409 409 340 340Upstream Blk Time (%) 46 50 46 68Queuing Penalty (veh) 291 314 0 0Storage Bay Dist (ft) 275 275 145 160 230 175Storage Blk Time (%) 0 0 11 0 0 80 62 0 7Queuing Penalty (veh) 0 1 11 0 0 31 145 1 21
Intersection: 134: Sunnyside Rd. & SE Stevens Rd.
Movement SB SBDirections Served LT RMaximum Queue (ft) 810 866Average Queue (ft) 397 44095th Queue (ft) 792 874Link Distance (ft) 1006 1006Upstream Blk Time (%) 1 1Queuing Penalty (veh) 2 2Storage Bay Dist (ft)Storage Blk Time (%) 32Queuing Penalty (veh) 66
Intersection: 135: 101st & Sunnyside Rd.
Movement EB EB EB WB WB WB NB NB SB SBDirections Served L T TR L T TR L TR L TRMaximum Queue (ft) 112 256 280 148 3890 3902 376 277 65 523Average Queue (ft) 45 118 129 38 1782 1822 318 83 37 40595th Queue (ft) 98 210 224 127 4064 4072 453 316 86 689Link Distance (ft) 409 409 9553 9553 354 354 496Upstream Blk Time (%) 76 18 66Queuing Penalty (veh) 0 0 0Storage Bay Dist (ft) 110 125 40Storage Blk Time (%) 1 9 0 64 13 80Queuing Penalty (veh) 5 5 0 14 12 98
Appendix Memorandum: Task 3.2 MMA Additional Needed Infrastructure Page A-56
Queuing and Blocking Report2010 Baseline 9/9/2015
CRC MMA Queuing Analysis SimTraffic ReportPage 36
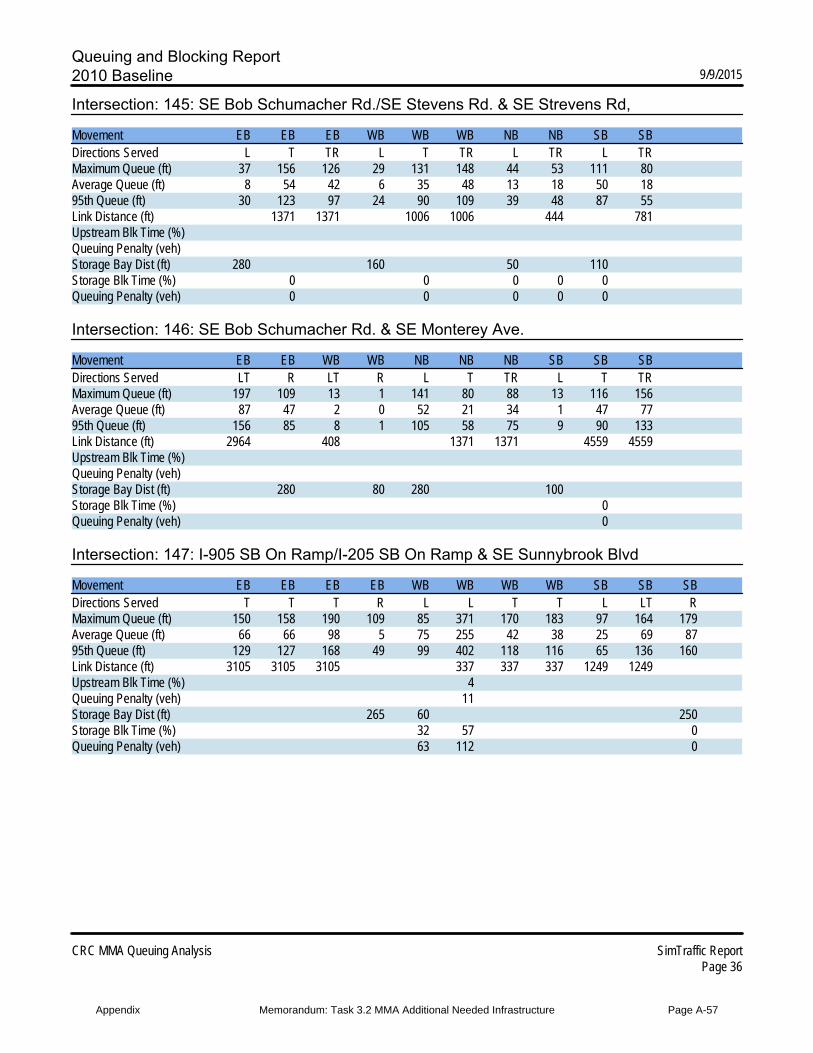
Intersection: 145: SE Bob Schumacher Rd./SE Stevens Rd. & SE Strevens Rd,
Movement EB EB EB WB WB WB NB NB SB SBDirections Served L T TR L T TR L TR L TRMaximum Queue (ft) 37 156 126 29 131 148 44 53 111 80Average Queue (ft) 8 54 42 6 35 48 13 18 50 1895th Queue (ft) 30 123 97 24 90 109 39 48 87 55Link Distance (ft) 1371 1371 1006 1006 444 781Upstream Blk Time (%)Queuing Penalty (veh)Storage Bay Dist (ft) 280 160 50 110Storage Blk Time (%) 0 0 0 0 0Queuing Penalty (veh) 0 0 0 0 0
Intersection: 146: SE Bob Schumacher Rd. & SE Monterey Ave.
Movement EB EB WB WB NB NB NB SB SB SBDirections Served LT R LT R L T TR L T TRMaximum Queue (ft) 197 109 13 1 141 80 88 13 116 156Average Queue (ft) 87 47 2 0 52 21 34 1 47 7795th Queue (ft) 156 85 8 1 105 58 75 9 90 133Link Distance (ft) 2964 408 1371 1371 4559 4559Upstream Blk Time (%)Queuing Penalty (veh)Storage Bay Dist (ft) 280 80 280 100Storage Blk Time (%) 0Queuing Penalty (veh) 0
Intersection: 147: I-905 SB On Ramp/I-205 SB On Ramp & SE Sunnybrook Blvd
Movement EB EB EB EB WB WB WB WB SB SB SBDirections Served T T T R L L T T L LT RMaximum Queue (ft) 150 158 190 109 85 371 170 183 97 164 179Average Queue (ft) 66 66 98 5 75 255 42 38 25 69 8795th Queue (ft) 129 127 168 49 99 402 118 116 65 136 160Link Distance (ft) 3105 3105 3105 337 337 337 1249 1249Upstream Blk Time (%) 4Queuing Penalty (veh) 11Storage Bay Dist (ft) 265 60 250Storage Blk Time (%) 32 57 0Queuing Penalty (veh) 63 112 0
Appendix Memorandum: Task 3.2 MMA Additional Needed Infrastructure Page A-57
Queuing and Blocking Report2010 Baseline 9/9/2015
CRC MMA Queuing Analysis SimTraffic ReportPage 37
Intersection: 148: I-205 NB Off Ramp & SE Sunnybrook Blvd
Movement EB EB EB EB WB WB WB WB NB NB NB NBDirections Served L L T T T T T R L LT T RMaximum Queue (ft) 114 160 187 221 312 309 370 200 107 155 154 437Average Queue (ft) 55 75 86 126 183 145 141 143 37 80 76 25495th Queue (ft) 112 134 160 204 301 285 306 219 83 133 134 383Link Distance (ft) 337 337 337 333 333 333 1185 1185Upstream Blk Time (%) 1 0 2Queuing Penalty (veh) 3 1 8Storage Bay Dist (ft) 90 175 400 400Storage Blk Time (%) 2 5 0 6 1Queuing Penalty (veh) 2 5 1 16 2
Intersection: 149: SE 97th Ave. & SE Sunnybrook Blvd
Movement EB EB EB WB WB WB WB NB NB NB SB SBDirections Served T T TR L T T T L L R L TMaximum Queue (ft) 149 173 295 95 113 103 102 233 244 488 80 166Average Queue (ft) 40 86 136 25 30 27 24 118 160 118 24 6795th Queue (ft) 114 156 246 65 76 71 69 228 250 320 62 130Link Distance (ft) 333 333 333 908 908 908 851 643Upstream Blk Time (%) 0 0Queuing Penalty (veh) 0 0Storage Bay Dist (ft) 150 225 225 275Storage Blk Time (%) 0 0 1 5 0Queuing Penalty (veh) 0 0 1 6 1
Intersection: 149: SE 97th Ave. & SE Sunnybrook Blvd
Movement SBDirections Served RMaximum Queue (ft) 99Average Queue (ft) 995th Queue (ft) 68Link Distance (ft)Upstream Blk Time (%)Queuing Penalty (veh)Storage Bay Dist (ft) 275Storage Blk Time (%)Queuing Penalty (veh)
Appendix Memorandum: Task 3.2 MMA Additional Needed Infrastructure Page A-58
Queuing and Blocking Report2010 Baseline 9/9/2015
CRC MMA Queuing Analysis SimTraffic ReportPage 38
Intersection: 150: SE Johnson Creek Blvd & SE 79th Pl
Movement EB WB WBDirections Served T T TRMaximum Queue (ft) 286 72 80Average Queue (ft) 43 10 1195th Queue (ft) 222 43 50Link Distance (ft) 2884 182 182Upstream Blk Time (%)Queuing Penalty (veh)Storage Bay Dist (ft)Storage Blk Time (%) 3Queuing Penalty (veh) 0
Network SummaryNetwork wide Queuing Penalty: 9268
Appendix Memorandum: Task 3.2 MMA Additional Needed Infrastructure Page A-59
Actuated Signals, Observed Splits2010 Baseline 9/9/2015
CRC MMA Queuing Analysis SimTraffic ReportPage 39
Intersection: 22: SE 82nd Ave & SE Lindy St
Phase 1 2 4 5 6 8Movement(s) Served NBL SBT WBTL SBL NBT EBTLMaximum Green (s) 4.0 81.0 22.0 4.0 86.0 21.5Minimum Green (s) 4.0 10.0 6.0 4.0 10.0 6.0Recall None C-Max None None C-Min NoneAvg. Green (s) 9.2 163.7 23.5 5.1 175.1 22.9g/C Ratio -0.01 -0.01 -0.01 -0.01 -0.01 -0.01Cycles Skipped (%) 37 38 37 88 38 37Cycles @ Minimum (%) 0 0 0 12 0 0Cycles Maxed Out (%) 59 62 59 12 62 59Cycles with Peds (%) 0 35 7 0 8 41
Controller SummaryAverage Cycle Length (s): NANumber of Complete Cycles : 0
Intersection: 101: SE Linwood Ave./SE Flavel Dr. & SE Johnson Creek Blvd
Phase 1 2 4 5 6 8Movement(s) Served WBL EBT SBTL EBL WBT NBTLMaximum Green (s) 20.0 60.0 30.0 20.0 60.0 30.0Minimum Green (s) 4.0 8.0 5.0 4.0 8.0 5.0Recall None Min None None Min NoneAvg. Green (s) 8.2 23.7 14.1 6.2 33.1 14.1g/C Ratio -0.01 NA -0.01 -0.01 -0.01 -0.01Cycles Skipped (%) 20 0 2 94 2 2Cycles @ Minimum (%) 0 0 2 0 0 2Cycles Maxed Out (%) 0 0 3 0 0 3Cycles with Peds (%) 0 0 0 0 16 0
Controller SummaryAverage Cycle Length (s): NANumber of Complete Cycles : 0
Appendix Memorandum: Task 3.2 MMA Additional Needed Infrastructure Page A-60
Actuated Signals, Observed Splits2010 Baseline 9/9/2015
CRC MMA Queuing Analysis SimTraffic ReportPage 40
Intersection: 102: SE Bell Ave/SE Bell Ave. & SE Johnson Creek Blvd
Phase 1 2 4 5 6 8Movement(s) Served WBL EBT SBTL EBL WBT NBTLMaximum Green (s) 20.0 65.0 35.0 15.5 65.0 35.0Minimum Green (s) 4.0 8.0 4.0 4.0 8.0 4.0Recall None Min None None Min NoneAvg. Green (s) 8.9 44.1 15.2 7.0 48.1 15.2g/C Ratio -0.01 NA NA -0.01 NA NACycles Skipped (%) 20 0 0 40 0 0Cycles @ Minimum (%) 0 0 0 0 0 0Cycles Maxed Out (%) 0 9 0 0 20 0Cycles with Peds (%) 0 30 2 0 34 29
Controller SummaryAverage Cycle Length (s): NANumber of Complete Cycles : 0
Intersection: 104: SE 82nd Ave & SE Johnson Creek Blvd
Phase 1 2 3 4 5 6 7 8Movement(s) Served NBL SBT EBL WBT SBL NBT WBL EBTMaximum Green (s) 22.5 42.0 12.5 35.0 28.5 36.0 18.0 29.0Minimum Green (s) 4.0 10.0 4.0 6.0 4.0 10.0 4.0 6.0Recall None C-Max None Max None C-Max None MaxAvg. Green (s) 18.8 45.7 11.7 36.3 25.9 38.6 16.8 30.2g/C Ratio NA NA NA NA -0.01 NA NA NACycles Skipped (%) 0 0 0 0 13 0 0 0Cycles @ Minimum (%) 0 0 0 0 0 0 0 0Cycles Maxed Out (%) 39 100 58 100 69 100 63 100Cycles with Peds (%) 0 4 0 4 0 11 0 4
Controller SummaryAverage Cycle Length (s): NANumber of Complete Cycles : 0
Appendix Memorandum: Task 3.2 MMA Additional Needed Infrastructure Page A-61

Actuated Signals, Observed Splits2010 Baseline 9/9/2015
CRC MMA Queuing Analysis SimTraffic ReportPage 41
Intersection: 105: SE Fuller Rd/SE Fuller Rd` & SE Johnson Creek Blvd
Phase 2 4 6 7 8Movement(s) Served EBT SBTL WBT Ped NBRMaximum Green (s) 36.0 28.5 33.5 15.5 10.5Minimum Green (s) 8.0 4.0 8.0 4.0 4.0Recall C-Max None Max None NoneAvg. Green (s) 65.7 7.7 65.7 0.0 7.5g/C Ratio -0.01 -0.01 -0.01 -0.01 -0.01Cycles Skipped (%) 7 6 7 100 58Cycles @ Minimum (%) 0 28 0 0 9Cycles Maxed Out (%) 93 0 93 0 0Cycles with Peds (%) 9 4 2 0 0
Controller SummaryAverage Cycle Length (s): NANumber of Complete Cycles : 0
Intersection: 106: I-205 SB On Ramp/I-205 SB Off Ramp & SE Johnson Creek Blvd
Phase 1 2 4 5 6Movement(s) Served WBL EBT SBL SBR WBTMaximum Green (s) 18.0 41.5 27.0 26.0 32.5Minimum Green (s) 4.0 10.0 6.0 6.0 10.0Recall None C-Max None None C-MaxAvg. Green (s) 10.9 60.0 16.7 26.6 43.4g/C Ratio -0.01 NA NA NA NACycles Skipped (%) 19 0 0 0 0Cycles @ Minimum (%) 0 0 0 0 0Cycles Maxed Out (%) 0 100 3 100 100Cycles with Peds (%) 0 0 0 0 0
Controller SummaryAverage Cycle Length (s): NANumber of Complete Cycles : 0
Appendix Memorandum: Task 3.2 MMA Additional Needed Infrastructure Page A-62
Actuated Signals, Observed Splits2010 Baseline 9/9/2015
CRC MMA Queuing Analysis SimTraffic ReportPage 42
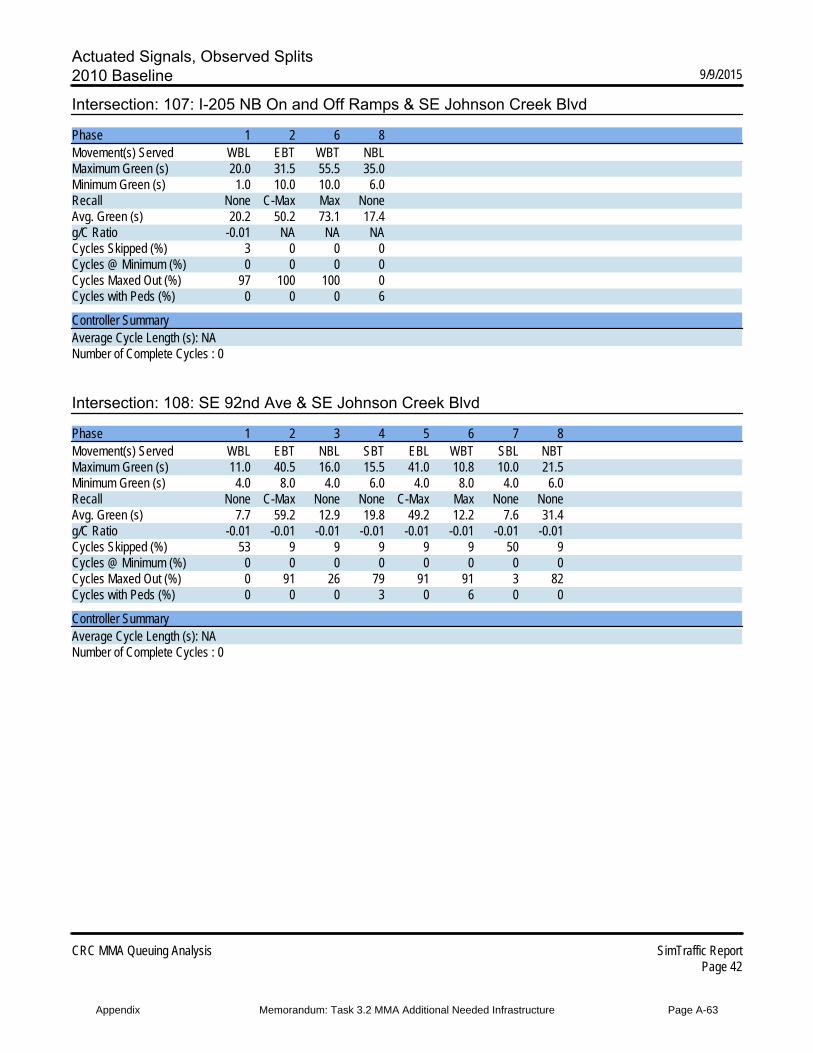
Intersection: 107: I-205 NB On and Off Ramps & SE Johnson Creek Blvd
Phase 1 2 6 8Movement(s) Served WBL EBT WBT NBLMaximum Green (s) 20.0 31.5 55.5 35.0Minimum Green (s) 1.0 10.0 10.0 6.0Recall None C-Max Max NoneAvg. Green (s) 20.2 50.2 73.1 17.4g/C Ratio -0.01 NA NA NACycles Skipped (%) 3 0 0 0Cycles @ Minimum (%) 0 0 0 0Cycles Maxed Out (%) 97 100 100 0Cycles with Peds (%) 0 0 0 6
Controller SummaryAverage Cycle Length (s): NANumber of Complete Cycles : 0
Intersection: 108: SE 92nd Ave & SE Johnson Creek Blvd
Phase 1 2 3 4 5 6 7 8Movement(s) Served WBL EBT NBL SBT EBL WBT SBL NBTMaximum Green (s) 11.0 40.5 16.0 15.5 41.0 10.8 10.0 21.5Minimum Green (s) 4.0 8.0 4.0 6.0 4.0 8.0 4.0 6.0Recall None C-Max None None C-Max Max None NoneAvg. Green (s) 7.7 59.2 12.9 19.8 49.2 12.2 7.6 31.4g/C Ratio -0.01 -0.01 -0.01 -0.01 -0.01 -0.01 -0.01 -0.01Cycles Skipped (%) 53 9 9 9 9 9 50 9Cycles @ Minimum (%) 0 0 0 0 0 0 0 0Cycles Maxed Out (%) 0 91 26 79 91 91 3 82Cycles with Peds (%) 0 0 0 3 0 6 0 0
Controller SummaryAverage Cycle Length (s): NANumber of Complete Cycles : 0
Appendix Memorandum: Task 3.2 MMA Additional Needed Infrastructure Page A-63
Actuated Signals, Observed Splits2010 Baseline 9/9/2015
CRC MMA Queuing Analysis SimTraffic ReportPage 43
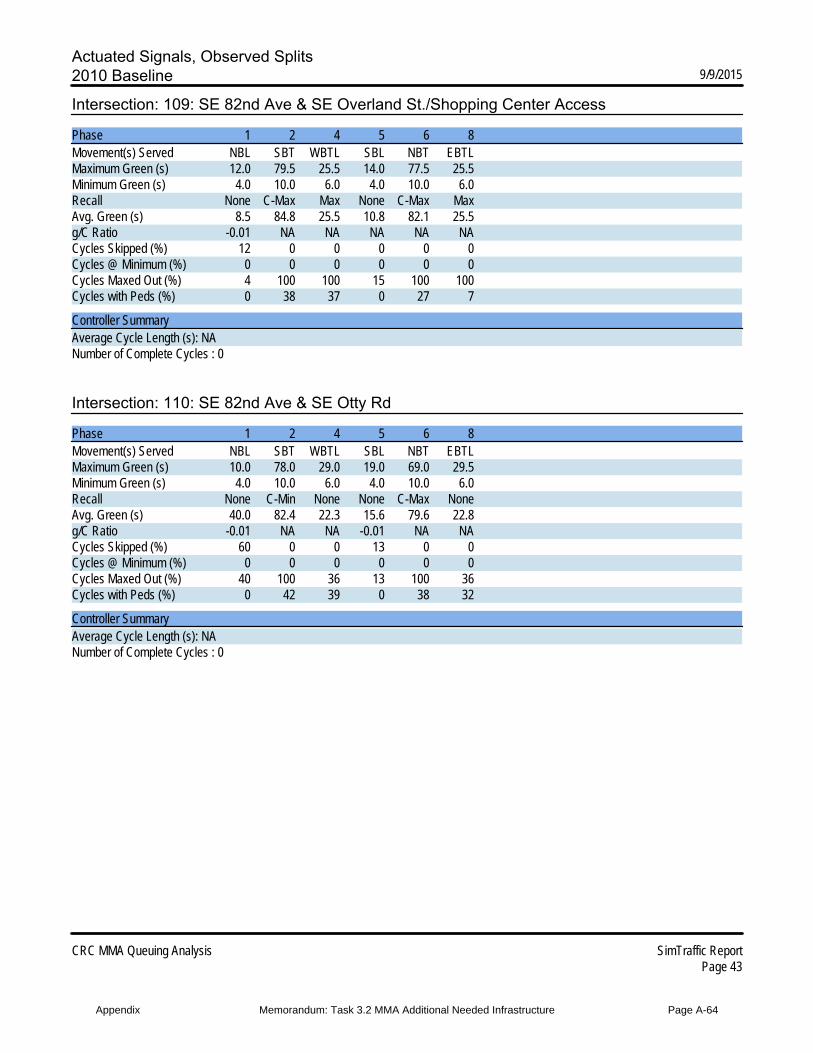
Intersection: 109: SE 82nd Ave & SE Overland St./Shopping Center Access
Phase 1 2 4 5 6 8Movement(s) Served NBL SBT WBTL SBL NBT EBTLMaximum Green (s) 12.0 79.5 25.5 14.0 77.5 25.5Minimum Green (s) 4.0 10.0 6.0 4.0 10.0 6.0Recall None C-Max Max None C-Max MaxAvg. Green (s) 8.5 84.8 25.5 10.8 82.1 25.5g/C Ratio -0.01 NA NA NA NA NACycles Skipped (%) 12 0 0 0 0 0Cycles @ Minimum (%) 0 0 0 0 0 0Cycles Maxed Out (%) 4 100 100 15 100 100Cycles with Peds (%) 0 38 37 0 27 7
Controller SummaryAverage Cycle Length (s): NANumber of Complete Cycles : 0
Intersection: 110: SE 82nd Ave & SE Otty Rd
Phase 1 2 4 5 6 8Movement(s) Served NBL SBT WBTL SBL NBT EBTLMaximum Green (s) 10.0 78.0 29.0 19.0 69.0 29.5Minimum Green (s) 4.0 10.0 6.0 4.0 10.0 6.0Recall None C-Min None None C-Max NoneAvg. Green (s) 40.0 82.4 22.3 15.6 79.6 22.8g/C Ratio -0.01 NA NA -0.01 NA NACycles Skipped (%) 60 0 0 13 0 0Cycles @ Minimum (%) 0 0 0 0 0 0Cycles Maxed Out (%) 40 100 36 13 100 36Cycles with Peds (%) 0 42 39 0 38 32
Controller SummaryAverage Cycle Length (s): NANumber of Complete Cycles : 0
Appendix Memorandum: Task 3.2 MMA Additional Needed Infrastructure Page A-64

Actuated Signals, Observed Splits2010 Baseline 9/9/2015
CRC MMA Queuing Analysis SimTraffic ReportPage 44
Intersection: 111: Access/SE Fuller Rd & SE Otty Rd
Phase 2 4 6 8Movement(s) Served SBTL WBTL NBTL EBTLMaximum Green (s) 30.0 20.0 30.0 20.0Minimum Green (s) 6.0 4.0 6.0 4.0Recall Min None Min NoneAvg. Green (s) 10.6 8.4 10.6 9.3g/C Ratio NA -0.01 NA -0.01Cycles Skipped (%) 0 43 0 40Cycles @ Minimum (%) 27 7 27 7Cycles Maxed Out (%) 1 1 1 1Cycles with Peds (%) 2 0 11 8
Controller SummaryAverage Cycle Length (s): NANumber of Complete Cycles : 0
Intersection: 112: SE Bob Schumacher Rd./SE 92nd Ave & SE Otty Rd
Phase 1 2 3 4 5 6 7 8Movement(s) Served NBL SBT EBL WBT SBL NBT WBL EBTMaximum Green (s) 20.0 40.0 20.0 40.0 20.0 40.0 20.0 40.0Minimum Green (s) 4.0 6.0 4.0 6.0 4.0 6.0 4.0 6.0Recall None Min None None None Min None NoneAvg. Green (s) 8.4 28.1 9.4 12.8 9.5 25.5 7.6 13.5g/C Ratio -0.01 NA -0.01 -0.01 -0.01 NA -0.01 -0.01Cycles Skipped (%) 20 0 35 30 9 0 51 11Cycles @ Minimum (%) 0 0 0 0 0 0 0 2Cycles Maxed Out (%) 0 17 6 0 0 7 2 0Cycles with Peds (%) 0 0 0 0 0 2 0 2
Controller SummaryAverage Cycle Length (s): NANumber of Complete Cycles : 0
Appendix Memorandum: Task 3.2 MMA Additional Needed Infrastructure Page A-65
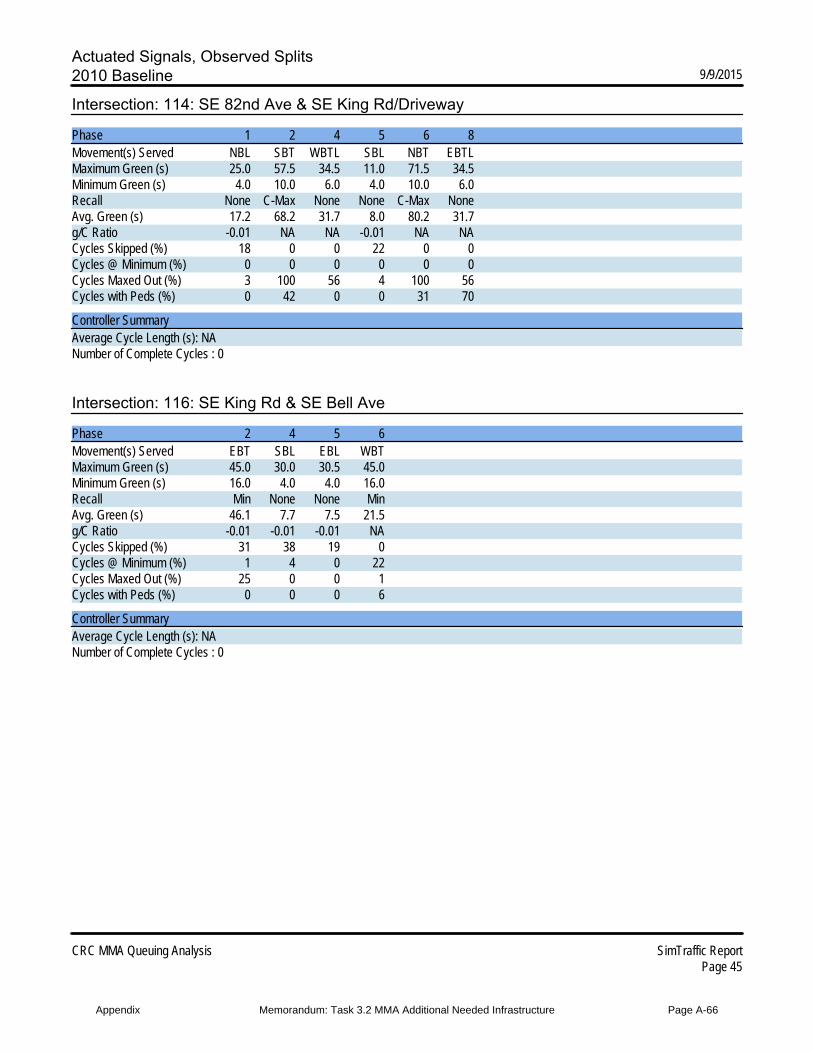
Actuated Signals, Observed Splits2010 Baseline 9/9/2015
CRC MMA Queuing Analysis SimTraffic ReportPage 45
Intersection: 114: SE 82nd Ave & SE King Rd/Driveway
Phase 1 2 4 5 6 8Movement(s) Served NBL SBT WBTL SBL NBT EBTLMaximum Green (s) 25.0 57.5 34.5 11.0 71.5 34.5Minimum Green (s) 4.0 10.0 6.0 4.0 10.0 6.0Recall None C-Max None None C-Max NoneAvg. Green (s) 17.2 68.2 31.7 8.0 80.2 31.7g/C Ratio -0.01 NA NA -0.01 NA NACycles Skipped (%) 18 0 0 22 0 0Cycles @ Minimum (%) 0 0 0 0 0 0Cycles Maxed Out (%) 3 100 56 4 100 56Cycles with Peds (%) 0 42 0 0 31 70
Controller SummaryAverage Cycle Length (s): NANumber of Complete Cycles : 0
Intersection: 116: SE King Rd & SE Bell Ave
Phase 2 4 5 6Movement(s) Served EBT SBL EBL WBTMaximum Green (s) 45.0 30.0 30.5 45.0Minimum Green (s) 16.0 4.0 4.0 16.0Recall Min None None MinAvg. Green (s) 46.1 7.7 7.5 21.5g/C Ratio -0.01 -0.01 -0.01 NACycles Skipped (%) 31 38 19 0Cycles @ Minimum (%) 1 4 0 22Cycles Maxed Out (%) 25 0 0 1Cycles with Peds (%) 0 0 0 6
Controller SummaryAverage Cycle Length (s): NANumber of Complete Cycles : 0
Appendix Memorandum: Task 3.2 MMA Additional Needed Infrastructure Page A-66
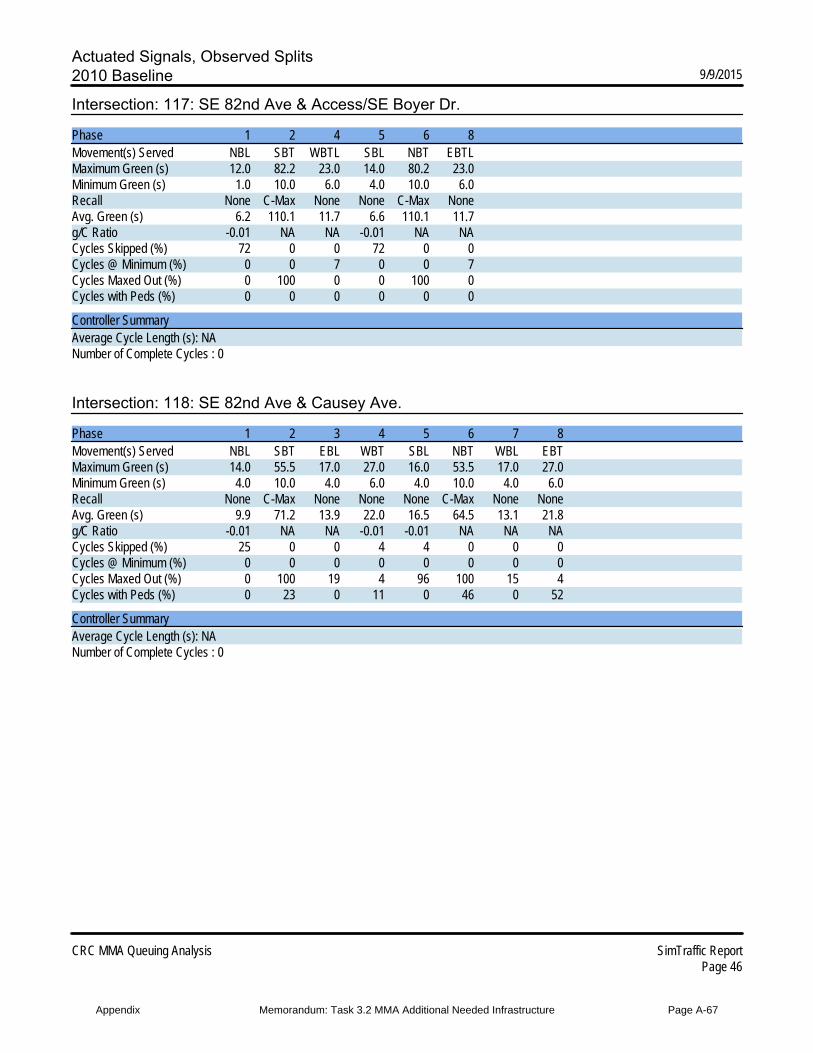
Actuated Signals, Observed Splits2010 Baseline 9/9/2015
CRC MMA Queuing Analysis SimTraffic ReportPage 46
Intersection: 117: SE 82nd Ave & Access/SE Boyer Dr.
Phase 1 2 4 5 6 8Movement(s) Served NBL SBT WBTL SBL NBT EBTLMaximum Green (s) 12.0 82.2 23.0 14.0 80.2 23.0Minimum Green (s) 1.0 10.0 6.0 4.0 10.0 6.0Recall None C-Max None None C-Max NoneAvg. Green (s) 6.2 110.1 11.7 6.6 110.1 11.7g/C Ratio -0.01 NA NA -0.01 NA NACycles Skipped (%) 72 0 0 72 0 0Cycles @ Minimum (%) 0 0 7 0 0 7Cycles Maxed Out (%) 0 100 0 0 100 0Cycles with Peds (%) 0 0 0 0 0 0
Controller SummaryAverage Cycle Length (s): NANumber of Complete Cycles : 0
Intersection: 118: SE 82nd Ave & Causey Ave.
Phase 1 2 3 4 5 6 7 8Movement(s) Served NBL SBT EBL WBT SBL NBT WBL EBTMaximum Green (s) 14.0 55.5 17.0 27.0 16.0 53.5 17.0 27.0Minimum Green (s) 4.0 10.0 4.0 6.0 4.0 10.0 4.0 6.0Recall None C-Max None None None C-Max None NoneAvg. Green (s) 9.9 71.2 13.9 22.0 16.5 64.5 13.1 21.8g/C Ratio -0.01 NA NA -0.01 -0.01 NA NA NACycles Skipped (%) 25 0 0 4 4 0 0 0Cycles @ Minimum (%) 0 0 0 0 0 0 0 0Cycles Maxed Out (%) 0 100 19 4 96 100 15 4Cycles with Peds (%) 0 23 0 11 0 46 0 52
Controller SummaryAverage Cycle Length (s): NANumber of Complete Cycles : 0
Appendix Memorandum: Task 3.2 MMA Additional Needed Infrastructure Page A-67
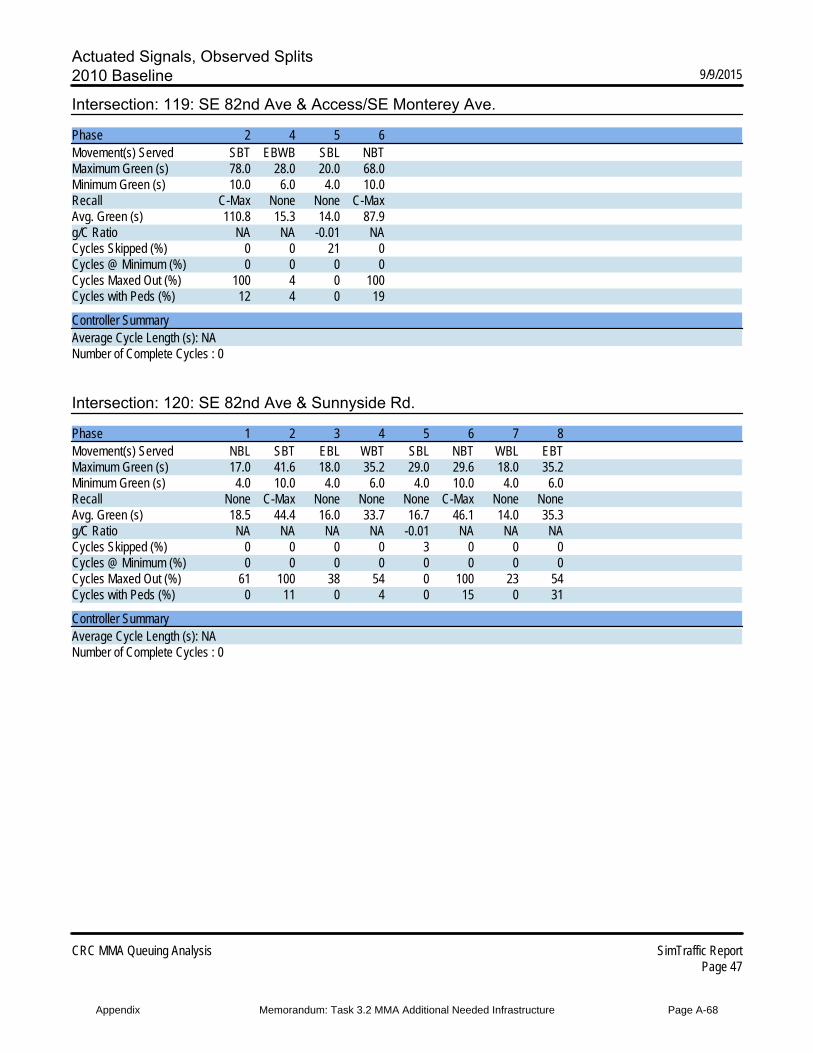
Actuated Signals, Observed Splits2010 Baseline 9/9/2015
CRC MMA Queuing Analysis SimTraffic ReportPage 47
Intersection: 119: SE 82nd Ave & Access/SE Monterey Ave.
Phase 2 4 5 6Movement(s) Served SBT EBWB SBL NBTMaximum Green (s) 78.0 28.0 20.0 68.0Minimum Green (s) 10.0 6.0 4.0 10.0Recall C-Max None None C-MaxAvg. Green (s) 110.8 15.3 14.0 87.9g/C Ratio NA NA -0.01 NACycles Skipped (%) 0 0 21 0Cycles @ Minimum (%) 0 0 0 0Cycles Maxed Out (%) 100 4 0 100Cycles with Peds (%) 12 4 0 19
Controller SummaryAverage Cycle Length (s): NANumber of Complete Cycles : 0
Intersection: 120: SE 82nd Ave & Sunnyside Rd.
Phase 1 2 3 4 5 6 7 8Movement(s) Served NBL SBT EBL WBT SBL NBT WBL EBTMaximum Green (s) 17.0 41.6 18.0 35.2 29.0 29.6 18.0 35.2Minimum Green (s) 4.0 10.0 4.0 6.0 4.0 10.0 4.0 6.0Recall None C-Max None None None C-Max None NoneAvg. Green (s) 18.5 44.4 16.0 33.7 16.7 46.1 14.0 35.3g/C Ratio NA NA NA NA -0.01 NA NA NACycles Skipped (%) 0 0 0 0 3 0 0 0Cycles @ Minimum (%) 0 0 0 0 0 0 0 0Cycles Maxed Out (%) 61 100 38 54 0 100 23 54Cycles with Peds (%) 0 11 0 4 0 15 0 31
Controller SummaryAverage Cycle Length (s): NANumber of Complete Cycles : 0
Appendix Memorandum: Task 3.2 MMA Additional Needed Infrastructure Page A-68
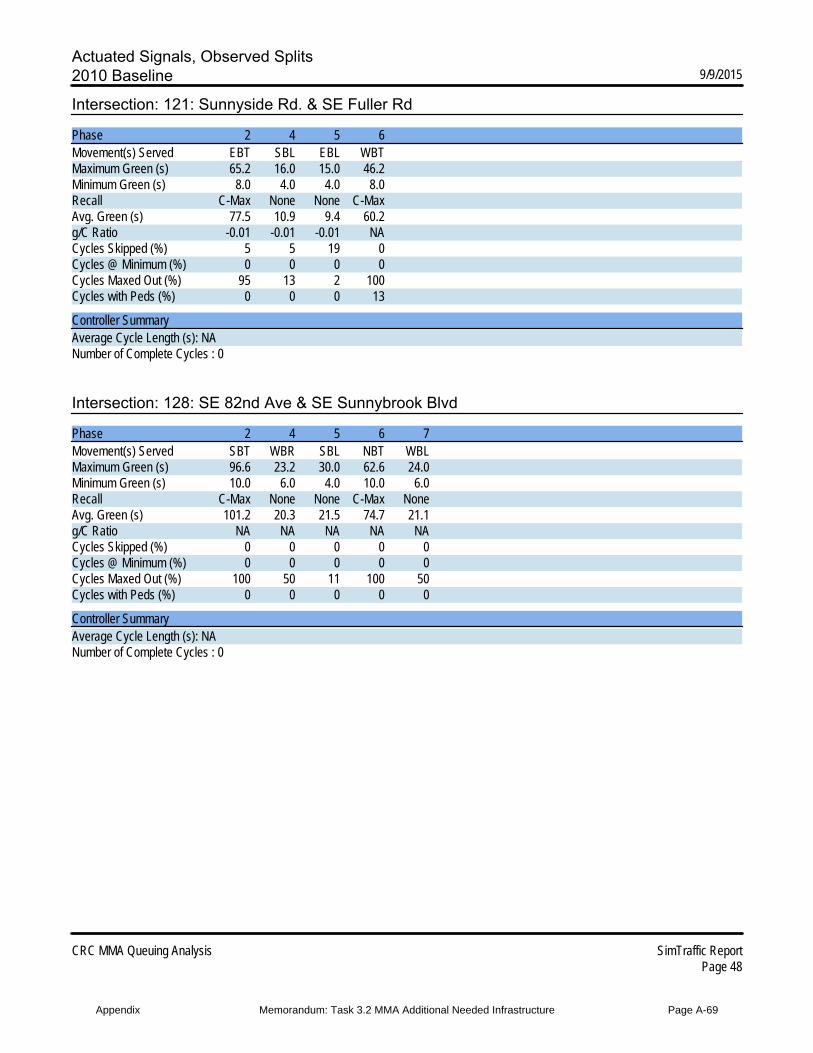
Actuated Signals, Observed Splits2010 Baseline 9/9/2015
CRC MMA Queuing Analysis SimTraffic ReportPage 48
Intersection: 121: Sunnyside Rd. & SE Fuller Rd
Phase 2 4 5 6Movement(s) Served EBT SBL EBL WBTMaximum Green (s) 65.2 16.0 15.0 46.2Minimum Green (s) 8.0 4.0 4.0 8.0Recall C-Max None None C-MaxAvg. Green (s) 77.5 10.9 9.4 60.2g/C Ratio -0.01 -0.01 -0.01 NACycles Skipped (%) 5 5 19 0Cycles @ Minimum (%) 0 0 0 0Cycles Maxed Out (%) 95 13 2 100Cycles with Peds (%) 0 0 0 13
Controller SummaryAverage Cycle Length (s): NANumber of Complete Cycles : 0
Intersection: 128: SE 82nd Ave & SE Sunnybrook Blvd
Phase 2 4 5 6 7Movement(s) Served SBT WBR SBL NBT WBLMaximum Green (s) 96.6 23.2 30.0 62.6 24.0Minimum Green (s) 10.0 6.0 4.0 10.0 6.0Recall C-Max None None C-Max NoneAvg. Green (s) 101.2 20.3 21.5 74.7 21.1g/C Ratio NA NA NA NA NACycles Skipped (%) 0 0 0 0 0Cycles @ Minimum (%) 0 0 0 0 0Cycles Maxed Out (%) 100 50 11 100 50Cycles with Peds (%) 0 0 0 0 0
Controller SummaryAverage Cycle Length (s): NANumber of Complete Cycles : 0
Appendix Memorandum: Task 3.2 MMA Additional Needed Infrastructure Page A-69
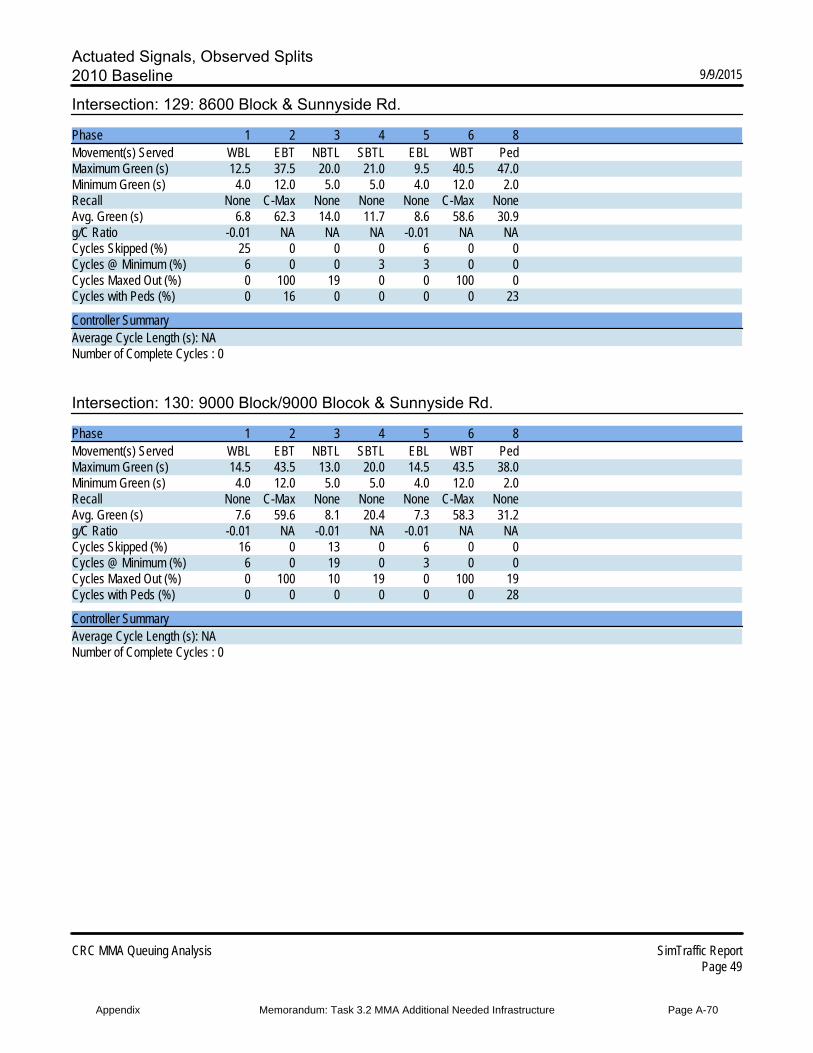
Actuated Signals, Observed Splits2010 Baseline 9/9/2015
CRC MMA Queuing Analysis SimTraffic ReportPage 49
Intersection: 129: 8600 Block & Sunnyside Rd.
Phase 1 2 3 4 5 6 8Movement(s) Served WBL EBT NBTL SBTL EBL WBT PedMaximum Green (s) 12.5 37.5 20.0 21.0 9.5 40.5 47.0Minimum Green (s) 4.0 12.0 5.0 5.0 4.0 12.0 2.0Recall None C-Max None None None C-Max NoneAvg. Green (s) 6.8 62.3 14.0 11.7 8.6 58.6 30.9g/C Ratio -0.01 NA NA NA -0.01 NA NACycles Skipped (%) 25 0 0 0 6 0 0Cycles @ Minimum (%) 6 0 0 3 3 0 0Cycles Maxed Out (%) 0 100 19 0 0 100 0Cycles with Peds (%) 0 16 0 0 0 0 23
Controller SummaryAverage Cycle Length (s): NANumber of Complete Cycles : 0
Intersection: 130: 9000 Block/9000 Blocok & Sunnyside Rd.
Phase 1 2 3 4 5 6 8Movement(s) Served WBL EBT NBTL SBTL EBL WBT PedMaximum Green (s) 14.5 43.5 13.0 20.0 14.5 43.5 38.0Minimum Green (s) 4.0 12.0 5.0 5.0 4.0 12.0 2.0Recall None C-Max None None None C-Max NoneAvg. Green (s) 7.6 59.6 8.1 20.4 7.3 58.3 31.2g/C Ratio -0.01 NA -0.01 NA -0.01 NA NACycles Skipped (%) 16 0 13 0 6 0 0Cycles @ Minimum (%) 6 0 19 0 3 0 0Cycles Maxed Out (%) 0 100 10 19 0 100 19Cycles with Peds (%) 0 0 0 0 0 0 28
Controller SummaryAverage Cycle Length (s): NANumber of Complete Cycles : 0
Appendix Memorandum: Task 3.2 MMA Additional Needed Infrastructure Page A-70
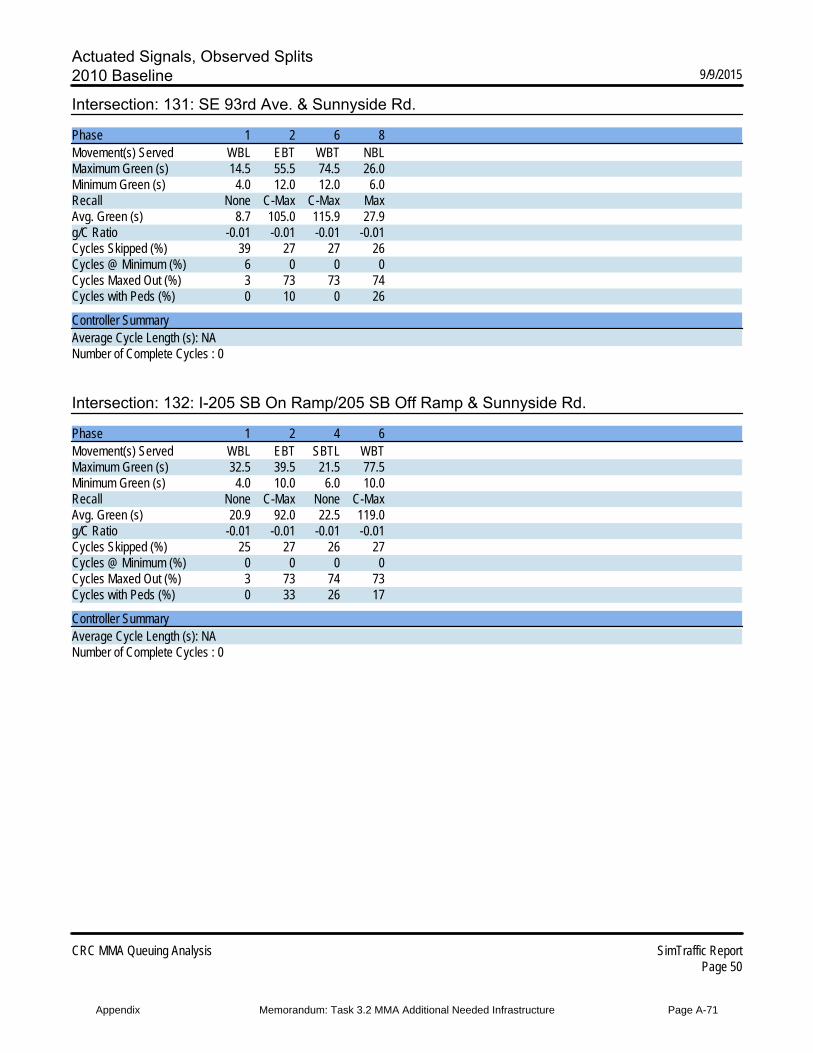
Actuated Signals, Observed Splits2010 Baseline 9/9/2015
CRC MMA Queuing Analysis SimTraffic ReportPage 50
Intersection: 131: SE 93rd Ave. & Sunnyside Rd.
Phase 1 2 6 8Movement(s) Served WBL EBT WBT NBLMaximum Green (s) 14.5 55.5 74.5 26.0Minimum Green (s) 4.0 12.0 12.0 6.0Recall None C-Max C-Max MaxAvg. Green (s) 8.7 105.0 115.9 27.9g/C Ratio -0.01 -0.01 -0.01 -0.01Cycles Skipped (%) 39 27 27 26Cycles @ Minimum (%) 6 0 0 0Cycles Maxed Out (%) 3 73 73 74Cycles with Peds (%) 0 10 0 26
Controller SummaryAverage Cycle Length (s): NANumber of Complete Cycles : 0
Intersection: 132: I-205 SB On Ramp/205 SB Off Ramp & Sunnyside Rd.
Phase 1 2 4 6Movement(s) Served WBL EBT SBTL WBTMaximum Green (s) 32.5 39.5 21.5 77.5Minimum Green (s) 4.0 10.0 6.0 10.0Recall None C-Max None C-MaxAvg. Green (s) 20.9 92.0 22.5 119.0g/C Ratio -0.01 -0.01 -0.01 -0.01Cycles Skipped (%) 25 27 26 27Cycles @ Minimum (%) 0 0 0 0Cycles Maxed Out (%) 3 73 74 73Cycles with Peds (%) 0 33 26 17
Controller SummaryAverage Cycle Length (s): NANumber of Complete Cycles : 0
Appendix Memorandum: Task 3.2 MMA Additional Needed Infrastructure Page A-71
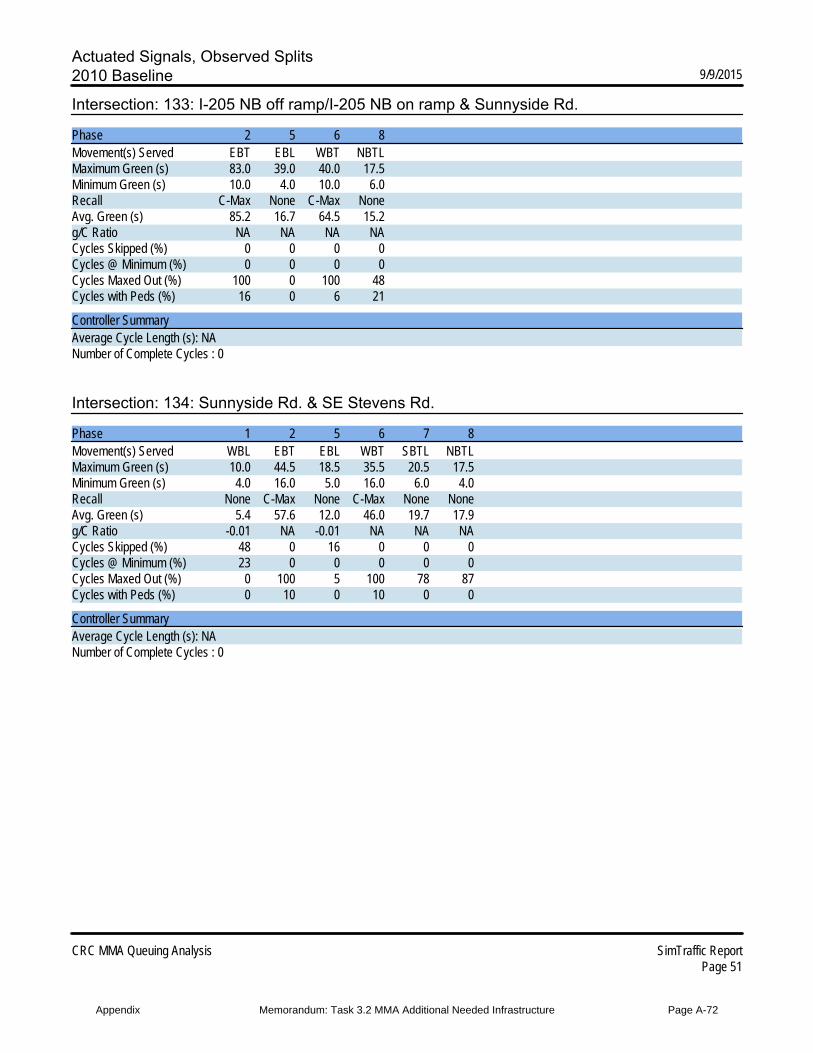
Actuated Signals, Observed Splits2010 Baseline 9/9/2015
CRC MMA Queuing Analysis SimTraffic ReportPage 51
Intersection: 133: I-205 NB off ramp/I-205 NB on ramp & Sunnyside Rd.
Phase 2 5 6 8Movement(s) Served EBT EBL WBT NBTLMaximum Green (s) 83.0 39.0 40.0 17.5Minimum Green (s) 10.0 4.0 10.0 6.0Recall C-Max None C-Max NoneAvg. Green (s) 85.2 16.7 64.5 15.2g/C Ratio NA NA NA NACycles Skipped (%) 0 0 0 0Cycles @ Minimum (%) 0 0 0 0Cycles Maxed Out (%) 100 0 100 48Cycles with Peds (%) 16 0 6 21
Controller SummaryAverage Cycle Length (s): NANumber of Complete Cycles : 0
Intersection: 134: Sunnyside Rd. & SE Stevens Rd.
Phase 1 2 5 6 7 8Movement(s) Served WBL EBT EBL WBT SBTL NBTLMaximum Green (s) 10.0 44.5 18.5 35.5 20.5 17.5Minimum Green (s) 4.0 16.0 5.0 16.0 6.0 4.0Recall None C-Max None C-Max None NoneAvg. Green (s) 5.4 57.6 12.0 46.0 19.7 17.9g/C Ratio -0.01 NA -0.01 NA NA NACycles Skipped (%) 48 0 16 0 0 0Cycles @ Minimum (%) 23 0 0 0 0 0Cycles Maxed Out (%) 0 100 5 100 78 87Cycles with Peds (%) 0 10 0 10 0 0
Controller SummaryAverage Cycle Length (s): NANumber of Complete Cycles : 0
Appendix Memorandum: Task 3.2 MMA Additional Needed Infrastructure Page A-72

Actuated Signals, Observed Splits2010 Baseline 9/9/2015
CRC MMA Queuing Analysis SimTraffic ReportPage 52
Intersection: 135: 101st & Sunnyside Rd.
Phase 1 2 4 5 6 8Movement(s) Served WBL EBT SBTL EBL WBT NBTLMaximum Green (s) 8.5 63.5 24.5 10.0 62.5 24.5Minimum Green (s) 4.0 16.0 4.0 4.0 16.0 4.0Recall None C-Max None None C-Max NoneAvg. Green (s) 5.3 73.4 23.9 6.0 69.9 23.9g/C Ratio -0.01 NA NA -0.01 NA NACycles Skipped (%) 60 0 0 26 0 0Cycles @ Minimum (%) 17 0 0 23 0 0Cycles Maxed Out (%) 0 100 91 6 100 91Cycles with Peds (%) 0 3 19 0 6 13
Controller SummaryAverage Cycle Length (s): NANumber of Complete Cycles : 0
Intersection: 145: SE Bob Schumacher Rd./SE Stevens Rd. & SE Strevens Rd,
Phase 1 2 4 5 6 8Movement(s) Served WBL EBT SBTL EBL WBT NBTLMaximum Green (s) 20.0 40.0 30.0 20.0 40.0 30.0Minimum Green (s) 4.0 6.0 5.0 4.0 6.0 5.0Recall None Min None None Min NoneAvg. Green (s) 6.4 19.4 7.1 6.0 19.1 7.1g/C Ratio -0.01 -0.01 -0.01 -0.01 -0.01 -0.01Cycles Skipped (%) 95 1 3 91 1 3Cycles @ Minimum (%) 0 2 6 0 2 6Cycles Maxed Out (%) 0 7 0 0 7 0Cycles with Peds (%) 0 0 0 0 0 0
Controller SummaryAverage Cycle Length (s): NANumber of Complete Cycles : 0
Appendix Memorandum: Task 3.2 MMA Additional Needed Infrastructure Page A-73
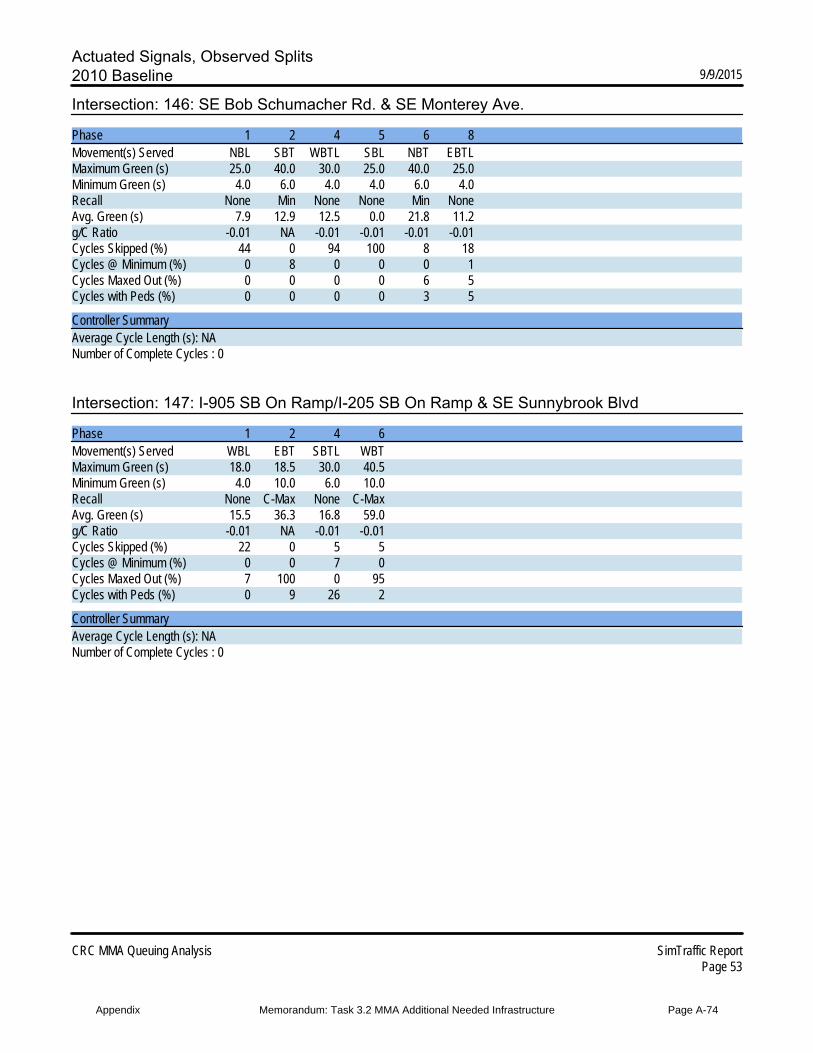
Actuated Signals, Observed Splits2010 Baseline 9/9/2015
CRC MMA Queuing Analysis SimTraffic ReportPage 53
Intersection: 146: SE Bob Schumacher Rd. & SE Monterey Ave.
Phase 1 2 4 5 6 8Movement(s) Served NBL SBT WBTL SBL NBT EBTLMaximum Green (s) 25.0 40.0 30.0 25.0 40.0 25.0Minimum Green (s) 4.0 6.0 4.0 4.0 6.0 4.0Recall None Min None None Min NoneAvg. Green (s) 7.9 12.9 12.5 0.0 21.8 11.2g/C Ratio -0.01 NA -0.01 -0.01 -0.01 -0.01Cycles Skipped (%) 44 0 94 100 8 18Cycles @ Minimum (%) 0 8 0 0 0 1Cycles Maxed Out (%) 0 0 0 0 6 5Cycles with Peds (%) 0 0 0 0 3 5
Controller SummaryAverage Cycle Length (s): NANumber of Complete Cycles : 0
Intersection: 147: I-905 SB On Ramp/I-205 SB On Ramp & SE Sunnybrook Blvd
Phase 1 2 4 6Movement(s) Served WBL EBT SBTL WBTMaximum Green (s) 18.0 18.5 30.0 40.5Minimum Green (s) 4.0 10.0 6.0 10.0Recall None C-Max None C-MaxAvg. Green (s) 15.5 36.3 16.8 59.0g/C Ratio -0.01 NA -0.01 -0.01Cycles Skipped (%) 22 0 5 5Cycles @ Minimum (%) 0 0 7 0Cycles Maxed Out (%) 7 100 0 95Cycles with Peds (%) 0 9 26 2
Controller SummaryAverage Cycle Length (s): NANumber of Complete Cycles : 0
Appendix Memorandum: Task 3.2 MMA Additional Needed Infrastructure Page A-74

Actuated Signals, Observed Splits2010 Baseline 9/9/2015
CRC MMA Queuing Analysis SimTraffic ReportPage 54
Intersection: 148: I-205 NB Off Ramp & SE Sunnybrook Blvd
Phase 2 5 6 8Movement(s) Served EBT EBL WBT NBTLMaximum Green (s) 34.5 9.0 21.5 36.0Minimum Green (s) 10.0 4.0 10.0 6.0Recall C-Max None C-Max NoneAvg. Green (s) 40.8 9.0 28.7 29.7g/C Ratio NA -0.01 NA NACycles Skipped (%) 0 19 0 0Cycles @ Minimum (%) 0 0 0 0Cycles Maxed Out (%) 100 25 100 40Cycles with Peds (%) 9 0 0 4
Controller SummaryAverage Cycle Length (s): NANumber of Complete Cycles : 0
Intersection: 149: SE 97th Ave. & SE Sunnybrook Blvd
Phase 1 2 4 6 8Movement(s) Served WBL EBT SBTL WBT NBLMaximum Green (s) 10.0 24.5 10.9 38.2 18.0Minimum Green (s) 4.0 8.0 4.0 8.0 4.0Recall None C-Max None C-Max NoneAvg. Green (s) 7.1 52.6 9.1 58.5 21.2g/C Ratio -0.01 -0.01 -0.01 -0.01 -0.01Cycles Skipped (%) 53 19 23 19 19Cycles @ Minimum (%) 0 0 0 0 0Cycles Maxed Out (%) 0 81 26 81 44Cycles with Peds (%) 0 2 0 5 21
Controller SummaryAverage Cycle Length (s): NANumber of Complete Cycles : 0
Appendix Memorandum: Task 3.2 MMA Additional Needed Infrastructure Page A-75
Simulation Report for 82nd Ave / Johnson Creek Blvd (with Project #1030)
Appendix Memorandum: Task 3.2 MMA Additional Needed Infrastructure Page A-76
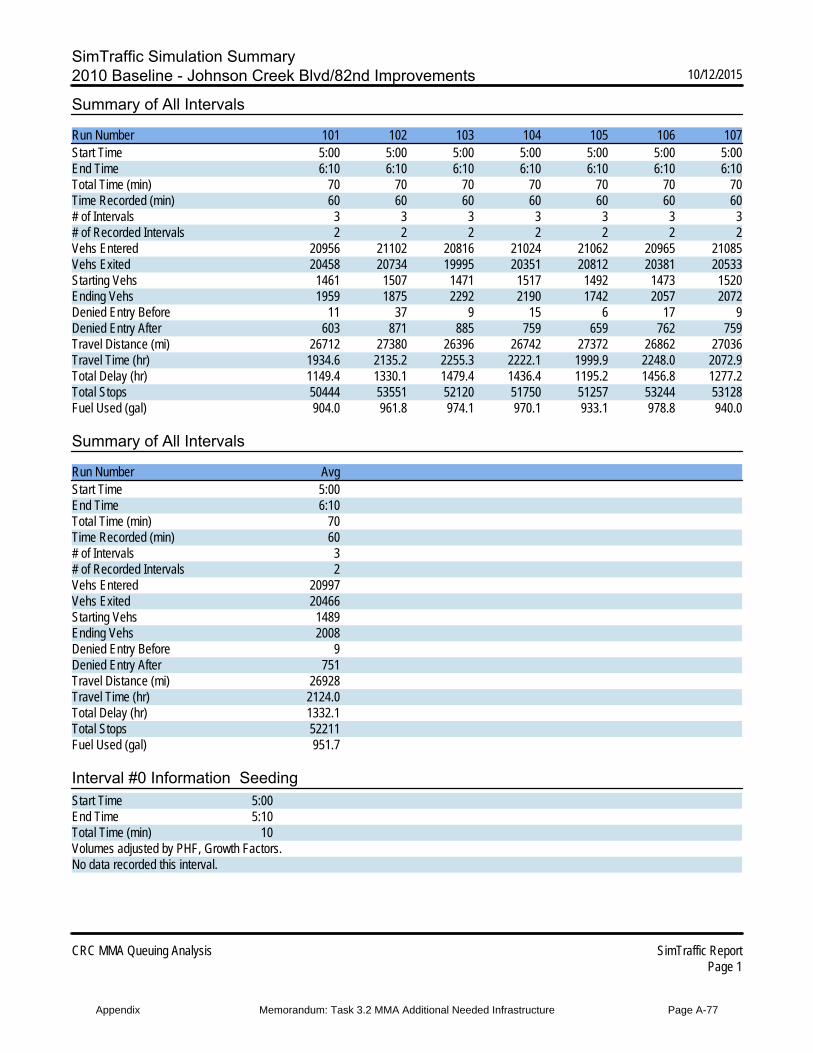
SimTraffic Simulation Summary2010 Baseline - Johnson Creek Blvd/82nd Improvements 10/12/2015
CRC MMA Queuing Analysis SimTraffic ReportPage 1
Summary of All Intervals
Run Number 101 102 103 104 105 106 107Start Time 5:00 5:00 5:00 5:00 5:00 5:00 5:00End Time 6:10 6:10 6:10 6:10 6:10 6:10 6:10Total Time (min) 70 70 70 70 70 70 70Time Recorded (min) 60 60 60 60 60 60 60# of Intervals 3 3 3 3 3 3 3# of Recorded Intervals 2 2 2 2 2 2 2Vehs Entered 20956 21102 20816 21024 21062 20965 21085Vehs Exited 20458 20734 19995 20351 20812 20381 20533Starting Vehs 1461 1507 1471 1517 1492 1473 1520Ending Vehs 1959 1875 2292 2190 1742 2057 2072Denied Entry Before 11 37 9 15 6 17 9Denied Entry After 603 871 885 759 659 762 759Travel Distance (mi) 26712 27380 26396 26742 27372 26862 27036Travel Time (hr) 1934.6 2135.2 2255.3 2222.1 1999.9 2248.0 2072.9Total Delay (hr) 1149.4 1330.1 1479.4 1436.4 1195.2 1456.8 1277.2Total Stops 50444 53551 52120 51750 51257 53244 53128Fuel Used (gal) 904.0 961.8 974.1 970.1 933.1 978.8 940.0
Summary of All Intervals
Run Number AvgStart Time 5:00End Time 6:10Total Time (min) 70Time Recorded (min) 60# of Intervals 3# of Recorded Intervals 2Vehs Entered 20997Vehs Exited 20466Starting Vehs 1489Ending Vehs 2008Denied Entry Before 9Denied Entry After 751Travel Distance (mi) 26928Travel Time (hr) 2124.0Total Delay (hr) 1332.1Total Stops 52211Fuel Used (gal) 951.7
Interval #0 Information SeedingStart Time 5:00End Time 5:10Total Time (min) 10Volumes adjusted by PHF, Growth Factors.No data recorded this interval.
Appendix Memorandum: Task 3.2 MMA Additional Needed Infrastructure Page A-77
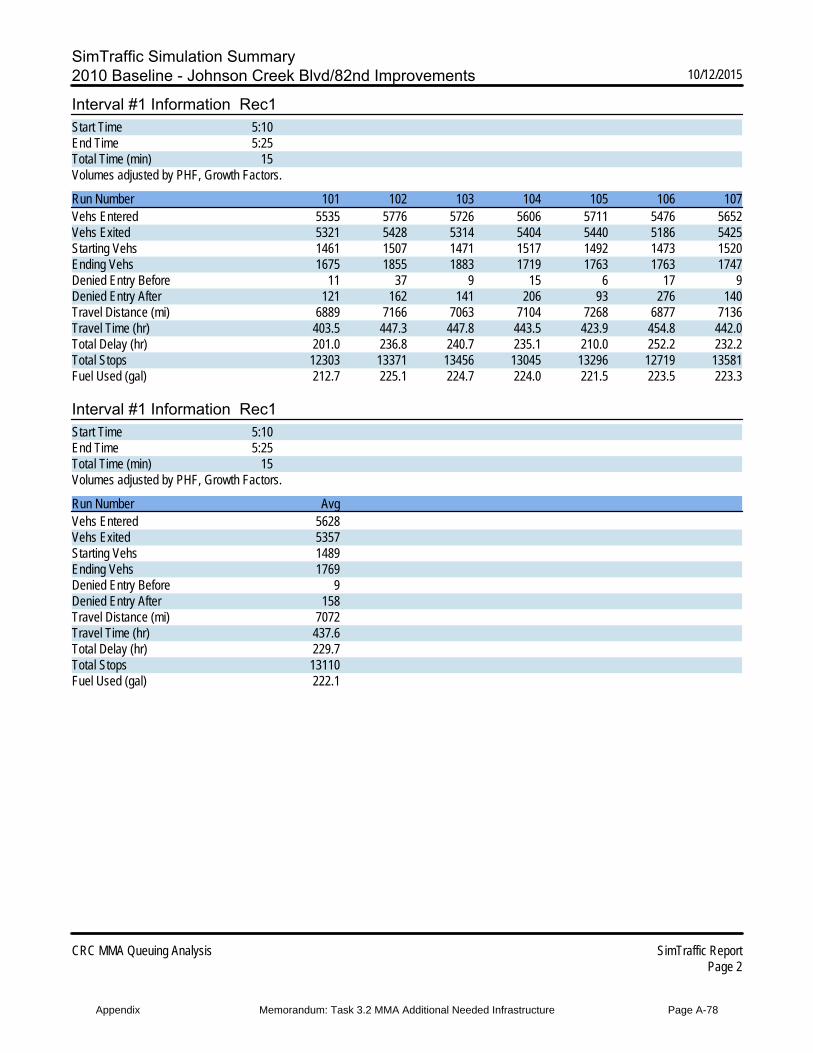
SimTraffic Simulation Summary2010 Baseline - Johnson Creek Blvd/82nd Improvements 10/12/2015
CRC MMA Queuing Analysis SimTraffic ReportPage 2
Interval #1 Information Rec1Start Time 5:10End Time 5:25Total Time (min) 15Volumes adjusted by PHF, Growth Factors.
Run Number 101 102 103 104 105 106 107Vehs Entered 5535 5776 5726 5606 5711 5476 5652Vehs Exited 5321 5428 5314 5404 5440 5186 5425Starting Vehs 1461 1507 1471 1517 1492 1473 1520Ending Vehs 1675 1855 1883 1719 1763 1763 1747Denied Entry Before 11 37 9 15 6 17 9Denied Entry After 121 162 141 206 93 276 140Travel Distance (mi) 6889 7166 7063 7104 7268 6877 7136Travel Time (hr) 403.5 447.3 447.8 443.5 423.9 454.8 442.0Total Delay (hr) 201.0 236.8 240.7 235.1 210.0 252.2 232.2Total Stops 12303 13371 13456 13045 13296 12719 13581Fuel Used (gal) 212.7 225.1 224.7 224.0 221.5 223.5 223.3
Interval #1 Information Rec1Start Time 5:10End Time 5:25Total Time (min) 15Volumes adjusted by PHF, Growth Factors.
Run Number AvgVehs Entered 5628Vehs Exited 5357Starting Vehs 1489Ending Vehs 1769Denied Entry Before 9Denied Entry After 158Travel Distance (mi) 7072Travel Time (hr) 437.6Total Delay (hr) 229.7Total Stops 13110Fuel Used (gal) 222.1
Appendix Memorandum: Task 3.2 MMA Additional Needed Infrastructure Page A-78
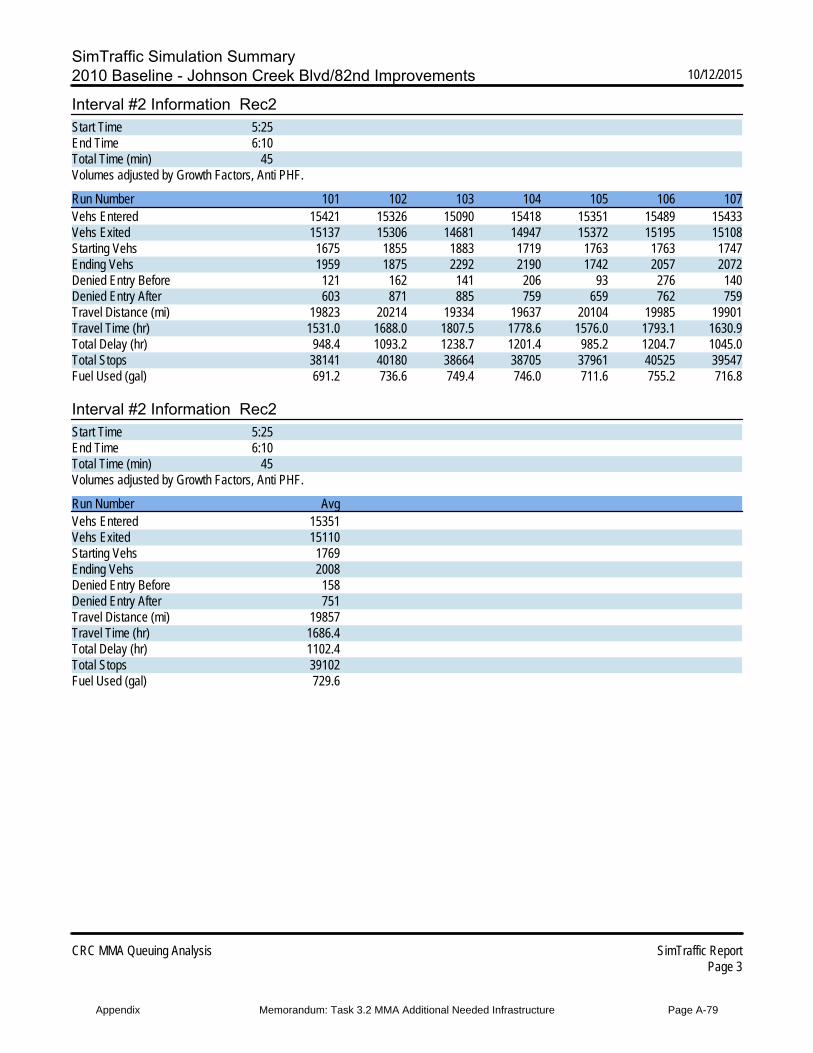
SimTraffic Simulation Summary2010 Baseline - Johnson Creek Blvd/82nd Improvements 10/12/2015
CRC MMA Queuing Analysis SimTraffic ReportPage 3
Interval #2 Information Rec2Start Time 5:25End Time 6:10Total Time (min) 45Volumes adjusted by Growth Factors, Anti PHF.
Run Number 101 102 103 104 105 106 107Vehs Entered 15421 15326 15090 15418 15351 15489 15433Vehs Exited 15137 15306 14681 14947 15372 15195 15108Starting Vehs 1675 1855 1883 1719 1763 1763 1747Ending Vehs 1959 1875 2292 2190 1742 2057 2072Denied Entry Before 121 162 141 206 93 276 140Denied Entry After 603 871 885 759 659 762 759Travel Distance (mi) 19823 20214 19334 19637 20104 19985 19901Travel Time (hr) 1531.0 1688.0 1807.5 1778.6 1576.0 1793.1 1630.9Total Delay (hr) 948.4 1093.2 1238.7 1201.4 985.2 1204.7 1045.0Total Stops 38141 40180 38664 38705 37961 40525 39547Fuel Used (gal) 691.2 736.6 749.4 746.0 711.6 755.2 716.8
Interval #2 Information Rec2Start Time 5:25End Time 6:10Total Time (min) 45Volumes adjusted by Growth Factors, Anti PHF.
Run Number AvgVehs Entered 15351Vehs Exited 15110Starting Vehs 1769Ending Vehs 2008Denied Entry Before 158Denied Entry After 751Travel Distance (mi) 19857Travel Time (hr) 1686.4Total Delay (hr) 1102.4Total Stops 39102Fuel Used (gal) 729.6
Appendix Memorandum: Task 3.2 MMA Additional Needed Infrastructure Page A-79
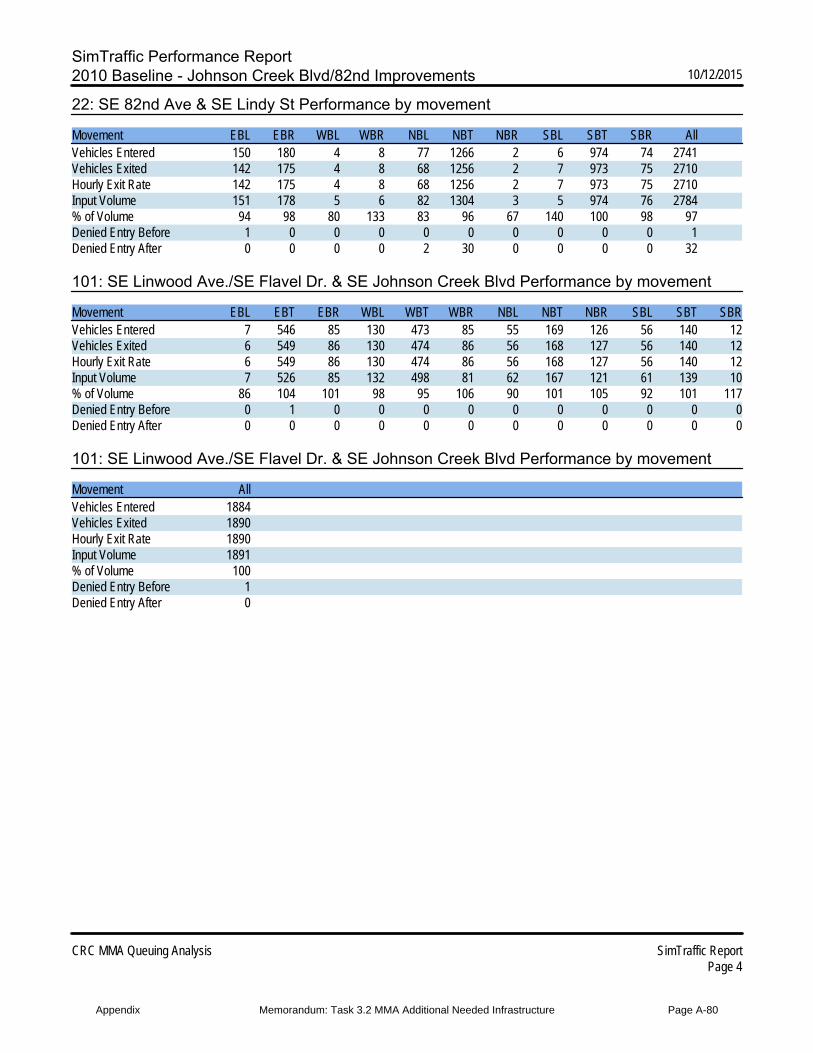
SimTraffic Performance Report2010 Baseline - Johnson Creek Blvd/82nd Improvements 10/12/2015
CRC MMA Queuing Analysis SimTraffic ReportPage 4
22: SE 82nd Ave & SE Lindy St Performance by movement
Movement EBL EBR WBL WBR NBL NBT NBR SBL SBT SBR AllVehicles Entered 150 180 4 8 77 1266 2 6 974 74 2741Vehicles Exited 142 175 4 8 68 1256 2 7 973 75 2710Hourly Exit Rate 142 175 4 8 68 1256 2 7 973 75 2710Input Volume 151 178 5 6 82 1304 3 5 974 76 2784% of Volume 94 98 80 133 83 96 67 140 100 98 97Denied Entry Before 1 0 0 0 0 0 0 0 0 0 1Denied Entry After 0 0 0 0 2 30 0 0 0 0 32
101: SE Linwood Ave./SE Flavel Dr. & SE Johnson Creek Blvd Performance by movement
Movement EBL EBT EBR WBL WBT WBR NBL NBT NBR SBL SBT SBRVehicles Entered 7 546 85 130 473 85 55 169 126 56 140 12Vehicles Exited 6 549 86 130 474 86 56 168 127 56 140 12Hourly Exit Rate 6 549 86 130 474 86 56 168 127 56 140 12Input Volume 7 526 85 132 498 81 62 167 121 61 139 10% of Volume 86 104 101 98 95 106 90 101 105 92 101 117Denied Entry Before 0 1 0 0 0 0 0 0 0 0 0 0Denied Entry After 0 0 0 0 0 0 0 0 0 0 0 0
101: SE Linwood Ave./SE Flavel Dr. & SE Johnson Creek Blvd Performance by movement
Movement AllVehicles Entered 1884Vehicles Exited 1890Hourly Exit Rate 1890Input Volume 1891% of Volume 100Denied Entry Before 1Denied Entry After 0
Appendix Memorandum: Task 3.2 MMA Additional Needed Infrastructure Page A-80
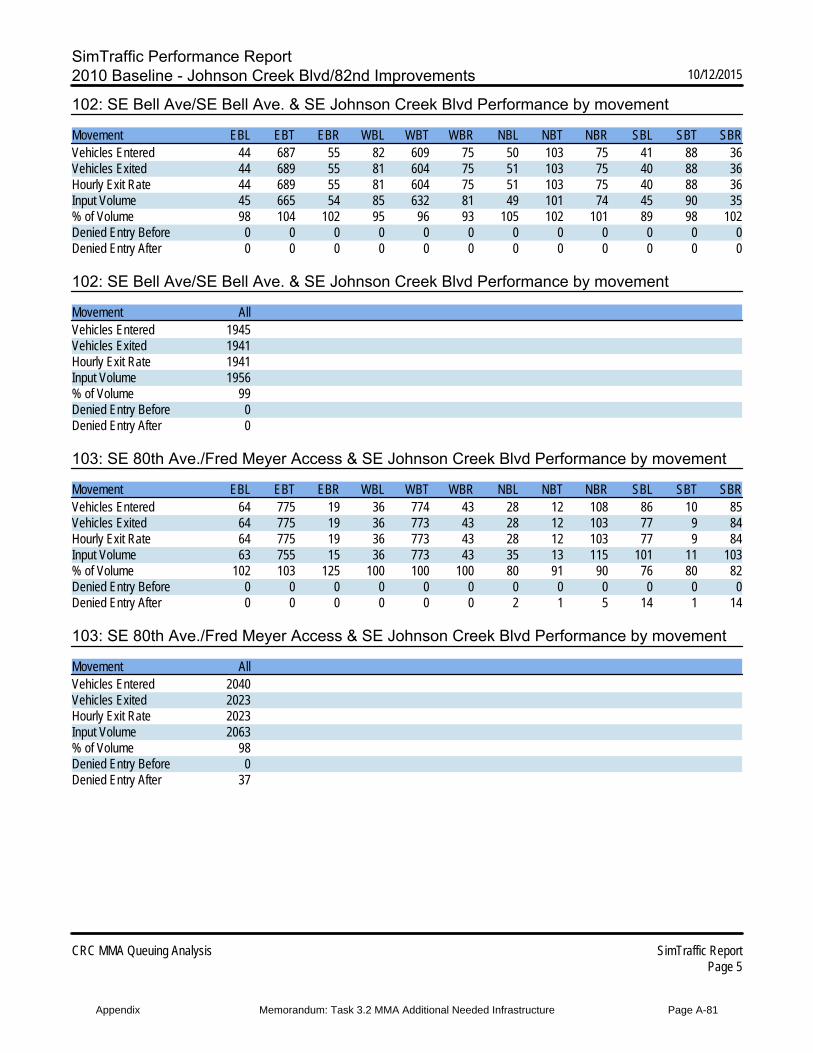
SimTraffic Performance Report2010 Baseline - Johnson Creek Blvd/82nd Improvements 10/12/2015
CRC MMA Queuing Analysis SimTraffic ReportPage 5
102: SE Bell Ave/SE Bell Ave. & SE Johnson Creek Blvd Performance by movement
Movement EBL EBT EBR WBL WBT WBR NBL NBT NBR SBL SBT SBRVehicles Entered 44 687 55 82 609 75 50 103 75 41 88 36Vehicles Exited 44 689 55 81 604 75 51 103 75 40 88 36Hourly Exit Rate 44 689 55 81 604 75 51 103 75 40 88 36Input Volume 45 665 54 85 632 81 49 101 74 45 90 35% of Volume 98 104 102 95 96 93 105 102 101 89 98 102Denied Entry Before 0 0 0 0 0 0 0 0 0 0 0 0Denied Entry After 0 0 0 0 0 0 0 0 0 0 0 0
102: SE Bell Ave/SE Bell Ave. & SE Johnson Creek Blvd Performance by movement
Movement AllVehicles Entered 1945Vehicles Exited 1941Hourly Exit Rate 1941Input Volume 1956% of Volume 99Denied Entry Before 0Denied Entry After 0
103: SE 80th Ave./Fred Meyer Access & SE Johnson Creek Blvd Performance by movement
Movement EBL EBT EBR WBL WBT WBR NBL NBT NBR SBL SBT SBRVehicles Entered 64 775 19 36 774 43 28 12 108 86 10 85Vehicles Exited 64 775 19 36 773 43 28 12 103 77 9 84Hourly Exit Rate 64 775 19 36 773 43 28 12 103 77 9 84Input Volume 63 755 15 36 773 43 35 13 115 101 11 103% of Volume 102 103 125 100 100 100 80 91 90 76 80 82Denied Entry Before 0 0 0 0 0 0 0 0 0 0 0 0Denied Entry After 0 0 0 0 0 0 2 1 5 14 1 14
103: SE 80th Ave./Fred Meyer Access & SE Johnson Creek Blvd Performance by movement
Movement AllVehicles Entered 2040Vehicles Exited 2023Hourly Exit Rate 2023Input Volume 2063% of Volume 98Denied Entry Before 0Denied Entry After 37
Appendix Memorandum: Task 3.2 MMA Additional Needed Infrastructure Page A-81
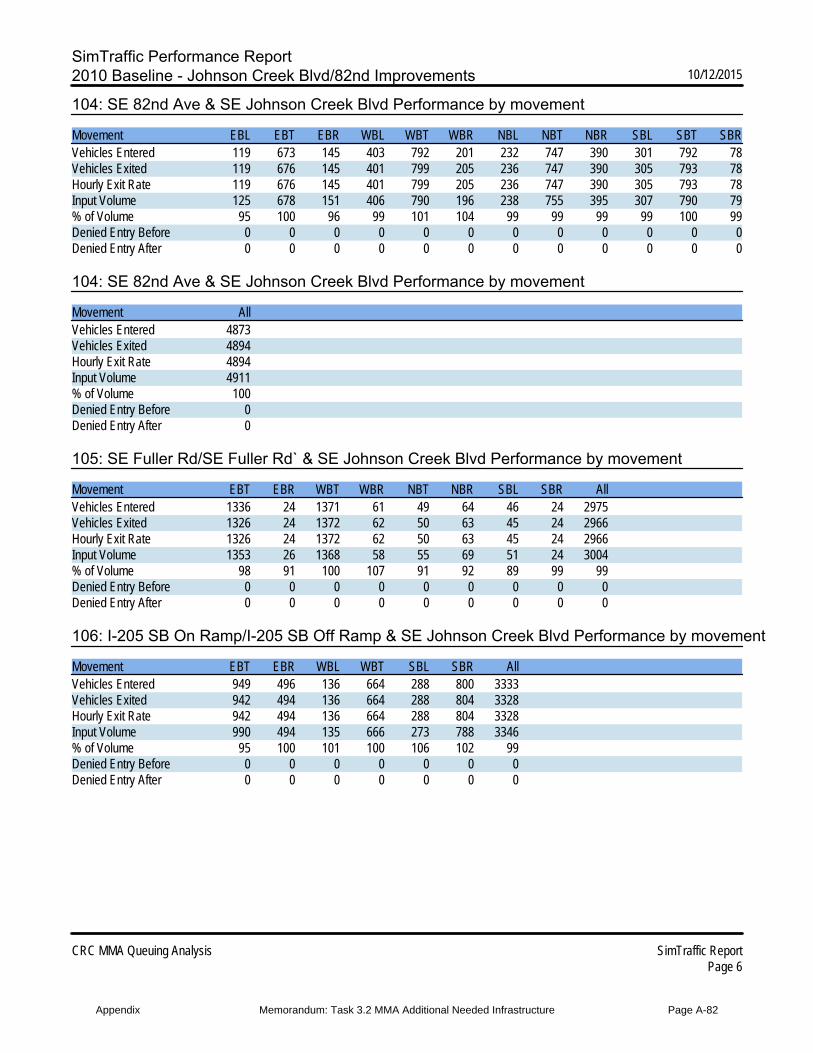
SimTraffic Performance Report2010 Baseline - Johnson Creek Blvd/82nd Improvements 10/12/2015
CRC MMA Queuing Analysis SimTraffic ReportPage 6
104: SE 82nd Ave & SE Johnson Creek Blvd Performance by movement
Movement EBL EBT EBR WBL WBT WBR NBL NBT NBR SBL SBT SBRVehicles Entered 119 673 145 403 792 201 232 747 390 301 792 78Vehicles Exited 119 676 145 401 799 205 236 747 390 305 793 78Hourly Exit Rate 119 676 145 401 799 205 236 747 390 305 793 78Input Volume 125 678 151 406 790 196 238 755 395 307 790 79% of Volume 95 100 96 99 101 104 99 99 99 99 100 99Denied Entry Before 0 0 0 0 0 0 0 0 0 0 0 0Denied Entry After 0 0 0 0 0 0 0 0 0 0 0 0
104: SE 82nd Ave & SE Johnson Creek Blvd Performance by movement
Movement AllVehicles Entered 4873Vehicles Exited 4894Hourly Exit Rate 4894Input Volume 4911% of Volume 100Denied Entry Before 0Denied Entry After 0
105: SE Fuller Rd/SE Fuller Rd` & SE Johnson Creek Blvd Performance by movement
Movement EBT EBR WBT WBR NBT NBR SBL SBR AllVehicles Entered 1336 24 1371 61 49 64 46 24 2975Vehicles Exited 1326 24 1372 62 50 63 45 24 2966Hourly Exit Rate 1326 24 1372 62 50 63 45 24 2966Input Volume 1353 26 1368 58 55 69 51 24 3004% of Volume 98 91 100 107 91 92 89 99 99Denied Entry Before 0 0 0 0 0 0 0 0 0Denied Entry After 0 0 0 0 0 0 0 0 0
106: I-205 SB On Ramp/I-205 SB Off Ramp & SE Johnson Creek Blvd Performance by movement
Movement EBT EBR WBL WBT SBL SBR AllVehicles Entered 949 496 136 664 288 800 3333Vehicles Exited 942 494 136 664 288 804 3328Hourly Exit Rate 942 494 136 664 288 804 3328Input Volume 990 494 135 666 273 788 3346% of Volume 95 100 101 100 106 102 99Denied Entry Before 0 0 0 0 0 0 0Denied Entry After 0 0 0 0 0 0 0
Appendix Memorandum: Task 3.2 MMA Additional Needed Infrastructure Page A-82
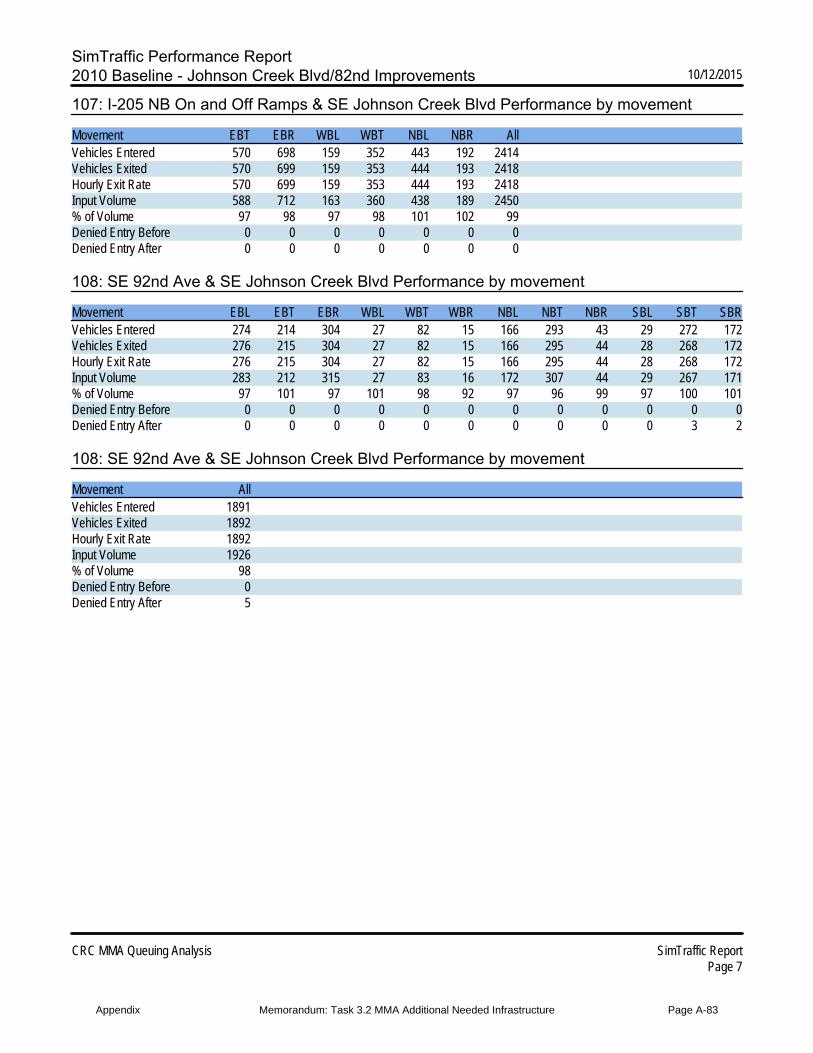
SimTraffic Performance Report2010 Baseline - Johnson Creek Blvd/82nd Improvements 10/12/2015
CRC MMA Queuing Analysis SimTraffic ReportPage 7
107: I-205 NB On and Off Ramps & SE Johnson Creek Blvd Performance by movement
Movement EBT EBR WBL WBT NBL NBR AllVehicles Entered 570 698 159 352 443 192 2414Vehicles Exited 570 699 159 353 444 193 2418Hourly Exit Rate 570 699 159 353 444 193 2418Input Volume 588 712 163 360 438 189 2450% of Volume 97 98 97 98 101 102 99Denied Entry Before 0 0 0 0 0 0 0Denied Entry After 0 0 0 0 0 0 0
108: SE 92nd Ave & SE Johnson Creek Blvd Performance by movement
Movement EBL EBT EBR WBL WBT WBR NBL NBT NBR SBL SBT SBRVehicles Entered 274 214 304 27 82 15 166 293 43 29 272 172Vehicles Exited 276 215 304 27 82 15 166 295 44 28 268 172Hourly Exit Rate 276 215 304 27 82 15 166 295 44 28 268 172Input Volume 283 212 315 27 83 16 172 307 44 29 267 171% of Volume 97 101 97 101 98 92 97 96 99 97 100 101Denied Entry Before 0 0 0 0 0 0 0 0 0 0 0 0Denied Entry After 0 0 0 0 0 0 0 0 0 0 3 2
108: SE 92nd Ave & SE Johnson Creek Blvd Performance by movement
Movement AllVehicles Entered 1891Vehicles Exited 1892Hourly Exit Rate 1892Input Volume 1926% of Volume 98Denied Entry Before 0Denied Entry After 5
Appendix Memorandum: Task 3.2 MMA Additional Needed Infrastructure Page A-83
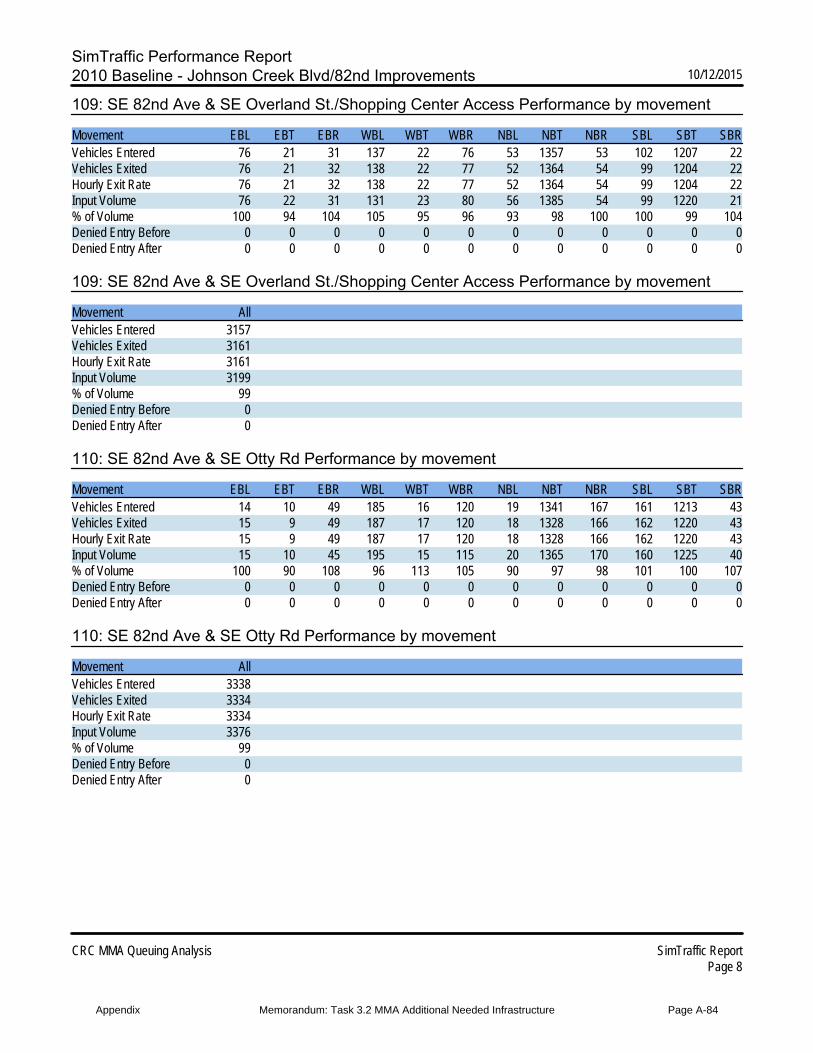
SimTraffic Performance Report2010 Baseline - Johnson Creek Blvd/82nd Improvements 10/12/2015
CRC MMA Queuing Analysis SimTraffic ReportPage 8
109: SE 82nd Ave & SE Overland St./Shopping Center Access Performance by movement
Movement EBL EBT EBR WBL WBT WBR NBL NBT NBR SBL SBT SBRVehicles Entered 76 21 31 137 22 76 53 1357 53 102 1207 22Vehicles Exited 76 21 32 138 22 77 52 1364 54 99 1204 22Hourly Exit Rate 76 21 32 138 22 77 52 1364 54 99 1204 22Input Volume 76 22 31 131 23 80 56 1385 54 99 1220 21% of Volume 100 94 104 105 95 96 93 98 100 100 99 104Denied Entry Before 0 0 0 0 0 0 0 0 0 0 0 0Denied Entry After 0 0 0 0 0 0 0 0 0 0 0 0
109: SE 82nd Ave & SE Overland St./Shopping Center Access Performance by movement
Movement AllVehicles Entered 3157Vehicles Exited 3161Hourly Exit Rate 3161Input Volume 3199% of Volume 99Denied Entry Before 0Denied Entry After 0
110: SE 82nd Ave & SE Otty Rd Performance by movement
Movement EBL EBT EBR WBL WBT WBR NBL NBT NBR SBL SBT SBRVehicles Entered 14 10 49 185 16 120 19 1341 167 161 1213 43Vehicles Exited 15 9 49 187 17 120 18 1328 166 162 1220 43Hourly Exit Rate 15 9 49 187 17 120 18 1328 166 162 1220 43Input Volume 15 10 45 195 15 115 20 1365 170 160 1225 40% of Volume 100 90 108 96 113 105 90 97 98 101 100 107Denied Entry Before 0 0 0 0 0 0 0 0 0 0 0 0Denied Entry After 0 0 0 0 0 0 0 0 0 0 0 0
110: SE 82nd Ave & SE Otty Rd Performance by movement
Movement AllVehicles Entered 3338Vehicles Exited 3334Hourly Exit Rate 3334Input Volume 3376% of Volume 99Denied Entry Before 0Denied Entry After 0
Appendix Memorandum: Task 3.2 MMA Additional Needed Infrastructure Page A-84
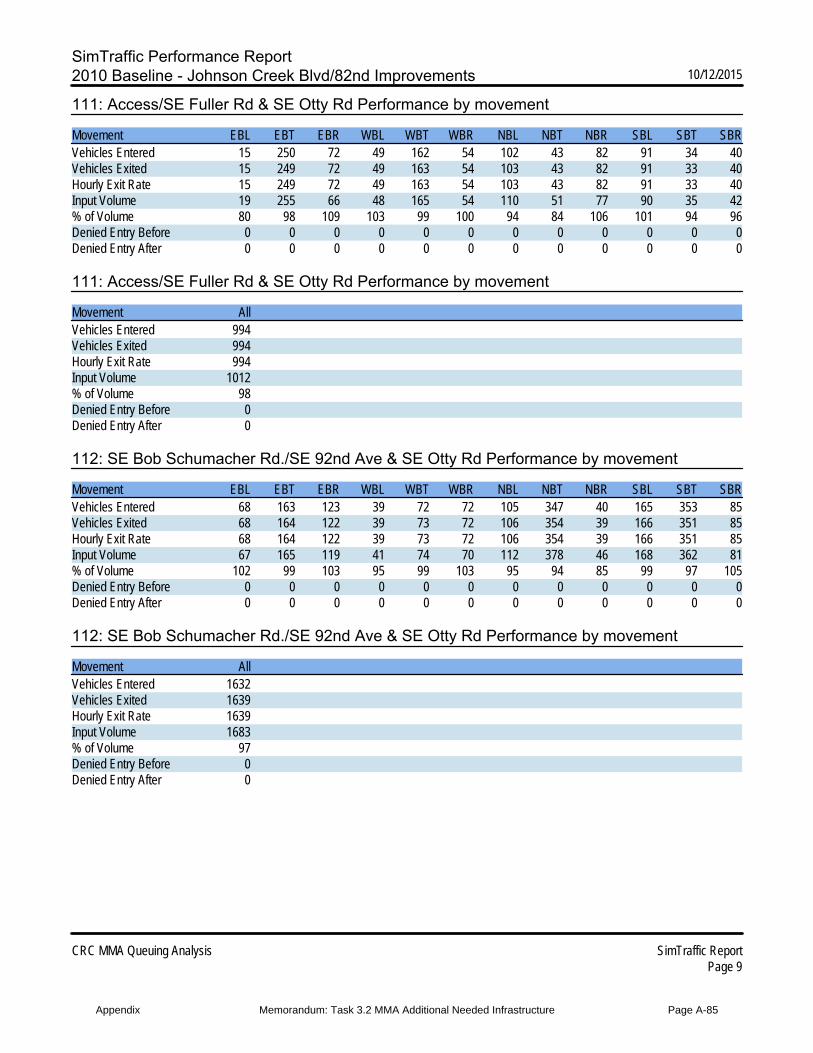
SimTraffic Performance Report2010 Baseline - Johnson Creek Blvd/82nd Improvements 10/12/2015
CRC MMA Queuing Analysis SimTraffic ReportPage 9
111: Access/SE Fuller Rd & SE Otty Rd Performance by movement
Movement EBL EBT EBR WBL WBT WBR NBL NBT NBR SBL SBT SBRVehicles Entered 15 250 72 49 162 54 102 43 82 91 34 40Vehicles Exited 15 249 72 49 163 54 103 43 82 91 33 40Hourly Exit Rate 15 249 72 49 163 54 103 43 82 91 33 40Input Volume 19 255 66 48 165 54 110 51 77 90 35 42% of Volume 80 98 109 103 99 100 94 84 106 101 94 96Denied Entry Before 0 0 0 0 0 0 0 0 0 0 0 0Denied Entry After 0 0 0 0 0 0 0 0 0 0 0 0
111: Access/SE Fuller Rd & SE Otty Rd Performance by movement
Movement AllVehicles Entered 994Vehicles Exited 994Hourly Exit Rate 994Input Volume 1012% of Volume 98Denied Entry Before 0Denied Entry After 0
112: SE Bob Schumacher Rd./SE 92nd Ave & SE Otty Rd Performance by movement
Movement EBL EBT EBR WBL WBT WBR NBL NBT NBR SBL SBT SBRVehicles Entered 68 163 123 39 72 72 105 347 40 165 353 85Vehicles Exited 68 164 122 39 73 72 106 354 39 166 351 85Hourly Exit Rate 68 164 122 39 73 72 106 354 39 166 351 85Input Volume 67 165 119 41 74 70 112 378 46 168 362 81% of Volume 102 99 103 95 99 103 95 94 85 99 97 105Denied Entry Before 0 0 0 0 0 0 0 0 0 0 0 0Denied Entry After 0 0 0 0 0 0 0 0 0 0 0 0
112: SE Bob Schumacher Rd./SE 92nd Ave & SE Otty Rd Performance by movement
Movement AllVehicles Entered 1632Vehicles Exited 1639Hourly Exit Rate 1639Input Volume 1683% of Volume 97Denied Entry Before 0Denied Entry After 0
Appendix Memorandum: Task 3.2 MMA Additional Needed Infrastructure Page A-85
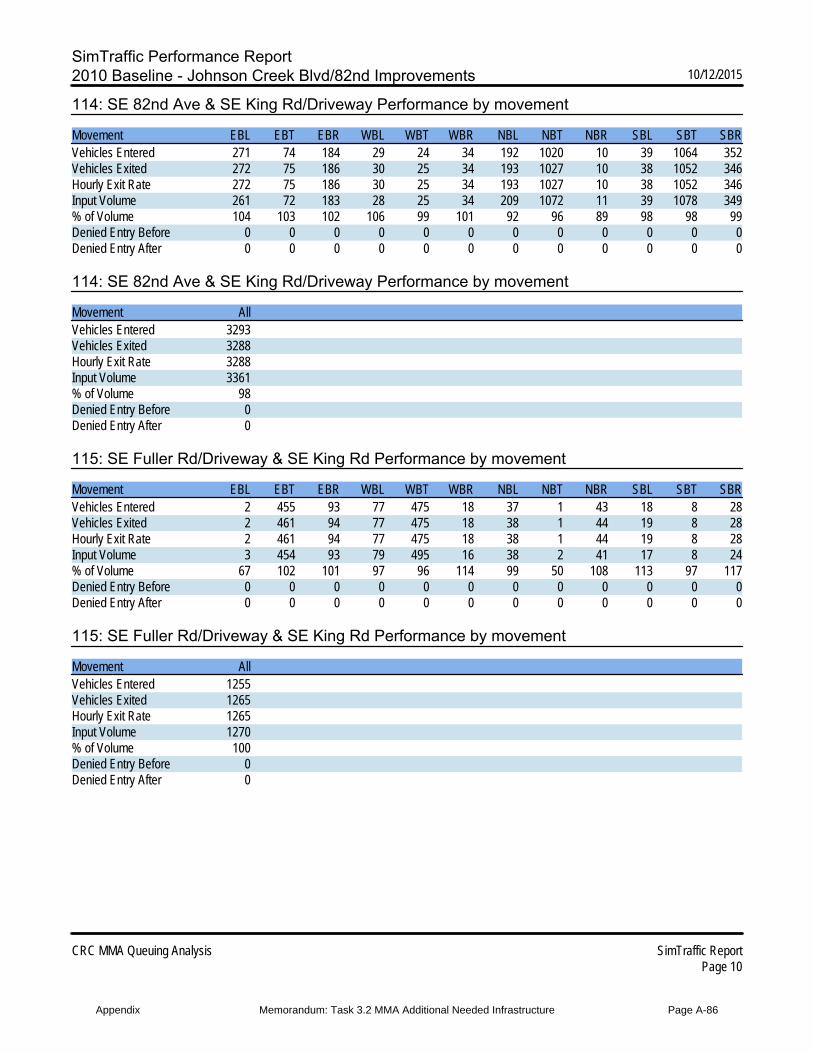
SimTraffic Performance Report2010 Baseline - Johnson Creek Blvd/82nd Improvements 10/12/2015
CRC MMA Queuing Analysis SimTraffic ReportPage 10
114: SE 82nd Ave & SE King Rd/Driveway Performance by movement
Movement EBL EBT EBR WBL WBT WBR NBL NBT NBR SBL SBT SBRVehicles Entered 271 74 184 29 24 34 192 1020 10 39 1064 352Vehicles Exited 272 75 186 30 25 34 193 1027 10 38 1052 346Hourly Exit Rate 272 75 186 30 25 34 193 1027 10 38 1052 346Input Volume 261 72 183 28 25 34 209 1072 11 39 1078 349% of Volume 104 103 102 106 99 101 92 96 89 98 98 99Denied Entry Before 0 0 0 0 0 0 0 0 0 0 0 0Denied Entry After 0 0 0 0 0 0 0 0 0 0 0 0
114: SE 82nd Ave & SE King Rd/Driveway Performance by movement
Movement AllVehicles Entered 3293Vehicles Exited 3288Hourly Exit Rate 3288Input Volume 3361% of Volume 98Denied Entry Before 0Denied Entry After 0
115: SE Fuller Rd/Driveway & SE King Rd Performance by movement
Movement EBL EBT EBR WBL WBT WBR NBL NBT NBR SBL SBT SBRVehicles Entered 2 455 93 77 475 18 37 1 43 18 8 28Vehicles Exited 2 461 94 77 475 18 38 1 44 19 8 28Hourly Exit Rate 2 461 94 77 475 18 38 1 44 19 8 28Input Volume 3 454 93 79 495 16 38 2 41 17 8 24% of Volume 67 102 101 97 96 114 99 50 108 113 97 117Denied Entry Before 0 0 0 0 0 0 0 0 0 0 0 0Denied Entry After 0 0 0 0 0 0 0 0 0 0 0 0
115: SE Fuller Rd/Driveway & SE King Rd Performance by movement
Movement AllVehicles Entered 1255Vehicles Exited 1265Hourly Exit Rate 1265Input Volume 1270% of Volume 100Denied Entry Before 0Denied Entry After 0
Appendix Memorandum: Task 3.2 MMA Additional Needed Infrastructure Page A-86
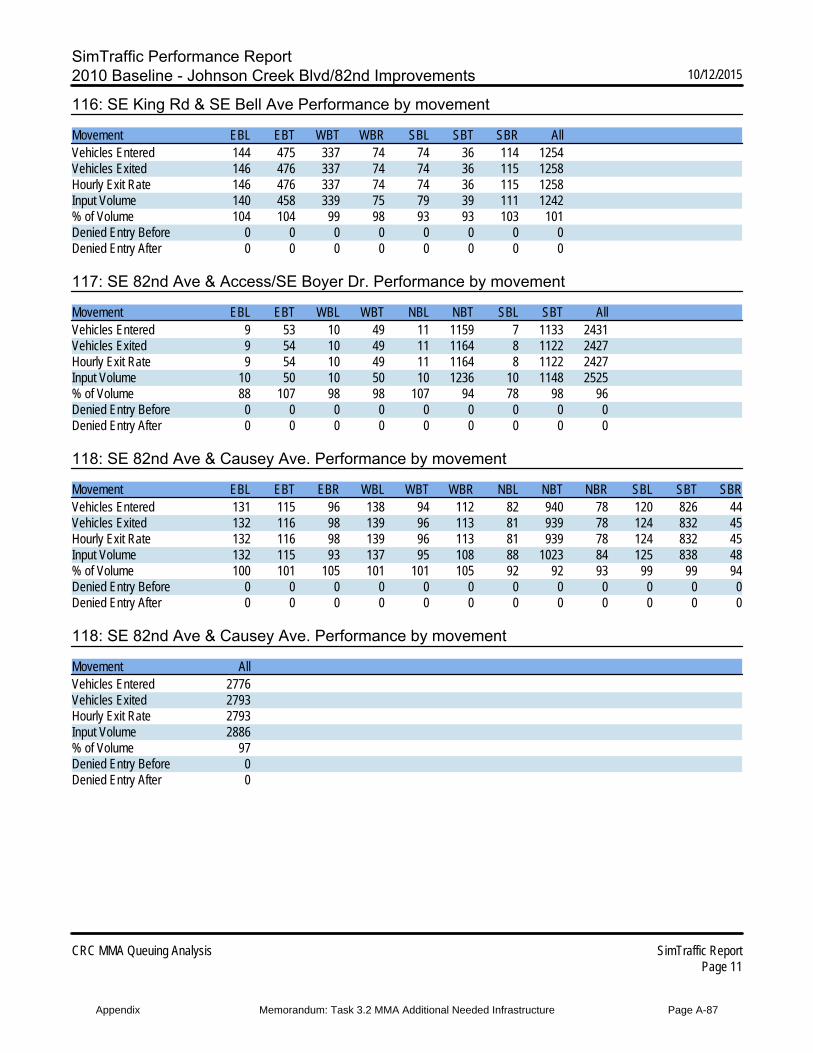
SimTraffic Performance Report2010 Baseline - Johnson Creek Blvd/82nd Improvements 10/12/2015
CRC MMA Queuing Analysis SimTraffic ReportPage 11
116: SE King Rd & SE Bell Ave Performance by movement
Movement EBL EBT WBT WBR SBL SBT SBR AllVehicles Entered 144 475 337 74 74 36 114 1254Vehicles Exited 146 476 337 74 74 36 115 1258Hourly Exit Rate 146 476 337 74 74 36 115 1258Input Volume 140 458 339 75 79 39 111 1242% of Volume 104 104 99 98 93 93 103 101Denied Entry Before 0 0 0 0 0 0 0 0Denied Entry After 0 0 0 0 0 0 0 0
117: SE 82nd Ave & Access/SE Boyer Dr. Performance by movement
Movement EBL EBT WBL WBT NBL NBT SBL SBT AllVehicles Entered 9 53 10 49 11 1159 7 1133 2431Vehicles Exited 9 54 10 49 11 1164 8 1122 2427Hourly Exit Rate 9 54 10 49 11 1164 8 1122 2427Input Volume 10 50 10 50 10 1236 10 1148 2525% of Volume 88 107 98 98 107 94 78 98 96Denied Entry Before 0 0 0 0 0 0 0 0 0Denied Entry After 0 0 0 0 0 0 0 0 0
118: SE 82nd Ave & Causey Ave. Performance by movement
Movement EBL EBT EBR WBL WBT WBR NBL NBT NBR SBL SBT SBRVehicles Entered 131 115 96 138 94 112 82 940 78 120 826 44Vehicles Exited 132 116 98 139 96 113 81 939 78 124 832 45Hourly Exit Rate 132 116 98 139 96 113 81 939 78 124 832 45Input Volume 132 115 93 137 95 108 88 1023 84 125 838 48% of Volume 100 101 105 101 101 105 92 92 93 99 99 94Denied Entry Before 0 0 0 0 0 0 0 0 0 0 0 0Denied Entry After 0 0 0 0 0 0 0 0 0 0 0 0
118: SE 82nd Ave & Causey Ave. Performance by movement
Movement AllVehicles Entered 2776Vehicles Exited 2793Hourly Exit Rate 2793Input Volume 2886% of Volume 97Denied Entry Before 0Denied Entry After 0
Appendix Memorandum: Task 3.2 MMA Additional Needed Infrastructure Page A-87
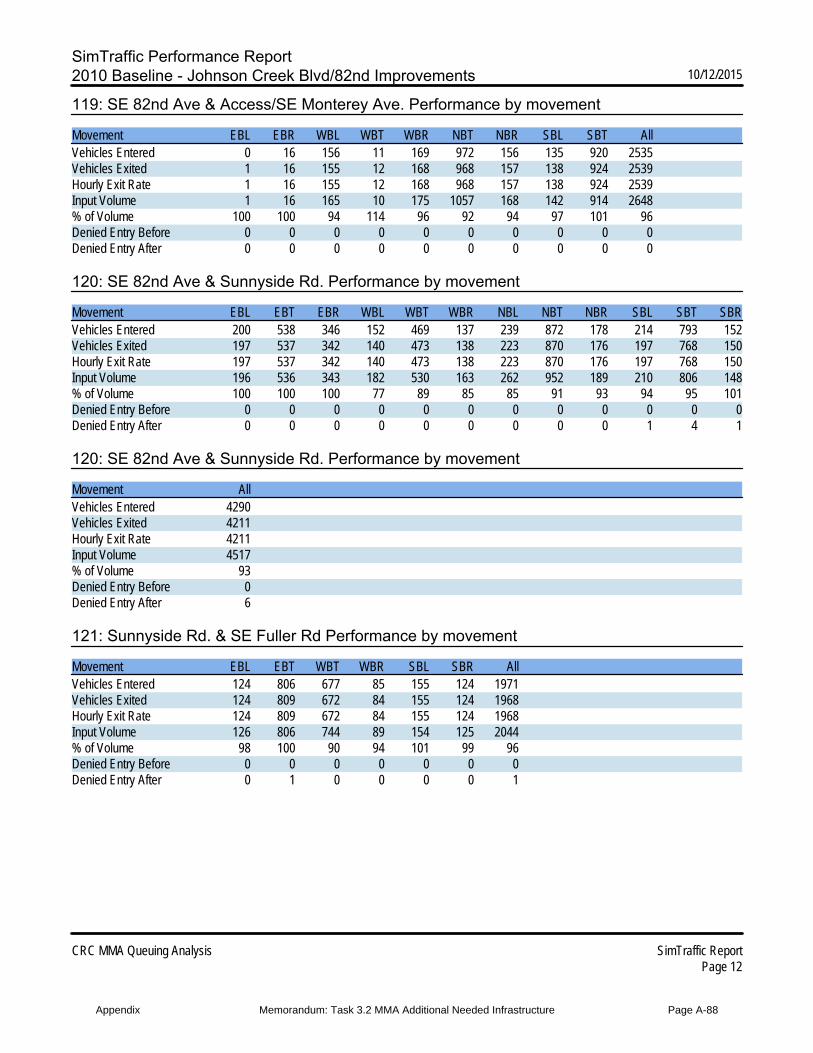
SimTraffic Performance Report2010 Baseline - Johnson Creek Blvd/82nd Improvements 10/12/2015
CRC MMA Queuing Analysis SimTraffic ReportPage 12
119: SE 82nd Ave & Access/SE Monterey Ave. Performance by movement
Movement EBL EBR WBL WBT WBR NBT NBR SBL SBT AllVehicles Entered 0 16 156 11 169 972 156 135 920 2535Vehicles Exited 1 16 155 12 168 968 157 138 924 2539Hourly Exit Rate 1 16 155 12 168 968 157 138 924 2539Input Volume 1 16 165 10 175 1057 168 142 914 2648% of Volume 100 100 94 114 96 92 94 97 101 96Denied Entry Before 0 0 0 0 0 0 0 0 0 0Denied Entry After 0 0 0 0 0 0 0 0 0 0
120: SE 82nd Ave & Sunnyside Rd. Performance by movement
Movement EBL EBT EBR WBL WBT WBR NBL NBT NBR SBL SBT SBRVehicles Entered 200 538 346 152 469 137 239 872 178 214 793 152Vehicles Exited 197 537 342 140 473 138 223 870 176 197 768 150Hourly Exit Rate 197 537 342 140 473 138 223 870 176 197 768 150Input Volume 196 536 343 182 530 163 262 952 189 210 806 148% of Volume 100 100 100 77 89 85 85 91 93 94 95 101Denied Entry Before 0 0 0 0 0 0 0 0 0 0 0 0Denied Entry After 0 0 0 0 0 0 0 0 0 1 4 1
120: SE 82nd Ave & Sunnyside Rd. Performance by movement
Movement AllVehicles Entered 4290Vehicles Exited 4211Hourly Exit Rate 4211Input Volume 4517% of Volume 93Denied Entry Before 0Denied Entry After 6
121: Sunnyside Rd. & SE Fuller Rd Performance by movement
Movement EBL EBT WBT WBR SBL SBR AllVehicles Entered 124 806 677 85 155 124 1971Vehicles Exited 124 809 672 84 155 124 1968Hourly Exit Rate 124 809 672 84 155 124 1968Input Volume 126 806 744 89 154 125 2044% of Volume 98 100 90 94 101 99 96Denied Entry Before 0 0 0 0 0 0 0Denied Entry After 0 1 0 0 0 0 1
Appendix Memorandum: Task 3.2 MMA Additional Needed Infrastructure Page A-88
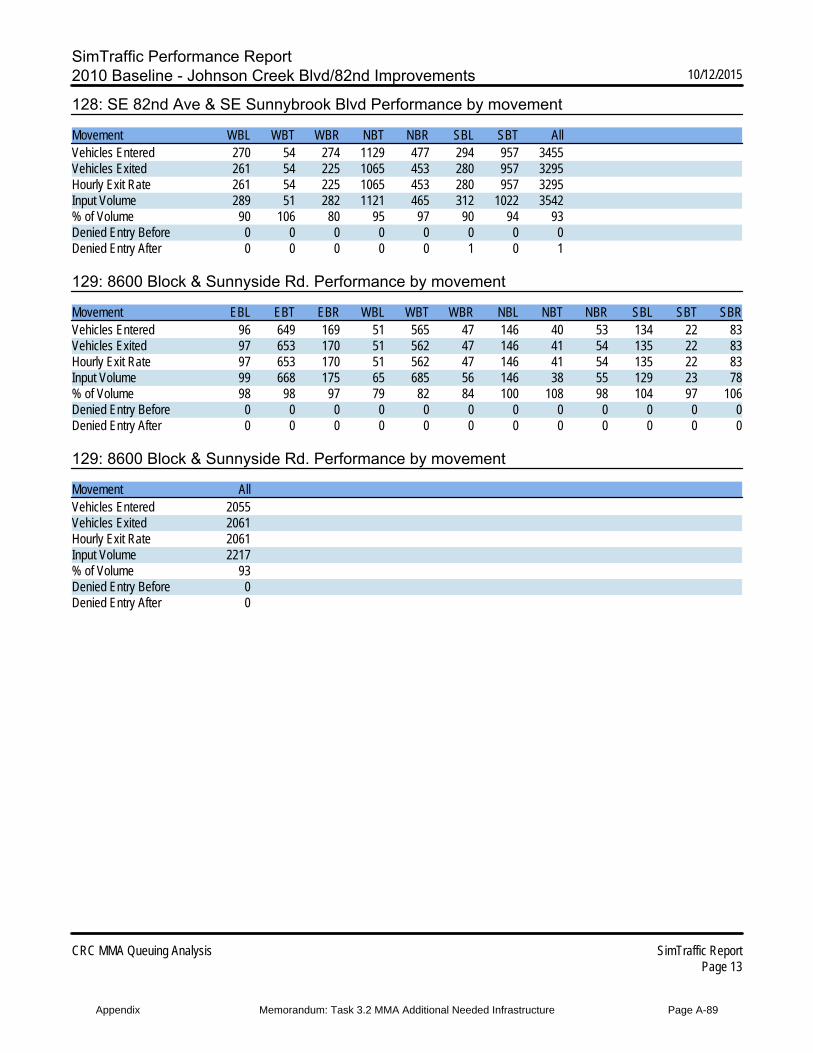
SimTraffic Performance Report2010 Baseline - Johnson Creek Blvd/82nd Improvements 10/12/2015
CRC MMA Queuing Analysis SimTraffic ReportPage 13
128: SE 82nd Ave & SE Sunnybrook Blvd Performance by movement
Movement WBL WBT WBR NBT NBR SBL SBT AllVehicles Entered 270 54 274 1129 477 294 957 3455Vehicles Exited 261 54 225 1065 453 280 957 3295Hourly Exit Rate 261 54 225 1065 453 280 957 3295Input Volume 289 51 282 1121 465 312 1022 3542% of Volume 90 106 80 95 97 90 94 93Denied Entry Before 0 0 0 0 0 0 0 0Denied Entry After 0 0 0 0 0 1 0 1
129: 8600 Block & Sunnyside Rd. Performance by movement
Movement EBL EBT EBR WBL WBT WBR NBL NBT NBR SBL SBT SBRVehicles Entered 96 649 169 51 565 47 146 40 53 134 22 83Vehicles Exited 97 653 170 51 562 47 146 41 54 135 22 83Hourly Exit Rate 97 653 170 51 562 47 146 41 54 135 22 83Input Volume 99 668 175 65 685 56 146 38 55 129 23 78% of Volume 98 98 97 79 82 84 100 108 98 104 97 106Denied Entry Before 0 0 0 0 0 0 0 0 0 0 0 0Denied Entry After 0 0 0 0 0 0 0 0 0 0 0 0
129: 8600 Block & Sunnyside Rd. Performance by movement
Movement AllVehicles Entered 2055Vehicles Exited 2061Hourly Exit Rate 2061Input Volume 2217% of Volume 93Denied Entry Before 0Denied Entry After 0
Appendix Memorandum: Task 3.2 MMA Additional Needed Infrastructure Page A-89
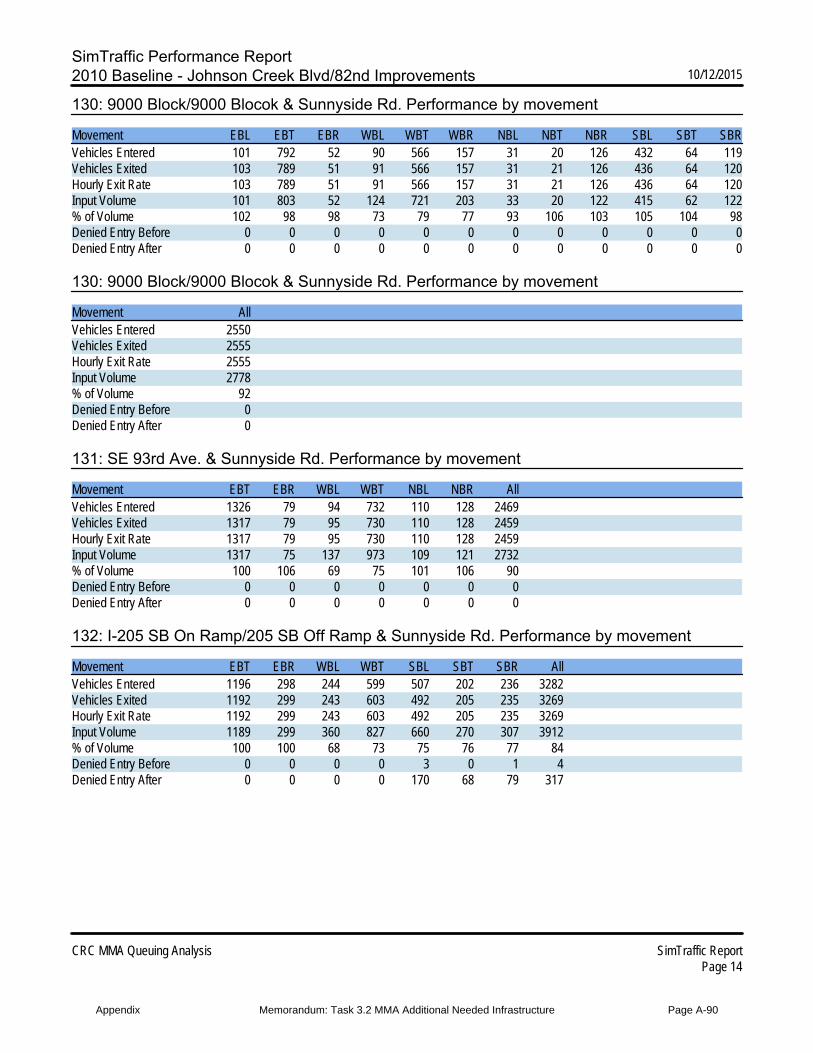
SimTraffic Performance Report2010 Baseline - Johnson Creek Blvd/82nd Improvements 10/12/2015
CRC MMA Queuing Analysis SimTraffic ReportPage 14
130: 9000 Block/9000 Blocok & Sunnyside Rd. Performance by movement
Movement EBL EBT EBR WBL WBT WBR NBL NBT NBR SBL SBT SBRVehicles Entered 101 792 52 90 566 157 31 20 126 432 64 119Vehicles Exited 103 789 51 91 566 157 31 21 126 436 64 120Hourly Exit Rate 103 789 51 91 566 157 31 21 126 436 64 120Input Volume 101 803 52 124 721 203 33 20 122 415 62 122% of Volume 102 98 98 73 79 77 93 106 103 105 104 98Denied Entry Before 0 0 0 0 0 0 0 0 0 0 0 0Denied Entry After 0 0 0 0 0 0 0 0 0 0 0 0
130: 9000 Block/9000 Blocok & Sunnyside Rd. Performance by movement
Movement AllVehicles Entered 2550Vehicles Exited 2555Hourly Exit Rate 2555Input Volume 2778% of Volume 92Denied Entry Before 0Denied Entry After 0
131: SE 93rd Ave. & Sunnyside Rd. Performance by movement
Movement EBT EBR WBL WBT NBL NBR AllVehicles Entered 1326 79 94 732 110 128 2469Vehicles Exited 1317 79 95 730 110 128 2459Hourly Exit Rate 1317 79 95 730 110 128 2459Input Volume 1317 75 137 973 109 121 2732% of Volume 100 106 69 75 101 106 90Denied Entry Before 0 0 0 0 0 0 0Denied Entry After 0 0 0 0 0 0 0
132: I-205 SB On Ramp/205 SB Off Ramp & Sunnyside Rd. Performance by movement
Movement EBT EBR WBL WBT SBL SBT SBR AllVehicles Entered 1196 298 244 599 507 202 236 3282Vehicles Exited 1192 299 243 603 492 205 235 3269Hourly Exit Rate 1192 299 243 603 492 205 235 3269Input Volume 1189 299 360 827 660 270 307 3912% of Volume 100 100 68 73 75 76 77 84Denied Entry Before 0 0 0 0 3 0 1 4Denied Entry After 0 0 0 0 170 68 79 317
Appendix Memorandum: Task 3.2 MMA Additional Needed Infrastructure Page A-90
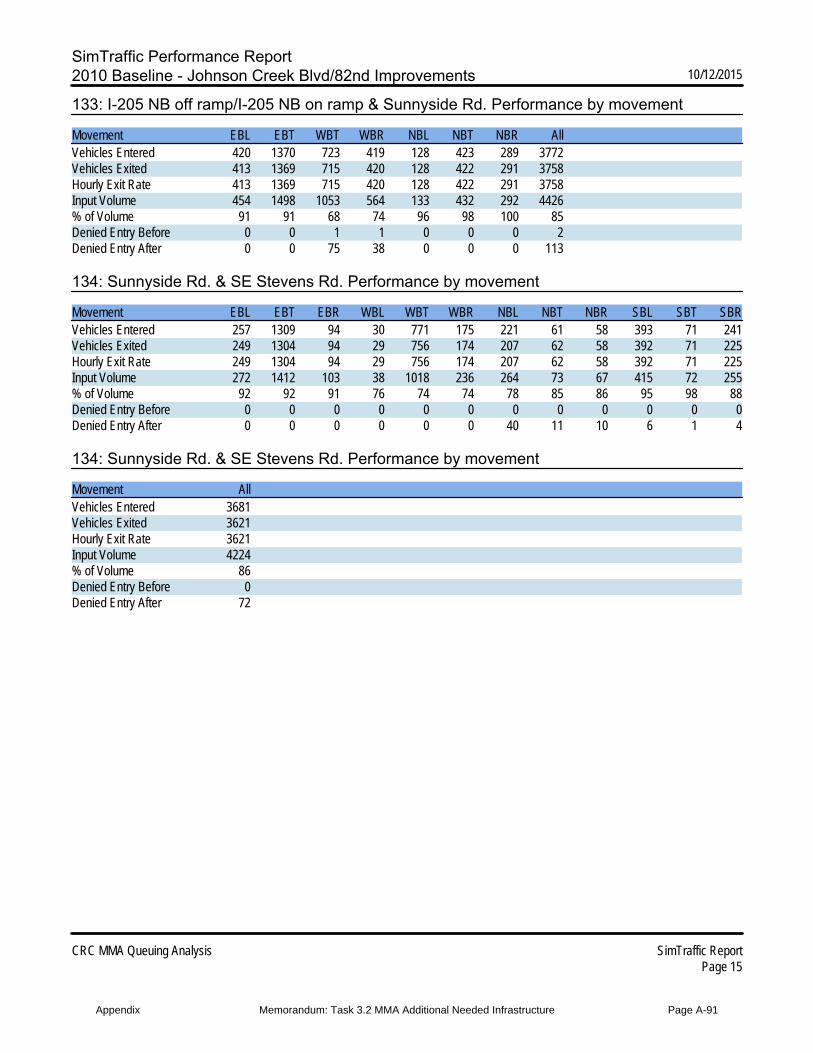
SimTraffic Performance Report2010 Baseline - Johnson Creek Blvd/82nd Improvements 10/12/2015
CRC MMA Queuing Analysis SimTraffic ReportPage 15
133: I-205 NB off ramp/I-205 NB on ramp & Sunnyside Rd. Performance by movement
Movement EBL EBT WBT WBR NBL NBT NBR AllVehicles Entered 420 1370 723 419 128 423 289 3772Vehicles Exited 413 1369 715 420 128 422 291 3758Hourly Exit Rate 413 1369 715 420 128 422 291 3758Input Volume 454 1498 1053 564 133 432 292 4426% of Volume 91 91 68 74 96 98 100 85Denied Entry Before 0 0 1 1 0 0 0 2Denied Entry After 0 0 75 38 0 0 0 113
134: Sunnyside Rd. & SE Stevens Rd. Performance by movement
Movement EBL EBT EBR WBL WBT WBR NBL NBT NBR SBL SBT SBRVehicles Entered 257 1309 94 30 771 175 221 61 58 393 71 241Vehicles Exited 249 1304 94 29 756 174 207 62 58 392 71 225Hourly Exit Rate 249 1304 94 29 756 174 207 62 58 392 71 225Input Volume 272 1412 103 38 1018 236 264 73 67 415 72 255% of Volume 92 92 91 76 74 74 78 85 86 95 98 88Denied Entry Before 0 0 0 0 0 0 0 0 0 0 0 0Denied Entry After 0 0 0 0 0 0 40 11 10 6 1 4
134: Sunnyside Rd. & SE Stevens Rd. Performance by movement
Movement AllVehicles Entered 3681Vehicles Exited 3621Hourly Exit Rate 3621Input Volume 4224% of Volume 86Denied Entry Before 0Denied Entry After 72
Appendix Memorandum: Task 3.2 MMA Additional Needed Infrastructure Page A-91
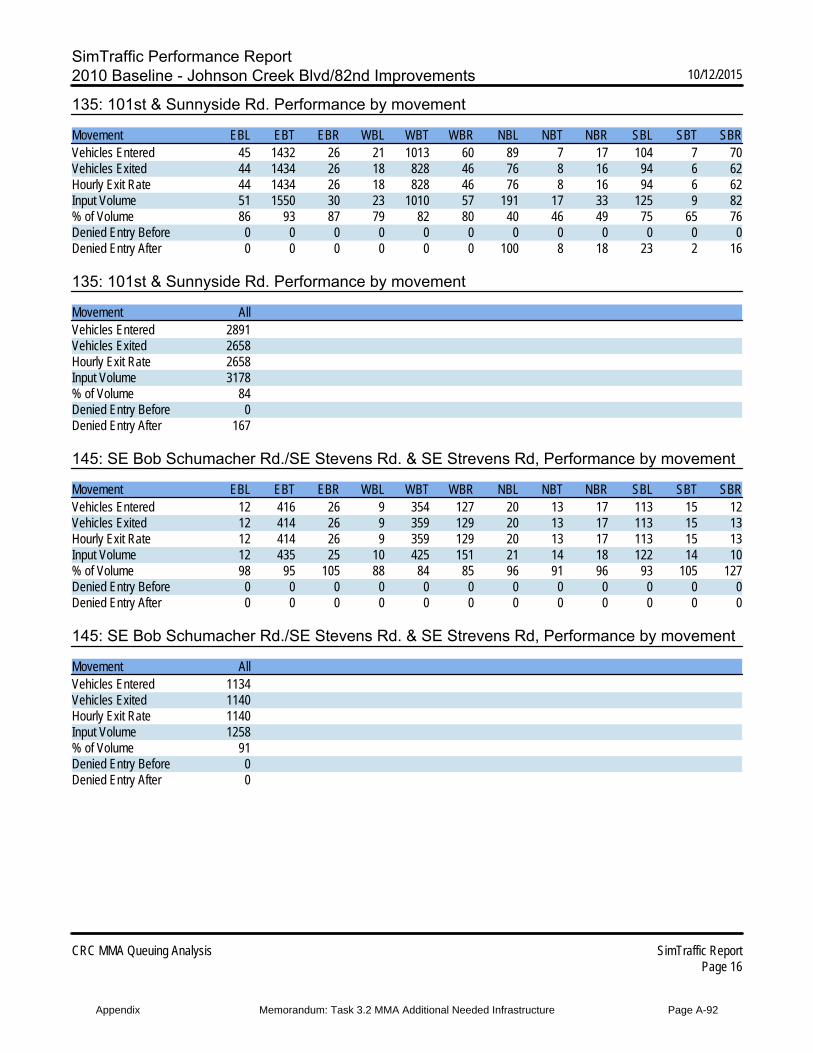
SimTraffic Performance Report2010 Baseline - Johnson Creek Blvd/82nd Improvements 10/12/2015
CRC MMA Queuing Analysis SimTraffic ReportPage 16
135: 101st & Sunnyside Rd. Performance by movement
Movement EBL EBT EBR WBL WBT WBR NBL NBT NBR SBL SBT SBRVehicles Entered 45 1432 26 21 1013 60 89 7 17 104 7 70Vehicles Exited 44 1434 26 18 828 46 76 8 16 94 6 62Hourly Exit Rate 44 1434 26 18 828 46 76 8 16 94 6 62Input Volume 51 1550 30 23 1010 57 191 17 33 125 9 82% of Volume 86 93 87 79 82 80 40 46 49 75 65 76Denied Entry Before 0 0 0 0 0 0 0 0 0 0 0 0Denied Entry After 0 0 0 0 0 0 100 8 18 23 2 16
135: 101st & Sunnyside Rd. Performance by movement
Movement AllVehicles Entered 2891Vehicles Exited 2658Hourly Exit Rate 2658Input Volume 3178% of Volume 84Denied Entry Before 0Denied Entry After 167
145: SE Bob Schumacher Rd./SE Stevens Rd. & SE Strevens Rd, Performance by movement
Movement EBL EBT EBR WBL WBT WBR NBL NBT NBR SBL SBT SBRVehicles Entered 12 416 26 9 354 127 20 13 17 113 15 12Vehicles Exited 12 414 26 9 359 129 20 13 17 113 15 13Hourly Exit Rate 12 414 26 9 359 129 20 13 17 113 15 13Input Volume 12 435 25 10 425 151 21 14 18 122 14 10% of Volume 98 95 105 88 84 85 96 91 96 93 105 127Denied Entry Before 0 0 0 0 0 0 0 0 0 0 0 0Denied Entry After 0 0 0 0 0 0 0 0 0 0 0 0
145: SE Bob Schumacher Rd./SE Stevens Rd. & SE Strevens Rd, Performance by movement
Movement AllVehicles Entered 1134Vehicles Exited 1140Hourly Exit Rate 1140Input Volume 1258% of Volume 91Denied Entry Before 0Denied Entry After 0
Appendix Memorandum: Task 3.2 MMA Additional Needed Infrastructure Page A-92
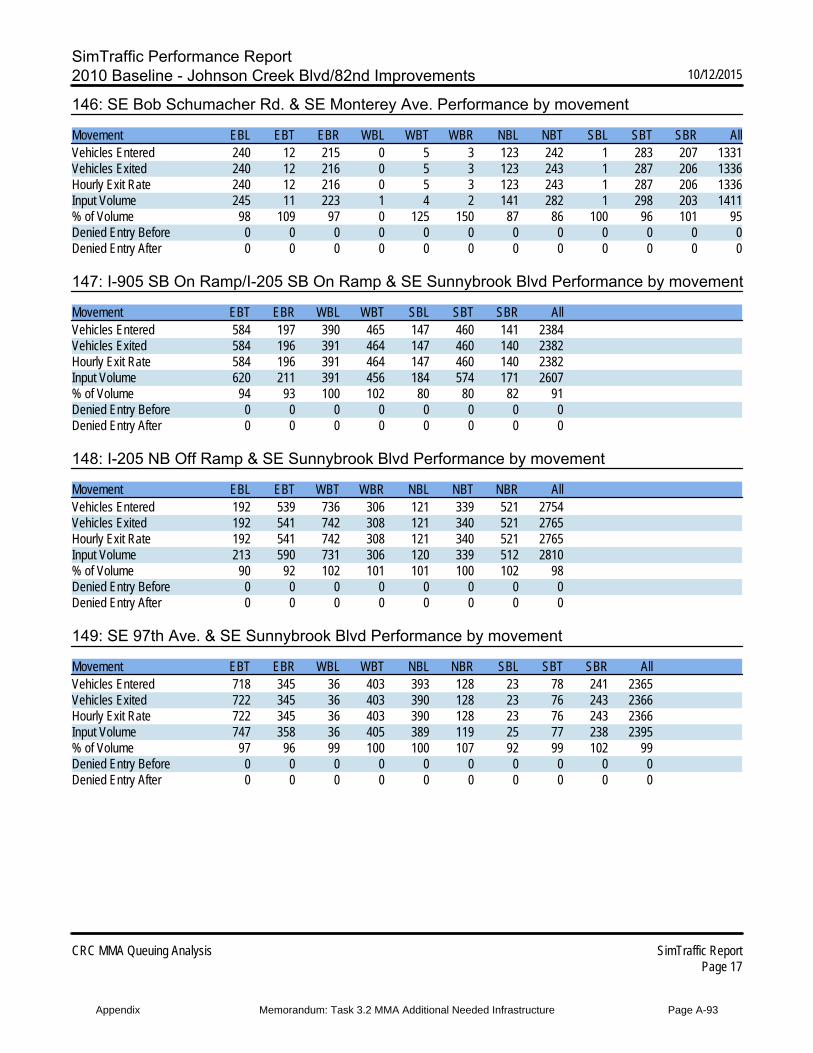
SimTraffic Performance Report2010 Baseline - Johnson Creek Blvd/82nd Improvements 10/12/2015
CRC MMA Queuing Analysis SimTraffic ReportPage 17
146: SE Bob Schumacher Rd. & SE Monterey Ave. Performance by movement
Movement EBL EBT EBR WBL WBT WBR NBL NBT SBL SBT SBR AllVehicles Entered 240 12 215 0 5 3 123 242 1 283 207 1331Vehicles Exited 240 12 216 0 5 3 123 243 1 287 206 1336Hourly Exit Rate 240 12 216 0 5 3 123 243 1 287 206 1336Input Volume 245 11 223 1 4 2 141 282 1 298 203 1411% of Volume 98 109 97 0 125 150 87 86 100 96 101 95Denied Entry Before 0 0 0 0 0 0 0 0 0 0 0 0Denied Entry After 0 0 0 0 0 0 0 0 0 0 0 0
147: I-905 SB On Ramp/I-205 SB On Ramp & SE Sunnybrook Blvd Performance by movement
Movement EBT EBR WBL WBT SBL SBT SBR AllVehicles Entered 584 197 390 465 147 460 141 2384Vehicles Exited 584 196 391 464 147 460 140 2382Hourly Exit Rate 584 196 391 464 147 460 140 2382Input Volume 620 211 391 456 184 574 171 2607% of Volume 94 93 100 102 80 80 82 91Denied Entry Before 0 0 0 0 0 0 0 0Denied Entry After 0 0 0 0 0 0 0 0
148: I-205 NB Off Ramp & SE Sunnybrook Blvd Performance by movement
Movement EBL EBT WBT WBR NBL NBT NBR AllVehicles Entered 192 539 736 306 121 339 521 2754Vehicles Exited 192 541 742 308 121 340 521 2765Hourly Exit Rate 192 541 742 308 121 340 521 2765Input Volume 213 590 731 306 120 339 512 2810% of Volume 90 92 102 101 101 100 102 98Denied Entry Before 0 0 0 0 0 0 0 0Denied Entry After 0 0 0 0 0 0 0 0
149: SE 97th Ave. & SE Sunnybrook Blvd Performance by movement
Movement EBT EBR WBL WBT NBL NBR SBL SBT SBR AllVehicles Entered 718 345 36 403 393 128 23 78 241 2365Vehicles Exited 722 345 36 403 390 128 23 76 243 2366Hourly Exit Rate 722 345 36 403 390 128 23 76 243 2366Input Volume 747 358 36 405 389 119 25 77 238 2395% of Volume 97 96 99 100 100 107 92 99 102 99Denied Entry Before 0 0 0 0 0 0 0 0 0 0Denied Entry After 0 0 0 0 0 0 0 0 0 0
Appendix Memorandum: Task 3.2 MMA Additional Needed Infrastructure Page A-93
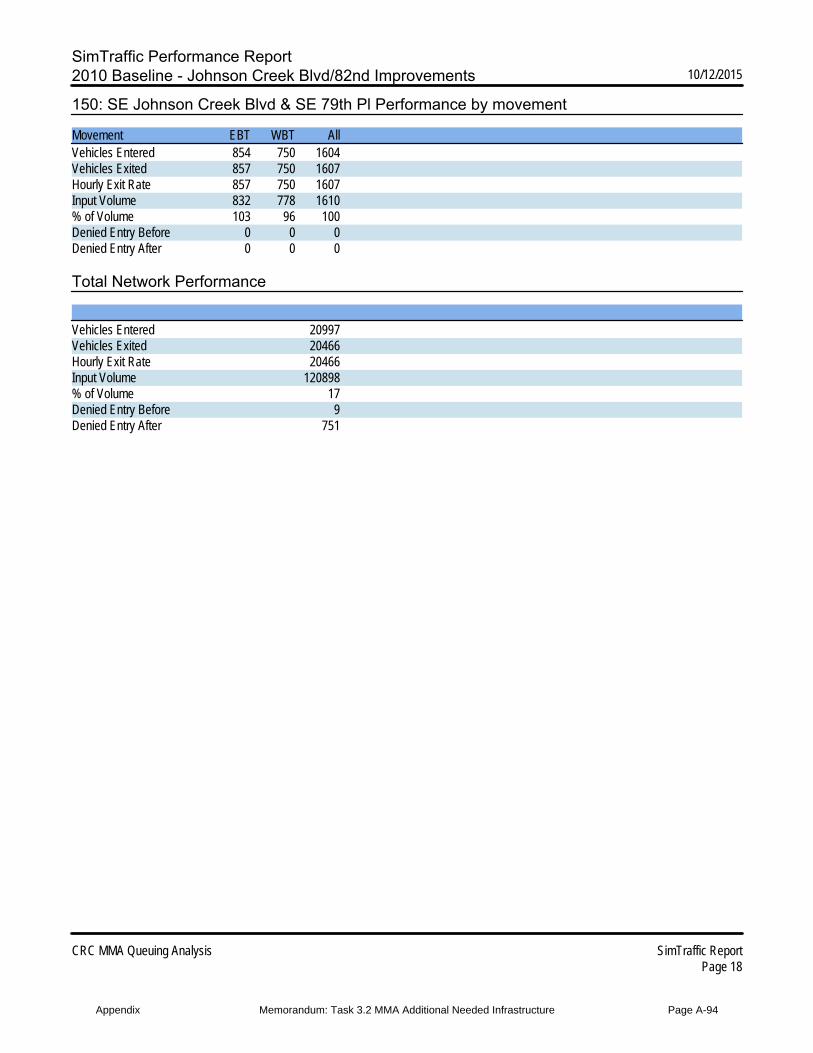
SimTraffic Performance Report2010 Baseline - Johnson Creek Blvd/82nd Improvements 10/12/2015
CRC MMA Queuing Analysis SimTraffic ReportPage 18
150: SE Johnson Creek Blvd & SE 79th Pl Performance by movement
Movement EBT WBT AllVehicles Entered 854 750 1604Vehicles Exited 857 750 1607Hourly Exit Rate 857 750 1607Input Volume 832 778 1610% of Volume 103 96 100Denied Entry Before 0 0 0Denied Entry After 0 0 0
Total Network Performance
Vehicles Entered 20997Vehicles Exited 20466Hourly Exit Rate 20466Input Volume 120898% of Volume 17Denied Entry Before 9Denied Entry After 751
Appendix Memorandum: Task 3.2 MMA Additional Needed Infrastructure Page A-94
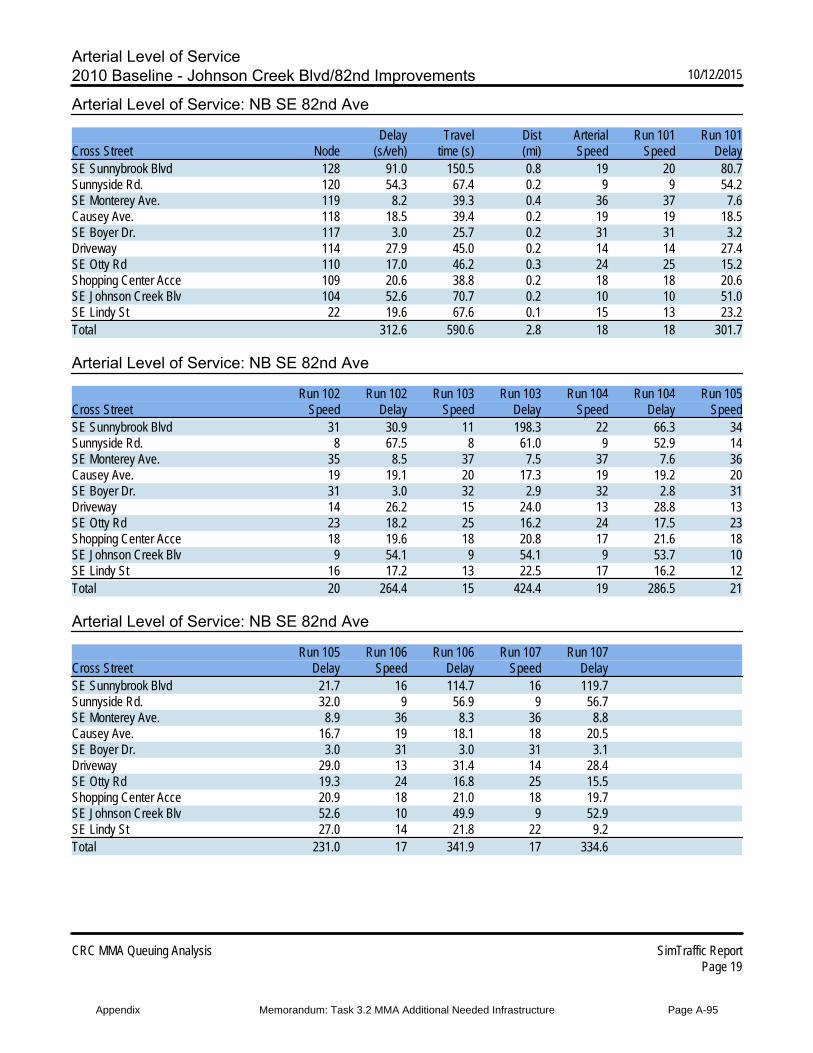
Arterial Level of Service2010 Baseline - Johnson Creek Blvd/82nd Improvements 10/12/2015
CRC MMA Queuing Analysis SimTraffic ReportPage 19
Arterial Level of Service: NB SE 82nd Ave
Delay Travel Dist Arterial Run 101 Run 101Cross Street Node (s/veh) time (s) (mi) Speed Speed DelaySE Sunnybrook Blvd 128 91.0 150.5 0.8 19 20 80.7Sunnyside Rd. 120 54.3 67.4 0.2 9 9 54.2SE Monterey Ave. 119 8.2 39.3 0.4 36 37 7.6Causey Ave. 118 18.5 39.4 0.2 19 19 18.5SE Boyer Dr. 117 3.0 25.7 0.2 31 31 3.2Driveway 114 27.9 45.0 0.2 14 14 27.4SE Otty Rd 110 17.0 46.2 0.3 24 25 15.2Shopping Center Acce 109 20.6 38.8 0.2 18 18 20.6SE Johnson Creek Blv 104 52.6 70.7 0.2 10 10 51.0SE Lindy St 22 19.6 67.6 0.1 15 13 23.2Total 312.6 590.6 2.8 18 18 301.7
Arterial Level of Service: NB SE 82nd Ave
Run 102 Run 102 Run 103 Run 103 Run 104 Run 104 Run 105Cross Street Speed Delay Speed Delay Speed Delay SpeedSE Sunnybrook Blvd 31 30.9 11 198.3 22 66.3 34Sunnyside Rd. 8 67.5 8 61.0 9 52.9 14SE Monterey Ave. 35 8.5 37 7.5 37 7.6 36Causey Ave. 19 19.1 20 17.3 19 19.2 20SE Boyer Dr. 31 3.0 32 2.9 32 2.8 31Driveway 14 26.2 15 24.0 13 28.8 13SE Otty Rd 23 18.2 25 16.2 24 17.5 23Shopping Center Acce 18 19.6 18 20.8 17 21.6 18SE Johnson Creek Blv 9 54.1 9 54.1 9 53.7 10SE Lindy St 16 17.2 13 22.5 17 16.2 12Total 20 264.4 15 424.4 19 286.5 21
Arterial Level of Service: NB SE 82nd Ave
Run 105 Run 106 Run 106 Run 107 Run 107Cross Street Delay Speed Delay Speed DelaySE Sunnybrook Blvd 21.7 16 114.7 16 119.7Sunnyside Rd. 32.0 9 56.9 9 56.7SE Monterey Ave. 8.9 36 8.3 36 8.8Causey Ave. 16.7 19 18.1 18 20.5SE Boyer Dr. 3.0 31 3.0 31 3.1Driveway 29.0 13 31.4 14 28.4SE Otty Rd 19.3 24 16.8 25 15.5Shopping Center Acce 20.9 18 21.0 18 19.7SE Johnson Creek Blv 52.6 10 49.9 9 52.9SE Lindy St 27.0 14 21.8 22 9.2Total 231.0 17 341.9 17 334.6
Appendix Memorandum: Task 3.2 MMA Additional Needed Infrastructure Page A-95
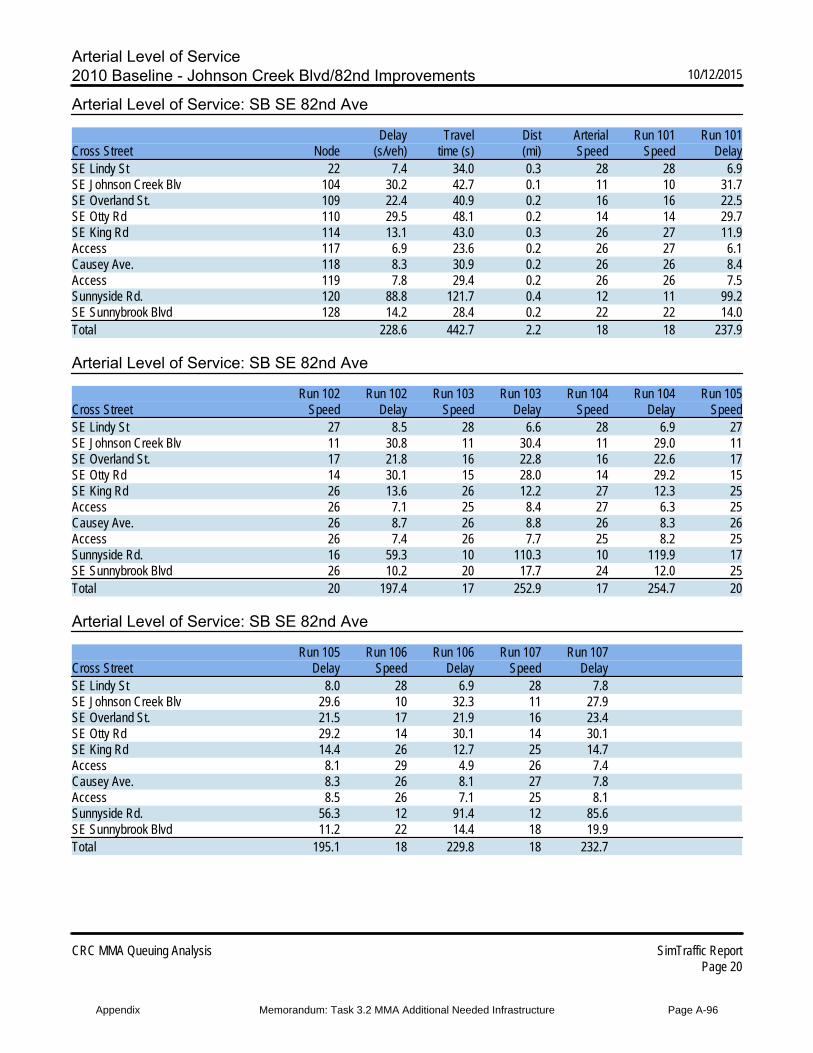
Arterial Level of Service2010 Baseline - Johnson Creek Blvd/82nd Improvements 10/12/2015
CRC MMA Queuing Analysis SimTraffic ReportPage 20
Arterial Level of Service: SB SE 82nd Ave
Delay Travel Dist Arterial Run 101 Run 101Cross Street Node (s/veh) time (s) (mi) Speed Speed DelaySE Lindy St 22 7.4 34.0 0.3 28 28 6.9SE Johnson Creek Blv 104 30.2 42.7 0.1 11 10 31.7SE Overland St. 109 22.4 40.9 0.2 16 16 22.5SE Otty Rd 110 29.5 48.1 0.2 14 14 29.7SE King Rd 114 13.1 43.0 0.3 26 27 11.9Access 117 6.9 23.6 0.2 26 27 6.1Causey Ave. 118 8.3 30.9 0.2 26 26 8.4Access 119 7.8 29.4 0.2 26 26 7.5Sunnyside Rd. 120 88.8 121.7 0.4 12 11 99.2SE Sunnybrook Blvd 128 14.2 28.4 0.2 22 22 14.0Total 228.6 442.7 2.2 18 18 237.9
Arterial Level of Service: SB SE 82nd Ave
Run 102 Run 102 Run 103 Run 103 Run 104 Run 104 Run 105Cross Street Speed Delay Speed Delay Speed Delay SpeedSE Lindy St 27 8.5 28 6.6 28 6.9 27SE Johnson Creek Blv 11 30.8 11 30.4 11 29.0 11SE Overland St. 17 21.8 16 22.8 16 22.6 17SE Otty Rd 14 30.1 15 28.0 14 29.2 15SE King Rd 26 13.6 26 12.2 27 12.3 25Access 26 7.1 25 8.4 27 6.3 25Causey Ave. 26 8.7 26 8.8 26 8.3 26Access 26 7.4 26 7.7 25 8.2 25Sunnyside Rd. 16 59.3 10 110.3 10 119.9 17SE Sunnybrook Blvd 26 10.2 20 17.7 24 12.0 25Total 20 197.4 17 252.9 17 254.7 20
Arterial Level of Service: SB SE 82nd Ave
Run 105 Run 106 Run 106 Run 107 Run 107Cross Street Delay Speed Delay Speed DelaySE Lindy St 8.0 28 6.9 28 7.8SE Johnson Creek Blv 29.6 10 32.3 11 27.9SE Overland St. 21.5 17 21.9 16 23.4SE Otty Rd 29.2 14 30.1 14 30.1SE King Rd 14.4 26 12.7 25 14.7Access 8.1 29 4.9 26 7.4Causey Ave. 8.3 26 8.1 27 7.8Access 8.5 26 7.1 25 8.1Sunnyside Rd. 56.3 12 91.4 12 85.6SE Sunnybrook Blvd 11.2 22 14.4 18 19.9Total 195.1 18 229.8 18 232.7
Appendix Memorandum: Task 3.2 MMA Additional Needed Infrastructure Page A-96
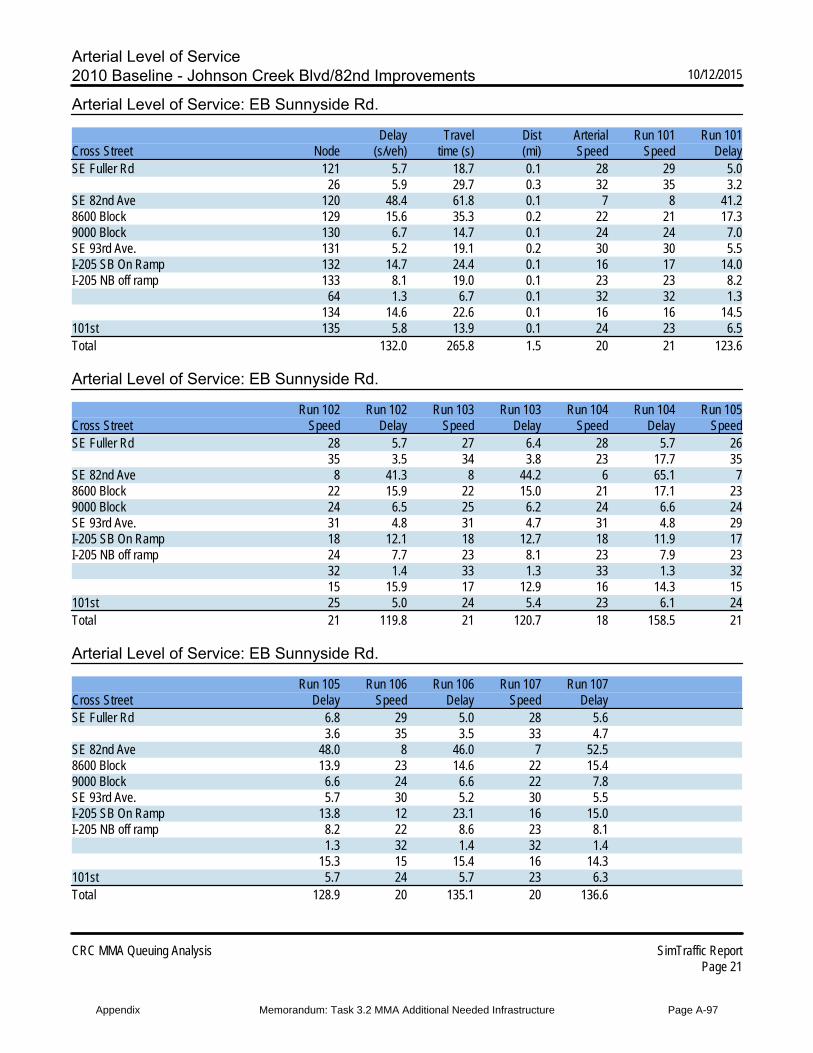
Arterial Level of Service2010 Baseline - Johnson Creek Blvd/82nd Improvements 10/12/2015
CRC MMA Queuing Analysis SimTraffic ReportPage 21
Arterial Level of Service: EB Sunnyside Rd.
Delay Travel Dist Arterial Run 101 Run 101Cross Street Node (s/veh) time (s) (mi) Speed Speed DelaySE Fuller Rd 121 5.7 18.7 0.1 28 29 5.0
26 5.9 29.7 0.3 32 35 3.2SE 82nd Ave 120 48.4 61.8 0.1 7 8 41.28600 Block 129 15.6 35.3 0.2 22 21 17.39000 Block 130 6.7 14.7 0.1 24 24 7.0SE 93rd Ave. 131 5.2 19.1 0.2 30 30 5.5I-205 SB On Ramp 132 14.7 24.4 0.1 16 17 14.0I-205 NB off ramp 133 8.1 19.0 0.1 23 23 8.2
64 1.3 6.7 0.1 32 32 1.3134 14.6 22.6 0.1 16 16 14.5
101st 135 5.8 13.9 0.1 24 23 6.5Total 132.0 265.8 1.5 20 21 123.6
Arterial Level of Service: EB Sunnyside Rd.
Run 102 Run 102 Run 103 Run 103 Run 104 Run 104 Run 105Cross Street Speed Delay Speed Delay Speed Delay SpeedSE Fuller Rd 28 5.7 27 6.4 28 5.7 26
35 3.5 34 3.8 23 17.7 35SE 82nd Ave 8 41.3 8 44.2 6 65.1 78600 Block 22 15.9 22 15.0 21 17.1 239000 Block 24 6.5 25 6.2 24 6.6 24SE 93rd Ave. 31 4.8 31 4.7 31 4.8 29I-205 SB On Ramp 18 12.1 18 12.7 18 11.9 17I-205 NB off ramp 24 7.7 23 8.1 23 7.9 23
32 1.4 33 1.3 33 1.3 3215 15.9 17 12.9 16 14.3 15
101st 25 5.0 24 5.4 23 6.1 24Total 21 119.8 21 120.7 18 158.5 21
Arterial Level of Service: EB Sunnyside Rd.
Run 105 Run 106 Run 106 Run 107 Run 107Cross Street Delay Speed Delay Speed DelaySE Fuller Rd 6.8 29 5.0 28 5.6
3.6 35 3.5 33 4.7SE 82nd Ave 48.0 8 46.0 7 52.58600 Block 13.9 23 14.6 22 15.49000 Block 6.6 24 6.6 22 7.8SE 93rd Ave. 5.7 30 5.2 30 5.5I-205 SB On Ramp 13.8 12 23.1 16 15.0I-205 NB off ramp 8.2 22 8.6 23 8.1
1.3 32 1.4 32 1.415.3 15 15.4 16 14.3
101st 5.7 24 5.7 23 6.3Total 128.9 20 135.1 20 136.6
Appendix Memorandum: Task 3.2 MMA Additional Needed Infrastructure Page A-97
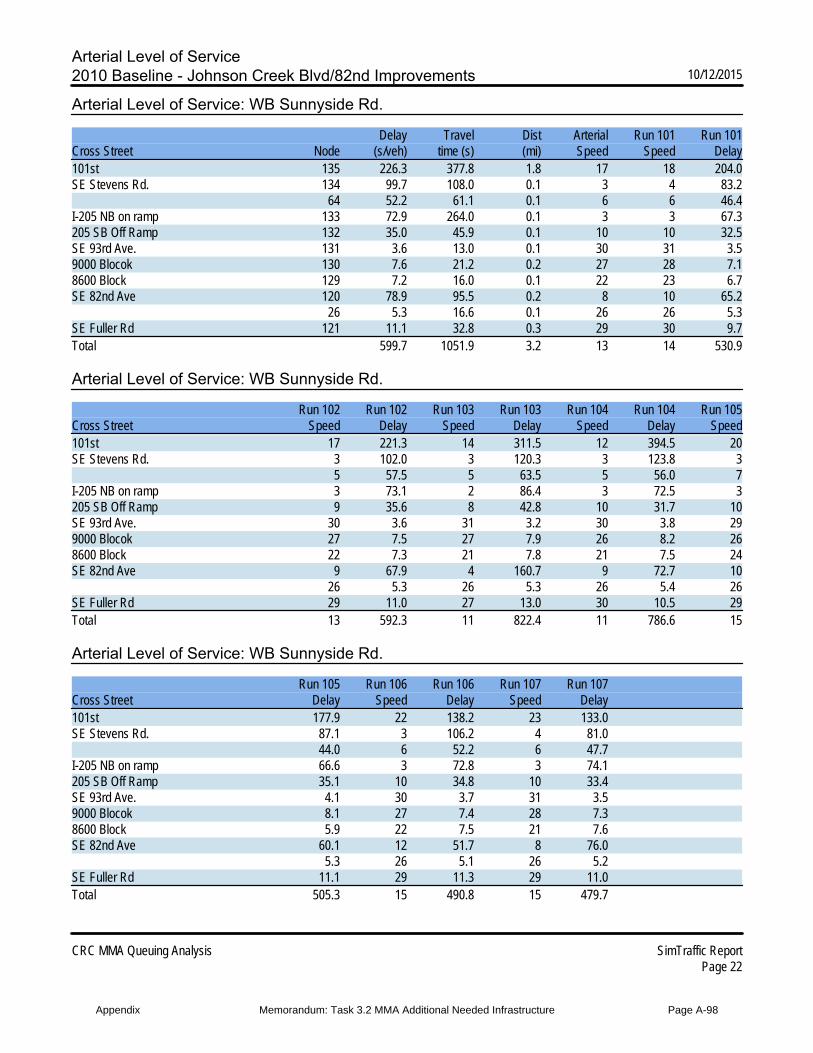
Arterial Level of Service2010 Baseline - Johnson Creek Blvd/82nd Improvements 10/12/2015
CRC MMA Queuing Analysis SimTraffic ReportPage 22
Arterial Level of Service: WB Sunnyside Rd.
Delay Travel Dist Arterial Run 101 Run 101Cross Street Node (s/veh) time (s) (mi) Speed Speed Delay101st 135 226.3 377.8 1.8 17 18 204.0SE Stevens Rd. 134 99.7 108.0 0.1 3 4 83.2
64 52.2 61.1 0.1 6 6 46.4I-205 NB on ramp 133 72.9 264.0 0.1 3 3 67.3205 SB Off Ramp 132 35.0 45.9 0.1 10 10 32.5SE 93rd Ave. 131 3.6 13.0 0.1 30 31 3.59000 Blocok 130 7.6 21.2 0.2 27 28 7.18600 Block 129 7.2 16.0 0.1 22 23 6.7SE 82nd Ave 120 78.9 95.5 0.2 8 10 65.2
26 5.3 16.6 0.1 26 26 5.3SE Fuller Rd 121 11.1 32.8 0.3 29 30 9.7Total 599.7 1051.9 3.2 13 14 530.9
Arterial Level of Service: WB Sunnyside Rd.
Run 102 Run 102 Run 103 Run 103 Run 104 Run 104 Run 105Cross Street Speed Delay Speed Delay Speed Delay Speed101st 17 221.3 14 311.5 12 394.5 20SE Stevens Rd. 3 102.0 3 120.3 3 123.8 3
5 57.5 5 63.5 5 56.0 7I-205 NB on ramp 3 73.1 2 86.4 3 72.5 3205 SB Off Ramp 9 35.6 8 42.8 10 31.7 10SE 93rd Ave. 30 3.6 31 3.2 30 3.8 299000 Blocok 27 7.5 27 7.9 26 8.2 268600 Block 22 7.3 21 7.8 21 7.5 24SE 82nd Ave 9 67.9 4 160.7 9 72.7 10
26 5.3 26 5.3 26 5.4 26SE Fuller Rd 29 11.0 27 13.0 30 10.5 29Total 13 592.3 11 822.4 11 786.6 15
Arterial Level of Service: WB Sunnyside Rd.
Run 105 Run 106 Run 106 Run 107 Run 107Cross Street Delay Speed Delay Speed Delay101st 177.9 22 138.2 23 133.0SE Stevens Rd. 87.1 3 106.2 4 81.0
44.0 6 52.2 6 47.7I-205 NB on ramp 66.6 3 72.8 3 74.1205 SB Off Ramp 35.1 10 34.8 10 33.4SE 93rd Ave. 4.1 30 3.7 31 3.59000 Blocok 8.1 27 7.4 28 7.38600 Block 5.9 22 7.5 21 7.6SE 82nd Ave 60.1 12 51.7 8 76.0
5.3 26 5.1 26 5.2SE Fuller Rd 11.1 29 11.3 29 11.0Total 505.3 15 490.8 15 479.7
Appendix Memorandum: Task 3.2 MMA Additional Needed Infrastructure Page A-98
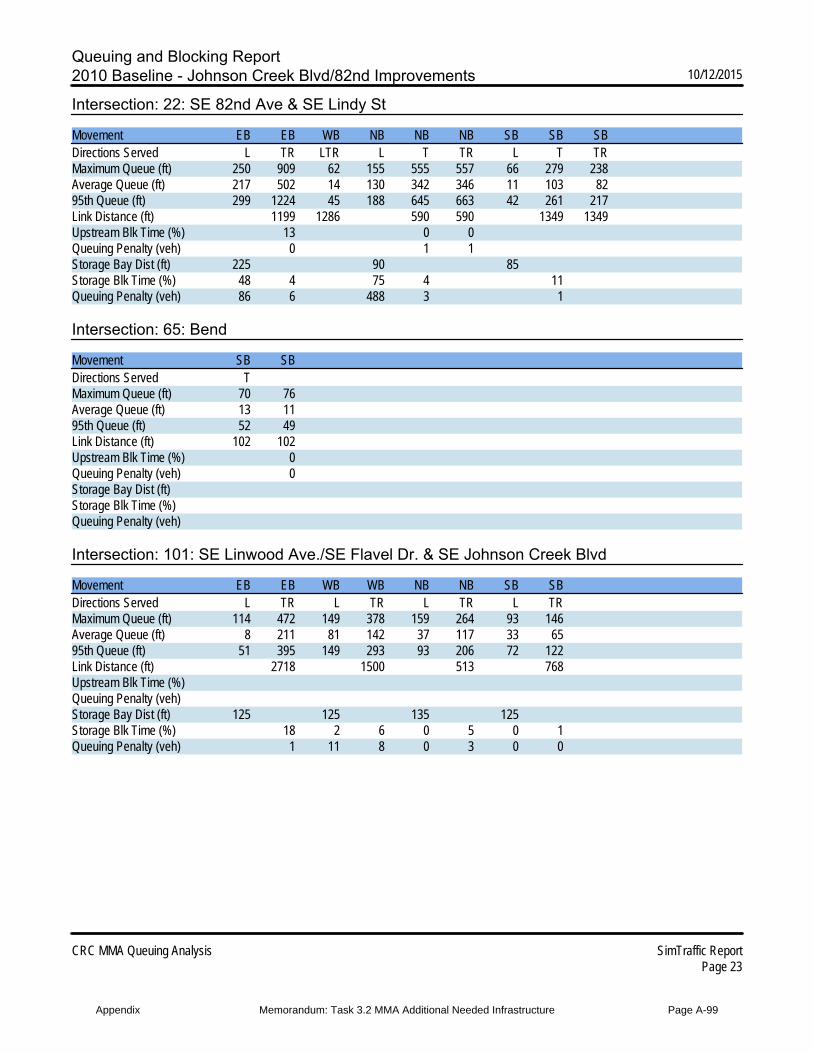
Queuing and Blocking Report2010 Baseline - Johnson Creek Blvd/82nd Improvements 10/12/2015
CRC MMA Queuing Analysis SimTraffic ReportPage 23
Intersection: 22: SE 82nd Ave & SE Lindy St
Movement EB EB WB NB NB NB SB SB SBDirections Served L TR LTR L T TR L T TRMaximum Queue (ft) 250 909 62 155 555 557 66 279 238Average Queue (ft) 217 502 14 130 342 346 11 103 8295th Queue (ft) 299 1224 45 188 645 663 42 261 217Link Distance (ft) 1199 1286 590 590 1349 1349Upstream Blk Time (%) 13 0 0Queuing Penalty (veh) 0 1 1Storage Bay Dist (ft) 225 90 85Storage Blk Time (%) 48 4 75 4 11Queuing Penalty (veh) 86 6 488 3 1
Intersection: 65: Bend
Movement SB SBDirections Served TMaximum Queue (ft) 70 76Average Queue (ft) 13 1195th Queue (ft) 52 49Link Distance (ft) 102 102Upstream Blk Time (%) 0Queuing Penalty (veh) 0Storage Bay Dist (ft)Storage Blk Time (%)Queuing Penalty (veh)
Intersection: 101: SE Linwood Ave./SE Flavel Dr. & SE Johnson Creek Blvd
Movement EB EB WB WB NB NB SB SBDirections Served L TR L TR L TR L TRMaximum Queue (ft) 114 472 149 378 159 264 93 146Average Queue (ft) 8 211 81 142 37 117 33 6595th Queue (ft) 51 395 149 293 93 206 72 122Link Distance (ft) 2718 1500 513 768Upstream Blk Time (%)Queuing Penalty (veh)Storage Bay Dist (ft) 125 125 135 125Storage Blk Time (%) 18 2 6 0 5 0 1Queuing Penalty (veh) 1 11 8 0 3 0 0
Appendix Memorandum: Task 3.2 MMA Additional Needed Infrastructure Page A-99
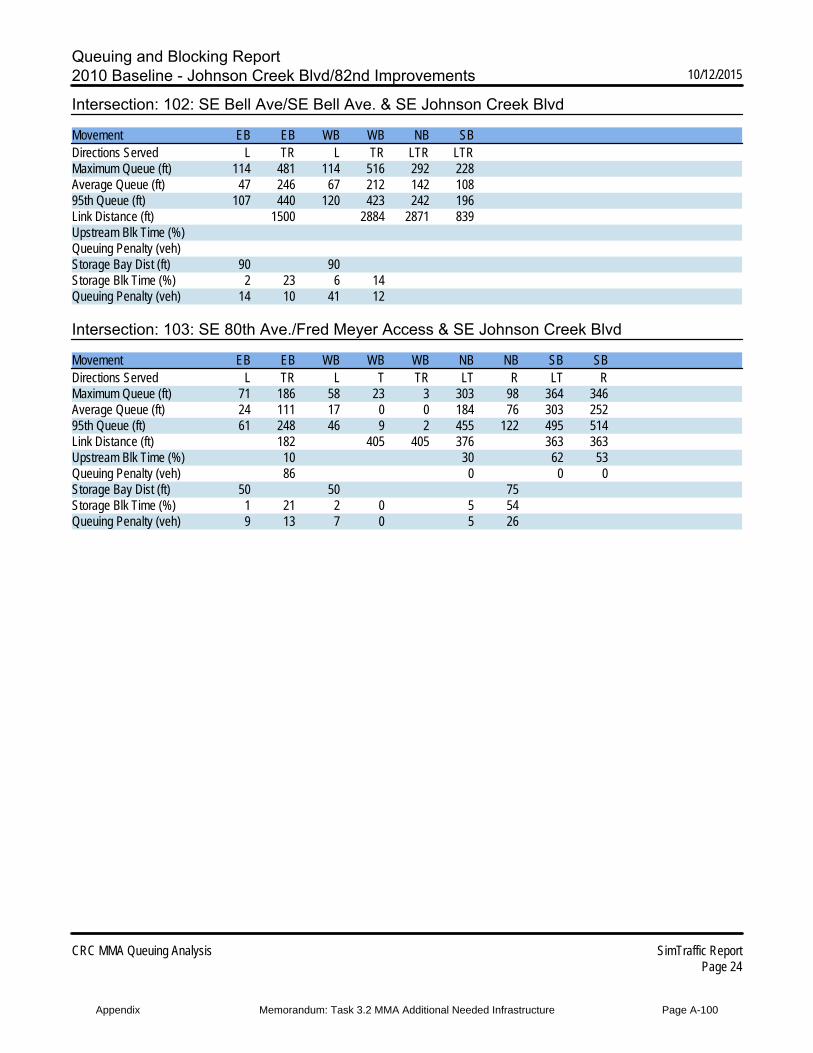
Queuing and Blocking Report2010 Baseline - Johnson Creek Blvd/82nd Improvements 10/12/2015
CRC MMA Queuing Analysis SimTraffic ReportPage 24
Intersection: 102: SE Bell Ave/SE Bell Ave. & SE Johnson Creek Blvd
Movement EB EB WB WB NB SBDirections Served L TR L TR LTR LTRMaximum Queue (ft) 114 481 114 516 292 228Average Queue (ft) 47 246 67 212 142 10895th Queue (ft) 107 440 120 423 242 196Link Distance (ft) 1500 2884 2871 839Upstream Blk Time (%)Queuing Penalty (veh)Storage Bay Dist (ft) 90 90Storage Blk Time (%) 2 23 6 14Queuing Penalty (veh) 14 10 41 12
Intersection: 103: SE 80th Ave./Fred Meyer Access & SE Johnson Creek Blvd
Movement EB EB WB WB WB NB NB SB SBDirections Served L TR L T TR LT R LT RMaximum Queue (ft) 71 186 58 23 3 303 98 364 346Average Queue (ft) 24 111 17 0 0 184 76 303 25295th Queue (ft) 61 248 46 9 2 455 122 495 514Link Distance (ft) 182 405 405 376 363 363Upstream Blk Time (%) 10 30 62 53Queuing Penalty (veh) 86 0 0 0Storage Bay Dist (ft) 50 50 75Storage Blk Time (%) 1 21 2 0 5 54Queuing Penalty (veh) 9 13 7 0 5 26
Appendix Memorandum: Task 3.2 MMA Additional Needed Infrastructure Page A-100
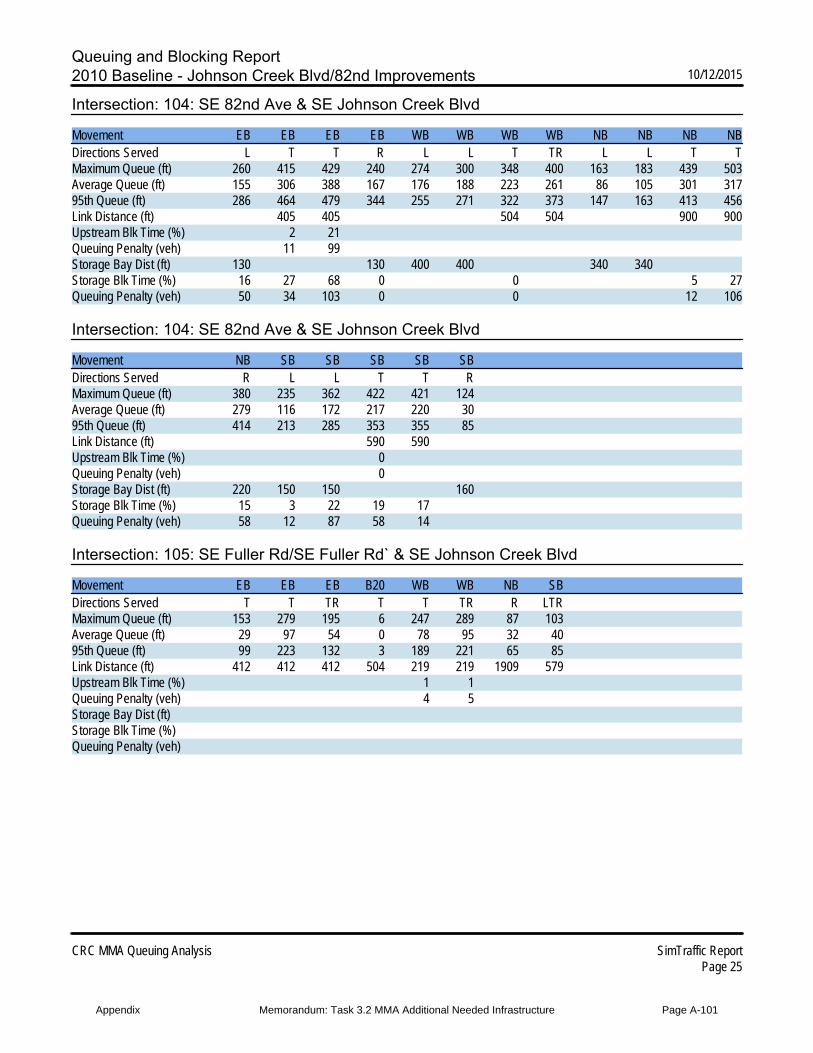
Queuing and Blocking Report2010 Baseline - Johnson Creek Blvd/82nd Improvements 10/12/2015
CRC MMA Queuing Analysis SimTraffic ReportPage 25
Intersection: 104: SE 82nd Ave & SE Johnson Creek Blvd
Movement EB EB EB EB WB WB WB WB NB NB NB NBDirections Served L T T R L L T TR L L T TMaximum Queue (ft) 260 415 429 240 274 300 348 400 163 183 439 503Average Queue (ft) 155 306 388 167 176 188 223 261 86 105 301 31795th Queue (ft) 286 464 479 344 255 271 322 373 147 163 413 456Link Distance (ft) 405 405 504 504 900 900Upstream Blk Time (%) 2 21Queuing Penalty (veh) 11 99Storage Bay Dist (ft) 130 130 400 400 340 340Storage Blk Time (%) 16 27 68 0 0 5 27Queuing Penalty (veh) 50 34 103 0 0 12 106
Intersection: 104: SE 82nd Ave & SE Johnson Creek Blvd
Movement NB SB SB SB SB SBDirections Served R L L T T RMaximum Queue (ft) 380 235 362 422 421 124Average Queue (ft) 279 116 172 217 220 3095th Queue (ft) 414 213 285 353 355 85Link Distance (ft) 590 590Upstream Blk Time (%) 0Queuing Penalty (veh) 0Storage Bay Dist (ft) 220 150 150 160Storage Blk Time (%) 15 3 22 19 17Queuing Penalty (veh) 58 12 87 58 14
Intersection: 105: SE Fuller Rd/SE Fuller Rd` & SE Johnson Creek Blvd
Movement EB EB EB B20 WB WB NB SBDirections Served T T TR T T TR R LTRMaximum Queue (ft) 153 279 195 6 247 289 87 103Average Queue (ft) 29 97 54 0 78 95 32 4095th Queue (ft) 99 223 132 3 189 221 65 85Link Distance (ft) 412 412 412 504 219 219 1909 579Upstream Blk Time (%) 1 1Queuing Penalty (veh) 4 5Storage Bay Dist (ft)Storage Blk Time (%)Queuing Penalty (veh)
Appendix Memorandum: Task 3.2 MMA Additional Needed Infrastructure Page A-101
Queuing and Blocking Report2010 Baseline - Johnson Creek Blvd/82nd Improvements 10/12/2015
CRC MMA Queuing Analysis SimTraffic ReportPage 26
Intersection: 106: I-205 SB On Ramp/I-205 SB Off Ramp & SE Johnson Creek Blvd
Movement EB EB EB WB WB WB SB SBDirections Served T T R L T T L RMaximum Queue (ft) 222 261 153 194 249 200 500 1365Average Queue (ft) 91 183 15 105 128 100 342 66995th Queue (ft) 200 294 75 179 206 172 606 1431Link Distance (ft) 219 219 219 618 618 2112Upstream Blk Time (%) 0 8 0 0Queuing Penalty (veh) 1 41 0 0Storage Bay Dist (ft) 170 400Storage Blk Time (%) 4 3 0 33Queuing Penalty (veh) 11 4 1 90
Intersection: 107: I-205 NB On and Off Ramps & SE Johnson Creek Blvd
Movement EB EB EB WB WB WB NB NB NBDirections Served T T R L T T L L RMaximum Queue (ft) 216 206 223 192 190 111 230 232 137Average Queue (ft) 88 88 112 111 60 44 141 137 5795th Queue (ft) 167 159 191 186 135 98 213 209 104Link Distance (ft) 618 618 618 579 579 2271Upstream Blk Time (%)Queuing Penalty (veh)Storage Bay Dist (ft) 180 450 450Storage Blk Time (%) 2Queuing Penalty (veh) 4
Intersection: 108: SE 92nd Ave & SE Johnson Creek Blvd
Movement EB EB EB WB WB WB NB NB SB SB SBDirections Served L T TR L T TR L TR L T RMaximum Queue (ft) 122 245 229 84 134 71 215 598 144 606 145Average Queue (ft) 64 35 68 29 60 21 157 261 43 439 11095th Queue (ft) 120 138 167 66 116 55 248 528 116 773 192Link Distance (ft) 579 579 854 854 2173 619Upstream Blk Time (%) 27Queuing Penalty (veh) 0Storage Bay Dist (ft) 100 130 190 120 120Storage Blk Time (%) 5 0 1 9 16 0 56 1Queuing Penalty (veh) 5 0 0 31 28 0 111 2
Appendix Memorandum: Task 3.2 MMA Additional Needed Infrastructure Page A-102
Queuing and Blocking Report2010 Baseline - Johnson Creek Blvd/82nd Improvements 10/12/2015
CRC MMA Queuing Analysis SimTraffic ReportPage 27
Intersection: 109: SE 82nd Ave & SE Overland St./Shopping Center Access
Movement EB WB WB NB NB NB NB SB SB SBDirections Served LTR LT R L T T R L T TRMaximum Queue (ft) 220 239 86 178 441 489 200 199 383 401Average Queue (ft) 98 117 31 71 264 298 63 103 218 24195th Queue (ft) 177 207 65 159 411 445 200 196 349 363Link Distance (ft) 495 457 457 956 956 900 900Upstream Blk Time (%)Queuing Penalty (veh)Storage Bay Dist (ft) 100 100 100Storage Blk Time (%) 2 20 23 14 12Queuing Penalty (veh) 13 11 12 77 12
Intersection: 110: SE 82nd Ave & SE Otty Rd
Movement EB EB WB WB WB NB NB NB NB SB SB SBDirections Served L TR L L TR L T T R L T TRMaximum Queue (ft) 55 97 151 159 160 129 465 413 125 170 700 690Average Queue (ft) 17 39 66 82 57 40 179 199 53 148 404 40795th Queue (ft) 46 77 123 134 117 113 338 339 135 201 656 655Link Distance (ft) 914 504 1553 1553 956 956Upstream Blk Time (%)Queuing Penalty (veh)Storage Bay Dist (ft) 150 350 350 105 100 70Storage Blk Time (%) 1 15 20 0 57 19Queuing Penalty (veh) 4 3 34 1 350 30
Intersection: 111: Access/SE Fuller Rd & SE Otty Rd
Movement EB EB WB WB NB NB NB SBDirections Served L TR L TR L T R LTRMaximum Queue (ft) 78 188 73 134 78 49 50 96Average Queue (ft) 13 79 32 67 34 12 18 3895th Queue (ft) 47 147 66 111 64 34 39 77Link Distance (ft) 504 1414 396 1909Upstream Blk Time (%)Queuing Penalty (veh)Storage Bay Dist (ft) 80 140 90 90Storage Blk Time (%) 0 5 0 0Queuing Penalty (veh) 0 1 0 0
Appendix Memorandum: Task 3.2 MMA Additional Needed Infrastructure Page A-103
Queuing and Blocking Report2010 Baseline - Johnson Creek Blvd/82nd Improvements 10/12/2015
CRC MMA Queuing Analysis SimTraffic ReportPage 28
Intersection: 112: SE Bob Schumacher Rd./SE 92nd Ave & SE Otty Rd
Movement EB EB EB WB WB NB NB SB SBDirections Served L T R L TR L TR L TRMaximum Queue (ft) 105 228 132 106 172 199 317 90 512Average Queue (ft) 51 89 35 34 75 79 154 81 22695th Queue (ft) 100 171 83 78 138 157 262 105 421Link Distance (ft) 590 611 4559 2173Upstream Blk Time (%)Queuing Penalty (veh)Storage Bay Dist (ft) 80 190 100 190 65Storage Blk Time (%) 3 10 0 1 4 0 4 30 20Queuing Penalty (veh) 9 18 0 1 2 0 4 127 34
Intersection: 114: SE 82nd Ave & SE King Rd/Driveway
Movement EB EB WB WB NB NB NB NB SB SB SB SBDirections Served LT TR LT TR L T T R L T T RMaximum Queue (ft) 130 127 96 47 175 608 595 154 110 308 337 115Average Queue (ft) 115 78 34 15 162 373 356 10 41 116 124 6495th Queue (ft) 124 132 76 38 208 569 551 70 94 237 266 130Link Distance (ft) 111 111 399 399 829 829 1553 1553Upstream Blk Time (%) 44 6Queuing Penalty (veh) 114 15Storage Bay Dist (ft) 150 150 90 90Storage Blk Time (%) 37 12 20 0 2 13 11 1Queuing Penalty (veh) 196 26 2 0 11 5 37 5
Intersection: 115: SE Fuller Rd/Driveway & SE King Rd
Movement EB EB WB WB NB SBDirections Served LT TR LT TR LTR LTRMaximum Queue (ft) 288 240 75 21 181 127Average Queue (ft) 126 37 29 1 66 4395th Queue (ft) 250 153 65 15 149 96Link Distance (ft) 1161 1161 111 111 223 220Upstream Blk Time (%) 0 1Queuing Penalty (veh) 0 0Storage Bay Dist (ft)Storage Blk Time (%)Queuing Penalty (veh)
Appendix Memorandum: Task 3.2 MMA Additional Needed Infrastructure Page A-104
Queuing and Blocking Report2010 Baseline - Johnson Creek Blvd/82nd Improvements 10/12/2015
CRC MMA Queuing Analysis SimTraffic ReportPage 29
Intersection: 116: SE King Rd & SE Bell Ave
Movement EB EB WB SBDirections Served L T TR LRMaximum Queue (ft) 119 199 236 188Average Queue (ft) 63 71 96 8195th Queue (ft) 107 149 178 146Link Distance (ft) 588 476 2871Upstream Blk Time (%)Queuing Penalty (veh)Storage Bay Dist (ft) 100Storage Blk Time (%) 2 2Queuing Penalty (veh) 9 2
Intersection: 117: SE 82nd Ave & Access/SE Boyer Dr.
Movement EB WB NB NB NB SB SB SBDirections Served LTR LT L T T L T TRMaximum Queue (ft) 129 133 50 135 132 50 244 257Average Queue (ft) 57 51 13 56 50 7 76 7295th Queue (ft) 110 105 39 109 106 29 186 184Link Distance (ft) 196 676 1111 1111 829 829Upstream Blk Time (%)Queuing Penalty (veh)Storage Bay Dist (ft) 300 270Storage Blk Time (%) 0Queuing Penalty (veh) 0
Intersection: 118: SE 82nd Ave & Causey Ave.
Movement EB EB WB WB WB NB NB NB NB SB SB SBDirections Served L TR L T R L T T R L T TRMaximum Queue (ft) 194 376 228 282 152 164 246 262 72 207 160 140Average Queue (ft) 124 178 116 91 44 82 151 159 24 92 51 5095th Queue (ft) 209 318 195 197 100 146 228 243 57 167 117 108Link Distance (ft) 640 1569 1037 1037 1111 1111Upstream Blk Time (%)Queuing Penalty (veh)Storage Bay Dist (ft) 115 90 90 200 200 200Storage Blk Time (%) 16 27 29 11 1 0 4 5 0 0Queuing Penalty (veh) 33 35 58 28 2 0 4 4 2 0
Appendix Memorandum: Task 3.2 MMA Additional Needed Infrastructure Page A-105
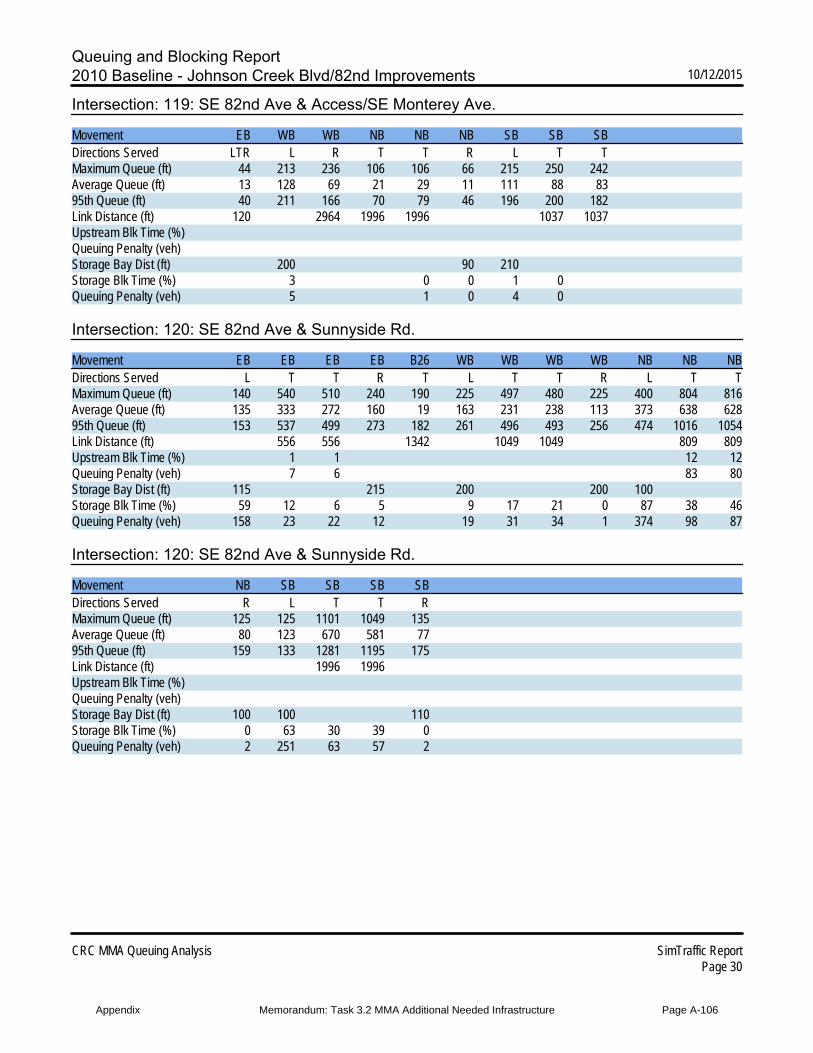
Queuing and Blocking Report2010 Baseline - Johnson Creek Blvd/82nd Improvements 10/12/2015
CRC MMA Queuing Analysis SimTraffic ReportPage 30
Intersection: 119: SE 82nd Ave & Access/SE Monterey Ave.
Movement EB WB WB NB NB NB SB SB SBDirections Served LTR L R T T R L T TMaximum Queue (ft) 44 213 236 106 106 66 215 250 242Average Queue (ft) 13 128 69 21 29 11 111 88 8395th Queue (ft) 40 211 166 70 79 46 196 200 182Link Distance (ft) 120 2964 1996 1996 1037 1037Upstream Blk Time (%)Queuing Penalty (veh)Storage Bay Dist (ft) 200 90 210Storage Blk Time (%) 3 0 0 1 0Queuing Penalty (veh) 5 1 0 4 0
Intersection: 120: SE 82nd Ave & Sunnyside Rd.
Movement EB EB EB EB B26 WB WB WB WB NB NB NBDirections Served L T T R T L T T R L T TMaximum Queue (ft) 140 540 510 240 190 225 497 480 225 400 804 816Average Queue (ft) 135 333 272 160 19 163 231 238 113 373 638 62895th Queue (ft) 153 537 499 273 182 261 496 493 256 474 1016 1054Link Distance (ft) 556 556 1342 1049 1049 809 809Upstream Blk Time (%) 1 1 12 12Queuing Penalty (veh) 7 6 83 80Storage Bay Dist (ft) 115 215 200 200 100Storage Blk Time (%) 59 12 6 5 9 17 21 0 87 38 46Queuing Penalty (veh) 158 23 22 12 19 31 34 1 374 98 87
Intersection: 120: SE 82nd Ave & Sunnyside Rd.
Movement NB SB SB SB SBDirections Served R L T T RMaximum Queue (ft) 125 125 1101 1049 135Average Queue (ft) 80 123 670 581 7795th Queue (ft) 159 133 1281 1195 175Link Distance (ft) 1996 1996Upstream Blk Time (%)Queuing Penalty (veh)Storage Bay Dist (ft) 100 100 110Storage Blk Time (%) 0 63 30 39 0Queuing Penalty (veh) 2 251 63 57 2
Appendix Memorandum: Task 3.2 MMA Additional Needed Infrastructure Page A-106
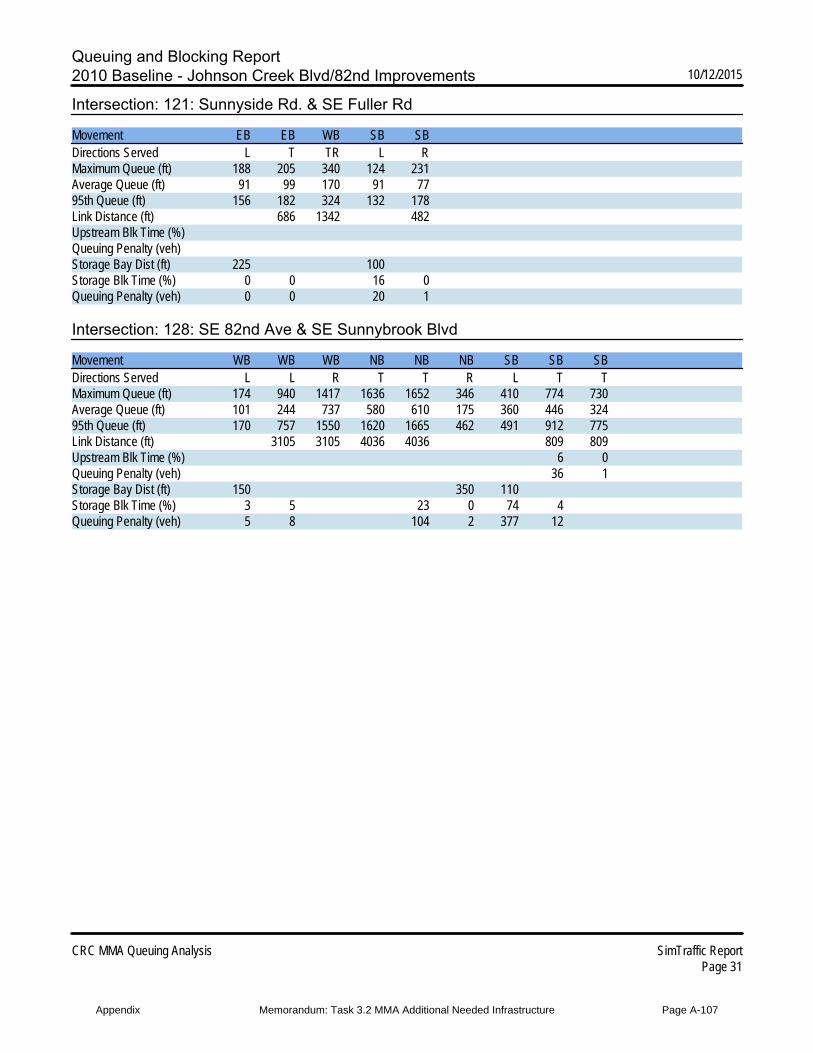
Queuing and Blocking Report2010 Baseline - Johnson Creek Blvd/82nd Improvements 10/12/2015
CRC MMA Queuing Analysis SimTraffic ReportPage 31
Intersection: 121: Sunnyside Rd. & SE Fuller Rd
Movement EB EB WB SB SBDirections Served L T TR L RMaximum Queue (ft) 188 205 340 124 231Average Queue (ft) 91 99 170 91 7795th Queue (ft) 156 182 324 132 178Link Distance (ft) 686 1342 482Upstream Blk Time (%)Queuing Penalty (veh)Storage Bay Dist (ft) 225 100Storage Blk Time (%) 0 0 16 0Queuing Penalty (veh) 0 0 20 1
Intersection: 128: SE 82nd Ave & SE Sunnybrook Blvd
Movement WB WB WB NB NB NB SB SB SBDirections Served L L R T T R L T TMaximum Queue (ft) 174 940 1417 1636 1652 346 410 774 730Average Queue (ft) 101 244 737 580 610 175 360 446 32495th Queue (ft) 170 757 1550 1620 1665 462 491 912 775Link Distance (ft) 3105 3105 4036 4036 809 809Upstream Blk Time (%) 6 0Queuing Penalty (veh) 36 1Storage Bay Dist (ft) 150 350 110Storage Blk Time (%) 3 5 23 0 74 4Queuing Penalty (veh) 5 8 104 2 377 12
Appendix Memorandum: Task 3.2 MMA Additional Needed Infrastructure Page A-107
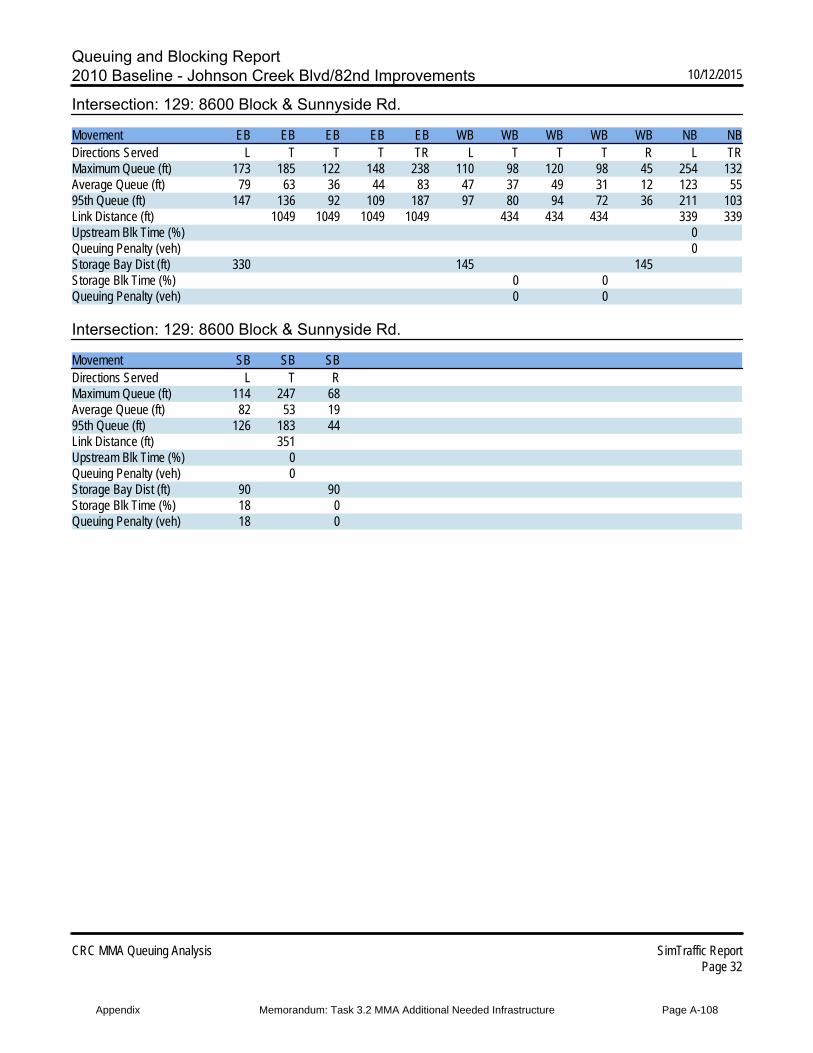
Queuing and Blocking Report2010 Baseline - Johnson Creek Blvd/82nd Improvements 10/12/2015
CRC MMA Queuing Analysis SimTraffic ReportPage 32
Intersection: 129: 8600 Block & Sunnyside Rd.
Movement EB EB EB EB EB WB WB WB WB WB NB NBDirections Served L T T T TR L T T T R L TRMaximum Queue (ft) 173 185 122 148 238 110 98 120 98 45 254 132Average Queue (ft) 79 63 36 44 83 47 37 49 31 12 123 5595th Queue (ft) 147 136 92 109 187 97 80 94 72 36 211 103Link Distance (ft) 1049 1049 1049 1049 434 434 434 339 339Upstream Blk Time (%) 0Queuing Penalty (veh) 0Storage Bay Dist (ft) 330 145 145Storage Blk Time (%) 0 0Queuing Penalty (veh) 0 0
Intersection: 129: 8600 Block & Sunnyside Rd.
Movement SB SB SBDirections Served L T RMaximum Queue (ft) 114 247 68Average Queue (ft) 82 53 1995th Queue (ft) 126 183 44Link Distance (ft) 351Upstream Blk Time (%) 0Queuing Penalty (veh) 0Storage Bay Dist (ft) 90 90Storage Blk Time (%) 18 0Queuing Penalty (veh) 18 0
Appendix Memorandum: Task 3.2 MMA Additional Needed Infrastructure Page A-108
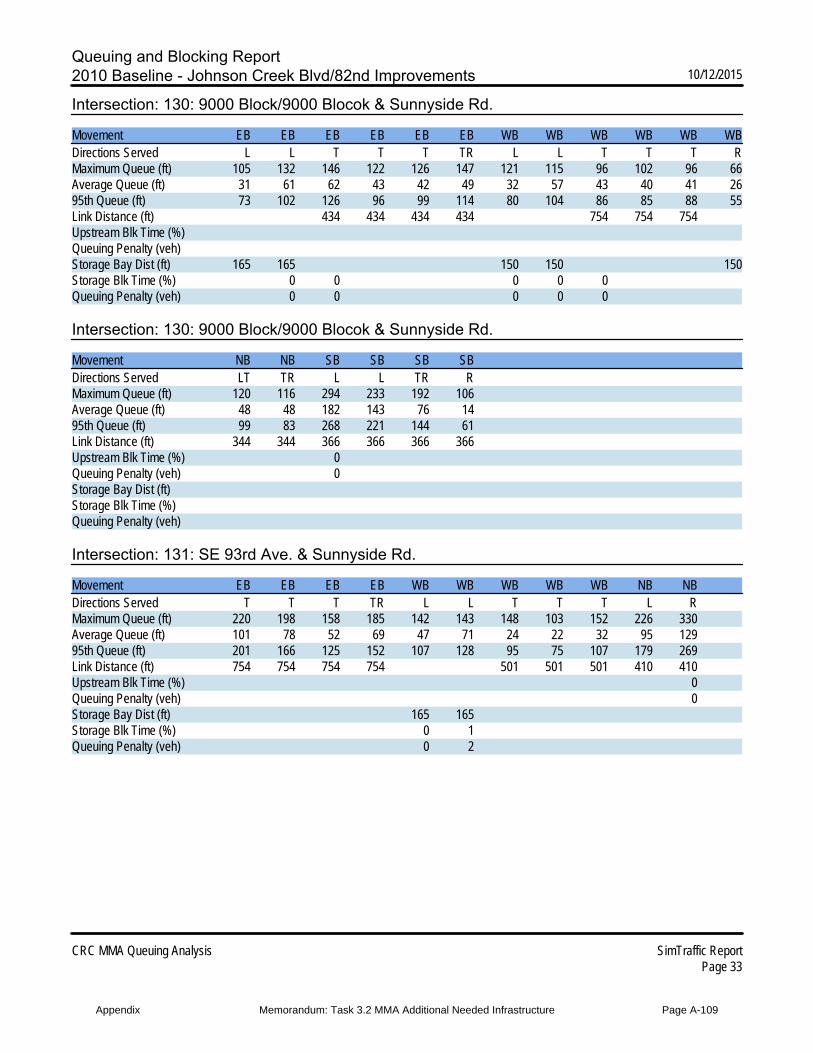
Queuing and Blocking Report2010 Baseline - Johnson Creek Blvd/82nd Improvements 10/12/2015
CRC MMA Queuing Analysis SimTraffic ReportPage 33
Intersection: 130: 9000 Block/9000 Blocok & Sunnyside Rd.
Movement EB EB EB EB EB EB WB WB WB WB WB WBDirections Served L L T T T TR L L T T T RMaximum Queue (ft) 105 132 146 122 126 147 121 115 96 102 96 66Average Queue (ft) 31 61 62 43 42 49 32 57 43 40 41 2695th Queue (ft) 73 102 126 96 99 114 80 104 86 85 88 55Link Distance (ft) 434 434 434 434 754 754 754Upstream Blk Time (%)Queuing Penalty (veh)Storage Bay Dist (ft) 165 165 150 150 150Storage Blk Time (%) 0 0 0 0 0Queuing Penalty (veh) 0 0 0 0 0
Intersection: 130: 9000 Block/9000 Blocok & Sunnyside Rd.
Movement NB NB SB SB SB SBDirections Served LT TR L L TR RMaximum Queue (ft) 120 116 294 233 192 106Average Queue (ft) 48 48 182 143 76 1495th Queue (ft) 99 83 268 221 144 61Link Distance (ft) 344 344 366 366 366 366Upstream Blk Time (%) 0Queuing Penalty (veh) 0Storage Bay Dist (ft)Storage Blk Time (%)Queuing Penalty (veh)
Intersection: 131: SE 93rd Ave. & Sunnyside Rd.
Movement EB EB EB EB WB WB WB WB WB NB NBDirections Served T T T TR L L T T T L RMaximum Queue (ft) 220 198 158 185 142 143 148 103 152 226 330Average Queue (ft) 101 78 52 69 47 71 24 22 32 95 12995th Queue (ft) 201 166 125 152 107 128 95 75 107 179 269Link Distance (ft) 754 754 754 754 501 501 501 410 410Upstream Blk Time (%) 0Queuing Penalty (veh) 0Storage Bay Dist (ft) 165 165Storage Blk Time (%) 0 1Queuing Penalty (veh) 0 2
Appendix Memorandum: Task 3.2 MMA Additional Needed Infrastructure Page A-109
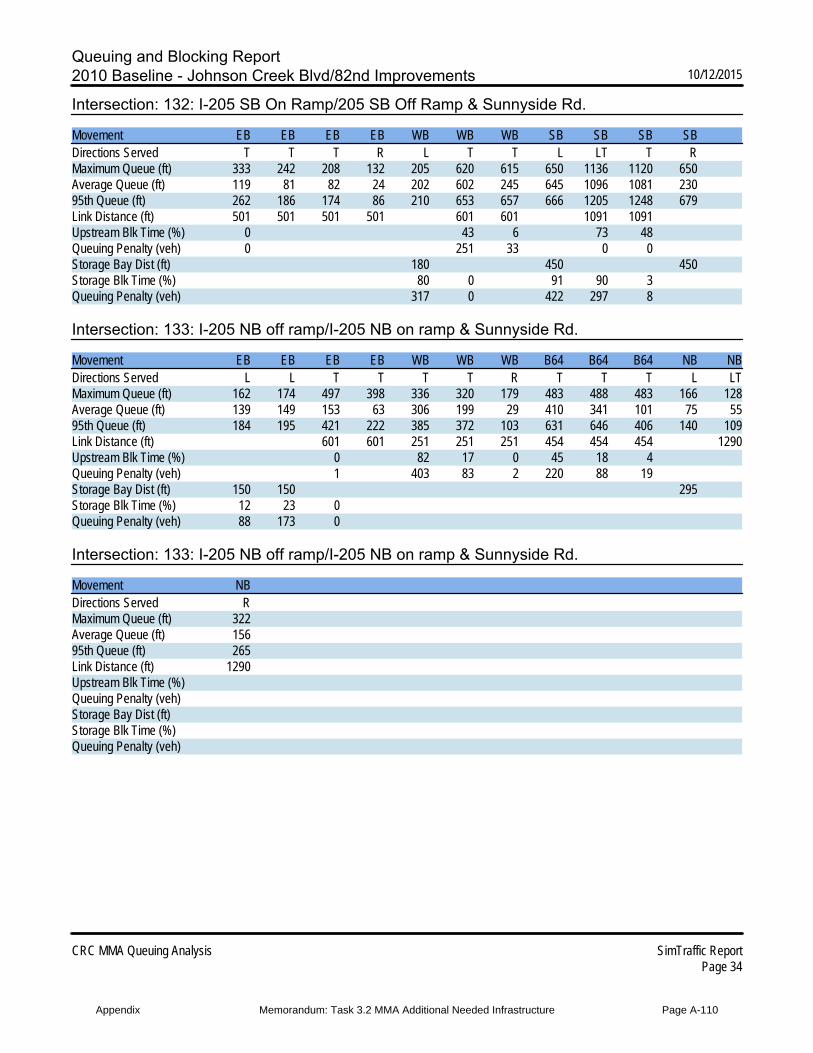
Queuing and Blocking Report2010 Baseline - Johnson Creek Blvd/82nd Improvements 10/12/2015
CRC MMA Queuing Analysis SimTraffic ReportPage 34
Intersection: 132: I-205 SB On Ramp/205 SB Off Ramp & Sunnyside Rd.
Movement EB EB EB EB WB WB WB SB SB SB SBDirections Served T T T R L T T L LT T RMaximum Queue (ft) 333 242 208 132 205 620 615 650 1136 1120 650Average Queue (ft) 119 81 82 24 202 602 245 645 1096 1081 23095th Queue (ft) 262 186 174 86 210 653 657 666 1205 1248 679Link Distance (ft) 501 501 501 501 601 601 1091 1091Upstream Blk Time (%) 0 43 6 73 48Queuing Penalty (veh) 0 251 33 0 0Storage Bay Dist (ft) 180 450 450Storage Blk Time (%) 80 0 91 90 3Queuing Penalty (veh) 317 0 422 297 8
Intersection: 133: I-205 NB off ramp/I-205 NB on ramp & Sunnyside Rd.
Movement EB EB EB EB WB WB WB B64 B64 B64 NB NBDirections Served L L T T T T R T T T L LTMaximum Queue (ft) 162 174 497 398 336 320 179 483 488 483 166 128Average Queue (ft) 139 149 153 63 306 199 29 410 341 101 75 5595th Queue (ft) 184 195 421 222 385 372 103 631 646 406 140 109Link Distance (ft) 601 601 251 251 251 454 454 454 1290Upstream Blk Time (%) 0 82 17 0 45 18 4Queuing Penalty (veh) 1 403 83 2 220 88 19Storage Bay Dist (ft) 150 150 295Storage Blk Time (%) 12 23 0Queuing Penalty (veh) 88 173 0
Intersection: 133: I-205 NB off ramp/I-205 NB on ramp & Sunnyside Rd.
Movement NBDirections Served RMaximum Queue (ft) 322Average Queue (ft) 15695th Queue (ft) 265Link Distance (ft) 1290Upstream Blk Time (%)Queuing Penalty (veh)Storage Bay Dist (ft)Storage Blk Time (%)Queuing Penalty (veh)
Appendix Memorandum: Task 3.2 MMA Additional Needed Infrastructure Page A-110
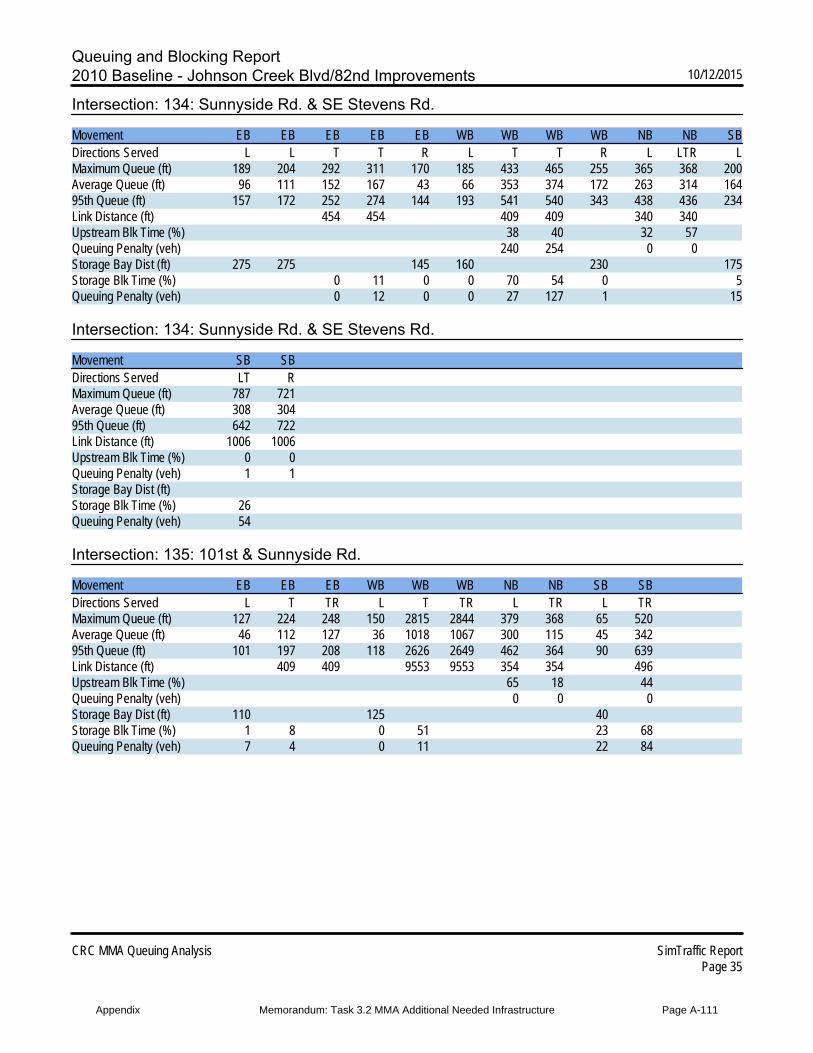
Queuing and Blocking Report2010 Baseline - Johnson Creek Blvd/82nd Improvements 10/12/2015
CRC MMA Queuing Analysis SimTraffic ReportPage 35
Intersection: 134: Sunnyside Rd. & SE Stevens Rd.
Movement EB EB EB EB EB WB WB WB WB NB NB SBDirections Served L L T T R L T T R L LTR LMaximum Queue (ft) 189 204 292 311 170 185 433 465 255 365 368 200Average Queue (ft) 96 111 152 167 43 66 353 374 172 263 314 16495th Queue (ft) 157 172 252 274 144 193 541 540 343 438 436 234Link Distance (ft) 454 454 409 409 340 340Upstream Blk Time (%) 38 40 32 57Queuing Penalty (veh) 240 254 0 0Storage Bay Dist (ft) 275 275 145 160 230 175Storage Blk Time (%) 0 11 0 0 70 54 0 5Queuing Penalty (veh) 0 12 0 0 27 127 1 15
Intersection: 134: Sunnyside Rd. & SE Stevens Rd.
Movement SB SBDirections Served LT RMaximum Queue (ft) 787 721Average Queue (ft) 308 30495th Queue (ft) 642 722Link Distance (ft) 1006 1006Upstream Blk Time (%) 0 0Queuing Penalty (veh) 1 1Storage Bay Dist (ft)Storage Blk Time (%) 26Queuing Penalty (veh) 54
Intersection: 135: 101st & Sunnyside Rd.
Movement EB EB EB WB WB WB NB NB SB SBDirections Served L T TR L T TR L TR L TRMaximum Queue (ft) 127 224 248 150 2815 2844 379 368 65 520Average Queue (ft) 46 112 127 36 1018 1067 300 115 45 34295th Queue (ft) 101 197 208 118 2626 2649 462 364 90 639Link Distance (ft) 409 409 9553 9553 354 354 496Upstream Blk Time (%) 65 18 44Queuing Penalty (veh) 0 0 0Storage Bay Dist (ft) 110 125 40Storage Blk Time (%) 1 8 0 51 23 68Queuing Penalty (veh) 7 4 0 11 22 84
Appendix Memorandum: Task 3.2 MMA Additional Needed Infrastructure Page A-111
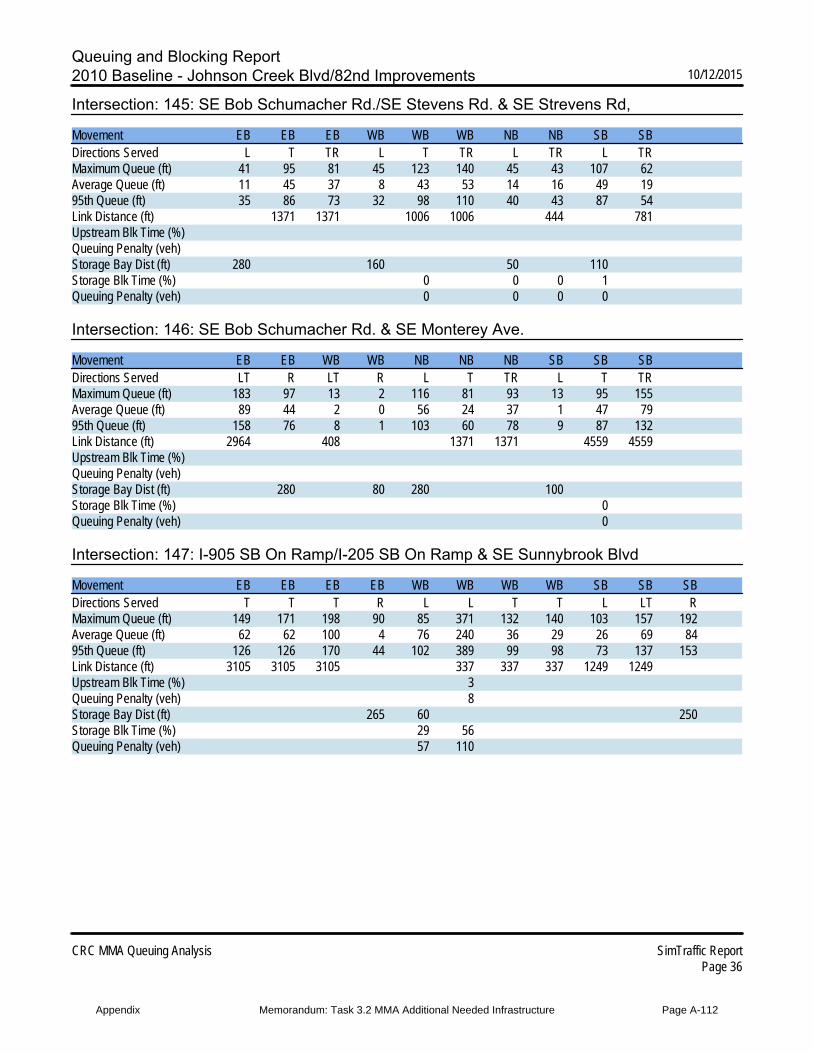
Queuing and Blocking Report2010 Baseline - Johnson Creek Blvd/82nd Improvements 10/12/2015
CRC MMA Queuing Analysis SimTraffic ReportPage 36
Intersection: 145: SE Bob Schumacher Rd./SE Stevens Rd. & SE Strevens Rd,
Movement EB EB EB WB WB WB NB NB SB SBDirections Served L T TR L T TR L TR L TRMaximum Queue (ft) 41 95 81 45 123 140 45 43 107 62Average Queue (ft) 11 45 37 8 43 53 14 16 49 1995th Queue (ft) 35 86 73 32 98 110 40 43 87 54Link Distance (ft) 1371 1371 1006 1006 444 781Upstream Blk Time (%)Queuing Penalty (veh)Storage Bay Dist (ft) 280 160 50 110Storage Blk Time (%) 0 0 0 1Queuing Penalty (veh) 0 0 0 0
Intersection: 146: SE Bob Schumacher Rd. & SE Monterey Ave.
Movement EB EB WB WB NB NB NB SB SB SBDirections Served LT R LT R L T TR L T TRMaximum Queue (ft) 183 97 13 2 116 81 93 13 95 155Average Queue (ft) 89 44 2 0 56 24 37 1 47 7995th Queue (ft) 158 76 8 1 103 60 78 9 87 132Link Distance (ft) 2964 408 1371 1371 4559 4559Upstream Blk Time (%)Queuing Penalty (veh)Storage Bay Dist (ft) 280 80 280 100Storage Blk Time (%) 0Queuing Penalty (veh) 0
Intersection: 147: I-905 SB On Ramp/I-205 SB On Ramp & SE Sunnybrook Blvd
Movement EB EB EB EB WB WB WB WB SB SB SBDirections Served T T T R L L T T L LT RMaximum Queue (ft) 149 171 198 90 85 371 132 140 103 157 192Average Queue (ft) 62 62 100 4 76 240 36 29 26 69 8495th Queue (ft) 126 126 170 44 102 389 99 98 73 137 153Link Distance (ft) 3105 3105 3105 337 337 337 1249 1249Upstream Blk Time (%) 3Queuing Penalty (veh) 8Storage Bay Dist (ft) 265 60 250Storage Blk Time (%) 29 56Queuing Penalty (veh) 57 110
Appendix Memorandum: Task 3.2 MMA Additional Needed Infrastructure Page A-112
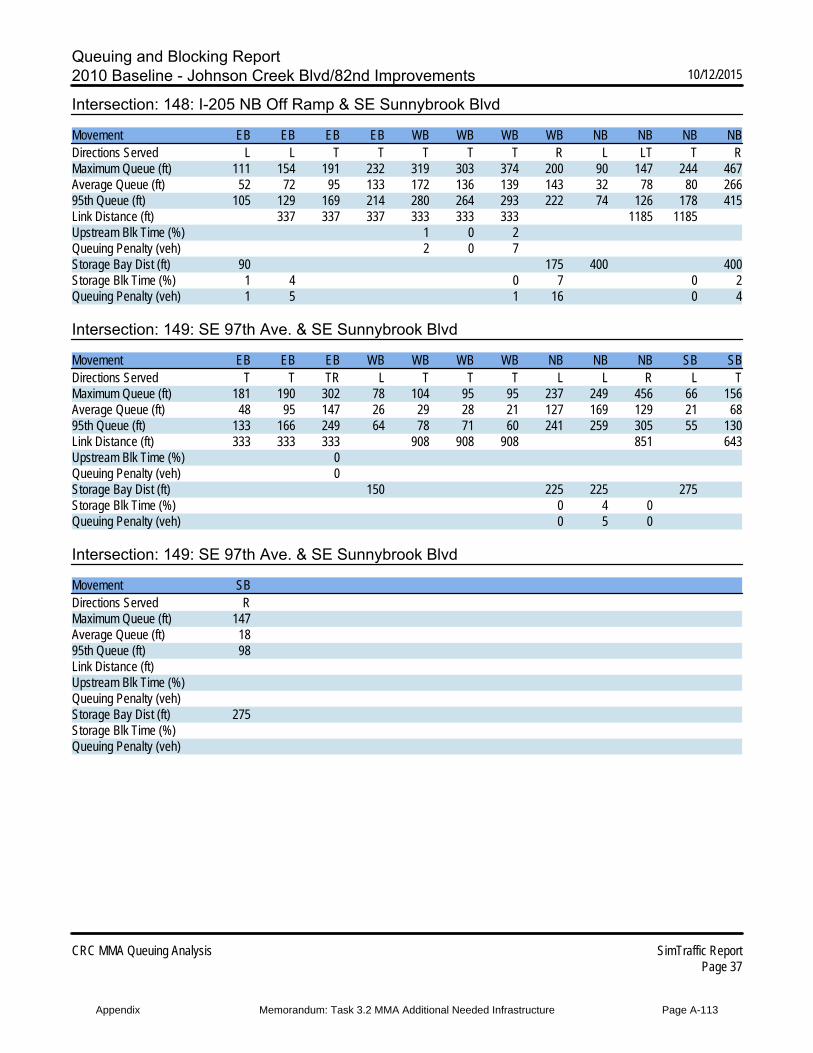
Queuing and Blocking Report2010 Baseline - Johnson Creek Blvd/82nd Improvements 10/12/2015
CRC MMA Queuing Analysis SimTraffic ReportPage 37
Intersection: 148: I-205 NB Off Ramp & SE Sunnybrook Blvd
Movement EB EB EB EB WB WB WB WB NB NB NB NBDirections Served L L T T T T T R L LT T RMaximum Queue (ft) 111 154 191 232 319 303 374 200 90 147 244 467Average Queue (ft) 52 72 95 133 172 136 139 143 32 78 80 26695th Queue (ft) 105 129 169 214 280 264 293 222 74 126 178 415Link Distance (ft) 337 337 337 333 333 333 1185 1185Upstream Blk Time (%) 1 0 2Queuing Penalty (veh) 2 0 7Storage Bay Dist (ft) 90 175 400 400Storage Blk Time (%) 1 4 0 7 0 2Queuing Penalty (veh) 1 5 1 16 0 4
Intersection: 149: SE 97th Ave. & SE Sunnybrook Blvd
Movement EB EB EB WB WB WB WB NB NB NB SB SBDirections Served T T TR L T T T L L R L TMaximum Queue (ft) 181 190 302 78 104 95 95 237 249 456 66 156Average Queue (ft) 48 95 147 26 29 28 21 127 169 129 21 6895th Queue (ft) 133 166 249 64 78 71 60 241 259 305 55 130Link Distance (ft) 333 333 333 908 908 908 851 643Upstream Blk Time (%) 0Queuing Penalty (veh) 0Storage Bay Dist (ft) 150 225 225 275Storage Blk Time (%) 0 4 0Queuing Penalty (veh) 0 5 0
Intersection: 149: SE 97th Ave. & SE Sunnybrook Blvd
Movement SBDirections Served RMaximum Queue (ft) 147Average Queue (ft) 1895th Queue (ft) 98Link Distance (ft)Upstream Blk Time (%)Queuing Penalty (veh)Storage Bay Dist (ft) 275Storage Blk Time (%)Queuing Penalty (veh)
Appendix Memorandum: Task 3.2 MMA Additional Needed Infrastructure Page A-113
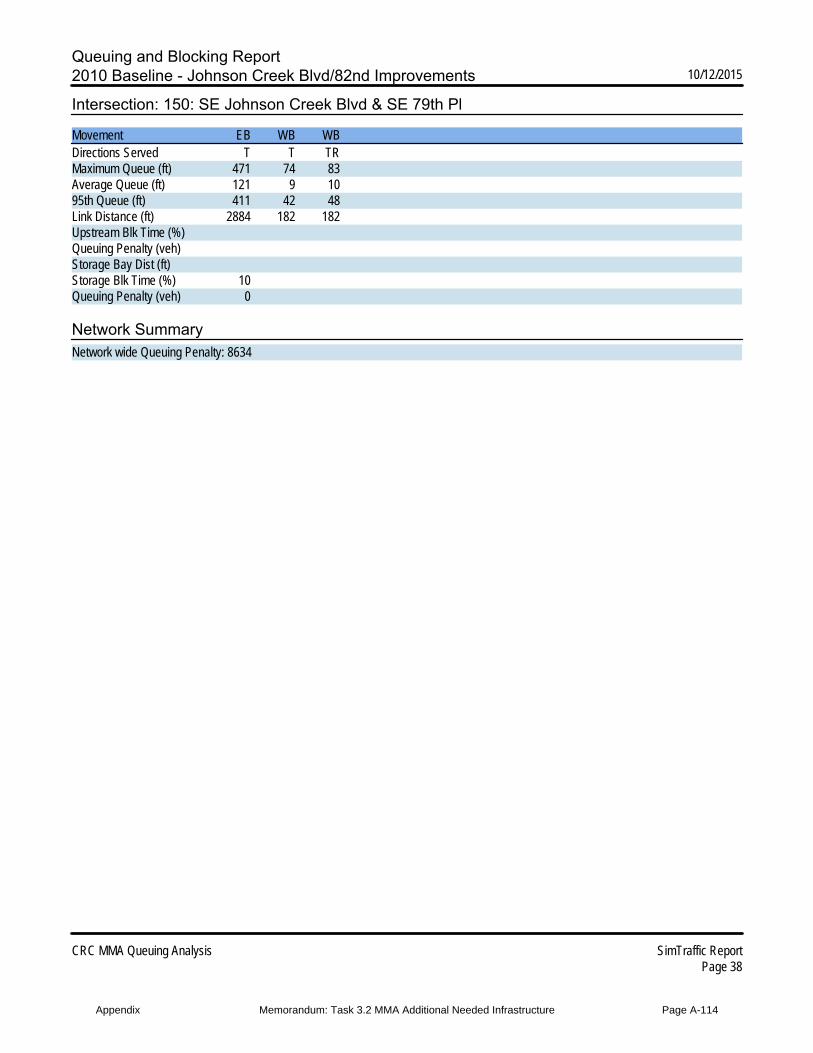
Queuing and Blocking Report2010 Baseline - Johnson Creek Blvd/82nd Improvements 10/12/2015
CRC MMA Queuing Analysis SimTraffic ReportPage 38
Intersection: 150: SE Johnson Creek Blvd & SE 79th Pl
Movement EB WB WBDirections Served T T TRMaximum Queue (ft) 471 74 83Average Queue (ft) 121 9 1095th Queue (ft) 411 42 48Link Distance (ft) 2884 182 182Upstream Blk Time (%)Queuing Penalty (veh)Storage Bay Dist (ft)Storage Blk Time (%) 10Queuing Penalty (veh) 0
Network SummaryNetwork wide Queuing Penalty: 8634
Appendix Memorandum: Task 3.2 MMA Additional Needed Infrastructure Page A-114

Actuated Signals, Observed Splits2010 Baseline - Johnson Creek Blvd/82nd Improvements 10/12/2015
CRC MMA Queuing Analysis SimTraffic ReportPage 39
Intersection: 22: SE 82nd Ave & SE Lindy St
Phase 1 2 4 5 6 8Movement(s) Served NBL SBT WBTL SBL NBT EBTLMaximum Green (s) 4.0 81.0 22.0 4.0 86.0 21.5Minimum Green (s) 4.0 10.0 6.0 4.0 10.0 6.0Recall None C-Max None None C-Min NoneAvg. Green (s) 9.1 173.9 23.6 4.7 184.1 23.1g/C Ratio -0.01 -0.01 -0.01 -0.01 -0.01 -0.01Cycles Skipped (%) 41 42 41 81 42 41Cycles @ Minimum (%) 0 0 0 19 0 0Cycles Maxed Out (%) 52 58 56 19 58 56Cycles with Peds (%) 0 35 11 0 4 41
Controller SummaryAverage Cycle Length (s): NANumber of Complete Cycles : 0
Intersection: 101: SE Linwood Ave./SE Flavel Dr. & SE Johnson Creek Blvd
Phase 1 2 4 5 6 8Movement(s) Served WBL EBT SBTL EBL WBT NBTLMaximum Green (s) 20.0 60.0 30.0 20.0 60.0 30.0Minimum Green (s) 4.0 8.0 5.0 4.0 8.0 5.0Recall None Min None None Min NoneAvg. Green (s) 8.4 24.9 14.2 6.1 33.7 14.2g/C Ratio -0.01 NA NA -0.01 NA NACycles Skipped (%) 20 0 0 90 0 0Cycles @ Minimum (%) 0 0 0 0 0 0Cycles Maxed Out (%) 0 0 3 0 2 3Cycles with Peds (%) 0 0 0 0 20 0
Controller SummaryAverage Cycle Length (s): NANumber of Complete Cycles : 0
Appendix Memorandum: Task 3.2 MMA Additional Needed Infrastructure Page A-115
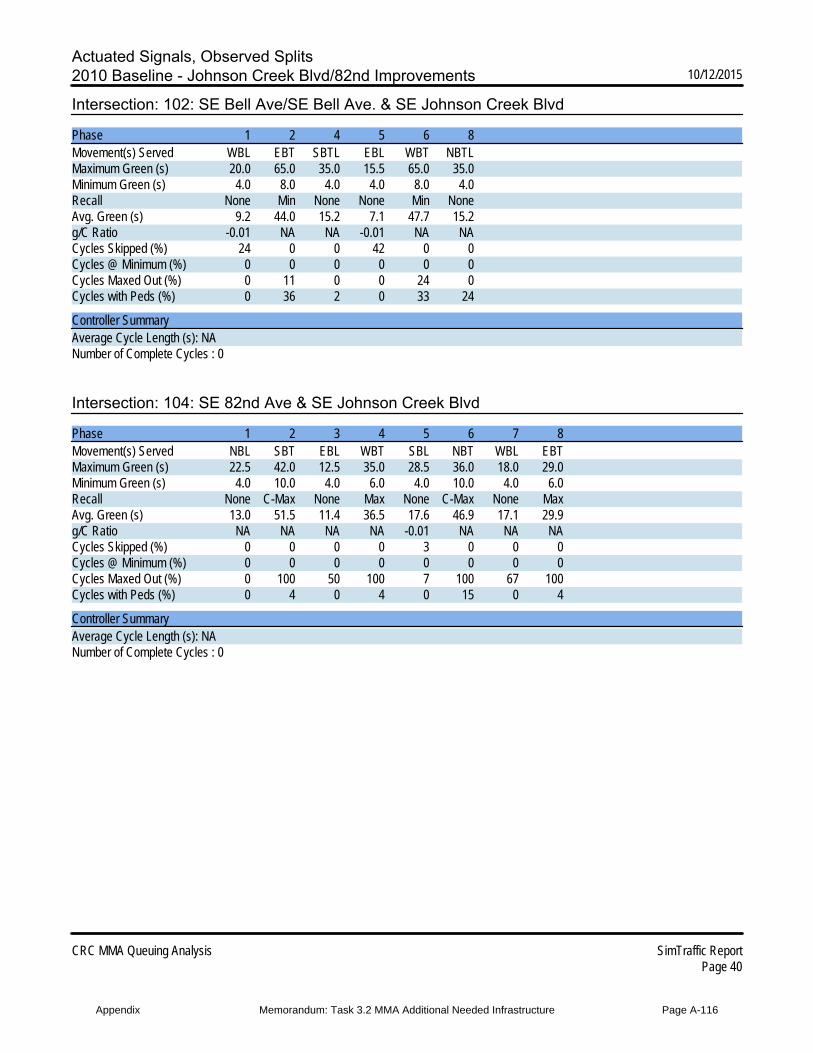
Actuated Signals, Observed Splits2010 Baseline - Johnson Creek Blvd/82nd Improvements 10/12/2015
CRC MMA Queuing Analysis SimTraffic ReportPage 40
Intersection: 102: SE Bell Ave/SE Bell Ave. & SE Johnson Creek Blvd
Phase 1 2 4 5 6 8Movement(s) Served WBL EBT SBTL EBL WBT NBTLMaximum Green (s) 20.0 65.0 35.0 15.5 65.0 35.0Minimum Green (s) 4.0 8.0 4.0 4.0 8.0 4.0Recall None Min None None Min NoneAvg. Green (s) 9.2 44.0 15.2 7.1 47.7 15.2g/C Ratio -0.01 NA NA -0.01 NA NACycles Skipped (%) 24 0 0 42 0 0Cycles @ Minimum (%) 0 0 0 0 0 0Cycles Maxed Out (%) 0 11 0 0 24 0Cycles with Peds (%) 0 36 2 0 33 24
Controller SummaryAverage Cycle Length (s): NANumber of Complete Cycles : 0
Intersection: 104: SE 82nd Ave & SE Johnson Creek Blvd
Phase 1 2 3 4 5 6 7 8Movement(s) Served NBL SBT EBL WBT SBL NBT WBL EBTMaximum Green (s) 22.5 42.0 12.5 35.0 28.5 36.0 18.0 29.0Minimum Green (s) 4.0 10.0 4.0 6.0 4.0 10.0 4.0 6.0Recall None C-Max None Max None C-Max None MaxAvg. Green (s) 13.0 51.5 11.4 36.5 17.6 46.9 17.1 29.9g/C Ratio NA NA NA NA -0.01 NA NA NACycles Skipped (%) 0 0 0 0 3 0 0 0Cycles @ Minimum (%) 0 0 0 0 0 0 0 0Cycles Maxed Out (%) 0 100 50 100 7 100 67 100Cycles with Peds (%) 0 4 0 4 0 15 0 4
Controller SummaryAverage Cycle Length (s): NANumber of Complete Cycles : 0
Appendix Memorandum: Task 3.2 MMA Additional Needed Infrastructure Page A-116
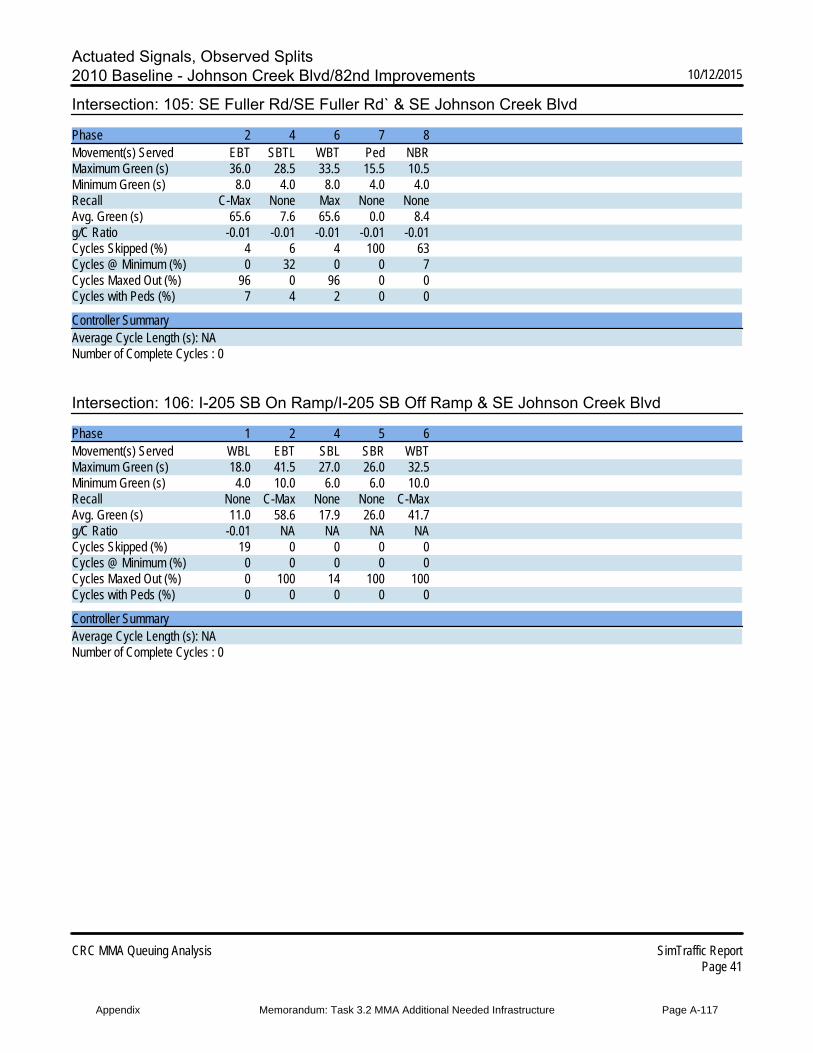
Actuated Signals, Observed Splits2010 Baseline - Johnson Creek Blvd/82nd Improvements 10/12/2015
CRC MMA Queuing Analysis SimTraffic ReportPage 41
Intersection: 105: SE Fuller Rd/SE Fuller Rd` & SE Johnson Creek Blvd
Phase 2 4 6 7 8Movement(s) Served EBT SBTL WBT Ped NBRMaximum Green (s) 36.0 28.5 33.5 15.5 10.5Minimum Green (s) 8.0 4.0 8.0 4.0 4.0Recall C-Max None Max None NoneAvg. Green (s) 65.6 7.6 65.6 0.0 8.4g/C Ratio -0.01 -0.01 -0.01 -0.01 -0.01Cycles Skipped (%) 4 6 4 100 63Cycles @ Minimum (%) 0 32 0 0 7Cycles Maxed Out (%) 96 0 96 0 0Cycles with Peds (%) 7 4 2 0 0
Controller SummaryAverage Cycle Length (s): NANumber of Complete Cycles : 0
Intersection: 106: I-205 SB On Ramp/I-205 SB Off Ramp & SE Johnson Creek Blvd
Phase 1 2 4 5 6Movement(s) Served WBL EBT SBL SBR WBTMaximum Green (s) 18.0 41.5 27.0 26.0 32.5Minimum Green (s) 4.0 10.0 6.0 6.0 10.0Recall None C-Max None None C-MaxAvg. Green (s) 11.0 58.6 17.9 26.0 41.7g/C Ratio -0.01 NA NA NA NACycles Skipped (%) 19 0 0 0 0Cycles @ Minimum (%) 0 0 0 0 0Cycles Maxed Out (%) 0 100 14 100 100Cycles with Peds (%) 0 0 0 0 0
Controller SummaryAverage Cycle Length (s): NANumber of Complete Cycles : 0
Appendix Memorandum: Task 3.2 MMA Additional Needed Infrastructure Page A-117

Actuated Signals, Observed Splits2010 Baseline - Johnson Creek Blvd/82nd Improvements 10/12/2015
CRC MMA Queuing Analysis SimTraffic ReportPage 42
Intersection: 107: I-205 NB On and Off Ramps & SE Johnson Creek Blvd
Phase 1 2 6 8Movement(s) Served WBL EBT WBT NBLMaximum Green (s) 20.0 31.5 55.5 35.0Minimum Green (s) 1.0 10.0 10.0 6.0Recall None C-Max Max NoneAvg. Green (s) 20.5 50.8 75.4 17.4g/C Ratio -0.01 NA NA NACycles Skipped (%) 6 0 0 0Cycles @ Minimum (%) 0 0 0 0Cycles Maxed Out (%) 94 100 100 0Cycles with Peds (%) 0 0 0 3
Controller SummaryAverage Cycle Length (s): NANumber of Complete Cycles : 0
Intersection: 108: SE 92nd Ave & SE Johnson Creek Blvd
Phase 1 2 3 4 5 6 7 8Movement(s) Served WBL EBT NBL SBT EBL WBT SBL NBTMaximum Green (s) 11.0 40.5 16.0 15.5 41.0 10.8 10.0 21.5Minimum Green (s) 4.0 8.0 4.0 6.0 4.0 8.0 4.0 6.0Recall None C-Max None None C-Max Max None NoneAvg. Green (s) 7.6 58.5 13.4 20.1 48.9 12.3 7.5 31.8g/C Ratio -0.01 -0.01 -0.01 -0.01 -0.01 -0.01 -0.01 -0.01Cycles Skipped (%) 47 9 9 9 9 9 50 9Cycles @ Minimum (%) 0 0 0 0 0 0 0 0Cycles Maxed Out (%) 0 91 34 79 91 91 3 85Cycles with Peds (%) 0 0 0 0 0 6 0 0
Controller SummaryAverage Cycle Length (s): NANumber of Complete Cycles : 0
Appendix Memorandum: Task 3.2 MMA Additional Needed Infrastructure Page A-118
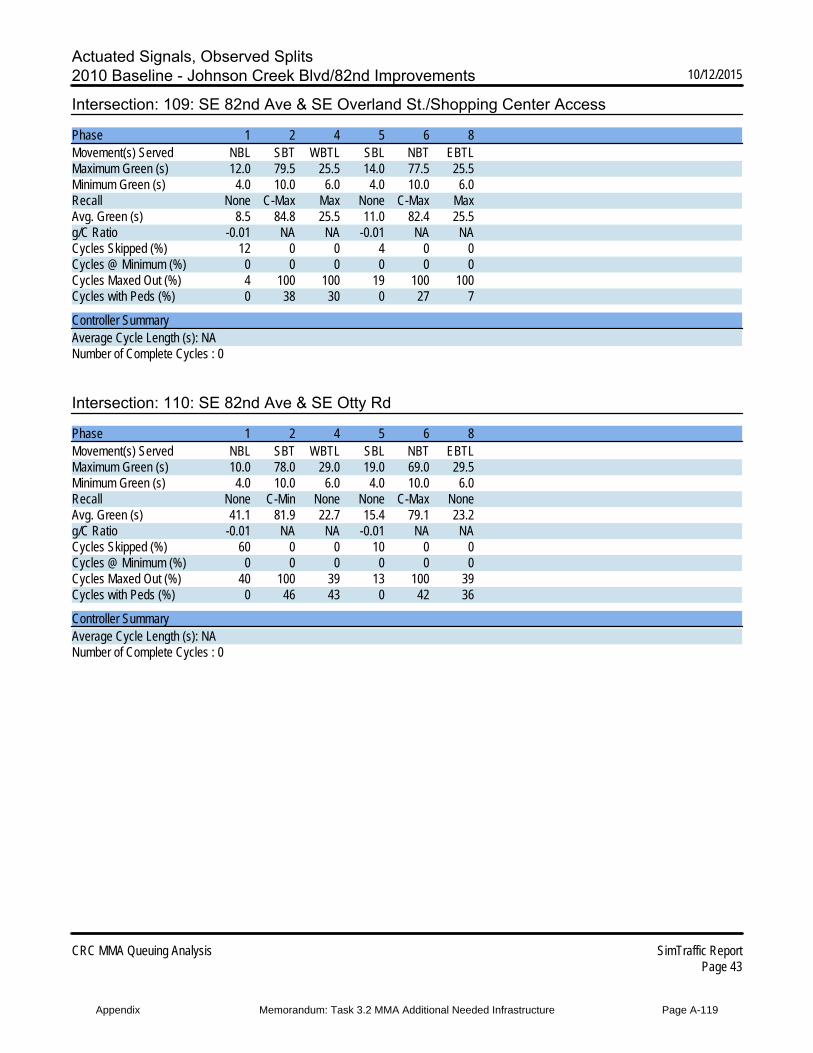
Actuated Signals, Observed Splits2010 Baseline - Johnson Creek Blvd/82nd Improvements 10/12/2015
CRC MMA Queuing Analysis SimTraffic ReportPage 43
Intersection: 109: SE 82nd Ave & SE Overland St./Shopping Center Access
Phase 1 2 4 5 6 8Movement(s) Served NBL SBT WBTL SBL NBT EBTLMaximum Green (s) 12.0 79.5 25.5 14.0 77.5 25.5Minimum Green (s) 4.0 10.0 6.0 4.0 10.0 6.0Recall None C-Max Max None C-Max MaxAvg. Green (s) 8.5 84.8 25.5 11.0 82.4 25.5g/C Ratio -0.01 NA NA -0.01 NA NACycles Skipped (%) 12 0 0 4 0 0Cycles @ Minimum (%) 0 0 0 0 0 0Cycles Maxed Out (%) 4 100 100 19 100 100Cycles with Peds (%) 0 38 30 0 27 7
Controller SummaryAverage Cycle Length (s): NANumber of Complete Cycles : 0
Intersection: 110: SE 82nd Ave & SE Otty Rd
Phase 1 2 4 5 6 8Movement(s) Served NBL SBT WBTL SBL NBT EBTLMaximum Green (s) 10.0 78.0 29.0 19.0 69.0 29.5Minimum Green (s) 4.0 10.0 6.0 4.0 10.0 6.0Recall None C-Min None None C-Max NoneAvg. Green (s) 41.1 81.9 22.7 15.4 79.1 23.2g/C Ratio -0.01 NA NA -0.01 NA NACycles Skipped (%) 60 0 0 10 0 0Cycles @ Minimum (%) 0 0 0 0 0 0Cycles Maxed Out (%) 40 100 39 13 100 39Cycles with Peds (%) 0 46 43 0 42 36
Controller SummaryAverage Cycle Length (s): NANumber of Complete Cycles : 0
Appendix Memorandum: Task 3.2 MMA Additional Needed Infrastructure Page A-119

Actuated Signals, Observed Splits2010 Baseline - Johnson Creek Blvd/82nd Improvements 10/12/2015
CRC MMA Queuing Analysis SimTraffic ReportPage 44
Intersection: 111: Access/SE Fuller Rd & SE Otty Rd
Phase 2 4 6 8Movement(s) Served SBTL WBTL NBTL EBTLMaximum Green (s) 30.0 20.0 30.0 20.0Minimum Green (s) 6.0 4.0 6.0 4.0Recall Min None Min NoneAvg. Green (s) 11.1 8.3 11.1 9.5g/C Ratio NA -0.01 NA -0.01Cycles Skipped (%) 0 41 0 42Cycles @ Minimum (%) 26 7 26 5Cycles Maxed Out (%) 1 1 1 1Cycles with Peds (%) 1 0 14 7
Controller SummaryAverage Cycle Length (s): NANumber of Complete Cycles : 0
Intersection: 112: SE Bob Schumacher Rd./SE 92nd Ave & SE Otty Rd
Phase 1 2 3 4 5 6 7 8Movement(s) Served NBL SBT EBL WBT SBL NBT WBL EBTMaximum Green (s) 20.0 40.0 20.0 40.0 20.0 40.0 20.0 40.0Minimum Green (s) 4.0 6.0 4.0 6.0 4.0 6.0 4.0 6.0Recall None Min None None None Min None NoneAvg. Green (s) 8.5 28.8 9.2 12.6 9.6 26.0 7.5 14.2g/C Ratio -0.01 NA -0.01 -0.01 -0.01 NA -0.01 -0.01Cycles Skipped (%) 22 0 34 28 9 0 55 11Cycles @ Minimum (%) 0 0 0 0 0 0 0 6Cycles Maxed Out (%) 0 19 6 0 0 7 0 0Cycles with Peds (%) 0 0 0 2 0 2 0 2
Controller SummaryAverage Cycle Length (s): NANumber of Complete Cycles : 0
Appendix Memorandum: Task 3.2 MMA Additional Needed Infrastructure Page A-120
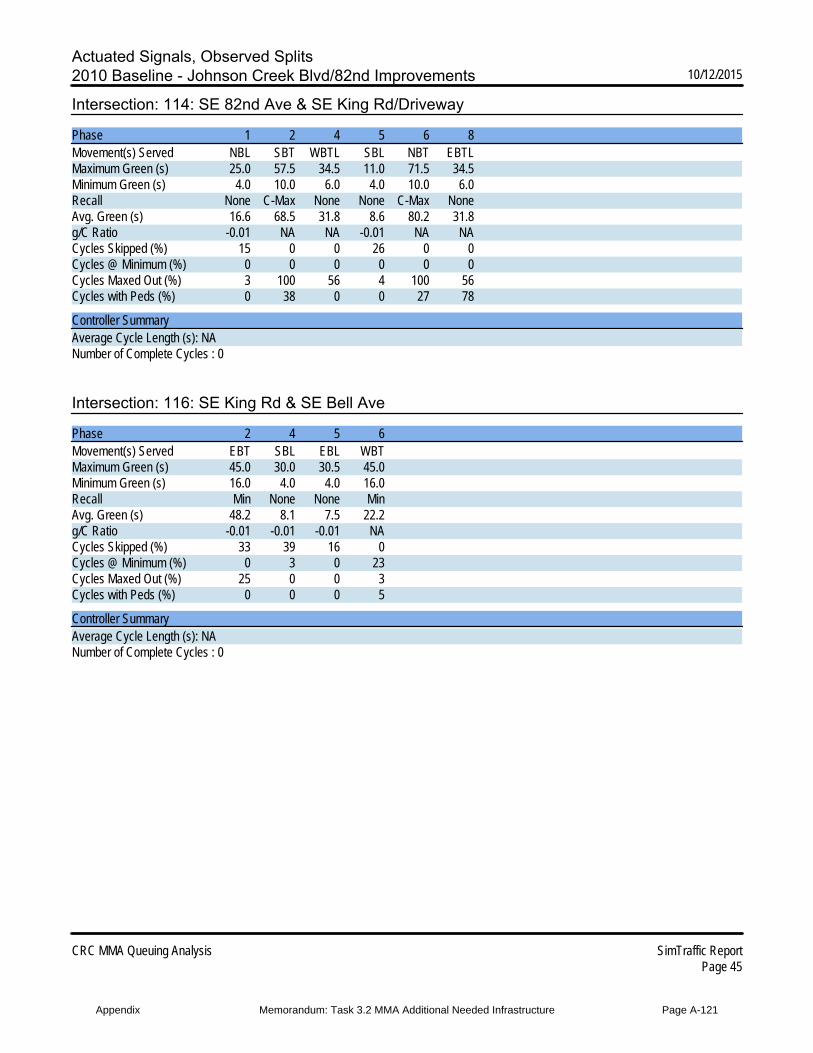
Actuated Signals, Observed Splits2010 Baseline - Johnson Creek Blvd/82nd Improvements 10/12/2015
CRC MMA Queuing Analysis SimTraffic ReportPage 45
Intersection: 114: SE 82nd Ave & SE King Rd/Driveway
Phase 1 2 4 5 6 8Movement(s) Served NBL SBT WBTL SBL NBT EBTLMaximum Green (s) 25.0 57.5 34.5 11.0 71.5 34.5Minimum Green (s) 4.0 10.0 6.0 4.0 10.0 6.0Recall None C-Max None None C-Max NoneAvg. Green (s) 16.6 68.5 31.8 8.6 80.2 31.8g/C Ratio -0.01 NA NA -0.01 NA NACycles Skipped (%) 15 0 0 26 0 0Cycles @ Minimum (%) 0 0 0 0 0 0Cycles Maxed Out (%) 3 100 56 4 100 56Cycles with Peds (%) 0 38 0 0 27 78
Controller SummaryAverage Cycle Length (s): NANumber of Complete Cycles : 0
Intersection: 116: SE King Rd & SE Bell Ave
Phase 2 4 5 6Movement(s) Served EBT SBL EBL WBTMaximum Green (s) 45.0 30.0 30.5 45.0Minimum Green (s) 16.0 4.0 4.0 16.0Recall Min None None MinAvg. Green (s) 48.2 8.1 7.5 22.2g/C Ratio -0.01 -0.01 -0.01 NACycles Skipped (%) 33 39 16 0Cycles @ Minimum (%) 0 3 0 23Cycles Maxed Out (%) 25 0 0 3Cycles with Peds (%) 0 0 0 5
Controller SummaryAverage Cycle Length (s): NANumber of Complete Cycles : 0
Appendix Memorandum: Task 3.2 MMA Additional Needed Infrastructure Page A-121
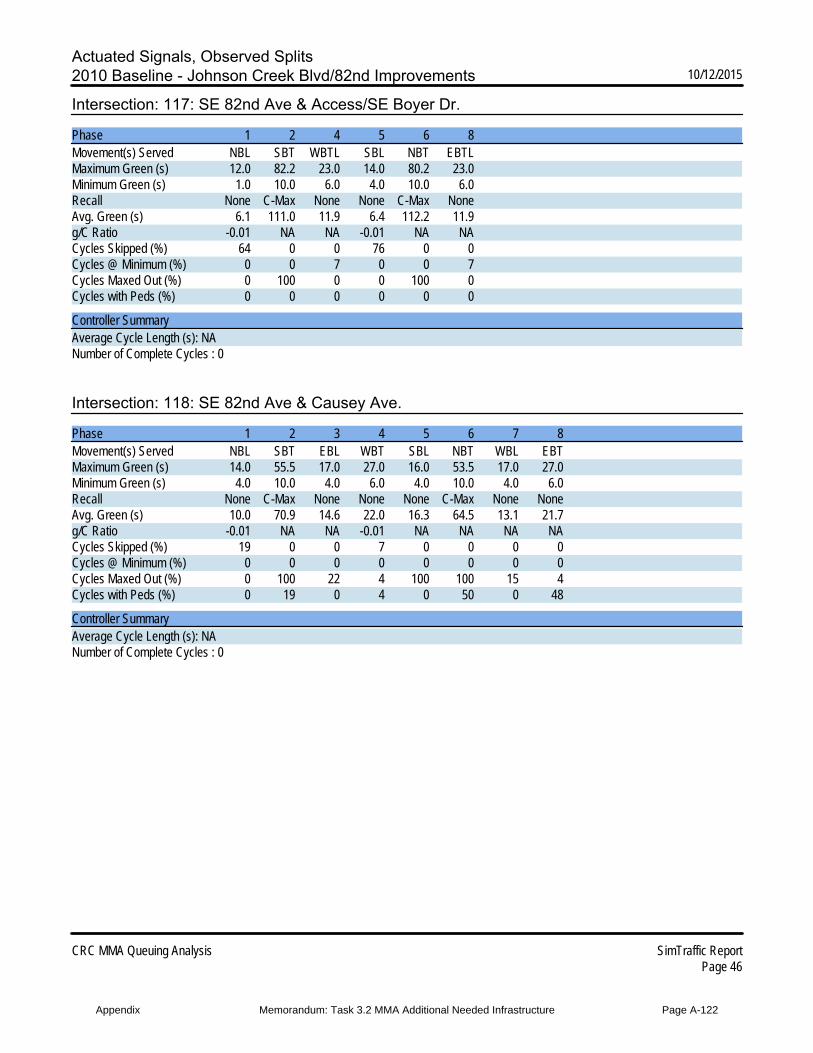
Actuated Signals, Observed Splits2010 Baseline - Johnson Creek Blvd/82nd Improvements 10/12/2015
CRC MMA Queuing Analysis SimTraffic ReportPage 46
Intersection: 117: SE 82nd Ave & Access/SE Boyer Dr.
Phase 1 2 4 5 6 8Movement(s) Served NBL SBT WBTL SBL NBT EBTLMaximum Green (s) 12.0 82.2 23.0 14.0 80.2 23.0Minimum Green (s) 1.0 10.0 6.0 4.0 10.0 6.0Recall None C-Max None None C-Max NoneAvg. Green (s) 6.1 111.0 11.9 6.4 112.2 11.9g/C Ratio -0.01 NA NA -0.01 NA NACycles Skipped (%) 64 0 0 76 0 0Cycles @ Minimum (%) 0 0 7 0 0 7Cycles Maxed Out (%) 0 100 0 0 100 0Cycles with Peds (%) 0 0 0 0 0 0
Controller SummaryAverage Cycle Length (s): NANumber of Complete Cycles : 0
Intersection: 118: SE 82nd Ave & Causey Ave.
Phase 1 2 3 4 5 6 7 8Movement(s) Served NBL SBT EBL WBT SBL NBT WBL EBTMaximum Green (s) 14.0 55.5 17.0 27.0 16.0 53.5 17.0 27.0Minimum Green (s) 4.0 10.0 4.0 6.0 4.0 10.0 4.0 6.0Recall None C-Max None None None C-Max None NoneAvg. Green (s) 10.0 70.9 14.6 22.0 16.3 64.5 13.1 21.7g/C Ratio -0.01 NA NA -0.01 NA NA NA NACycles Skipped (%) 19 0 0 7 0 0 0 0Cycles @ Minimum (%) 0 0 0 0 0 0 0 0Cycles Maxed Out (%) 0 100 22 4 100 100 15 4Cycles with Peds (%) 0 19 0 4 0 50 0 48
Controller SummaryAverage Cycle Length (s): NANumber of Complete Cycles : 0
Appendix Memorandum: Task 3.2 MMA Additional Needed Infrastructure Page A-122

Actuated Signals, Observed Splits2010 Baseline - Johnson Creek Blvd/82nd Improvements 10/12/2015
CRC MMA Queuing Analysis SimTraffic ReportPage 47
Intersection: 119: SE 82nd Ave & Access/SE Monterey Ave.
Phase 2 4 5 6Movement(s) Served SBT EBWB SBL NBTMaximum Green (s) 78.0 28.0 20.0 68.0Minimum Green (s) 10.0 6.0 4.0 10.0Recall C-Max None None C-MaxAvg. Green (s) 110.4 15.6 13.4 88.3g/C Ratio NA NA -0.01 NACycles Skipped (%) 0 0 21 0Cycles @ Minimum (%) 0 0 0 0Cycles Maxed Out (%) 100 7 0 100Cycles with Peds (%) 12 7 0 19
Controller SummaryAverage Cycle Length (s): NANumber of Complete Cycles : 0
Intersection: 120: SE 82nd Ave & Sunnyside Rd.
Phase 1 2 3 4 5 6 7 8Movement(s) Served NBL SBT EBL WBT SBL NBT WBL EBTMaximum Green (s) 17.0 41.6 18.0 35.2 29.0 29.6 18.0 35.2Minimum Green (s) 4.0 10.0 4.0 6.0 4.0 10.0 4.0 6.0Recall None C-Max None None None C-Max None NoneAvg. Green (s) 17.6 43.5 16.3 35.6 17.0 44.1 14.4 37.9g/C Ratio NA NA NA NA -0.01 NA NA NACycles Skipped (%) 0 0 0 0 3 0 0 0Cycles @ Minimum (%) 0 0 0 0 0 0 0 0Cycles Maxed Out (%) 61 100 38 69 0 100 27 69Cycles with Peds (%) 0 7 0 8 0 11 0 35
Controller SummaryAverage Cycle Length (s): NANumber of Complete Cycles : 0
Appendix Memorandum: Task 3.2 MMA Additional Needed Infrastructure Page A-123
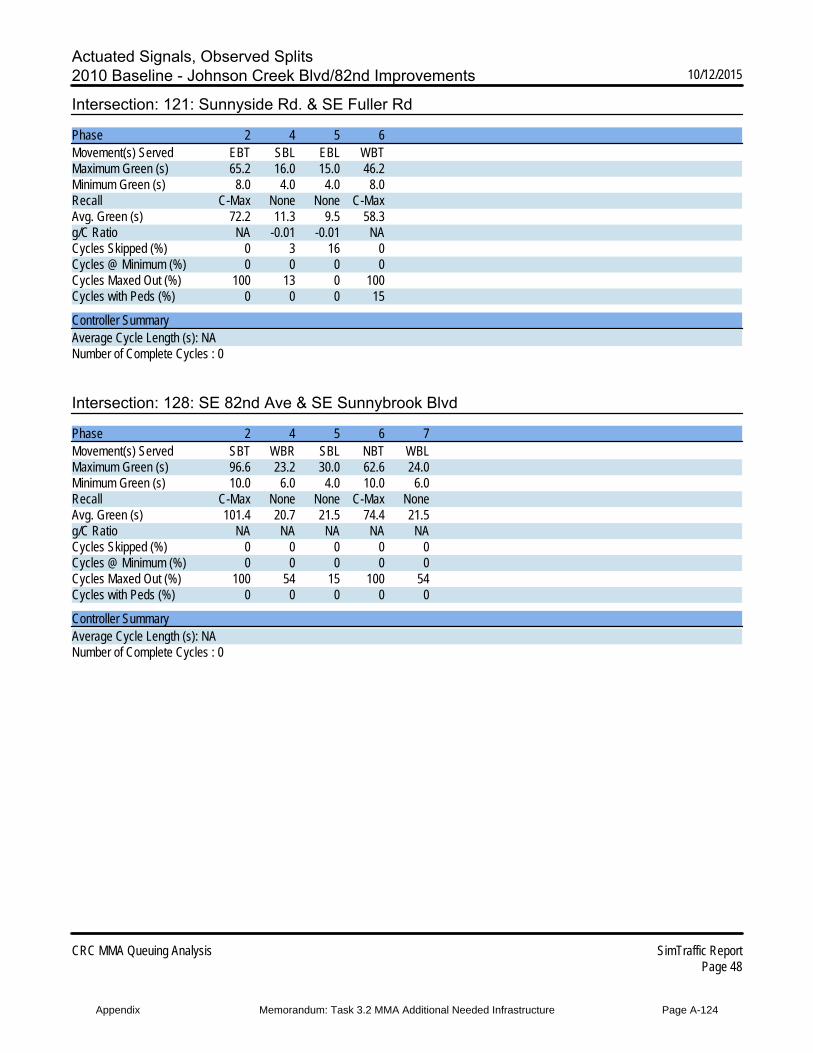
Actuated Signals, Observed Splits2010 Baseline - Johnson Creek Blvd/82nd Improvements 10/12/2015
CRC MMA Queuing Analysis SimTraffic ReportPage 48
Intersection: 121: Sunnyside Rd. & SE Fuller Rd
Phase 2 4 5 6Movement(s) Served EBT SBL EBL WBTMaximum Green (s) 65.2 16.0 15.0 46.2Minimum Green (s) 8.0 4.0 4.0 8.0Recall C-Max None None C-MaxAvg. Green (s) 72.2 11.3 9.5 58.3g/C Ratio NA -0.01 -0.01 NACycles Skipped (%) 0 3 16 0Cycles @ Minimum (%) 0 0 0 0Cycles Maxed Out (%) 100 13 0 100Cycles with Peds (%) 0 0 0 15
Controller SummaryAverage Cycle Length (s): NANumber of Complete Cycles : 0
Intersection: 128: SE 82nd Ave & SE Sunnybrook Blvd
Phase 2 4 5 6 7Movement(s) Served SBT WBR SBL NBT WBLMaximum Green (s) 96.6 23.2 30.0 62.6 24.0Minimum Green (s) 10.0 6.0 4.0 10.0 6.0Recall C-Max None None C-Max NoneAvg. Green (s) 101.4 20.7 21.5 74.4 21.5g/C Ratio NA NA NA NA NACycles Skipped (%) 0 0 0 0 0Cycles @ Minimum (%) 0 0 0 0 0Cycles Maxed Out (%) 100 54 15 100 54Cycles with Peds (%) 0 0 0 0 0
Controller SummaryAverage Cycle Length (s): NANumber of Complete Cycles : 0
Appendix Memorandum: Task 3.2 MMA Additional Needed Infrastructure Page A-124
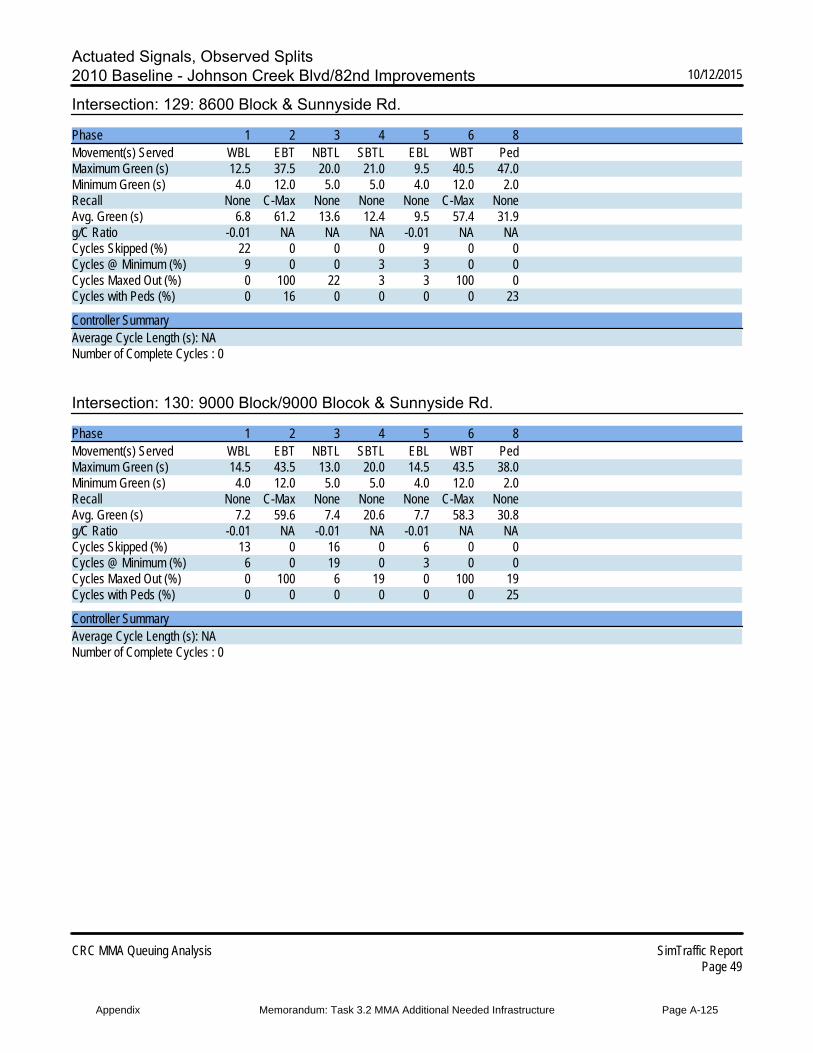
Actuated Signals, Observed Splits2010 Baseline - Johnson Creek Blvd/82nd Improvements 10/12/2015
CRC MMA Queuing Analysis SimTraffic ReportPage 49
Intersection: 129: 8600 Block & Sunnyside Rd.
Phase 1 2 3 4 5 6 8Movement(s) Served WBL EBT NBTL SBTL EBL WBT PedMaximum Green (s) 12.5 37.5 20.0 21.0 9.5 40.5 47.0Minimum Green (s) 4.0 12.0 5.0 5.0 4.0 12.0 2.0Recall None C-Max None None None C-Max NoneAvg. Green (s) 6.8 61.2 13.6 12.4 9.5 57.4 31.9g/C Ratio -0.01 NA NA NA -0.01 NA NACycles Skipped (%) 22 0 0 0 9 0 0Cycles @ Minimum (%) 9 0 0 3 3 0 0Cycles Maxed Out (%) 0 100 22 3 3 100 0Cycles with Peds (%) 0 16 0 0 0 0 23
Controller SummaryAverage Cycle Length (s): NANumber of Complete Cycles : 0
Intersection: 130: 9000 Block/9000 Blocok & Sunnyside Rd.
Phase 1 2 3 4 5 6 8Movement(s) Served WBL EBT NBTL SBTL EBL WBT PedMaximum Green (s) 14.5 43.5 13.0 20.0 14.5 43.5 38.0Minimum Green (s) 4.0 12.0 5.0 5.0 4.0 12.0 2.0Recall None C-Max None None None C-Max NoneAvg. Green (s) 7.2 59.6 7.4 20.6 7.7 58.3 30.8g/C Ratio -0.01 NA -0.01 NA -0.01 NA NACycles Skipped (%) 13 0 16 0 6 0 0Cycles @ Minimum (%) 6 0 19 0 3 0 0Cycles Maxed Out (%) 0 100 6 19 0 100 19Cycles with Peds (%) 0 0 0 0 0 0 25
Controller SummaryAverage Cycle Length (s): NANumber of Complete Cycles : 0
Appendix Memorandum: Task 3.2 MMA Additional Needed Infrastructure Page A-125

Actuated Signals, Observed Splits2010 Baseline - Johnson Creek Blvd/82nd Improvements 10/12/2015
CRC MMA Queuing Analysis SimTraffic ReportPage 50
Intersection: 131: SE 93rd Ave. & Sunnyside Rd.
Phase 1 2 6 8Movement(s) Served WBL EBT WBT NBLMaximum Green (s) 14.5 55.5 74.5 26.0Minimum Green (s) 4.0 12.0 12.0 6.0Recall None C-Max C-Max MaxAvg. Green (s) 8.3 98.8 109.5 27.8g/C Ratio -0.01 -0.01 -0.01 -0.01Cycles Skipped (%) 35 23 23 23Cycles @ Minimum (%) 6 0 0 0Cycles Maxed Out (%) 0 77 77 77Cycles with Peds (%) 0 10 0 23
Controller SummaryAverage Cycle Length (s): NANumber of Complete Cycles : 0
Intersection: 132: I-205 SB On Ramp/205 SB Off Ramp & Sunnyside Rd.
Phase 1 2 4 6Movement(s) Served WBL EBT SBTL WBTMaximum Green (s) 32.5 39.5 21.5 77.5Minimum Green (s) 4.0 10.0 6.0 10.0Recall None C-Max None C-MaxAvg. Green (s) 21.2 93.0 22.2 120.7g/C Ratio -0.01 -0.01 -0.01 -0.01Cycles Skipped (%) 25 27 26 27Cycles @ Minimum (%) 0 0 0 0Cycles Maxed Out (%) 3 73 74 73Cycles with Peds (%) 0 37 26 17
Controller SummaryAverage Cycle Length (s): NANumber of Complete Cycles : 0
Appendix Memorandum: Task 3.2 MMA Additional Needed Infrastructure Page A-126

Actuated Signals, Observed Splits2010 Baseline - Johnson Creek Blvd/82nd Improvements 10/12/2015
CRC MMA Queuing Analysis SimTraffic ReportPage 51
Intersection: 133: I-205 NB off ramp/I-205 NB on ramp & Sunnyside Rd.
Phase 2 5 6 8Movement(s) Served EBT EBL WBT NBTLMaximum Green (s) 83.0 39.0 40.0 17.5Minimum Green (s) 10.0 4.0 10.0 6.0Recall C-Max None C-Max NoneAvg. Green (s) 85.1 16.9 64.3 15.4g/C Ratio NA NA NA NACycles Skipped (%) 0 0 0 0Cycles @ Minimum (%) 0 0 0 0Cycles Maxed Out (%) 100 0 100 48Cycles with Peds (%) 10 0 10 27
Controller SummaryAverage Cycle Length (s): NANumber of Complete Cycles : 0
Intersection: 134: Sunnyside Rd. & SE Stevens Rd.
Phase 1 2 5 6 7 8Movement(s) Served WBL EBT EBL WBT SBTL NBTLMaximum Green (s) 10.0 44.5 18.5 35.5 20.5 17.5Minimum Green (s) 4.0 16.0 5.0 16.0 6.0 4.0Recall None C-Max None C-Max None NoneAvg. Green (s) 5.7 56.9 12.1 46.1 19.1 18.2g/C Ratio -0.01 NA -0.01 NA NA NACycles Skipped (%) 47 0 14 0 0 0Cycles @ Minimum (%) 20 0 0 0 0 0Cycles Maxed Out (%) 0 100 3 100 66 74Cycles with Peds (%) 0 10 0 7 0 0
Controller SummaryAverage Cycle Length (s): NANumber of Complete Cycles : 0
Appendix Memorandum: Task 3.2 MMA Additional Needed Infrastructure Page A-127
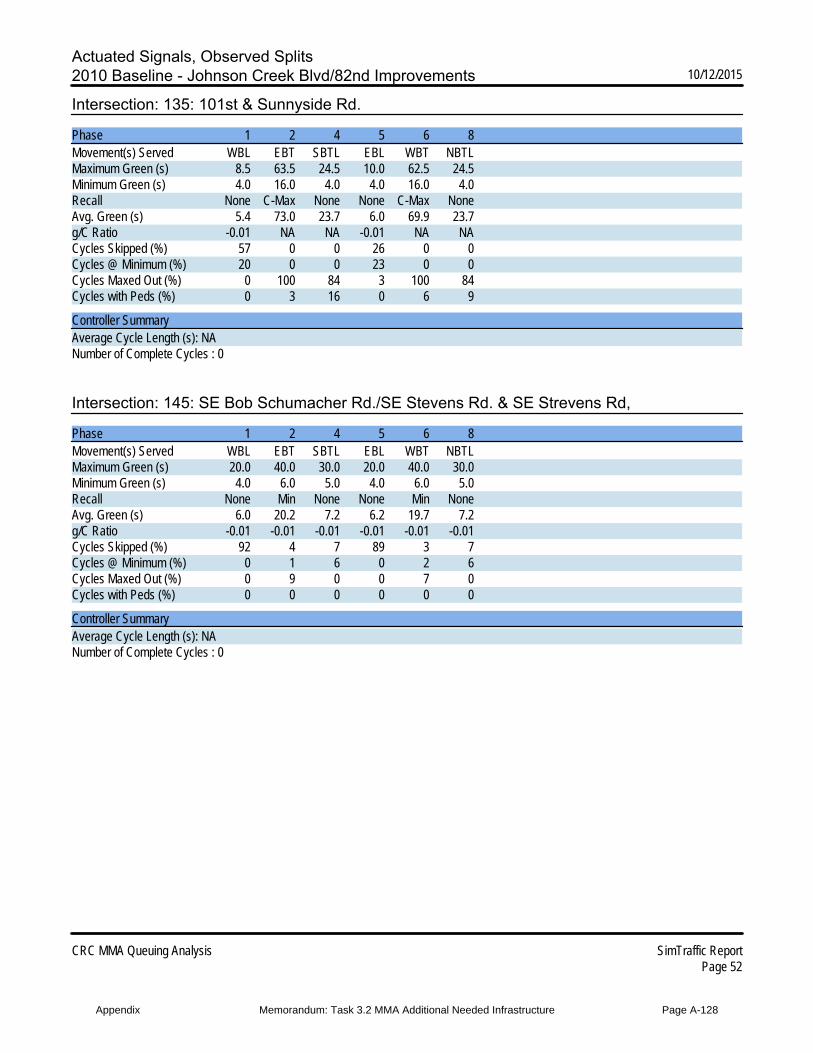
Actuated Signals, Observed Splits2010 Baseline - Johnson Creek Blvd/82nd Improvements 10/12/2015
CRC MMA Queuing Analysis SimTraffic ReportPage 52
Intersection: 135: 101st & Sunnyside Rd.
Phase 1 2 4 5 6 8Movement(s) Served WBL EBT SBTL EBL WBT NBTLMaximum Green (s) 8.5 63.5 24.5 10.0 62.5 24.5Minimum Green (s) 4.0 16.0 4.0 4.0 16.0 4.0Recall None C-Max None None C-Max NoneAvg. Green (s) 5.4 73.0 23.7 6.0 69.9 23.7g/C Ratio -0.01 NA NA -0.01 NA NACycles Skipped (%) 57 0 0 26 0 0Cycles @ Minimum (%) 20 0 0 23 0 0Cycles Maxed Out (%) 0 100 84 3 100 84Cycles with Peds (%) 0 3 16 0 6 9
Controller SummaryAverage Cycle Length (s): NANumber of Complete Cycles : 0
Intersection: 145: SE Bob Schumacher Rd./SE Stevens Rd. & SE Strevens Rd,
Phase 1 2 4 5 6 8Movement(s) Served WBL EBT SBTL EBL WBT NBTLMaximum Green (s) 20.0 40.0 30.0 20.0 40.0 30.0Minimum Green (s) 4.0 6.0 5.0 4.0 6.0 5.0Recall None Min None None Min NoneAvg. Green (s) 6.0 20.2 7.2 6.2 19.7 7.2g/C Ratio -0.01 -0.01 -0.01 -0.01 -0.01 -0.01Cycles Skipped (%) 92 4 7 89 3 7Cycles @ Minimum (%) 0 1 6 0 2 6Cycles Maxed Out (%) 0 9 0 0 7 0Cycles with Peds (%) 0 0 0 0 0 0
Controller SummaryAverage Cycle Length (s): NANumber of Complete Cycles : 0
Appendix Memorandum: Task 3.2 MMA Additional Needed Infrastructure Page A-128
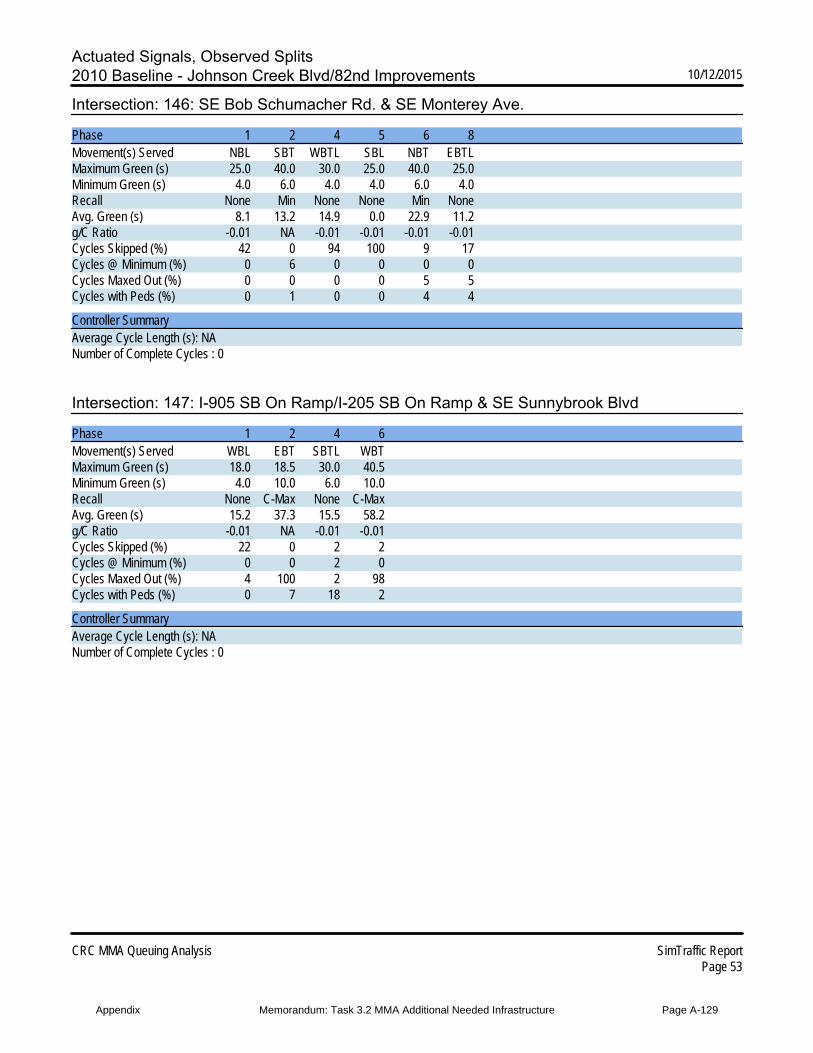
Actuated Signals, Observed Splits2010 Baseline - Johnson Creek Blvd/82nd Improvements 10/12/2015
CRC MMA Queuing Analysis SimTraffic ReportPage 53
Intersection: 146: SE Bob Schumacher Rd. & SE Monterey Ave.
Phase 1 2 4 5 6 8Movement(s) Served NBL SBT WBTL SBL NBT EBTLMaximum Green (s) 25.0 40.0 30.0 25.0 40.0 25.0Minimum Green (s) 4.0 6.0 4.0 4.0 6.0 4.0Recall None Min None None Min NoneAvg. Green (s) 8.1 13.2 14.9 0.0 22.9 11.2g/C Ratio -0.01 NA -0.01 -0.01 -0.01 -0.01Cycles Skipped (%) 42 0 94 100 9 17Cycles @ Minimum (%) 0 6 0 0 0 0Cycles Maxed Out (%) 0 0 0 0 5 5Cycles with Peds (%) 0 1 0 0 4 4
Controller SummaryAverage Cycle Length (s): NANumber of Complete Cycles : 0
Intersection: 147: I-905 SB On Ramp/I-205 SB On Ramp & SE Sunnybrook Blvd
Phase 1 2 4 6Movement(s) Served WBL EBT SBTL WBTMaximum Green (s) 18.0 18.5 30.0 40.5Minimum Green (s) 4.0 10.0 6.0 10.0Recall None C-Max None C-MaxAvg. Green (s) 15.2 37.3 15.5 58.2g/C Ratio -0.01 NA -0.01 -0.01Cycles Skipped (%) 22 0 2 2Cycles @ Minimum (%) 0 0 2 0Cycles Maxed Out (%) 4 100 2 98Cycles with Peds (%) 0 7 18 2
Controller SummaryAverage Cycle Length (s): NANumber of Complete Cycles : 0
Appendix Memorandum: Task 3.2 MMA Additional Needed Infrastructure Page A-129
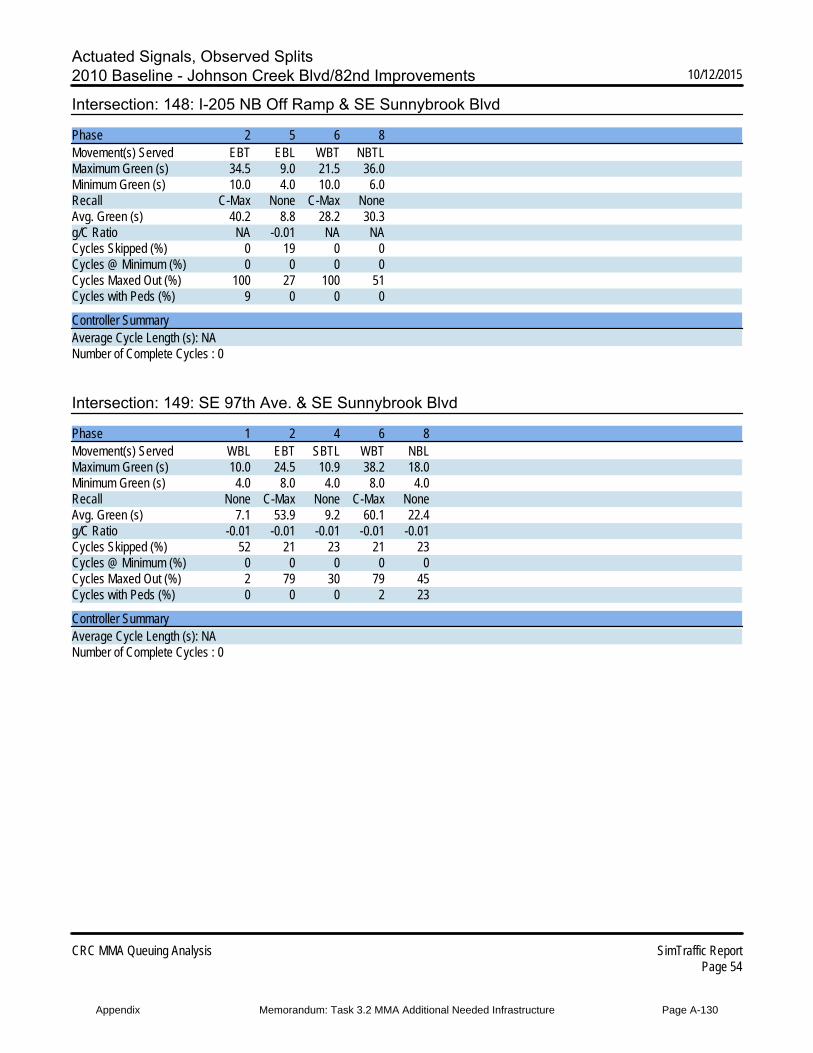
Actuated Signals, Observed Splits2010 Baseline - Johnson Creek Blvd/82nd Improvements 10/12/2015
CRC MMA Queuing Analysis SimTraffic ReportPage 54
Intersection: 148: I-205 NB Off Ramp & SE Sunnybrook Blvd
Phase 2 5 6 8Movement(s) Served EBT EBL WBT NBTLMaximum Green (s) 34.5 9.0 21.5 36.0Minimum Green (s) 10.0 4.0 10.0 6.0Recall C-Max None C-Max NoneAvg. Green (s) 40.2 8.8 28.2 30.3g/C Ratio NA -0.01 NA NACycles Skipped (%) 0 19 0 0Cycles @ Minimum (%) 0 0 0 0Cycles Maxed Out (%) 100 27 100 51Cycles with Peds (%) 9 0 0 0
Controller SummaryAverage Cycle Length (s): NANumber of Complete Cycles : 0
Intersection: 149: SE 97th Ave. & SE Sunnybrook Blvd
Phase 1 2 4 6 8Movement(s) Served WBL EBT SBTL WBT NBLMaximum Green (s) 10.0 24.5 10.9 38.2 18.0Minimum Green (s) 4.0 8.0 4.0 8.0 4.0Recall None C-Max None C-Max NoneAvg. Green (s) 7.1 53.9 9.2 60.1 22.4g/C Ratio -0.01 -0.01 -0.01 -0.01 -0.01Cycles Skipped (%) 52 21 23 21 23Cycles @ Minimum (%) 0 0 0 0 0Cycles Maxed Out (%) 2 79 30 79 45Cycles with Peds (%) 0 0 0 2 23
Controller SummaryAverage Cycle Length (s): NANumber of Complete Cycles : 0
Appendix Memorandum: Task 3.2 MMA Additional Needed Infrastructure Page A-130
Highway Capacity Manual (HCM) Report for 82nd Ave (Ped. Enhancements, Existing)
Appendix Memorandum: Task 3.2 MMA Additional Needed Infrastructure Page A-131
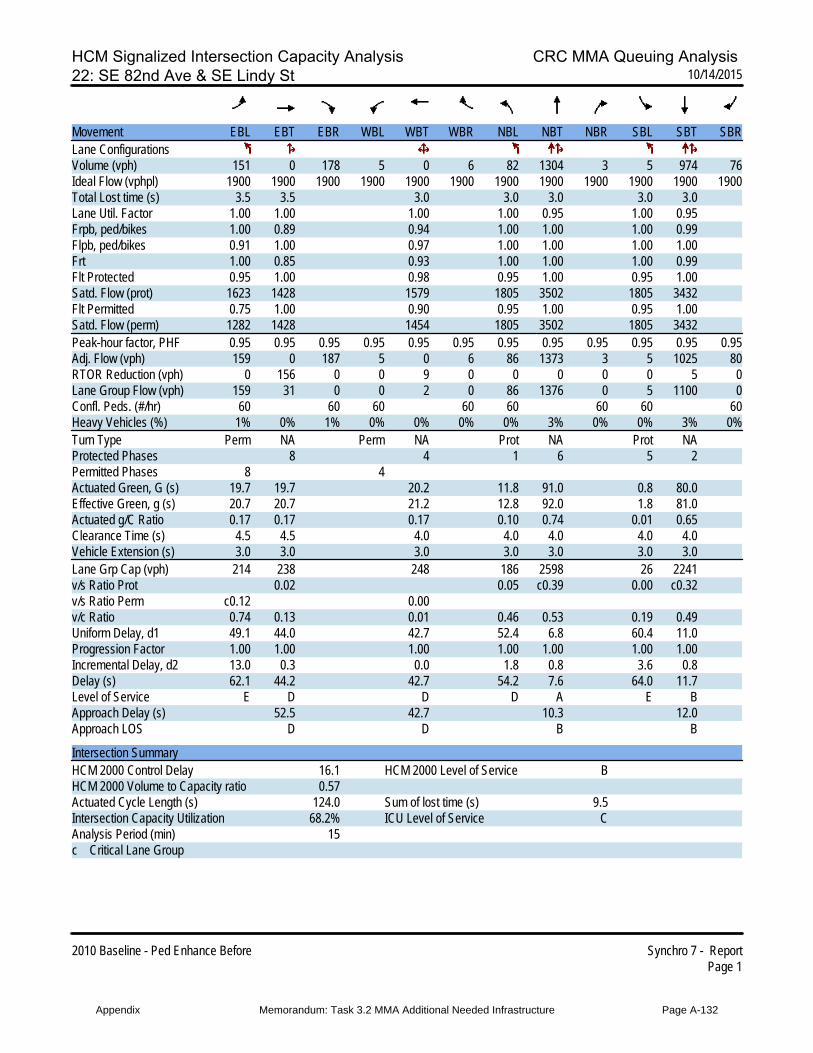
HCM Signalized Intersection Capacity Analysis CRC MMA Queuing Analysis 22: SE 82nd Ave & SE Lindy St 10/14/2015
2010 Baseline - Ped Enhance Before Synchro 7 - ReportPage 1
Movement EBL EBT EBR WBL WBT WBR NBL NBT NBR SBL SBT SBRLane ConfigurationsVolume (vph) 151 0 178 5 0 6 82 1304 3 5 974 76Ideal Flow (vphpl) 1900 1900 1900 1900 1900 1900 1900 1900 1900 1900 1900 1900Total Lost time (s) 3.5 3.5 3.0 3.0 3.0 3.0 3.0Lane Util. Factor 1.00 1.00 1.00 1.00 0.95 1.00 0.95Frpb, ped/bikes 1.00 0.89 0.94 1.00 1.00 1.00 0.99Flpb, ped/bikes 0.91 1.00 0.97 1.00 1.00 1.00 1.00Frt 1.00 0.85 0.93 1.00 1.00 1.00 0.99Flt Protected 0.95 1.00 0.98 0.95 1.00 0.95 1.00Satd. Flow (prot) 1623 1428 1579 1805 3502 1805 3432Flt Permitted 0.75 1.00 0.90 0.95 1.00 0.95 1.00Satd. Flow (perm) 1282 1428 1454 1805 3502 1805 3432Peak-hour factor, PHF 0.95 0.95 0.95 0.95 0.95 0.95 0.95 0.95 0.95 0.95 0.95 0.95Adj. Flow (vph) 159 0 187 5 0 6 86 1373 3 5 1025 80RTOR Reduction (vph) 0 156 0 0 9 0 0 0 0 0 5 0Lane Group Flow (vph) 159 31 0 0 2 0 86 1376 0 5 1100 0Confl. Peds. (#/hr) 60 60 60 60 60 60 60 60Heavy Vehicles (%) 1% 0% 1% 0% 0% 0% 0% 3% 0% 0% 3% 0%Turn Type Perm NA Perm NA Prot NA Prot NAProtected Phases 8 4 1 6 5 2Permitted Phases 8 4Actuated Green, G (s) 19.7 19.7 20.2 11.8 91.0 0.8 80.0Effective Green, g (s) 20.7 20.7 21.2 12.8 92.0 1.8 81.0Actuated g/C Ratio 0.17 0.17 0.17 0.10 0.74 0.01 0.65Clearance Time (s) 4.5 4.5 4.0 4.0 4.0 4.0 4.0Vehicle Extension (s) 3.0 3.0 3.0 3.0 3.0 3.0 3.0Lane Grp Cap (vph) 214 238 248 186 2598 26 2241v/s Ratio Prot 0.02 0.05 c0.39 0.00 c0.32v/s Ratio Perm c0.12 0.00v/c Ratio 0.74 0.13 0.01 0.46 0.53 0.19 0.49Uniform Delay, d1 49.1 44.0 42.7 52.4 6.8 60.4 11.0Progression Factor 1.00 1.00 1.00 1.00 1.00 1.00 1.00Incremental Delay, d2 13.0 0.3 0.0 1.8 0.8 3.6 0.8Delay (s) 62.1 44.2 42.7 54.2 7.6 64.0 11.7Level of Service E D D D A E BApproach Delay (s) 52.5 42.7 10.3 12.0Approach LOS D D B B
Intersection SummaryHCM 2000 Control Delay 16.1 HCM 2000 Level of Service BHCM 2000 Volume to Capacity ratio 0.57Actuated Cycle Length (s) 124.0 Sum of lost time (s) 9.5Intersection Capacity Utilization 68.2% ICU Level of Service CAnalysis Period (min) 15c Critical Lane Group
Appendix Memorandum: Task 3.2 MMA Additional Needed Infrastructure Page A-132
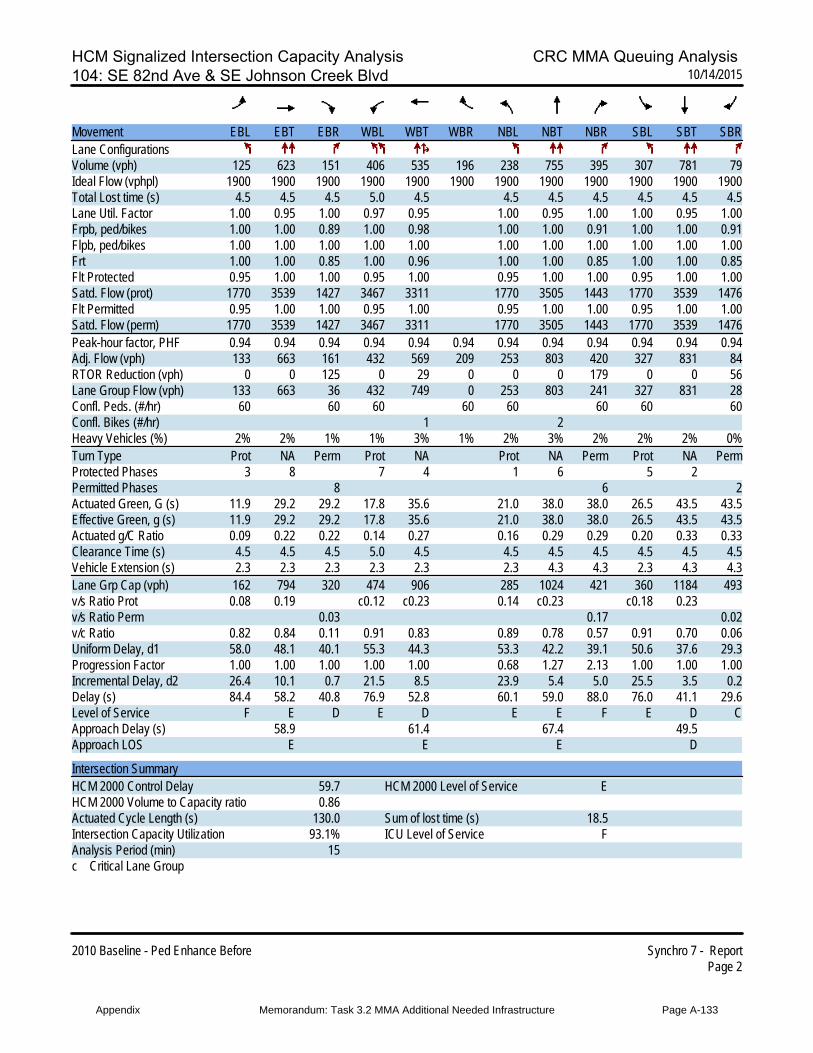
HCM Signalized Intersection Capacity Analysis CRC MMA Queuing Analysis 104: SE 82nd Ave & SE Johnson Creek Blvd 10/14/2015
2010 Baseline - Ped Enhance Before Synchro 7 - ReportPage 2
Movement EBL EBT EBR WBL WBT WBR NBL NBT NBR SBL SBT SBRLane ConfigurationsVolume (vph) 125 623 151 406 535 196 238 755 395 307 781 79Ideal Flow (vphpl) 1900 1900 1900 1900 1900 1900 1900 1900 1900 1900 1900 1900Total Lost time (s) 4.5 4.5 4.5 5.0 4.5 4.5 4.5 4.5 4.5 4.5 4.5Lane Util. Factor 1.00 0.95 1.00 0.97 0.95 1.00 0.95 1.00 1.00 0.95 1.00Frpb, ped/bikes 1.00 1.00 0.89 1.00 0.98 1.00 1.00 0.91 1.00 1.00 0.91Flpb, ped/bikes 1.00 1.00 1.00 1.00 1.00 1.00 1.00 1.00 1.00 1.00 1.00Frt 1.00 1.00 0.85 1.00 0.96 1.00 1.00 0.85 1.00 1.00 0.85Flt Protected 0.95 1.00 1.00 0.95 1.00 0.95 1.00 1.00 0.95 1.00 1.00Satd. Flow (prot) 1770 3539 1427 3467 3311 1770 3505 1443 1770 3539 1476Flt Permitted 0.95 1.00 1.00 0.95 1.00 0.95 1.00 1.00 0.95 1.00 1.00Satd. Flow (perm) 1770 3539 1427 3467 3311 1770 3505 1443 1770 3539 1476Peak-hour factor, PHF 0.94 0.94 0.94 0.94 0.94 0.94 0.94 0.94 0.94 0.94 0.94 0.94Adj. Flow (vph) 133 663 161 432 569 209 253 803 420 327 831 84RTOR Reduction (vph) 0 0 125 0 29 0 0 0 179 0 0 56Lane Group Flow (vph) 133 663 36 432 749 0 253 803 241 327 831 28Confl. Peds. (#/hr) 60 60 60 60 60 60 60 60Confl. Bikes (#/hr) 1 2Heavy Vehicles (%) 2% 2% 1% 1% 3% 1% 2% 3% 2% 2% 2% 0%Turn Type Prot NA Perm Prot NA Prot NA Perm Prot NA PermProtected Phases 3 8 7 4 1 6 5 2Permitted Phases 8 6 2Actuated Green, G (s) 11.9 29.2 29.2 17.8 35.6 21.0 38.0 38.0 26.5 43.5 43.5Effective Green, g (s) 11.9 29.2 29.2 17.8 35.6 21.0 38.0 38.0 26.5 43.5 43.5Actuated g/C Ratio 0.09 0.22 0.22 0.14 0.27 0.16 0.29 0.29 0.20 0.33 0.33Clearance Time (s) 4.5 4.5 4.5 5.0 4.5 4.5 4.5 4.5 4.5 4.5 4.5Vehicle Extension (s) 2.3 2.3 2.3 2.3 2.3 2.3 4.3 4.3 2.3 4.3 4.3Lane Grp Cap (vph) 162 794 320 474 906 285 1024 421 360 1184 493v/s Ratio Prot 0.08 0.19 c0.12 c0.23 0.14 c0.23 c0.18 0.23v/s Ratio Perm 0.03 0.17 0.02v/c Ratio 0.82 0.84 0.11 0.91 0.83 0.89 0.78 0.57 0.91 0.70 0.06Uniform Delay, d1 58.0 48.1 40.1 55.3 44.3 53.3 42.2 39.1 50.6 37.6 29.3Progression Factor 1.00 1.00 1.00 1.00 1.00 0.68 1.27 2.13 1.00 1.00 1.00Incremental Delay, d2 26.4 10.1 0.7 21.5 8.5 23.9 5.4 5.0 25.5 3.5 0.2Delay (s) 84.4 58.2 40.8 76.9 52.8 60.1 59.0 88.0 76.0 41.1 29.6Level of Service F E D E D E E F E D CApproach Delay (s) 58.9 61.4 67.4 49.5Approach LOS E E E D
Intersection SummaryHCM 2000 Control Delay 59.7 HCM 2000 Level of Service EHCM 2000 Volume to Capacity ratio 0.86Actuated Cycle Length (s) 130.0 Sum of lost time (s) 18.5Intersection Capacity Utilization 93.1% ICU Level of Service FAnalysis Period (min) 15c Critical Lane Group
Appendix Memorandum: Task 3.2 MMA Additional Needed Infrastructure Page A-133

HCM Signalized Intersection Capacity Analysis CRC MMA Queuing Analysis 109: SE 82nd Ave & SE Overland St./Shopping Center Access 10/14/2015
2010 Baseline - Ped Enhance Before Synchro 7 - ReportPage 3
Movement EBL EBT EBR WBL WBT WBR NBL NBT NBR SBL SBT SBRLane ConfigurationsVolume (vph) 76 22 31 131 23 80 56 1123 54 99 1103 21Ideal Flow (vphpl) 1900 1900 1900 1900 1900 1900 1900 1900 1900 1900 1900 1900Total Lost time (s) 4.5 4.5 4.5 4.0 4.5 4.5 4.0 4.5Lane Util. Factor 1.00 1.00 1.00 1.00 0.95 1.00 1.00 0.95Frpb, ped/bikes 0.97 1.00 0.89 1.00 1.00 0.76 1.00 1.00Flpb, ped/bikes 0.96 0.94 1.00 1.00 1.00 1.00 1.00 1.00Frt 0.97 1.00 0.85 1.00 1.00 0.85 1.00 1.00Flt Protected 0.97 0.96 1.00 0.95 1.00 1.00 0.95 1.00Satd. Flow (prot) 1624 1702 1420 1805 3539 1220 1787 3515Flt Permitted 0.57 0.66 1.00 0.95 1.00 1.00 0.95 1.00Satd. Flow (perm) 957 1165 1420 1805 3539 1220 1787 3515Peak-hour factor, PHF 0.95 0.95 0.95 0.95 0.95 0.95 0.95 0.95 0.95 0.95 0.95 0.95Adj. Flow (vph) 80 23 33 138 24 84 59 1182 57 104 1161 22RTOR Reduction (vph) 0 9 0 0 0 68 0 0 18 0 1 0Lane Group Flow (vph) 0 127 0 0 162 16 59 1182 39 104 1182 0Confl. Peds. (#/hr) 60 60 60 60 60 60 60 60Heavy Vehicles (%) 3% 0% 3% 1% 0% 1% 0% 2% 0% 1% 2% 0%Turn Type Perm NA Perm NA Perm Prot NA Perm Prot NAProtected Phases 8 4 1 6 5 2Permitted Phases 8 4 4 6Actuated Green, G (s) 25.5 25.5 25.5 7.7 80.0 80.0 11.5 83.8Effective Green, g (s) 25.5 25.5 25.5 7.7 80.0 80.0 11.5 83.8Actuated g/C Ratio 0.20 0.20 0.20 0.06 0.62 0.62 0.09 0.64Clearance Time (s) 4.5 4.5 4.5 4.0 4.5 4.5 4.0 4.5Vehicle Extension (s) 4.2 4.2 4.2 2.3 4.2 4.2 2.3 4.2Lane Grp Cap (vph) 187 228 278 106 2177 750 158 2265v/s Ratio Prot 0.03 c0.33 c0.06 c0.34v/s Ratio Perm 0.13 c0.14 0.01 0.03v/c Ratio 0.68 0.71 0.06 0.56 0.54 0.05 0.66 0.52Uniform Delay, d1 48.5 48.8 42.5 59.5 14.4 9.9 57.3 12.4Progression Factor 1.00 1.00 1.00 1.03 1.82 1.92 0.97 1.16Incremental Delay, d2 18.2 17.1 0.4 3.5 0.8 0.1 5.5 0.6Delay (s) 66.6 65.9 42.9 64.5 27.1 19.2 61.4 14.9Level of Service E E D E C B E BApproach Delay (s) 66.6 58.1 28.4 18.7Approach LOS E E C B
Intersection SummaryHCM 2000 Control Delay 28.4 HCM 2000 Level of Service CHCM 2000 Volume to Capacity ratio 0.58Actuated Cycle Length (s) 130.0 Sum of lost time (s) 13.0Intersection Capacity Utilization 80.6% ICU Level of Service DAnalysis Period (min) 15c Critical Lane Group
Appendix Memorandum: Task 3.2 MMA Additional Needed Infrastructure Page A-134
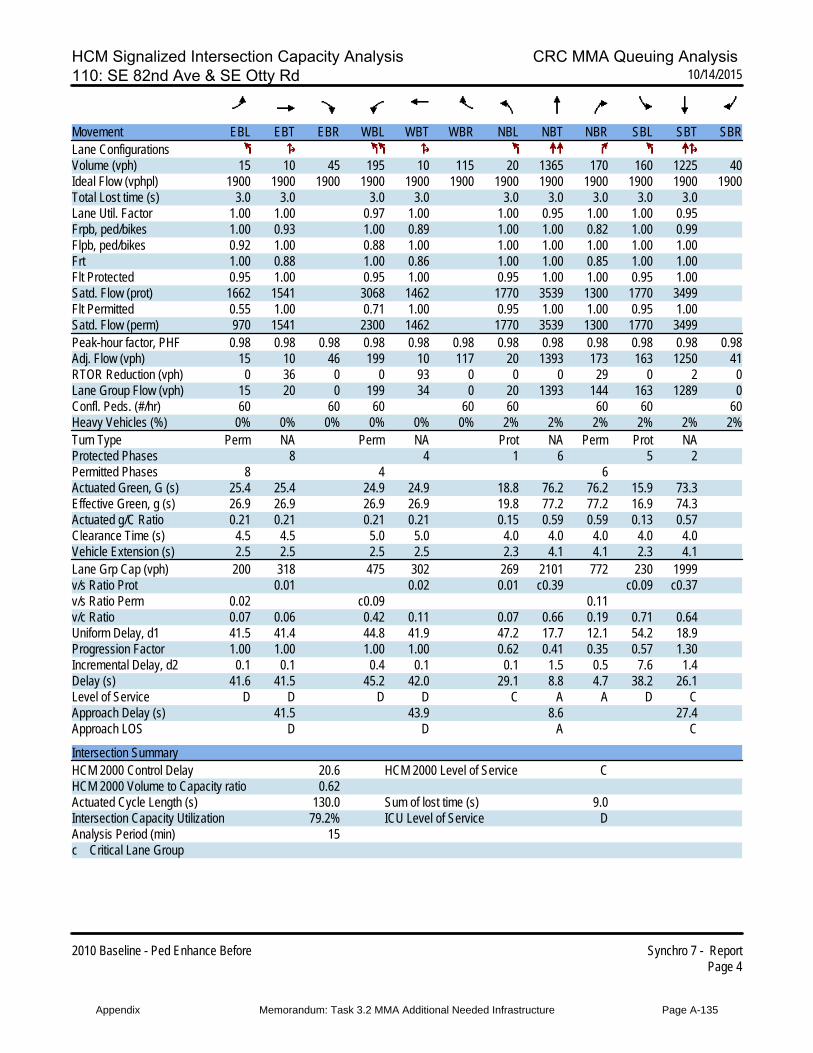
HCM Signalized Intersection Capacity Analysis CRC MMA Queuing Analysis 110: SE 82nd Ave & SE Otty Rd 10/14/2015
2010 Baseline - Ped Enhance Before Synchro 7 - ReportPage 4
Movement EBL EBT EBR WBL WBT WBR NBL NBT NBR SBL SBT SBRLane ConfigurationsVolume (vph) 15 10 45 195 10 115 20 1365 170 160 1225 40Ideal Flow (vphpl) 1900 1900 1900 1900 1900 1900 1900 1900 1900 1900 1900 1900Total Lost time (s) 3.0 3.0 3.0 3.0 3.0 3.0 3.0 3.0 3.0Lane Util. Factor 1.00 1.00 0.97 1.00 1.00 0.95 1.00 1.00 0.95Frpb, ped/bikes 1.00 0.93 1.00 0.89 1.00 1.00 0.82 1.00 0.99Flpb, ped/bikes 0.92 1.00 0.88 1.00 1.00 1.00 1.00 1.00 1.00Frt 1.00 0.88 1.00 0.86 1.00 1.00 0.85 1.00 1.00Flt Protected 0.95 1.00 0.95 1.00 0.95 1.00 1.00 0.95 1.00Satd. Flow (prot) 1662 1541 3068 1462 1770 3539 1300 1770 3499Flt Permitted 0.55 1.00 0.71 1.00 0.95 1.00 1.00 0.95 1.00Satd. Flow (perm) 970 1541 2300 1462 1770 3539 1300 1770 3499Peak-hour factor, PHF 0.98 0.98 0.98 0.98 0.98 0.98 0.98 0.98 0.98 0.98 0.98 0.98Adj. Flow (vph) 15 10 46 199 10 117 20 1393 173 163 1250 41RTOR Reduction (vph) 0 36 0 0 93 0 0 0 29 0 2 0Lane Group Flow (vph) 15 20 0 199 34 0 20 1393 144 163 1289 0Confl. Peds. (#/hr) 60 60 60 60 60 60 60 60Heavy Vehicles (%) 0% 0% 0% 0% 0% 0% 2% 2% 2% 2% 2% 2%Turn Type Perm NA Perm NA Prot NA Perm Prot NAProtected Phases 8 4 1 6 5 2Permitted Phases 8 4 6Actuated Green, G (s) 25.4 25.4 24.9 24.9 18.8 76.2 76.2 15.9 73.3Effective Green, g (s) 26.9 26.9 26.9 26.9 19.8 77.2 77.2 16.9 74.3Actuated g/C Ratio 0.21 0.21 0.21 0.21 0.15 0.59 0.59 0.13 0.57Clearance Time (s) 4.5 4.5 5.0 5.0 4.0 4.0 4.0 4.0 4.0Vehicle Extension (s) 2.5 2.5 2.5 2.5 2.3 4.1 4.1 2.3 4.1Lane Grp Cap (vph) 200 318 475 302 269 2101 772 230 1999v/s Ratio Prot 0.01 0.02 0.01 c0.39 c0.09 c0.37v/s Ratio Perm 0.02 c0.09 0.11v/c Ratio 0.07 0.06 0.42 0.11 0.07 0.66 0.19 0.71 0.64Uniform Delay, d1 41.5 41.4 44.8 41.9 47.2 17.7 12.1 54.2 18.9Progression Factor 1.00 1.00 1.00 1.00 0.62 0.41 0.35 0.57 1.30Incremental Delay, d2 0.1 0.1 0.4 0.1 0.1 1.5 0.5 7.6 1.4Delay (s) 41.6 41.5 45.2 42.0 29.1 8.8 4.7 38.2 26.1Level of Service D D D D C A A D CApproach Delay (s) 41.5 43.9 8.6 27.4Approach LOS D D A C
Intersection SummaryHCM 2000 Control Delay 20.6 HCM 2000 Level of Service CHCM 2000 Volume to Capacity ratio 0.62Actuated Cycle Length (s) 130.0 Sum of lost time (s) 9.0Intersection Capacity Utilization 79.2% ICU Level of Service DAnalysis Period (min) 15c Critical Lane Group
Appendix Memorandum: Task 3.2 MMA Additional Needed Infrastructure Page A-135
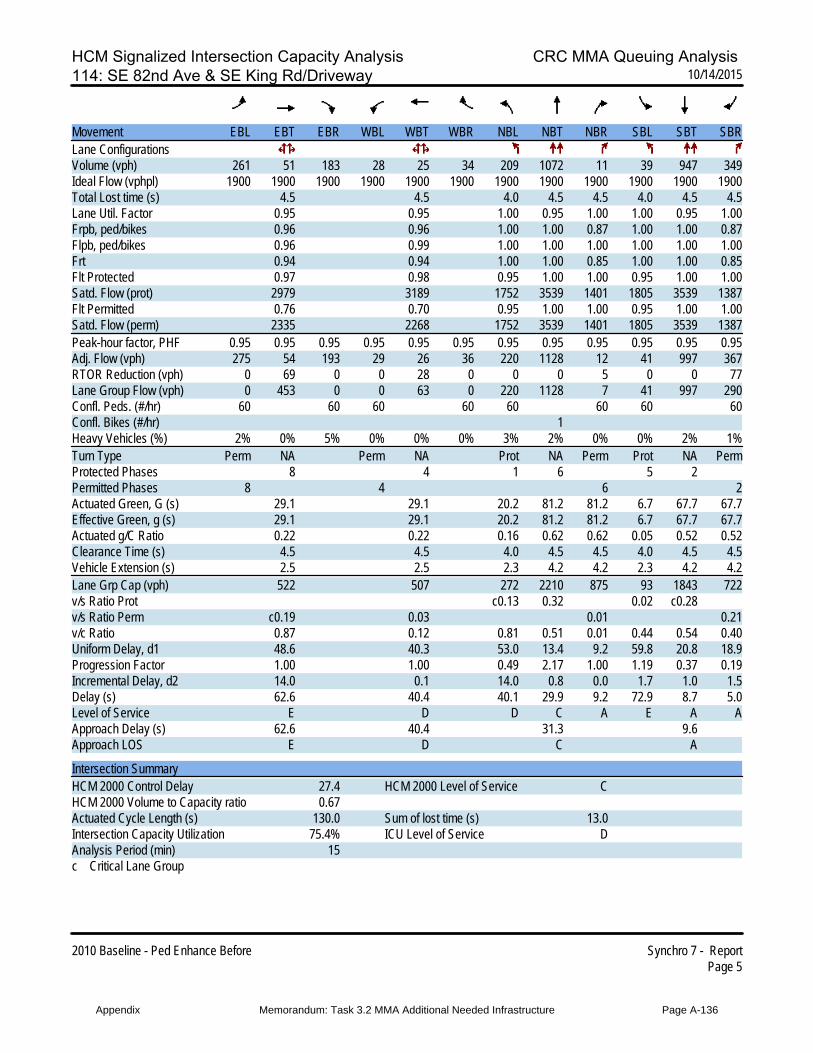
HCM Signalized Intersection Capacity Analysis CRC MMA Queuing Analysis 114: SE 82nd Ave & SE King Rd/Driveway 10/14/2015
2010 Baseline - Ped Enhance Before Synchro 7 - ReportPage 5
Movement EBL EBT EBR WBL WBT WBR NBL NBT NBR SBL SBT SBRLane ConfigurationsVolume (vph) 261 51 183 28 25 34 209 1072 11 39 947 349Ideal Flow (vphpl) 1900 1900 1900 1900 1900 1900 1900 1900 1900 1900 1900 1900Total Lost time (s) 4.5 4.5 4.0 4.5 4.5 4.0 4.5 4.5Lane Util. Factor 0.95 0.95 1.00 0.95 1.00 1.00 0.95 1.00Frpb, ped/bikes 0.96 0.96 1.00 1.00 0.87 1.00 1.00 0.87Flpb, ped/bikes 0.96 0.99 1.00 1.00 1.00 1.00 1.00 1.00Frt 0.94 0.94 1.00 1.00 0.85 1.00 1.00 0.85Flt Protected 0.97 0.98 0.95 1.00 1.00 0.95 1.00 1.00Satd. Flow (prot) 2979 3189 1752 3539 1401 1805 3539 1387Flt Permitted 0.76 0.70 0.95 1.00 1.00 0.95 1.00 1.00Satd. Flow (perm) 2335 2268 1752 3539 1401 1805 3539 1387Peak-hour factor, PHF 0.95 0.95 0.95 0.95 0.95 0.95 0.95 0.95 0.95 0.95 0.95 0.95Adj. Flow (vph) 275 54 193 29 26 36 220 1128 12 41 997 367RTOR Reduction (vph) 0 69 0 0 28 0 0 0 5 0 0 77Lane Group Flow (vph) 0 453 0 0 63 0 220 1128 7 41 997 290Confl. Peds. (#/hr) 60 60 60 60 60 60 60 60Confl. Bikes (#/hr) 1Heavy Vehicles (%) 2% 0% 5% 0% 0% 0% 3% 2% 0% 0% 2% 1%Turn Type Perm NA Perm NA Prot NA Perm Prot NA PermProtected Phases 8 4 1 6 5 2Permitted Phases 8 4 6 2Actuated Green, G (s) 29.1 29.1 20.2 81.2 81.2 6.7 67.7 67.7Effective Green, g (s) 29.1 29.1 20.2 81.2 81.2 6.7 67.7 67.7Actuated g/C Ratio 0.22 0.22 0.16 0.62 0.62 0.05 0.52 0.52Clearance Time (s) 4.5 4.5 4.0 4.5 4.5 4.0 4.5 4.5Vehicle Extension (s) 2.5 2.5 2.3 4.2 4.2 2.3 4.2 4.2Lane Grp Cap (vph) 522 507 272 2210 875 93 1843 722v/s Ratio Prot c0.13 0.32 0.02 c0.28v/s Ratio Perm c0.19 0.03 0.01 0.21v/c Ratio 0.87 0.12 0.81 0.51 0.01 0.44 0.54 0.40Uniform Delay, d1 48.6 40.3 53.0 13.4 9.2 59.8 20.8 18.9Progression Factor 1.00 1.00 0.49 2.17 1.00 1.19 0.37 0.19Incremental Delay, d2 14.0 0.1 14.0 0.8 0.0 1.7 1.0 1.5Delay (s) 62.6 40.4 40.1 29.9 9.2 72.9 8.7 5.0Level of Service E D D C A E A AApproach Delay (s) 62.6 40.4 31.3 9.6Approach LOS E D C A
Intersection SummaryHCM 2000 Control Delay 27.4 HCM 2000 Level of Service CHCM 2000 Volume to Capacity ratio 0.67Actuated Cycle Length (s) 130.0 Sum of lost time (s) 13.0Intersection Capacity Utilization 75.4% ICU Level of Service DAnalysis Period (min) 15c Critical Lane Group
Appendix Memorandum: Task 3.2 MMA Additional Needed Infrastructure Page A-136
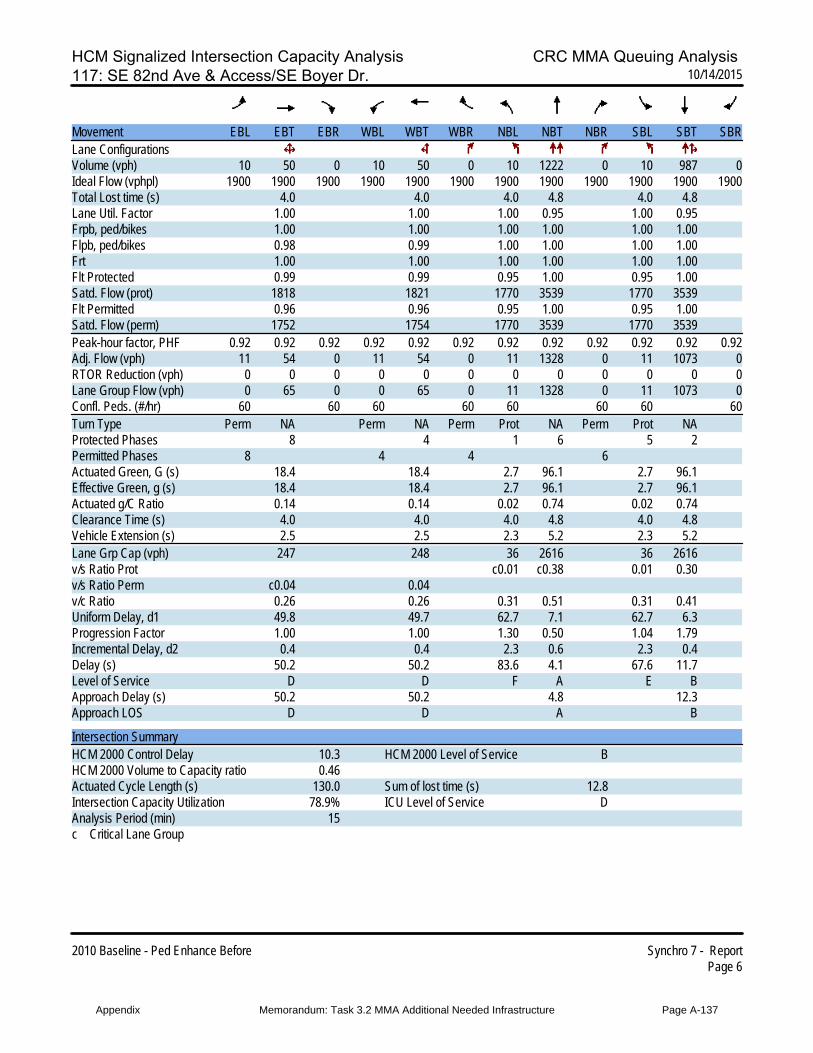
HCM Signalized Intersection Capacity Analysis CRC MMA Queuing Analysis 117: SE 82nd Ave & Access/SE Boyer Dr. 10/14/2015
2010 Baseline - Ped Enhance Before Synchro 7 - ReportPage 6
Movement EBL EBT EBR WBL WBT WBR NBL NBT NBR SBL SBT SBRLane ConfigurationsVolume (vph) 10 50 0 10 50 0 10 1222 0 10 987 0Ideal Flow (vphpl) 1900 1900 1900 1900 1900 1900 1900 1900 1900 1900 1900 1900Total Lost time (s) 4.0 4.0 4.0 4.8 4.0 4.8Lane Util. Factor 1.00 1.00 1.00 0.95 1.00 0.95Frpb, ped/bikes 1.00 1.00 1.00 1.00 1.00 1.00Flpb, ped/bikes 0.98 0.99 1.00 1.00 1.00 1.00Frt 1.00 1.00 1.00 1.00 1.00 1.00Flt Protected 0.99 0.99 0.95 1.00 0.95 1.00Satd. Flow (prot) 1818 1821 1770 3539 1770 3539Flt Permitted 0.96 0.96 0.95 1.00 0.95 1.00Satd. Flow (perm) 1752 1754 1770 3539 1770 3539Peak-hour factor, PHF 0.92 0.92 0.92 0.92 0.92 0.92 0.92 0.92 0.92 0.92 0.92 0.92Adj. Flow (vph) 11 54 0 11 54 0 11 1328 0 11 1073 0RTOR Reduction (vph) 0 0 0 0 0 0 0 0 0 0 0 0Lane Group Flow (vph) 0 65 0 0 65 0 11 1328 0 11 1073 0Confl. Peds. (#/hr) 60 60 60 60 60 60 60 60Turn Type Perm NA Perm NA Perm Prot NA Perm Prot NAProtected Phases 8 4 1 6 5 2Permitted Phases 8 4 4 6Actuated Green, G (s) 18.4 18.4 2.7 96.1 2.7 96.1Effective Green, g (s) 18.4 18.4 2.7 96.1 2.7 96.1Actuated g/C Ratio 0.14 0.14 0.02 0.74 0.02 0.74Clearance Time (s) 4.0 4.0 4.0 4.8 4.0 4.8Vehicle Extension (s) 2.5 2.5 2.3 5.2 2.3 5.2Lane Grp Cap (vph) 247 248 36 2616 36 2616v/s Ratio Prot c0.01 c0.38 0.01 0.30v/s Ratio Perm c0.04 0.04v/c Ratio 0.26 0.26 0.31 0.51 0.31 0.41Uniform Delay, d1 49.8 49.7 62.7 7.1 62.7 6.3Progression Factor 1.00 1.00 1.30 0.50 1.04 1.79Incremental Delay, d2 0.4 0.4 2.3 0.6 2.3 0.4Delay (s) 50.2 50.2 83.6 4.1 67.6 11.7Level of Service D D F A E BApproach Delay (s) 50.2 50.2 4.8 12.3Approach LOS D D A B
Intersection SummaryHCM 2000 Control Delay 10.3 HCM 2000 Level of Service BHCM 2000 Volume to Capacity ratio 0.46Actuated Cycle Length (s) 130.0 Sum of lost time (s) 12.8Intersection Capacity Utilization 78.9% ICU Level of Service DAnalysis Period (min) 15c Critical Lane Group
Appendix Memorandum: Task 3.2 MMA Additional Needed Infrastructure Page A-137
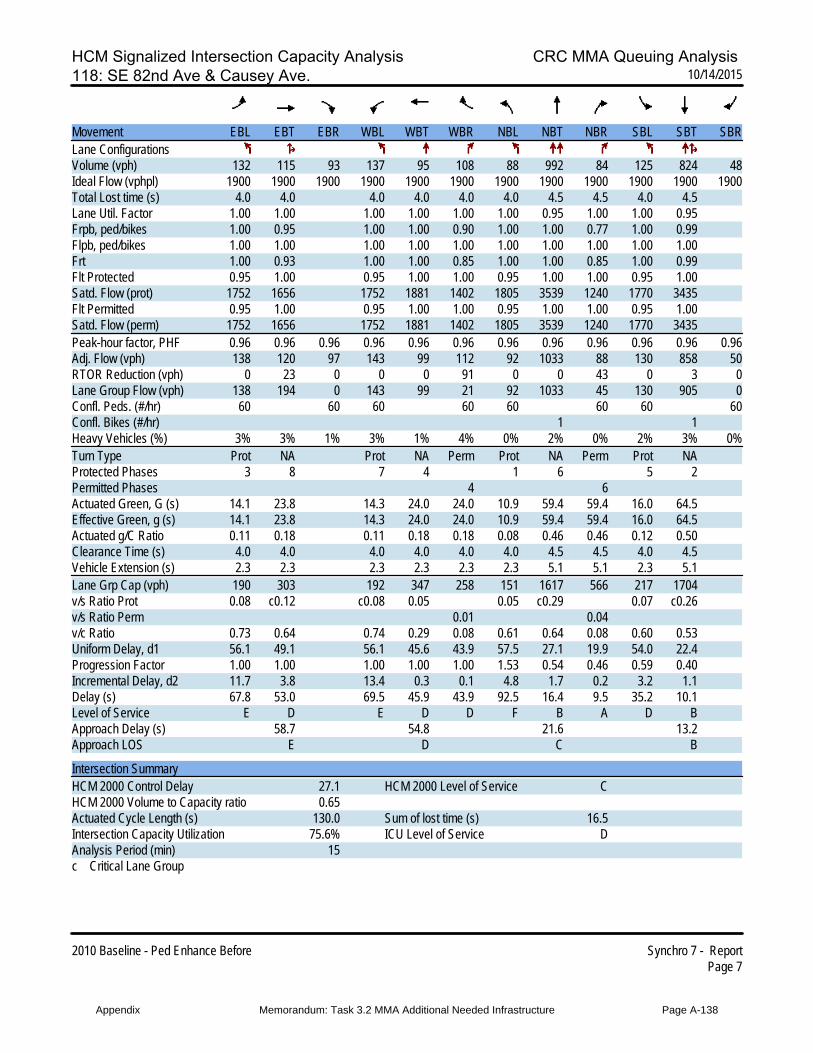
HCM Signalized Intersection Capacity Analysis CRC MMA Queuing Analysis 118: SE 82nd Ave & Causey Ave. 10/14/2015
2010 Baseline - Ped Enhance Before Synchro 7 - ReportPage 7
Movement EBL EBT EBR WBL WBT WBR NBL NBT NBR SBL SBT SBRLane ConfigurationsVolume (vph) 132 115 93 137 95 108 88 992 84 125 824 48Ideal Flow (vphpl) 1900 1900 1900 1900 1900 1900 1900 1900 1900 1900 1900 1900Total Lost time (s) 4.0 4.0 4.0 4.0 4.0 4.0 4.5 4.5 4.0 4.5Lane Util. Factor 1.00 1.00 1.00 1.00 1.00 1.00 0.95 1.00 1.00 0.95Frpb, ped/bikes 1.00 0.95 1.00 1.00 0.90 1.00 1.00 0.77 1.00 0.99Flpb, ped/bikes 1.00 1.00 1.00 1.00 1.00 1.00 1.00 1.00 1.00 1.00Frt 1.00 0.93 1.00 1.00 0.85 1.00 1.00 0.85 1.00 0.99Flt Protected 0.95 1.00 0.95 1.00 1.00 0.95 1.00 1.00 0.95 1.00Satd. Flow (prot) 1752 1656 1752 1881 1402 1805 3539 1240 1770 3435Flt Permitted 0.95 1.00 0.95 1.00 1.00 0.95 1.00 1.00 0.95 1.00Satd. Flow (perm) 1752 1656 1752 1881 1402 1805 3539 1240 1770 3435Peak-hour factor, PHF 0.96 0.96 0.96 0.96 0.96 0.96 0.96 0.96 0.96 0.96 0.96 0.96Adj. Flow (vph) 138 120 97 143 99 112 92 1033 88 130 858 50RTOR Reduction (vph) 0 23 0 0 0 91 0 0 43 0 3 0Lane Group Flow (vph) 138 194 0 143 99 21 92 1033 45 130 905 0Confl. Peds. (#/hr) 60 60 60 60 60 60 60 60Confl. Bikes (#/hr) 1 1Heavy Vehicles (%) 3% 3% 1% 3% 1% 4% 0% 2% 0% 2% 3% 0%Turn Type Prot NA Prot NA Perm Prot NA Perm Prot NAProtected Phases 3 8 7 4 1 6 5 2Permitted Phases 4 6Actuated Green, G (s) 14.1 23.8 14.3 24.0 24.0 10.9 59.4 59.4 16.0 64.5Effective Green, g (s) 14.1 23.8 14.3 24.0 24.0 10.9 59.4 59.4 16.0 64.5Actuated g/C Ratio 0.11 0.18 0.11 0.18 0.18 0.08 0.46 0.46 0.12 0.50Clearance Time (s) 4.0 4.0 4.0 4.0 4.0 4.0 4.5 4.5 4.0 4.5Vehicle Extension (s) 2.3 2.3 2.3 2.3 2.3 2.3 5.1 5.1 2.3 5.1Lane Grp Cap (vph) 190 303 192 347 258 151 1617 566 217 1704v/s Ratio Prot 0.08 c0.12 c0.08 0.05 0.05 c0.29 0.07 c0.26v/s Ratio Perm 0.01 0.04v/c Ratio 0.73 0.64 0.74 0.29 0.08 0.61 0.64 0.08 0.60 0.53Uniform Delay, d1 56.1 49.1 56.1 45.6 43.9 57.5 27.1 19.9 54.0 22.4Progression Factor 1.00 1.00 1.00 1.00 1.00 1.53 0.54 0.46 0.59 0.40Incremental Delay, d2 11.7 3.8 13.4 0.3 0.1 4.8 1.7 0.2 3.2 1.1Delay (s) 67.8 53.0 69.5 45.9 43.9 92.5 16.4 9.5 35.2 10.1Level of Service E D E D D F B A D BApproach Delay (s) 58.7 54.8 21.6 13.2Approach LOS E D C B
Intersection SummaryHCM 2000 Control Delay 27.1 HCM 2000 Level of Service CHCM 2000 Volume to Capacity ratio 0.65Actuated Cycle Length (s) 130.0 Sum of lost time (s) 16.5Intersection Capacity Utilization 75.6% ICU Level of Service DAnalysis Period (min) 15c Critical Lane Group
Appendix Memorandum: Task 3.2 MMA Additional Needed Infrastructure Page A-138
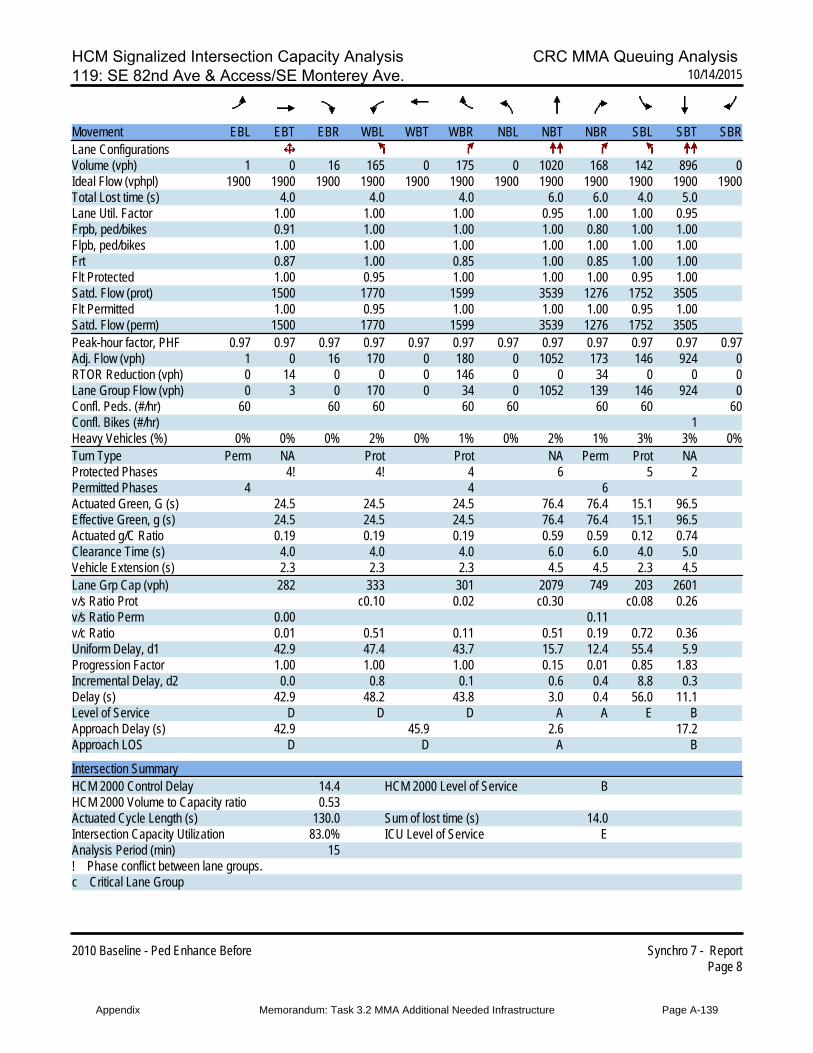
HCM Signalized Intersection Capacity Analysis CRC MMA Queuing Analysis 119: SE 82nd Ave & Access/SE Monterey Ave. 10/14/2015
2010 Baseline - Ped Enhance Before Synchro 7 - ReportPage 8
Movement EBL EBT EBR WBL WBT WBR NBL NBT NBR SBL SBT SBRLane ConfigurationsVolume (vph) 1 0 16 165 0 175 0 1020 168 142 896 0Ideal Flow (vphpl) 1900 1900 1900 1900 1900 1900 1900 1900 1900 1900 1900 1900Total Lost time (s) 4.0 4.0 4.0 6.0 6.0 4.0 5.0Lane Util. Factor 1.00 1.00 1.00 0.95 1.00 1.00 0.95Frpb, ped/bikes 0.91 1.00 1.00 1.00 0.80 1.00 1.00Flpb, ped/bikes 1.00 1.00 1.00 1.00 1.00 1.00 1.00Frt 0.87 1.00 0.85 1.00 0.85 1.00 1.00Flt Protected 1.00 0.95 1.00 1.00 1.00 0.95 1.00Satd. Flow (prot) 1500 1770 1599 3539 1276 1752 3505Flt Permitted 1.00 0.95 1.00 1.00 1.00 0.95 1.00Satd. Flow (perm) 1500 1770 1599 3539 1276 1752 3505Peak-hour factor, PHF 0.97 0.97 0.97 0.97 0.97 0.97 0.97 0.97 0.97 0.97 0.97 0.97Adj. Flow (vph) 1 0 16 170 0 180 0 1052 173 146 924 0RTOR Reduction (vph) 0 14 0 0 0 146 0 0 34 0 0 0Lane Group Flow (vph) 0 3 0 170 0 34 0 1052 139 146 924 0Confl. Peds. (#/hr) 60 60 60 60 60 60 60 60Confl. Bikes (#/hr) 1Heavy Vehicles (%) 0% 0% 0% 2% 0% 1% 0% 2% 1% 3% 3% 0%Turn Type Perm NA Prot Prot NA Perm Prot NAProtected Phases 4! 4! 4 6 5 2Permitted Phases 4 4 6Actuated Green, G (s) 24.5 24.5 24.5 76.4 76.4 15.1 96.5Effective Green, g (s) 24.5 24.5 24.5 76.4 76.4 15.1 96.5Actuated g/C Ratio 0.19 0.19 0.19 0.59 0.59 0.12 0.74Clearance Time (s) 4.0 4.0 4.0 6.0 6.0 4.0 5.0Vehicle Extension (s) 2.3 2.3 2.3 4.5 4.5 2.3 4.5Lane Grp Cap (vph) 282 333 301 2079 749 203 2601v/s Ratio Prot c0.10 0.02 c0.30 c0.08 0.26v/s Ratio Perm 0.00 0.11v/c Ratio 0.01 0.51 0.11 0.51 0.19 0.72 0.36Uniform Delay, d1 42.9 47.4 43.7 15.7 12.4 55.4 5.9Progression Factor 1.00 1.00 1.00 0.15 0.01 0.85 1.83Incremental Delay, d2 0.0 0.8 0.1 0.6 0.4 8.8 0.3Delay (s) 42.9 48.2 43.8 3.0 0.4 56.0 11.1Level of Service D D D A A E BApproach Delay (s) 42.9 45.9 2.6 17.2Approach LOS D D A B
Intersection SummaryHCM 2000 Control Delay 14.4 HCM 2000 Level of Service BHCM 2000 Volume to Capacity ratio 0.53Actuated Cycle Length (s) 130.0 Sum of lost time (s) 14.0Intersection Capacity Utilization 83.0% ICU Level of Service EAnalysis Period (min) 15! Phase conflict between lane groups.c Critical Lane Group
Appendix Memorandum: Task 3.2 MMA Additional Needed Infrastructure Page A-139
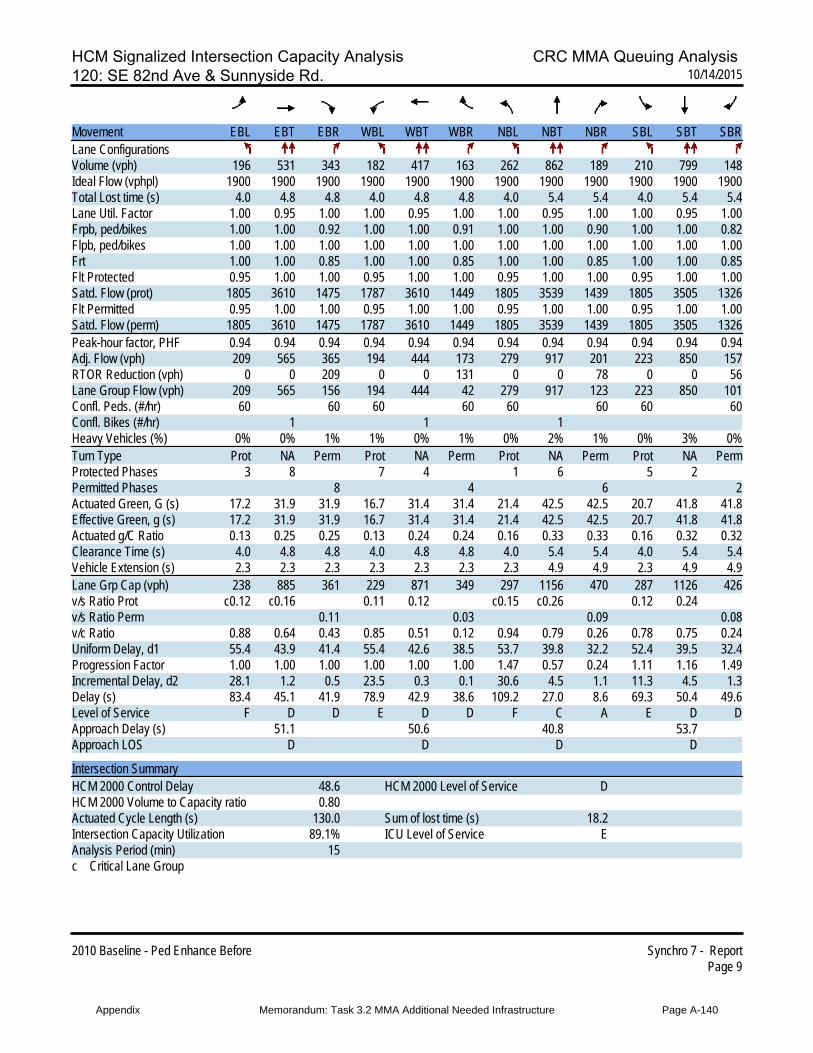
HCM Signalized Intersection Capacity Analysis CRC MMA Queuing Analysis 120: SE 82nd Ave & Sunnyside Rd. 10/14/2015
2010 Baseline - Ped Enhance Before Synchro 7 - ReportPage 9
Movement EBL EBT EBR WBL WBT WBR NBL NBT NBR SBL SBT SBRLane ConfigurationsVolume (vph) 196 531 343 182 417 163 262 862 189 210 799 148Ideal Flow (vphpl) 1900 1900 1900 1900 1900 1900 1900 1900 1900 1900 1900 1900Total Lost time (s) 4.0 4.8 4.8 4.0 4.8 4.8 4.0 5.4 5.4 4.0 5.4 5.4Lane Util. Factor 1.00 0.95 1.00 1.00 0.95 1.00 1.00 0.95 1.00 1.00 0.95 1.00Frpb, ped/bikes 1.00 1.00 0.92 1.00 1.00 0.91 1.00 1.00 0.90 1.00 1.00 0.82Flpb, ped/bikes 1.00 1.00 1.00 1.00 1.00 1.00 1.00 1.00 1.00 1.00 1.00 1.00Frt 1.00 1.00 0.85 1.00 1.00 0.85 1.00 1.00 0.85 1.00 1.00 0.85Flt Protected 0.95 1.00 1.00 0.95 1.00 1.00 0.95 1.00 1.00 0.95 1.00 1.00Satd. Flow (prot) 1805 3610 1475 1787 3610 1449 1805 3539 1439 1805 3505 1326Flt Permitted 0.95 1.00 1.00 0.95 1.00 1.00 0.95 1.00 1.00 0.95 1.00 1.00Satd. Flow (perm) 1805 3610 1475 1787 3610 1449 1805 3539 1439 1805 3505 1326Peak-hour factor, PHF 0.94 0.94 0.94 0.94 0.94 0.94 0.94 0.94 0.94 0.94 0.94 0.94Adj. Flow (vph) 209 565 365 194 444 173 279 917 201 223 850 157RTOR Reduction (vph) 0 0 209 0 0 131 0 0 78 0 0 56Lane Group Flow (vph) 209 565 156 194 444 42 279 917 123 223 850 101Confl. Peds. (#/hr) 60 60 60 60 60 60 60 60Confl. Bikes (#/hr) 1 1 1Heavy Vehicles (%) 0% 0% 1% 1% 0% 1% 0% 2% 1% 0% 3% 0%Turn Type Prot NA Perm Prot NA Perm Prot NA Perm Prot NA PermProtected Phases 3 8 7 4 1 6 5 2Permitted Phases 8 4 6 2Actuated Green, G (s) 17.2 31.9 31.9 16.7 31.4 31.4 21.4 42.5 42.5 20.7 41.8 41.8Effective Green, g (s) 17.2 31.9 31.9 16.7 31.4 31.4 21.4 42.5 42.5 20.7 41.8 41.8Actuated g/C Ratio 0.13 0.25 0.25 0.13 0.24 0.24 0.16 0.33 0.33 0.16 0.32 0.32Clearance Time (s) 4.0 4.8 4.8 4.0 4.8 4.8 4.0 5.4 5.4 4.0 5.4 5.4Vehicle Extension (s) 2.3 2.3 2.3 2.3 2.3 2.3 2.3 4.9 4.9 2.3 4.9 4.9Lane Grp Cap (vph) 238 885 361 229 871 349 297 1156 470 287 1126 426v/s Ratio Prot c0.12 c0.16 0.11 0.12 c0.15 c0.26 0.12 0.24v/s Ratio Perm 0.11 0.03 0.09 0.08v/c Ratio 0.88 0.64 0.43 0.85 0.51 0.12 0.94 0.79 0.26 0.78 0.75 0.24Uniform Delay, d1 55.4 43.9 41.4 55.4 42.6 38.5 53.7 39.8 32.2 52.4 39.5 32.4Progression Factor 1.00 1.00 1.00 1.00 1.00 1.00 1.47 0.57 0.24 1.11 1.16 1.49Incremental Delay, d2 28.1 1.2 0.5 23.5 0.3 0.1 30.6 4.5 1.1 11.3 4.5 1.3Delay (s) 83.4 45.1 41.9 78.9 42.9 38.6 109.2 27.0 8.6 69.3 50.4 49.6Level of Service F D D E D D F C A E D DApproach Delay (s) 51.1 50.6 40.8 53.7Approach LOS D D D D
Intersection SummaryHCM 2000 Control Delay 48.6 HCM 2000 Level of Service DHCM 2000 Volume to Capacity ratio 0.80Actuated Cycle Length (s) 130.0 Sum of lost time (s) 18.2Intersection Capacity Utilization 89.1% ICU Level of Service EAnalysis Period (min) 15c Critical Lane Group
Appendix Memorandum: Task 3.2 MMA Additional Needed Infrastructure Page A-140
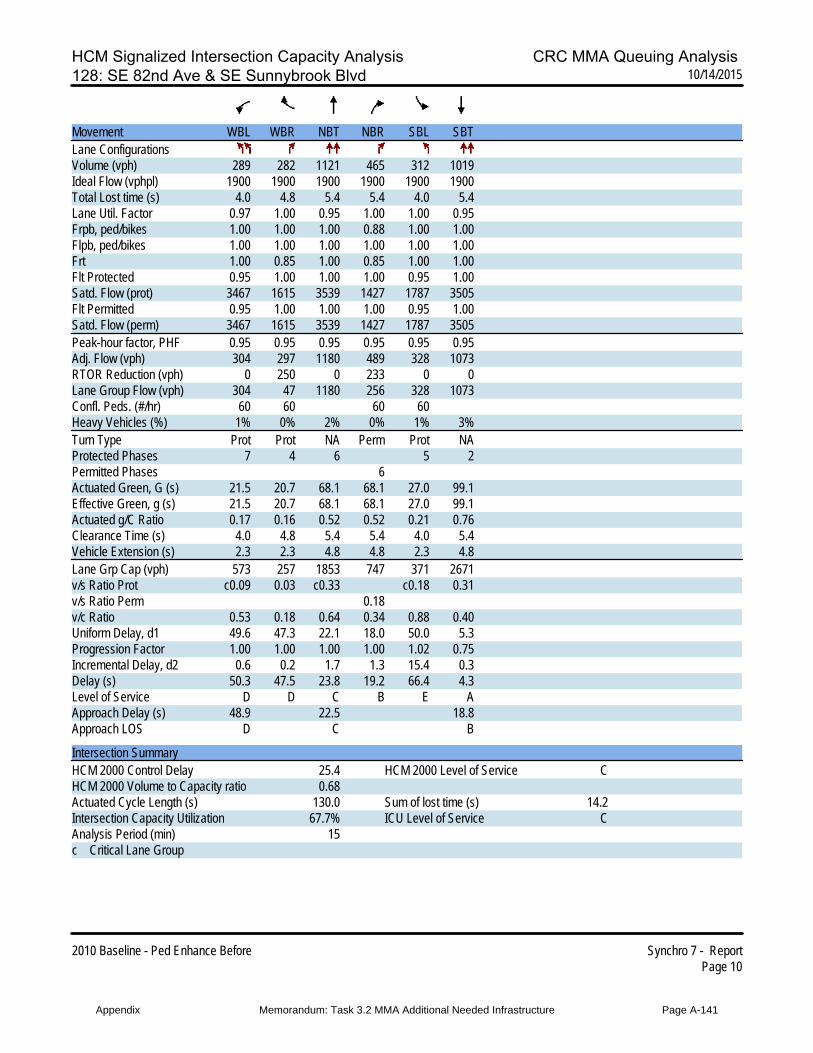
HCM Signalized Intersection Capacity Analysis CRC MMA Queuing Analysis 128: SE 82nd Ave & SE Sunnybrook Blvd 10/14/2015
2010 Baseline - Ped Enhance Before Synchro 7 - ReportPage 10
Movement WBL WBR NBT NBR SBL SBTLane ConfigurationsVolume (vph) 289 282 1121 465 312 1019Ideal Flow (vphpl) 1900 1900 1900 1900 1900 1900Total Lost time (s) 4.0 4.8 5.4 5.4 4.0 5.4Lane Util. Factor 0.97 1.00 0.95 1.00 1.00 0.95Frpb, ped/bikes 1.00 1.00 1.00 0.88 1.00 1.00Flpb, ped/bikes 1.00 1.00 1.00 1.00 1.00 1.00Frt 1.00 0.85 1.00 0.85 1.00 1.00Flt Protected 0.95 1.00 1.00 1.00 0.95 1.00Satd. Flow (prot) 3467 1615 3539 1427 1787 3505Flt Permitted 0.95 1.00 1.00 1.00 0.95 1.00Satd. Flow (perm) 3467 1615 3539 1427 1787 3505Peak-hour factor, PHF 0.95 0.95 0.95 0.95 0.95 0.95Adj. Flow (vph) 304 297 1180 489 328 1073RTOR Reduction (vph) 0 250 0 233 0 0Lane Group Flow (vph) 304 47 1180 256 328 1073Confl. Peds. (#/hr) 60 60 60 60Heavy Vehicles (%) 1% 0% 2% 0% 1% 3%Turn Type Prot Prot NA Perm Prot NAProtected Phases 7 4 6 5 2Permitted Phases 6Actuated Green, G (s) 21.5 20.7 68.1 68.1 27.0 99.1Effective Green, g (s) 21.5 20.7 68.1 68.1 27.0 99.1Actuated g/C Ratio 0.17 0.16 0.52 0.52 0.21 0.76Clearance Time (s) 4.0 4.8 5.4 5.4 4.0 5.4Vehicle Extension (s) 2.3 2.3 4.8 4.8 2.3 4.8Lane Grp Cap (vph) 573 257 1853 747 371 2671v/s Ratio Prot c0.09 0.03 c0.33 c0.18 0.31v/s Ratio Perm 0.18v/c Ratio 0.53 0.18 0.64 0.34 0.88 0.40Uniform Delay, d1 49.6 47.3 22.1 18.0 50.0 5.3Progression Factor 1.00 1.00 1.00 1.00 1.02 0.75Incremental Delay, d2 0.6 0.2 1.7 1.3 15.4 0.3Delay (s) 50.3 47.5 23.8 19.2 66.4 4.3Level of Service D D C B E AApproach Delay (s) 48.9 22.5 18.8Approach LOS D C B
Intersection SummaryHCM 2000 Control Delay 25.4 HCM 2000 Level of Service CHCM 2000 Volume to Capacity ratio 0.68Actuated Cycle Length (s) 130.0 Sum of lost time (s) 14.2Intersection Capacity Utilization 67.7% ICU Level of Service CAnalysis Period (min) 15c Critical Lane Group
Appendix Memorandum: Task 3.2 MMA Additional Needed Infrastructure Page A-141

Highway Capacity Manual (HCM) Report for 82nd Ave (Ped. Enhancements, 90 Sec.)
Appendix Memorandum: Task 3.2 MMA Additional Needed Infrastructure Page A-142
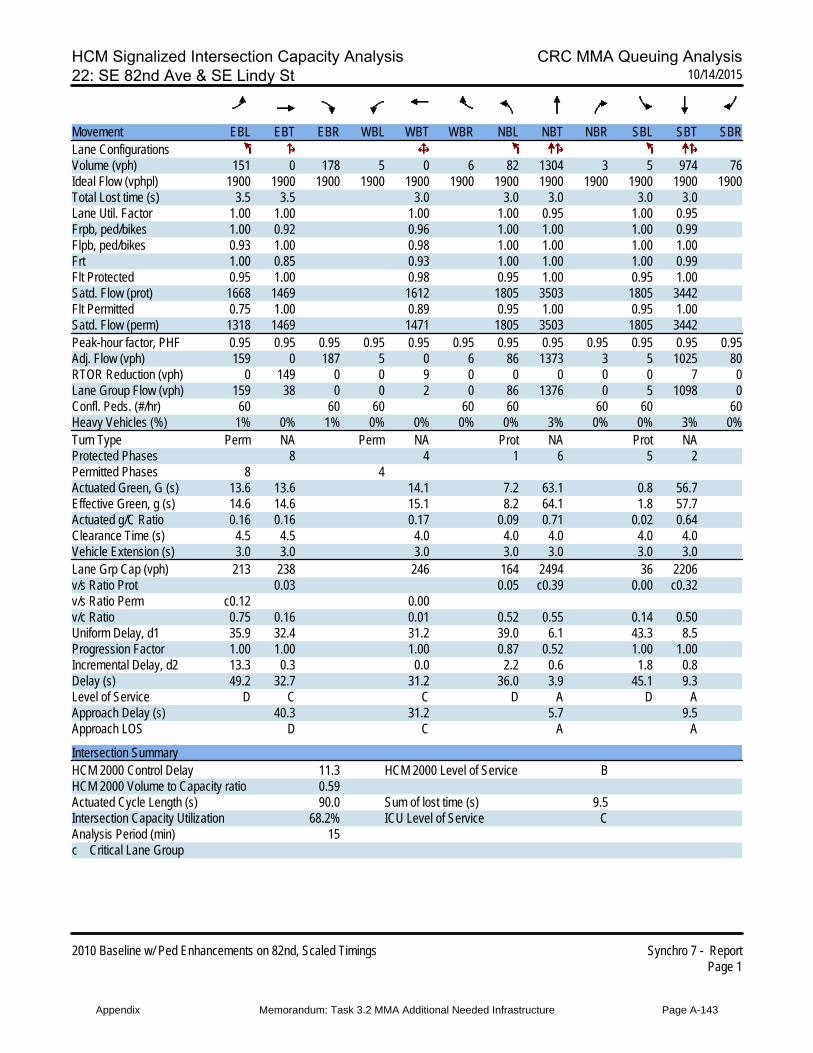
HCM Signalized Intersection Capacity Analysis CRC MMA Queuing Analysis22: SE 82nd Ave & SE Lindy St 10/14/2015
2010 Baseline w/ Ped Enhancements on 82nd, Scaled Timings Synchro 7 - ReportPage 1
Movement EBL EBT EBR WBL WBT WBR NBL NBT NBR SBL SBT SBRLane ConfigurationsVolume (vph) 151 0 178 5 0 6 82 1304 3 5 974 76Ideal Flow (vphpl) 1900 1900 1900 1900 1900 1900 1900 1900 1900 1900 1900 1900Total Lost time (s) 3.5 3.5 3.0 3.0 3.0 3.0 3.0Lane Util. Factor 1.00 1.00 1.00 1.00 0.95 1.00 0.95Frpb, ped/bikes 1.00 0.92 0.96 1.00 1.00 1.00 0.99Flpb, ped/bikes 0.93 1.00 0.98 1.00 1.00 1.00 1.00Frt 1.00 0.85 0.93 1.00 1.00 1.00 0.99Flt Protected 0.95 1.00 0.98 0.95 1.00 0.95 1.00Satd. Flow (prot) 1668 1469 1612 1805 3503 1805 3442Flt Permitted 0.75 1.00 0.89 0.95 1.00 0.95 1.00Satd. Flow (perm) 1318 1469 1471 1805 3503 1805 3442Peak-hour factor, PHF 0.95 0.95 0.95 0.95 0.95 0.95 0.95 0.95 0.95 0.95 0.95 0.95Adj. Flow (vph) 159 0 187 5 0 6 86 1373 3 5 1025 80RTOR Reduction (vph) 0 149 0 0 9 0 0 0 0 0 7 0Lane Group Flow (vph) 159 38 0 0 2 0 86 1376 0 5 1098 0Confl. Peds. (#/hr) 60 60 60 60 60 60 60 60Heavy Vehicles (%) 1% 0% 1% 0% 0% 0% 0% 3% 0% 0% 3% 0%Turn Type Perm NA Perm NA Prot NA Prot NAProtected Phases 8 4 1 6 5 2Permitted Phases 8 4Actuated Green, G (s) 13.6 13.6 14.1 7.2 63.1 0.8 56.7Effective Green, g (s) 14.6 14.6 15.1 8.2 64.1 1.8 57.7Actuated g/C Ratio 0.16 0.16 0.17 0.09 0.71 0.02 0.64Clearance Time (s) 4.5 4.5 4.0 4.0 4.0 4.0 4.0Vehicle Extension (s) 3.0 3.0 3.0 3.0 3.0 3.0 3.0Lane Grp Cap (vph) 213 238 246 164 2494 36 2206v/s Ratio Prot 0.03 0.05 c0.39 0.00 c0.32v/s Ratio Perm c0.12 0.00v/c Ratio 0.75 0.16 0.01 0.52 0.55 0.14 0.50Uniform Delay, d1 35.9 32.4 31.2 39.0 6.1 43.3 8.5Progression Factor 1.00 1.00 1.00 0.87 0.52 1.00 1.00Incremental Delay, d2 13.3 0.3 0.0 2.2 0.6 1.8 0.8Delay (s) 49.2 32.7 31.2 36.0 3.9 45.1 9.3Level of Service D C C D A D AApproach Delay (s) 40.3 31.2 5.7 9.5Approach LOS D C A A
Intersection SummaryHCM 2000 Control Delay 11.3 HCM 2000 Level of Service BHCM 2000 Volume to Capacity ratio 0.59Actuated Cycle Length (s) 90.0 Sum of lost time (s) 9.5Intersection Capacity Utilization 68.2% ICU Level of Service CAnalysis Period (min) 15c Critical Lane Group
Appendix Memorandum: Task 3.2 MMA Additional Needed Infrastructure Page A-143
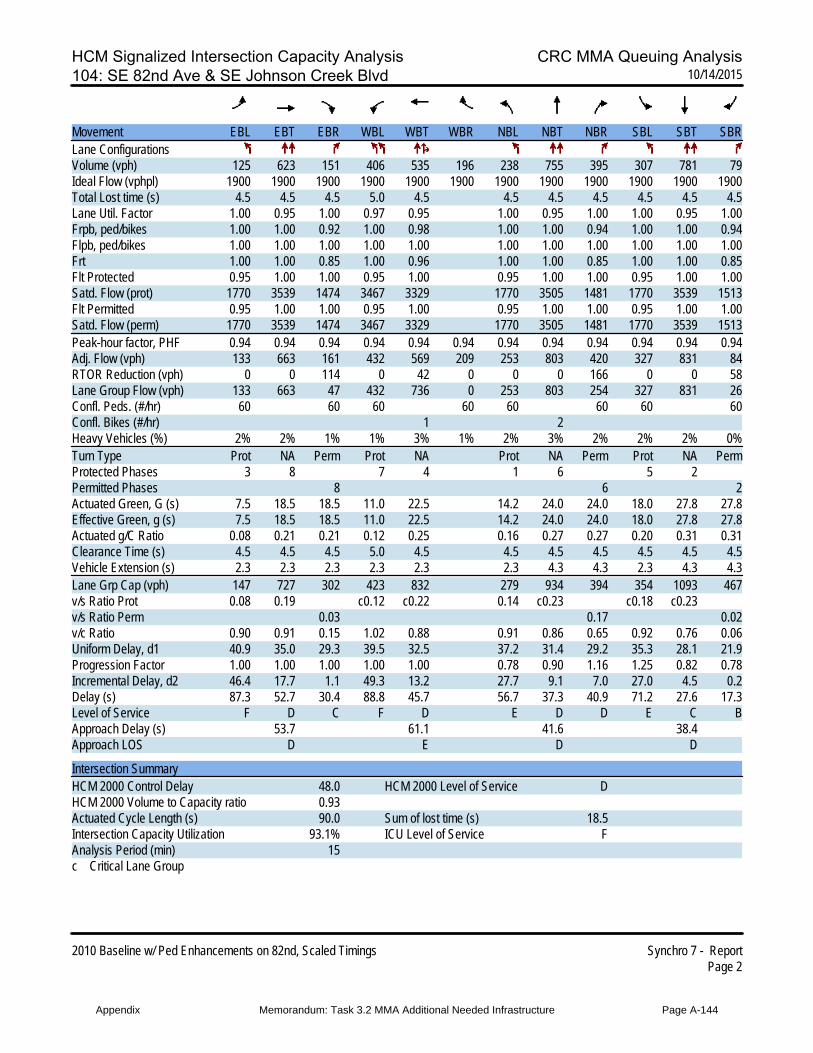
HCM Signalized Intersection Capacity Analysis CRC MMA Queuing Analysis104: SE 82nd Ave & SE Johnson Creek Blvd 10/14/2015
2010 Baseline w/ Ped Enhancements on 82nd, Scaled Timings Synchro 7 - ReportPage 2
Movement EBL EBT EBR WBL WBT WBR NBL NBT NBR SBL SBT SBRLane ConfigurationsVolume (vph) 125 623 151 406 535 196 238 755 395 307 781 79Ideal Flow (vphpl) 1900 1900 1900 1900 1900 1900 1900 1900 1900 1900 1900 1900Total Lost time (s) 4.5 4.5 4.5 5.0 4.5 4.5 4.5 4.5 4.5 4.5 4.5Lane Util. Factor 1.00 0.95 1.00 0.97 0.95 1.00 0.95 1.00 1.00 0.95 1.00Frpb, ped/bikes 1.00 1.00 0.92 1.00 0.98 1.00 1.00 0.94 1.00 1.00 0.94Flpb, ped/bikes 1.00 1.00 1.00 1.00 1.00 1.00 1.00 1.00 1.00 1.00 1.00Frt 1.00 1.00 0.85 1.00 0.96 1.00 1.00 0.85 1.00 1.00 0.85Flt Protected 0.95 1.00 1.00 0.95 1.00 0.95 1.00 1.00 0.95 1.00 1.00Satd. Flow (prot) 1770 3539 1474 3467 3329 1770 3505 1481 1770 3539 1513Flt Permitted 0.95 1.00 1.00 0.95 1.00 0.95 1.00 1.00 0.95 1.00 1.00Satd. Flow (perm) 1770 3539 1474 3467 3329 1770 3505 1481 1770 3539 1513Peak-hour factor, PHF 0.94 0.94 0.94 0.94 0.94 0.94 0.94 0.94 0.94 0.94 0.94 0.94Adj. Flow (vph) 133 663 161 432 569 209 253 803 420 327 831 84RTOR Reduction (vph) 0 0 114 0 42 0 0 0 166 0 0 58Lane Group Flow (vph) 133 663 47 432 736 0 253 803 254 327 831 26Confl. Peds. (#/hr) 60 60 60 60 60 60 60 60Confl. Bikes (#/hr) 1 2Heavy Vehicles (%) 2% 2% 1% 1% 3% 1% 2% 3% 2% 2% 2% 0%Turn Type Prot NA Perm Prot NA Prot NA Perm Prot NA PermProtected Phases 3 8 7 4 1 6 5 2Permitted Phases 8 6 2Actuated Green, G (s) 7.5 18.5 18.5 11.0 22.5 14.2 24.0 24.0 18.0 27.8 27.8Effective Green, g (s) 7.5 18.5 18.5 11.0 22.5 14.2 24.0 24.0 18.0 27.8 27.8Actuated g/C Ratio 0.08 0.21 0.21 0.12 0.25 0.16 0.27 0.27 0.20 0.31 0.31Clearance Time (s) 4.5 4.5 4.5 5.0 4.5 4.5 4.5 4.5 4.5 4.5 4.5Vehicle Extension (s) 2.3 2.3 2.3 2.3 2.3 2.3 4.3 4.3 2.3 4.3 4.3Lane Grp Cap (vph) 147 727 302 423 832 279 934 394 354 1093 467v/s Ratio Prot 0.08 0.19 c0.12 c0.22 0.14 c0.23 c0.18 c0.23v/s Ratio Perm 0.03 0.17 0.02v/c Ratio 0.90 0.91 0.15 1.02 0.88 0.91 0.86 0.65 0.92 0.76 0.06Uniform Delay, d1 40.9 35.0 29.3 39.5 32.5 37.2 31.4 29.2 35.3 28.1 21.9Progression Factor 1.00 1.00 1.00 1.00 1.00 0.78 0.90 1.16 1.25 0.82 0.78Incremental Delay, d2 46.4 17.7 1.1 49.3 13.2 27.7 9.1 7.0 27.0 4.5 0.2Delay (s) 87.3 52.7 30.4 88.8 45.7 56.7 37.3 40.9 71.2 27.6 17.3Level of Service F D C F D E D D E C BApproach Delay (s) 53.7 61.1 41.6 38.4Approach LOS D E D D
Intersection SummaryHCM 2000 Control Delay 48.0 HCM 2000 Level of Service DHCM 2000 Volume to Capacity ratio 0.93Actuated Cycle Length (s) 90.0 Sum of lost time (s) 18.5Intersection Capacity Utilization 93.1% ICU Level of Service FAnalysis Period (min) 15c Critical Lane Group
Appendix Memorandum: Task 3.2 MMA Additional Needed Infrastructure Page A-144
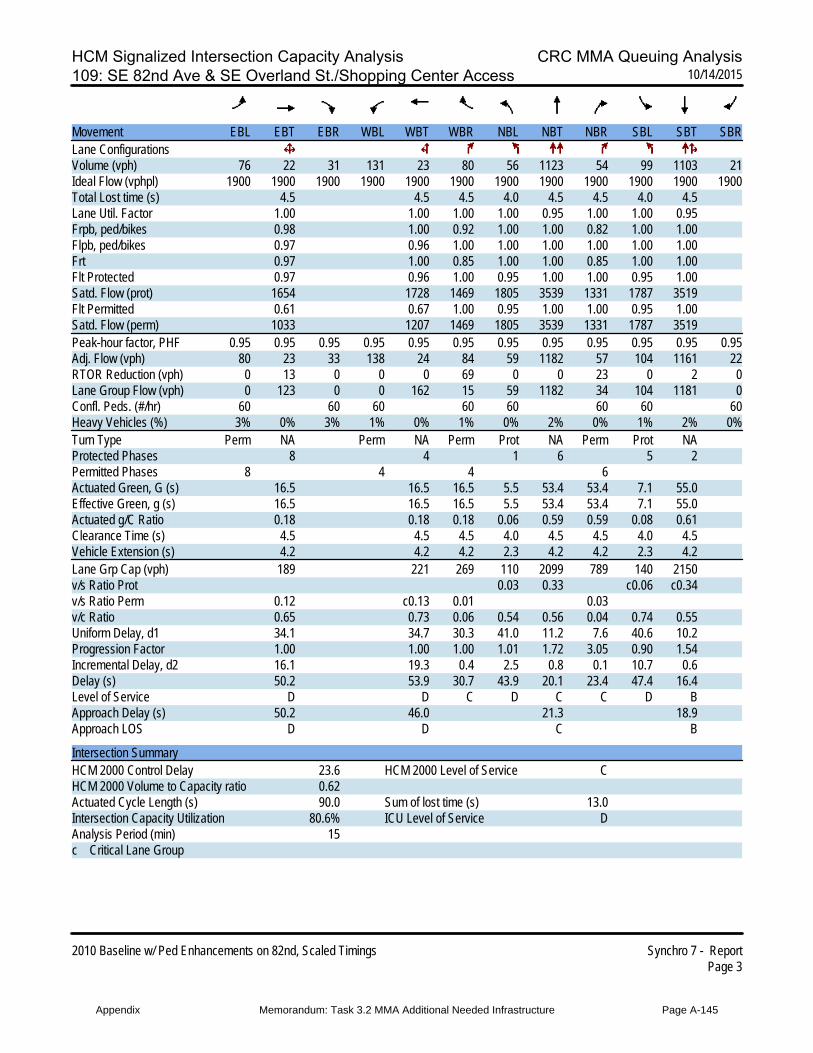
HCM Signalized Intersection Capacity Analysis CRC MMA Queuing Analysis109: SE 82nd Ave & SE Overland St./Shopping Center Access 10/14/2015
2010 Baseline w/ Ped Enhancements on 82nd, Scaled Timings Synchro 7 - ReportPage 3
Movement EBL EBT EBR WBL WBT WBR NBL NBT NBR SBL SBT SBRLane ConfigurationsVolume (vph) 76 22 31 131 23 80 56 1123 54 99 1103 21Ideal Flow (vphpl) 1900 1900 1900 1900 1900 1900 1900 1900 1900 1900 1900 1900Total Lost time (s) 4.5 4.5 4.5 4.0 4.5 4.5 4.0 4.5Lane Util. Factor 1.00 1.00 1.00 1.00 0.95 1.00 1.00 0.95Frpb, ped/bikes 0.98 1.00 0.92 1.00 1.00 0.82 1.00 1.00Flpb, ped/bikes 0.97 0.96 1.00 1.00 1.00 1.00 1.00 1.00Frt 0.97 1.00 0.85 1.00 1.00 0.85 1.00 1.00Flt Protected 0.97 0.96 1.00 0.95 1.00 1.00 0.95 1.00Satd. Flow (prot) 1654 1728 1469 1805 3539 1331 1787 3519Flt Permitted 0.61 0.67 1.00 0.95 1.00 1.00 0.95 1.00Satd. Flow (perm) 1033 1207 1469 1805 3539 1331 1787 3519Peak-hour factor, PHF 0.95 0.95 0.95 0.95 0.95 0.95 0.95 0.95 0.95 0.95 0.95 0.95Adj. Flow (vph) 80 23 33 138 24 84 59 1182 57 104 1161 22RTOR Reduction (vph) 0 13 0 0 0 69 0 0 23 0 2 0Lane Group Flow (vph) 0 123 0 0 162 15 59 1182 34 104 1181 0Confl. Peds. (#/hr) 60 60 60 60 60 60 60 60Heavy Vehicles (%) 3% 0% 3% 1% 0% 1% 0% 2% 0% 1% 2% 0%Turn Type Perm NA Perm NA Perm Prot NA Perm Prot NAProtected Phases 8 4 1 6 5 2Permitted Phases 8 4 4 6Actuated Green, G (s) 16.5 16.5 16.5 5.5 53.4 53.4 7.1 55.0Effective Green, g (s) 16.5 16.5 16.5 5.5 53.4 53.4 7.1 55.0Actuated g/C Ratio 0.18 0.18 0.18 0.06 0.59 0.59 0.08 0.61Clearance Time (s) 4.5 4.5 4.5 4.0 4.5 4.5 4.0 4.5Vehicle Extension (s) 4.2 4.2 4.2 2.3 4.2 4.2 2.3 4.2Lane Grp Cap (vph) 189 221 269 110 2099 789 140 2150v/s Ratio Prot 0.03 0.33 c0.06 c0.34v/s Ratio Perm 0.12 c0.13 0.01 0.03v/c Ratio 0.65 0.73 0.06 0.54 0.56 0.04 0.74 0.55Uniform Delay, d1 34.1 34.7 30.3 41.0 11.2 7.6 40.6 10.2Progression Factor 1.00 1.00 1.00 1.01 1.72 3.05 0.90 1.54Incremental Delay, d2 16.1 19.3 0.4 2.5 0.8 0.1 10.7 0.6Delay (s) 50.2 53.9 30.7 43.9 20.1 23.4 47.4 16.4Level of Service D D C D C C D BApproach Delay (s) 50.2 46.0 21.3 18.9Approach LOS D D C B
Intersection SummaryHCM 2000 Control Delay 23.6 HCM 2000 Level of Service CHCM 2000 Volume to Capacity ratio 0.62Actuated Cycle Length (s) 90.0 Sum of lost time (s) 13.0Intersection Capacity Utilization 80.6% ICU Level of Service DAnalysis Period (min) 15c Critical Lane Group
Appendix Memorandum: Task 3.2 MMA Additional Needed Infrastructure Page A-145
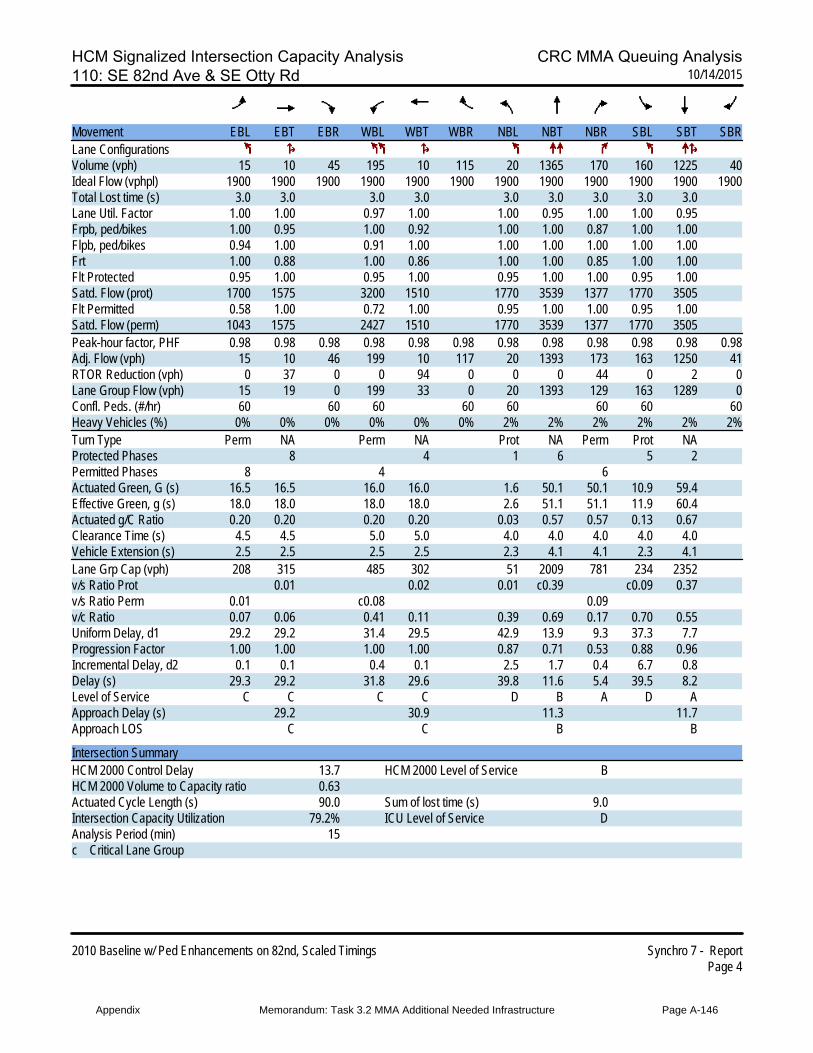
HCM Signalized Intersection Capacity Analysis CRC MMA Queuing Analysis110: SE 82nd Ave & SE Otty Rd 10/14/2015
2010 Baseline w/ Ped Enhancements on 82nd, Scaled Timings Synchro 7 - ReportPage 4
Movement EBL EBT EBR WBL WBT WBR NBL NBT NBR SBL SBT SBRLane ConfigurationsVolume (vph) 15 10 45 195 10 115 20 1365 170 160 1225 40Ideal Flow (vphpl) 1900 1900 1900 1900 1900 1900 1900 1900 1900 1900 1900 1900Total Lost time (s) 3.0 3.0 3.0 3.0 3.0 3.0 3.0 3.0 3.0Lane Util. Factor 1.00 1.00 0.97 1.00 1.00 0.95 1.00 1.00 0.95Frpb, ped/bikes 1.00 0.95 1.00 0.92 1.00 1.00 0.87 1.00 1.00Flpb, ped/bikes 0.94 1.00 0.91 1.00 1.00 1.00 1.00 1.00 1.00Frt 1.00 0.88 1.00 0.86 1.00 1.00 0.85 1.00 1.00Flt Protected 0.95 1.00 0.95 1.00 0.95 1.00 1.00 0.95 1.00Satd. Flow (prot) 1700 1575 3200 1510 1770 3539 1377 1770 3505Flt Permitted 0.58 1.00 0.72 1.00 0.95 1.00 1.00 0.95 1.00Satd. Flow (perm) 1043 1575 2427 1510 1770 3539 1377 1770 3505Peak-hour factor, PHF 0.98 0.98 0.98 0.98 0.98 0.98 0.98 0.98 0.98 0.98 0.98 0.98Adj. Flow (vph) 15 10 46 199 10 117 20 1393 173 163 1250 41RTOR Reduction (vph) 0 37 0 0 94 0 0 0 44 0 2 0Lane Group Flow (vph) 15 19 0 199 33 0 20 1393 129 163 1289 0Confl. Peds. (#/hr) 60 60 60 60 60 60 60 60Heavy Vehicles (%) 0% 0% 0% 0% 0% 0% 2% 2% 2% 2% 2% 2%Turn Type Perm NA Perm NA Prot NA Perm Prot NAProtected Phases 8 4 1 6 5 2Permitted Phases 8 4 6Actuated Green, G (s) 16.5 16.5 16.0 16.0 1.6 50.1 50.1 10.9 59.4Effective Green, g (s) 18.0 18.0 18.0 18.0 2.6 51.1 51.1 11.9 60.4Actuated g/C Ratio 0.20 0.20 0.20 0.20 0.03 0.57 0.57 0.13 0.67Clearance Time (s) 4.5 4.5 5.0 5.0 4.0 4.0 4.0 4.0 4.0Vehicle Extension (s) 2.5 2.5 2.5 2.5 2.3 4.1 4.1 2.3 4.1Lane Grp Cap (vph) 208 315 485 302 51 2009 781 234 2352v/s Ratio Prot 0.01 0.02 0.01 c0.39 c0.09 0.37v/s Ratio Perm 0.01 c0.08 0.09v/c Ratio 0.07 0.06 0.41 0.11 0.39 0.69 0.17 0.70 0.55Uniform Delay, d1 29.2 29.2 31.4 29.5 42.9 13.9 9.3 37.3 7.7Progression Factor 1.00 1.00 1.00 1.00 0.87 0.71 0.53 0.88 0.96Incremental Delay, d2 0.1 0.1 0.4 0.1 2.5 1.7 0.4 6.7 0.8Delay (s) 29.3 29.2 31.8 29.6 39.8 11.6 5.4 39.5 8.2Level of Service C C C C D B A D AApproach Delay (s) 29.2 30.9 11.3 11.7Approach LOS C C B B
Intersection SummaryHCM 2000 Control Delay 13.7 HCM 2000 Level of Service BHCM 2000 Volume to Capacity ratio 0.63Actuated Cycle Length (s) 90.0 Sum of lost time (s) 9.0Intersection Capacity Utilization 79.2% ICU Level of Service DAnalysis Period (min) 15c Critical Lane Group
Appendix Memorandum: Task 3.2 MMA Additional Needed Infrastructure Page A-146
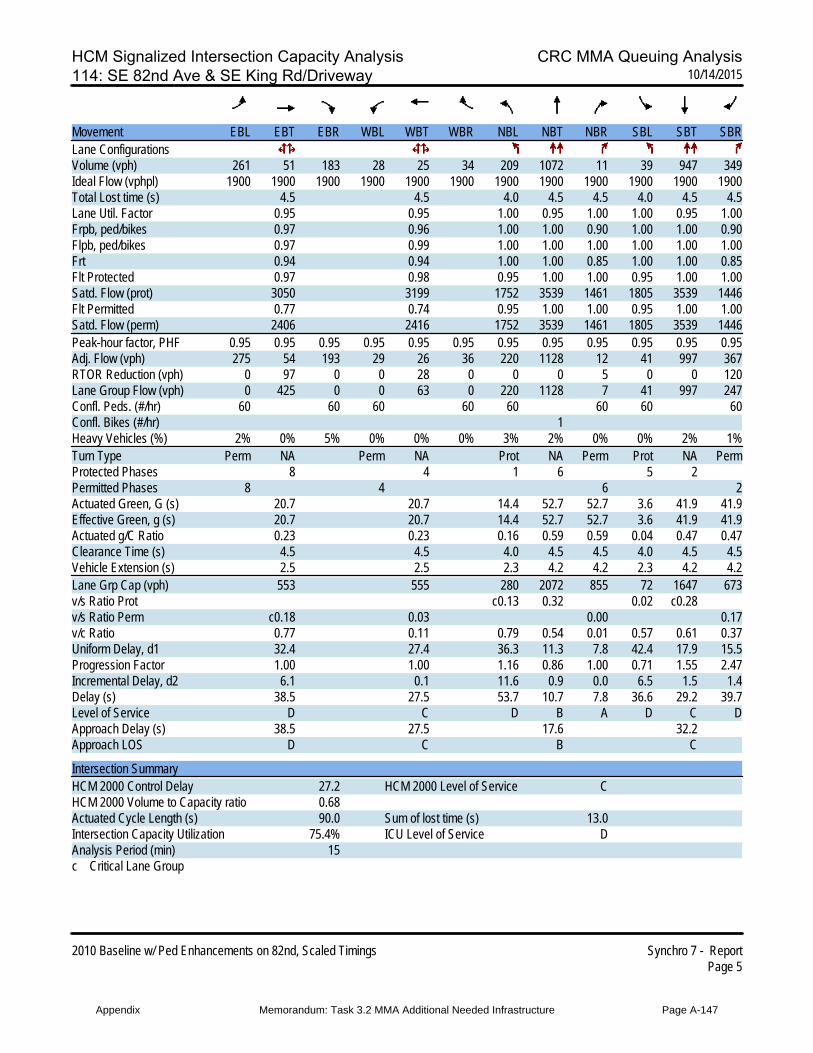
HCM Signalized Intersection Capacity Analysis CRC MMA Queuing Analysis114: SE 82nd Ave & SE King Rd/Driveway 10/14/2015
2010 Baseline w/ Ped Enhancements on 82nd, Scaled Timings Synchro 7 - ReportPage 5
Movement EBL EBT EBR WBL WBT WBR NBL NBT NBR SBL SBT SBRLane ConfigurationsVolume (vph) 261 51 183 28 25 34 209 1072 11 39 947 349Ideal Flow (vphpl) 1900 1900 1900 1900 1900 1900 1900 1900 1900 1900 1900 1900Total Lost time (s) 4.5 4.5 4.0 4.5 4.5 4.0 4.5 4.5Lane Util. Factor 0.95 0.95 1.00 0.95 1.00 1.00 0.95 1.00Frpb, ped/bikes 0.97 0.96 1.00 1.00 0.90 1.00 1.00 0.90Flpb, ped/bikes 0.97 0.99 1.00 1.00 1.00 1.00 1.00 1.00Frt 0.94 0.94 1.00 1.00 0.85 1.00 1.00 0.85Flt Protected 0.97 0.98 0.95 1.00 1.00 0.95 1.00 1.00Satd. Flow (prot) 3050 3199 1752 3539 1461 1805 3539 1446Flt Permitted 0.77 0.74 0.95 1.00 1.00 0.95 1.00 1.00Satd. Flow (perm) 2406 2416 1752 3539 1461 1805 3539 1446Peak-hour factor, PHF 0.95 0.95 0.95 0.95 0.95 0.95 0.95 0.95 0.95 0.95 0.95 0.95Adj. Flow (vph) 275 54 193 29 26 36 220 1128 12 41 997 367RTOR Reduction (vph) 0 97 0 0 28 0 0 0 5 0 0 120Lane Group Flow (vph) 0 425 0 0 63 0 220 1128 7 41 997 247Confl. Peds. (#/hr) 60 60 60 60 60 60 60 60Confl. Bikes (#/hr) 1Heavy Vehicles (%) 2% 0% 5% 0% 0% 0% 3% 2% 0% 0% 2% 1%Turn Type Perm NA Perm NA Prot NA Perm Prot NA PermProtected Phases 8 4 1 6 5 2Permitted Phases 8 4 6 2Actuated Green, G (s) 20.7 20.7 14.4 52.7 52.7 3.6 41.9 41.9Effective Green, g (s) 20.7 20.7 14.4 52.7 52.7 3.6 41.9 41.9Actuated g/C Ratio 0.23 0.23 0.16 0.59 0.59 0.04 0.47 0.47Clearance Time (s) 4.5 4.5 4.0 4.5 4.5 4.0 4.5 4.5Vehicle Extension (s) 2.5 2.5 2.3 4.2 4.2 2.3 4.2 4.2Lane Grp Cap (vph) 553 555 280 2072 855 72 1647 673v/s Ratio Prot c0.13 0.32 0.02 c0.28v/s Ratio Perm c0.18 0.03 0.00 0.17v/c Ratio 0.77 0.11 0.79 0.54 0.01 0.57 0.61 0.37Uniform Delay, d1 32.4 27.4 36.3 11.3 7.8 42.4 17.9 15.5Progression Factor 1.00 1.00 1.16 0.86 1.00 0.71 1.55 2.47Incremental Delay, d2 6.1 0.1 11.6 0.9 0.0 6.5 1.5 1.4Delay (s) 38.5 27.5 53.7 10.7 7.8 36.6 29.2 39.7Level of Service D C D B A D C DApproach Delay (s) 38.5 27.5 17.6 32.2Approach LOS D C B C
Intersection SummaryHCM 2000 Control Delay 27.2 HCM 2000 Level of Service CHCM 2000 Volume to Capacity ratio 0.68Actuated Cycle Length (s) 90.0 Sum of lost time (s) 13.0Intersection Capacity Utilization 75.4% ICU Level of Service DAnalysis Period (min) 15c Critical Lane Group
Appendix Memorandum: Task 3.2 MMA Additional Needed Infrastructure Page A-147

HCM Signalized Intersection Capacity Analysis CRC MMA Queuing Analysis117: SE 82nd Ave & Access/SE Boyer Dr. 10/14/2015
2010 Baseline w/ Ped Enhancements on 82nd, Scaled Timings Synchro 7 - ReportPage 6
Movement EBL EBT EBR WBL WBT WBR NBL NBT NBR SBL SBT SBRLane ConfigurationsVolume (vph) 10 50 0 10 50 0 10 1222 0 10 987 0Ideal Flow (vphpl) 1900 1900 1900 1900 1900 1900 1900 1900 1900 1900 1900 1900Total Lost time (s) 4.0 4.0 4.0 4.8 4.0 4.8Lane Util. Factor 1.00 1.00 1.00 0.95 1.00 0.95Frpb, ped/bikes 1.00 1.00 1.00 1.00 1.00 1.00Flpb, ped/bikes 0.99 0.99 1.00 1.00 1.00 1.00Frt 1.00 1.00 1.00 1.00 1.00 1.00Flt Protected 0.99 0.99 0.95 1.00 0.95 1.00Satd. Flow (prot) 1827 1828 1770 3539 1770 3539Flt Permitted 0.95 0.95 0.95 1.00 0.95 1.00Satd. Flow (perm) 1753 1754 1770 3539 1770 3539Peak-hour factor, PHF 0.92 0.92 0.92 0.92 0.92 0.92 0.92 0.92 0.92 0.92 0.92 0.92Adj. Flow (vph) 11 54 0 11 54 0 11 1328 0 11 1073 0RTOR Reduction (vph) 0 0 0 0 0 0 0 0 0 0 0 0Lane Group Flow (vph) 0 65 0 0 65 0 11 1328 0 11 1073 0Confl. Peds. (#/hr) 60 60 60 60 60 60 60 60Turn Type Perm NA Perm NA Perm Prot NA Perm Prot NAProtected Phases 8 4 1 6 5 2Permitted Phases 8 4 4 6Actuated Green, G (s) 12.0 12.0 1.3 63.9 1.3 63.9Effective Green, g (s) 12.0 12.0 1.3 63.9 1.3 63.9Actuated g/C Ratio 0.13 0.13 0.01 0.71 0.01 0.71Clearance Time (s) 4.0 4.0 4.0 4.8 4.0 4.8Vehicle Extension (s) 2.5 2.5 2.3 5.2 2.3 5.2Lane Grp Cap (vph) 233 233 25 2512 25 2512v/s Ratio Prot c0.01 c0.38 0.01 0.30v/s Ratio Perm c0.04 0.04v/c Ratio 0.28 0.28 0.44 0.53 0.44 0.43Uniform Delay, d1 35.1 35.1 44.0 6.1 44.0 5.4Progression Factor 1.00 1.00 1.51 0.43 1.05 0.46Incremental Delay, d2 0.5 0.5 5.5 0.6 5.6 0.4Delay (s) 35.6 35.6 71.9 3.2 52.0 2.9Level of Service D D E A D AApproach Delay (s) 35.6 35.6 3.8 3.4Approach LOS D D A A
Intersection SummaryHCM 2000 Control Delay 5.2 HCM 2000 Level of Service AHCM 2000 Volume to Capacity ratio 0.49Actuated Cycle Length (s) 90.0 Sum of lost time (s) 12.8Intersection Capacity Utilization 78.9% ICU Level of Service DAnalysis Period (min) 15c Critical Lane Group
Appendix Memorandum: Task 3.2 MMA Additional Needed Infrastructure Page A-148
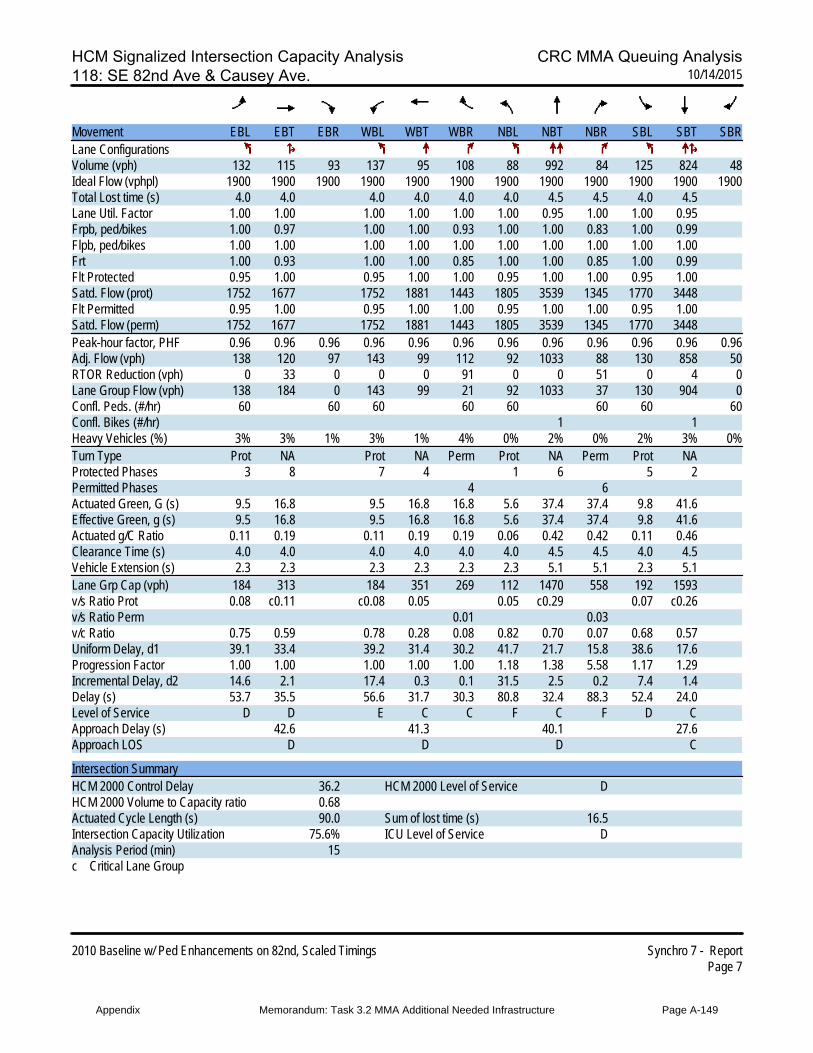
HCM Signalized Intersection Capacity Analysis CRC MMA Queuing Analysis118: SE 82nd Ave & Causey Ave. 10/14/2015
2010 Baseline w/ Ped Enhancements on 82nd, Scaled Timings Synchro 7 - ReportPage 7
Movement EBL EBT EBR WBL WBT WBR NBL NBT NBR SBL SBT SBRLane ConfigurationsVolume (vph) 132 115 93 137 95 108 88 992 84 125 824 48Ideal Flow (vphpl) 1900 1900 1900 1900 1900 1900 1900 1900 1900 1900 1900 1900Total Lost time (s) 4.0 4.0 4.0 4.0 4.0 4.0 4.5 4.5 4.0 4.5Lane Util. Factor 1.00 1.00 1.00 1.00 1.00 1.00 0.95 1.00 1.00 0.95Frpb, ped/bikes 1.00 0.97 1.00 1.00 0.93 1.00 1.00 0.83 1.00 0.99Flpb, ped/bikes 1.00 1.00 1.00 1.00 1.00 1.00 1.00 1.00 1.00 1.00Frt 1.00 0.93 1.00 1.00 0.85 1.00 1.00 0.85 1.00 0.99Flt Protected 0.95 1.00 0.95 1.00 1.00 0.95 1.00 1.00 0.95 1.00Satd. Flow (prot) 1752 1677 1752 1881 1443 1805 3539 1345 1770 3448Flt Permitted 0.95 1.00 0.95 1.00 1.00 0.95 1.00 1.00 0.95 1.00Satd. Flow (perm) 1752 1677 1752 1881 1443 1805 3539 1345 1770 3448Peak-hour factor, PHF 0.96 0.96 0.96 0.96 0.96 0.96 0.96 0.96 0.96 0.96 0.96 0.96Adj. Flow (vph) 138 120 97 143 99 112 92 1033 88 130 858 50RTOR Reduction (vph) 0 33 0 0 0 91 0 0 51 0 4 0Lane Group Flow (vph) 138 184 0 143 99 21 92 1033 37 130 904 0Confl. Peds. (#/hr) 60 60 60 60 60 60 60 60Confl. Bikes (#/hr) 1 1Heavy Vehicles (%) 3% 3% 1% 3% 1% 4% 0% 2% 0% 2% 3% 0%Turn Type Prot NA Prot NA Perm Prot NA Perm Prot NAProtected Phases 3 8 7 4 1 6 5 2Permitted Phases 4 6Actuated Green, G (s) 9.5 16.8 9.5 16.8 16.8 5.6 37.4 37.4 9.8 41.6Effective Green, g (s) 9.5 16.8 9.5 16.8 16.8 5.6 37.4 37.4 9.8 41.6Actuated g/C Ratio 0.11 0.19 0.11 0.19 0.19 0.06 0.42 0.42 0.11 0.46Clearance Time (s) 4.0 4.0 4.0 4.0 4.0 4.0 4.5 4.5 4.0 4.5Vehicle Extension (s) 2.3 2.3 2.3 2.3 2.3 2.3 5.1 5.1 2.3 5.1Lane Grp Cap (vph) 184 313 184 351 269 112 1470 558 192 1593v/s Ratio Prot 0.08 c0.11 c0.08 0.05 0.05 c0.29 0.07 c0.26v/s Ratio Perm 0.01 0.03v/c Ratio 0.75 0.59 0.78 0.28 0.08 0.82 0.70 0.07 0.68 0.57Uniform Delay, d1 39.1 33.4 39.2 31.4 30.2 41.7 21.7 15.8 38.6 17.6Progression Factor 1.00 1.00 1.00 1.00 1.00 1.18 1.38 5.58 1.17 1.29Incremental Delay, d2 14.6 2.1 17.4 0.3 0.1 31.5 2.5 0.2 7.4 1.4Delay (s) 53.7 35.5 56.6 31.7 30.3 80.8 32.4 88.3 52.4 24.0Level of Service D D E C C F C F D CApproach Delay (s) 42.6 41.3 40.1 27.6Approach LOS D D D C
Intersection SummaryHCM 2000 Control Delay 36.2 HCM 2000 Level of Service DHCM 2000 Volume to Capacity ratio 0.68Actuated Cycle Length (s) 90.0 Sum of lost time (s) 16.5Intersection Capacity Utilization 75.6% ICU Level of Service DAnalysis Period (min) 15c Critical Lane Group
Appendix Memorandum: Task 3.2 MMA Additional Needed Infrastructure Page A-149
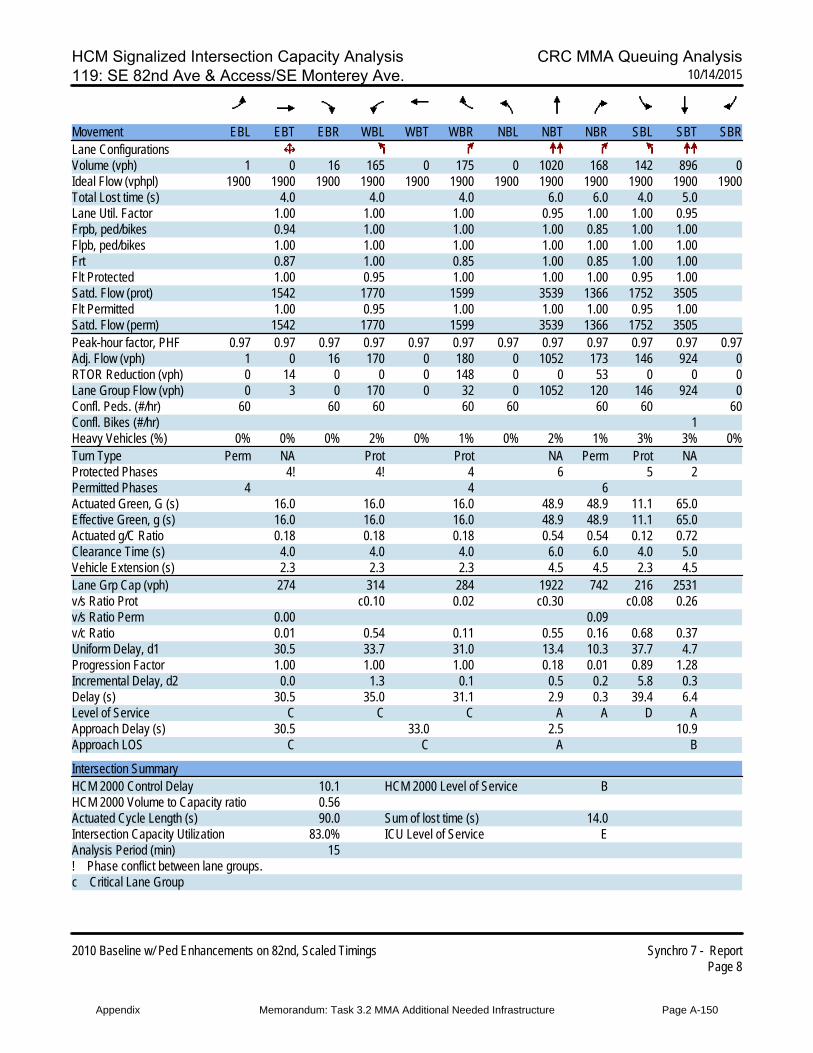
HCM Signalized Intersection Capacity Analysis CRC MMA Queuing Analysis119: SE 82nd Ave & Access/SE Monterey Ave. 10/14/2015
2010 Baseline w/ Ped Enhancements on 82nd, Scaled Timings Synchro 7 - ReportPage 8
Movement EBL EBT EBR WBL WBT WBR NBL NBT NBR SBL SBT SBRLane ConfigurationsVolume (vph) 1 0 16 165 0 175 0 1020 168 142 896 0Ideal Flow (vphpl) 1900 1900 1900 1900 1900 1900 1900 1900 1900 1900 1900 1900Total Lost time (s) 4.0 4.0 4.0 6.0 6.0 4.0 5.0Lane Util. Factor 1.00 1.00 1.00 0.95 1.00 1.00 0.95Frpb, ped/bikes 0.94 1.00 1.00 1.00 0.85 1.00 1.00Flpb, ped/bikes 1.00 1.00 1.00 1.00 1.00 1.00 1.00Frt 0.87 1.00 0.85 1.00 0.85 1.00 1.00Flt Protected 1.00 0.95 1.00 1.00 1.00 0.95 1.00Satd. Flow (prot) 1542 1770 1599 3539 1366 1752 3505Flt Permitted 1.00 0.95 1.00 1.00 1.00 0.95 1.00Satd. Flow (perm) 1542 1770 1599 3539 1366 1752 3505Peak-hour factor, PHF 0.97 0.97 0.97 0.97 0.97 0.97 0.97 0.97 0.97 0.97 0.97 0.97Adj. Flow (vph) 1 0 16 170 0 180 0 1052 173 146 924 0RTOR Reduction (vph) 0 14 0 0 0 148 0 0 53 0 0 0Lane Group Flow (vph) 0 3 0 170 0 32 0 1052 120 146 924 0Confl. Peds. (#/hr) 60 60 60 60 60 60 60 60Confl. Bikes (#/hr) 1Heavy Vehicles (%) 0% 0% 0% 2% 0% 1% 0% 2% 1% 3% 3% 0%Turn Type Perm NA Prot Prot NA Perm Prot NAProtected Phases 4! 4! 4 6 5 2Permitted Phases 4 4 6Actuated Green, G (s) 16.0 16.0 16.0 48.9 48.9 11.1 65.0Effective Green, g (s) 16.0 16.0 16.0 48.9 48.9 11.1 65.0Actuated g/C Ratio 0.18 0.18 0.18 0.54 0.54 0.12 0.72Clearance Time (s) 4.0 4.0 4.0 6.0 6.0 4.0 5.0Vehicle Extension (s) 2.3 2.3 2.3 4.5 4.5 2.3 4.5Lane Grp Cap (vph) 274 314 284 1922 742 216 2531v/s Ratio Prot c0.10 0.02 c0.30 c0.08 0.26v/s Ratio Perm 0.00 0.09v/c Ratio 0.01 0.54 0.11 0.55 0.16 0.68 0.37Uniform Delay, d1 30.5 33.7 31.0 13.4 10.3 37.7 4.7Progression Factor 1.00 1.00 1.00 0.18 0.01 0.89 1.28Incremental Delay, d2 0.0 1.3 0.1 0.5 0.2 5.8 0.3Delay (s) 30.5 35.0 31.1 2.9 0.3 39.4 6.4Level of Service C C C A A D AApproach Delay (s) 30.5 33.0 2.5 10.9Approach LOS C C A B
Intersection SummaryHCM 2000 Control Delay 10.1 HCM 2000 Level of Service BHCM 2000 Volume to Capacity ratio 0.56Actuated Cycle Length (s) 90.0 Sum of lost time (s) 14.0Intersection Capacity Utilization 83.0% ICU Level of Service EAnalysis Period (min) 15! Phase conflict between lane groups.c Critical Lane Group
Appendix Memorandum: Task 3.2 MMA Additional Needed Infrastructure Page A-150
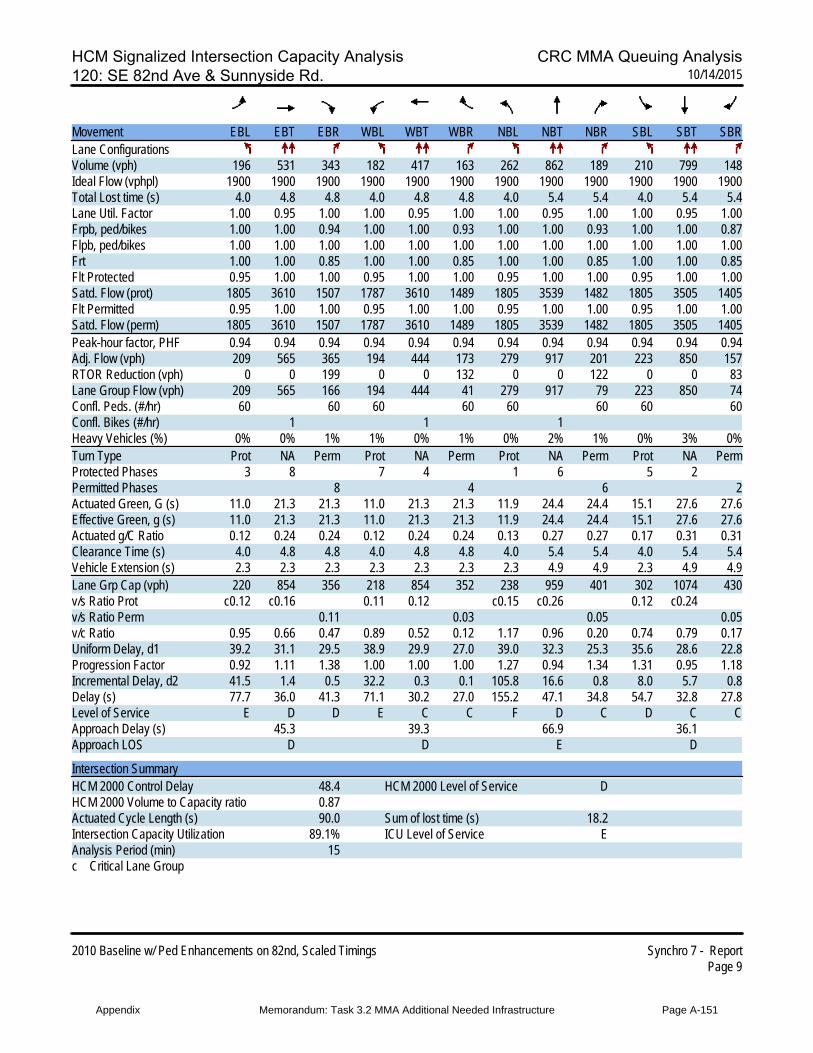
HCM Signalized Intersection Capacity Analysis CRC MMA Queuing Analysis120: SE 82nd Ave & Sunnyside Rd. 10/14/2015
2010 Baseline w/ Ped Enhancements on 82nd, Scaled Timings Synchro 7 - ReportPage 9
Movement EBL EBT EBR WBL WBT WBR NBL NBT NBR SBL SBT SBRLane ConfigurationsVolume (vph) 196 531 343 182 417 163 262 862 189 210 799 148Ideal Flow (vphpl) 1900 1900 1900 1900 1900 1900 1900 1900 1900 1900 1900 1900Total Lost time (s) 4.0 4.8 4.8 4.0 4.8 4.8 4.0 5.4 5.4 4.0 5.4 5.4Lane Util. Factor 1.00 0.95 1.00 1.00 0.95 1.00 1.00 0.95 1.00 1.00 0.95 1.00Frpb, ped/bikes 1.00 1.00 0.94 1.00 1.00 0.93 1.00 1.00 0.93 1.00 1.00 0.87Flpb, ped/bikes 1.00 1.00 1.00 1.00 1.00 1.00 1.00 1.00 1.00 1.00 1.00 1.00Frt 1.00 1.00 0.85 1.00 1.00 0.85 1.00 1.00 0.85 1.00 1.00 0.85Flt Protected 0.95 1.00 1.00 0.95 1.00 1.00 0.95 1.00 1.00 0.95 1.00 1.00Satd. Flow (prot) 1805 3610 1507 1787 3610 1489 1805 3539 1482 1805 3505 1405Flt Permitted 0.95 1.00 1.00 0.95 1.00 1.00 0.95 1.00 1.00 0.95 1.00 1.00Satd. Flow (perm) 1805 3610 1507 1787 3610 1489 1805 3539 1482 1805 3505 1405Peak-hour factor, PHF 0.94 0.94 0.94 0.94 0.94 0.94 0.94 0.94 0.94 0.94 0.94 0.94Adj. Flow (vph) 209 565 365 194 444 173 279 917 201 223 850 157RTOR Reduction (vph) 0 0 199 0 0 132 0 0 122 0 0 83Lane Group Flow (vph) 209 565 166 194 444 41 279 917 79 223 850 74Confl. Peds. (#/hr) 60 60 60 60 60 60 60 60Confl. Bikes (#/hr) 1 1 1Heavy Vehicles (%) 0% 0% 1% 1% 0% 1% 0% 2% 1% 0% 3% 0%Turn Type Prot NA Perm Prot NA Perm Prot NA Perm Prot NA PermProtected Phases 3 8 7 4 1 6 5 2Permitted Phases 8 4 6 2Actuated Green, G (s) 11.0 21.3 21.3 11.0 21.3 21.3 11.9 24.4 24.4 15.1 27.6 27.6Effective Green, g (s) 11.0 21.3 21.3 11.0 21.3 21.3 11.9 24.4 24.4 15.1 27.6 27.6Actuated g/C Ratio 0.12 0.24 0.24 0.12 0.24 0.24 0.13 0.27 0.27 0.17 0.31 0.31Clearance Time (s) 4.0 4.8 4.8 4.0 4.8 4.8 4.0 5.4 5.4 4.0 5.4 5.4Vehicle Extension (s) 2.3 2.3 2.3 2.3 2.3 2.3 2.3 4.9 4.9 2.3 4.9 4.9Lane Grp Cap (vph) 220 854 356 218 854 352 238 959 401 302 1074 430v/s Ratio Prot c0.12 c0.16 0.11 0.12 c0.15 c0.26 0.12 c0.24v/s Ratio Perm 0.11 0.03 0.05 0.05v/c Ratio 0.95 0.66 0.47 0.89 0.52 0.12 1.17 0.96 0.20 0.74 0.79 0.17Uniform Delay, d1 39.2 31.1 29.5 38.9 29.9 27.0 39.0 32.3 25.3 35.6 28.6 22.8Progression Factor 0.92 1.11 1.38 1.00 1.00 1.00 1.27 0.94 1.34 1.31 0.95 1.18Incremental Delay, d2 41.5 1.4 0.5 32.2 0.3 0.1 105.8 16.6 0.8 8.0 5.7 0.8Delay (s) 77.7 36.0 41.3 71.1 30.2 27.0 155.2 47.1 34.8 54.7 32.8 27.8Level of Service E D D E C C F D C D C CApproach Delay (s) 45.3 39.3 66.9 36.1Approach LOS D D E D
Intersection SummaryHCM 2000 Control Delay 48.4 HCM 2000 Level of Service DHCM 2000 Volume to Capacity ratio 0.87Actuated Cycle Length (s) 90.0 Sum of lost time (s) 18.2Intersection Capacity Utilization 89.1% ICU Level of Service EAnalysis Period (min) 15c Critical Lane Group
Appendix Memorandum: Task 3.2 MMA Additional Needed Infrastructure Page A-151

HCM Signalized Intersection Capacity Analysis CRC MMA Queuing Analysis128: SE 82nd Ave & SE Sunnybrook Blvd 10/14/2015
2010 Baseline w/ Ped Enhancements on 82nd, Scaled Timings Synchro 7 - ReportPage 10
Movement WBL WBR NBT NBR SBL SBTLane ConfigurationsVolume (vph) 289 282 1121 465 312 1019Ideal Flow (vphpl) 1900 1900 1900 1900 1900 1900Total Lost time (s) 4.0 4.8 5.4 5.4 4.0 5.4Lane Util. Factor 0.97 1.00 0.95 1.00 1.00 0.95Frpb, ped/bikes 1.00 1.00 1.00 0.92 1.00 1.00Flpb, ped/bikes 1.00 1.00 1.00 1.00 1.00 1.00Frt 1.00 0.85 1.00 0.85 1.00 1.00Flt Protected 0.95 1.00 1.00 1.00 0.95 1.00Satd. Flow (prot) 3467 1615 3539 1479 1787 3505Flt Permitted 0.95 1.00 1.00 1.00 0.95 1.00Satd. Flow (perm) 3467 1615 3539 1479 1787 3505Peak-hour factor, PHF 0.95 0.95 0.95 0.95 0.95 0.95Adj. Flow (vph) 304 297 1180 489 328 1073RTOR Reduction (vph) 0 254 0 247 0 0Lane Group Flow (vph) 304 43 1180 242 328 1073Confl. Peds. (#/hr) 60 60 60 60Heavy Vehicles (%) 1% 0% 2% 0% 1% 3%Turn Type Prot Prot NA Perm Prot NAProtected Phases 7 4 6 5 2Permitted Phases 6Actuated Green, G (s) 13.8 13.0 44.5 44.5 18.3 66.8Effective Green, g (s) 13.8 13.0 44.5 44.5 18.3 66.8Actuated g/C Ratio 0.15 0.14 0.49 0.49 0.20 0.74Clearance Time (s) 4.0 4.8 5.4 5.4 4.0 5.4Vehicle Extension (s) 2.3 2.3 4.8 4.8 2.3 4.8Lane Grp Cap (vph) 531 233 1749 731 363 2601v/s Ratio Prot c0.09 0.03 c0.33 c0.18 0.31v/s Ratio Perm 0.16v/c Ratio 0.57 0.18 0.67 0.33 0.90 0.41Uniform Delay, d1 35.4 33.8 17.3 13.8 35.0 4.3Progression Factor 1.00 1.00 1.00 1.00 1.09 0.78Incremental Delay, d2 1.1 0.2 2.1 1.2 17.3 0.3Delay (s) 36.5 34.1 19.4 15.0 55.5 3.7Level of Service D C B B E AApproach Delay (s) 35.3 18.1 15.8Approach LOS D B B
Intersection SummaryHCM 2000 Control Delay 20.0 HCM 2000 Level of Service CHCM 2000 Volume to Capacity ratio 0.72Actuated Cycle Length (s) 90.0 Sum of lost time (s) 14.2Intersection Capacity Utilization 67.7% ICU Level of Service CAnalysis Period (min) 15c Critical Lane Group
Appendix Memorandum: Task 3.2 MMA Additional Needed Infrastructure Page A-152