Embed Size (px)
Citation preview
2013-2015 LOWER CLACKAMAS RIVER
MACROINVERTEBRATE ASSESSMENT Clackamas County, Oregon
FINAL REPORT
Prepared for
Clackamas River Water Providers
By
Michael B. Cole, Ph.D.
Cole Ecological, Inc.
February 2016
i Cole Ecological, Inc. 2013-2015 Lower Clackamas River Macroinvertebrates
EXECUTIVE SUMMARY
In recognizing the value of biomonitoring to help inform water quality conditions and
trends, Clackamas River Water Partners (CRWP) developed a long-term
macroinvertebrate monitoring plan for the lower Clackamas River and its tributaries
(Cole 2013). This plan recommends routine (annual or biannual) sampling from the
lower mainstem Clackamas River and its major tributaries; over time these efforts will
produce a robust dataset necessary to identify changes in biological conditions when they
occur. Because the lower mainstem Clackamas River is the primary focus of CRWP’s
monitoring, initial implantation of the monitoring plan has focused on the mainstem river.
Since the program’s inception in 2013, the river has been sampled each of the last three
years. This report describes the methods, results, and conclusions from the first three
years of monitoring macroinvertebrate communities on the lower Clackamas River.
Macroinvertebrates were sampled from five sites in the lower Clackamas River between
river miles 0.5 and 20 in September of 2013, 2014, and 2015. Each of these sites had
been selected for long-term monitoring during the development of the monitoring plan.
Sampling was performed using standard field methods, and samples were processed
using standard laboratory methods. Data were analyzed using macroinvertebrate
community metrics known to be responsive to disturbance in western Oregon rivers and
streams.
The first three years of CRWP macroinvertebrate monitoring in the lower Clackamas
River suggest that community conditions are generally similar between river miles 0 and
20. Furthermore, these conditions are generally similar to those reported by others in
1999, 2000, and 2003. While the lack of a standard or reference condition for larger
rivers in the region precludes an assignment of condition classes to these results, the
presence of numerous mayfly, stonefly, and caddisfly taxa in the lower river is suggestive
of current water quality and habitat conditions that are generally suitable for maintenance
of diverse native aquatic communities.
Conditions measured in 2015 were similar to those measured in 2013 and 2014 at four of
five sites. While temporal variability in community metrics was higher at some sample
sites than at others, the measured variability was not beyond what would be expected for
normal year-to-year variation (i.e., no obvious indication of increased or decreased
biological conditions at any sites from 2013 to 2015). While conditions at CLKRM0.5
(as indicated by a number of community metrics) were lower in 2015 than in past years,
the measured condition likely reflects the natural variability in the lower river and is not
suggestive of a decline in condition immediately related to anthropogenic disturbance.
Accordingly, these data represent average conditions and variability in these conditions
over the range of environmental conditions occurring during the 2013-2015 sampling
period.
These three years of baseline community data from the lower river were used to calculate
several measures of variability to understand the relative sensitivity of metrics selected
for monitoring and to exemplify how to use the data to detect future change. Results of
ii Cole Ecological, Inc. 2013-2015 Lower Clackamas River Macroinvertebrates
these analyses suggest that OR DEQ multimetric scores, EPT richness, total community
richness, and the Community Tolerance Index (CTI) show the most promise for detecting
future changes in community conditions when they occur. Continued annual or biannual
replicated sampling in the lower Clackamas River is recommended to ensure a robust
data set. Future data will allow further characterization of spatial and temporal variability
under a range of climatic and flow conditions, thereby improving the ability to detect
change when change occurs. Future data will also be used to identify changes to benthic
community conditions through comparison with conditions measured over the past three
sampling years.
iii Cole Ecological, Inc. 2013-2015 Lower Clackamas River Macroinvertebrates
TABLE OF CONTENTS
EXECUTIVE SUMMARY ................................................................................................. i
LIST OF TABLES ............................................................................................................. iv
LIST OF FIGURES ........................................................................................................... iv
ACKNOWLEDGMENTS .................................................................................................. v
INTRODUCTION .............................................................................................................. 1
METHODS ......................................................................................................................... 2
SAMPLE SITE SELECTION......................................................................................... 2
FIELD DATA COLLECTION ....................................................................................... 3
Physical Habitat Assessment ...................................................................................... 3
Water Chemistry Sampling ......................................................................................... 4
Macroinvertebrate Sample Collection ........................................................................ 4
SAMPLE SORTING AND MACROINVERTEBRATE IDENTIFICATION .............. 5
DATA ANALYSIS ......................................................................................................... 5
RESULTS ........................................................................................................................... 8
DISCUSSION ................................................................................................................... 16
CONCLUSIONS & RECOMMENDATIONS ................................................................. 21
LITERATURE CITED ..................................................................................................... 22
APPENDIX A. .................................................................................................................. 33
iv Cole Ecological, Inc. 2013-2015 Lower Clackamas River Macroinvertebrates
LIST OF TABLES
Table 1. List of macroinvertebrates sample sites in the Clackamas River, Oregon,
September 2013-2015. ................................................................................................ 4
Table 2. Metric set and scoring criteria (WQIW 1999) used to assess condition of
macroinvertebrate communities in the Clackamas River, Oregon, fall 2013-2015. ... 6
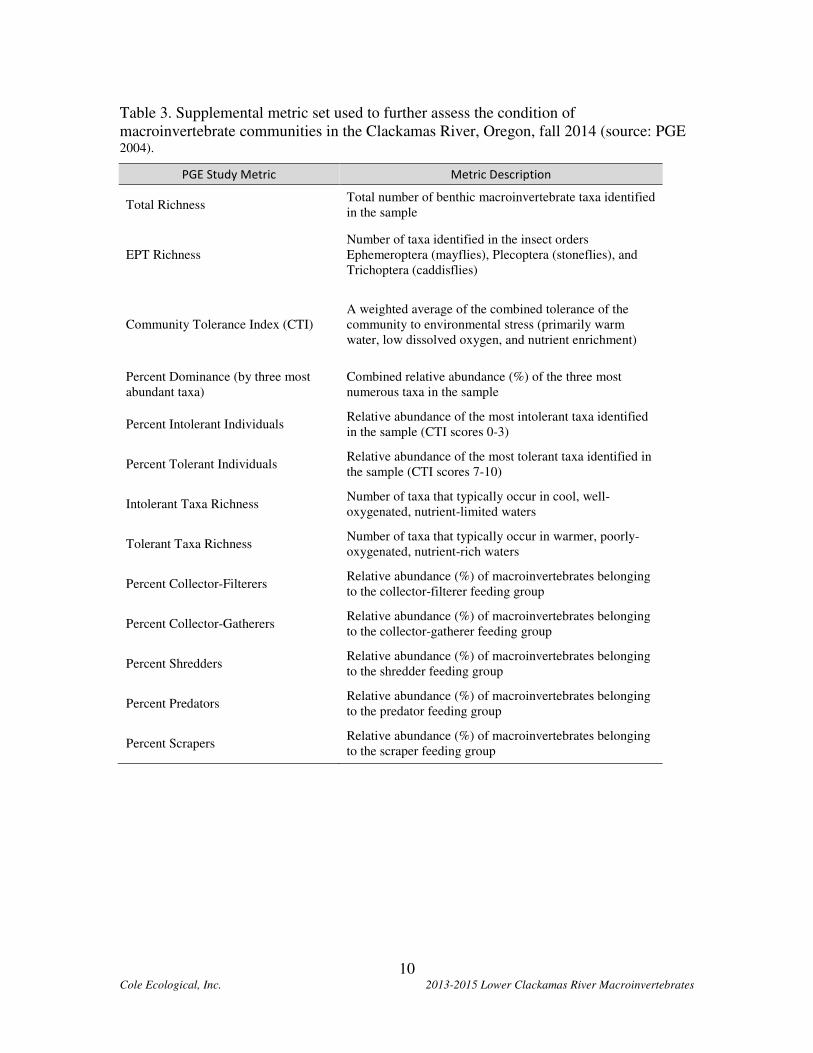
Table 3. Supplemental metric set used to further assess the condition of
macroinvertebrate communities in the Clackamas River, Oregon, fall 2014 (source:
PGE 2004). ................................................................................................................ 10
Table 4. Water quality and physical habitat conditions measured from five
macroinvertebrate sample sites in the Clackamas River, Oregon, September 21,
2015........................................................................................................................... 11
Table 5. Means and standard deviations of OR DEQ community metrics and total multi-
metric scores calculated from duplicate macroinvertebrate samples collected from
five sites along the lower Clackamas River, Oregon, in fall 2013, 2014, and 2015.
Metrics source: Oregon DEQ. Multimetric scores from the 2003 Metro study are
included in the last row of the table for comparative purposes. ............................... 14
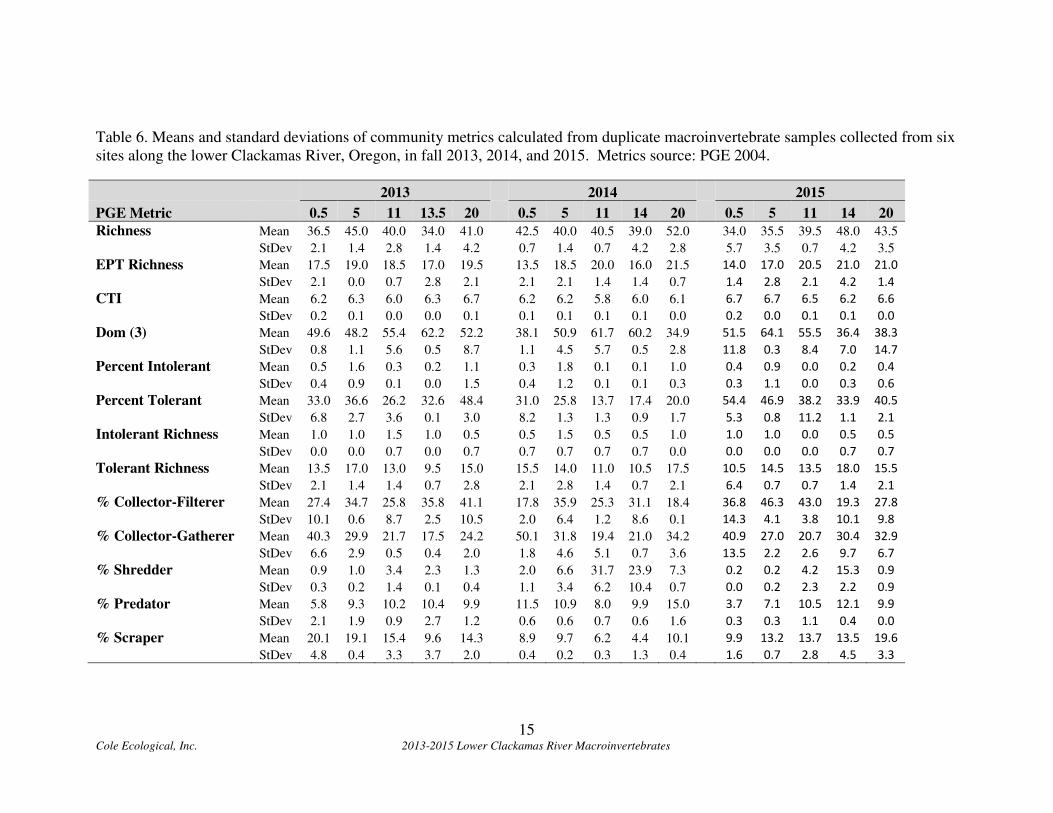
Table 6. Means and standard deviations of community metrics calculated from duplicate
macroinvertebrate samples collected from six sites along the lower Clackamas
River, Oregon, in fall 2013, 2014, and 2015. Metrics source: PGE 2004. .............. 15
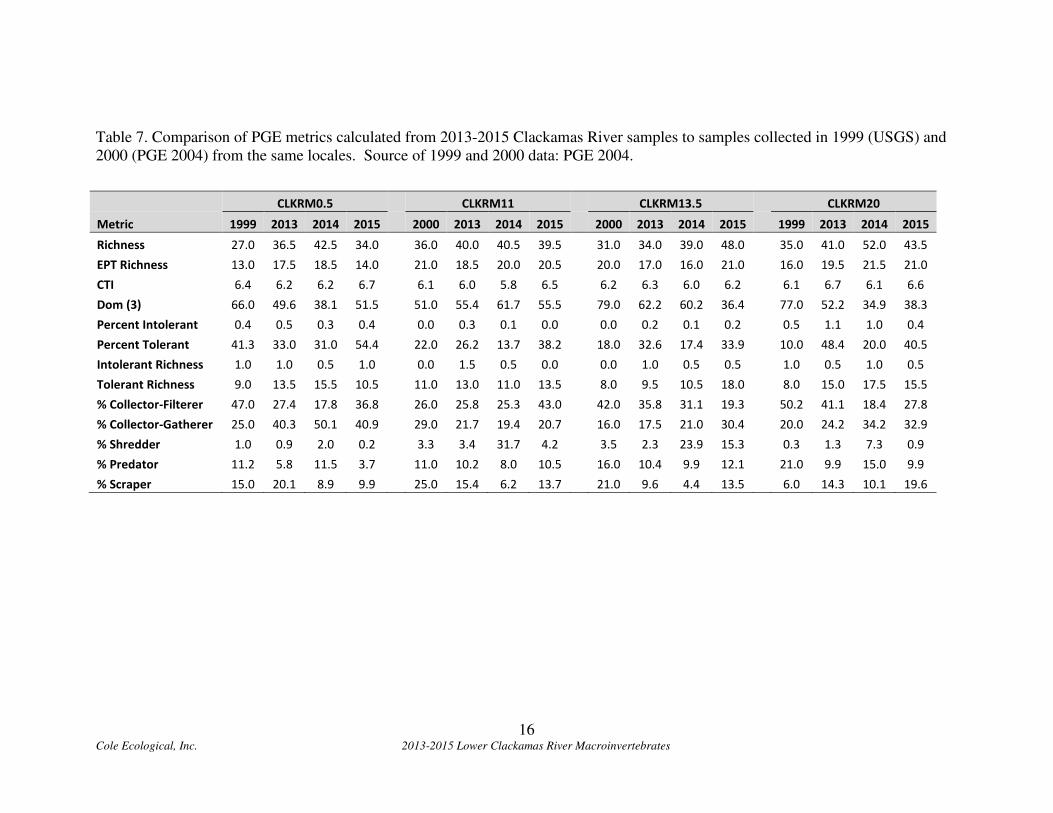
Table 7. Comparison of PGE metrics calculated from 2013-2015 Clackamas River
samples to samples collected in 1999 (USGS) and 2000 (PGE 2004) from the same
locales. Source of 1999 and 2000 data: PGE 2004. ................................................. 16
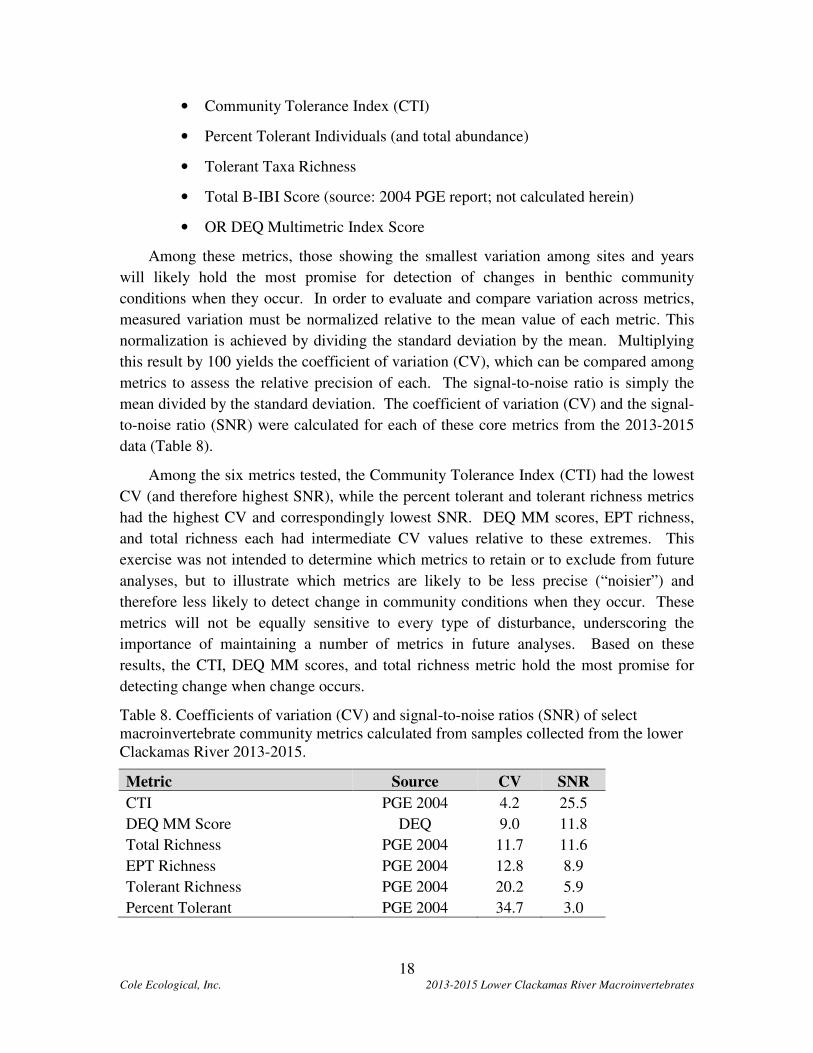
Table 8. Coefficients of variation (CV) and signal-to-noise ratios (SNR) of select
macroinvertebrate community metrics calculated from samples collected from the
lower Clackamas River 2013-2015. .......................................................................... 18
Table 9. Multimetric score overall mean, standard deviation, and mean minus two
standard deviations for each of five macroinvertebrate sample sites on the
Clackamas River, 2013-2015 (n = 6 each site). ........................................................ 20
LIST OF FIGURES
Figure 1. 2013-2015 lower Clackamas River macroinvertebrate sample sites. .................. 3
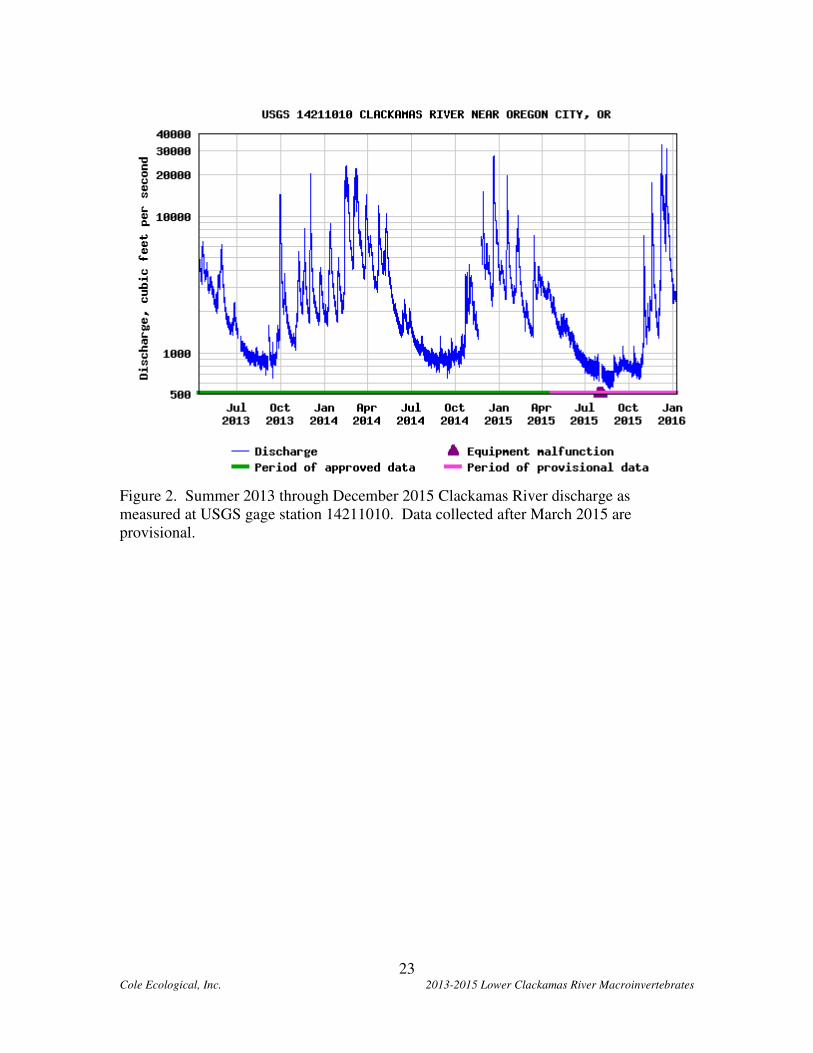
Figure 2. Summer 2013 through December 2015 Clackamas River discharge as
measured at USGS gage station 14211010. Data collected after March 2015 are
provisional................................................................................................................. 23
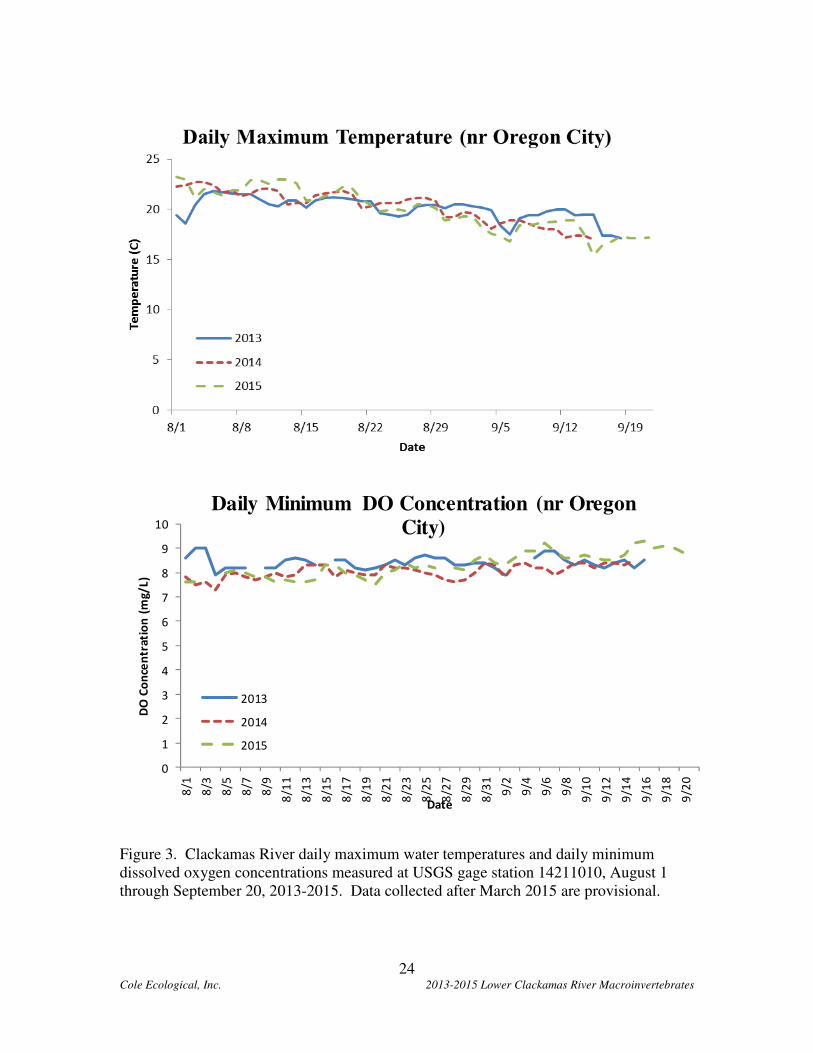
Figure 3. Clackamas River daily maximum water temperatures and daily minimum
dissolved oxygen concentrations measured at USGS gage station 14211010, August
1 through September 20, 2013-2015. Data collected after March 2015 are
provisional................................................................................................................. 24
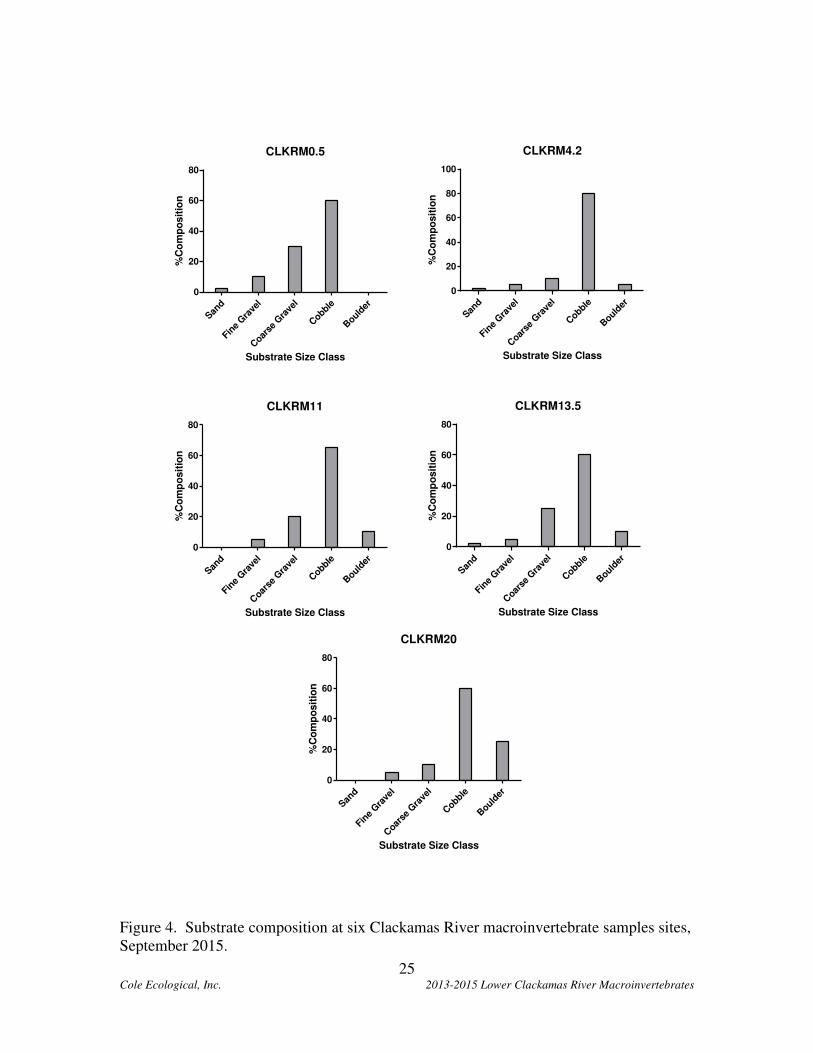
Figure 4. Substrate composition at six Clackamas River macroinvertebrate samples sites,
September 2015. ....................................................................................................... 25
v Cole Ecological, Inc. 2013-2015 Lower Clackamas River Macroinvertebrates
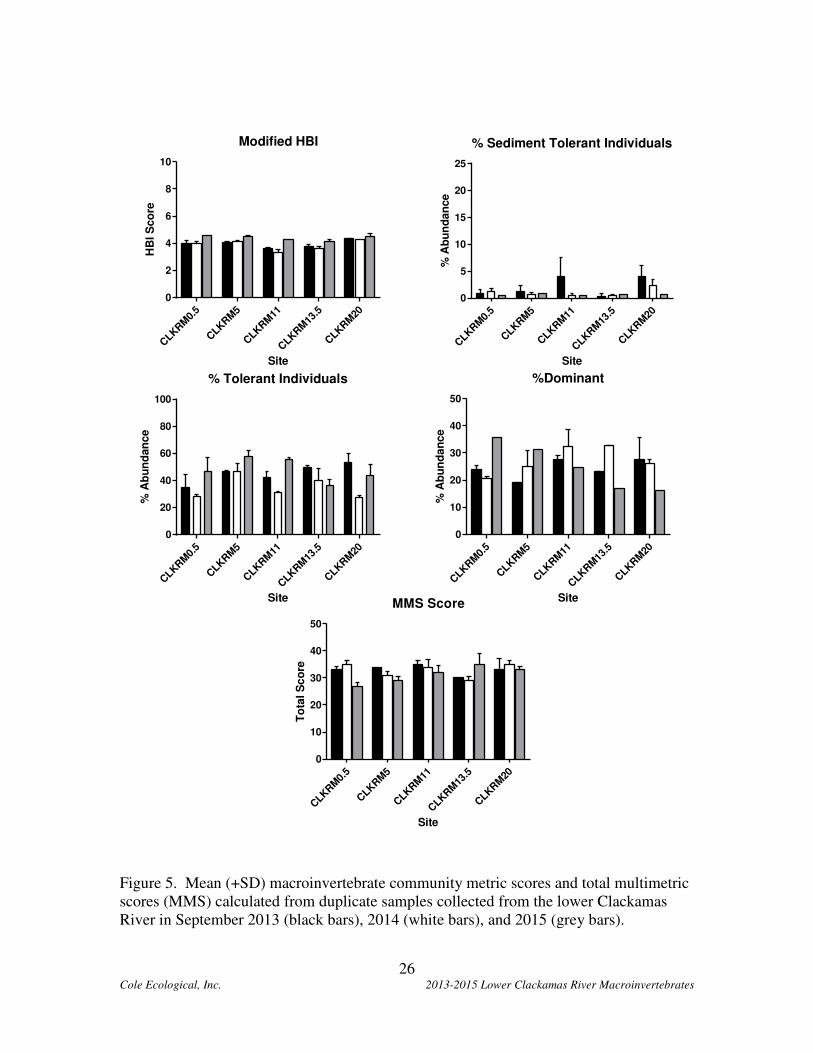
Figure 5. Mean (+SD) macroinvertebrate community metric scores and total multimetric
scores (MMS) calculated from duplicate samples collected from the lower
Clackamas River in September 2013 (black bars), 2014 (white bars), and 2015 (grey
bars)........................................................................................................................... 26
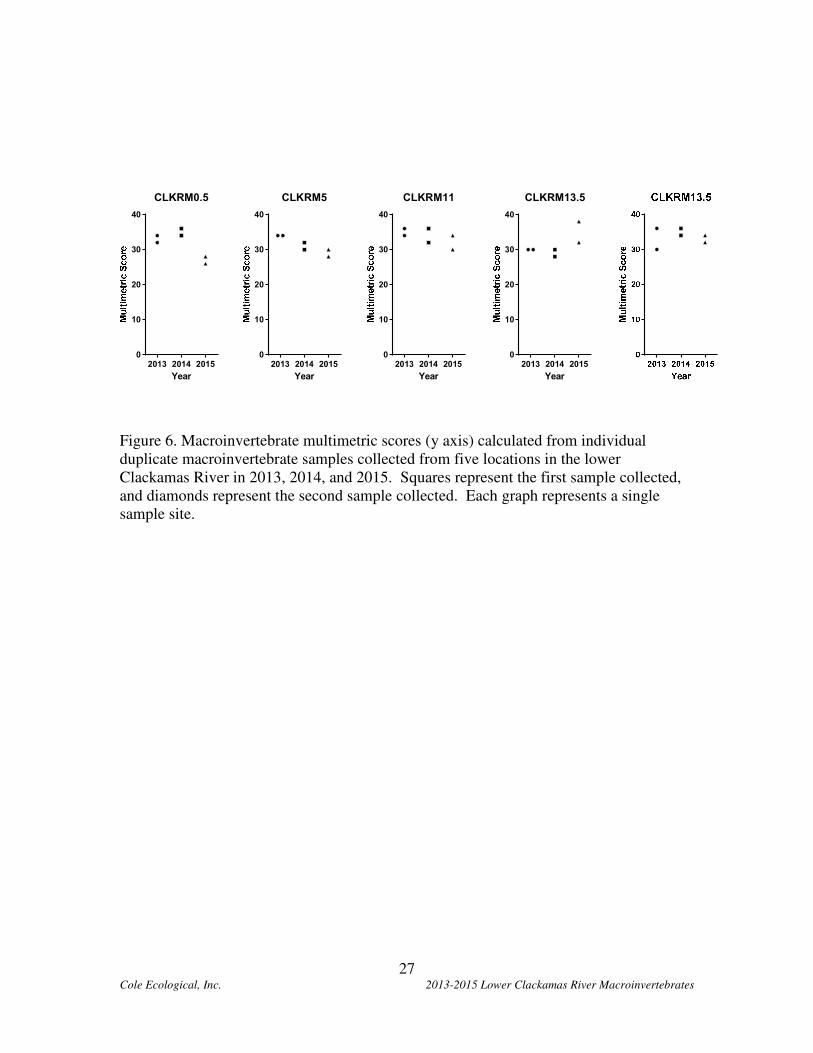
Figure 6. Macroinvertebrate multimetric scores (y axis) calculated from individual
duplicate macroinvertebrate samples collected from five locations in the lower
Clackamas River in 2013, 2014, and 2015. Squares represent the first sample
collected, and diamonds represent the second sample collected. ............................. 27
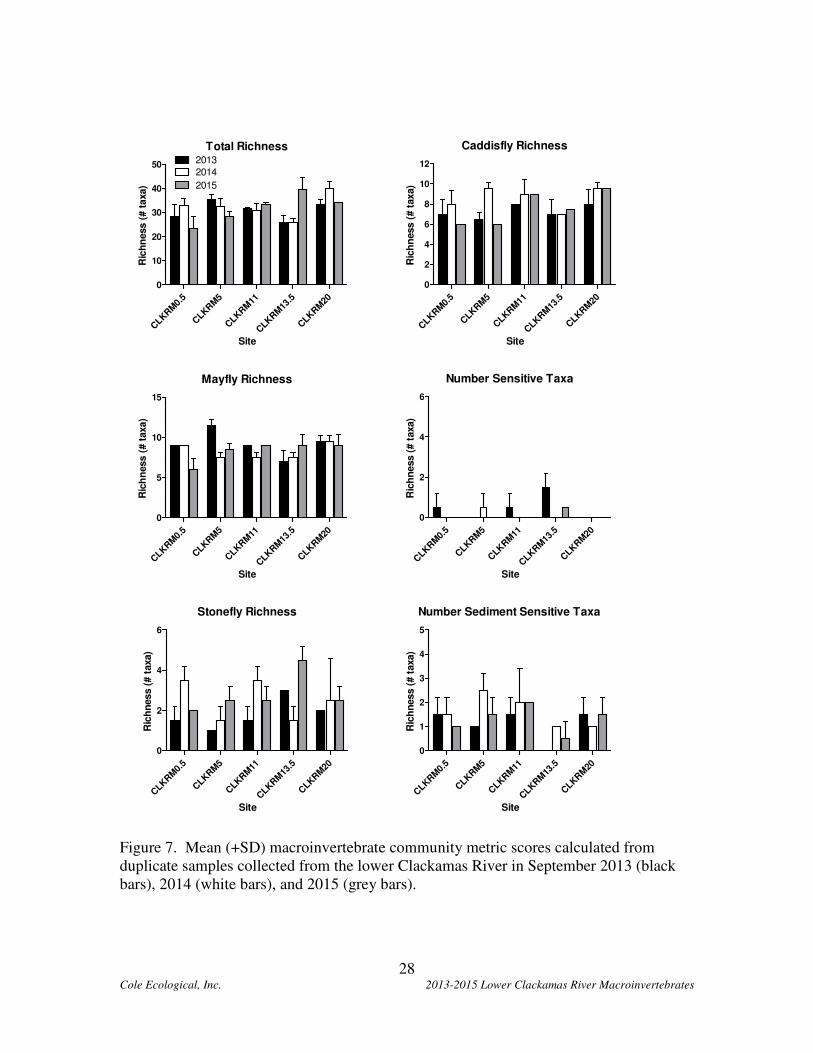
Figure 7. Mean (+SD) macroinvertebrate community metric scores calculated from
duplicate samples collected from the lower Clackamas River in September 2013
(black bars), 2014 (white bars), and 2015 (grey bars). ............................................. 28
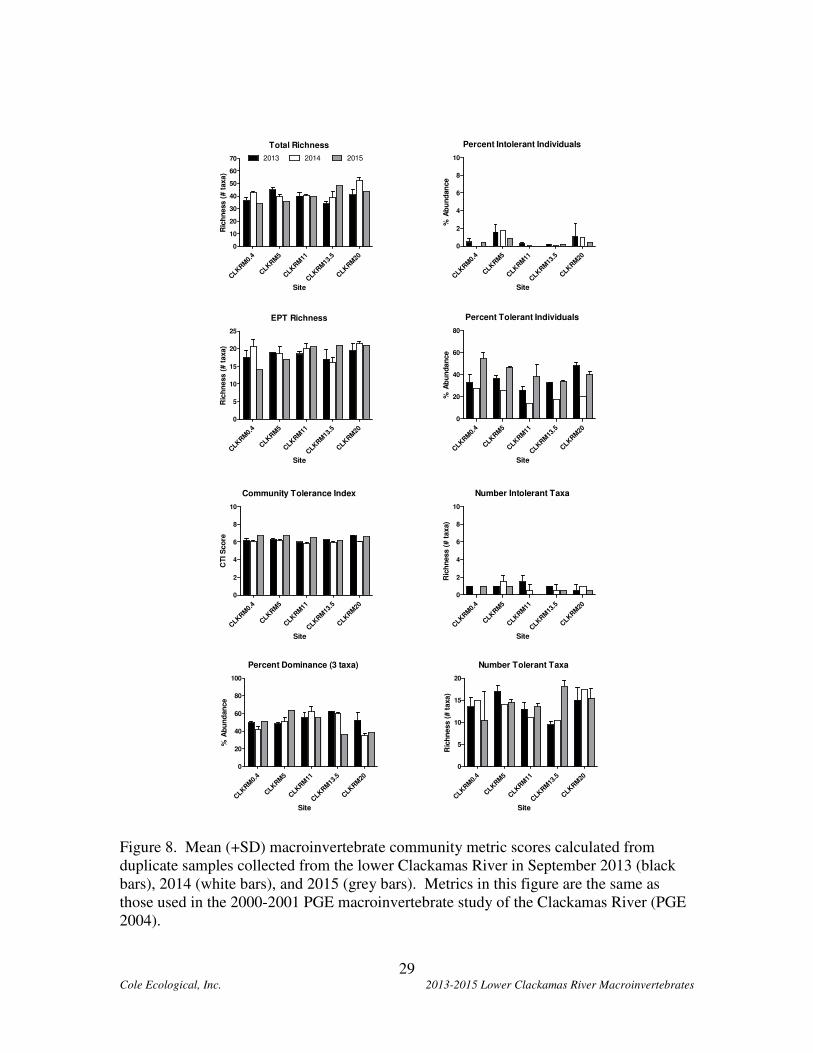
Figure 8. Mean (+SD) macroinvertebrate community metric scores calculated from
duplicate samples collected from the lower Clackamas River in September 2013
(black bars), 2014 (white bars), and 2015 (grey bars). Metrics in this figure are the
same as those used in the 2000-2001 PGE macroinvertebrate study of the Clackamas
River (PGE 2004). .................................................................................................... 29
Figure 9. Mean (+SD) abundance of macroinvertebrate functional feeding groups
calculated from duplicate samples collected from the lower Clackamas River in
September 2013 (black bars), 2014 (white bars), and 2015 (grey bars). Metrics in
this figure are the same as those used in the 2000-2001 PGE macroinvertebrate
study of the Clackamas River (PGE 2004). .............................................................. 30
Figure 10. Mean total taxa richness calculated from macroinvertebrate samples collected
from the Clackamas River in 1999/2000 and 2013-2015. ........................................ 31
Figure 11. NMS ordination bi-plots of macroinvertebrate communities sampled from
five reaches in the lower Clackamas River, Oregon, in September 2013, 2014, and
2015. Each point in each bi plot represents a single sample. Samples in the upper bi-
plot are color-coded by river mile, while points in the lower bi plot are color-coded
by year sampled. Points occurring closer together have more similar
macroinvertebrate communities than do points occurring farther apart. .................. 32
ACKNOWLEDGMENTS
This project was funded by the Clackamas River Water Providers (CRWP) and
managed by CRWP Water Resources Manager, Kim Swan. Field assistance with 2013-
2015 sample collection was provided by Kim Swan, and Clackamas River Water (CRW)
Water Quality Manager, Suzanne DeLorenzo. Macroinvertebrate samples were
processed by Cole Ecological, Inc. (CE) Technician Christopher Burtch. Project
taxonomy was performed by CE taxonomists Michael Cole and Ann Gregoire. Site
location mapping was performed by Rich Blaha of Aquila Geospatial, LLC.
1 Cole Ecological, Inc. 2013-2015 Lower Clackamas River Macroinvertebrates
INTRODUCTION
The lower Clackamas River is a valuable ecological and economic resource to the
communities of Clackamas County, providing drinking water; fishing, boating and other
recreation; and hydro-power. Numerous local, state, and federal agencies sample the
river and its many tributaries to monitor water quality relative to conditions necessary to
support these beneficial uses. The Clackamas River Water Providers (CRWP) is a
coalition of municipal water providers that receives drinking water from the Clackamas
River. CRWP receives water from the lower Clackamas River at five points of diversion
(POD) at river miles 0.8, 1.7, 2.7, 3.1, and 22.7. CRWP is working to ensure that the
river and its tributaries are sufficiently monitored to adequately assess and protect water
quality.
Biological monitoring of rivers and streams is widely recognized as an effective tool
for measuring and monitoring overall ecological integrity of these systems.
Macroinvertebrate communities lend particularly well to biomonitoring because they are
diverse, they range widely in sensitivity to water pollution and other perturbations, and
they are easy to collect. Macroinvertebrate communities simultaneously integrate the
effects of multiple stressors and therefore provide an index of the aggregate effects of all
pollutants and other stressors in a system. For these reasons, macroinvertebrate
assessment and monitoring is widely used by water resource management agencies for
assessing the condition of rivers and streams.
In the lower Clackamas River basin, macroinvertebrate assessments have been
conducted by numerous organizations, including PGE, Clackamas Water Environment
Services, the University of Washington, the United States Geological Survey, and
Portland METRO, among others (Cole 2013). Owing chiefly to differing geographic foci
and a lack of coordination among entities, each of these efforts have occurred largely
independently of the others, resulting in a lack of reliable long-term data that might
inform trending of these conditions in the Clackamas River or its tributaries (Cole 2013).
In recognizing the value of biomonitoring for informing water quality conditions and
trends, CRWP developed a long-term macroinvertebrate monitoring plan for the lower
Clackamas River and its major tributaries (Cole 2013). This plan recommends sampling
from the lower mainstem Clackamas River and its major tributaries once every year (or
two, depending on availability of resources); these efforts are intended to produce a long-
term dataset necessary to identify persistent changes in biological conditions when they
occur. Because the lower mainstem Clackamas River is the primary focus of CRWP’s
monitoring, the plan recommended sampling the river in each of the first three years of
monitoring. The main objective of the first three annual monitoring efforts in the
mainstem Clackamas River is to characterize and quantify temporal variability in
macroinvertebrate community conditions at each monitoring location in order to better
2 Cole Ecological, Inc. 2013-2015 Lower Clackamas River Macroinvertebrates
understand data needs for detecting changes in biological conditions over time. This
report describes the methods, results, and conclusions for these first three years of
monitoring macroinvertebrate communities on the lower mainstem of the Clackamas
River.
METHODS
SAMPLE SITE SELECTION
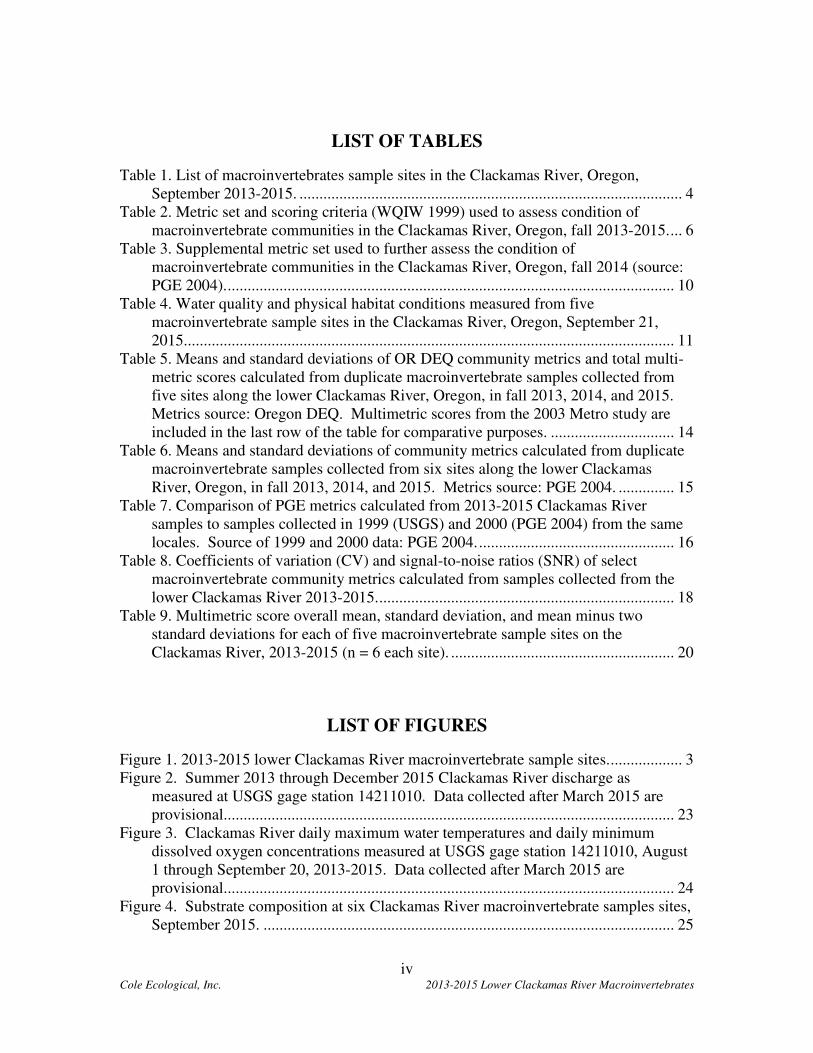
Five drinking water points-of-diversion (POD) are located along the lower
Clackamas River (including one immediately upriver of the River Mill Dam) at river
miles 0.8, RM 1.7, RM 2.7, RM 3.1, RM 22.7. Furthermore, a single WWTP discharges
directly into the Clackamas River immediately upriver of the River Mill Dam. To the
extent possible, stations on the mainstem Clackamas River were initially selected in 2013
to assess water quality immediately upriver of PODs and bracketing WWTPs. Six sites
were sampled in fall 2013 during the first year of monitoring. One of these six sites,
CLKRM25, was dropped from the monitoring program in subsequent years because
habitat conditions at this site differed markedly from those at the other sites, primarily
because this site was located in a very short reach of river occurring between two
impounded sections of river. Accordingly, the uppermost site in 2014 and 2015 occurred
at CLKRM20 below the River Mill Dam (Figure 1). This site serves to monitor the
aggregate (and un-separable) effects of the dam, the Estacada WWTP, and potential
sources of stress further upriver on the ecology of the river in this reach.
Deep Creek enters the Clackamas River at RM 11.6, approximately midway between
River Mill Dam and the uppermost of the series of 4 drinking water PODs in the lower
3.1 miles of river. Because Deep Creek carries treated effluent from the Boring WWTP
(via North Fork Deep Creek) and seasonally from the Sandy WWTP (via Tickle Creek),
two sample sites (upriver: CLKRM13.5 and downriver: CLKRM11) were established in
2013 and resampled in 2014 and 2015 to bracket this large tributary system.
Rock Creek enters the Clackamas River at RM 6.4. A sample site was established on
the river in 2013 below the confluence with Rock Creek (CLKRM5) to monitor
ecological conditions upriver of the POD at RM 3.1. The lower-most sample site is
located at river mile 0.5 (CLKRM0.5) below the series of 4 PODs to monitor water
quality flowing through this 2.6-mile-long section of river. This site serves to inform
ecological conditions within this section of river within which water is being withdrawn
for municipal use.
These sites were also selected in 2013 because macroinvertebrates have been
sampled using standardized field and laboratory methods from or nearby (within ½ mile)
each of these sites in the past (Table 1), providing some historic baseline of past
conditions. The USGS sampled from CLKRM0.5 and CLKRM20 in 1999. PGE
3 Cole Ecological, Inc. 2013-2015 Lower Clackamas River Macroinvertebrates
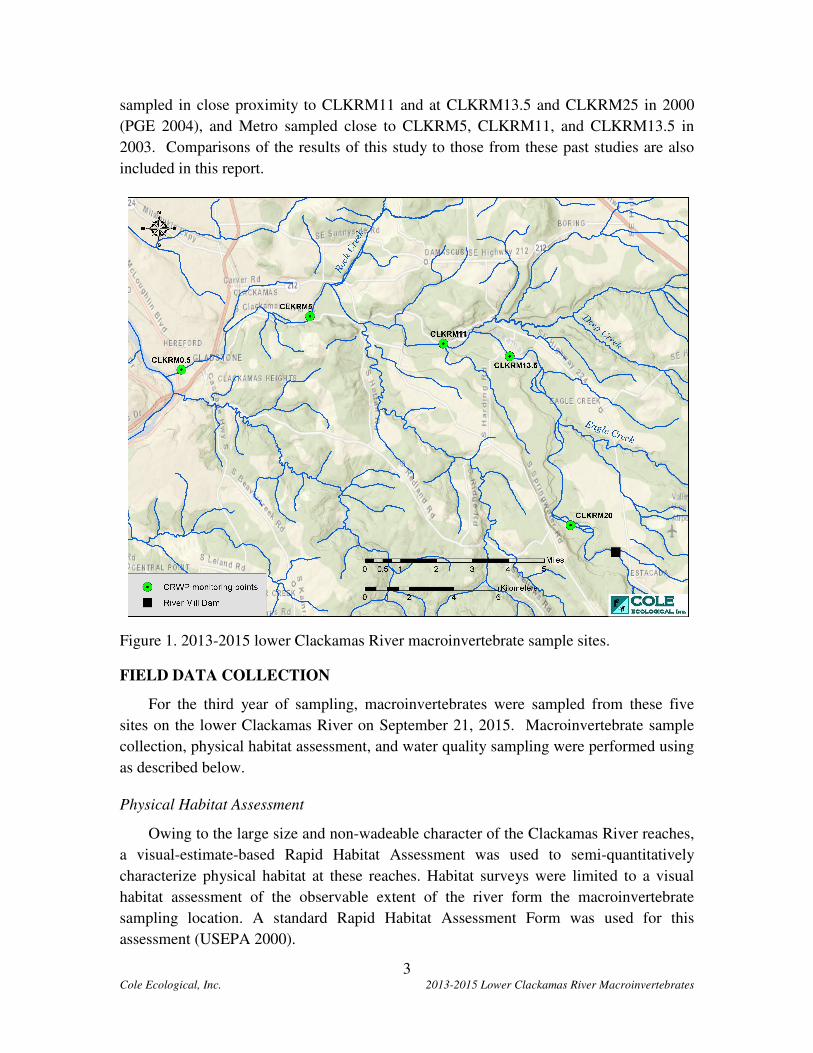
sampled in close proximity to CLKRM11 and at CLKRM13.5 and CLKRM25 in 2000
(PGE 2004), and Metro sampled close to CLKRM5, CLKRM11, and CLKRM13.5 in
2003. Comparisons of the results of this study to those from these past studies are also
included in this report.
Figure 1. 2013-2015 lower Clackamas River macroinvertebrate sample sites.
FIELD DATA COLLECTION
For the third year of sampling, macroinvertebrates were sampled from these five
sites on the lower Clackamas River on September 21, 2015. Macroinvertebrate sample
collection, physical habitat assessment, and water quality sampling were performed using
as described below.
Physical Habitat Assessment
Owing to the large size and non-wadeable character of the Clackamas River reaches,
a visual-estimate-based Rapid Habitat Assessment was used to semi-quantitatively
characterize physical habitat at these reaches. Habitat surveys were limited to a visual
habitat assessment of the observable extent of the river form the macroinvertebrate
sampling location. A standard Rapid Habitat Assessment Form was used for this
assessment (USEPA 2000).
4 Cole Ecological, Inc. 2013-2015 Lower Clackamas River Macroinvertebrates
Additionally, substrate in the immediate area from which macroinvertebrate samples
was visually estimated to semi-quantitatively characterize percent composition of
boulders, cobbles, gravels, and sand/fines, as well as embeddedness of coarse substrates.
Furthermore, the range of depths from which samples were collected in riffle habitats was
recorded for each site.
Water Chemistry Sampling
Water chemistry parameters including temperature (°C), dissolved oxygen (DO)
saturation (percent), dissolved oxygen concentration (mg/L), conductivity (µS/cm), and
specific conductance (µS/cm) were measured at each reach. Water temperature, dissolved
oxygen, conductivity, and specific conductance were measured in situ with a multi-
parameter YSI Model 556 water chemistry meter.
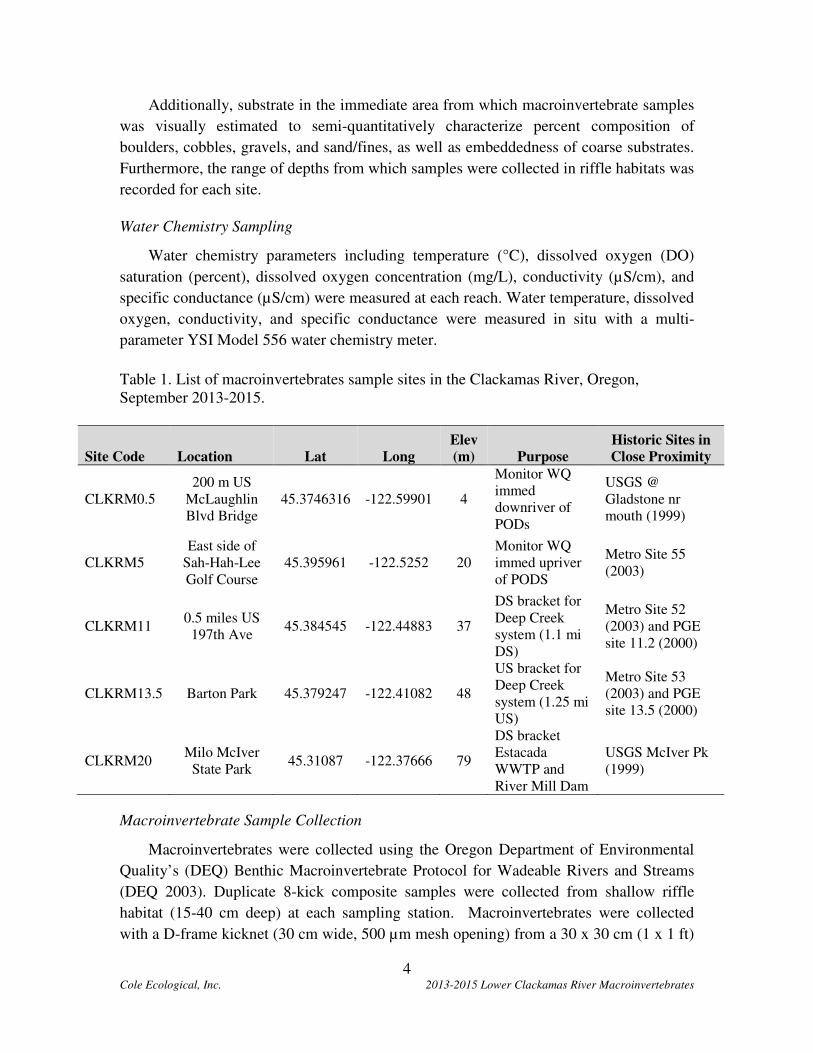
Table 1. List of macroinvertebrates sample sites in the Clackamas River, Oregon,
September 2013-2015.
Site Code Location Lat Long
Elev
(m) Purpose
Historic Sites in
Close Proximity
CLKRM0.5
200 m US
McLaughlin
Blvd Bridge
45.3746316 -122.59901 4
Monitor WQ
immed
downriver of
PODs
USGS @
Gladstone nr
mouth (1999)
CLKRM5
East side of
Sah-Hah-Lee
Golf Course
45.395961 -122.5252 20
Monitor WQ
immed upriver
of PODS
Metro Site 55
(2003)
CLKRM11 0.5 miles US
197th Ave 45.384545 -122.44883 37
DS bracket for
Deep Creek
system (1.1 mi
DS)
Metro Site 52
(2003) and PGE
site 11.2 (2000)
CLKRM13.5 Barton Park 45.379247 -122.41082 48
US bracket for
Deep Creek
system (1.25 mi
US)
Metro Site 53
(2003) and PGE
site 13.5 (2000)
CLKRM20 Milo McIver
State Park 45.31087 -122.37666 79
DS bracket
Estacada
WWTP and
River Mill Dam
USGS McIver Pk
(1999)
Macroinvertebrate Sample Collection
Macroinvertebrates were collected using the Oregon Department of Environmental
Quality’s (DEQ) Benthic Macroinvertebrate Protocol for Wadeable Rivers and Streams
(DEQ 2003). Duplicate 8-kick composite samples were collected from shallow riffle
habitat (15-40 cm deep) at each sampling station. Macroinvertebrates were collected
with a D-frame kicknet (30 cm wide, 500 µm mesh opening) from a 30 x 30 cm (1 x 1 ft)
5 Cole Ecological, Inc. 2013-2015 Lower Clackamas River Macroinvertebrates
area at each sampling point. Larger pieces of substrate, when encountered, were first
hand washed inside the net, and then placed outside of the sampled area. Then the area
was thoroughly disturbed by hand (or by foot in deeper water) to a depth of ~10 cm. The
eight samples from the reach were composited and carefully washed through a 500 µm
sieve to strain fine sediment and hand remove larger substrate and leaves after inspection
for clinging macroinvertebrates. The composite sample was placed into one or more 1-L
polyethylene wide-mouth bottles, labeled, and preserved with 80% denatured ethanol for
later sorting and identification at the laboratory.
SAMPLE SORTING AND MACROINVERTEBRATE IDENTIFICATION
Samples were sorted to remove a 500-organism subsample from each preserved
following the procedures described in the DEQ Level 3 protocols (Water Quality
Interagency Workgroup [WQIW], 1999) and using a Caton gridded tray, as described by
Caton (1991). Contents of the sample were first emptied onto the gridded tray and then
floated with water to evenly distribute the sample material across the tray. Squares of
material from the 30-square gridded tray were transferred to a Petri dish, which was
examined under a dissecting microscope at 7–10X magnification to sort aquatic
macroinvertebrates from the sample matrix. Macroinvertebrates were removed from each
sample until at least 500 organisms were counted, or until the entire sample had been
sorted. Following sample sorting, all macroinvertebrates were generally identified to the
level of taxonomic resolution recommended for Level 3 macroinvertebrate assessments
by the Northwest Biological Assessment Working Group (NBAWG 2002).
DATA ANALYSIS
A number of standardized analytical approaches exist for assessing the condition
of macroinvertebrate communities in Oregon. These approaches can be broadly
classified as multimetric indexes and predictive models. Multimetric analysis employs a
set of metrics, each of which describes an attribute of the macroinvertebrate community
that has been shown to be responsive to environmental condition gradients. Each
community metric is converted to a standardized score; standardized scores of all metrics
are then summed to produce a single multimetric score that is an index of overall
biological integrity. Multimetric index scores are converted to condition classes
corresponding to specific bins of scores. The DEQ Level 3 multimetric assessment
utilizes a 10-metric set that includes six positive metrics that score higher with improved
biological conditions, and four negative metrics that score lower with improved
conditions (Table 2). The Modified Hilsenhoff Biotic Index (HBI), originally developed
by Hilsenhoff (1982), computes an index to organic enrichment pollution based on the
relative abundance of various taxa at a reach. Values of the index range from 1 to 10;
6 Cole Ecological, Inc. 2013-2015 Lower Clackamas River Macroinvertebrates
higher scores are interpreted as an indication of a macroinvertebrate community more
tolerant to fluctuations in water temperature, fine sediment inputs, and organic
enrichment. Sensitive taxa are those that are intolerant of warm water temperatures, high
sediment loads, and organic enrichment; tolerant taxa are adapted to persist under such
adverse conditions. Taxa in the dataset are assigned attribute codes and values using the
most recent version of DEQ’s taxa coding (DEQ, unpublished information).
Predictive models evaluate macroinvertebrate community conditions based on a
comparison of observed (O) to expected (E) taxa (Hawkins et al. 2000, Hubler 2008).
The observed taxa are those that occurred at the site, whereas the expected taxa are those
commonly occurring (>50% probability of occurrence) at reference sites. Biological
condition is determined by comparing the O/E score to the distribution of reference reach
O/E scores in the model. Predictive models used in Oregon are collectively known as
PREDATOR models. Three regional PREDATOR models are currently in use in Oregon
(Hubler 2008).
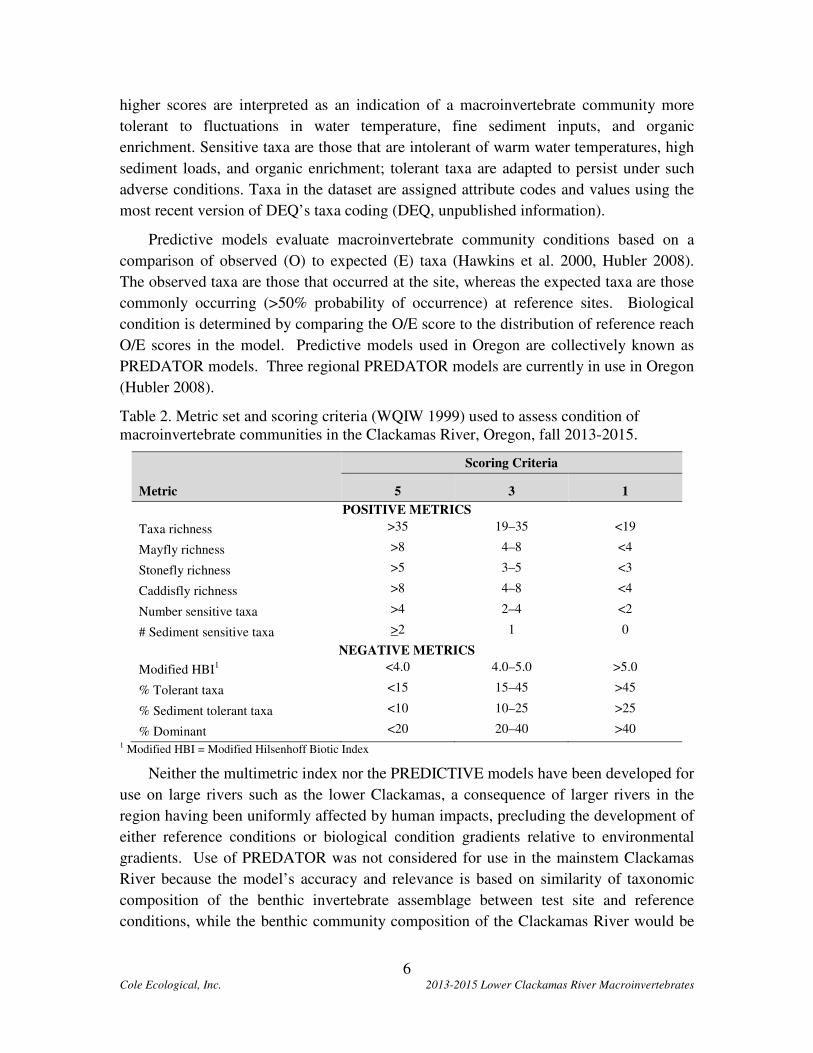
Table 2. Metric set and scoring criteria (WQIW 1999) used to assess condition of
macroinvertebrate communities in the Clackamas River, Oregon, fall 2013-2015.
Metric
Scoring Criteria
5 3 1
POSITIVE METRICS
Taxa richness >35 19–35 <19
Mayfly richness >8 4–8 <4
Stonefly richness >5 3–5 <3
Caddisfly richness >8 4–8 <4
Number sensitive taxa >4 2–4 <2
# Sediment sensitive taxa >2 1 0
NEGATIVE METRICS
Modified HBI1 <4.0 4.0–5.0 >5.0
% Tolerant taxa <15 15–45 >45
% Sediment tolerant taxa <10 10–25 >25
% Dominant <20 20–40 >40 1 Modified HBI = Modified Hilsenhoff Biotic Index
Neither the multimetric index nor the PREDICTIVE models have been developed for
use on large rivers such as the lower Clackamas, a consequence of larger rivers in the
region having been uniformly affected by human impacts, precluding the development of
either reference conditions or biological condition gradients relative to environmental
gradients. Use of PREDATOR was not considered for use in the mainstem Clackamas
River because the model’s accuracy and relevance is based on similarity of taxonomic
composition of the benthic invertebrate assemblage between test site and reference
conditions, while the benthic community composition of the Clackamas River would be
7 Cole Ecological, Inc. 2013-2015 Lower Clackamas River Macroinvertebrates
expected to naturally differ from that of the smaller rivers and streams used to calibrate
the model to reference conditions.
The DEQ multimetric set was used in this study to assess macroinvertebrate
community conditions in the lower Clackamas River; however, the analysis focused on
graphically examining individual metrics and the total multi-metric score for overall
longitudinal trends in macroinvertebrate community conditions in the river and for
obvious deviations from trends or ranges in values among sample sites. Un-standardized
metric scores were used in the data analyses; standardized metric scores were calculated
only to produce a composite multi-metric score for each sample. Condition classes were
not assigned to sample sites for reasons cited earlier. As duplicate samples were
collected from each site in these first two years of sampling, site means and standard
deviations were calculated to assist with interpretation of data and inferring differences
and trends among sites. Because DEQ historically performed this multimetric analysis
using Chironomidae data left at subfamily/tribe levels of taxonomic resolution, these
metrics were calculated with this family backed up to these higher taxonomic levels to
allow direct comparison with results of a 2003 assessment of the lower Clackamas River.
This assessment of the mainstem Clackamas River also warranted further analyses
by which a number of additional individual metrics were examined. Metrics selected
consisted of those used by PGE in a 2000-2001 study of the mainstem Clackamas River
and selected major tributaries (Table 3, PGE 2004). A complete explanation of these
metrics can be found in PGE’s 2004 repot. Source coding for calculating these metrics
was provided by Bob Wisseman of Aquatic Biology Associates (B. Wisseman, personal
communication). Chironomidae were identified to genus or species group levels for
these analyses. These metrics were analyzed in the same manner as described above for
the DEQ metric set.
Macroinvertebrate data were also analyzed using non-metric multidimensional
scaling (NMS) ordination to examine patterns in community composition in relation to
river mile and year sampled. NMS, a non-parametric ordination technique, was used
because it assumes no underlying distribution of the data, is robust to data departures
from normality, and therefore is suggested for use with ecological data (McCune &
Mefford, 1999). NMS multivariate analysis was performed in PC-Ord Version 6.08
statistical software. Macroinvertebrate data were log-transformed (using log10 [x+1]) to
reduce the influence of numerically-dominant taxa (Krebs, 1989). This type of
transformation is useful when there is a high degree of variation in the number of
organisms represented by different taxa (McCune & Mefford, 1999) and has routinely
been used on macroinvertebrate community data prior to performing multivariate analysis
(e.g., Jackson, 1993; Reece & Richardson, 2000; Rempel, Richardson & Healey, 2000).
NMS was performed using the Sorenson (Bray-Curtis) distance measure and a minimum
of 400 iterations.
8 Cole Ecological, Inc. 2013-2015 Lower Clackamas River Macroinvertebrates
RESULTS
As with previous sampling years under this program in 2013 and 2014, streamflows
during the 2015 sampling event (September 21, 2015) were at seasonal baseflows, as
determined from data obtained from USGS gage station 14211010 on the Clackamas
River near Oregon City (2015 data are presently provisional data). While flows under
which macroinvertebrates were collected were similar among the three years, provisional
discharge data collected from this gage station suggest that mid-to-late-summer flows
were lower in 2015 than they had been during the last two years antecedent to sampling
(Figure 2). In 2013 and 2014, August discharge at station 14211010 was typically 800 to
900 cfs, while discharge at this station was 600 to 700 cfs for much of August 2015,
potentially producing more stressful ambient in-river conditions. However, provisional
USGS water quality data collected at this same gage station suggest that neither late-
summer temperature nor dissolved oxygen conditions notably differed between 2015 and
the previous two years (Figure 3).
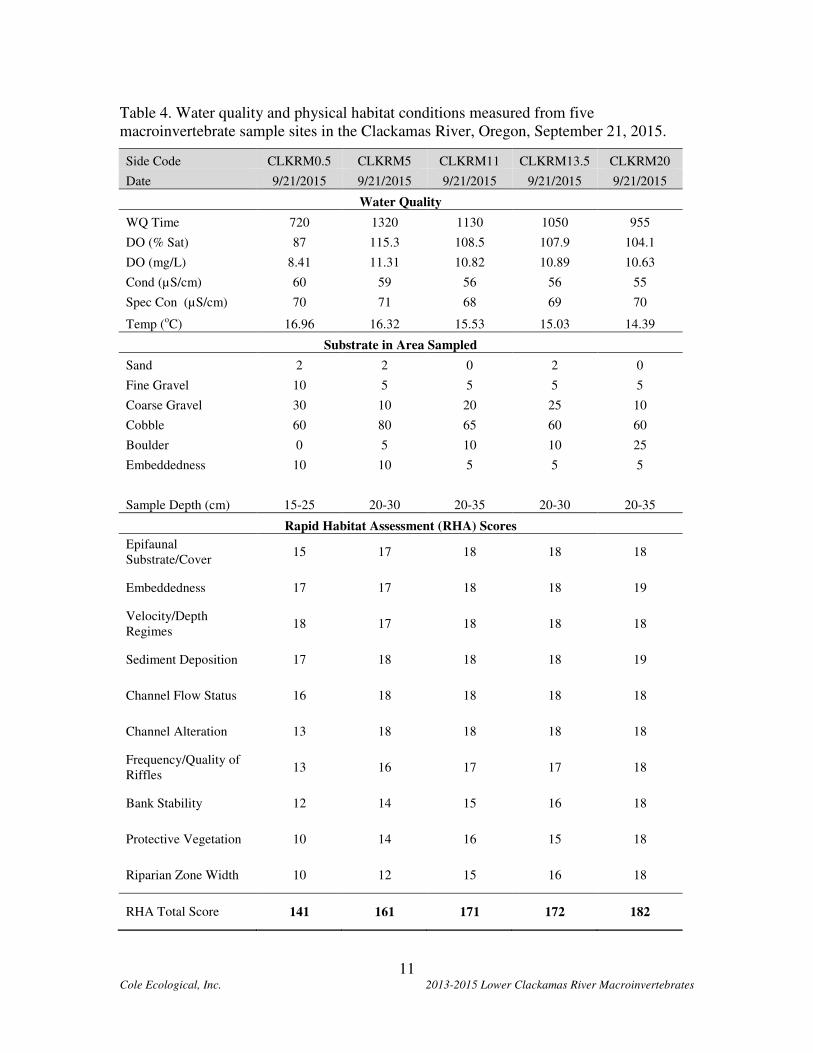
Rapid habitat scores from the five sites again ranged narrowly in 2015 from 141 to
182 (on scale of 10 to 200), indicating generally similar habitat conditions with respect to
sediment deposition, substrate composition, riparian condition, and habitat complexity
across the five sites (Table 4). Substrate conditions were also similar among the five sites
and appeared largely unchanged relative to those observed in 2013 and 2014. Riffle bed
materials were uniformly dominated by cobble substrate (Table 4 and Figure 4).
Substrates were secondarily dominated by coarse gravels at all sites other than
CLKRM20, located approximately 2.5 miles downriver from River Mill Dam. This
section of river, depleted of smaller substrates as a result of the upriver impoundment,
was secondarily dominated by boulders (Table 4 and Figure 4). No significant changes
in habitat conditions from 2013 to 2015 were noted at any of the five sample stations.
Water chemistry, based on limited instantaneous sampling of only a few parameters
at the time of macroinvertebrate sampling, was also similar among the five reaches in
2015. Dissolved oxygen concentrations approached or exceeded complete saturation, and
specific conductance ranged narrowly (between 68 and 71 µS/cm) across all sites (Table
4).
As in 2013 and 2014, DEQ macroinvertebrate multimetric (MM) scores calculated
from the 2015 data indicated that community conditions were similar among the reaches,
as mean total MM scores ranged only between 27 and 35 on a scale of 10 to 50 (Table 5
and Figure 5). Across the five sites, 2015 MM scores averaged 31.2, versus 32.8 in 2014
and 33.0 in 2013, suggesting similar lower-river-wide benthic ecological conditions
across the three years.
Between 2013 and 2015, mean MM scores ranged by two points at CLKRM5.0 and
CLKRM11, by five points at CLKRM20, by six points at CLKRM13.5, and by 8 points
9 Cole Ecological, Inc. 2013-2015 Lower Clackamas River Macroinvertebrates
at CLKRM0.5. This generally narrow range of scores suggests that under the range of
river conditions occurring over the past three seasons, macroinvertebrate community
conditions, as represented by the samples collected, do not exhibit large within-site
variability in condition, a desirable characteristic for detecting deleterious changes when
they occur. A closer examination of individual MM scores by site over time reveals that
the largest temporal change in MM scores, that at CLKRM0.5 from 2014 to 2015 of 8
points, occurred because both of the replicate samples scored lower in 2015 than in 2014
(Figure 6). This agreement in MM scores between the two replicates suggests that
conditions in the lower river at CLKRM0.5 may have indeed been marginally reduced
from 2014 to 2015.
In contrast to when duplicate samples are in agreement, and to illustrate the utility in
collecting duplicate samples, one of two samples collected from CLKRM13.5 in 2015
received an MM score of 6 points higher than any other sample had scored from the site
in three years. Examination of this score in relation to the others in Figure 5 suggests the
possibility that this score is an outlier and may not necessarily be representative of
average conditions at the site. This is an important consideration, as one objective of the
first three years of Clackamas River macroinvertebrate sampling was to assess variability
in macroinvertebrate community conditions in order to better understand what magnitude
of change in metric values would suggest a real change in biological condition. When
only one of two duplicate samples occurs outside the range of previous values (or
threshold values based on this range), the occurrence of an outlier value must be
considered.
Site pairs CLKRM0.5-CLKRM5 and CLKRM11-CLKRM13.5 serve as upstream-
downstream pairs to detect changes in ecological conditions within each length of river
bracketed by these pairs. Each of these site pairs exhibited similar mean total scores in
2015 (Table 5). Mean MM scores in 2015 differed between CLKRM0.5 and CLKRM5
by only 2 MM score points, while MM scores between CLKRM11 and CLKRM13.5
differed by 3 MM score points (Table 5), suggesting similar overall community
conditions between sites within each pair. Unlike in past years, the 2015 MM score data
suggest a slight decrease in macroinvertebrate community conditions in a downriver
direction across the lower four sample sites (Figure 5).
10 Cole Ecological, Inc. 2013-2015 Lower Clackamas River Macroinvertebrates
Table 3. Supplemental metric set used to further assess the condition of
macroinvertebrate communities in the Clackamas River, Oregon, fall 2014 (source: PGE 2004).
PGE Study Metric Metric Description
Total Richness Total number of benthic macroinvertebrate taxa identified
in the sample
EPT Richness
Number of taxa identified in the insect orders
Ephemeroptera (mayflies), Plecoptera (stoneflies), and
Trichoptera (caddisflies)
Community Tolerance Index (CTI)
A weighted average of the combined tolerance of the
community to environmental stress (primarily warm
water, low dissolved oxygen, and nutrient enrichment)
Percent Dominance (by three most
abundant taxa)
Combined relative abundance (%) of the three most
numerous taxa in the sample
Percent Intolerant Individuals Relative abundance of the most intolerant taxa identified
in the sample (CTI scores 0-3)
Percent Tolerant Individuals Relative abundance of the most tolerant taxa identified in
the sample (CTI scores 7-10)
Intolerant Taxa Richness Number of taxa that typically occur in cool, well-
oxygenated, nutrient-limited waters
Tolerant Taxa Richness Number of taxa that typically occur in warmer, poorly-
oxygenated, nutrient-rich waters
Percent Collector-Filterers Relative abundance (%) of macroinvertebrates belonging
to the collector-filterer feeding group
Percent Collector-Gatherers Relative abundance (%) of macroinvertebrates belonging
to the collector-gatherer feeding group
Percent Shredders Relative abundance (%) of macroinvertebrates belonging
to the shredder feeding group
Percent Predators Relative abundance (%) of macroinvertebrates belonging
to the predator feeding group
Percent Scrapers Relative abundance (%) of macroinvertebrates belonging
to the scraper feeding group
11 Cole Ecological, Inc. 2013-2015 Lower Clackamas River Macroinvertebrates
Table 4. Water quality and physical habitat conditions measured from five
macroinvertebrate sample sites in the Clackamas River, Oregon, September 21, 2015.
Side Code CLKRM0.5 CLKRM5 CLKRM11 CLKRM13.5 CLKRM20
Date 9/21/2015 9/21/2015 9/21/2015 9/21/2015 9/21/2015
Water Quality
WQ Time 720 1320 1130 1050 955
DO (% Sat) 87 115.3 108.5 107.9 104.1
DO (mg/L) 8.41 11.31 10.82 10.89 10.63
Cond (µS/cm) 60 59 56 56 55
Spec Con (µS/cm) 70 71 68 69 70
Temp (oC) 16.96 16.32 15.53 15.03 14.39
Substrate in Area Sampled
Sand 2 2 0 2 0
Fine Gravel 10 5 5 5 5
Coarse Gravel 30 10 20 25 10
Cobble 60 80 65 60 60
Boulder 0 5 10 10 25
Embeddedness 10 10 5 5 5
Sample Depth (cm) 15-25 20-30 20-35 20-30 20-35
Rapid Habitat Assessment (RHA) Scores
Epifaunal
Substrate/Cover 15 17 18 18 18
Embeddedness 17 17 18 18 19
Velocity/Depth
Regimes 18 17 18 18 18
Sediment Deposition 17 18 18 18 19
Channel Flow Status 16 18 18 18 18
Channel Alteration 13 18 18 18 18
Frequency/Quality of
Riffles 13 16 17 17 18
Bank Stability 12 14 15 16 18
Protective Vegetation 10 14 16 15 18
Riparian Zone Width 10 12 15 16 18
RHA Total Score 141 161 171 172 182
12 Cole Ecological, Inc. 2013-2015 Lower Clackamas River Macroinvertebrates
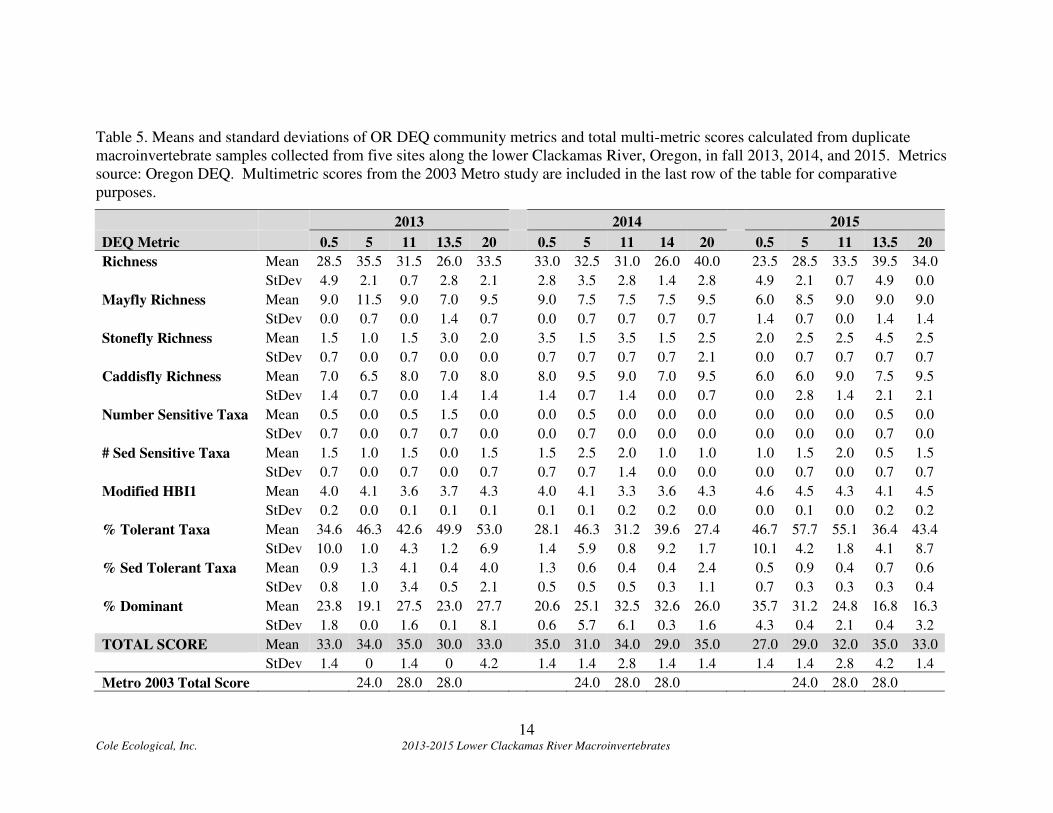
Total MM scores in this study were at least marginally higher than those measured in
2003 by Metro (Table 5; Cole 2004). MM scores at CLKRM5 have increased from 24 in
2003 to 31, 31, and 29 across the 3 years in this study. MM scores at CLKMR11 have
increased at from 28 in 2003 to 32, 35, and 32 in this study. MM scores at CLKRM13.5
were very similar between 2003 (28) and 2013-14 (30 and 29), but the 2015 score of 35 is
7 points higher than the 2003 score. As previously discussed, this higher score may have
resulted from an outlier score from one of the replicates collected in 2015. Similarly,
results from the prior studies may also contain outlier results, which are more likely to
unknowingly occur because samples were not collected in duplicate.
Individual DEQ metrics were also generally similar between 2013 and 2015 (Table
5; Figures 5 and 7). Individual DEQ metrics once again showed more variation among
sites than did total MMS scores, and patterns were inconsistent among metrics (Table 5
and Figure 5 and 7), lending support to results of the MMS scores that macroinvertebrate
community conditions did not vary significantly among sites. 2015 marked the first year
in which several metrics – including total richness and stonefly richness – appeared to
exhibit upstream-downstream trends in values, although these were not pronounced, and
may not necessarily reflect real gradients in community conditions.
Additional metrics used by PGE (PGE 2004) and selected for inclusion in this study
consistently suggested generally similar conditions among reaches and did not indicate
strong longitudinal trends in any attributes examined (Table 6 and Figure 8). As was the
case with several DEQ metrics calculated in 2015, a few PGE metrics – including total
richness and EPT richness – exhibited potential trends, but these were subtle. The
Community Tolerance Index (CTI; Table 3) was similar among sites, ranging only from
6.2 to 6.7 on a scale of 0 to 10, a range similar to that exhibited in 2013 and 2014 (Table
6 and Figure 8). Total richness once again exhibited some variation among sites, ranging
from 34 to 48; unlike in previous years, this metric consistently decreased between
CLKRM13.5 and CLKRM0.5 in 2015. Tolerant taxa richness and percent tolerant
organisms were once again variable among sites, and this third year of data collection
indicated a larger amount of temporal variability expressed in these metrics than in
others, as well (Figure 8). Interestingly, the percent tolerant organisms metric at
CLKRM0.5 was notably higher in 2015 than in previous years, lending support to the
possibility that lower DEQ MM scores in 2015 resulted from increased stress on the
benthic community in the very lower river as compared to previous years.
Collector-gatherer and collector-filterer organisms (Table 3) once again dominated
benthic communities across all sites in 2014 (Figure 9). Both metrics exhibited moderate
variation among sites, suggesting that these metrics may not be as suitable as some others
for detecting changes in benthic community conditions in the river.
2013-2015 PGE metric results were generally similar to those measured in 1999 and
2000 at the four sites where older data were available. Following the 2014 season,
13 Cole Ecological, Inc. 2013-2015 Lower Clackamas River Macroinvertebrates
community richness appeared to potentially be trending higher at three of these sites
(Table 7; Figure 10). However, community richness was reduced in 2015 relative to
2014 at two of these sites, suggesting that inter-annual variability and sampling error
were likely responsible for these observed differences over time.
NMS produced a three-dimensional ordination that explained 73.4% of the variation
in the original sample space (final stress = 11.17). Both year (correlation with axis 1: r =
-0.665, p = 0.00006) and river mile (correlation with axis 2: r = -0.809; p = <0.00001;
correlation with axis 3: r = 0.805, p < 0.0001) were significantly correlated with one or
more ordination axes, indicating a measurable effect of both variables on patterns in
community composition. NMS bi-plots (Figure 11) reveal some clustering of samples
(according to similar community composition) by both sample year (2013/2014 versus
2015) and by sample location (river mile). NMS results suggest that community
conditions generally in 2015 were generally the least similar among the three sampling
years, and that community conditions at CLKRM20 were the least similar among the five
sites.
14 Cole Ecological, Inc. 2013-2015 Lower Clackamas River Macroinvertebrates
Table 5. Means and standard deviations of OR DEQ community metrics and total multi-metric scores calculated from duplicate
macroinvertebrate samples collected from five sites along the lower Clackamas River, Oregon, in fall 2013, 2014, and 2015. Metrics
source: Oregon DEQ. Multimetric scores from the 2003 Metro study are included in the last row of the table for comparative
purposes.
2013 2014 2015
DEQ Metric 0.5 5 11 13.5 20 0.5 5 11 14 20 0.5 5 11 13.5 20
Richness Mean 28.5 35.5 31.5 26.0 33.5 33.0 32.5 31.0 26.0 40.0 23.5 28.5 33.5 39.5 34.0
StDev 4.9 2.1 0.7 2.8 2.1 2.8 3.5 2.8 1.4 2.8 4.9 2.1 0.7 4.9 0.0
Mayfly Richness Mean 9.0 11.5 9.0 7.0 9.5 9.0 7.5 7.5 7.5 9.5 6.0 8.5 9.0 9.0 9.0
StDev 0.0 0.7 0.0 1.4 0.7 0.0 0.7 0.7 0.7 0.7 1.4 0.7 0.0 1.4 1.4
Stonefly Richness Mean 1.5 1.0 1.5 3.0 2.0 3.5 1.5 3.5 1.5 2.5 2.0 2.5 2.5 4.5 2.5
StDev 0.7 0.0 0.7 0.0 0.0 0.7 0.7 0.7 0.7 2.1 0.0 0.7 0.7 0.7 0.7
Caddisfly Richness Mean 7.0 6.5 8.0 7.0 8.0 8.0 9.5 9.0 7.0 9.5 6.0 6.0 9.0 7.5 9.5
StDev 1.4 0.7 0.0 1.4 1.4 1.4 0.7 1.4 0.0 0.7 0.0 2.8 1.4 2.1 2.1
Number Sensitive Taxa Mean 0.5 0.0 0.5 1.5 0.0 0.0 0.5 0.0 0.0 0.0 0.0 0.0 0.0 0.5 0.0
StDev 0.7 0.0 0.7 0.7 0.0 0.0 0.7 0.0 0.0 0.0 0.0 0.0 0.0 0.7 0.0
# Sed Sensitive Taxa Mean 1.5 1.0 1.5 0.0 1.5 1.5 2.5 2.0 1.0 1.0 1.0 1.5 2.0 0.5 1.5
StDev 0.7 0.0 0.7 0.0 0.7 0.7 0.7 1.4 0.0 0.0 0.0 0.7 0.0 0.7 0.7
Modified HBI1 Mean 4.0 4.1 3.6 3.7 4.3 4.0 4.1 3.3 3.6 4.3 4.6 4.5 4.3 4.1 4.5
StDev 0.2 0.0 0.1 0.1 0.1 0.1 0.1 0.2 0.2 0.0 0.0 0.1 0.0 0.2 0.2
% Tolerant Taxa Mean 34.6 46.3 42.6 49.9 53.0 28.1 46.3 31.2 39.6 27.4 46.7 57.7 55.1 36.4 43.4
StDev 10.0 1.0 4.3 1.2 6.9 1.4 5.9 0.8 9.2 1.7 10.1 4.2 1.8 4.1 8.7
% Sed Tolerant Taxa Mean 0.9 1.3 4.1 0.4 4.0 1.3 0.6 0.4 0.4 2.4 0.5 0.9 0.4 0.7 0.6
StDev 0.8 1.0 3.4 0.5 2.1 0.5 0.5 0.5 0.3 1.1 0.7 0.3 0.3 0.3 0.4
% Dominant Mean 23.8 19.1 27.5 23.0 27.7 20.6 25.1 32.5 32.6 26.0 35.7 31.2 24.8 16.8 16.3
StDev 1.8 0.0 1.6 0.1 8.1 0.6 5.7 6.1 0.3 1.6 4.3 0.4 2.1 0.4 3.2
TOTAL SCORE Mean 33.0 34.0 35.0 30.0 33.0 35.0 31.0 34.0 29.0 35.0 27.0 29.0 32.0 35.0 33.0
StDev 1.4 0 1.4 0 4.2 1.4 1.4 2.8 1.4 1.4 1.4 1.4 2.8 4.2 1.4
Metro 2003 Total Score 24.0 28.0 28.0 24.0 28.0 28.0 24.0 28.0 28.0
15 Cole Ecological, Inc. 2013-2015 Lower Clackamas River Macroinvertebrates
Table 6. Means and standard deviations of community metrics calculated from duplicate macroinvertebrate samples collected from six
sites along the lower Clackamas River, Oregon, in fall 2013, 2014, and 2015. Metrics source: PGE 2004.
2013 2014 2015
PGE Metric 0.5 5 11 13.5 20 0.5 5 11 14 20 0.5 5 11 14 20
Richness Mean 36.5 45.0 40.0 34.0 41.0 42.5 40.0 40.5 39.0 52.0 34.0 35.5 39.5 48.0 43.5
StDev 2.1 1.4 2.8 1.4 4.2 0.7 1.4 0.7 4.2 2.8 5.7 3.5 0.7 4.2 3.5
EPT Richness Mean 17.5 19.0 18.5 17.0 19.5 13.5 18.5 20.0 16.0 21.5 14.0 17.0 20.5 21.0 21.0
StDev 2.1 0.0 0.7 2.8 2.1 2.1 2.1 1.4 1.4 0.7 1.4 2.8 2.1 4.2 1.4
CTI Mean 6.2 6.3 6.0 6.3 6.7 6.2 6.2 5.8 6.0 6.1 6.7 6.7 6.5 6.2 6.6
StDev 0.2 0.1 0.0 0.0 0.1 0.1 0.1 0.1 0.1 0.0 0.2 0.0 0.1 0.1 0.0
Dom (3) Mean 49.6 48.2 55.4 62.2 52.2 38.1 50.9 61.7 60.2 34.9 51.5 64.1 55.5 36.4 38.3
StDev 0.8 1.1 5.6 0.5 8.7 1.1 4.5 5.7 0.5 2.8 11.8 0.3 8.4 7.0 14.7
Percent Intolerant Mean 0.5 1.6 0.3 0.2 1.1 0.3 1.8 0.1 0.1 1.0 0.4 0.9 0.0 0.2 0.4
StDev 0.4 0.9 0.1 0.0 1.5 0.4 1.2 0.1 0.1 0.3 0.3 1.1 0.0 0.3 0.6
Percent Tolerant Mean 33.0 36.6 26.2 32.6 48.4 31.0 25.8 13.7 17.4 20.0 54.4 46.9 38.2 33.9 40.5
StDev 6.8 2.7 3.6 0.1 3.0 8.2 1.3 1.3 0.9 1.7 5.3 0.8 11.2 1.1 2.1
Intolerant Richness Mean 1.0 1.0 1.5 1.0 0.5 0.5 1.5 0.5 0.5 1.0 1.0 1.0 0.0 0.5 0.5
StDev 0.0 0.0 0.7 0.0 0.7 0.7 0.7 0.7 0.7 0.0 0.0 0.0 0.0 0.7 0.7
Tolerant Richness Mean 13.5 17.0 13.0 9.5 15.0 15.5 14.0 11.0 10.5 17.5 10.5 14.5 13.5 18.0 15.5
StDev 2.1 1.4 1.4 0.7 2.8 2.1 2.8 1.4 0.7 2.1 6.4 0.7 0.7 1.4 2.1
% Collector-Filterer Mean 27.4 34.7 25.8 35.8 41.1 17.8 35.9 25.3 31.1 18.4 36.8 46.3 43.0 19.3 27.8
StDev 10.1 0.6 8.7 2.5 10.5 2.0 6.4 1.2 8.6 0.1 14.3 4.1 3.8 10.1 9.8
% Collector-Gatherer Mean 40.3 29.9 21.7 17.5 24.2 50.1 31.8 19.4 21.0 34.2 40.9 27.0 20.7 30.4 32.9
StDev 6.6 2.9 0.5 0.4 2.0 1.8 4.6 5.1 0.7 3.6 13.5 2.2 2.6 9.7 6.7
% Shredder Mean 0.9 1.0 3.4 2.3 1.3 2.0 6.6 31.7 23.9 7.3 0.2 0.2 4.2 15.3 0.9
StDev 0.3 0.2 1.4 0.1 0.4 1.1 3.4 6.2 10.4 0.7 0.0 0.2 2.3 2.2 0.9
% Predator Mean 5.8 9.3 10.2 10.4 9.9 11.5 10.9 8.0 9.9 15.0 3.7 7.1 10.5 12.1 9.9
StDev 2.1 1.9 0.9 2.7 1.2 0.6 0.6 0.7 0.6 1.6 0.3 0.3 1.1 0.4 0.0
% Scraper Mean 20.1 19.1 15.4 9.6 14.3 8.9 9.7 6.2 4.4 10.1 9.9 13.2 13.7 13.5 19.6
StDev 4.8 0.4 3.3 3.7 2.0 0.4 0.2 0.3 1.3 0.4 1.6 0.7 2.8 4.5 3.3
16 Cole Ecological, Inc. 2013-2015 Lower Clackamas River Macroinvertebrates
Table 7. Comparison of PGE metrics calculated from 2013-2015 Clackamas River samples to samples collected in 1999 (USGS) and
2000 (PGE 2004) from the same locales. Source of 1999 and 2000 data: PGE 2004.
CLKRM0.5 CLKRM11 CLKRM13.5 CLKRM20
Metric 1999 2013 2014 2015 2000 2013 2014 2015 2000 2013 2014 2015 1999 2013 2014 2015
Richness 27.0 36.5 42.5 34.0 36.0 40.0 40.5 39.5 31.0 34.0 39.0 48.0 35.0 41.0 52.0 43.5
EPT Richness 13.0 17.5 18.5 14.0 21.0 18.5 20.0 20.5 20.0 17.0 16.0 21.0 16.0 19.5 21.5 21.0
CTI 6.4 6.2 6.2 6.7 6.1 6.0 5.8 6.5 6.2 6.3 6.0 6.2 6.1 6.7 6.1 6.6
Dom (3) 66.0 49.6 38.1 51.5 51.0 55.4 61.7 55.5 79.0 62.2 60.2 36.4 77.0 52.2 34.9 38.3
Percent Intolerant 0.4 0.5 0.3 0.4 0.0 0.3 0.1 0.0 0.0 0.2 0.1 0.2 0.5 1.1 1.0 0.4
Percent Tolerant 41.3 33.0 31.0 54.4 22.0 26.2 13.7 38.2 18.0 32.6 17.4 33.9 10.0 48.4 20.0 40.5
Intolerant Richness 1.0 1.0 0.5 1.0 0.0 1.5 0.5 0.0 0.0 1.0 0.5 0.5 1.0 0.5 1.0 0.5
Tolerant Richness 9.0 13.5 15.5 10.5 11.0 13.0 11.0 13.5 8.0 9.5 10.5 18.0 8.0 15.0 17.5 15.5
% Collector-Filterer 47.0 27.4 17.8 36.8 26.0 25.8 25.3 43.0 42.0 35.8 31.1 19.3 50.2 41.1 18.4 27.8
% Collector-Gatherer 25.0 40.3 50.1 40.9 29.0 21.7 19.4 20.7 16.0 17.5 21.0 30.4 20.0 24.2 34.2 32.9
% Shredder 1.0 0.9 2.0 0.2 3.3 3.4 31.7 4.2 3.5 2.3 23.9 15.3 0.3 1.3 7.3 0.9
% Predator 11.2 5.8 11.5 3.7 11.0 10.2 8.0 10.5 16.0 10.4 9.9 12.1 21.0 9.9 15.0 9.9
% Scraper 15.0 20.1 8.9 9.9 25.0 15.4 6.2 13.7 21.0 9.6 4.4 13.5 6.0 14.3 10.1 19.6
17 Cole Ecological, Inc. 2013-2015 Lower Clackamas River Macroinvertebrates
DISCUSSION
Results of the 2015 lower Clackamas River macroinvertebrate assessment once again
suggest that macroinvertebrate communities inhabiting shallow riffle habitat of the lower
Clackamas River between river miles 0 and 20 presently exhibit modest variation in
community conditions among lower river locations. These results also generally suggest
relatively uniform ambient environmental conditions within this 20-mile length of river.
Observations of physical habitat conditions and water quality measurements made during
this study from 2013 through 2015 also suggest a lack of obvious environmental
gradients in the lower river that would be expected to exert a significant effect on benthic
communities. PGE’s 2000 study of macroinvertebrate communities revealed that the
most distinct changes in benthic community conditions occurred upriver of the mainstem
river impoundments where the river transitions from a mid-order montane stream to a
larger, lower-gradient riverine environment (PGE 2004). Despite the lack of major
longitudinal gradients in community conditions, NMS ordination analyses in both 2014
and 2015 revealed measurable differences in community composition among sites, and
that these subtle differences do correspond with river mile. NMS analysis also revealed
that composition was influenced by sampling year, with larger differences occurring in
2015 relative to the other two years. Owing to its ability to reveal these less obvious
patterns in community composition, NMS ordination analysis could prove useful for
elucidating future deviations from current conditions when used in conjunction with
community metric analysis.
This study included metrics from two sources – PGE’s 2004 report and OR DEQ – to
allow comparison of the present data set with the results of several historic data sets.
While the first few years of monitoring utilized this larger number of metrics from both
sources, future monitoring of the river can focus on a smaller set based on the results of
these first three years of monitoring and also based on redundancy in certain metrics
between the two sets. First, macroinvertebrate attribute coding used to derive the DEQ
metrics is not as well researched or accurate as is the coding used to calculate the PGE
source metrics. As such, among metrics that are redundant between the two sets, use of
the PGE metrics is recommended. Furthermore, the 2004 PGE report includes an
example Benthic Index of Biotic Integrity (B-IBI) that could be used to provide a single
multi-metric index score for the lower river that may be more relevant to large rivers than
is the DEQ multimetric index (PGE 2004). As such, the following set of core metrics is
recommended for continued monitoring of benthic macroinvertebrate communities in the
lower Clackamas River:
• Total Richness
• EPT Richness
18 Cole Ecological, Inc. 2013-2015 Lower Clackamas River Macroinvertebrates
• Community Tolerance Index (CTI)
• Percent Tolerant Individuals (and total abundance)
• Tolerant Taxa Richness
• Total B-IBI Score (source: 2004 PGE report; not calculated herein)
• OR DEQ Multimetric Index Score
Among these metrics, those showing the smallest variation among sites and years
will likely hold the most promise for detection of changes in benthic community
conditions when they occur. In order to evaluate and compare variation across metrics,
measured variation must be normalized relative to the mean value of each metric. This
normalization is achieved by dividing the standard deviation by the mean. Multiplying
this result by 100 yields the coefficient of variation (CV), which can be compared among
metrics to assess the relative precision of each. The signal-to-noise ratio is simply the
mean divided by the standard deviation. The coefficient of variation (CV) and the signal-
to-noise ratio (SNR) were calculated for each of these core metrics from the 2013-2015
data (Table 8).
Among the six metrics tested, the Community Tolerance Index (CTI) had the lowest
CV (and therefore highest SNR), while the percent tolerant and tolerant richness metrics
had the highest CV and correspondingly lowest SNR. DEQ MM scores, EPT richness,
and total richness each had intermediate CV values relative to these extremes. This
exercise was not intended to determine which metrics to retain or to exclude from future
analyses, but to illustrate which metrics are likely to be less precise (“noisier”) and
therefore less likely to detect change in community conditions when they occur. These
metrics will not be equally sensitive to every type of disturbance, underscoring the
importance of maintaining a number of metrics in future analyses. Based on these
results, the CTI, DEQ MM scores, and total richness metric hold the most promise for
detecting change when change occurs.
Table 8. Coefficients of variation (CV) and signal-to-noise ratios (SNR) of select
macroinvertebrate community metrics calculated from samples collected from the lower
Clackamas River 2013-2015.
Metric Source CV SNR
CTI PGE 2004 4.2 25.5
DEQ MM Score DEQ 9.0 11.8
Total Richness PGE 2004 11.7 11.6
EPT Richness PGE 2004 12.8 8.9
Tolerant Richness PGE 2004 20.2 5.9
Percent Tolerant PGE 2004 34.7 3.0
19 Cole Ecological, Inc. 2013-2015 Lower Clackamas River Macroinvertebrates
Generally, conditions appear to be similar among lower-river reaches and do not
vary considerably over time (and over the range of environmental conditions that
occurred during this two-year sampling period). The lower MM scores for both
replicates at CLKRM0.5 in 2015 suggest that the result is representative of conditions at
the site at the time of sampling. As this site occurs furthest downriver in the system,
where environmental extremes are likely to be largest, it would be expected that this site
could experience larger temporal variability than would the other sites. This larger
variability in scores at CLKRM0.5 highlights the need to use a statistically based
approach for determining when such deviations in scores from those of previous years
represent a change in ecological condition that occurs outside “normal” range.
One such approach compares new values to the range of previous values in order to
determine the likelihood that the new and old values derive from the same population
(signifying no change). The data collected over the past three years are considered to be
representative of the “natural” variability within sites, among sites, and across the three
years, and have been collected in the absence of any known significant disturbances.
Accordingly, quantification of this variability within each site over the three years allows
one to estimate the value of each metric that would be sufficiently outside this range so as
to likely be the result of a change in condition. When data are normally distributed (will
need to be tested once each site has amassed a larger sample size), 95% percent of values
should occur within two standard deviations of the mean. Any values occurring outside
this range of metric values collected from each site would be cause for further
investigation of this likely decline in biological condition.
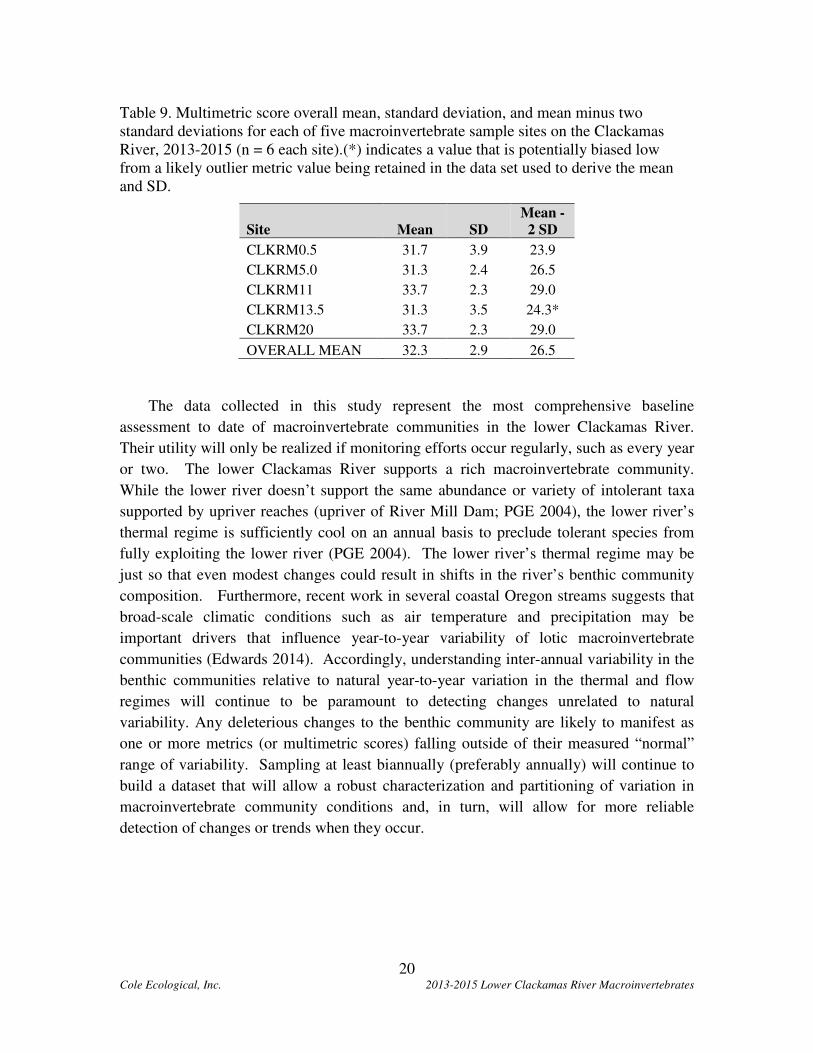
The DEQ multimetric score was used to demonstrate how each metric can be used in
change-of-condition detection in this manner (Table 9). MM scores larger than two
standard deviations below the mean would be an indication that a change in biological
condition has occurred because the probability of such a value occurring under “natural”
conditions (i.e., in the absence of disturbance) would be 0.05 (with normally distributed
data). Because a wider range of scores has occurred at some sites than at others,
threshold metric values for detecting change will differ among sites using this approach.
Sites with larger “natural” variability, such as CLKRM0.5, will have lower threshold
values to indicate a change. When such changes occur, the data should first be examined
to determine whether a potential outlier sample contributed to the result, or if the
duplicate sample results correspond with each other. Follow-up investigation could
include additional biological sampling to corroborate the initial results, as well as water
quality testing, particularly if follow-up biological sampling continues to indicate a likely
impact. Of course, as additional data are collected in future years (and those data are
determined not to indicate any change in condition to the benthic community), these
additional data can be used to refine these criteria for detecting potential impacts.
20 Cole Ecological, Inc. 2013-2015 Lower Clackamas River Macroinvertebrates
Table 9. Multimetric score overall mean, standard deviation, and mean minus two
standard deviations for each of five macroinvertebrate sample sites on the Clackamas
River, 2013-2015 (n = 6 each site).(*) indicates a value that is potentially biased low
from a likely outlier metric value being retained in the data set used to derive the mean
and SD.
Site Mean SD
Mean -
2 SD
CLKRM0.5 31.7 3.9 23.9
CLKRM5.0 31.3 2.4 26.5
CLKRM11 33.7 2.3 29.0
CLKRM13.5 31.3 3.5 24.3*
CLKRM20 33.7 2.3 29.0
OVERALL MEAN 32.3 2.9 26.5
The data collected in this study represent the most comprehensive baseline
assessment to date of macroinvertebrate communities in the lower Clackamas River.
Their utility will only be realized if monitoring efforts occur regularly, such as every year
or two. The lower Clackamas River supports a rich macroinvertebrate community.
While the lower river doesn’t support the same abundance or variety of intolerant taxa
supported by upriver reaches (upriver of River Mill Dam; PGE 2004), the lower river’s
thermal regime is sufficiently cool on an annual basis to preclude tolerant species from
fully exploiting the lower river (PGE 2004). The lower river’s thermal regime may be
just so that even modest changes could result in shifts in the river’s benthic community
composition. Furthermore, recent work in several coastal Oregon streams suggests that
broad-scale climatic conditions such as air temperature and precipitation may be
important drivers that influence year-to-year variability of lotic macroinvertebrate
communities (Edwards 2014). Accordingly, understanding inter-annual variability in the
benthic communities relative to natural year-to-year variation in the thermal and flow
regimes will continue to be paramount to detecting changes unrelated to natural
variability. Any deleterious changes to the benthic community are likely to manifest as
one or more metrics (or multimetric scores) falling outside of their measured “normal”
range of variability. Sampling at least biannually (preferably annually) will continue to
build a dataset that will allow a robust characterization and partitioning of variation in
macroinvertebrate community conditions and, in turn, will allow for more reliable
detection of changes or trends when they occur.
21 Cole Ecological, Inc. 2013-2015 Lower Clackamas River Macroinvertebrates
CONCLUSIONS & RECOMMENDATIONS
• The first three years of CRWP macroinvertebrate monitoring in the lower
Clackamas River suggest that community conditions are generally similar
between river miles 0 and 20. Furthermore, these conditions are generally similar
to those reported by others in 1999, 2000, and 2003, with some indication that
conditions may be slightly improved at some sites since 1999/2000. While the
lack of a standard or reference condition for larger rivers in the region precludes
an assignment of a condition class to these results, the presence of numerous EPT
taxa is suggestive of current water quality and habitat conditions that are generally
suitable for maintenance of diverse native aquatic communities.
• Conditions measured in 2015 were generally similar to those measured in 2013
and 2014 at most sites. While temporal variability in community metrics was
higher at some sample sites than at others, the measured variability was not
beyond what would be expected as normal year-to-year variation (i.e., no obvious
indication of increased or decreased biological conditions at any sites from 2013
to 2015). While conditions at CLKRM0.5 (as indicated by a number of metrics)
were lower in 2015 than in past years, the measured condition likely reflects the
natural variability in conditions in the lower river and is not suggestive of a
decline in condition immediately related to anthropogenic disturbance.
Accordingly, these data represent average conditions and variability in these
conditions over the range of environmental conditions occurring during the 2013-
2015 sampling period.
• These three years of baseline macroinvertebrate community conditions in the
lower Clackamas River were used to calculate several measures of variability,
including the coefficient of variation and signal-to-noise ratio, to understand the
relative sensitivity of metrics selected for monitoring and to exemplify how to use
the data to detect future change.
• Continue annual or biannual replicated sampling in the lower Clackamas River.
These additional data will further characterize spatial and temporal variability
under a range of climatic and flow conditions, thereby improving the ability to
detect change when change occurs. Future data will also be used to identify
changes to benthic community conditions through comparison with measured
variation in conditions over the past three sampling years.
• Continue testing the selected monitoring metrics for changes in condition and for
further characterization of variability as additional data are amassed. Focus
analyses on the set of core metrics and multimetric indexes identified and
examined in this report.
22 Cole Ecological, Inc. 2013-2015 Lower Clackamas River Macroinvertebrates
LITERATURE CITED
Cole, M. B. 2004. Baseline Assessment of Stream Habitat and Macroinvertebrate
Communities in and Adjacent to the Damascus Area Urban Growth Boundary Expansion,
Oregon. Unpublished report prepared for Metro, Portland, Oregon.
Cole, M. B. 2013. Lower Clackamas River Basin Macroinvertebrate Monitoring Plan.
Unpublished report prepared by M. Cole for the Clackamas River Water Providers,
Clackamas, OR.
DEQ, 2003. Benthic Macroinvertebrate Protocol for Wadeable Rivers and Streams.
Unpublished methods manual. Oregon Department of Environmental Quality, Portland,
OR.
Edwards, P.M. 2014. "Macroinvertebrates and Excessive Fine Sediment Conditions in
Oregon Coastal Streams" (2014). Portland State University, Dissertations and Theses.
Paper 1831.
Hubler, S. 2008. PREDATOR: Development and use of RIVPACS-type
macroinvertebrate models to assess the biotic condition of wadeable Oregon streams.
Unpublished report prepared by the Oregon Department of Environmental Quality,
Watershed Assessment Section. 51 pp.
Jackson D. A. 1993. Multivariate analysis of benthic invertebrate communities: the
implication of choosing particular data standardizations, measures of association, and
ordination methods. Hydrobiologia, 268, 9-26.
McCune B. & Mefford M. J. 1999. PC-ORD. Multivariate analysis of ecological data,
Version 4. MJM Software Design, Gleneden Beach, Oregon, USA.
NBAWG 2002 (unpublished draft). Level 3 standard taxonomic effort for benthic
invertebrate biomonitoring studies in the Pacific Northwest. www.xerces.org
PGE. 2004. Characterization of benthic invertebrate communities in the Clackamas River
watershed, Oregon. Unpublished report prepared for Portland General Electric, Portland,
OR. 125 pp + appendices.
Reece P. F. & Richardson J. S. 2000. Benthic macroinvertebrate assemblages of coastal
and continental streams and large rivers of southwestern British Columbia, Canada.
Hydrobiologia, 439, 77-89.
Rempel L. L., Richardson J. S., & Healey M. C. 2000. Macroinvertebrate community
structure along gradients of hydraulic and sedimentary conditions in a large gravel-bed
river. Freshwater Biology, 45, 57-73.
23 Cole Ecological, Inc. 2013-2015 Lower Clackamas River Macroinvertebrates
Figure 2. Summer 2013 through December 2015 Clackamas River discharge as
measured at USGS gage station 14211010. Data collected after March 2015 are
provisional.
24 Cole Ecological, Inc. 2013-2015 Lower Clackamas River Macroinvertebrates
0
1
2
3
4
5
6
7
8
9
10
8/1
8/3
8/5
8/7
8/9
8/1
1
8/1
3
8/1
5
8/1
7
8/1
9
8/2
1
8/2
3
8/2
5
8/2
7
8/2
9
8/3
1
9/2
9/4
9/6
9/8
9/1
0
9/1
2
9/1
4
9/1
6
9/1
8
9/2
0
DO
Co
nce
ntr
ati
on
(m
g/
L)
Date
Daily Minimum DO Concentration (nr Oregon
City)
2013
2014
2015
Figure 3. Clackamas River daily maximum water temperatures and daily minimum
dissolved oxygen concentrations measured at USGS gage station 14211010, August 1
through September 20, 2013-2015. Data collected after March 2015 are provisional.
25 Cole Ecological, Inc. 2013-2015 Lower Clackamas River Macroinvertebrates
CLKRM0.5
Sand
Fine
Gra
vel
Coar
se G
rave
l
Cobble
Bould
er
0
20
40
60
80
Substrate Size Class
%C
om
po
sit
ion
CLKRM4.2
Sand
Fine
Gra
vel
Coar
se G
rave
l
Cobble
Bould
er0
20
40
60
80
100
Substrate Size Class
%C
om
po
sit
ion
CLKRM11
Sand
Fine
Gra
vel
Coa
rse
Gra
vel
Cobble
Bould
er0
20
40
60
80
Substrate Size Class
%C
om
po
sit
ion
CLKRM13.5
Sand
Fine
Gra
vel
Coa
rse
Gra
vel
Cobble
Bould
er0
20
40
60
80
Substrate Size Class
%C
om
po
sit
ion
CLKRM20
Sand
Fine
Gra
vel
Coa
rse
Gra
vel
Cobble
Bould
er0
20
40
60
80
Substrate Size Class
%C
om
po
sit
ion
Figure 4. Substrate composition at six Clackamas River macroinvertebrate samples sites,
September 2015.
26 Cole Ecological, Inc. 2013-2015 Lower Clackamas River Macroinvertebrates
Modified HBI
CLK
RM
0.5
CLK
RM
5
CLK
RM
11
CLK
RM
13.5
CLK
RM
20
0
2
4
6
8
10
Site
HB
I S
co
re% Sediment Tolerant Individuals
CLK
RM
0.5
CLK
RM
5
CLK
RM
11
CLK
RM
13.5
CLK
RM
20
0
5
10
15
20
25
Site
% A
bu
nd
an
ce
% Tolerant Individuals
CLK
RM
0.5
CLK
RM
5
CLK
RM
11
CLK
RM
13.5
CLK
RM
20
0
20
40
60
80
100
Site
% A
bu
nd
an
ce
%Dominant
CLK
RM
0.5
CLK
RM
5
CLK
RM
11
CLK
RM
13.5
CLK
RM
20
0
10
20
30
40
50
Site
% A
bu
nd
an
ce
MMS Score
CLK
RM
0.5
CLK
RM
5
CLK
RM
11
CLK
RM
13.5
CLK
RM
20
0
10
20
30
40
50
Site
To
tal S
co
re
Figure 5. Mean (+SD) macroinvertebrate community metric scores and total multimetric
scores (MMS) calculated from duplicate samples collected from the lower Clackamas
River in September 2013 (black bars), 2014 (white bars), and 2015 (grey bars).
27 Cole Ecological, Inc. 2013-2015 Lower Clackamas River Macroinvertebrates
2013 2014 2015
0
10
20
30
40
CLKRM0.5
Year
2013 2014 2015
0
10
20
30
40
CLKRM5
Year
2013 2014 2015
0
10
20
30
40
CLKRM11
Year
2013 2014 2015
0
10
20
30
40
CLKRM13.5
Year
Figure 6. Macroinvertebrate multimetric scores (y axis) calculated from individual
duplicate macroinvertebrate samples collected from five locations in the lower
Clackamas River in 2013, 2014, and 2015. Squares represent the first sample collected,
and diamonds represent the second sample collected. Each graph represents a single
sample site.
28 Cole Ecological, Inc. 2013-2015 Lower Clackamas River Macroinvertebrates
Total Richness
CLK
RM
0.5
CLK
RM
5
CLK
RM
11
CLK
RM
13.5
CLK
RM
20
0
10
20
30
40
502014
2013
2015
Site
Ric
hn
ess (
# t
axa)
Caddisfly Richness
CLK
RM
0.5
CLK
RM
5
CLK
RM
11
CLK
RM
13.5
CLK
RM
20
0
2
4
6
8
10
12
Site
Ric
hn
ess (
# t
axa)
Mayfly Richness
CLK
RM
0.5
CLK
RM
5
CLK
RM
11
CLK
RM
13.5
CLK
RM
20
0
5
10
15
Site
Ric
hn
ess (
# t
axa)
Number Sensitive Taxa
CLK
RM
0.5
CLK
RM
5
CLK
RM
11
CLK
RM
13.5
CLK
RM
20
0
2
4
6
Site
Ric
hn
ess (
# t
axa)
Stonefly Richness
CLK
RM
0.5
CLK
RM
5
CLK
RM
11
CLK
RM
13.5
CLK
RM
20
0
2
4
6
Site
Ric
hn
ess (
# t
axa)
Number Sediment Sensitive Taxa
CLK
RM
0.5
CLK
RM
5
CLK
RM
11
CLK
RM
13.5
CLK
RM
20
0
1
2
3
4
5
Site
Ric
hn
ess (
# t
axa)
Figure 7. Mean (+SD) macroinvertebrate community metric scores calculated from
duplicate samples collected from the lower Clackamas River in September 2013 (black
bars), 2014 (white bars), and 2015 (grey bars).
29 Cole Ecological, Inc. 2013-2015 Lower Clackamas River Macroinvertebrates
Total Richness
CLK
RM
0.4
CLK
RM
5
CLK
RM
11
CLK
RM
13.5
CLK
RM
20
0
10
20
30
40
50
60
70 2013 2014 2015
Site
Ric
hn
ess (
# t
axa)
Percent Intolerant Individuals
CLK
RM
0.4
CLK
RM
5
CLK
RM
11
CLK
RM
13.5
CLK
RM
20
0
2
4
6
8
10
Site
% A
bu
nd
an
ce
EPT Richness
CLK
RM
0.4
CLK
RM
5
CLK
RM
11
CLK
RM
13.5
CLK
RM
20
0
5
10
15
20
25
Site
Ric
hn
ess (
# t
axa)
Percent Tolerant Individuals
CLK
RM
0.4
CLK
RM
5
CLK
RM
11
CLK
RM
13.5
CLK
RM
20
0
20
40
60
80
Site
% A
bu
nd
an
ce
Community Tolerance Index
CLK
RM
0.4
CLK
RM
5
CLK
RM
11
CLK
RM
13.5
CLK
RM
20
0
2
4
6
8
10
Site
CT
I S
co
re
Number Intolerant Taxa
CLK
RM
0.4
CLK
RM
5
CLK
RM
11
CLK
RM
13.5
CLK
RM
20
0
2
4
6
8
10
Site
Ric
hn
ess (
# t
axa)
Percent Dominance (3 taxa)
CLK
RM
0.4
CLK
RM
5
CLK
RM
11
CLK
RM
13.5
CLK
RM
20
0
20
40
60
80
100
Site
% A
bu
nd
an
ce
Number Tolerant Taxa
CLK
RM
0.4
CLK
RM
5
CLK
RM
11
CLK
RM
13.5
CLK
RM
20
0
5
10
15
20
Site
Ric
hn
ess (
# t
axa)
Figure 8. Mean (+SD) macroinvertebrate community metric scores calculated from
duplicate samples collected from the lower Clackamas River in September 2013 (black
bars), 2014 (white bars), and 2015 (grey bars). Metrics in this figure are the same as
those used in the 2000-2001 PGE macroinvertebrate study of the Clackamas River (PGE
2004).
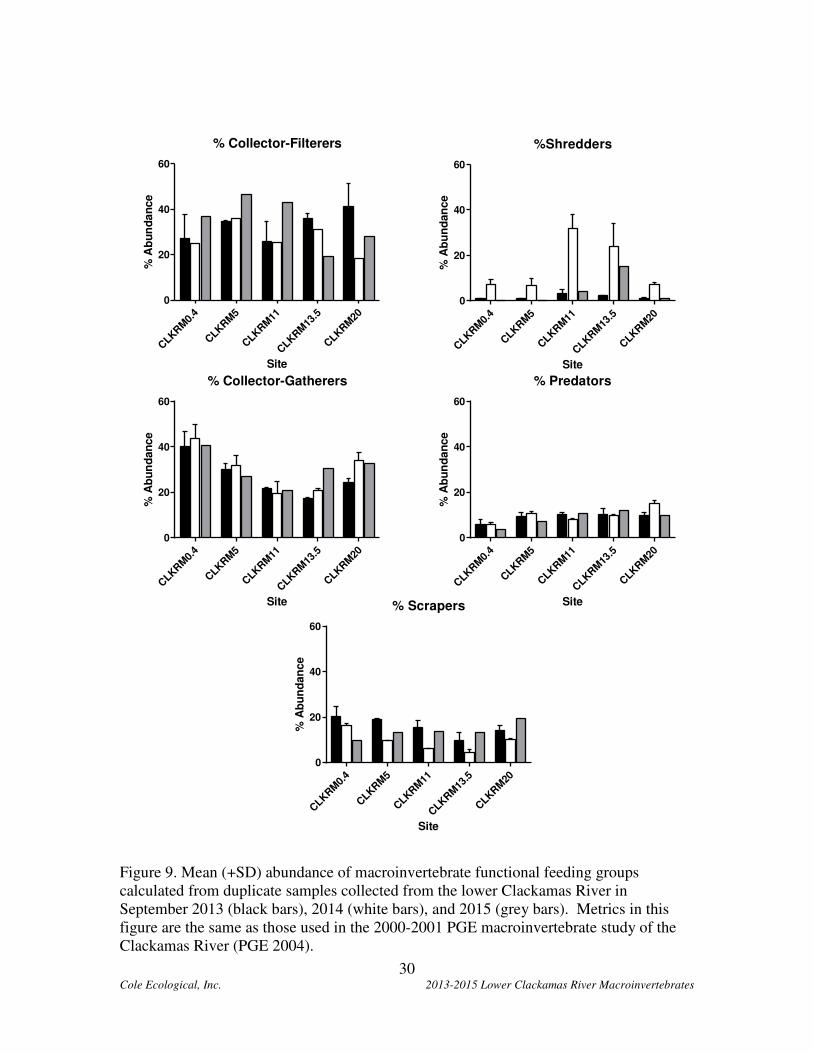
30 Cole Ecological, Inc. 2013-2015 Lower Clackamas River Macroinvertebrates
% Collector-Filterers
CLK
RM
0.4
CLK
RM
5
CLK
RM
11
CLK
RM
13.5
CLK
RM
20
0
20
40
60
Site
% A
bu
nd
an
ce
%Shredders
CLK
RM
0.4
CLK
RM
5
CLK
RM
11
CLK
RM
13.5
CLK
RM
20
0
20
40
60
Site
% A
bu
nd
an
ce
% Collector-Gatherers
CLK
RM
0.4
CLK
RM
5
CLK
RM
11
CLK
RM
13.5
CLK
RM
20
0
20
40
60
Site
% A
bu
nd
an
ce
% Predators
CLK
RM
0.4
CLK
RM
5
CLK
RM
11
CLK
RM
13.5
CLK
RM
20
0
20
40
60
Site
% A
bu
nd
an
ce
% Scrapers
CLK
RM
0.4
CLK
RM
5
CLK
RM
11
CLK
RM
13.5
CLK
RM
20
0
20
40
60
Site
% A
bu
nd
an
ce
Figure 9. Mean (+SD) abundance of macroinvertebrate functional feeding groups
calculated from duplicate samples collected from the lower Clackamas River in
September 2013 (black bars), 2014 (white bars), and 2015 (grey bars). Metrics in this
figure are the same as those used in the 2000-2001 PGE macroinvertebrate study of the
Clackamas River (PGE 2004).
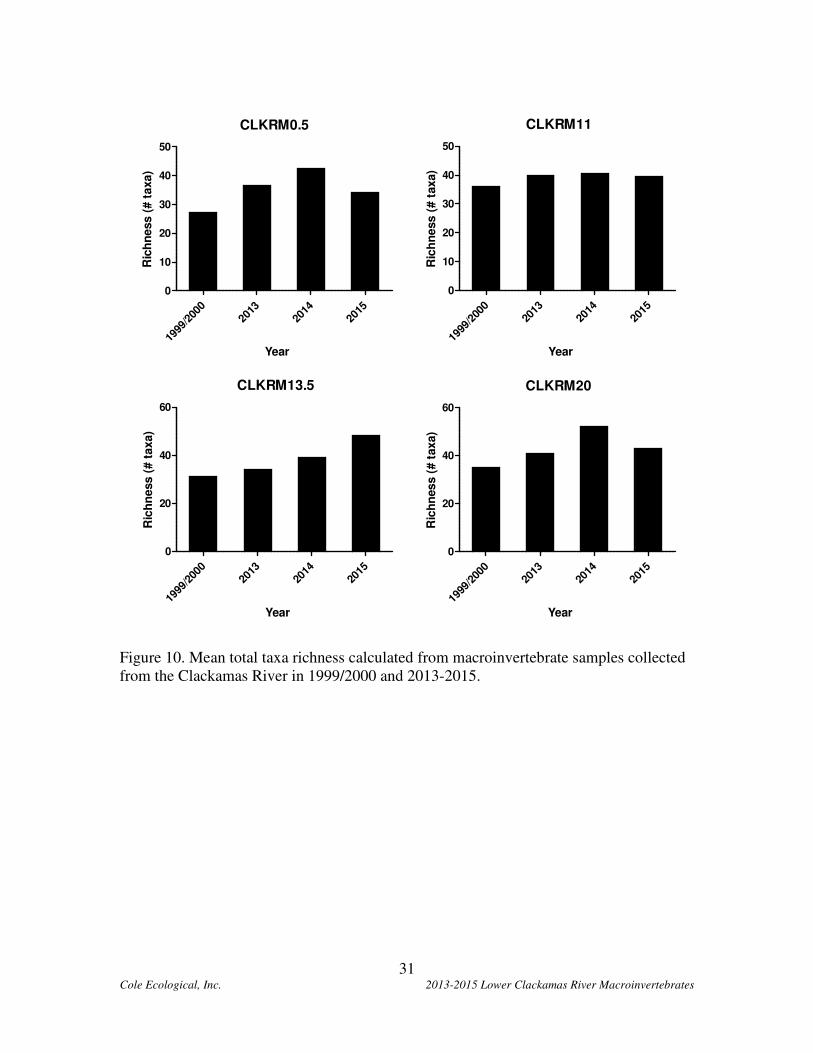
31 Cole Ecological, Inc. 2013-2015 Lower Clackamas River Macroinvertebrates
CLKRM0.5
1999
/200
020
1320
1420
15
0
10
20
30
40
50
Year
Ric
hn
ess (
# t
axa)
CLKRM11
1999
/200
020
1320
1420
15
0
10
20
30
40
50
Year
Ric
hn
ess (
# t
axa)
CLKRM13.5
1999
/200
020
1320
1420
15
0
20
40
60
Year
Ric
hn
ess (
# t
axa)
CLKRM20
1999
/200
020
1320
1420
15
0
20
40
60
Year
Ric
hn
ess (
# t
axa)
Figure 10. Mean total taxa richness calculated from macroinvertebrate samples collected
from the Clackamas River in 1999/2000 and 2013-2015.
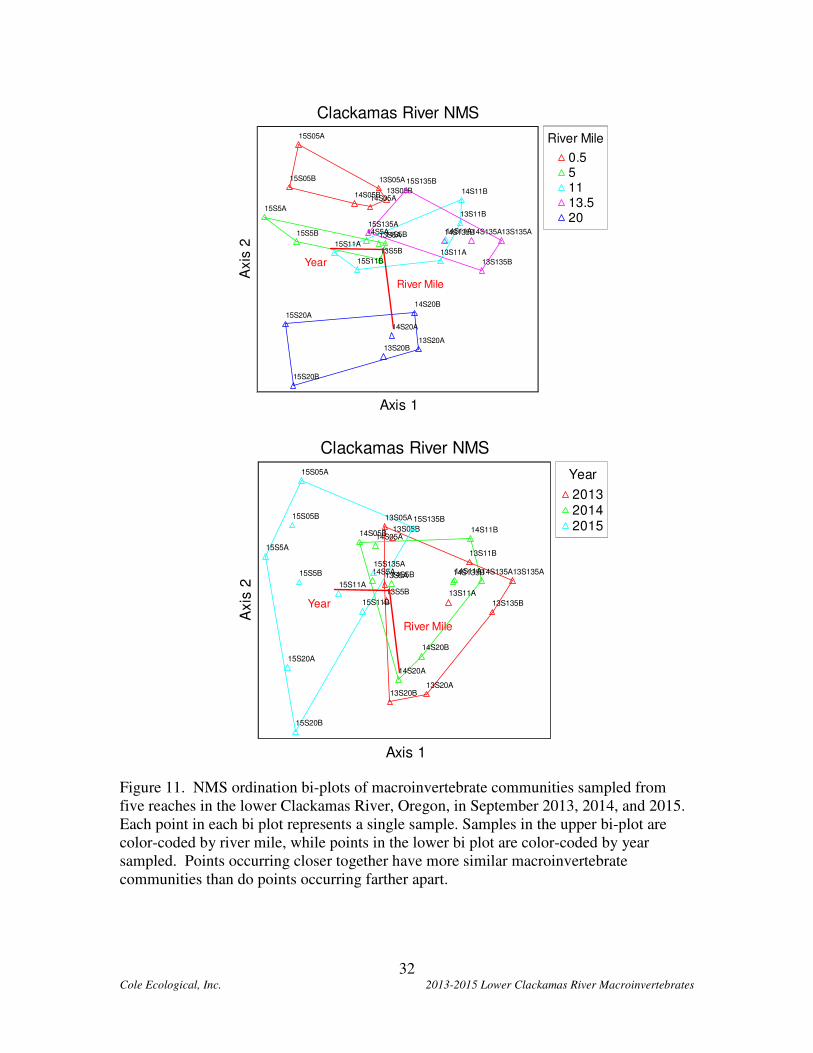
32 Cole Ecological, Inc. 2013-2015 Lower Clackamas River Macroinvertebrates
13S05A
13S05B
13S5A
13S5B 13S11A
13S11B
13S135A
13S135B
13S20A
13S20B
14S05A14S05B
14S5A14S5B14S11A
14S11B
14S135A14S135B
14S20A
14S20B
15S05A
15S05B
15S5A
15S5B
15S11A
15S11B
15S135A
15S135B
15S20A
15S20B
River Mile
Year
Clackamas River NMS
Axis 1
Axis
2
River Mile
0.5
5
11
13.5
20
13S05A
13S05B
13S5A
13S5B 13S11A
13S11B
13S135A
13S135B
13S20A
13S20B
14S05A14S05B
14S5A14S5B14S11A
14S11B
14S135A14S135B
14S20A
14S20B
15S05A
15S05B
15S5A
15S5B
15S11A
15S11B
15S135A
15S135B
15S20A
15S20B
River Mile
Year
Clackamas River NMS
Axis 1
Axis
2
Year
2013
2014
2015
Figure 11. NMS ordination bi-plots of macroinvertebrate communities sampled from
five reaches in the lower Clackamas River, Oregon, in September 2013, 2014, and 2015.
Each point in each bi plot represents a single sample. Samples in the upper bi-plot are
color-coded by river mile, while points in the lower bi plot are color-coded by year
sampled. Points occurring closer together have more similar macroinvertebrate
communities than do points occurring farther apart.
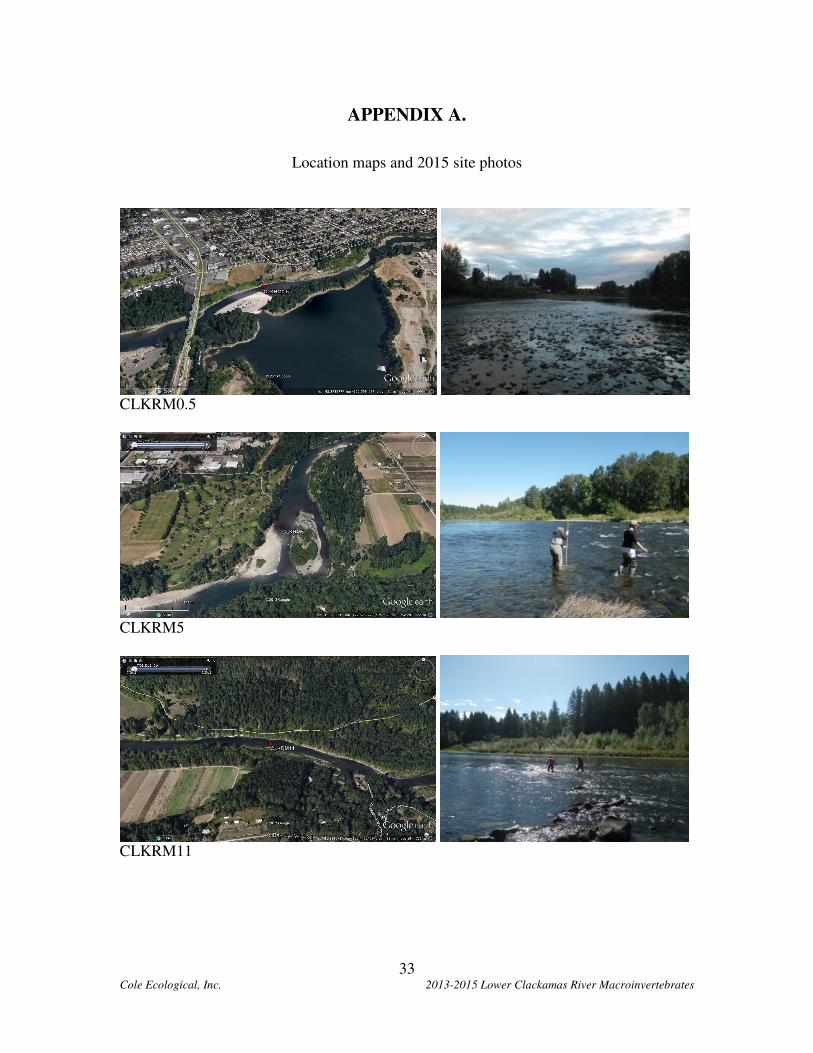
33 Cole Ecological, Inc. 2013-2015 Lower Clackamas River Macroinvertebrates
APPENDIX A.
Location maps and 2015 site photos
CLKRM0.5
CLKRM5
CLKRM11
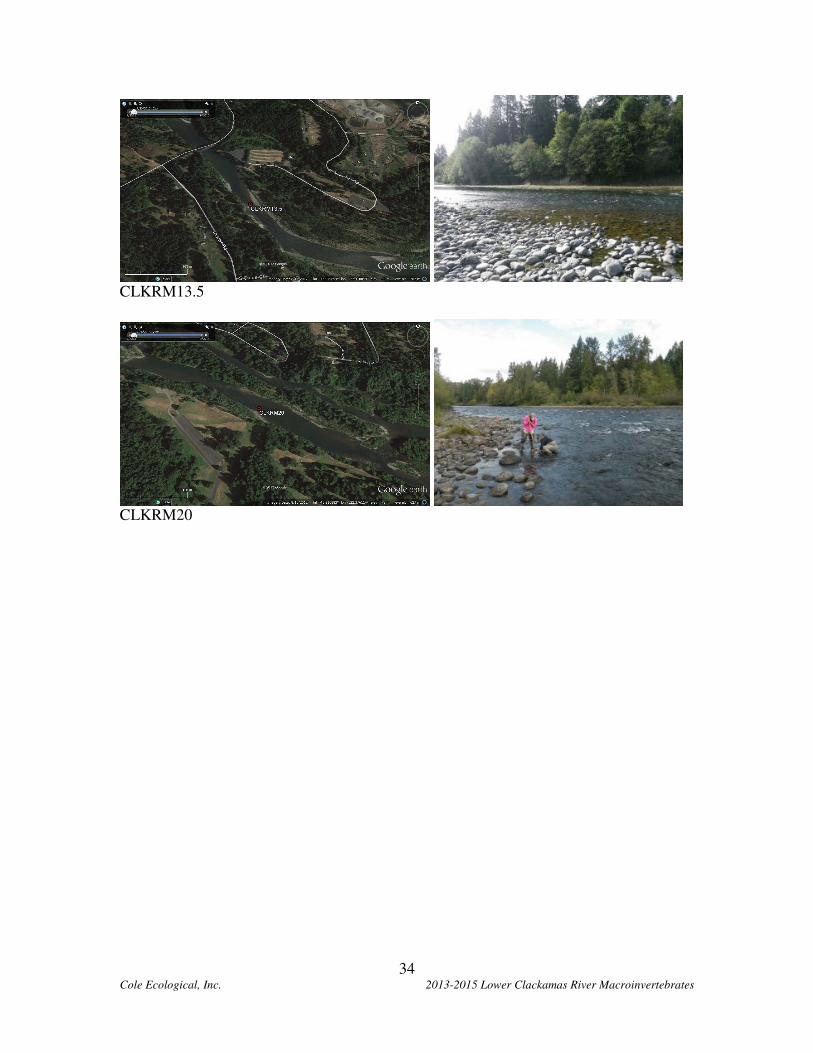
34 Cole Ecological, Inc. 2013-2015 Lower Clackamas River Macroinvertebrates
CLKRM13.5
CLKRM20
![[CLACKAMAS COUNTY ALTERNATE WORK WEEK PILOT PROJECT ... · [CLACKAMAS COUNTY ALTERNATE WORK WEEK PILOT PROJECT ] ... Clackamas County Alternate Work Week Pilot Project Final Report](https://img.pdfslide.us/doc/110x75/5b894f857f8b9a287e8bd8ee/clackamas-county-alternate-work-week-pilot-project-clackamas-county-alternate.jpg)