Embed Size (px)
Citation preview
240 Technical Gazette 28, 1(2021), 240-247
ISSN 1330-3651 (Print), ISSN 1848-6339 (Online) https://doi.org/10.17559/TV-20201106131352 Original scientific paper
Crack Growth Rate Analysis of Stress Corrosion Cracking
Mohamed ALKATEB, Srđan TADIĆ, Aleksandar SEDMAK*, Ivana IVANOVIĆ, Svetislav MARKOVIĆ
Abstract: A theoretical film rupture model was used for computational procedure to predict the crack growth rate within the Stress Corrosion Cracking (SCC) conditions. Chemical, electrochemical and mechanical aspects of the SCC were analyzed and set into the computer program to calculate crack growth rate. Extended Finite Element Model (XFEM) was applied to calculate Stress Intensity Factor (SIF) in two loading modes - tensile test specimen and compact tension (CT) specimen. Elastic-plastic fracture mechanics (EPFM) was used for CT specimen. The computational model was verified with experimental results published in literature. Results have shown good agreement in two cases analysed here, stainless and common structural steel, indicating great potential of the XFEM to simulate the crack growth rate within the SCC conditions. Keywords: film rupture model; finite element method; fracture mechanics; stress intensity factor
1 INTRODUCTION
Stress corrosion cracking is a kind of environmentally assisted failure of engineering materials. Gradual crack propagation and eventual final failure are a result of simultaneous response of chemical reactions and mechanical forces at the crack tip [1]. Historically, the phenomenon was observed in the 19th century as a spontaneous cracking of military brass cartridges during the monsoon periods in India, when it was named "seasonal cracking", the term which was retained until the modern period. Later, it appeared that SCC was a cause of some severe industrial and urban accidents, some of them with serious losses [2]. The SCC is caused by three main factors: 1) material susceptibility to cracking, 2) environmental corrosive conditions, 3) applied tensile stress or just residual stress. If the applied loading is cyclic, "corrosion fatigue" (CF) is considered as a particular case of SCC. In addition, depending on the rate of chemical reactions in the crack tip, "hydrogen induced cracking" (HIC) is also considered as a specific mechanism of the SCC [3].
The SCC mechanisms are classified into anodic and cathodic SCC, the first one governed by anodic metal dissolution at the crack tip, whereas the later one, dominantly occurring in welded joints, is governed by hydrogen diffusion, causing hydrogen embrittlement and/or HIC. However, during corrosion, both anodic and cathodic reactions occur simultaneously and the governing mechanism is determined by the rate of the particular reaction [4].
During the SCC crack growth, three regions can be observed: (1) low K values, when crack propagation rate increases rapidly, (2) intermediate stress-intensity levels, when the crack growth rate approaches almost constant plateau and, finally, (3) when the K value approaches KIc, rapid crack growth and the onset of final failure [5].
Many papers exist, concerning chemical, electro-chemical and mechanical aspects at the crack tip. The most recent in-depth review was published by Bland et al. [6]. There is a large series of papers focused on mechanisms and modeling of the SCC [7-10]. Stress cracking corrosion plays important role in weldments, biomedical applications and in components where electrolytic media exist, [11-14]. Finite element analysis of the SCC can be found in some recent papers [15-18].
This paper presents a brief introduction to slip disso-lution model, (electro)chemical and mechanical aspects of the model, two finite element models for two different geometries (with applied stress and variable displacement as a boundary conditions) and, finally, verifications with experimentally published results for two different mate-rials, stainless steel and mild steel SCC, [19-21]. The model was calculated in Python programming language, while the Code-Aster was used for finite element analysis, [22]. Pre- and post-processing were performed in a Salome-Meca environment, [22]. All of them are open-source, free software, under the Linux OS, successfully used in other applications [23].
2 MODEL
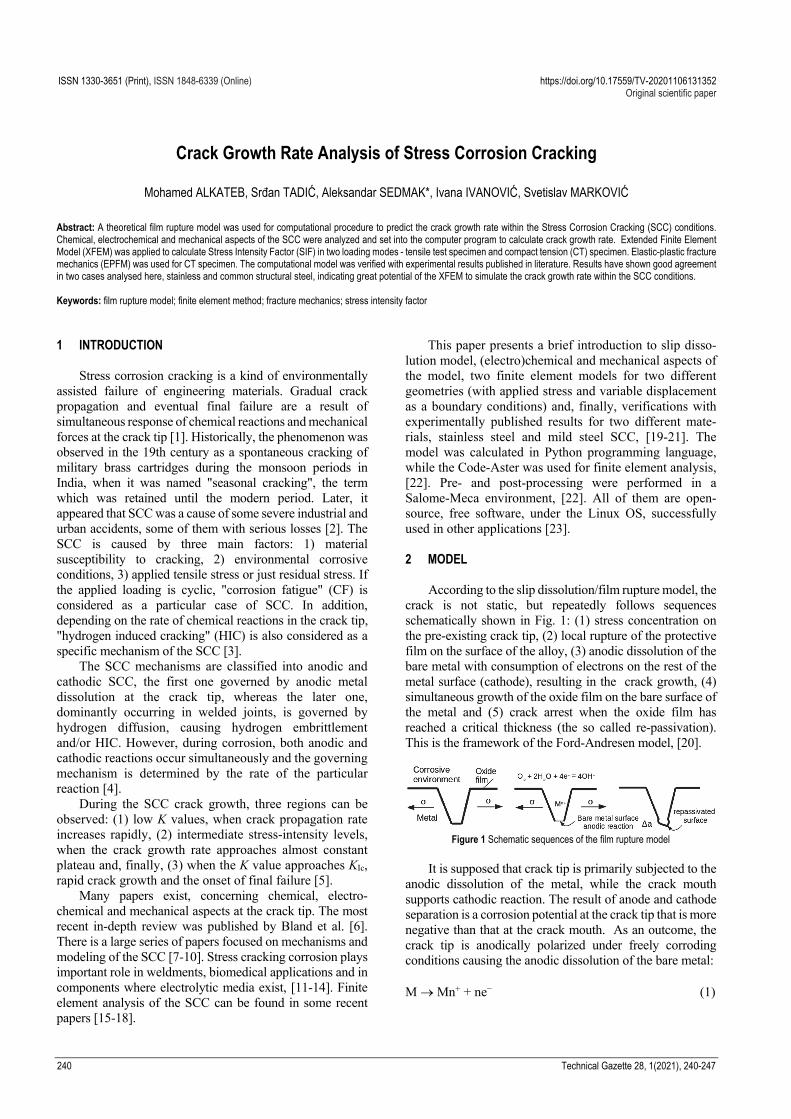
According to the slip dissolution/film rupture model, the crack is not static, but repeatedly follows sequences schematically shown in Fig. 1: (1) stress concentration on the pre-existing crack tip, (2) local rupture of the protective film on the surface of the alloy, (3) anodic dissolution of the bare metal with consumption of electrons on the rest of the metal surface (cathode), resulting in the crack growth, (4) simultaneous growth of the oxide film on the bare surface of the metal and (5) crack arrest when the oxide film has reached a critical thickness (the so called re-passivation). This is the framework of the Ford-Andresen model, [20].
Figure 1 Schematic sequences of the film rupture model
It is supposed that crack tip is primarily subjected to the
anodic dissolution of the metal, while the crack mouth supports cathodic reaction. The result of anode and cathode separation is a corrosion potential at the crack tip that is more negative than that at the crack mouth. As an outcome, the crack tip is anodically polarized under freely corroding conditions causing the anodic dissolution of the bare metal:
M Mn+ + ne− (1)
Mohamed ALKATEB et al.: Crack Growth Rate Analysis of Stress Corrosion Cracking
Tehnički vjesnik 28, 1(2021), 240-247 241
while two possible cathodic reactions may be occurring at the crack mouth: O2 + 2H2O + 4e− 4OH− (2) 2H+ + 2e− H2 (3)
Type of cathodic reaction at the crack mouth may be
crucial for type of the SCC to be operable. It depends on pH value, oxygen supply, chemical conditions on the metal surface, etc. In particular, anodic reaction of the ferrous alloys can be described by: 3Fe + 4H2O Fe3O4 + 8H+ + 8e− (4)
Additionally, in stainless steels with nickel and
chromium as main alloying elements, one gets: Ni + H2O NiO + 2H+ + 2e− (5) 2Cr + 3H2O Cr2O3 + 6H+ + 6e− (6)
On the other side, in diluted aluminum alloys, anodic
dissolution reaction is:
2Al + 6H2O 2Al(OH)3 + 6H+ (7) Ford and Andresen proposed a theoretical model for
SCC crack growth rates considering electrochemical and mechanical aspects at the crack tip, which is simultaneously subjected to corrosive environment and tensile loading. The fundamental mathematical equation for active path corro-sion model is Faraday's law [24].
..
1
.m
c o mcf
f f
da M M i tQdt z F z F m
a
(8)
where M and z are the molar mass and the number of valence electrons, respectively, F is Faraday's constant, Qf is the electric charge passed in time interval between the two successive film rupture events, dotted εc is the strain rate at the crack tip and εf is the rupture ductility of passive film, i is anodic current density immediately after the passive film rupture and m is re-passivation exponent. Variables in Eq. (8) are grouped into materials constants (M, z, ρ, F), electrochemical and mechanical (dotted εc) variables. 3 ELECTRO-CHEMICAL ASPECTS OF THE SCC
The experimental data of anodic current can be repre-
sented by [25]:
corr corra
a
corr corra
rp corrrp
2.3exp
2.3exp
12.3
exp
i E E
i
i E E
i E E
(9)
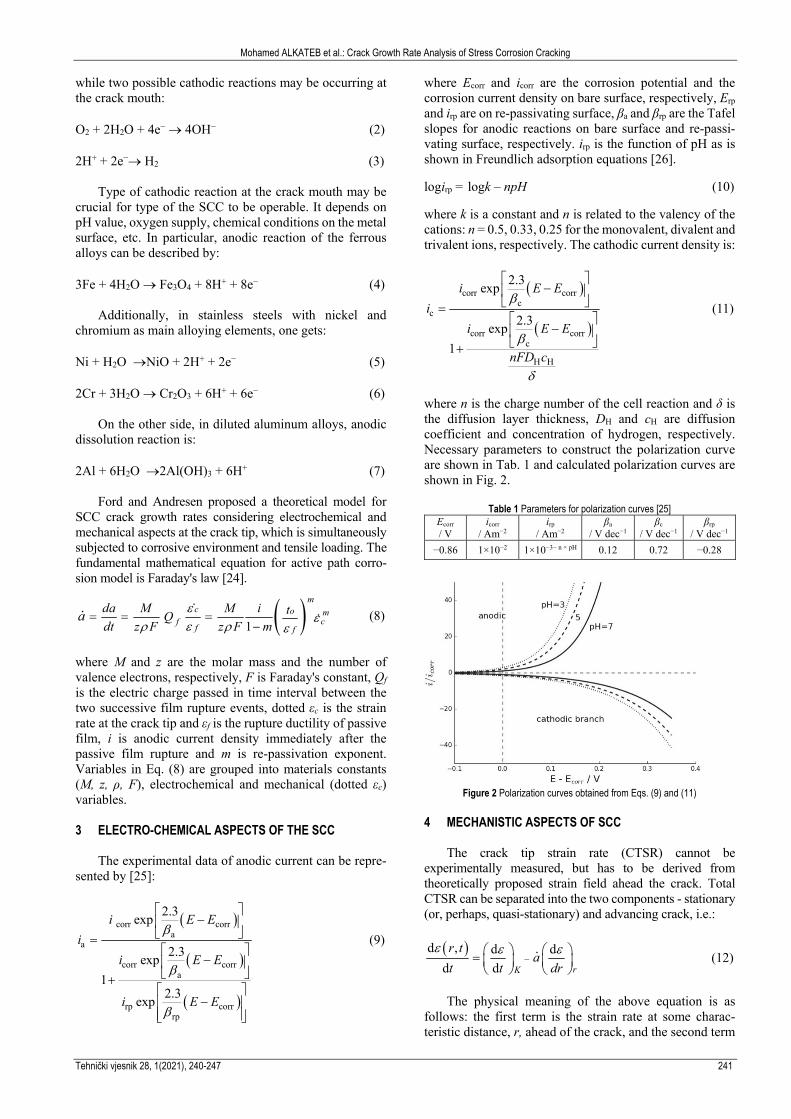
where Ecorr and icorr are the corrosion potential and the corrosion current density on bare surface, respectively, Erp and irp are on re-passivating surface, βa and βrp are the Tafel slopes for anodic reactions on bare surface and re-passi-vating surface, respectively. irp is the function of pH as is shown in Freundlich adsorption equations [26].
logirp = logk – npH (10)
where k is a constant and n is related to the valency of the cations: n = 0.5, 0.33, 0.25 for the monovalent, divalent and trivalent ions, respectively. The cathodic current density is:
corr corrc
c
corr corrc
H H
2.3exp
2.3exp
1
i E E
i
i E E
nFD c
(11)
where n is the charge number of the cell reaction and δ is the diffusion layer thickness, DH and cH are diffusion coefficient and concentration of hydrogen, respectively. Necessary parameters to construct the polarization curve are shown in Tab. 1 and calculated polarization curves are shown in Fig. 2.
Table 1 Parameters for polarization curves [25] Ecorr / V
icorr / Am−2
irp
/ Am−2 βa
/ V dec−1 βc
/ V dec−1 βrp
/ V dec−1
−0.86 1×10⁻² 1×10⁻³− n × pH 0.12 0.72 −0.28
Figure 2 Polarization curves obtained from Eqs. (9) and (11)
4 MECHANISTIC ASPECTS OF SCC
The crack tip strain rate (CTSR) cannot be
experimentally measured, but has to be derived from theoretically proposed strain field ahead the crack. Total CTSR can be separated into the two components - stationary (or, perhaps, quasi-stationary) and advancing crack, i.e.:
d , .d d
d d rK
r ta
t t dr
(12)
The physical meaning of the above equation is as
follows: the first term is the strain rate at some charac-teristic distance, r, ahead of the crack, and the second term
Mohamed ALKATEB et al.: Crack Growth Rate Analysis of Stress Corrosion Cracking
242 Technical Gazette 28, 1(2021), 240-247
is the strain rate generated due to crack advances with the rate da/dt through the strain field.
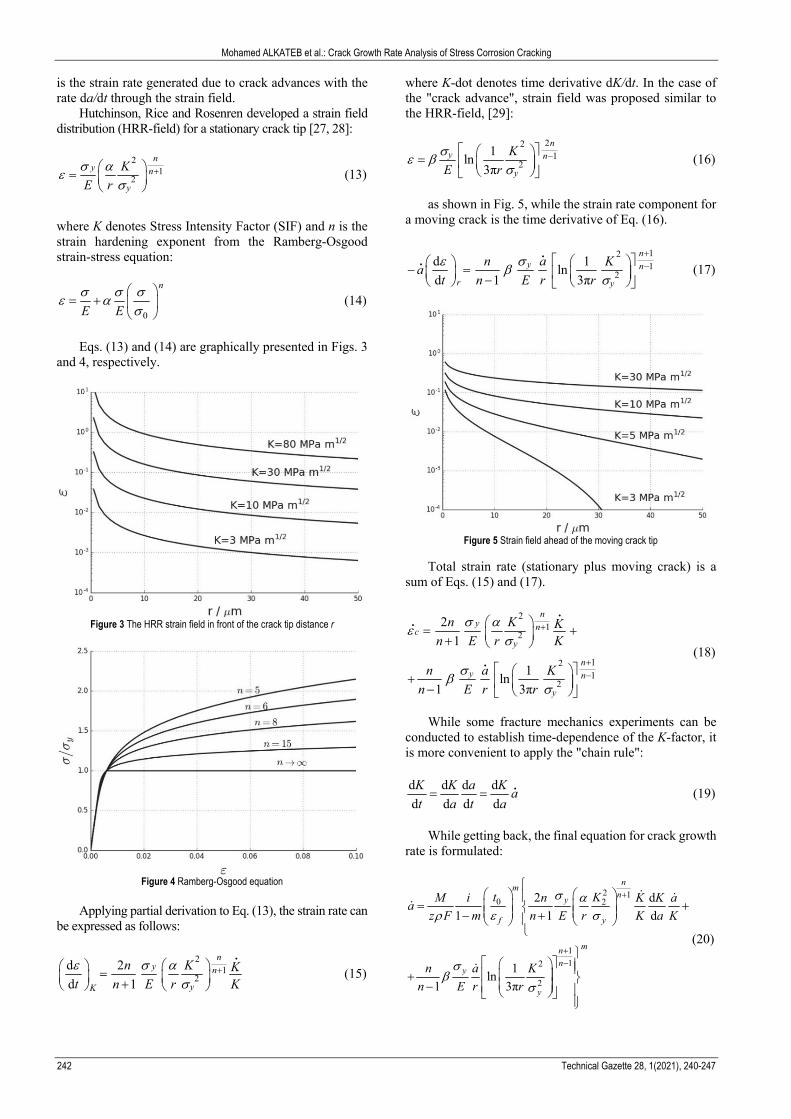
Hutchinson, Rice and Rosenren developed a strain field distribution (HRR-field) for a stationary crack tip [27, 28]:
2
12
ny n
y
K
E r
(13)
where K denotes Stress Intensity Factor (SIF) and n is the strain hardening exponent from the Ramberg-Osgood strain-stress equation:
0
n
E E
(14)
Eqs. (13) and (14) are graphically presented in Figs. 3
and 4, respectively.
Figure 3 The HRR strain field in front of the crack tip distance r
Figure 4 Ramberg-Osgood equation
Applying partial derivation to Eq. (13), the strain rate can
be expressed as follows:
21
2d 2
d 1
ny n
yK
n K Kt n E r K
(15)
where K-dot denotes time derivative dK/dt. In the case of the "crack advance", strain field was proposed similar to the HRR-field, [29]:
221
21
ln3π
ny n
y
K
E r
(16)
as shown in Fig. 5, while the strain rate component for
a moving crack is the time derivative of Eq. (16).
121
2d 1
lnd 1 3π
ny n
r y
n a Ka
t n E r r
(17)
Figure 5 Strain field ahead of the moving crack tip
Total strain rate (stationary plus moving crack) is a
sum of Eqs. (15) and (17).
21
2
121
2
2
1
1ln
1 3π
ny nc
y
ny n
y
n K Kn E r K
n a K
n E r r
(18)
While some fracture mechanics experiments can be
conducted to establish time-dependence of the K-factor, it is more convenient to apply the "chain rule": d d d d
d d d d
K K a Ka
t a t a (19)
While getting back, the final equation for crack growth
rate is formulated:
2 10 2
1
12
2
2 d
1 1 d
1ln
1 3π
nm
ny
f y
mn
ny
y
t KM i n K K aa
z F m n E r K a K
n a K
n E r r
(20)
Mohamed ALKATEB et al.: Crack Growth Rate Analysis of Stress Corrosion Cracking
Tehnički vjesnik 28, 1(2021), 240-247 243
Both sides of Eq. (20) include the first derivative of crack length, a, over time, t (a-dot). Anyhow, Eq. (20) can be easily solved either in analytical or in finite element formulation. Parameters used in this work are shown in Tab. 2.
The characteristic distance r was calculated from the plastic zone size ahead of the crack [30]:
2
2
2
2
0.305
1.16
y
y
y
y
K
arK
(21)
where λ is a parameter defined in [30].
Table 2 Parameters used in calculation
MFe / kg/mol atomic mass of iron 55.8×10⁻³ MAl / kg/mol atomic mass of aluminium 26.9×10⁻³ F / C/mol Faraday's constant 96485 z Number of exchanged electrons 2 ρ / kg/m3 Density 7.8×10 t0 / sec Incubation period of re-passivation 1×10⁻²
εf Fracture ductility of passive film 1×10⁻³
m Exponent of re-passivation kinetics 2/3 σy / MPa Yield strength 450 E / GPa Young modulus 200 β Rice parameter 5.08 n Ramberg-Osgood exponent 6-10 Α Material constant in HRR-field 0.2×10⁻²
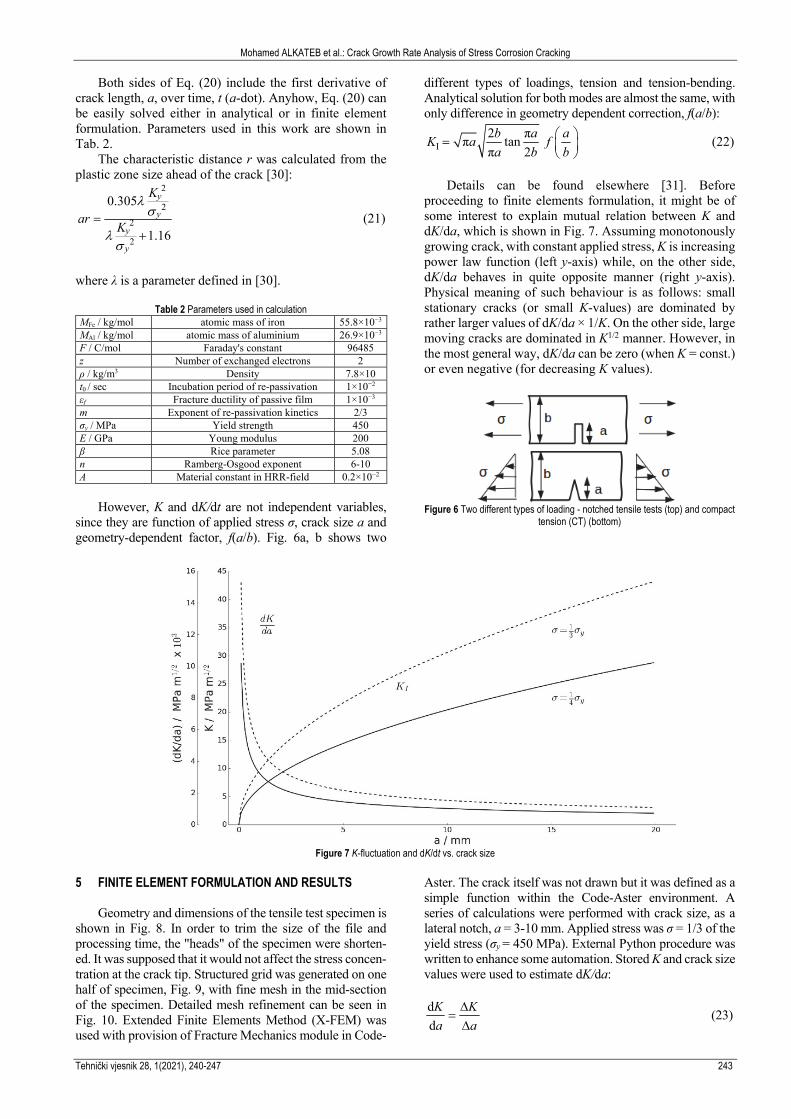
However, K and dK/dt are not independent variables,
since they are function of applied stress σ, crack size a and geometry-dependent factor, f(a/b). Fig. 6a, b shows two
different types of loadings, tension and tension-bending. Analytical solution for both modes are almost the same, with only difference in geometry dependent correction, f(a/b):
I2 π
π tanπ 2
b a aK a f
a b b
(22)
Details can be found elsewhere [31]. Before
proceeding to finite elements formulation, it might be of some interest to explain mutual relation between K and dK/da, which is shown in Fig. 7. Assuming monotonously growing crack, with constant applied stress, K is increasing power law function (left y-axis) while, on the other side, dK/da behaves in quite opposite manner (right y-axis). Physical meaning of such behaviour is as follows: small stationary cracks (or small K-values) are dominated by rather larger values of dK/da × 1/K. On the other side, large moving cracks are dominated in K1/2 manner. However, in the most general way, dK/da can be zero (when K = const.) or even negative (for decreasing K values).
Figure 6 Two different types of loading - notched tensile tests (top) and compact
tension (CT) (bottom)
Figure 7 K-fluctuation and dK/dt vs. crack size
5 FINITE ELEMENT FORMULATION AND RESULTS
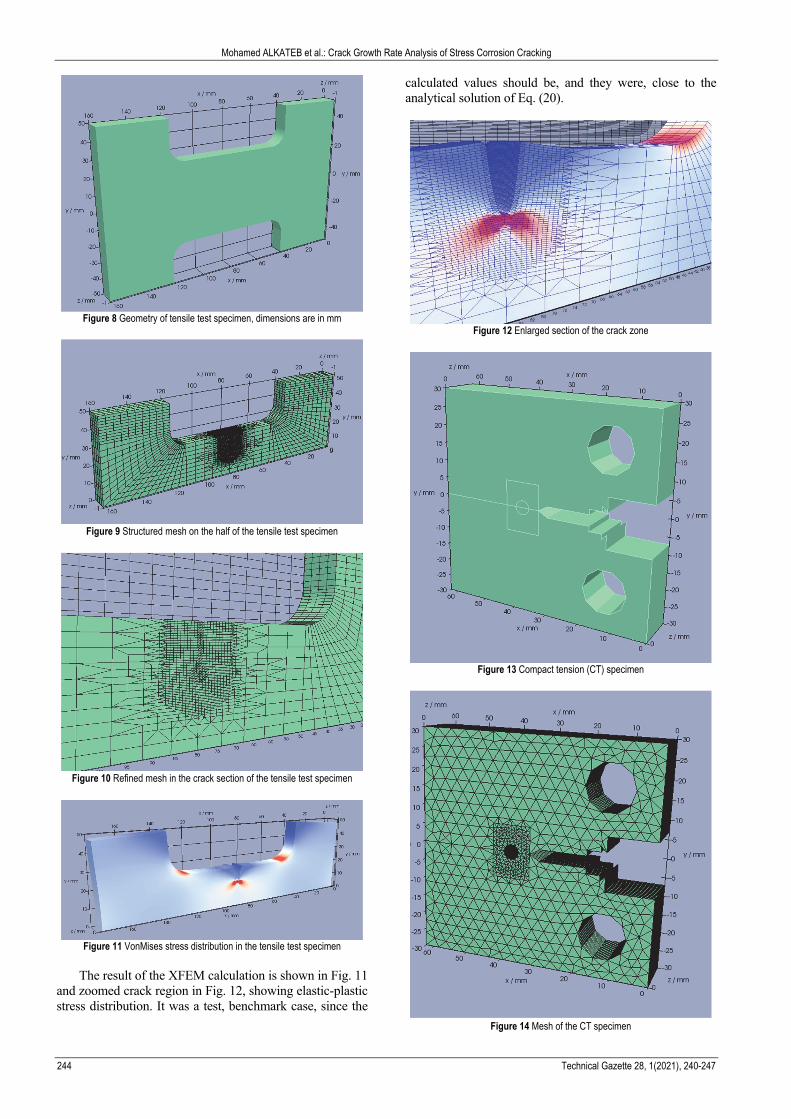
Geometry and dimensions of the tensile test specimen is
shown in Fig. 8. In order to trim the size of the file and processing time, the "heads" of the specimen were shorten-ed. It was supposed that it would not affect the stress concen-tration at the crack tip. Structured grid was generated on one half of specimen, Fig. 9, with fine mesh in the mid-section of the specimen. Detailed mesh refinement can be seen in Fig. 10. Extended Finite Elements Method (X-FEM) was used with provision of Fracture Mechanics module in Code-
Aster. The crack itself was not drawn but it was defined as a simple function within the Code-Aster environment. A series of calculations were performed with crack size, as a lateral notch, a = 3-10 mm. Applied stress was σ = 1/3 of the yield stress (σy = 450 MPa). External Python procedure was written to enhance some automation. Stored K and crack size values were used to estimate dK/da: d
d
K K
a a
(23)
Mohamed ALKATEB et al.: Crack Growth Rate Analysis of Stress Corrosion Cracking
244 Technical Gazette 28, 1(2021), 240-247
Figure 8 Geometry of tensile test specimen, dimensions are in mm
Figure 9 Structured mesh on the half of the tensile test specimen
Figure 10 Refined mesh in the crack section of the tensile test specimen
Figure 11 VonMises stress distribution in the tensile test specimen
The result of the XFEM calculation is shown in Fig. 11
and zoomed crack region in Fig. 12, showing elastic-plastic stress distribution. It was a test, benchmark case, since the
calculated values should be, and they were, close to the analytical solution of Eq. (20).
Figure 12 Enlarged section of the crack zone
Figure 13 Compact tension (CT) specimen
Figure 14 Mesh of the CT specimen
Mohamed ALKATEB et al.: Crack Growth Rate Analysis of Stress Corrosion Cracking
Tehnički vjesnik 28, 1(2021), 240-247 245
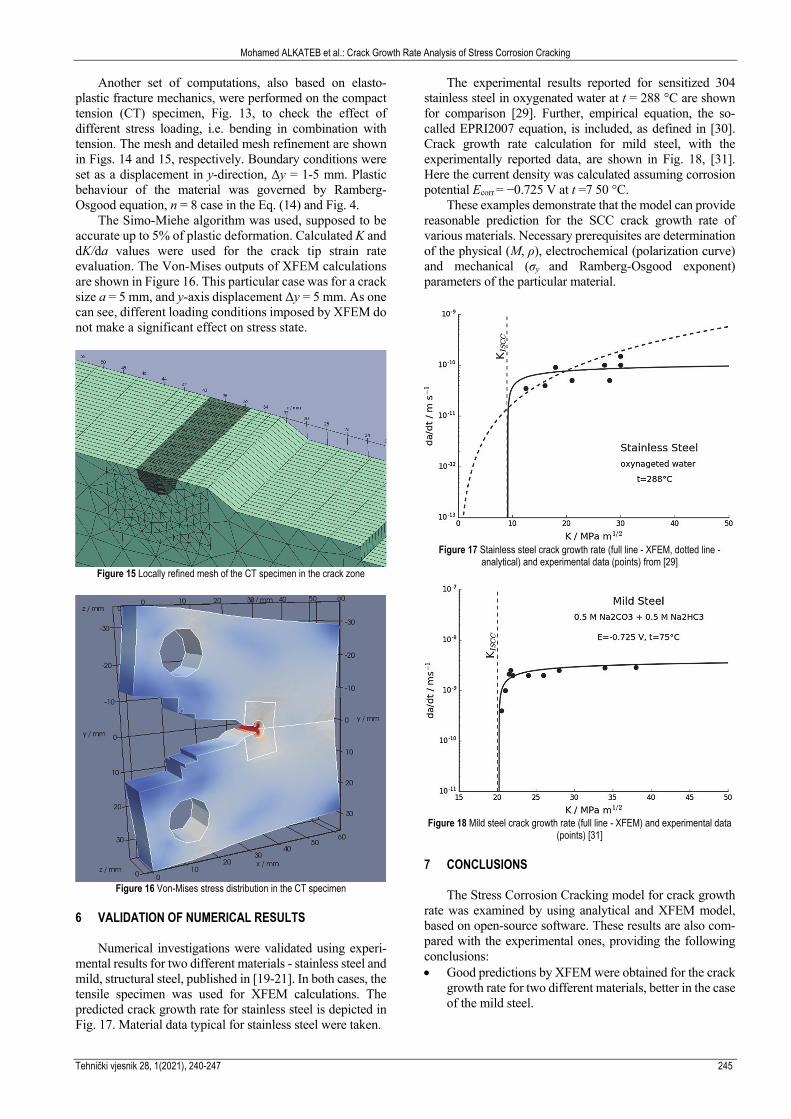
Another set of computations, also based on elasto-plastic fracture mechanics, were performed on the compact tension (CT) specimen, Fig. 13, to check the effect of different stress loading, i.e. bending in combination with tension. The mesh and detailed mesh refinement are shown in Figs. 14 and 15, respectively. Boundary conditions were set as a displacement in y-direction, Δy = 1-5 mm. Plastic behaviour of the material was governed by Ramberg-Osgood equation, n = 8 case in the Eq. (14) and Fig. 4.
The Simo-Miehe algorithm was used, supposed to be accurate up to 5% of plastic deformation. Calculated K and dK/da values were used for the crack tip strain rate evaluation. The Von-Mises outputs of XFEM calculations are shown in Figure 16. This particular case was for a crack size a = 5 mm, and y-axis displacement Δy = 5 mm. As one can see, different loading conditions imposed by XFEM do not make a significant effect on stress state.
Figure 15 Locally refined mesh of the CT specimen in the crack zone
Figure 16 Von-Mises stress distribution in the CT specimen
6 VALIDATION OF NUMERICAL RESULTS
Numerical investigations were validated using experi-
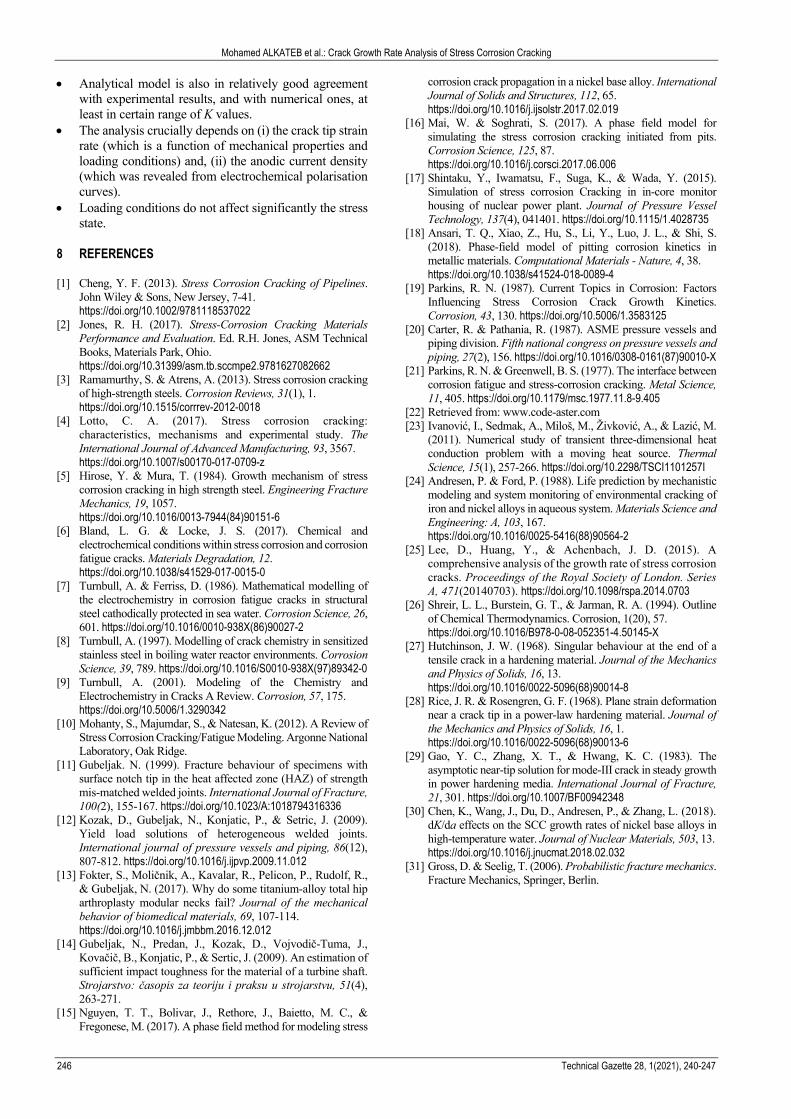
mental results for two different materials - stainless steel and mild, structural steel, published in [19-21]. In both cases, the tensile specimen was used for XFEM calculations. The predicted crack growth rate for stainless steel is depicted in Fig. 17. Material data typical for stainless steel were taken.
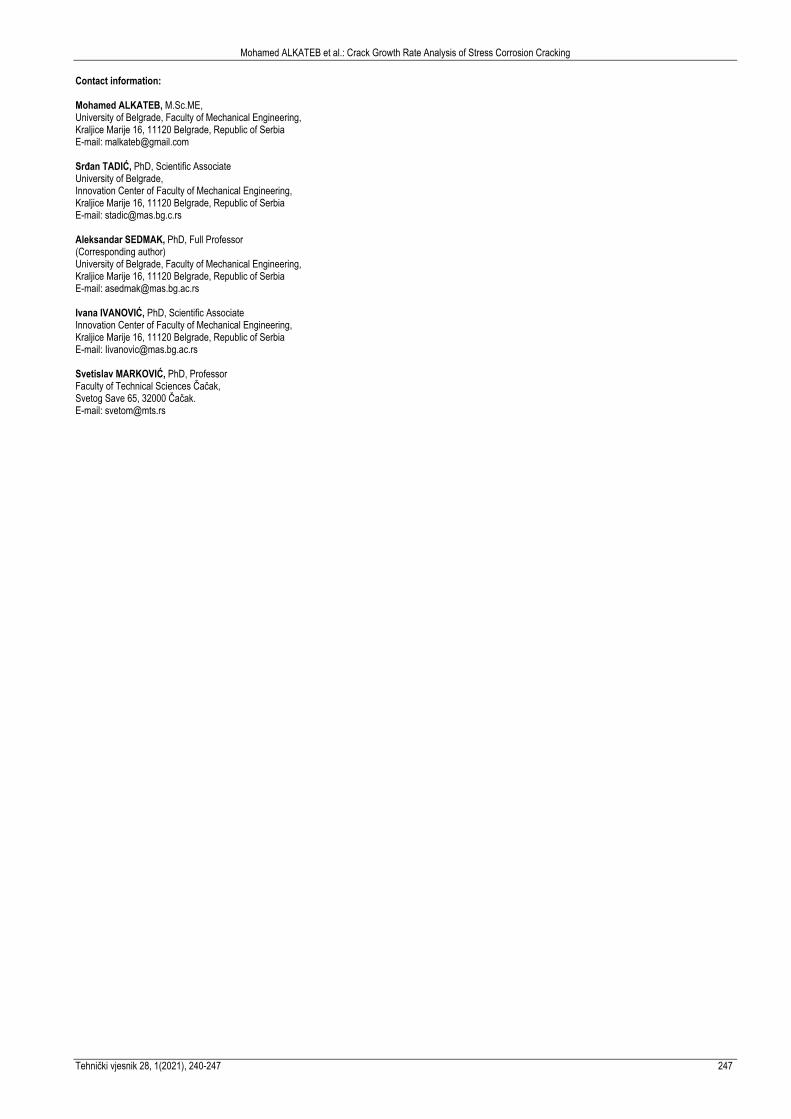
The experimental results reported for sensitized 304 stainless steel in oxygenated water at t = 288 °C are shown for comparison [29]. Further, empirical equation, the so-called EPRI2007 equation, is included, as defined in [30]. Crack growth rate calculation for mild steel, with the experimentally reported data, are shown in Fig. 18, [31]. Here the current density was calculated assuming corrosion potential Ecorr = −0.725 V at t =7 50 °C.
These examples demonstrate that the model can provide reasonable prediction for the SCC crack growth rate of various materials. Necessary prerequisites are determination of the physical (M, ρ), electrochemical (polarization curve) and mechanical (σy and Ramberg-Osgood exponent) parameters of the particular material.
Figure 17 Stainless steel crack growth rate (full line - XFEM, dotted line -
analytical) and experimental data (points) from [29]
Figure 18 Mild steel crack growth rate (full line - XFEM) and experimental data
(points) [31]
7 CONCLUSIONS
The Stress Corrosion Cracking model for crack growth rate was examined by using analytical and XFEM model, based on open-source software. These results are also com-pared with the experimental ones, providing the following conclusions: Good predictions by XFEM were obtained for the crack
growth rate for two different materials, better in the case of the mild steel.
Mohamed ALKATEB et al.: Crack Growth Rate Analysis of Stress Corrosion Cracking
246 Technical Gazette 28, 1(2021), 240-247
Analytical model is also in relatively good agreement with experimental results, and with numerical ones, at least in certain range of K values.
The analysis crucially depends on (i) the crack tip strain rate (which is a function of mechanical properties and loading conditions) and, (ii) the anodic current density (which was revealed from electrochemical polarisation curves).
Loading conditions do not affect significantly the stress state.
8 REFERENCES [1] Cheng, Y. F. (2013). Stress Corrosion Cracking of Pipelines.
John Wiley & Sons, New Jersey, 7-41. https://doi.org/10.1002/9781118537022 [2] Jones, R. H. (2017). Stress-Corrosion Cracking Materials
Performance and Evaluation. Ed. R.H. Jones, ASM Technical Books, Materials Park, Ohio.
https://doi.org/10.31399/asm.tb.sccmpe2.9781627082662 [3] Ramamurthy, S. & Atrens, A. (2013). Stress corrosion cracking
of high-strength steels. Corrosion Reviews, 31(1), 1. https://doi.org/10.1515/corrrev-2012-0018 [4] Lotto, C. A. (2017). Stress corrosion cracking:
characteristics, mechanisms and experimental study. The International Journal of Advanced Manufacturing, 93, 3567.
https://doi.org/10.1007/s00170-017-0709-z [5] Hirose, Y. & Mura, T. (1984). Growth mechanism of stress
corrosion cracking in high strength steel. Engineering Fracture Mechanics, 19, 1057.
https://doi.org/10.1016/0013-7944(84)90151-6 [6] Bland, L. G. & Locke, J. S. (2017). Chemical and
electrochemical conditions within stress corrosion and corrosion fatigue cracks. Materials Degradation, 12.
https://doi.org/10.1038/s41529-017-0015-0 [7] Turnbull, A. & Ferriss, D. (1986). Mathematical modelling of
the electrochemistry in corrosion fatigue cracks in structural steel cathodically protected in sea water. Corrosion Science, 26, 601. https://doi.org/10.1016/0010-938X(86)90027-2
[8] Turnbull, A. (1997). Modelling of crack chemistry in sensitized stainless steel in boiling water reactor environments. Corrosion Science, 39, 789. https://doi.org/10.1016/S0010-938X(97)89342-0
[9] Turnbull, A. (2001). Modeling of the Chemistry and Electrochemistry in Cracks A Review. Corrosion, 57, 175.
https://doi.org/10.5006/1.3290342 [10] Mohanty, S., Majumdar, S., & Natesan, K. (2012). A Review of
Stress Corrosion Cracking/Fatigue Modeling. Argonne National Laboratory, Oak Ridge.
[11] Gubeljak. N. (1999). Fracture behaviour of specimens with surface notch tip in the heat affected zone (HAZ) of strength mis-matched welded joints. International Journal of Fracture, 100(2), 155-167. https://doi.org/10.1023/A:1018794316336
[12] Kozak, D., Gubeljak, N., Konjatic, P., & Setric, J. (2009). Yield load solutions of heterogeneous welded joints. International journal of pressure vessels and piping, 86(12), 807-812. https://doi.org/10.1016/j.ijpvp.2009.11.012
[13] Fokter, S., Moličnik, A., Kavalar, R., Pelicon, P., Rudolf, R., & Gubeljak, N. (2017). Why do some titanium-alloy total hip arthroplasty modular necks fail? Journal of the mechanical behavior of biomedical materials, 69, 107-114.
https://doi.org/10.1016/j.jmbbm.2016.12.012 [14] Gubeljak, N., Predan, J., Kozak, D., Vojvodič-Tuma, J.,
Kovačič, B., Konjatic, P., & Sertic, J. (2009). An estimation of sufficient impact toughness for the material of a turbine shaft. Strojarstvo: časopis za teoriju i praksu u strojarstvu, 51(4), 263-271.
[15] Nguyen, T. T., Bolivar, J., Rethore, J., Baietto, M. C., & Fregonese, M. (2017). A phase field method for modeling stress
corrosion crack propagation in a nickel base alloy. International Journal of Solids and Structures, 112, 65.
https://doi.org/10.1016/j.ijsolstr.2017.02.019 [16] Mai, W. & Soghrati, S. (2017). A phase field model for
simulating the stress corrosion cracking initiated from pits. Corrosion Science, 125, 87.
https://doi.org/10.1016/j.corsci.2017.06.006 [17] Shintaku, Y., Iwamatsu, F., Suga, K., & Wada, Y. (2015).
Simulation of stress corrosion Cracking in in-core monitor housing of nuclear power plant. Journal of Pressure Vessel Technology, 137(4), 041401. https://doi.org/10.1115/1.4028735
[18] Ansari, T. Q., Xiao, Z., Hu, S., Li, Y., Luo, J. L., & Shi, S. (2018). Phase-field model of pitting corrosion kinetics in metallic materials. Computational Materials - Nature, 4, 38.
https://doi.org/10.1038/s41524-018-0089-4 [19] Parkins, R. N. (1987). Current Topics in Corrosion: Factors
Influencing Stress Corrosion Crack Growth Kinetics. Corrosion, 43, 130. https://doi.org/10.5006/1.3583125
[20] Carter, R. & Pathania, R. (1987). ASME pressure vessels and piping division. Fifth national congress on pressure vessels and piping, 27(2), 156. https://doi.org/10.1016/0308-0161(87)90010-X
[21] Parkins, R. N. & Greenwell, B. S. (1977). The interface between corrosion fatigue and stress-corrosion cracking. Metal Science, 11, 405. https://doi.org/10.1179/msc.1977.11.8-9.405
[22] Retrieved from: www.code-aster.com [23] Ivanović, I., Sedmak, A., Miloš, M., Živković, A., & Lazić, M.
(2011). Numerical study of transient three-dimensional heat conduction problem with a moving heat source. Thermal Science, 15(1), 257-266. https://doi.org/10.2298/TSCI1101257I
[24] Andresen, P. & Ford, P. (1988). Life prediction by mechanistic modeling and system monitoring of environmental cracking of iron and nickel alloys in aqueous system. Materials Science and Engineering: A, 103, 167.
https://doi.org/10.1016/0025-5416(88)90564-2 [25] Lee, D., Huang, Y., & Achenbach, J. D. (2015). A
comprehensive analysis of the growth rate of stress corrosion cracks. Proceedings of the Royal Society of London. Series A, 471(20140703). https://doi.org/10.1098/rspa.2014.0703
[26] Shreir, L. L., Burstein, G. T., & Jarman, R. A. (1994). Outline of Chemical Thermodynamics. Corrosion, 1(20), 57.
https://doi.org/10.1016/B978-0-08-052351-4.50145-X [27] Hutchinson, J. W. (1968). Singular behaviour at the end of a
tensile crack in a hardening material. Journal of the Mechanics and Physics of Solids, 16, 13.
https://doi.org/10.1016/0022-5096(68)90014-8 [28] Rice, J. R. & Rosengren, G. F. (1968). Plane strain deformation
near a crack tip in a power-law hardening material. Journal of the Mechanics and Physics of Solids, 16, 1.
https://doi.org/10.1016/0022-5096(68)90013-6 [29] Gao, Y. C., Zhang, X. T., & Hwang, K. C. (1983). The
asymptotic near-tip solution for mode-III crack in steady growth in power hardening media. International Journal of Fracture, 21, 301. https://doi.org/10.1007/BF00942348
[30] Chen, K., Wang, J., Du, D., Andresen, P., & Zhang, L. (2018). dK/da effects on the SCC growth rates of nickel base alloys in high-temperature water. Journal of Nuclear Materials, 503, 13.
https://doi.org/10.1016/j.jnucmat.2018.02.032 [31] Gross, D. & Seelig, T. (2006). Probabilistic fracture mechanics.
Fracture Mechanics, Springer, Berlin.
Mohamed ALKATEB et al.: Crack Growth Rate Analysis of Stress Corrosion Cracking
Tehnički vjesnik 28, 1(2021), 240-247 247
Contact information: Mohamed ALKATEB, M.Sc.ME, University of Belgrade, Faculty of Mechanical Engineering, Kraljice Marije 16, 11120 Belgrade, Republic of Serbia E-mail: [email protected] Srđan TADIĆ, PhD, Scientific Associate University of Belgrade, Innovation Center of Faculty of Mechanical Engineering, Kraljice Marije 16, 11120 Belgrade, Republic of Serbia E-mail: [email protected] Aleksandar SEDMAK, PhD, Full Professor (Corresponding author) University of Belgrade, Faculty of Mechanical Engineering, Kraljice Marije 16, 11120 Belgrade, Republic of Serbia E-mail: [email protected] Ivana IVANOVIĆ, PhD, Scientific Associate Innovation Center of Faculty of Mechanical Engineering, Kraljice Marije 16, 11120 Belgrade, Republic of Serbia E-mail: [email protected] Svetislav MARKOVIĆ, PhD, Professor Faculty of Technical Sciences Čačak, Svetog Save 65, 32000 Čačak. E-mail: [email protected]