Embed Size (px)
DESCRIPTION
The CALIFORNIA ASSOCATION OF REALTORS® reported that California home sales ease in September as market transitions into off-season.
Citation preview

CALIFORNIAHOUSING MARKETUPDATE
Monthly Sales and Price Statistics
September 2015
SALES OF EXISTING DETACHED HOMES
California, Sep 2015 Sales: 425,030 Units, +7.3%YTD, +6.9%YTY
-
100,000
200,000
300,000
400,000
500,000
600,000
700,000
Jan
-05
Jul-
05
Jan
-06
Jul-
06
Jan
-07
Jul-
07
Jan
-08
Jul-
08
Jan
-09
Jul-
09
Jan
-10
Jul-
10
Jan
-11
Jul-
11
Jan
-12
Jul-
12
Jan
-13
Jul-
13
Jan
-14
Jul-
14
Jan
-15
Jul-
15
*Sales are seasonally adjusted and annualizedSERIES: Sales of Existing Single Family HomesSOURCE: CALIFORNIA ASSOCIATION OF REALTORS®
Sep-15:425,030
Sep-14:397,490
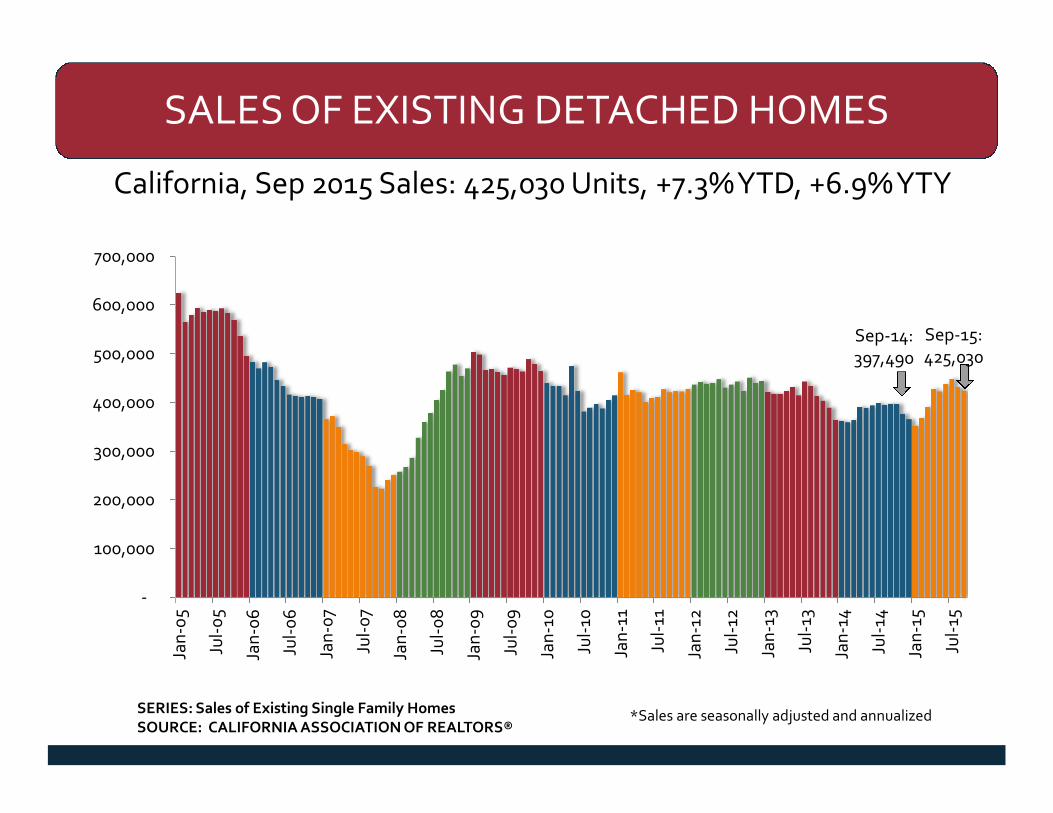
CALIFORNIA SALES
SERIES: Sales of Existing Single Family Homes, Seasonally AdjustedSOURCE: CALIFORNIA ASSOCIATION OF REALTORS®
-25%
-20%
-15%
-10%
-5%
0%
5%
10%
15%
Jan
-10
Ap
r-10
Jul-
10
Oct
-10
Jan
-11
Ap
r-11
Jul-
11
Oct
-11
Jan
-12
Ap
r-12
Jul-
12
Oct
-12
Jan
-13
Ap
r-13
Jul-
13
Oct
-13
Jan
-14
Ap
r-14
Jul-
14
Oct
-14
Jan
-15
Ap
r-15
Jul-
15
Year-over-Year % Chg 6 per. Mov. Avg. (Year-over-Year % Chg)
First sign of levelingoff since early 2014

CHANGE IN SALES BY PRICE RANGE
(Year-to-Year)
-11.4%
9.3% 9.0%
16.5%
13.9%17.2%
13.3%10.7%
-15%
-10%
-5%
0%
5%
10%
15%
20%
Sep-15
SERIES: Sales of Existing Detached HomesSOURCE: CALIFORNIA ASSOCIATION OF REALTORS®
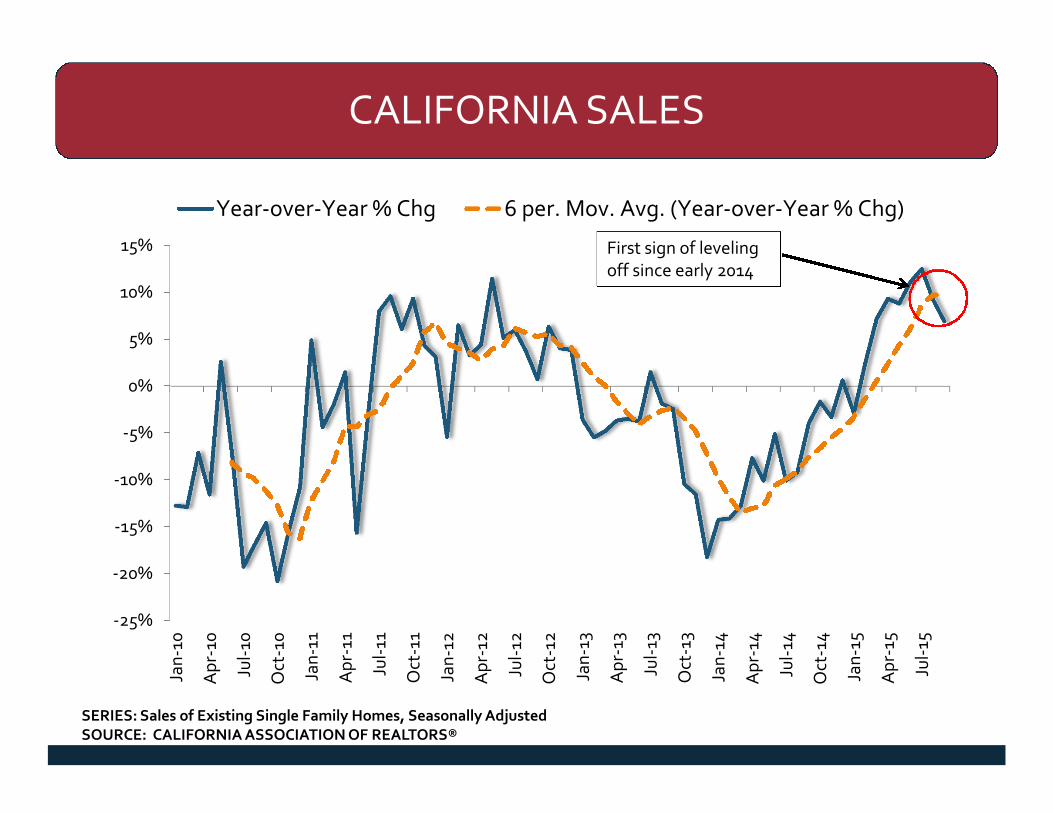
SALES SHARE BY PRICE RANGE
14%
18%16%
13%
19%
9% 8%
3%
11%
18%16%
14%
20%
10% 9%
3%
0%
10%
20%
30%
Sep-14 Sep-15
SERIES: Sales of Existing Detached HomesSOURCE: CALIFORNIA ASSOCIATION OF REALTORS®
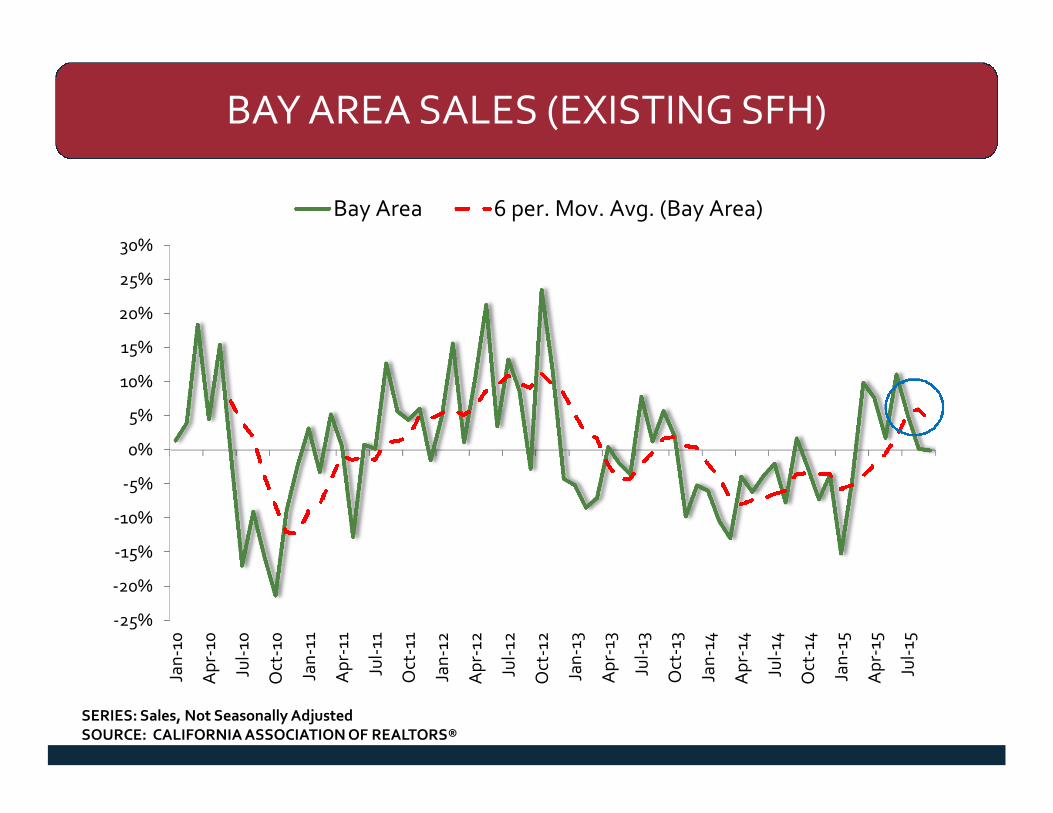
BAY AREA SALES (EXISTING SFH)
SERIES: Sales, Not Seasonally AdjustedSOURCE: CALIFORNIA ASSOCIATION OF REALTORS®
-25%
-20%
-15%
-10%
-5%
0%
5%
10%
15%
20%
25%
30%
Jan
-10
Ap
r-10
Jul-
10
Oct
-10
Jan
-11
Ap
r-11
Jul-
11
Oct
-11
Jan
-12
Ap
r-12
Jul-
12
Oct
-12
Jan
-13
Ap
r-13
Jul-
13
Oct
-13
Jan
-14
Ap
r-14
Jul-
14
Oct
-14
Jan
-15
Ap
r-15
Jul-
15
Bay Area 6 per. Mov. Avg. (Bay Area)
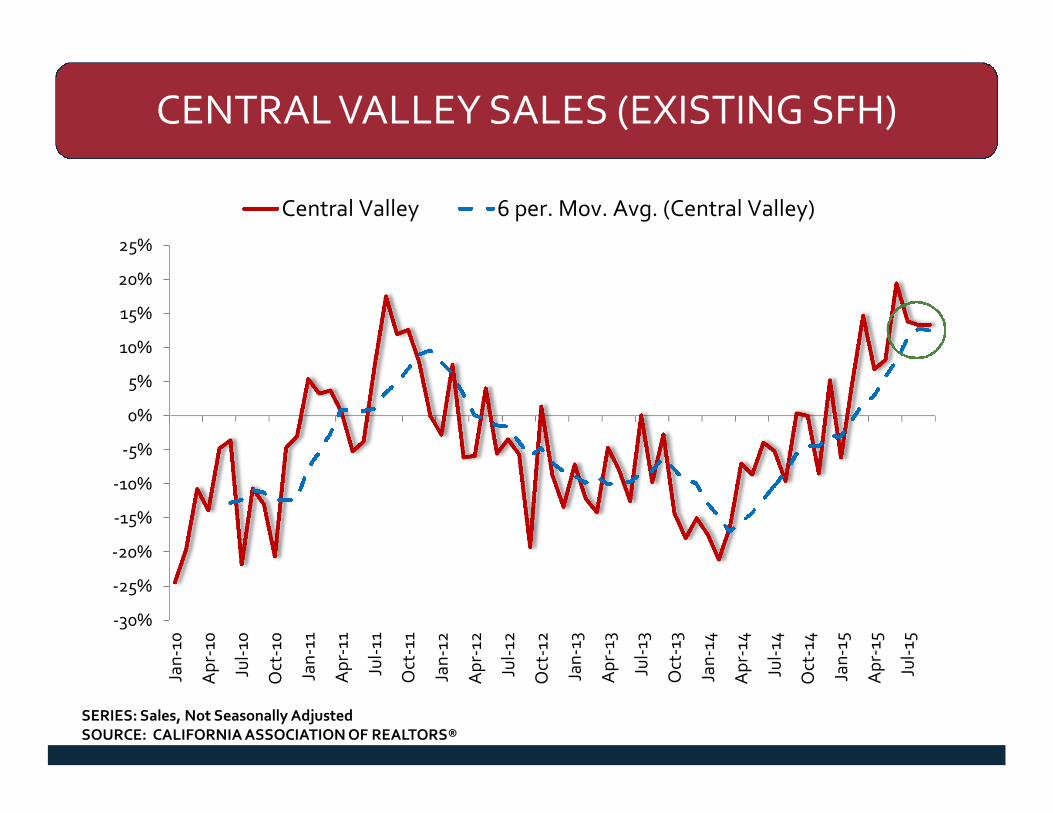
CENTRAL VALLEY SALES (EXISTING SFH)
SERIES: Sales, Not Seasonally AdjustedSOURCE: CALIFORNIA ASSOCIATION OF REALTORS®
-30%
-25%
-20%
-15%
-10%
-5%
0%
5%
10%
15%
20%
25%
Jan
-10
Ap
r-10
Jul-
10
Oct
-10
Jan
-11
Ap
r-11
Jul-
11
Oct
-11
Jan
-12
Ap
r-12
Jul-
12
Oct
-12
Jan
-13
Ap
r-13
Jul-
13
Oct
-13
Jan
-14
Ap
r-14
Jul-
14
Oct
-14
Jan
-15
Ap
r-15
Jul-
15
Central Valley 6 per. Mov. Avg. (Central Valley)
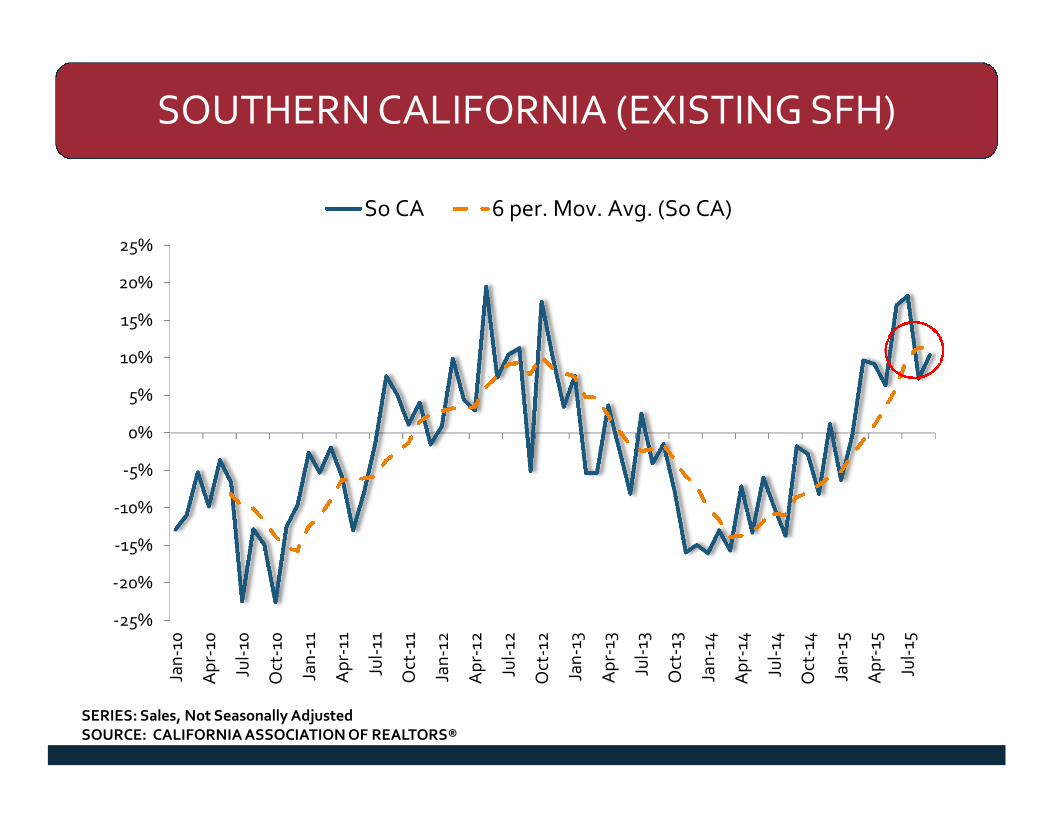
SOUTHERN CALIFORNIA (EXISTING SFH)
SERIES: Sales, Not Seasonally AdjustedSOURCE: CALIFORNIA ASSOCIATION OF REALTORS®
-25%
-20%
-15%
-10%
-5%
0%
5%
10%
15%
20%
25%
Jan
-10
Ap
r-10
Jul-
10
Oct
-10
Jan
-11
Ap
r-11
Jul-
11
Oct
-11
Jan
-12
Ap
r-12
Jul-
12
Oct
-12
Jan
-13
Ap
r-13
Jul-
13
Oct
-13
Jan
-14
Ap
r-14
Jul-
14
Oct
-14
Jan
-15
Ap
r-15
Jul-
15
So CA 6 per. Mov. Avg. (So CA)
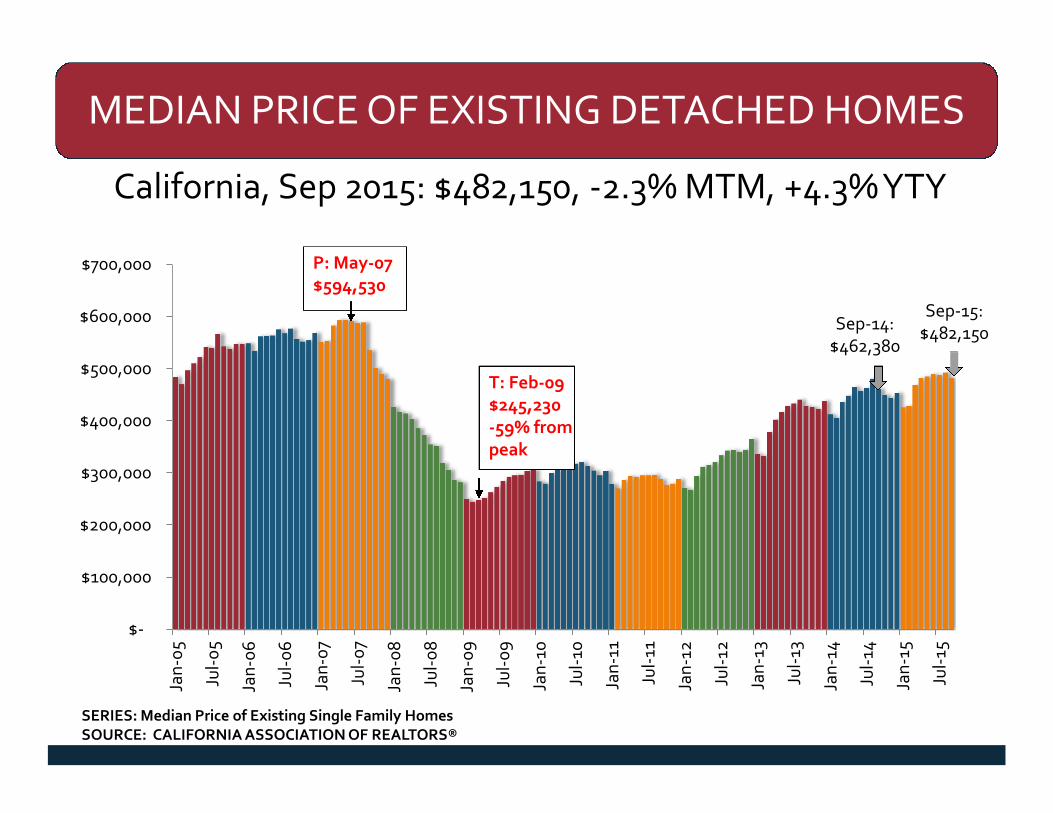
MEDIAN PRICE OF EXISTING DETACHED HOMES
California, Sep 2015: $482,150, -2.3% MTM, +4.3%YTY
$-
$100,000
$200,000
$300,000
$400,000
$500,000
$600,000
$700,000
Jan
-05
Jul-
05
Jan
-06
Jul-
06
Jan
-07
Jul-
07
Jan
-08
Jul-
08
Jan
-09
Jul-
09
Jan
-10
Jul-
10
Jan
-11
Jul-
11
Jan
-12
Jul-
12
Jan
-13
Jul-
13
Jan
-14
Jul-
14
Jan
-15
Jul-
15
P: May-07$594,530
T: Feb-09$245,230-59% frompeak
SERIES: Median Price of Existing Single Family HomesSOURCE: CALIFORNIA ASSOCIATION OF REALTORS®
Sep-15:$482,150
Sep-14:$462,380
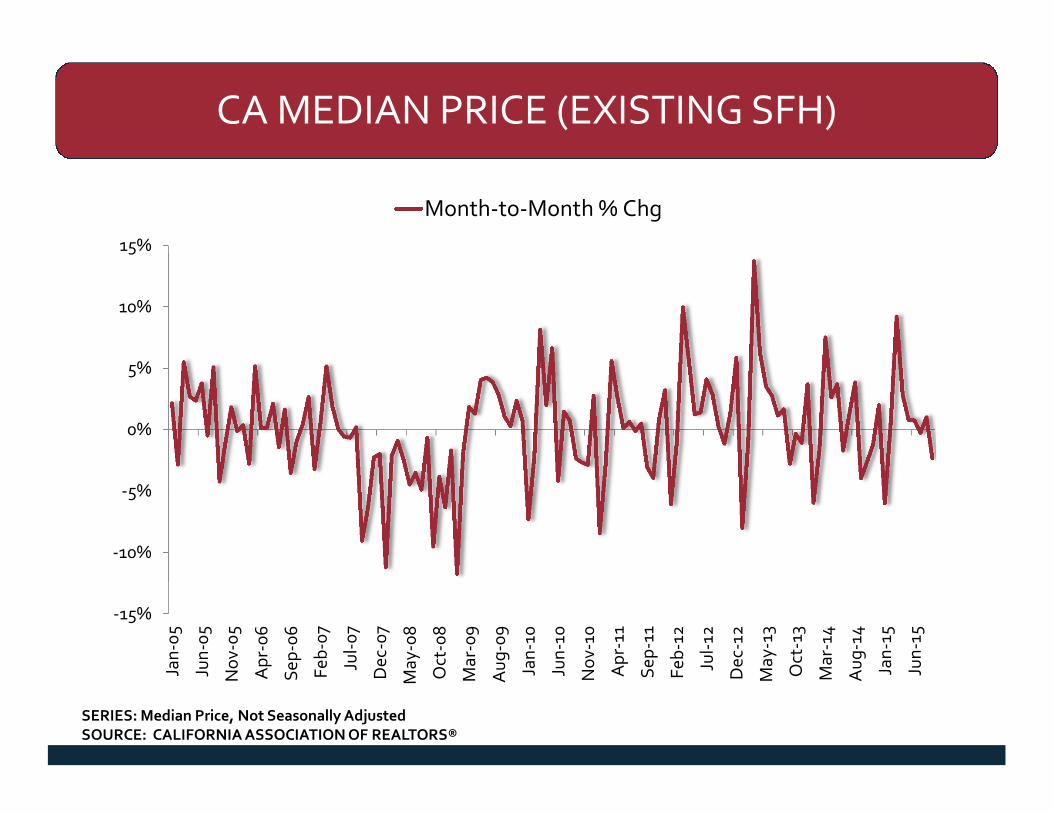
CA MEDIAN PRICE (EXISTING SFH)
SERIES: Median Price, Not Seasonally AdjustedSOURCE: CALIFORNIA ASSOCIATION OF REALTORS®
-15%
-10%
-5%
0%
5%
10%
15%
Jan
-05
Jun
-05
No
v-0
5
Ap
r-0
6
Sep
-06
Feb
-07
Jul-
07
Dec
-07
May
-08
Oct
-08
Mar
-09
Au
g-0
9
Jan
-10
Jun
-10
No
v-10
Ap
r-11
Sep
-11
Feb
-12
Jul-
12
Dec
-12
May
-13
Oct
-13
Mar
-14
Au
g-1
4
Jan
-15
Jun
-15
Month-to-Month % Chg

-50%
-40%
-30%
-20%
-10%
0%
10%
20%
30%
40%
50%
Jan
-05
Jul-
05
Jan
-06
Jul-
06
Jan
-07
Jul-
07
Jan
-08
Jul-
08
Jan
-09
Jul-
09
Jan
-10
Jul-
10
Jan
-11
Jul-
11
Jan
-12
Jul-
12
Jan
-13
Jul-
13
Jan
-14
Jul-
14
Jan
-15
Jul-
15
Condo Single-Family Homes
HOME PRICE APPRECIATIONS HAVEMODERATED SINCE MID 2013
SERIES: Sales of SFH and Condo UnitsSOURCE: CALIFORNIA ASSOCIATION OF REALTORS®
YTY% Chg. in Price
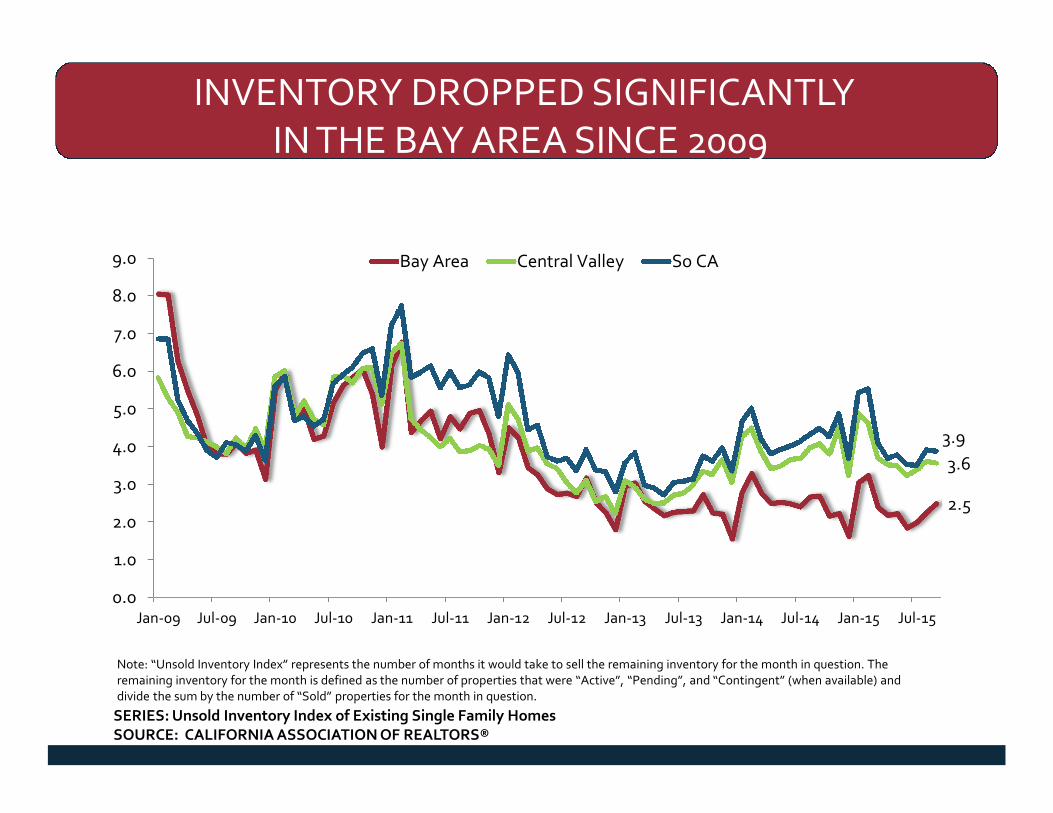
INVENTORY DROPPED SIGNIFICANTLYIN THE BAY AREA SINCE 2009
BUT REMAINED TIGHT
Note: “Unsold Inventory Index” represents the number of months it would take to sell the remaining inventory for the month in question. Theremaining inventory for the month is defined as the number of properties that were “Active”, “Pending”, and “Contingent” (when available) anddivide the sum by the number of “Sold” properties for the month in question.
2.5
3.6
3.9
0.0
1.0
2.0
3.0
4.0
5.0
6.0
7.0
8.0
9.0
Jan-09 Jul-09 Jan-10 Jul-10 Jan-11 Jul-11 Jan-12 Jul-12 Jan-13 Jul-13 Jan-14 Jul-14 Jan-15 Jul-15
Bay Area Central Valley So CA
SERIES: Unsold Inventory Index of Existing Single Family HomesSOURCE: CALIFORNIA ASSOCIATION OF REALTORS®
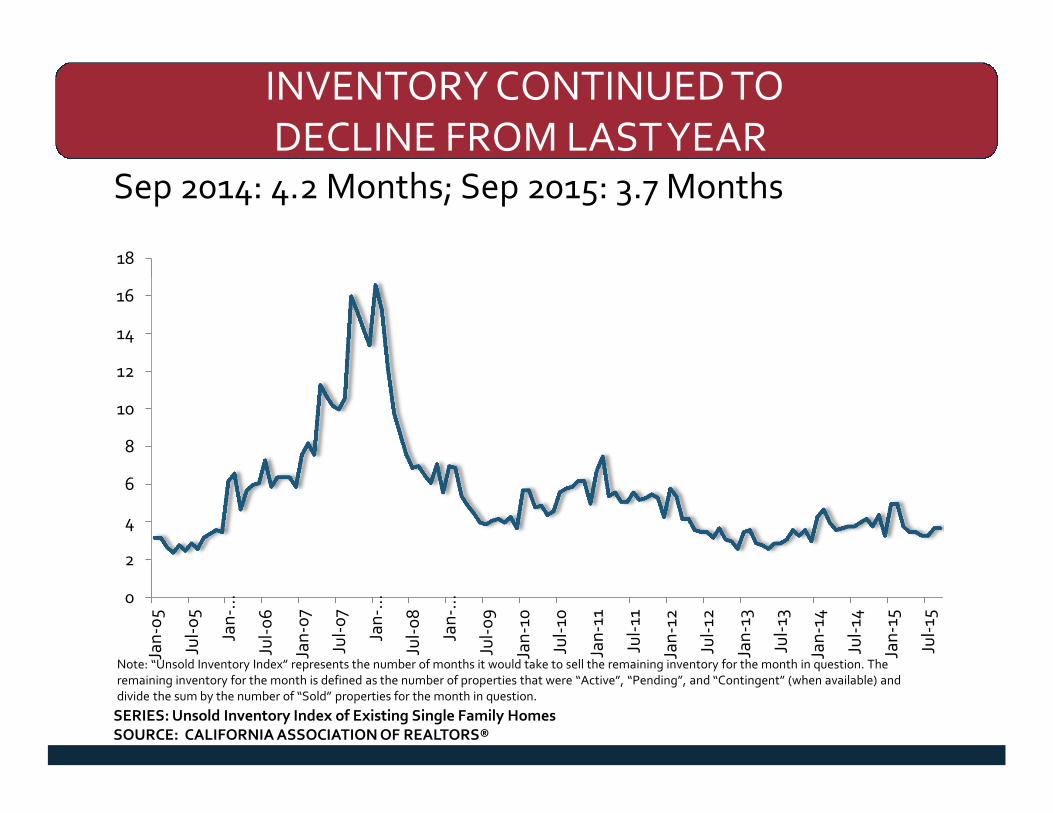
INVENTORY CONTINUED TODECLINE FROM LASTYEAR
Sep 2014: 4.2 Months; Sep 2015: 3.7 Months
Note: “Unsold Inventory Index” represents the number of months it would take to sell the remaining inventory for the month in question. Theremaining inventory for the month is defined as the number of properties that were “Active”, “Pending”, and “Contingent” (when available) anddivide the sum by the number of “Sold” properties for the month in question.
0
2
4
6
8
10
12
14
16
18
Jan
-05
Jul-
05
Jan
-…
Jul-
06
Jan
-07
Jul-
07
Jan
-…
Jul-
08
Jan
-…
Jul-
09
Jan
-10
Jul-
10
Jan
-11
Jul-
11
Jan
-12
Jul-
12
Jan
-13
Jul-
13
Jan
-14
Jul-
14
Jan
-15
Jul-
15
SERIES: Unsold Inventory Index of Existing Single Family HomesSOURCE: CALIFORNIA ASSOCIATION OF REALTORS®
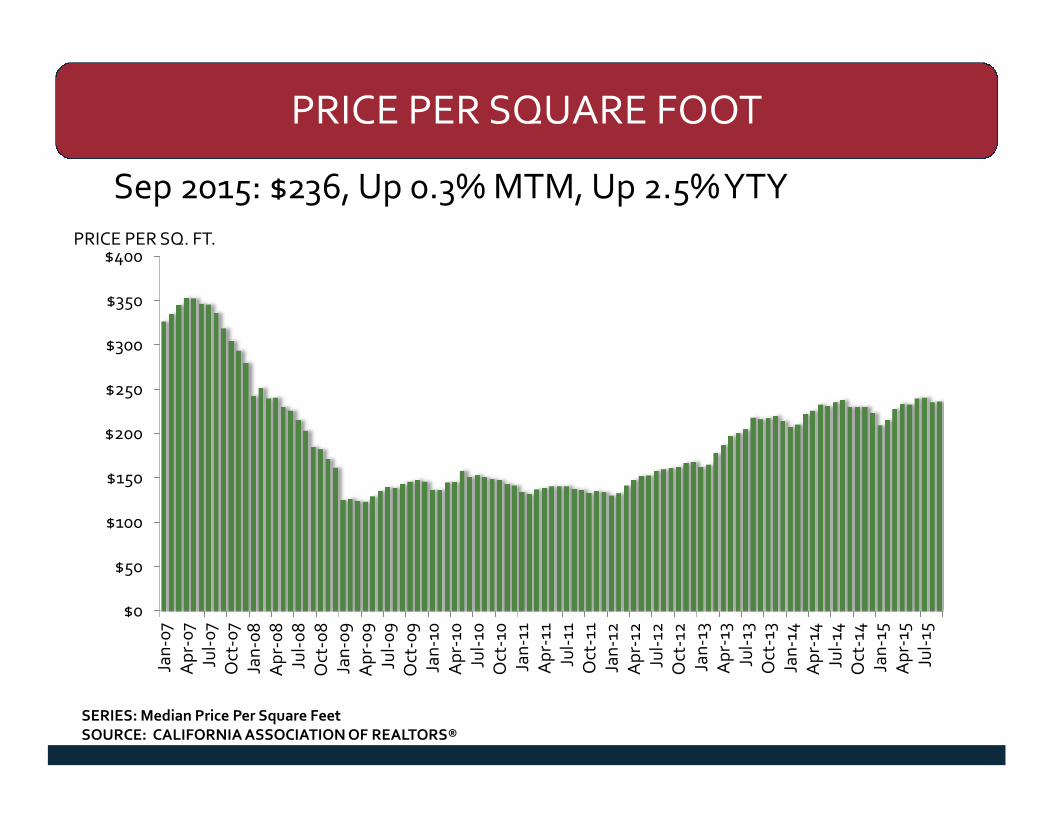
PRICE PER SQUARE FOOT
Sep 2015: $236, Up 0.3% MTM, Up 2.5%YTY
$0
$50
$100
$150
$200
$250
$300
$350
$400
Jan
-07
Ap
r-0
7Ju
l-0
7O
ct-0
7Ja
n-0
8A
pr-
08
Jul-
08
Oct
-08
Jan
-09
Ap
r-0
9Ju
l-0
9O
ct-0
9Ja
n-1
0A
pr-
10Ju
l-10
Oct
-10
Jan
-11
Ap
r-11
Jul-
11O
ct-1
1Ja
n-1
2A
pr-
12Ju
l-12
Oct
-12
Jan
-13
Ap
r-13
Jul-
13O
ct-1
3Ja
n-1
4A
pr-
14Ju
l-14
Oct
-14
Jan
-15
Ap
r-15
Jul-
15
PRICE PER SQ. FT.
SERIES: Median Price Per Square FeetSOURCE: CALIFORNIA ASSOCIATION OF REALTORS®

SALES-TO-LIST RATIO
Sep 2015: 98.5%, Down 0.2% MTM, Up 0.5%YTY
98.5%
86%
88%
90%
92%
94%
96%
98%
100%
102%
Jan
-07
Ap
r-0
7Ju
l-0
7O
ct-0
7Ja
n-0
8A
pr-
08
Jul-
08
Oct
-08
Jan
-09
Ap
r-0
9Ju
l-0
9O
ct-0
9Ja
n-1
0A
pr-
10Ju
l-10
Oct
-10
Jan
-11
Ap
r-11
Jul-
11O
ct-1
1Ja
n-1
2A
pr-
12Ju
l-12
Oct
-12
Jan
-13
Ap
r-13
Jul-
13O
ct-1
3Ja
n-1
4A
pr-
14Ju
l-14
Oct
-14
Jan
-15
Ap
r-15
Jul-
15
Sales-to-List Price Ratio
SERIES: Sales-to-List RatioSOURCE: CALIFORNIA ASSOCIATION OF REALTORS®
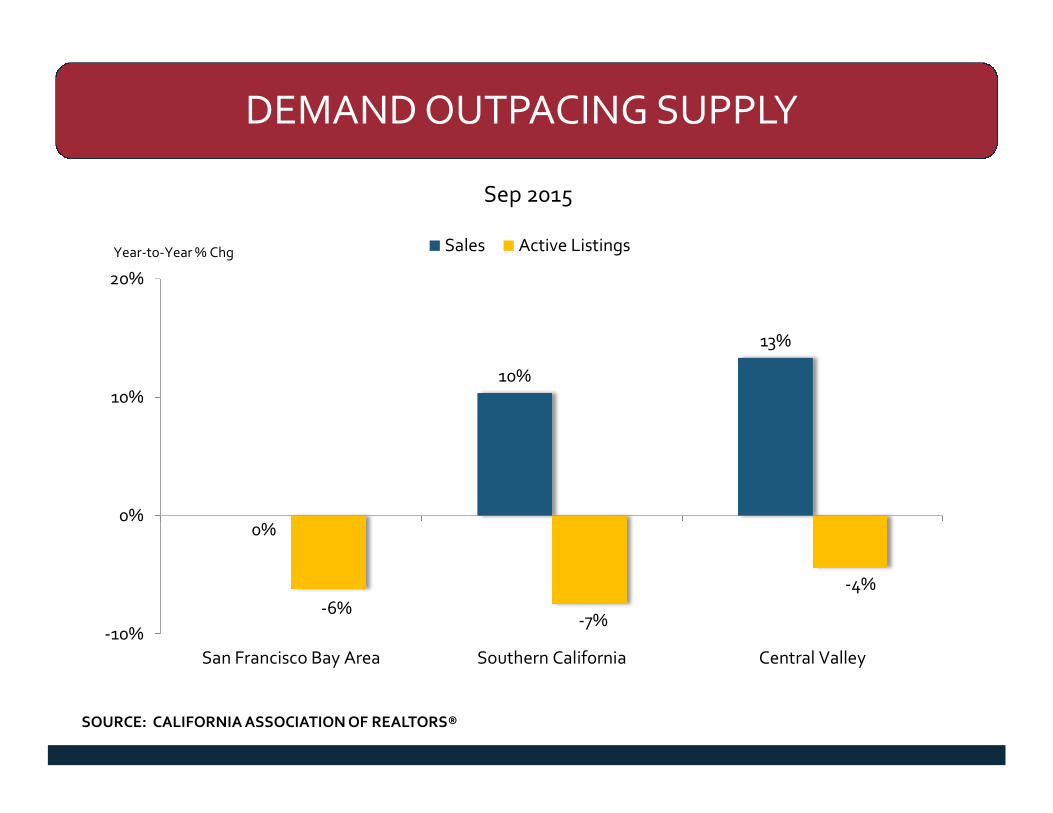
DEMAND OUTPACING SUPPLY
0%
10%
13%
-6%-7%
-4%
-10%
0%
10%
20%
San Francisco Bay Area Southern California Central Valley
Sales Active ListingsYear-to-Year % Chg
SOURCE: CALIFORNIA ASSOCIATION OF REALTORS®
Sep 2015