Embed Size (px)
Citation preview
3219817
Costs and Revenues of Franchised Passenger Train Operators in the UK
November 2012
Office of Rail Regulation | November 2012 | Costs and Revenues of UK Passenger Train Operations 2 3219817
Contents
Executive Summary 3
1. Introduction 9
Purpose of the report 9
Structure of the report 10
Comparison with other European TOCs 10
Background 11
Scope 12
Approach 13
Next steps 14
2. Evolution of train operators’ costs and revenues 15
Regulatory framework of franchised passenger TOCs 15
Government Support 19
Evolution of Revenues and Subsidies 20
Evolution of TOCs total costs 25
Evolution of staff, rolling stock and energy costs 30
Evolution of staff costs 31
Evolution of rolling stock costs 33
Evolution of other costs 34
Evolution of TOC’s Performance 35
3. Comparative analysis of TOCs’ costs in 2010-11 38
Introduction 38
Comparison of TOC’s service characteristics 38
What factors drive TOCs cost 46
2010-2011 Total Cost and Income 47
Comparative analysis of 2010-11 costs 48
Comparison of operators’ costs per train-kilometre and vehicle-kilometre 49
Comparison of costs per train-hour 52
Comparison of operators’ costs per passenger-kilometre 53
Overall comparison of TOC unit costs 54
Conclusion 55 Appendix 56
Office of Rail Regulation | November 2012 | Costs and Revenues of UK Passenger Train Operations 3 3219817
Executive Summary
Purpose
1. This report is being published to improve the understanding of costs and cost drivers in the rail industry.
The Rail Value for Money study1 commissioned by the DfT and the ORR identified that UK rail industry
costs could be reduced by between £2.7bn and £3.8bn per annum by 2018-19, with around 70 per cent of
this reduction coming from Network Rail, and 30 per cent from the rest of the industry. The study
recommended that the ORR should benchmark TOC costs nationally and internationally to better
understand their drivers. This report is a response to that recommendation and the first in what we expect
to be an annual series of reports aimed at understanding and comparing the costs of passenger train
operations in the UK.
2. The main objectives of this work are to:
(a) help inform public debate on the efficiency of the rail industry by providing greater transparency to
taxpayers and customers on what they are paying in relation to what they receive;
(b) help DfT and TS better understand cost drivers in order to promote value for money in franchise
specifications; and
(c) inform train operators on their costs relative to others, to place them in a better position to investigate
the underlying causes of these differences.
3. The long term aim for this work is to contribute to an improvement in efficiency through reductions in the
overall cost of operating the railways.
Context
4. Over the period covered in this report2 there has been strong growth in usage of the railways in Great
Britain, alongside improvements in safety, satisfaction, and operational performance. There have also been
increases in revenues to train operators (53 per cent in real terms, or 4 per cent when taking passenger
growth into account) and costs (35 per cent in real terms, or 13 per cent when taking service level
1 http://www.rail-reg.gov.uk/upload/pdf/rail-vfm-detailed-report-may11.pdf 2 2000-01 to 2011-12 – the period over which DfT has suitable data available.
Office of Rail Regulation | November 2012 | Costs and Revenues of UK Passenger Train Operations 4 3219817
increases into account). Operator costs accounted for 48 per cent of total industry costs in 2010-113, and
so are an important element in improving the overall efficiency of the industry.
5. This report presents detailed analysis of these costs and revenues for the 19 franchised Train Operating
Companies (TOCs) in Great Britain for the first time. It demonstrates a real and very welcome commitment
to transparency and accountability from the rail industry.
6. The work has involved collaboration across a number of organisations, notably ORR, the Department for
Transport (DfT), Transport Scotland (TS), the Welsh Government, the Association of Train Operating
Companies and its members, Transport for London, and Mersey Travel. ORR is grateful to these
organisations for their willingness to engage and provide support in producing this report.
7. The report provides analysis of how costs and revenues have changed over time, and how they vary
across franchises. The analysis cannot yet fully identify the underlying drivers of train operator costs and
costs between train operators, but given that TOCs operate through franchise competitions and face on-
going investor pressures, the focus is more on factors outside of their direct control.
8. This report takes an important first step by comparing unit costs against some aspects of market
characteristics (overall demand) and franchise requirements (such as train and vehicle kilometres
operated). Given their potential importance, subsequent reports will focus further on understanding the
impact of franchise requirements and market conditions on efficiency.
Key Results – Comparisons over time
9. Figure 13 on page 29 of the report shows RPI-adjusted total operator costs, excluding access charges,
increased by 35 per cent between 2000-01 and 2011-12. This should be considered in conjunction with a
20 per cent increase in service levels (timetabled train kilometres) over the period. Overall real operating
costs per train kilometre increased by 13 per cent, significantly less than the 35 per cent increase in total
costs.
10. In terms of revenues, the analysis shows real revenue growth of 52 per cent between 2000-01 and
2011-12, with similar growth in passenger numbers. The rise in real income per passenger kilometre (so
taking account of growth in service use) was 4 per cent over the period.
11. The impact of these changes is that the net subsidy being paid to TOCs by the DfT and TS is now
relatively close to zero. This reflects payments made directly to TOCs but importantly does not include the
impacts of subsidies to Network Rail, such as the network grant. The network grant is paid directly by
government to Network Rail in lieu of fixed access charges that would otherwise have to be recouped from
3 Operator costs exclude access charges and performance regime payments.
Office of Rail Regulation | November 2012 | Costs and Revenues of UK Passenger Train Operations 5 3219817
infrastructure users (i.e. TOCs, open access operators and freight operating companies).4 In the absence
of the network grant, Network Rail would have to charge TOCs much higher access charges and, in turn,
the level of TOC subsidy would also need to be much higher. As such, it is important to bear in mind, when
considering the fall in direct subsidy paid to TOCs, that it does not capture the implicit government subsidy
they receive via the network grant’s effects on access charges.
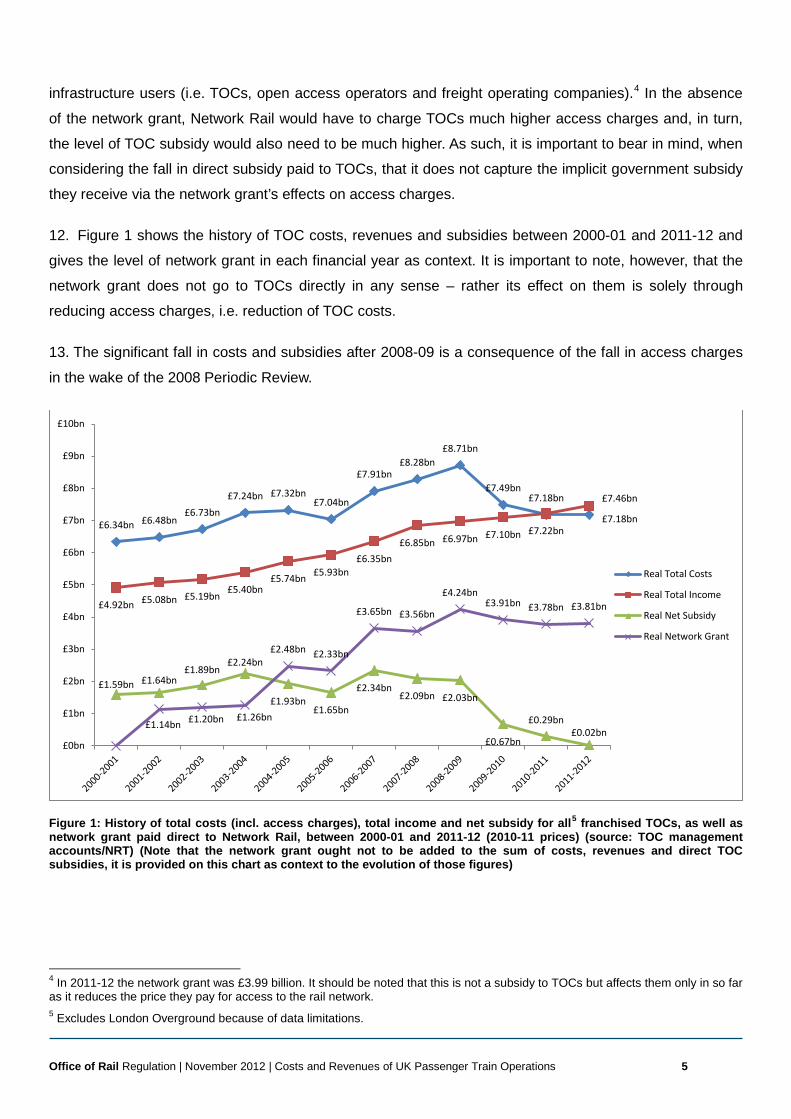
12. Figure 1 shows the history of TOC costs, revenues and subsidies between 2000-01 and 2011-12 and
gives the level of network grant in each financial year as context. It is important to note, however, that the
network grant does not go to TOCs directly in any sense – rather its effect on them is solely through
reducing access charges, i.e. reduction of TOC costs.
13. The significant fall in costs and subsidies after 2008-09 is a consequence of the fall in access charges
in the wake of the 2008 Periodic Review.
Figure 1: History of total costs (incl. access charges), total income and net subsidy for all5 franchised TOCs, as well as network grant paid direct to Network Rail, between 2000-01 and 2011-12 (2010-11 prices) (source: TOC management accounts/NRT) (Note that the network grant ought not to be added to the sum of costs, revenues and direct TOC subsidies, it is provided on this chart as context to the evolution of those figures)
4 In 2011-12 the network grant was £3.99 billion. It should be noted that this is not a subsidy to TOCs but affects them only in so far as it reduces the price they pay for access to the rail network. 5 Excludes London Overground because of data limitations.
£6.34bn £6.48bn £6.73bn
£7.24bn £7.32bn £7.04bn
£7.91bn £8.28bn
£8.71bn
£7.49bn £7.18bn
£7.18bn
£4.92bn £5.08bn £5.19bn £5.40bn
£5.74bn £5.93bn £6.35bn
£6.85bn £6.97bn £7.10bn £7.22bn
£7.46bn
£1.59bn £1.64bn £1.89bn
£2.24bn
£1.93bn £1.65bn
£2.34bn £2.09bn £2.03bn
£0.67bn
£0.29bn £0.02bn
£1.14bn £1.20bn £1.26bn
£2.48bn £2.33bn
£3.65bn £3.56bn
£4.24bn £3.91bn £3.78bn £3.81bn
£0bn
£1bn
£2bn
£3bn
£4bn
£5bn
£6bn
£7bn
£8bn
£9bn
£10bn
Real Total Costs
Real Total Income
Real Net Subsidy
Real Network Grant
Office of Rail Regulation | November 2012 | Costs and Revenues of UK Passenger Train Operations 6 3219817
Key Results – Differences in cost by train operating company
14. The approach taken in this report provides a transparent analysis of costs using simple measures of
unit costs, specifically costs per train, vehicle and passenger kilometre, and costs per train hour. Using
these different measures allows us to put variation in costs between TOCs into greater context. Train
kilometres is the rail industry standard measure for volume of service provision. In comparison with train
kilometres: using vehicle kilometres allows us to factor into account varying train lengths between TOCs,
using train hours takes account of the variation in average speed between TOCs6 and using passenger
kilometres allows us to put cost levels in the context of service usage (though it should be noted that
passenger kilometres are not a significant cost driver in and of themselves).
15. Using these measures, the report shows that no individual TOC is consistently above the average, and
four TOCs have costs consistently on or below average for the first three measures. They are: East
Midlands Trains, First Great Western, National Express East Anglia and Stagecoach Southwestern. Note
that as we cannot yet separate cost drivers between market characteristics, franchise specifications or
management policies, this analysis should not be used to establish a “league table” of TOC efficiency.
Additionally, there are also links between costs and revenues not captured here - for example some
operators may choose to spend more on marketing, customer service, or train quality to try to increase
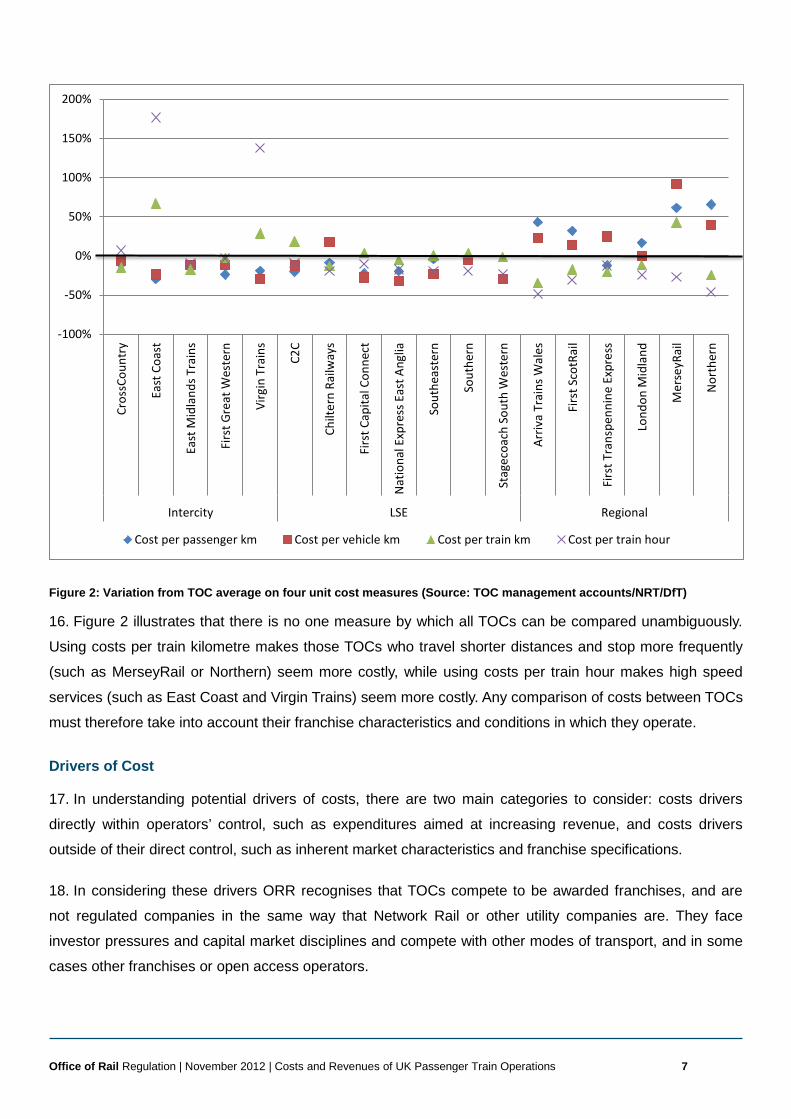
overall revenues. Figure 2 sets out how costs against these metrics vary across TOCs.
6 TOCs with low average speed will tend to look more costly when using train kilometres as a measure of output owing to the fact that they travel fewer kilometres
Office of Rail Regulation | November 2012 | Costs and Revenues of UK Passenger Train Operations 7 3219817
Figure 2: Variation from TOC average on four unit cost measures (Source: TOC management accounts/NRT/DfT)
16. Figure 2 illustrates that there is no one measure by which all TOCs can be compared unambiguously.
Using costs per train kilometre makes those TOCs who travel shorter distances and stop more frequently
(such as MerseyRail or Northern) seem more costly, while using costs per train hour makes high speed
services (such as East Coast and Virgin Trains) seem more costly. Any comparison of costs between TOCs
must therefore take into account their franchise characteristics and conditions in which they operate.
Drivers of Cost
17. In understanding potential drivers of costs, there are two main categories to consider: costs drivers
directly within operators’ control, such as expenditures aimed at increasing revenue, and costs drivers
outside of their direct control, such as inherent market characteristics and franchise specifications.
18. In considering these drivers ORR recognises that TOCs compete to be awarded franchises, and are
not regulated companies in the same way that Network Rail or other utility companies are. They face
investor pressures and capital market disciplines and compete with other modes of transport, and in some
cases other franchises or open access operators.
-100%
-50%
0%
50%
100%
150%
200%Cr
ossC
ount
ry
East
Coa
st
East
Mid
land
s Tra
ins
Firs
t Gre
at W
este
rn
Virg
in T
rain
s
C2C
Chilt
ern
Railw
ays
Firs
t Cap
ital C
onne
ct
Nat
iona
l Exp
ress
Eas
t Ang
lia
Sout
heas
tern
Sout
hern
Stag
ecoa
ch S
outh
Wes
tern
Arriv
a Tr
ains
Wal
es
Firs
t Sco
tRai
l
Firs
t Tra
nspe
nnin
e Ex
pres
s
Lond
on M
idla
nd
Mer
seyR
ail
Nor
ther
n
Intercity LSE Regional
Cost per passenger km Cost per vehicle km Cost per train km Cost per train hour
Office of Rail Regulation | November 2012 | Costs and Revenues of UK Passenger Train Operations 8 3219817
19. So long as these competition and investor pressures are sufficiently strong, the significant drivers of
overall costs will be underlying market characteristics and franchise requirements. ORR would like to make
use of more sophisticated statistical techniques in subsequent annual reports to better isolate exactly how
market characteristics and franchise specifications contribute to costs.
International comparisons
20. Separately to this report, ORR has published an analysis undertaken by the economic consultancy firm
Civity that compares TOCs in Great Britain to those in other European countries. This study provides an
analysis of the variation in revenues and costs across operators in different countries, and assesses some
of the potential drivers of these costs. The study is available on the ORR website.7
7 http://www.rail-reg.gov.uk/server/show/nav.1856
Office of Rail Regulation | November 2012 | Costs and Revenues of UK Passenger Train Operations 9 3219817
1. Introduction
Purpose of the report
1.1 In this report, we present information on train operators’ costs and revenues and show the results of
comparative analyses of train operators’ costs in Great Britain. We explore the key factors that drive train
operators’ costs, taking into account the different performance and operating characteristics of the
operators. This report does not aim to establish a “league table” of TOC efficiency because at this stage we
are not able to delineate clearly the cost drivers between market characteristics, franchise specifications
and management policies. Our approach has been to provide a transparent analysis of costs using simple
measures of unit cost and discuss why costs may differ between TOCs.
1.2 By publishing a report on train operators’ costs and cost drivers, we intend to increase transparency
and accountability in an area where little information is readily available in the public domain and to identify
the drivers of difference in Train Operating Companies (TOCs) costs, including structural conditions such
as market conditions, franchise requirements, and TOC management decisions.
1.3 We are also publishing this report to improve the understanding of costs and cost drivers in the rail
industry. This is important because it is considered by many that GB rail costs are too high. In particular,
the Rail Value for Money (RVfM)8 study identified the need to improve value for money, including in
passenger train operations. This work showed high passenger operations costs compared to European
comparators and an increase in costs over time. It recommended that the ORR benchmark TOCs’ and
Rolling Stock Companies’ (ROSCOs) costs nationally and internationally to better understand their costs.
Our report, which focuses on TOCs, including their rolling stock costs, is a first response to this
recommendation.
1.4 The expected benefits of publishing this report will be that:
(a) Taxpayers and customers will have better information on what they are funding/paying in relation to
what they are getting. They will be in a better place to participate in the public debate on the efficiency of
the rail industry and seek improvements in costs but also in the delivery of what they want;
8 http://www.rail-reg.gov.uk/upload/pdf/rail-vfm-detailed-report-may11.pdf
Office of Rail Regulation | November 2012 | Costs and Revenues of UK Passenger Train Operations 10 3219817
(b) the DfT, Transport Scotland and other franchise authorities will be better informed on the drivers of
costs and will be in better position to make decisions on franchise requirements that provide better value
for money; and
(c) TOC management will have more information on their costs in comparison to other TOCs. As such,
they will be better incentivised to improve their cost efficiency, and in a better position to investigate
further any differences highlighted in our work.
1.5 Ultimately, our long-term aim is to see this work contribute to a reduction in the cost of operating the
railway ranging from changes in franchising policy to improvements in decision-making by TOCs.
Structure of the report
1.6 Chapter 2 shows the historic development of costs and revenues of franchised TOCs operating in
Great Britain over the last decade. We analyse the changes that occurred during these years, taking into
account the evolution of train operators’ production (for example the number of train kilometres operated)
and overall outcomes (for example, their reliability and passenger satisfaction score).
1.7 In Chapter 3, we compare the costs and revenues of train operators in Great Britain, looking at the
financial year 2010-11. We highlight reasons that can explain differences in costs, taking into account
market characteristics (for example overall demand) and franchise requirements such as requirement on
service frequency.
1.8 An appendix to this report includes more detailed analysis of TOC cost drivers and service
characteristics.
Comparison with other European TOCs
1.9 Separately to this report the ORR has published analysis undertaken by the economic consultancy firm
Civity that compares TOCs in Great Britain to those in other European countries. The objective of this
European study is to build on the results shown in the RVfM study and understand better what drives
differences between train operators’ costs in Great Britain and in other European countries. Working with
operators in Great Britain and in Europe, Civity, the consultants who led this study, looked at the costs,
revenues and performance of TOCs in 7 countries. The report provides some high level analysis of the
variation in revenues and costs across operators, and assesses some of the potential drivers of rolling
stock and train driver costs.
Office of Rail Regulation | November 2012 | Costs and Revenues of UK Passenger Train Operations 11 3219817
Background
1.10 We are publishing this first report on train operators’ costs and cost drivers to respond to the need for
greater transparency in the rail sector. More generally, openness and transparency are playing an
increasingly important role in delivering the UK Government’s objectives for strengthened public
accountability; public service improvement; and stimulating wider economic growth by helping third parties
to develop innovative products and services based on public sector information. It is also viewed as a way
to empower the consumer to exert pressure on businesses to improve their performance and to be more
innovative. Likewise, the Scottish Government is of the view that providing better information on public
services will help increase the usefulness of those services, improve accountability and create economic
opportunity.
1.11 The Department for Transport’s (DfT) Command Paper ‘Reforming our Railways: Putting the
Customer First’9 stresses the importance of improving the availability of data and information to
passengers and taxpayers. DfT notes that in the context of the rail industry, where £4 billion of public
subsidy was provided in 2010-1110, the public has a right to clearer and more transparent information on
costs and on all aspects of performance. In our consultation document on transparency published in July11,
we confirm our support for DfT’s transparency agenda. We also explain that transparency has a vital role to
play in driving the behavioural changes necessary for industry reform, delivering better value for money
and delivering an industry that has a sharper focus on its customers.
1.12 Much information is already made available on the rail sector. For example, we publish whole industry
performance information on safety, punctuality and passenger satisfaction. We also publish information on
Network Rail’s finances and progress against efficiency targets. In addition to the information published by
the ORR, the Association of Train Operating Companies (ATOC), Network Rail and the Department for
Transport also publish information on the rail sector.
1.13 There is, however, significantly less financial information available on other key parts of the sector
such as TOCs and ROSCOs. This limits the visibility of whole-industry financing and potential cost saving
initiatives at a whole-industry level. In January we took a first step towards increasing transparency and
promoting a whole industry perspective by publishing for the first time transparent financial accounts on a
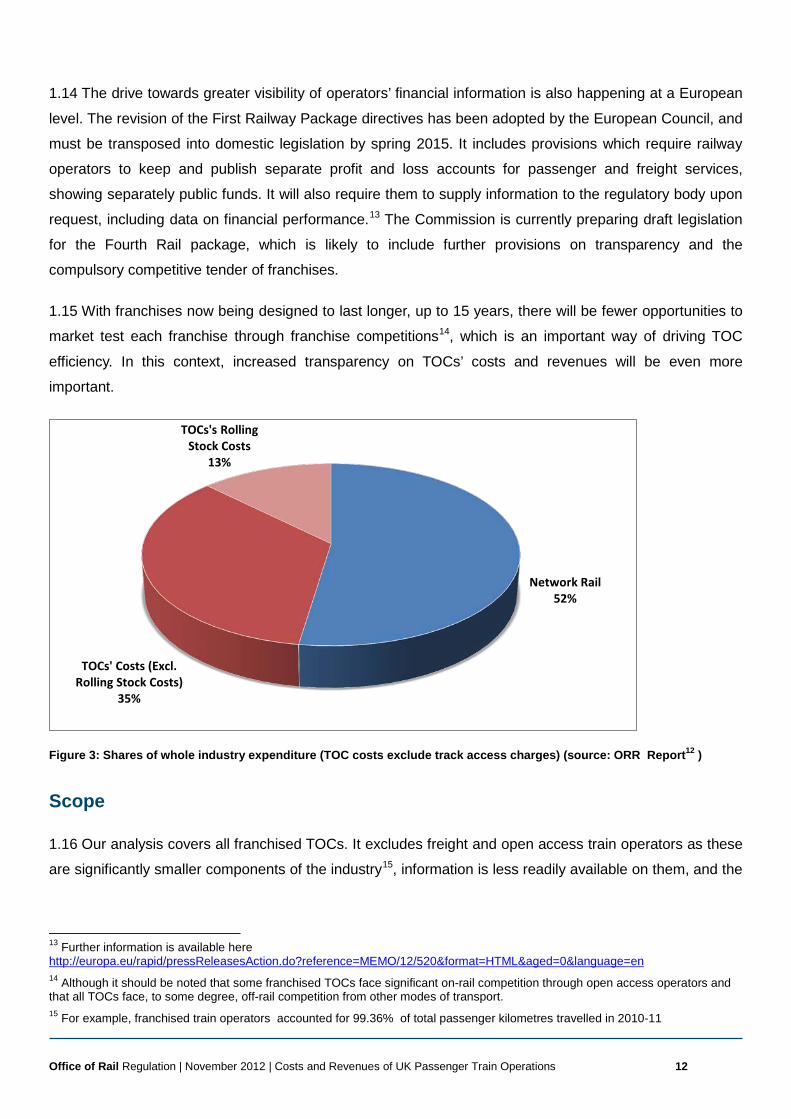
whole-industry basis, route-by-route12. Figure 3 below, shows the relative shares of expenditure of TOCs
and Network Rail in 2010-11. Total TOC expenditure was £5.24bn, which accounted for 48% of the whole
industry expenditure.
9 http://www.dft.gov.uk/publications/reforming-our-railways/ 10 National Rail Trend data - http://dataportal.orr.gov.uk/ 11 http://www.rail-reg.gov.uk/upload/pdf/transparency-consultation-july-2012.pdf 12 http://www.rail-reg.gov.uk/upload/pdf/gb_rail_industry_financial_information.pdf
Office of Rail Regulation | November 2012 | Costs and Revenues of UK Passenger Train Operations 12 3219817
1.14 The drive towards greater visibility of operators’ financial information is also happening at a European
level. The revision of the First Railway Package directives has been adopted by the European Council, and
must be transposed into domestic legislation by spring 2015. It includes provisions which require railway
operators to keep and publish separate profit and loss accounts for passenger and freight services,
showing separately public funds. It will also require them to supply information to the regulatory body upon
request, including data on financial performance.13 The Commission is currently preparing draft legislation
for the Fourth Rail package, which is likely to include further provisions on transparency and the
compulsory competitive tender of franchises.
1.15 With franchises now being designed to last longer, up to 15 years, there will be fewer opportunities to
market test each franchise through franchise competitions14, which is an important way of driving TOC
efficiency. In this context, increased transparency on TOCs’ costs and revenues will be even more
important.
Figure 3: Shares of whole industry expenditure (TOC costs exclude track access charges) (source: ORR Report12 )
Scope
1.16 Our analysis covers all franchised TOCs. It excludes freight and open access train operators as these
are significantly smaller components of the industry15, information is less readily available on them, and the
13 Further information is available here http://europa.eu/rapid/pressReleasesAction.do?reference=MEMO/12/520&format=HTML&aged=0&language=en 14 Although it should be noted that some franchised TOCs face significant on-rail competition through open access operators and that all TOCs face, to some degree, off-rail competition from other modes of transport. 15 For example, franchised train operators accounted for 99.36% of total passenger kilometres travelled in 2010-11
Network Rail 52%
TOCs' Costs (Excl. Rolling Stock Costs)
35%
TOCs's Rolling Stock Costs
13%
Office of Rail Regulation | November 2012 | Costs and Revenues of UK Passenger Train Operations 13 3219817
report is designed to focus on the cost drivers of passenger train operations – freight operating companies
have different cost drivers.
1.17 We have used data from 2000-01 to 2011-12 for the historical trend analysis and from 2010-11 for the
comparative analysis of individual TOC costs. Unless otherwise stated, real cost and revenue figures are
presented in 2010-11 prices.16
1.18 Our report draws largely on the following sources of information:
(a) Management accounting data submitted by TOCs to government under their franchise obligations;
(b) Financial and timetable data from the Network Modelling Framework where specific data were
unavailable in the management accounts submitted DfT17 ;
(c) Timetable data provided by DfT;
(d) Financial and operational data published in the ORR’s National Rail Trends Portal18; and
(e) Operational data from Network Rail.
Approach
1.19 This work has been undertaken in collaboration with the Association of Train Operating Companies
(ATOC) and its members, the DfT, TS, Transport for London (TfL), Mersey Travel and the Welsh
Government. We are grateful for the support and cooperation they have provided throughout this study.
1.20 Although the focus of this work has been to understand train operators’ costs, and to a lesser extent
their revenues, whenever possible, costs have been analysed in relation to train operators’ performance,
safety, market characteristics (for example overall demand) and franchise requirements (for example
requirements related to service frequency). As a result, to inform our analysis we consider measures like
cost by train kilometres operated and cost by passenger kilometres transported. This approach provides a
basis for better comparability over time and between operators. However a single measure will only
capture one aspect of TOC costs; for example, the measure “cost per train kilometre” gives a good
measure of costs in relation to volume of service provided but it does not take into account, for example,
levels of crowding. We have, therefore, considered a range of measures (including cost per train kilometre,
cost per seat kilometre, cost per passenger kilometre etc.) to help better understand the factors that may
affect TOC costs and revenues.
16 Adjusted using all items RPI inflation. 17 The NMF is a modelling tool and database developed for the DfT and ORR by SDG in conjunction with the Institute for Transport Studies at the University of Leeds. 18 http://dataportal.orr.gov.uk/
Office of Rail Regulation | November 2012 | Costs and Revenues of UK Passenger Train Operations 14 3219817
1.21 As we have already noted, this report does not aim to establish a “league table” of TOC efficiency. In
comparing unit costs and looking at costs drivers we have taken into account that TOCs compete to be
awarded franchises and are not regulated companies in the same way that Network Rail or other utility
companies are. As such, they face investor pressure and capital market disciplines and, to some extent,
they have to compete with other modes, other rail franchises and open access operators. In our analysis,
we therefore highlight how TOC costs and revenues vary due to various factors that are not controllable by
TOC management such as the inherent market characteristics and franchise specifications.
1.22 The conclusions reached in this report have been informed by a number of methods of analysis. We
have analysed unit cost measures and carried out interviews with TOCs and workshops to discuss
explanations for observed trends and set them in their context – this includes discussing key cost drivers
with TOCs, comparing unit cost measures and looking at possible explanations of between TOC
differences.
Next steps
1.23 This is the first of what we expect to be an annual publication on TOC costs and revenues. We
anticipate that the contents of the report will evolve with time. For example, we intend to strengthen the
analysis to better delineate cost drivers between market characteristics, franchise specificities and
management choices. We will explore the possibility of using econometrics to build on our current analysis.
In the longer-term, the aim of this work is to quantify the impacts of cost drivers and support the
identification and promotion of best practice in delivering efficiencies. We will also give further
consideration to rolling stock costs, as recommended in the RVfM study.
1.24 In January 2012, we published the GB rail industry financial information for 2010-1112. This was a first
step towards increased transparency on the industry costs and revenues. It provided financial information
about the TOCs and Network Rail (NR) disaggregated by regional routes. Although the publication on
whole-industry financial information has a different scope than this report, the two reports complement
each other well. We will consider bringing closer the two reports by combining those analyses or aligning
publication dates.
Office of Rail Regulation | November 2012 | Costs and Revenues of UK Passenger Train Operations 15 3219817
2. Evolution of train operators’ costs and revenues
2.1 In this chapter, we first give some background information on the regulatory framework in which TOCs
operate. We then provide a brief overview of the development of TOCs’ performance, before we discuss in
more detail the change in their revenues and costs over the last decade.
Regulatory framework of franchised passenger TOCs
Pre-Privatisation
2.2 Before 1993, Britain’s integrated railway was operated and maintained by British Rail, which was
responsible for both the planning and delivery of passenger operations. The 1993 Railways Act sought to
privatise the British railway industry; in doing so, it split responsibility for delivery of passenger rail services
from the management and maintenance of infrastructure.
2.3 The privatisation of passenger train operations began with the re-organisation of British Rail’s
passenger rail operations into 25 separate, publicly owned franchises. The newly created Office of
Passenger Rail Franchising was then given the responsibility for selling these franchises to privately owned
Train Operating Companies (TOCs). Although the bidding process and contract specificity have changed
over the years, this model remains broadly the same today.
2.4 The rolling stock that was previously operated by British Rail was sold to three Rolling Stock Operating
Companies (ROSCOs). The TOCs continue to lease the majority of passenger trains from ROSCOs, who
are typically also responsible for heavy maintenance; the relatively short life of franchises generally makes
investment in rolling stock assets unattractive to train operators.
Franchised Passenger Operations
2.5 The aim of franchising is to promote competition “for the market”19, with a view to ensuring that each
contract is awarded to the operator that can carry out the activities most efficiently. The principle of the
franchise bidding process is that competition in service offerings ought to exert competitive pressures on all
19 TOCs compete to operate the franchise on an (almost) exclusive basis (some TOCs compete with a limited number of open access operators)
Office of Rail Regulation | November 2012 | Costs and Revenues of UK Passenger Train Operations 16 3219817
participants, thereby mimicking the effects of a competitive market and promoting efficiency. It is worth
noting that there is also some “in the market” competition, where open access operators compete on a
commercial basis, as well as between TOCs on some routes. However, the extent of such competition is
limited; for instance, open access operators accounted for only 0.7% of total passenger kilometres in 2010-
11. As well as “on rail” competition, TOCs also compete, to a greater or lesser extent depending on the
nature of their service, with other “off rail” modes of transport.
2.6 In 2001 the responsibility for allocating franchises moved to the newly created Strategic Rail Authority
and in 2006 it was moved again to the DfT, with whom it currently resides (specific franchises are also
allocated by Transport Scotland (First ScotRail), the Welsh Government (Arriva Trains Wales),
MerseyTravel PTE (MerseyRail) and Transport for London (London Overground)) . Passenger franchise
contracts are awarded to TOCs through a competitive tendering process. There is a range of franchise
durations, but they typically last for up to seven years, although the DfT is now moving towards awarding
longer franchise contracts, up to 15 years. Automatic extensions can be available if the TOC meets certain
performance targets. DfT’s invitations to tender include “Service Level Commitments” (SLCs) that define
the services that the successful bidder must provide. SLCs are specified to a relatively high degree of
detail. For example, they include detailed specifications of train frequencies and stopping patterns.
2.7 TOCs service quality is closely monitored with reference to a Service Quality Management System.
Because of the level of specificity of the SLCs (and the frequent unviability of some of the commitments),
TOCs are required to specify the level of subsidy they expect to receive as part of their bid. It has,
however, become more common in recent years for TOCs to specify instead the size of the premium they
expect to pay to the franchise authorities, this has occurred chiefly as a result of increased passenger
demand for rail travel. The franchise authorities evaluates the subsidy/premium along with the service
offering as part of the overall franchise bid for each TOC.
2.8 The subsidy/premium paid by TOCs, considered in isolation, can misrepresent the degree to which the
industry as a whole is subsidised: DfT and TS pay a grant to Network Rail which dwarves the levels of
subsidies and premia paid to/by TOCs, and were Network Rail to stop receiving this grant they would be
TOCs would face much higher access charges and would require much larger subsidies to make the
provision of passenger rail services viable.
2.9 TOCs tend to be thinly-capitalised companies with few assets and relatively little ability to bear
downside risk (the risk involved in higher than expected costs or lower than expected revenues). To help
manage this issue, revenue risk-sharing mechanisms were introduced into franchise contracts. Although
bidders could propose their own design for revenue risk-sharing mechanisms, a standard model emerged,
commonly referred to as a “cap and collar” mechanism, which typically activates four years into the life of a
franchise. The main features of a typical cap and collar are that, where the franchise is contracted with the
DfT:
Office of Rail Regulation | November 2012 | Costs and Revenues of UK Passenger Train Operations 17 3219817
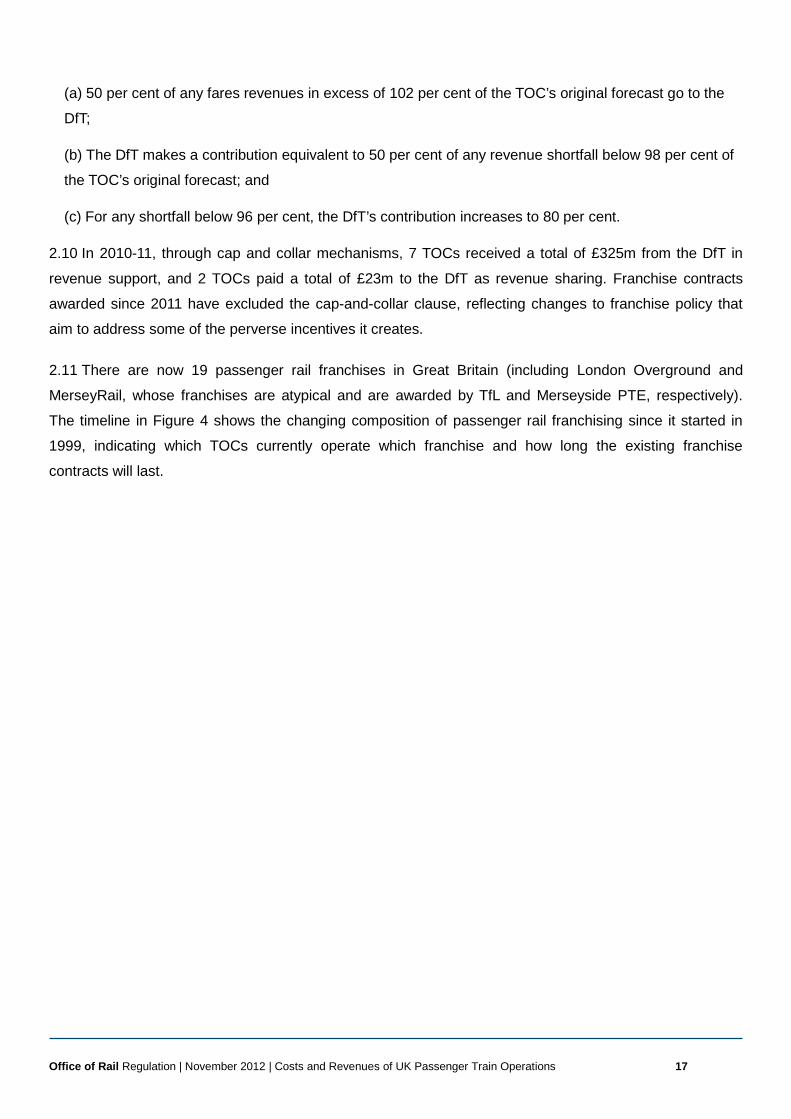
(a) 50 per cent of any fares revenues in excess of 102 per cent of the TOC’s original forecast go to the
DfT;
(b) The DfT makes a contribution equivalent to 50 per cent of any revenue shortfall below 98 per cent of
the TOC’s original forecast; and
(c) For any shortfall below 96 per cent, the DfT’s contribution increases to 80 per cent.
2.10 In 2010-11, through cap and collar mechanisms, 7 TOCs received a total of £325m from the DfT in
revenue support, and 2 TOCs paid a total of £23m to the DfT as revenue sharing. Franchise contracts
awarded since 2011 have excluded the cap-and-collar clause, reflecting changes to franchise policy that
aim to address some of the perverse incentives it creates.
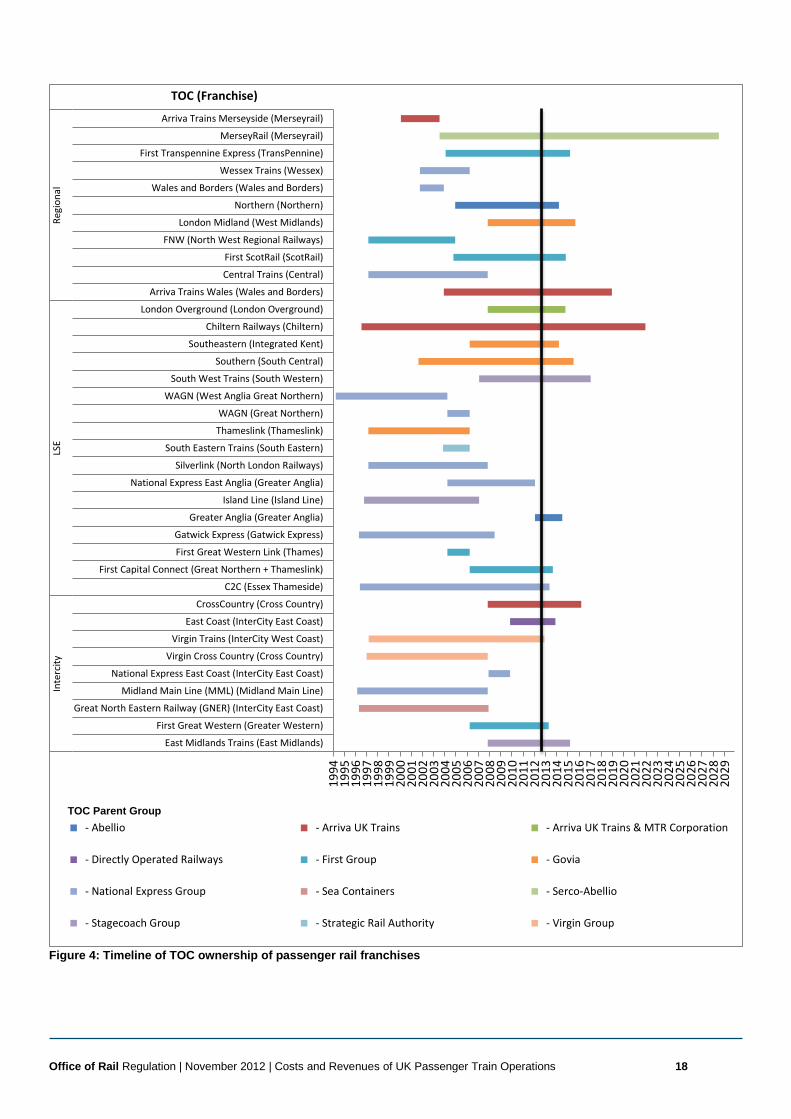
2.11 There are now 19 passenger rail franchises in Great Britain (including London Overground and
MerseyRail, whose franchises are atypical and are awarded by TfL and Merseyside PTE, respectively).
The timeline in Figure 4 shows the changing composition of passenger rail franchising since it started in
1999, indicating which TOCs currently operate which franchise and how long the existing franchise
contracts will last.
Office of Rail Regulation | November 2012 | Costs and Revenues of UK Passenger Train Operations 18 3219817
Figure 4: Timeline of TOC ownership of passenger rail franchises
1994
1995
1996
1997
1998
1999
2000
2001
2002
2003
2004
2005
2006
2007
2008
2009
2010
2011
2012
2013
2014
2015
2016
2017
2018
2019
2020
2021
2022
2023
2024
2025
2026
2027
2028
2029
East Midlands Trains (East Midlands)
First Great Western (Greater Western)
Great North Eastern Railway (GNER) (InterCity East Coast)
Midland Main Line (MML) (Midland Main Line)
National Express East Coast (InterCity East Coast)
Virgin Cross Country (Cross Country)
Virgin Trains (InterCity West Coast)
East Coast (InterCity East Coast)
CrossCountry (Cross Country)
C2C (Essex Thameside)
First Capital Connect (Great Northern + Thameslink)
First Great Western Link (Thames)
Gatwick Express (Gatwick Express)
Greater Anglia (Greater Anglia)
Island Line (Island Line)
National Express East Anglia (Greater Anglia)
Silverlink (North London Railways)
South Eastern Trains (South Eastern)
Thameslink (Thameslink)
WAGN (Great Northern)
WAGN (West Anglia Great Northern)
South West Trains (South Western)
Southern (South Central)
Southeastern (Integrated Kent)
Chiltern Railways (Chiltern)
London Overground (London Overground)
Arriva Trains Wales (Wales and Borders)
Central Trains (Central)
First ScotRail (ScotRail)
FNW (North West Regional Railways)
London Midland (West Midlands)
Northern (Northern)
Wales and Borders (Wales and Borders)
Wessex Trains (Wessex)
First Transpennine Express (TransPennine)
MerseyRail (Merseyrail)
Arriva Trains Merseyside (Merseyrail)
Inte
rcity
LSE
Regi
onal
TOC (Franchise)
- Abellio - Arriva UK Trains - Arriva UK Trains & MTR Corporation
- Directly Operated Railways - First Group - Govia
- National Express Group - Sea Containers - Serco-Abellio
- Stagecoach Group - Strategic Rail Authority - Virgin Group
TOC Parent Group
Office of Rail Regulation | November 2012 | Costs and Revenues of UK Passenger Train Operations 19 3219817
Government Support
2.12 Before focussing on the evolution of revenues, costs and subsidies of TOCs in isolation, it is important
that they should be considered in the context of government support as a whole.
2.13 Subsidies paid directly to TOCs have fallen significantly between the 2000-01 and 2011-12 financial
years. However, this does not capture the much larger increase in the network grant paid by DfT and TS to
Network Rail during the same period. Since, in the absence of the network grant, Network Rail would have
to recoup much of the cost of running the rail network from TOCs, at least part of the grant can be
considered to be an indirect subsidy to TOCs (effectively reducing the price they pay for access to the rail
network).
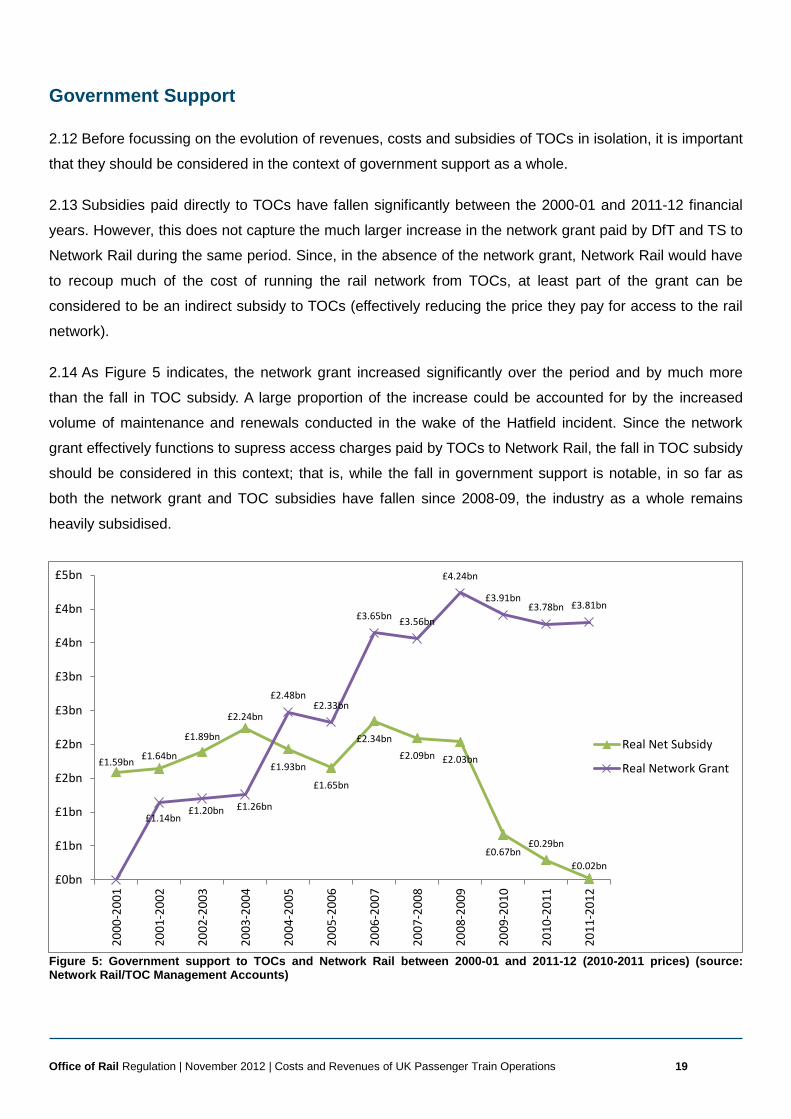
2.14 As Figure 5 indicates, the network grant increased significantly over the period and by much more
than the fall in TOC subsidy. A large proportion of the increase could be accounted for by the increased
volume of maintenance and renewals conducted in the wake of the Hatfield incident. Since the network
grant effectively functions to supress access charges paid by TOCs to Network Rail, the fall in TOC subsidy
should be considered in this context; that is, while the fall in government support is notable, in so far as
both the network grant and TOC subsidies have fallen since 2008-09, the industry as a whole remains
heavily subsidised.
Figure 5: Government support to TOCs and Network Rail between 2000-01 and 2011-12 (2010-2011 prices) (source: Network Rail/TOC Management Accounts)
£1.59bn £1.64bn
£1.89bn
£2.24bn
£1.93bn
£1.65bn
£2.34bn £2.09bn £2.03bn
£0.67bn £0.29bn
£0.02bn
£1.14bn £1.20bn £1.26bn
£2.48bn £2.33bn
£3.65bn £3.56bn
£4.24bn
£3.91bn £3.78bn £3.81bn
£0bn
£1bn
£1bn
£2bn
£2bn
£3bn
£3bn
£4bn
£4bn
£5bn
2000
-200
1
2001
-200
2
2002
-200
3
2003
-200
4
2004
-200
5
2005
-200
6
2006
-200
7
2007
-200
8
2008
-200
9
2009
-201
0
2010
-201
1
2011
-201
2
Real Net Subsidy
Real Network Grant
Office of Rail Regulation | November 2012 | Costs and Revenues of UK Passenger Train Operations 20 3219817
2.15 To put the level of government support in context it is useful to look at the relationship between costs,
revenues, direct TOC subsidies and the network grant. It is important to note that the network grant may
also cover the effects of inefficiencies in Network Rail and that if it were to be removed both freight and
open access operators would also face higher access charges (i.e. the entire reduction in the network grant
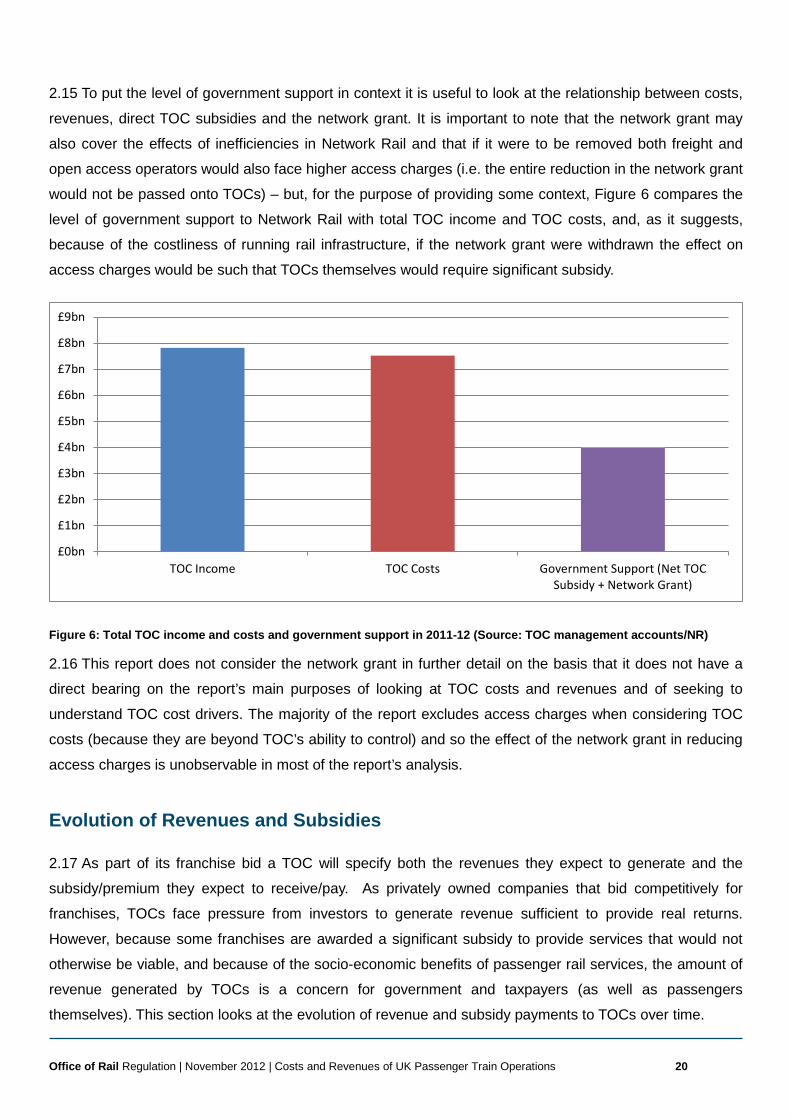
would not be passed onto TOCs) – but, for the purpose of providing some context, Figure 6 compares the
level of government support to Network Rail with total TOC income and TOC costs, and, as it suggests,
because of the costliness of running rail infrastructure, if the network grant were withdrawn the effect on
access charges would be such that TOCs themselves would require significant subsidy.
Figure 6: Total TOC income and costs and government support in 2011-12 (Source: TOC management accounts/NR)
2.16 This report does not consider the network grant in further detail on the basis that it does not have a
direct bearing on the report’s main purposes of looking at TOC costs and revenues and of seeking to
understand TOC cost drivers. The majority of the report excludes access charges when considering TOC
costs (because they are beyond TOC’s ability to control) and so the effect of the network grant in reducing
access charges is unobservable in most of the report’s analysis.
Evolution of Revenues and Subsidies
2.17 As part of its franchise bid a TOC will specify both the revenues they expect to generate and the
subsidy/premium they expect to receive/pay. As privately owned companies that bid competitively for
franchises, TOCs face pressure from investors to generate revenue sufficient to provide real returns.
However, because some franchises are awarded a significant subsidy to provide services that would not
otherwise be viable, and because of the socio-economic benefits of passenger rail services, the amount of
revenue generated by TOCs is a concern for government and taxpayers (as well as passengers
themselves). This section looks at the evolution of revenue and subsidy payments to TOCs over time.
£0bn
£1bn
£2bn
£3bn
£4bn
£5bn
£6bn
£7bn
£8bn
£9bn
TOC Income TOC Costs Government Support (Net TOCSubsidy + Network Grant)
Office of Rail Regulation | November 2012 | Costs and Revenues of UK Passenger Train Operations 21 3219817
2.18 Data limitations have prevented the inclusion of London Overground in any of the historical revenue
and subsidy analysis included in this section.
Revenues
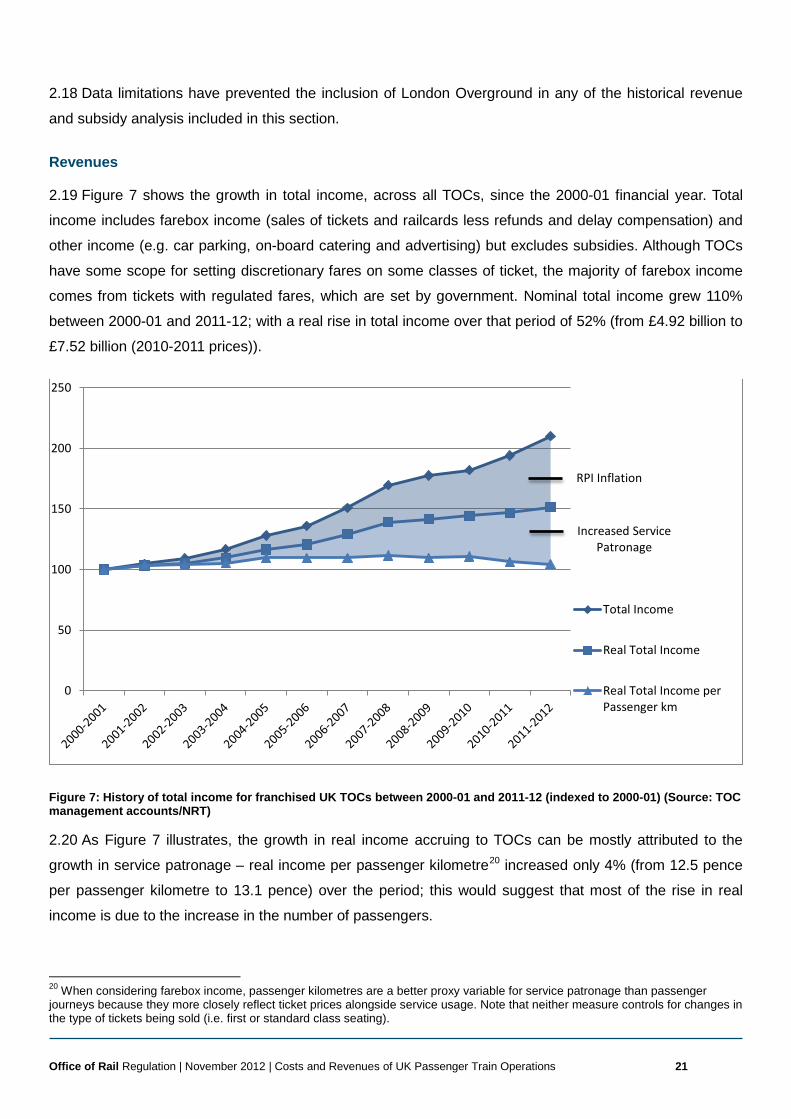
2.19 Figure 7 shows the growth in total income, across all TOCs, since the 2000-01 financial year. Total
income includes farebox income (sales of tickets and railcards less refunds and delay compensation) and
other income (e.g. car parking, on-board catering and advertising) but excludes subsidies. Although TOCs
have some scope for setting discretionary fares on some classes of ticket, the majority of farebox income
comes from tickets with regulated fares, which are set by government. Nominal total income grew 110%
between 2000-01 and 2011-12; with a real rise in total income over that period of 52% (from £4.92 billion to
£7.52 billion (2010-2011 prices)).
Figure 7: History of total income for franchised UK TOCs between 2000-01 and 2011-12 (indexed to 2000-01) (Source: TOC management accounts/NRT)
2.20 As Figure 7 illustrates, the growth in real income accruing to TOCs can be mostly attributed to the
growth in service patronage – real income per passenger kilometre20 increased only 4% (from 12.5 pence
per passenger kilometre to 13.1 pence) over the period; this would suggest that most of the rise in real
income is due to the increase in the number of passengers.
20 When considering farebox income, passenger kilometres are a better proxy variable for service patronage than passenger journeys because they more closely reflect ticket prices alongside service usage. Note that neither measure controls for changes in the type of tickets being sold (i.e. first or standard class seating).
RPI Inflation
Increased Service Patronage
0
50
100
150
200
250
Total Income
Real Total Income
Real Total Income perPassenger km
Office of Rail Regulation | November 2012 | Costs and Revenues of UK Passenger Train Operations 22 3219817
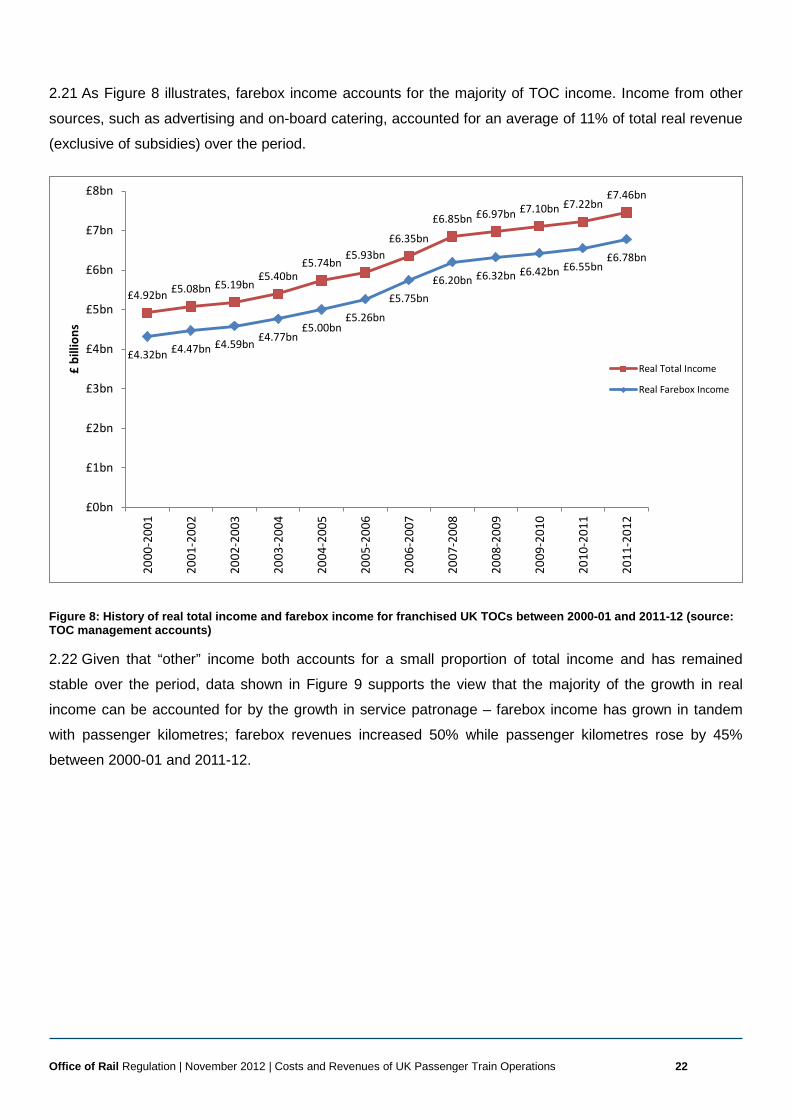
2.21 As Figure 8 illustrates, farebox income accounts for the majority of TOC income. Income from other
sources, such as advertising and on-board catering, accounted for an average of 11% of total real revenue
(exclusive of subsidies) over the period.
Figure 8: History of real total income and farebox income for franchised UK TOCs between 2000-01 and 2011-12 (source: TOC management accounts)
2.22 Given that “other” income both accounts for a small proportion of total income and has remained
stable over the period, data shown in Figure 9 supports the view that the majority of the growth in real
income can be accounted for by the growth in service patronage – farebox income has grown in tandem
with passenger kilometres; farebox revenues increased 50% while passenger kilometres rose by 45%
between 2000-01 and 2011-12.
£4.92bn £5.08bn £5.19bn £5.40bn
£5.74bn £5.93bn
£6.35bn
£6.85bn £6.97bn £7.10bn £7.22bn £7.46bn
£4.32bn £4.47bn £4.59bn £4.77bn £5.00bn
£5.26bn
£5.75bn £6.20bn £6.32bn £6.42bn £6.55bn
£6.78bn
£0bn
£1bn
£2bn
£3bn
£4bn
£5bn
£6bn
£7bn
£8bn
2000
-200
1
2001
-200
2
2002
-200
3
2003
-200
4
2004
-200
5
2005
-200
6
2006
-200
7
2007
-200
8
2008
-200
9
2009
-201
0
2010
-201
1
2011
-201
2
£ bi
llion
s
Real Total Income
Real Farebox Income
Office of Rail Regulation | November 2012 | Costs and Revenues of UK Passenger Train Operations 23 3219817
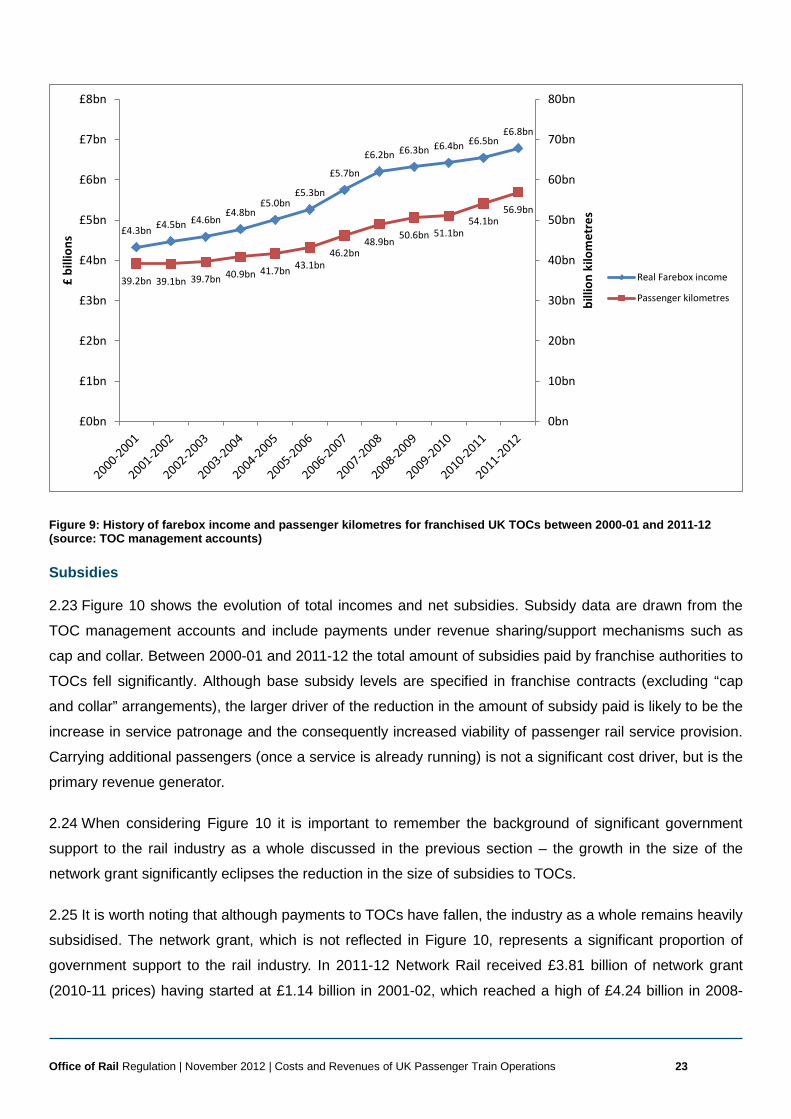
Figure 9: History of farebox income and passenger kilometres for franchised UK TOCs between 2000-01 and 2011-12 (source: TOC management accounts)
Subsidies
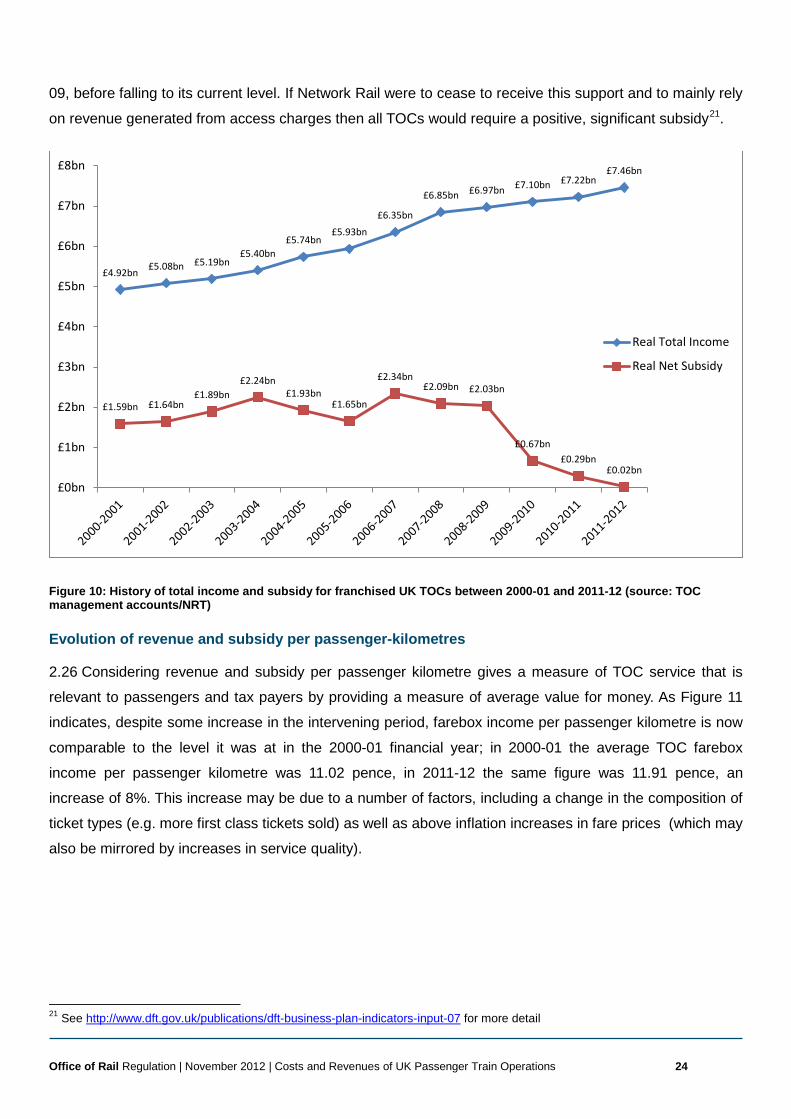
2.23 Figure 10 shows the evolution of total incomes and net subsidies. Subsidy data are drawn from the
TOC management accounts and include payments under revenue sharing/support mechanisms such as
cap and collar. Between 2000-01 and 2011-12 the total amount of subsidies paid by franchise authorities to
TOCs fell significantly. Although base subsidy levels are specified in franchise contracts (excluding “cap
and collar” arrangements), the larger driver of the reduction in the amount of subsidy paid is likely to be the
increase in service patronage and the consequently increased viability of passenger rail service provision.
Carrying additional passengers (once a service is already running) is not a significant cost driver, but is the
primary revenue generator.
2.24 When considering Figure 10 it is important to remember the background of significant government
support to the rail industry as a whole discussed in the previous section – the growth in the size of the
network grant significantly eclipses the reduction in the size of subsidies to TOCs.
2.25 It is worth noting that although payments to TOCs have fallen, the industry as a whole remains heavily
subsidised. The network grant, which is not reflected in Figure 10, represents a significant proportion of
government support to the rail industry. In 2011-12 Network Rail received £3.81 billion of network grant
(2010-11 prices) having started at £1.14 billion in 2001-02, which reached a high of £4.24 billion in 2008-
£4.3bn £4.5bn £4.6bn £4.8bn
£5.0bn £5.3bn
£5.7bn
£6.2bn £6.3bn £6.4bn £6.5bn £6.8bn
39.2bn 39.1bn 39.7bn 40.9bn 41.7bn 43.1bn 46.2bn
48.9bn 50.6bn 51.1bn
54.1bn 56.9bn
0bn
10bn
20bn
30bn
40bn
50bn
60bn
70bn
80bn
£0bn
£1bn
£2bn
£3bn
£4bn
£5bn
£6bn
£7bn
£8bn
billi
on k
ilom
etre
s
£ bi
llion
s
Real Farebox income
Passenger kilometres
Office of Rail Regulation | November 2012 | Costs and Revenues of UK Passenger Train Operations 24 3219817
09, before falling to its current level. If Network Rail were to cease to receive this support and to mainly rely
on revenue generated from access charges then all TOCs would require a positive, significant subsidy21.
Figure 10: History of total income and subsidy for franchised UK TOCs between 2000-01 and 2011-12 (source: TOC management accounts/NRT)
Evolution of revenue and subsidy per passenger-kilometres
2.26 Considering revenue and subsidy per passenger kilometre gives a measure of TOC service that is
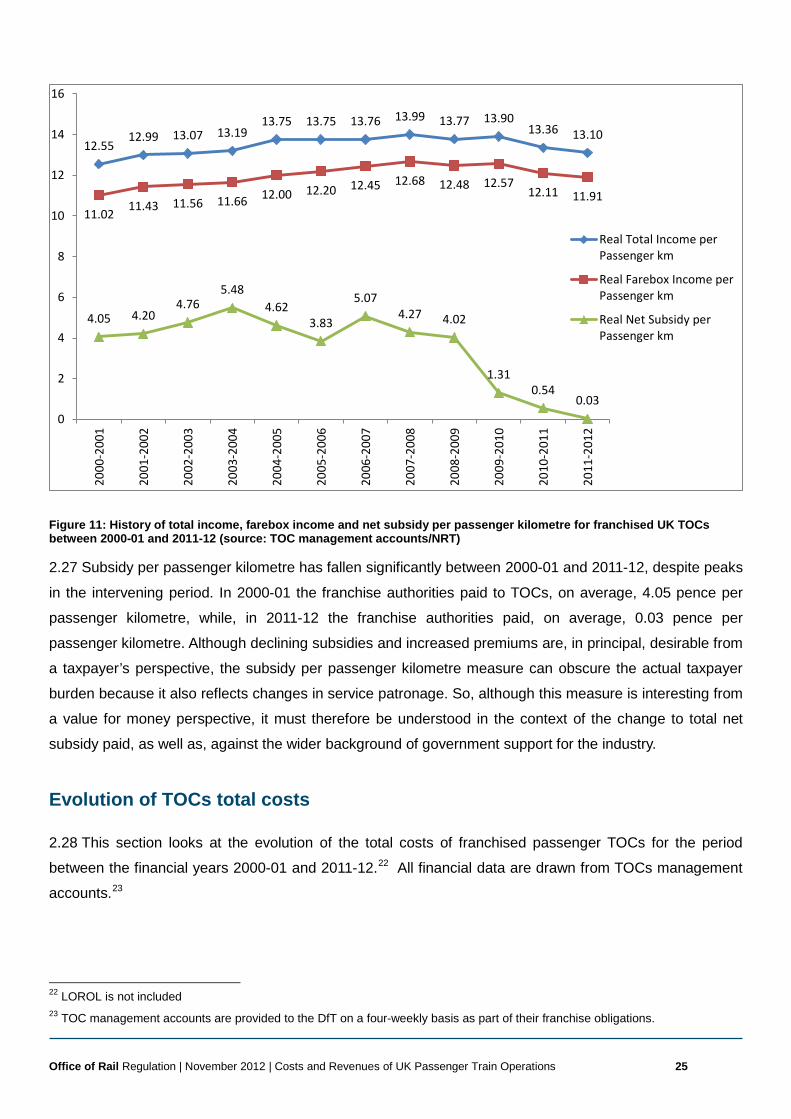
relevant to passengers and tax payers by providing a measure of average value for money. As Figure 11
indicates, despite some increase in the intervening period, farebox income per passenger kilometre is now
comparable to the level it was at in the 2000-01 financial year; in 2000-01 the average TOC farebox
income per passenger kilometre was 11.02 pence, in 2011-12 the same figure was 11.91 pence, an
increase of 8%. This increase may be due to a number of factors, including a change in the composition of
ticket types (e.g. more first class tickets sold) as well as above inflation increases in fare prices (which may
also be mirrored by increases in service quality).
21 See http://www.dft.gov.uk/publications/dft-business-plan-indicators-input-07 for more detail
£4.92bn £5.08bn £5.19bn £5.40bn
£5.74bn £5.93bn
£6.35bn
£6.85bn £6.97bn £7.10bn £7.22bn £7.46bn
£1.59bn £1.64bn £1.89bn
£2.24bn £1.93bn
£1.65bn
£2.34bn £2.09bn £2.03bn
£0.67bn £0.29bn
£0.02bn
£0bn
£1bn
£2bn
£3bn
£4bn
£5bn
£6bn
£7bn
£8bn
Real Total Income
Real Net Subsidy
Office of Rail Regulation | November 2012 | Costs and Revenues of UK Passenger Train Operations 25 3219817
Figure 11: History of total income, farebox income and net subsidy per passenger kilometre for franchised UK TOCs between 2000-01 and 2011-12 (source: TOC management accounts/NRT)
2.27 Subsidy per passenger kilometre has fallen significantly between 2000-01 and 2011-12, despite peaks
in the intervening period. In 2000-01 the franchise authorities paid to TOCs, on average, 4.05 pence per
passenger kilometre, while, in 2011-12 the franchise authorities paid, on average, 0.03 pence per
passenger kilometre. Although declining subsidies and increased premiums are, in principal, desirable from
a taxpayer’s perspective, the subsidy per passenger kilometre measure can obscure the actual taxpayer
burden because it also reflects changes in service patronage. So, although this measure is interesting from
a value for money perspective, it must therefore be understood in the context of the change to total net
subsidy paid, as well as, against the wider background of government support for the industry.
Evolution of TOCs total costs
2.28 This section looks at the evolution of the total costs of franchised passenger TOCs for the period
between the financial years 2000-01 and 2011-12.22 All financial data are drawn from TOCs management
accounts.23
22 LOROL is not included 23 TOC management accounts are provided to the DfT on a four-weekly basis as part of their franchise obligations.
12.55 12.99 13.07 13.19
13.75 13.75 13.76 13.99 13.77 13.90 13.36 13.10
11.02 11.43 11.56 11.66 12.00 12.20 12.45 12.68 12.48 12.57 12.11 11.91
4.05 4.20 4.76
5.48 4.62
3.83
5.07 4.27 4.02
1.31 0.54
0.03 0
2
4
6
8
10
12
14
1620
00-2
001
2001
-200
2
2002
-200
3
2003
-200
4
2004
-200
5
2005
-200
6
2006
-200
7
2007
-200
8
2008
-200
9
2009
-201
0
2010
-201
1
2011
-201
2
Real Total Income perPassenger km
Real Farebox Income perPassenger km
Real Net Subsidy perPassenger km
Office of Rail Regulation | November 2012 | Costs and Revenues of UK Passenger Train Operations 26 3219817
Composition of TOCs total costs
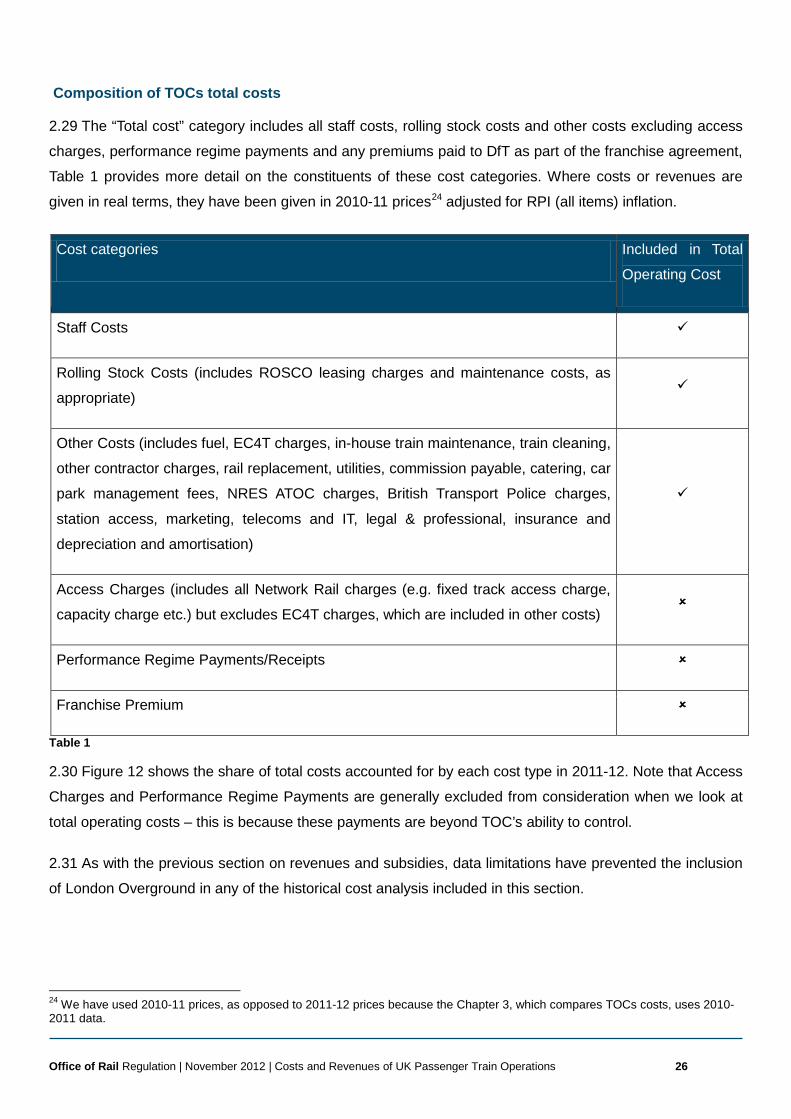
2.29 The “Total cost” category includes all staff costs, rolling stock costs and other costs excluding access
charges, performance regime payments and any premiums paid to DfT as part of the franchise agreement,
Table 1 provides more detail on the constituents of these cost categories. Where costs or revenues are
given in real terms, they have been given in 2010-11 prices24 adjusted for RPI (all items) inflation.
Cost categories Included in Total
Operating Cost
Staff Costs
Rolling Stock Costs (includes ROSCO leasing charges and maintenance costs, as
appropriate)
Other Costs (includes fuel, EC4T charges, in-house train maintenance, train cleaning,
other contractor charges, rail replacement, utilities, commission payable, catering, car
park management fees, NRES ATOC charges, British Transport Police charges,
station access, marketing, telecoms and IT, legal & professional, insurance and
depreciation and amortisation)
Access Charges (includes all Network Rail charges (e.g. fixed track access charge,
capacity charge etc.) but excludes EC4T charges, which are included in other costs)
Performance Regime Payments/Receipts
Franchise Premium
Table 1
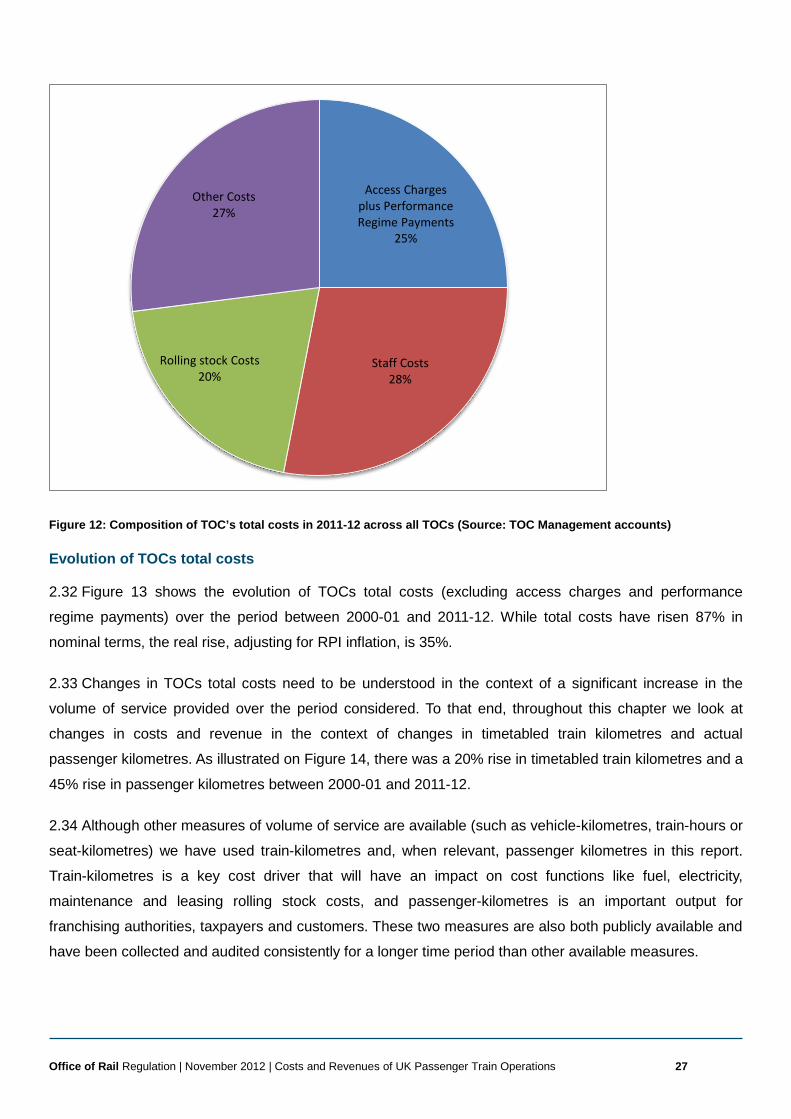
2.30 Figure 12 shows the share of total costs accounted for by each cost type in 2011-12. Note that Access
Charges and Performance Regime Payments are generally excluded from consideration when we look at
total operating costs – this is because these payments are beyond TOC’s ability to control.
2.31 As with the previous section on revenues and subsidies, data limitations have prevented the inclusion
of London Overground in any of the historical cost analysis included in this section.
24 We have used 2010-11 prices, as opposed to 2011-12 prices because the Chapter 3, which compares TOCs costs, uses 2010-2011 data.
Office of Rail Regulation | November 2012 | Costs and Revenues of UK Passenger Train Operations 27 3219817
Figure 12: Composition of TOC’s total costs in 2011-12 across all TOCs (Source: TOC Management accounts)
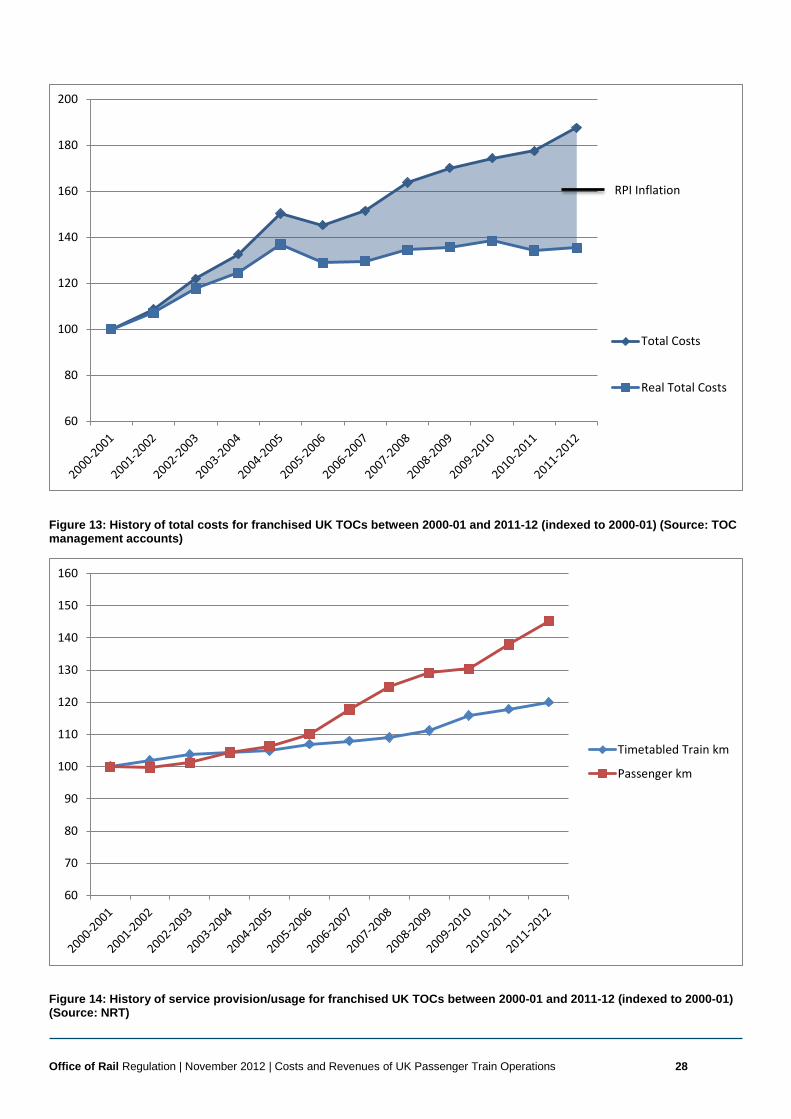
Evolution of TOCs total costs
2.32 Figure 13 shows the evolution of TOCs total costs (excluding access charges and performance
regime payments) over the period between 2000-01 and 2011-12. While total costs have risen 87% in
nominal terms, the real rise, adjusting for RPI inflation, is 35%.
2.33 Changes in TOCs total costs need to be understood in the context of a significant increase in the
volume of service provided over the period considered. To that end, throughout this chapter we look at
changes in costs and revenue in the context of changes in timetabled train kilometres and actual
passenger kilometres. As illustrated on Figure 14, there was a 20% rise in timetabled train kilometres and a
45% rise in passenger kilometres between 2000-01 and 2011-12.
2.34 Although other measures of volume of service are available (such as vehicle-kilometres, train-hours or
seat-kilometres) we have used train-kilometres and, when relevant, passenger kilometres in this report.
Train-kilometres is a key cost driver that will have an impact on cost functions like fuel, electricity,
maintenance and leasing rolling stock costs, and passenger-kilometres is an important output for
franchising authorities, taxpayers and customers. These two measures are also both publicly available and
have been collected and audited consistently for a longer time period than other available measures.
Access Charges plus Performance Regime Payments
25%
Staff Costs 28%
Rolling stock Costs 20%
Other Costs 27%
Office of Rail Regulation | November 2012 | Costs and Revenues of UK Passenger Train Operations 28 3219817
Figure 13: History of total costs for franchised UK TOCs between 2000-01 and 2011-12 (indexed to 2000-01) (Source: TOC management accounts)
Figure 14: History of service provision/usage for franchised UK TOCs between 2000-01 and 2011-12 (indexed to 2000-01) (Source: NRT)
RPI Inflation
60
80
100
120
140
160
180
200
Total Costs
Real Total Costs
60
70
80
90
100
110
120
130
140
150
160
Timetabled Train km
Passenger km
Office of Rail Regulation | November 2012 | Costs and Revenues of UK Passenger Train Operations 29 3219817
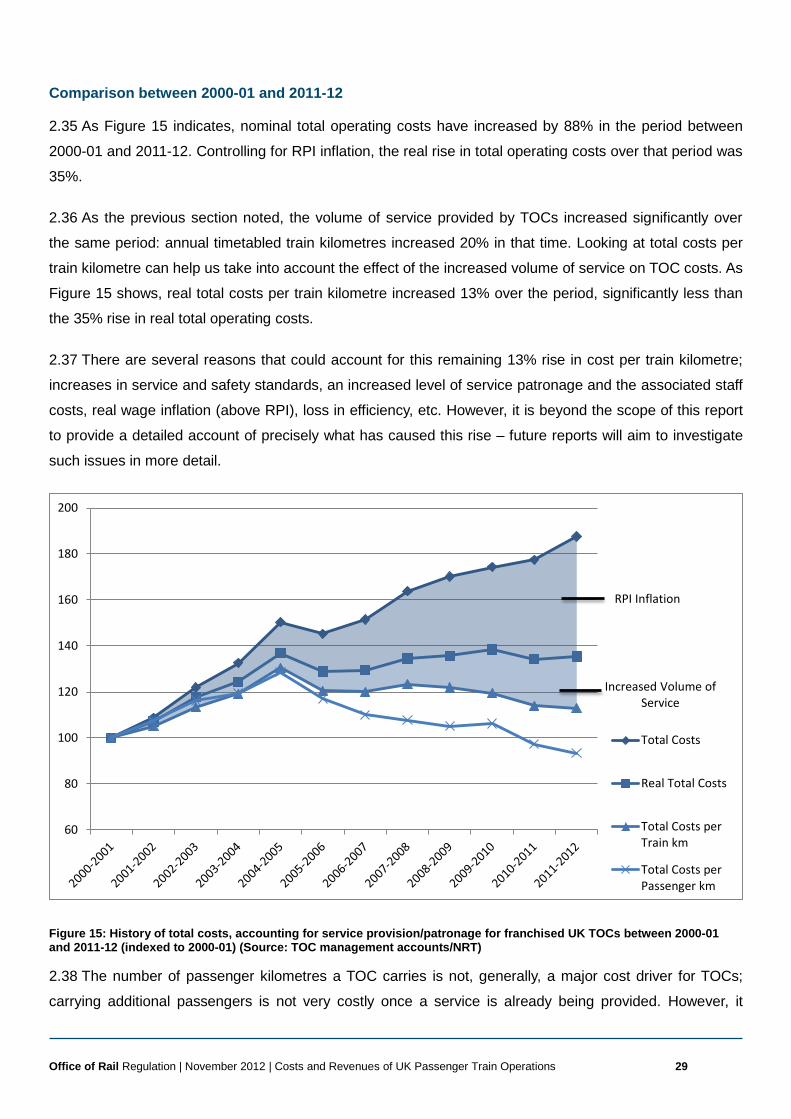
Comparison between 2000-01 and 2011-12
2.35 As Figure 15 indicates, nominal total operating costs have increased by 88% in the period between
2000-01 and 2011-12. Controlling for RPI inflation, the real rise in total operating costs over that period was
35%.
2.36 As the previous section noted, the volume of service provided by TOCs increased significantly over
the same period: annual timetabled train kilometres increased 20% in that time. Looking at total costs per
train kilometre can help us take into account the effect of the increased volume of service on TOC costs. As
Figure 15 shows, real total costs per train kilometre increased 13% over the period, significantly less than
the 35% rise in real total operating costs.
2.37 There are several reasons that could account for this remaining 13% rise in cost per train kilometre;
increases in service and safety standards, an increased level of service patronage and the associated staff
costs, real wage inflation (above RPI), loss in efficiency, etc. However, it is beyond the scope of this report
to provide a detailed account of precisely what has caused this rise – future reports will aim to investigate
such issues in more detail.
Figure 15: History of total costs, accounting for service provision/patronage for franchised UK TOCs between 2000-01 and 2011-12 (indexed to 2000-01) (Source: TOC management accounts/NRT)
2.38 The number of passenger kilometres a TOC carries is not, generally, a major cost driver for TOCs;
carrying additional passengers is not very costly once a service is already being provided. However, it
RPI Inflation
Increased Volume of Service
60
80
100
120
140
160
180
200
Total Costs
Real Total Costs
Total Costs perTrain km
Total Costs perPassenger km
Office of Rail Regulation | November 2012 | Costs and Revenues of UK Passenger Train Operations 30 3219817
should be noted that a significant increase in passenger demand could cause the addition of extra
carriages or the provision of additional services, in which case the consequent cost increase would be
significant.
2.39 Despite the less than direct effect on costs of changes in passenger kilometres, it is useful from the
perspective of passengers and taxpayers to consider total operating costs per passenger kilometre – this
gives an indication of how much, on average, it costs a TOC to move a passenger one kilometre. In 2011-
12 the average cost of moving one passenger one kilometre was 8.9 pence, a 12% reduction from the
2000-01 value of 10.1 pence. Although falling costs per passenger kilometre are generally desirable, this
fall cannot be taken to indicate efficiency gains due to the large increase in passenger numbers over the
period.
Trend analysis
2.40 Figure 15 shows three distinct periods in the evolution of TOC total costs, from 2000-01 to 2004-05,
2004-05 to 2006-07 and 2006-07 to now.
2.41 During the 2000-01 to 2004-05 period, real total operating costs increased sharply. Between 2000-01
and 2002-03, there was an increase of 35% in real terms – in only three years – without a very significant
increase in the volume of service provided. This reflects sharp increases in staff, rolling stock and energy
costs over this period. The incident at Hatfield in October 2000, which led to significantly reduced network
speeds (through the introduction of temporary speed restrictions intended to allow a programme of
thorough track safety inspections), may explain the escalation of cost in the absence of significant capacity
increases.
2.42 Real total costs decreased by 15 percentage points from 2004-05 to 2006-07. This corresponds to a
period where many TOCs were at the end of their franchise contracts and possibly wound down their
activities and spending at that time. TOCs costs increased again between 2006-07 and 2009-10 as some
TOCs were starting their franchise contracts before decreasing between 2009-10 and 2011-12.
Evolution of staff, rolling stock and energy costs
2.43 To understand better the changing composition of train operators’ costs, it is useful to look at their
main cost categories: rolling stock costs, staff costs and other operating costs (such as marketing,
insurance, depreciation etc.) as defined in Table 1 at the beginning of this chapter.
2.44 It is important to note that TOCs might record similar types of expenditure in different lines within their
management accounts. Also, depending on their leasing arrangements, TOCs may record rolling stock
maintenance costs as part of their rolling stock leasing costs or, if they carry out their maintenance in-
house, as part of their staff or “other” costs. Due to these potential differences, we only use these
Office of Rail Regulation | November 2012 | Costs and Revenues of UK Passenger Train Operations 31 3219817
categories (rolling stock, staff and other costs) to provide an overall picture of train operators’ main types of
expenditure and the rough proportion of expenditure accounted for by each.
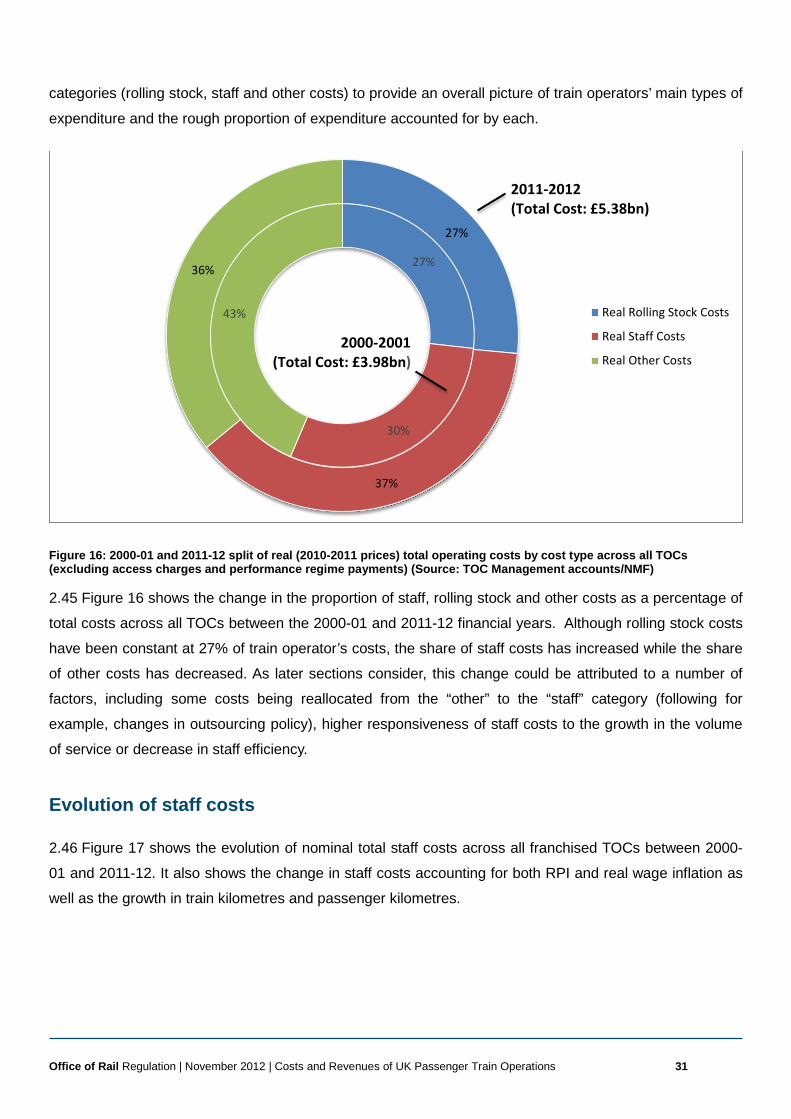
Figure 16: 2000-01 and 2011-12 split of real (2010-2011 prices) total operating costs by cost type across all TOCs (excluding access charges and performance regime payments) (Source: TOC Management accounts/NMF)
2.45 Figure 16 shows the change in the proportion of staff, rolling stock and other costs as a percentage of
total costs across all TOCs between the 2000-01 and 2011-12 financial years. Although rolling stock costs
have been constant at 27% of train operator’s costs, the share of staff costs has increased while the share
of other costs has decreased. As later sections consider, this change could be attributed to a number of
factors, including some costs being reallocated from the “other” to the “staff” category (following for
example, changes in outsourcing policy), higher responsiveness of staff costs to the growth in the volume
of service or decrease in staff efficiency.
Evolution of staff costs
2.46 Figure 17 shows the evolution of nominal total staff costs across all franchised TOCs between 2000-
01 and 2011-12. It also shows the change in staff costs accounting for both RPI and real wage inflation as
well as the growth in train kilometres and passenger kilometres.
27%
30%
43%
27%
37%
36%
Real Rolling Stock Costs
Real Staff Costs
Real Other Costs
2011-2012 (Total Cost: £5.38bn)
2000-2001 (Total Cost: £3.98bn)
Office of Rail Regulation | November 2012 | Costs and Revenues of UK Passenger Train Operations 32 3219817
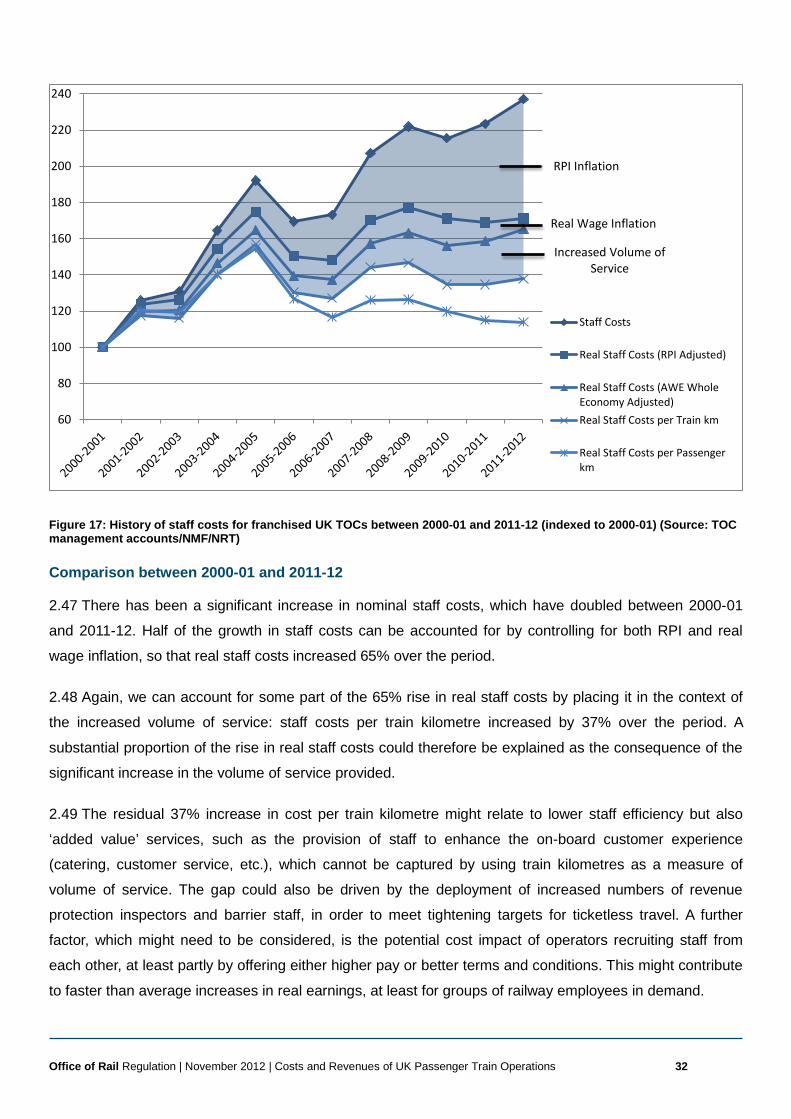
Figure 17: History of staff costs for franchised UK TOCs between 2000-01 and 2011-12 (indexed to 2000-01) (Source: TOC management accounts/NMF/NRT)
Comparison between 2000-01 and 2011-12
2.47 There has been a significant increase in nominal staff costs, which have doubled between 2000-01
and 2011-12. Half of the growth in staff costs can be accounted for by controlling for both RPI and real
wage inflation, so that real staff costs increased 65% over the period.
2.48 Again, we can account for some part of the 65% rise in real staff costs by placing it in the context of
the increased volume of service: staff costs per train kilometre increased by 37% over the period. A
substantial proportion of the rise in real staff costs could therefore be explained as the consequence of the
significant increase in the volume of service provided.
2.49 The residual 37% increase in cost per train kilometre might relate to lower staff efficiency but also
‘added value’ services, such as the provision of staff to enhance the on-board customer experience
(catering, customer service, etc.), which cannot be captured by using train kilometres as a measure of
volume of service. The gap could also be driven by the deployment of increased numbers of revenue
protection inspectors and barrier staff, in order to meet tightening targets for ticketless travel. A further
factor, which might need to be considered, is the potential cost impact of operators recruiting staff from
each other, at least partly by offering either higher pay or better terms and conditions. This might contribute
to faster than average increases in real earnings, at least for groups of railway employees in demand.
RPI Inflation
Real Wage Inflation
Increased Volume of Service
60
80
100
120
140
160
180
200
220
240
Staff Costs
Real Staff Costs (RPI Adjusted)
Real Staff Costs (AWE WholeEconomy Adjusted)Real Staff Costs per Train km
Real Staff Costs per Passengerkm
Office of Rail Regulation | November 2012 | Costs and Revenues of UK Passenger Train Operations 33 3219817
2.50 In the context of growing service patronage the growth in real staff costs is relatively low: staff cost per
passenger kilometres increased by 13% over the period. Whilst passenger kilometres are not as significant
a driver of staff costs as train kilometres, staff costs are nonetheless more sensitive to increased service
patronage than, for instance, rolling stock costs, since increased passenger numbers put a greater burden
on cleaning staff, on-board revenue protection inspectors and station staff. As such, there is some
justification in saying that the level of the real rise in staff costs, when taking into account greater service
provision, sits somewhere between the 37% rise in staff costs per train kilometre and the 13% rise in staff
costs per passenger kilometre.
Trend analysis
2.51 The evolution of staff costs over the course of the last 10 years is similar to the trend of total costs.
We see a sharp increase between 2000-01 to 2004-05 followed by a decrease between 2004-05 and 2006-
07. Costs increased sharply again between 2006-07 and 2007-08 before stabilising in the last three years,
reflecting the impact on the recession as real earnings have shrunk slightly.
Evolution of rolling stock costs
Comparison between 2000-01 and 2011-12
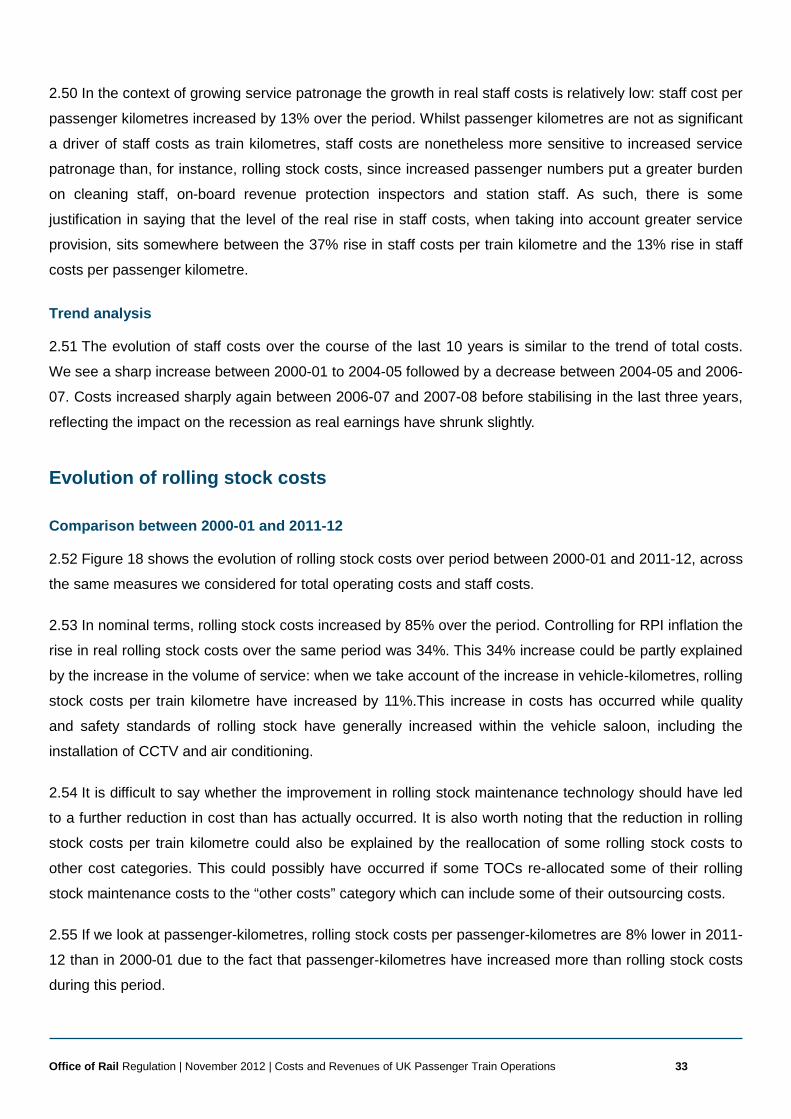
2.52 Figure 18 shows the evolution of rolling stock costs over period between 2000-01 and 2011-12, across
the same measures we considered for total operating costs and staff costs.
2.53 In nominal terms, rolling stock costs increased by 85% over the period. Controlling for RPI inflation the
rise in real rolling stock costs over the same period was 34%. This 34% increase could be partly explained
by the increase in the volume of service: when we take account of the increase in vehicle-kilometres, rolling
stock costs per train kilometre have increased by 11%.This increase in costs has occurred while quality
and safety standards of rolling stock have generally increased within the vehicle saloon, including the
installation of CCTV and air conditioning.
2.54 It is difficult to say whether the improvement in rolling stock maintenance technology should have led
to a further reduction in cost than has actually occurred. It is also worth noting that the reduction in rolling
stock costs per train kilometre could also be explained by the reallocation of some rolling stock costs to
other cost categories. This could possibly have occurred if some TOCs re-allocated some of their rolling
stock maintenance costs to the “other costs” category which can include some of their outsourcing costs.
2.55 If we look at passenger-kilometres, rolling stock costs per passenger-kilometres are 8% lower in 2011-
12 than in 2000-01 due to the fact that passenger-kilometres have increased more than rolling stock costs
during this period.
Office of Rail Regulation | November 2012 | Costs and Revenues of UK Passenger Train Operations 34 3219817
Figure 18: History of rolling stock charges for UK TOCs between 2000-01 and 2011-12 (indexed to 2000-01) (Source: TOC Management accounts/NRT)
Trend analysis
2.56 The evolution of rolling stock costs over the course of this period is similar to the trend of total costs.
We can identify two periods: from 2000-01 to 2004-05 where costs increased significantly and from 2004-
05 to 2011-12 where costs overall decreased.
2.57 Between 2000-01 and 2004-05, there was extensive investment in new and overhauled fleets. The
investment focussed on replacing/refurbishing rolling stock rather than additional capacity. It is worth noting
that disruption to services after the Hatfield incident led to a reduced network capacity and a lower than
planned volume of service. Real costs have overall decreased from their peak in 2006-07. The investment
in modern rolling stock design, with its ‘plug and play’ maintenance philosophy and state-of-the-art
diagnostics may have helped deliver these cost reductions.
Evolution of other costs
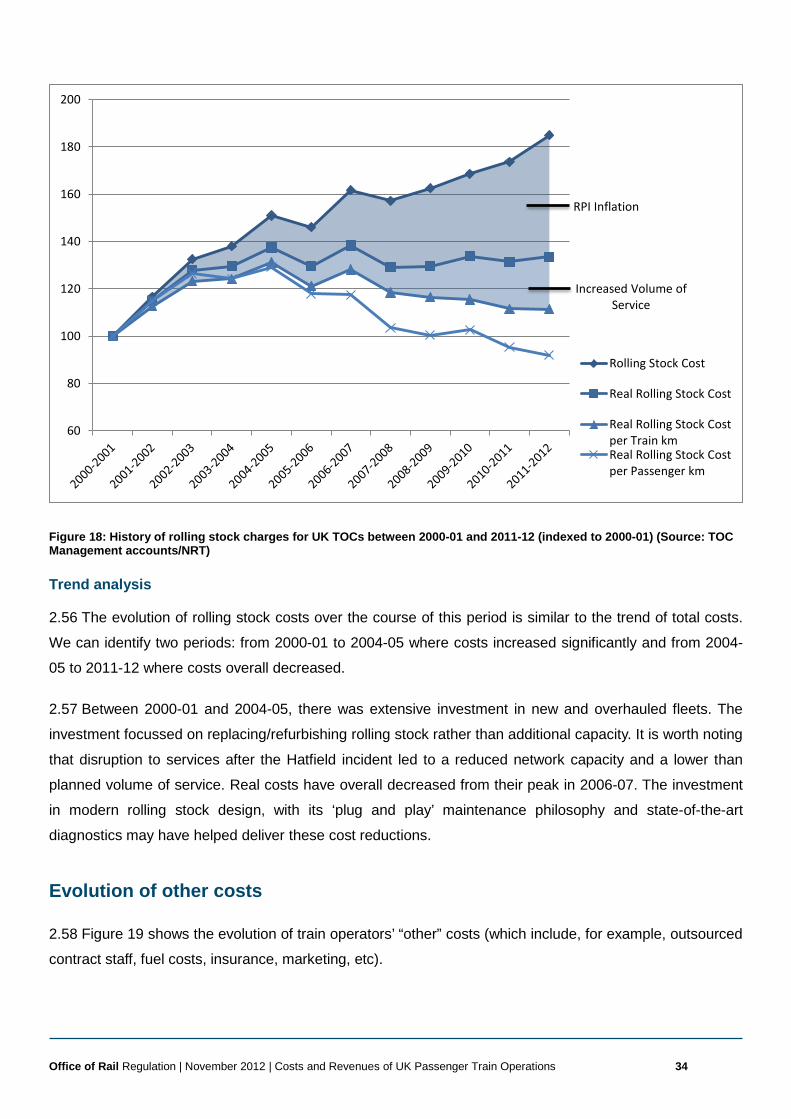
2.58 Figure 19 shows the evolution of train operators’ “other” costs (which include, for example, outsourced
contract staff, fuel costs, insurance, marketing, etc).
RPI Inflation
Increased Volume of Service
60
80
100
120
140
160
180
200
Rolling Stock Cost
Real Rolling Stock Cost
Real Rolling Stock Costper Train kmReal Rolling Stock Costper Passenger km
Office of Rail Regulation | November 2012 | Costs and Revenues of UK Passenger Train Operations 35 3219817
Figure 19: History of “other” costs (excludes EC4T charges as data not consistently available) for UK TOCs between 2000-01 and 2011-12 (indexed to 2000-01) (Source: TOC Management accounts/NRT)
2.59 The nominal rise in other costs between the 2000-01 and 2011-12 financial years was 55%.
Controlling for RPI inflation, the real rise in other costs over that period was 11%.
2.60 Taking into account the increased volume of service provided, other costs per train kilometre fell by
7% over the period. This is maybe due to the fact that many costs that feature in “other costs” such as
marketing, legal fees and office accommodation do not rise in direct proportion with the volume of service
provided (running more train services does not necessarily require more adverts) so that most of the fall is
probably accounted for by the rise in train kilometres alone. It is also possible that the decline in costs is
due to gains in efficiency or the fact that costs have been reallocated to different cost categories.
Evolution of TOC’s Performance
2.61 The focus of this report is on TOCs’ costs and revenues. In previous sections we have sought to place
the history of TOC costs and revenues in the context of changes to some of their main outputs, train
kilometres and passenger kilometres. In this section we consider two other, more qualitative, measures of
TOC output, that represent changes in performance, against which changes in costs and revenue should
be understood and give an indication of how the value for money of TOC services has changed over the
past decade.
RPI Inflation
Increased Volume of Service
60
70
80
90
100
110
120
130
140
150
160
Other Costs
Real Other Costs
Real Other Costs perTrain kmReal Other Costs perPassenger km
Office of Rail Regulation | November 2012 | Costs and Revenues of UK Passenger Train Operations 36 3219817
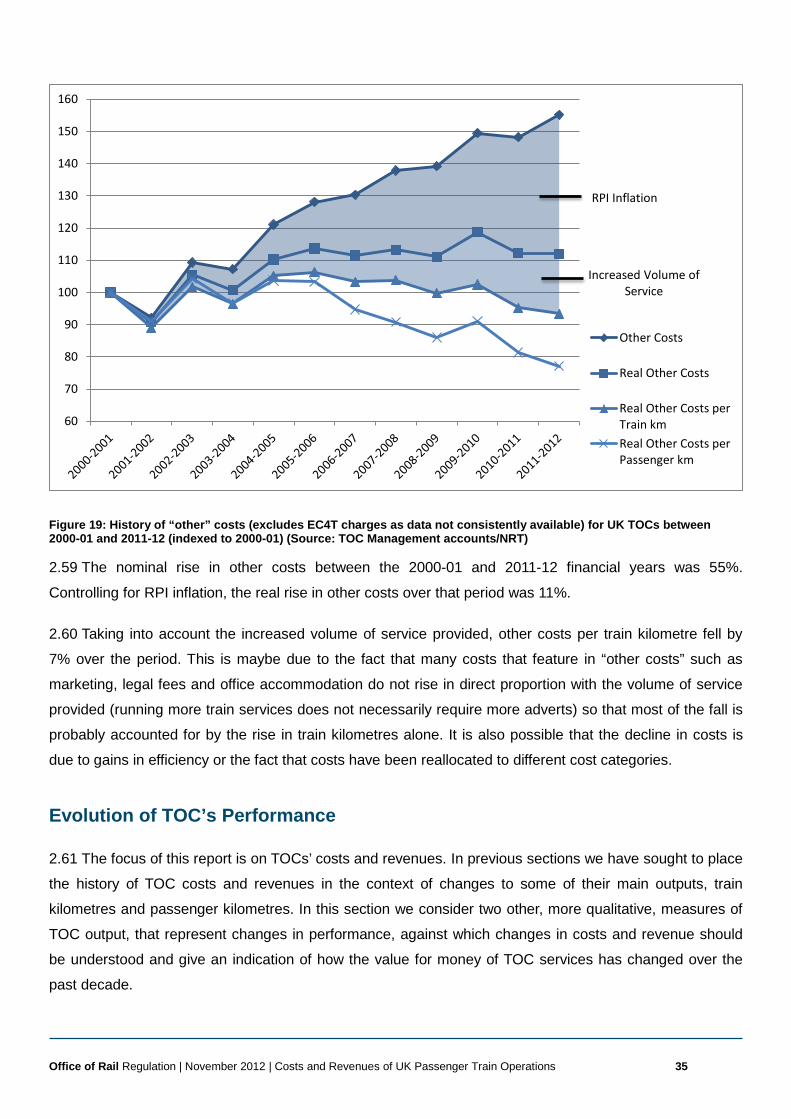
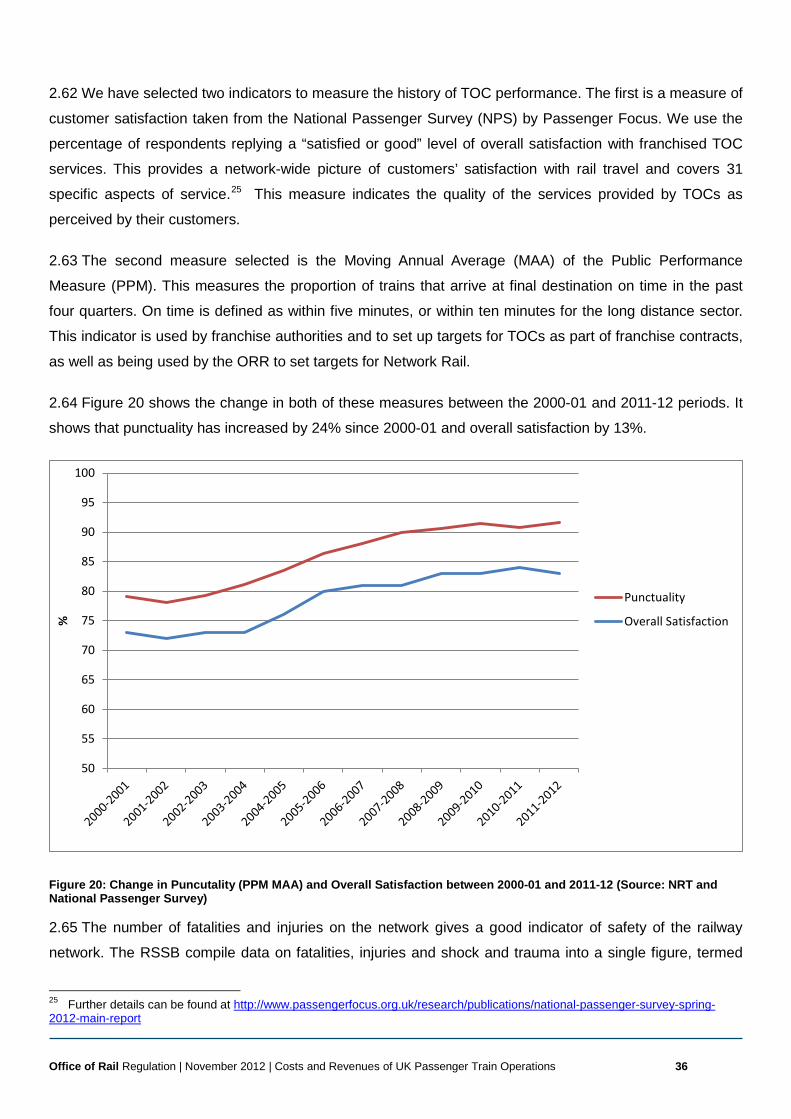
2.62 We have selected two indicators to measure the history of TOC performance. The first is a measure of
customer satisfaction taken from the National Passenger Survey (NPS) by Passenger Focus. We use the
percentage of respondents replying a “satisfied or good” level of overall satisfaction with franchised TOC
services. This provides a network-wide picture of customers’ satisfaction with rail travel and covers 31
specific aspects of service.25 This measure indicates the quality of the services provided by TOCs as
perceived by their customers.
2.63 The second measure selected is the Moving Annual Average (MAA) of the Public Performance
Measure (PPM). This measures the proportion of trains that arrive at final destination on time in the past
four quarters. On time is defined as within five minutes, or within ten minutes for the long distance sector.
This indicator is used by franchise authorities and to set up targets for TOCs as part of franchise contracts,
as well as being used by the ORR to set targets for Network Rail.
2.64 Figure 20 shows the change in both of these measures between the 2000-01 and 2011-12 periods. It
shows that punctuality has increased by 24% since 2000-01 and overall satisfaction by 13%.
Figure 20: Change in Puncutality (PPM MAA) and Overall Satisfaction between 2000-01 and 2011-12 (Source: NRT and National Passenger Survey)
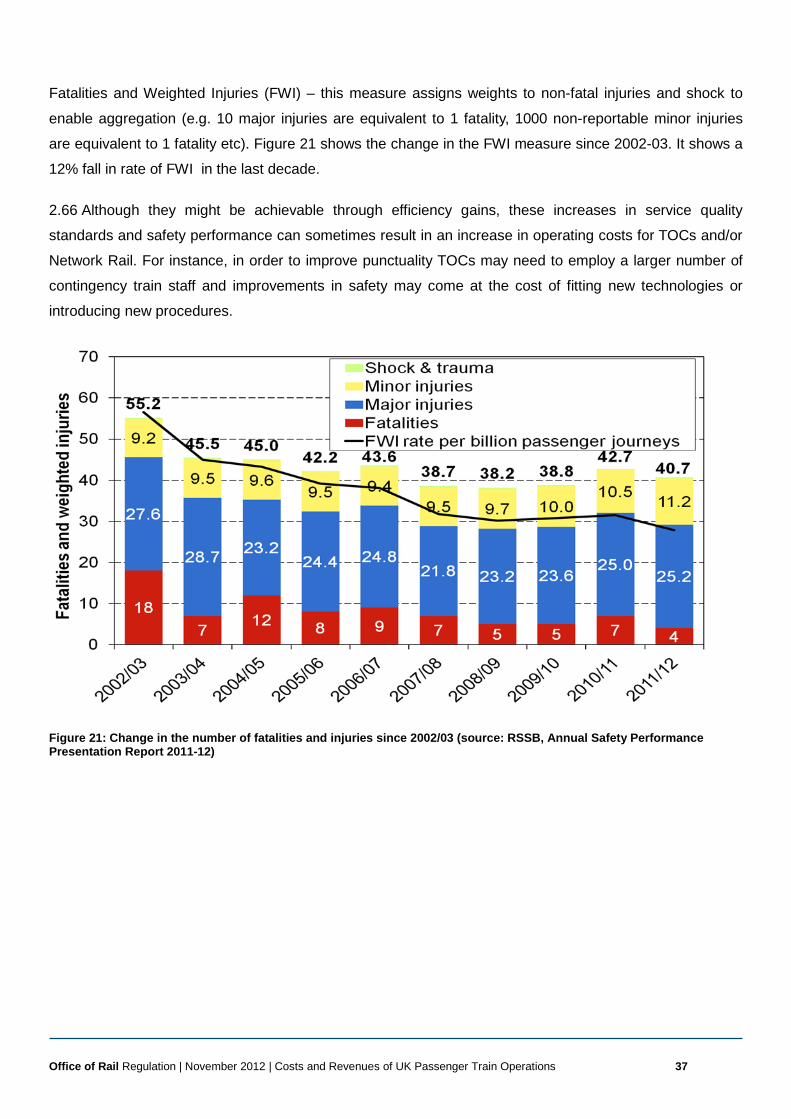
2.65 The number of fatalities and injuries on the network gives a good indicator of safety of the railway
network. The RSSB compile data on fatalities, injuries and shock and trauma into a single figure, termed
25 Further details can be found at http://www.passengerfocus.org.uk/research/publications/national-passenger-survey-spring-2012-main-report
50
55
60
65
70
75
80
85
90
95
100
%
Punctuality
Overall Satisfaction
Office of Rail Regulation | November 2012 | Costs and Revenues of UK Passenger Train Operations 37 3219817
Fatalities and Weighted Injuries (FWI) – this measure assigns weights to non-fatal injuries and shock to
enable aggregation (e.g. 10 major injuries are equivalent to 1 fatality, 1000 non-reportable minor injuries
are equivalent to 1 fatality etc). Figure 21 shows the change in the FWI measure since 2002-03. It shows a
12% fall in rate of FWI in the last decade.
2.66 Although they might be achievable through efficiency gains, these increases in service quality
standards and safety performance can sometimes result in an increase in operating costs for TOCs and/or
Network Rail. For instance, in order to improve punctuality TOCs may need to employ a larger number of
contingency train staff and improvements in safety may come at the cost of fitting new technologies or
introducing new procedures.
Figure 21: Change in the number of fatalities and injuries since 2002/03 (source: RSSB, Annual Safety Performance Presentation Report 2011-12)
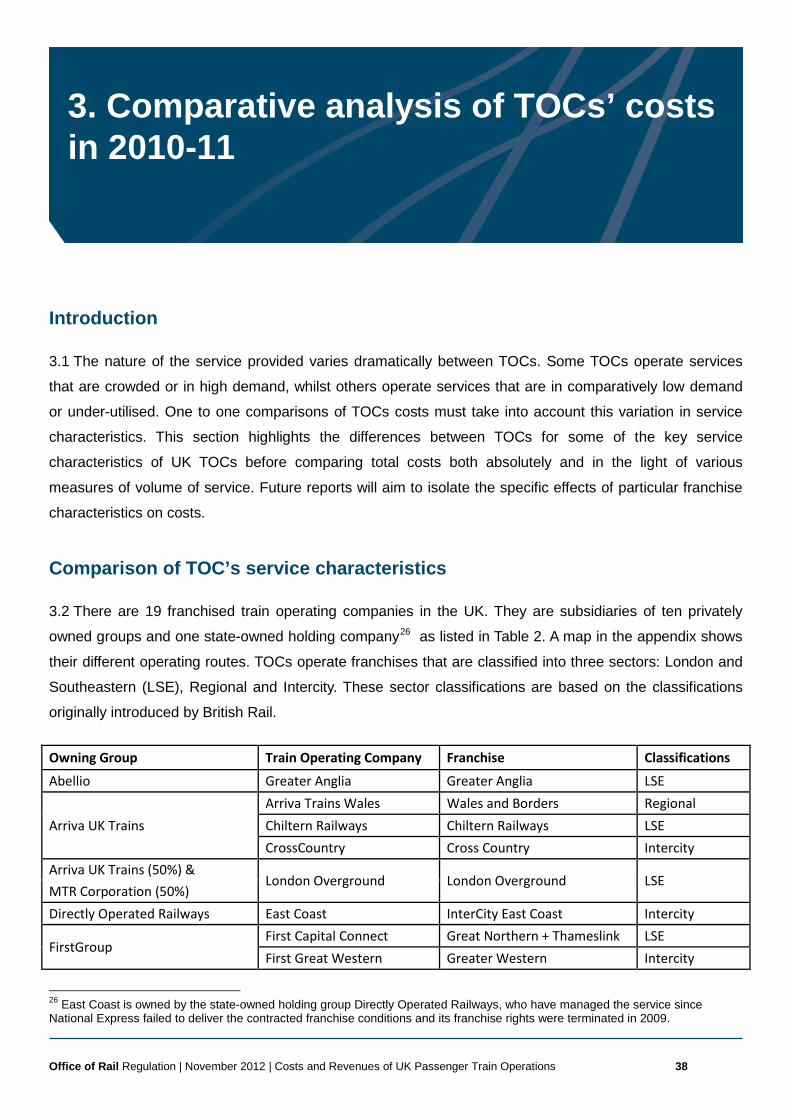
Office of Rail Regulation | November 2012 | Costs and Revenues of UK Passenger Train Operations 38 3219817
3. Comparative analysis of TOCs’ costs in 2010-11
Introduction
3.1 The nature of the service provided varies dramatically between TOCs. Some TOCs operate services
that are crowded or in high demand, whilst others operate services that are in comparatively low demand
or under-utilised. One to one comparisons of TOCs costs must take into account this variation in service
characteristics. This section highlights the differences between TOCs for some of the key service
characteristics of UK TOCs before comparing total costs both absolutely and in the light of various
measures of volume of service. Future reports will aim to isolate the specific effects of particular franchise
characteristics on costs.
Comparison of TOC’s service characteristics
3.2 There are 19 franchised train operating companies in the UK. They are subsidiaries of ten privately
owned groups and one state-owned holding company26 as listed in Table 2. A map in the appendix shows
their different operating routes. TOCs operate franchises that are classified into three sectors: London and
Southeastern (LSE), Regional and Intercity. These sector classifications are based on the classifications
originally introduced by British Rail.
Owning Group Train Operating Company Franchise Classifications
Abellio Greater Anglia Greater Anglia LSE
Arriva UK Trains Arriva Trains Wales Wales and Borders Regional Chiltern Railways Chiltern Railways LSE CrossCountry Cross Country Intercity
Arriva UK Trains (50%) & London Overground London Overground LSE
MTR Corporation (50%) Directly Operated Railways East Coast InterCity East Coast Intercity
FirstGroup First Capital Connect Great Northern + Thameslink LSE First Great Western Greater Western Intercity
26 East Coast is owned by the state-owned holding group Directly Operated Railways, who have managed the service since National Express failed to deliver the contracted franchise conditions and its franchise rights were terminated in 2009.
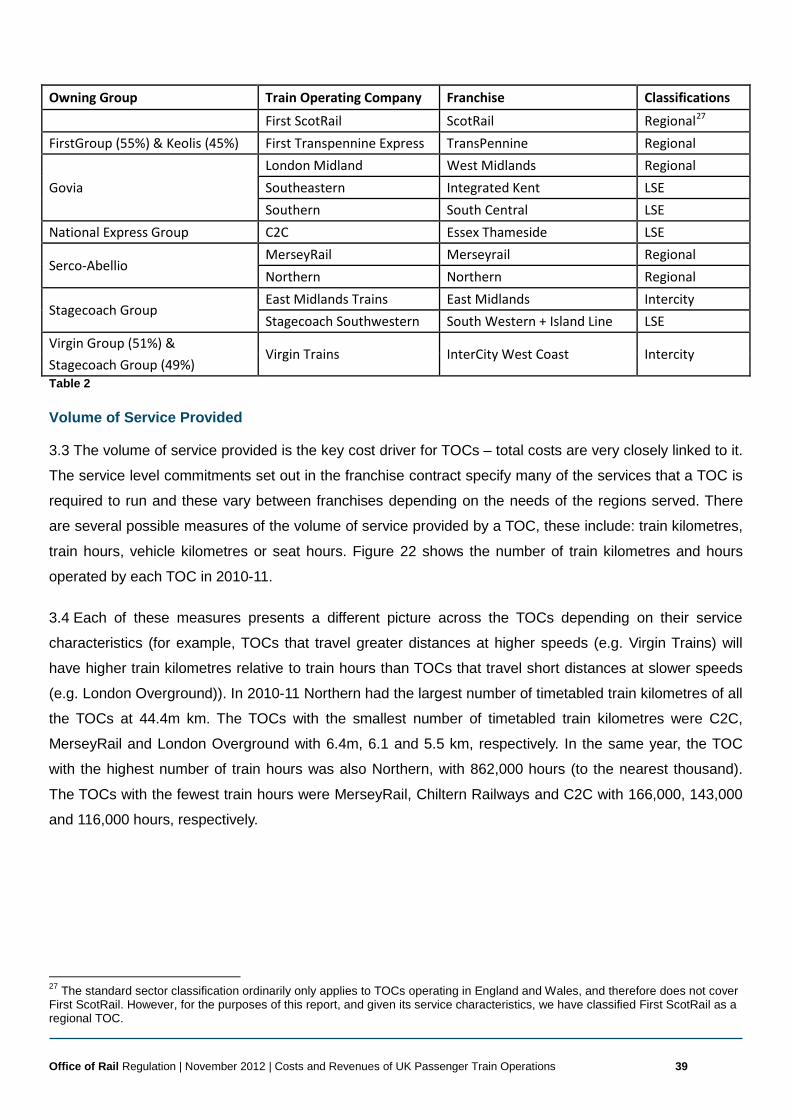
Office of Rail Regulation | November 2012 | Costs and Revenues of UK Passenger Train Operations 39 3219817
Owning Group Train Operating Company Franchise Classifications
First ScotRail ScotRail Regional27 FirstGroup (55%) & Keolis (45%) First Transpennine Express TransPennine Regional
Govia London Midland West Midlands Regional Southeastern Integrated Kent LSE Southern South Central LSE
National Express Group C2C Essex Thameside LSE
Serco-Abellio MerseyRail Merseyrail Regional Northern Northern Regional
Stagecoach Group East Midlands Trains East Midlands Intercity Stagecoach Southwestern South Western + Island Line LSE
Virgin Group (51%) & Virgin Trains InterCity West Coast Intercity
Stagecoach Group (49%) Table 2
Volume of Service Provided
3.3 The volume of service provided is the key cost driver for TOCs – total costs are very closely linked to it.
The service level commitments set out in the franchise contract specify many of the services that a TOC is
required to run and these vary between franchises depending on the needs of the regions served. There
are several possible measures of the volume of service provided by a TOC, these include: train kilometres,
train hours, vehicle kilometres or seat hours. Figure 22 shows the number of train kilometres and hours
operated by each TOC in 2010-11.
3.4 Each of these measures presents a different picture across the TOCs depending on their service
characteristics (for example, TOCs that travel greater distances at higher speeds (e.g. Virgin Trains) will
have higher train kilometres relative to train hours than TOCs that travel short distances at slower speeds
(e.g. London Overground)). In 2010-11 Northern had the largest number of timetabled train kilometres of all
the TOCs at 44.4m km. The TOCs with the smallest number of timetabled train kilometres were C2C,
MerseyRail and London Overground with 6.4m, 6.1 and 5.5 km, respectively. In the same year, the TOC
with the highest number of train hours was also Northern, with 862,000 hours (to the nearest thousand).
The TOCs with the fewest train hours were MerseyRail, Chiltern Railways and C2C with 166,000, 143,000
and 116,000 hours, respectively.
27 The standard sector classification ordinarily only applies to TOCs operating in England and Wales, and therefore does not cover First ScotRail. However, for the purposes of this report, and given its service characteristics, we have classified First ScotRail as a regional TOC.
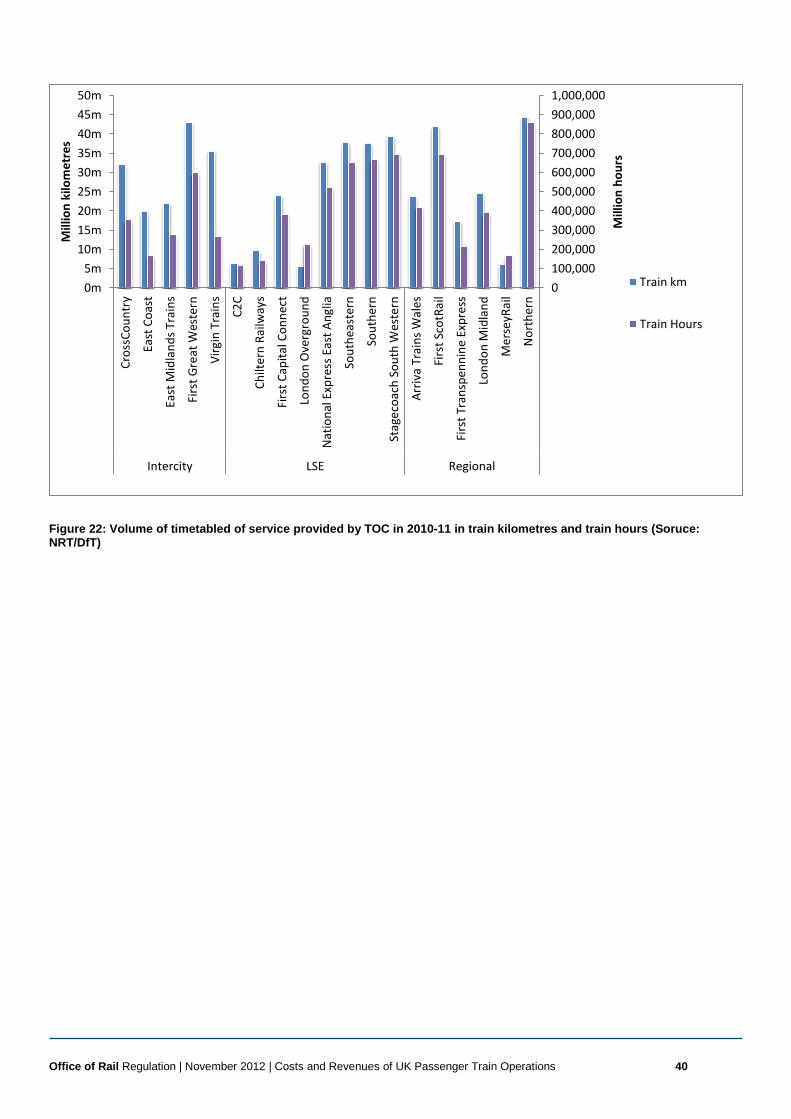
Office of Rail Regulation | November 2012 | Costs and Revenues of UK Passenger Train Operations 40 3219817
Figure 22: Volume of timetabled of service provided by TOC in 2010-11 in train kilometres and train hours (Soruce: NRT/DfT)
0100,000200,000300,000400,000500,000600,000700,000800,000900,0001,000,000
0m5m
10m15m20m25m30m35m40m45m50m
Cros
sCou
ntry
East
Coa
st
East
Mid
land
s Tra
ins
Firs
t Gre
at W
este
rn
Virg
in T
rain
s
C2C
Chilt
ern
Railw
ays
Firs
t Cap
ital C
onne
ct
Lond
on O
verg
roun
d
Nat
iona
l Exp
ress
Eas
t Ang
lia
Sout
heas
tern
Sout
hern
Stag
ecoa
ch S
outh
Wes
tern
Arriv
a Tr
ains
Wal
es
Firs
t Sco
tRai
l
Firs
t Tra
nspe
nnin
e Ex
pres
s
Lond
on M
idla
nd
Mer
seyR
ail
Nor
ther
n
Intercity LSE Regional
Mill
ion
hour
s
Mill
ion
kilo
met
res
Train km
Train Hours
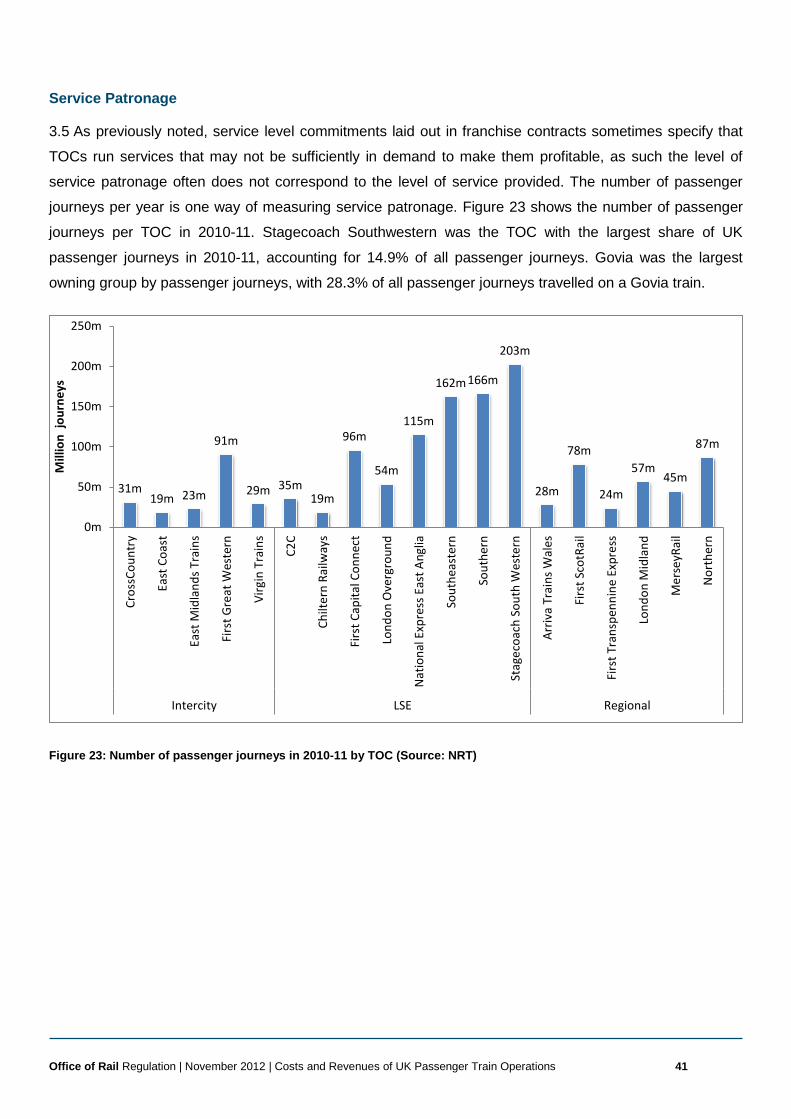
Office of Rail Regulation | November 2012 | Costs and Revenues of UK Passenger Train Operations 41 3219817
Service Patronage
3.5 As previously noted, service level commitments laid out in franchise contracts sometimes specify that
TOCs run services that may not be sufficiently in demand to make them profitable, as such the level of
service patronage often does not correspond to the level of service provided. The number of passenger
journeys per year is one way of measuring service patronage. Figure 23 shows the number of passenger
journeys per TOC in 2010-11. Stagecoach Southwestern was the TOC with the largest share of UK
passenger journeys in 2010-11, accounting for 14.9% of all passenger journeys. Govia was the largest
owning group by passenger journeys, with 28.3% of all passenger journeys travelled on a Govia train.
Figure 23: Number of passenger journeys in 2010-11 by TOC (Source: NRT)
31m 19m 23m
91m
29m 35m 19m
96m
54m
115m
162m 166m
203m
28m
78m
24m
57m 45m
87m
0m
50m
100m
150m
200m
250m
Cros
sCou
ntry
East
Coa
st
East
Mid
land
s Tra
ins
Firs
t Gre
at W
este
rn
Virg
in T
rain
s
C2C
Chilt
ern
Railw
ays
Firs
t Cap
ital C
onne
ct
Lond
on O
verg
roun
d
Nat
iona
l Exp
ress
Eas
t Ang
lia
Sout
heas
tern
Sout
hern
Stag
ecoa
ch S
outh
Wes
tern
Arriv
a Tr
ains
Wal
es
Firs
t Sco
tRai
l
Firs
t Tra
nspe
nnin
e Ex
pres
s
Lond
on M
idla
nd
Mer
seyR
ail
Nor
ther
nIntercity LSE Regional
Mill
ion
jour
neys
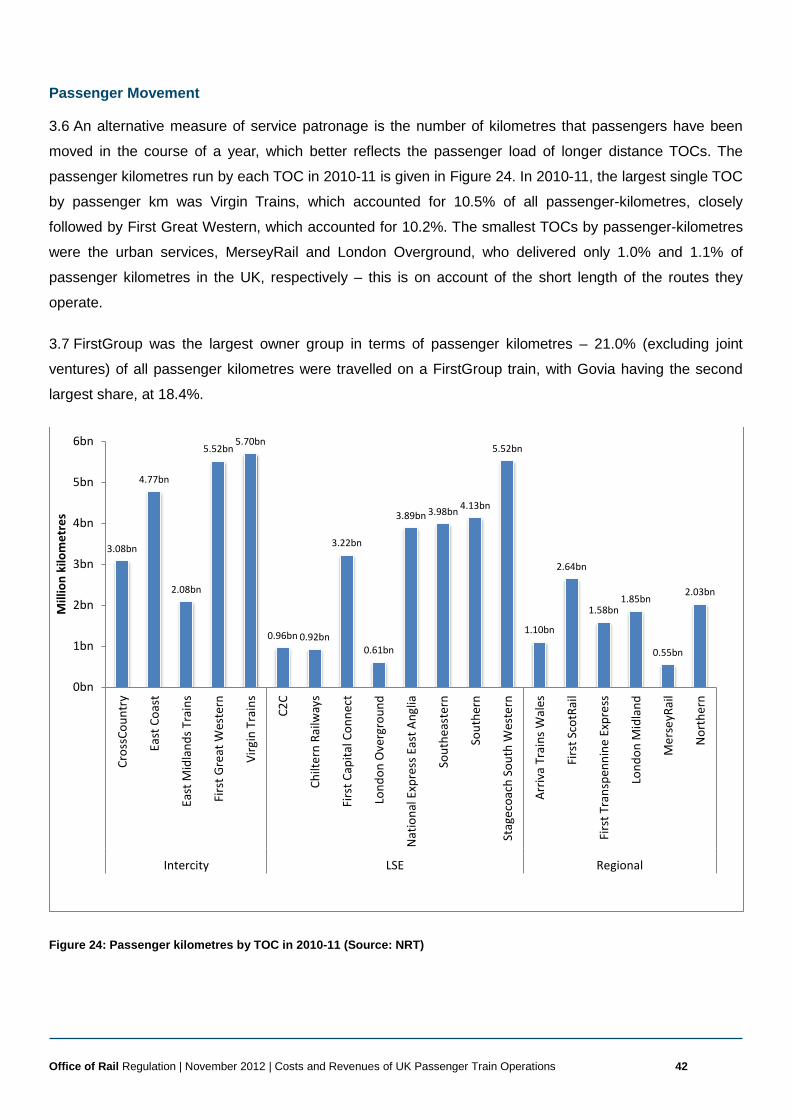
Office of Rail Regulation | November 2012 | Costs and Revenues of UK Passenger Train Operations 42 3219817
Passenger Movement
3.6 An alternative measure of service patronage is the number of kilometres that passengers have been
moved in the course of a year, which better reflects the passenger load of longer distance TOCs. The
passenger kilometres run by each TOC in 2010-11 is given in Figure 24. In 2010-11, the largest single TOC
by passenger km was Virgin Trains, which accounted for 10.5% of all passenger-kilometres, closely
followed by First Great Western, which accounted for 10.2%. The smallest TOCs by passenger-kilometres
were the urban services, MerseyRail and London Overground, who delivered only 1.0% and 1.1% of
passenger kilometres in the UK, respectively – this is on account of the short length of the routes they
operate.
3.7 FirstGroup was the largest owner group in terms of passenger kilometres – 21.0% (excluding joint
ventures) of all passenger kilometres were travelled on a FirstGroup train, with Govia having the second
largest share, at 18.4%.
Figure 24: Passenger kilometres by TOC in 2010-11 (Source: NRT)
3.08bn
4.77bn
2.08bn
5.52bn 5.70bn
0.96bn 0.92bn
3.22bn
0.61bn
3.89bn 3.98bn 4.13bn
5.52bn
1.10bn
2.64bn
1.58bn 1.85bn
0.55bn
2.03bn
0bn
1bn
2bn
3bn
4bn
5bn
6bn
Cros
sCou
ntry
East
Coa
st
East
Mid
land
s Tra
ins
Firs
t Gre
at W
este
rn
Virg
in T
rain
s
C2C
Chilt
ern
Railw
ays
Firs
t Cap
ital C
onne
ct
Lond
on O
verg
roun
d
Nat
iona
l Exp
ress
Eas
t Ang
lia
Sout
heas
tern
Sout
hern
Stag
ecoa
ch S
outh
Wes
tern
Arriv
a Tr
ains
Wal
es
Firs
t Sco
tRai
l
Firs
t Tra
nspe
nnin
e Ex
pres
s
Lond
on M
idla
nd
Mer
seyR
ail
Nor
ther
n
Intercity LSE Regional
Mill
ion
kilo
met
res
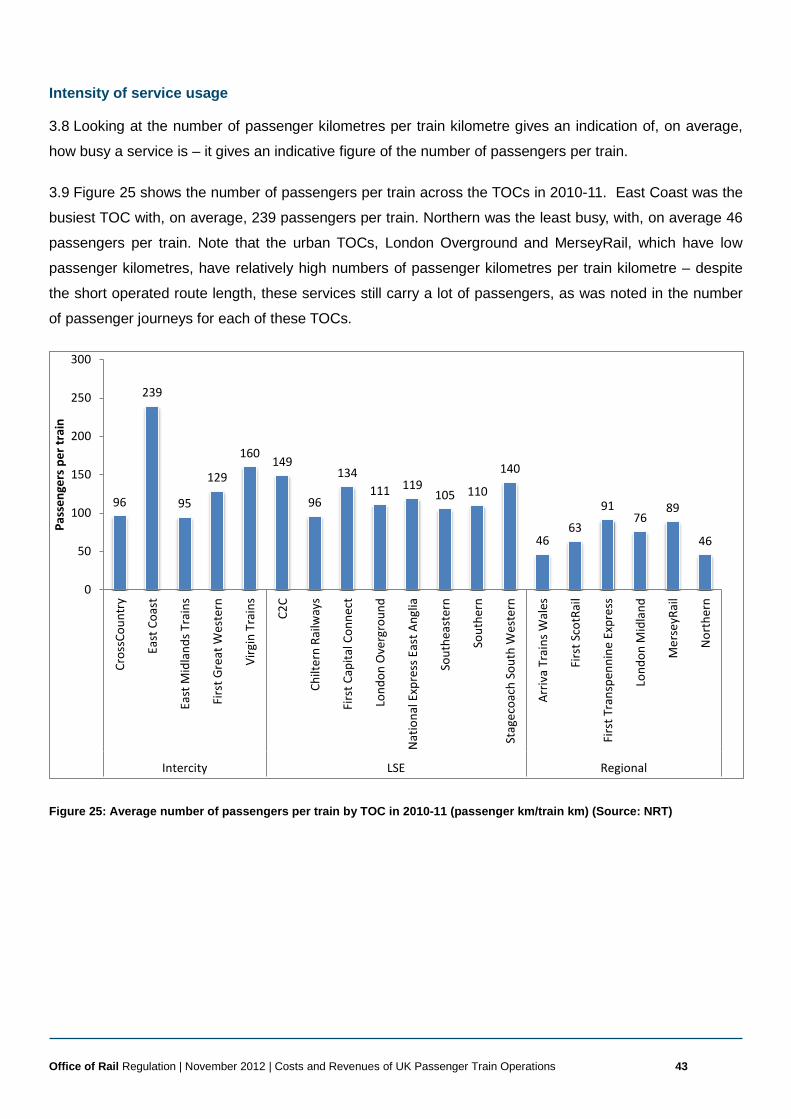
Office of Rail Regulation | November 2012 | Costs and Revenues of UK Passenger Train Operations 43 3219817
Intensity of service usage
3.8 Looking at the number of passenger kilometres per train kilometre gives an indication of, on average,
how busy a service is – it gives an indicative figure of the number of passengers per train.
3.9 Figure 25 shows the number of passengers per train across the TOCs in 2010-11. East Coast was the
busiest TOC with, on average, 239 passengers per train. Northern was the least busy, with, on average 46
passengers per train. Note that the urban TOCs, London Overground and MerseyRail, which have low
passenger kilometres, have relatively high numbers of passenger kilometres per train kilometre – despite
the short operated route length, these services still carry a lot of passengers, as was noted in the number
of passenger journeys for each of these TOCs.
Figure 25: Average number of passengers per train by TOC in 2010-11 (passenger km/train km) (Source: NRT)
96
239
95
129
160 149
96
134 111 119
105 110
140
46 63
91 76
89
46
0
50
100
150
200
250
300
Cros
sCou
ntry
East
Coa
st
East
Mid
land
s Tra
ins
Firs
t Gre
at W
este
rn
Virg
in T
rain
s
C2C
Chilt
ern
Railw
ays
Firs
t Cap
ital C
onne
ct
Lond
on O
verg
roun
d
Nat
iona
l Exp
ress
Eas
t Ang
lia
Sout
heas
tern
Sout
hern
Stag
ecoa
ch S
outh
Wes
tern
Arriv
a Tr
ains
Wal
es
Firs
t Sco
tRai
l
Firs
t Tra
nspe
nnin
e Ex
pres
s
Lond
on M
idla
nd
Mer
seyR
ail
Nor
ther
n
Intercity LSE Regional
Pass
enge
rs p
er tr
ain
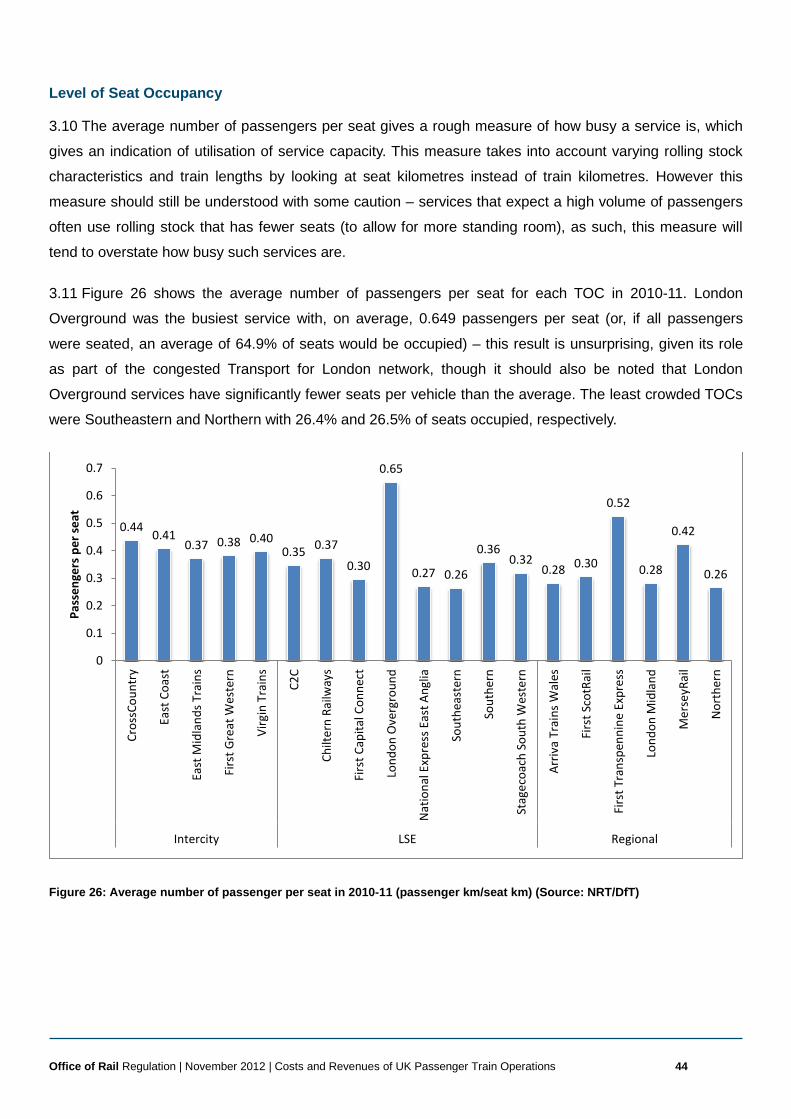
Office of Rail Regulation | November 2012 | Costs and Revenues of UK Passenger Train Operations 44 3219817
Level of Seat Occupancy
3.10 The average number of passengers per seat gives a rough measure of how busy a service is, which
gives an indication of utilisation of service capacity. This measure takes into account varying rolling stock
characteristics and train lengths by looking at seat kilometres instead of train kilometres. However this
measure should still be understood with some caution – services that expect a high volume of passengers
often use rolling stock that has fewer seats (to allow for more standing room), as such, this measure will
tend to overstate how busy such services are.
3.11 Figure 26 shows the average number of passengers per seat for each TOC in 2010-11. London
Overground was the busiest service with, on average, 0.649 passengers per seat (or, if all passengers
were seated, an average of 64.9% of seats would be occupied) – this result is unsurprising, given its role
as part of the congested Transport for London network, though it should also be noted that London
Overground services have significantly fewer seats per vehicle than the average. The least crowded TOCs
were Southeastern and Northern with 26.4% and 26.5% of seats occupied, respectively.
Figure 26: Average number of passenger per seat in 2010-11 (passenger km/seat km) (Source: NRT/DfT)
0.44 0.41 0.37 0.38 0.40
0.35 0.37
0.30
0.65
0.27 0.26
0.36 0.32
0.28 0.30
0.52
0.28
0.42
0.26
0
0.1
0.2
0.3
0.4
0.5
0.6
0.7
Cros
sCou
ntry
East
Coa
st
East
Mid
land
s Tra
ins
Firs
t Gre
at W
este
rn
Virg
in T
rain
s
C2C
Chilt
ern
Railw
ays
Firs
t Cap
ital C
onne
ct
Lond
on O
verg
roun
d
Nat
iona
l Exp
ress
Eas
t Ang
lia
Sout
heas
tern
Sout
hern
Stag
ecoa
ch S
outh
Wes
tern
Arriv
a Tr
ains
Wal
es
Firs
t Sco
tRai
l
Firs
t Tra
nspe
nnin
e Ex
pres
s
Lond
on M
idla
nd
Mer
seyR
ail
Nor
ther
n
Intercity LSE Regional
Pass
enge
rs p
er se
at
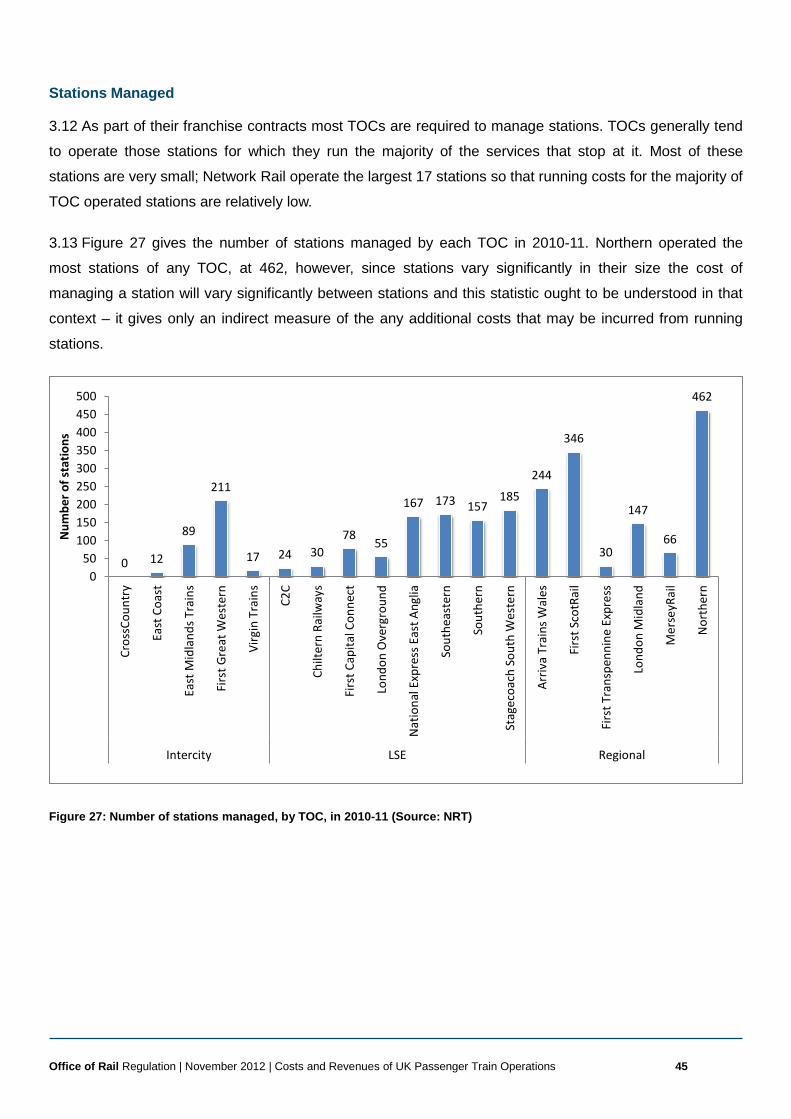
Office of Rail Regulation | November 2012 | Costs and Revenues of UK Passenger Train Operations 45 3219817
Stations Managed
3.12 As part of their franchise contracts most TOCs are required to manage stations. TOCs generally tend
to operate those stations for which they run the majority of the services that stop at it. Most of these
stations are very small; Network Rail operate the largest 17 stations so that running costs for the majority of
TOC operated stations are relatively low.
3.13 Figure 27 gives the number of stations managed by each TOC in 2010-11. Northern operated the
most stations of any TOC, at 462, however, since stations vary significantly in their size the cost of
managing a station will vary significantly between stations and this statistic ought to be understood in that
context – it gives only an indirect measure of the any additional costs that may be incurred from running
stations.
Figure 27: Number of stations managed, by TOC, in 2010-11 (Source: NRT)
0 12
89
211
17 24 30 78 55
167 173 157 185
244
346
30
147
66
462
050
100150200250300350400450500
Cros
sCou
ntry
East
Coa
st
East
Mid
land
s Tra
ins
Firs
t Gre
at W
este
rn
Virg
in T
rain
s
C2C
Chilt
ern
Railw
ays
Firs
t Cap
ital C
onne
ct
Lond
on O
verg
roun
d
Nat
iona
l Exp
ress
Eas
t Ang
lia
Sout
heas
tern
Sout
hern
Stag
ecoa
ch S
outh
Wes
tern
Arriv
a Tr
ains
Wal
es
Firs
t Sco
tRai
l
Firs
t Tra
nspe
nnin
e Ex
pres
s
Lond
on M
idla
nd
Mer
seyR
ail
Nor
ther
n
Intercity LSE Regional
Num
ber o
f sta
tions
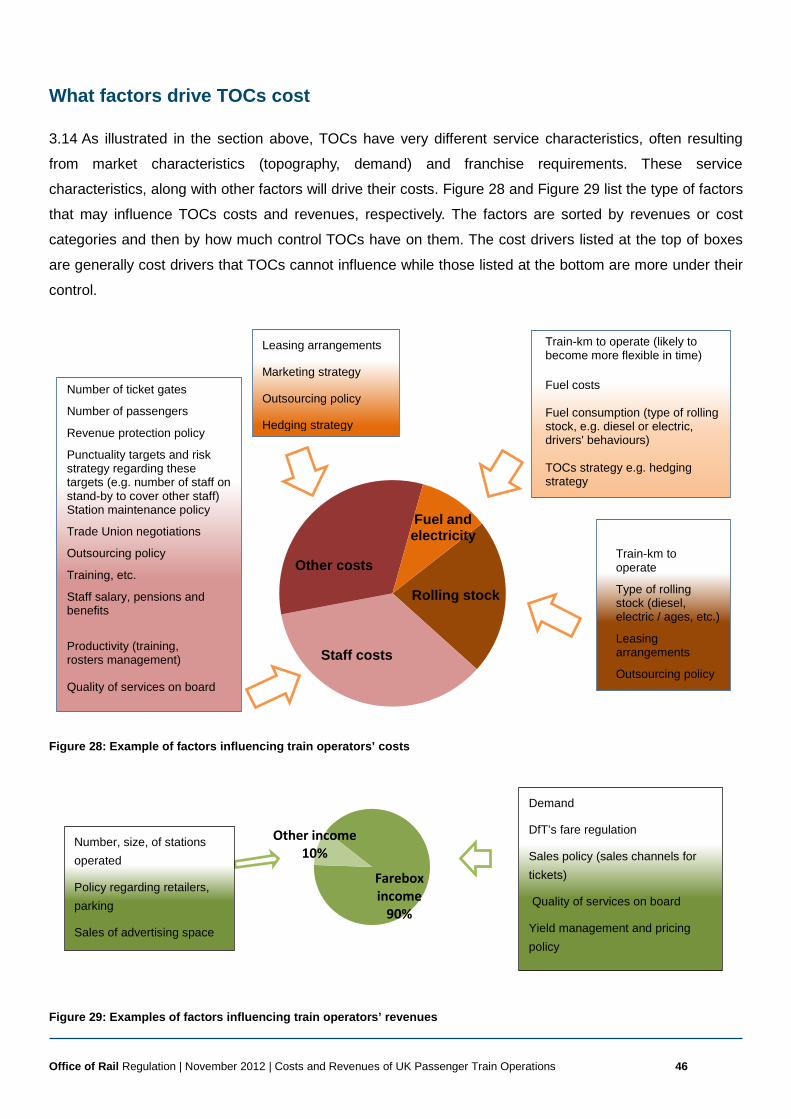
Office of Rail Regulation | November 2012 | Costs and Revenues of UK Passenger Train Operations 46 3219817
Farebox income
90%
Other income 10%
Demand
DfT’s fare regulation
Sales policy (sales channels for tickets)
Quality of services on board
Yield management and pricing policy
Number, size, of stations operated
Policy regarding retailers, parking
Sales of advertising space
What factors drive TOCs cost
3.14 As illustrated in the section above, TOCs have very different service characteristics, often resulting
from market characteristics (topography, demand) and franchise requirements. These service
characteristics, along with other factors will drive their costs. Figure 28 and Figure 29 list the type of factors
that may influence TOCs costs and revenues, respectively. The factors are sorted by revenues or cost
categories and then by how much control TOCs have on them. The cost drivers listed at the top of boxes
are generally cost drivers that TOCs cannot influence while those listed at the bottom are more under their
control.
Figure 28: Example of factors influencing train operators’ costs
Figure 29: Examples of factors influencing train operators’ revenues
Rolling stock
Staff costs
Other costs
Fuel and electricity
Train-km to operate (likely to become more flexible in time)
Fuel costs Fuel consumption (type of rolling stock, e.g. diesel or electric, drivers' behaviours) TOCs strategy e.g. hedging strategy
Number of ticket gates
Number of passengers
Revenue protection policy
Punctuality targets and risk strategy regarding these targets (e.g. number of staff on stand-by to cover other staff) Station maintenance policy
Trade Union negotiations
Outsourcing policy
Training, etc.
Staff salary, pensions and benefits
Productivity (training, rosters management) Quality of services on board
Leasing arrangements
Marketing strategy
Outsourcing policy
Hedging strategy
Train-km to operate
Type of rolling stock (diesel, electric / ages, etc.)
Leasing arrangements
Outsourcing policy
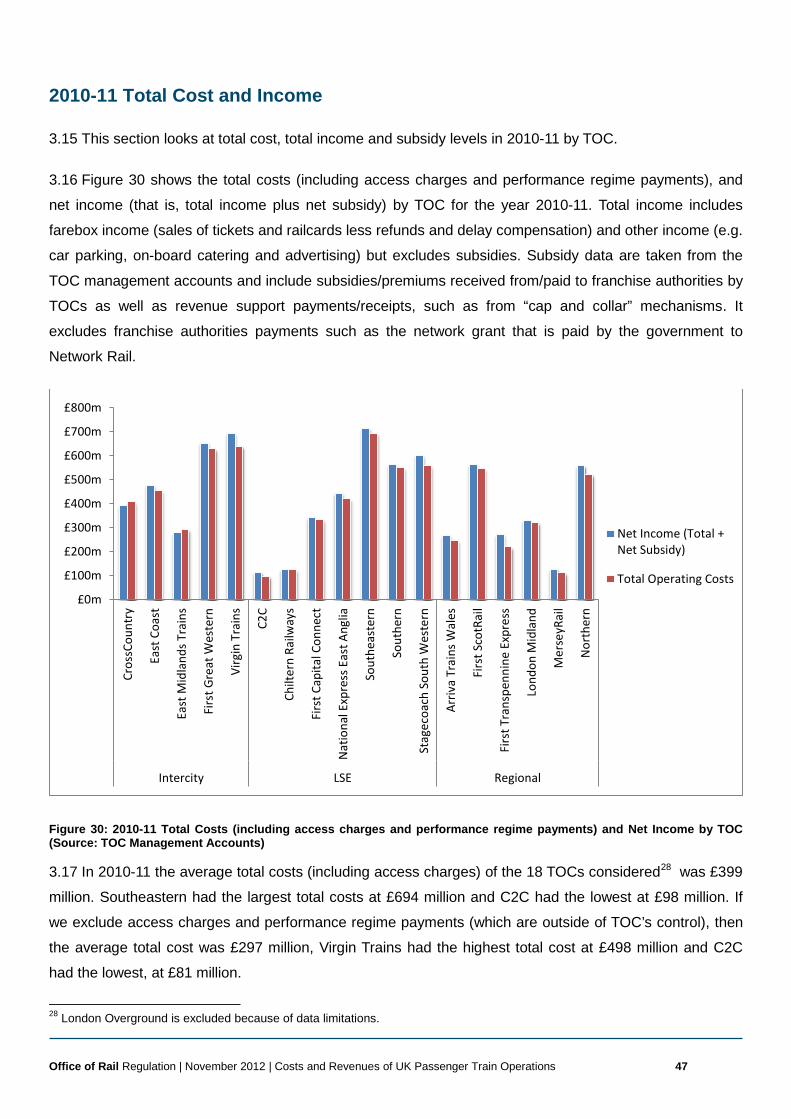
Office of Rail Regulation | November 2012 | Costs and Revenues of UK Passenger Train Operations 47 3219817
2010-11 Total Cost and Income
3.15 This section looks at total cost, total income and subsidy levels in 2010-11 by TOC.
3.16 Figure 30 shows the total costs (including access charges and performance regime payments), and
net income (that is, total income plus net subsidy) by TOC for the year 2010-11. Total income includes
farebox income (sales of tickets and railcards less refunds and delay compensation) and other income (e.g.
car parking, on-board catering and advertising) but excludes subsidies. Subsidy data are taken from the
TOC management accounts and include subsidies/premiums received from/paid to franchise authorities by
TOCs as well as revenue support payments/receipts, such as from “cap and collar” mechanisms. It
excludes franchise authorities payments such as the network grant that is paid by the government to
Network Rail.
Figure 30: 2010-11 Total Costs (including access charges and performance regime payments) and Net Income by TOC (Source: TOC Management Accounts)
3.17 In 2010-11 the average total costs (including access charges) of the 18 TOCs considered28 was £399
million. Southeastern had the largest total costs at £694 million and C2C had the lowest at £98 million. If
we exclude access charges and performance regime payments (which are outside of TOC’s control), then
the average total cost was £297 million, Virgin Trains had the highest total cost at £498 million and C2C
had the lowest, at £81 million.
28 London Overground is excluded because of data limitations.
£0m
£100m
£200m
£300m
£400m
£500m
£600m
£700m
£800m
Cros
sCou
ntry
East
Coa
st
East
Mid
land
s Tra
ins
Firs
t Gre
at W
este
rn
Virg
in T
rain
s
C2C
Chilt
ern
Railw
ays
Firs
t Cap
ital C
onne
ct
Nat
iona
l Exp
ress
Eas
t Ang
lia
Sout
heas
tern
Sout
hern
Stag
ecoa
ch S
outh
Wes
tern
Arriv
a Tr
ains
Wal
es
Firs
t Sco
tRai
l
Firs
t Tra
nspe
nnin
e Ex
pres
s
Lond
on M
idla
nd
Mer
seyR
ail
Nor
ther
n
Intercity LSE Regional
Net Income (Total +Net Subsidy)
Total Operating Costs
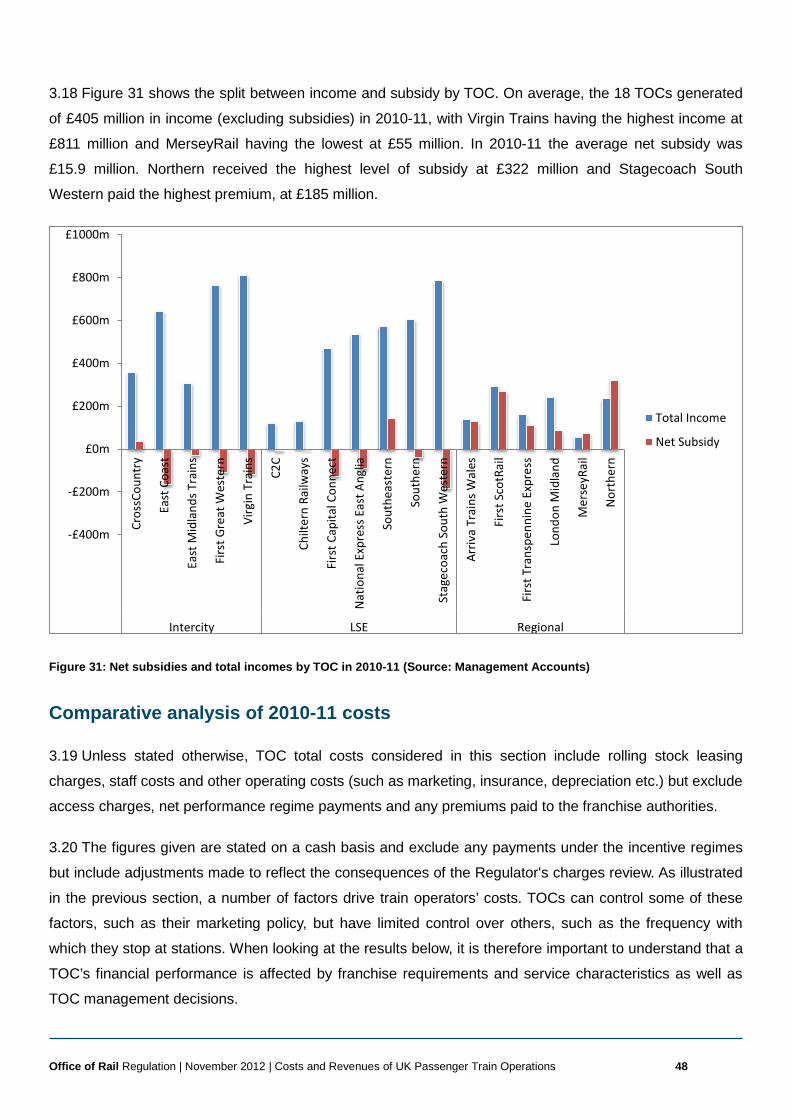
Office of Rail Regulation | November 2012 | Costs and Revenues of UK Passenger Train Operations 48 3219817
3.18 Figure 31 shows the split between income and subsidy by TOC. On average, the 18 TOCs generated
of £405 million in income (excluding subsidies) in 2010-11, with Virgin Trains having the highest income at
£811 million and MerseyRail having the lowest at £55 million. In 2010-11 the average net subsidy was
£15.9 million. Northern received the highest level of subsidy at £322 million and Stagecoach South
Western paid the highest premium, at £185 million.
Figure 31: Net subsidies and total incomes by TOC in 2010-11 (Source: Management Accounts)
Comparative analysis of 2010-11 costs
3.19 Unless stated otherwise, TOC total costs considered in this section include rolling stock leasing
charges, staff costs and other operating costs (such as marketing, insurance, depreciation etc.) but exclude
access charges, net performance regime payments and any premiums paid to the franchise authorities.
3.20 The figures given are stated on a cash basis and exclude any payments under the incentive regimes
but include adjustments made to reflect the consequences of the Regulator's charges review. As illustrated
in the previous section, a number of factors drive train operators’ costs. TOCs can control some of these
factors, such as their marketing policy, but have limited control over others, such as the frequency with
which they stop at stations. When looking at the results below, it is therefore important to understand that a
TOC’s financial performance is affected by franchise requirements and service characteristics as well as
TOC management decisions.
-£400m
-£200m
£0m
£200m
£400m
£600m
£800m
£1000m
Cros
sCou
ntry
East
Coa
st
East
Mid
land
s Tra
ins
Firs
t Gre
at W
este
rn
Virg
in T
rain
s
C2C
Chilt
ern
Railw
ays
Firs
t Cap
ital C
onne
ct
Nat
iona
l Exp
ress
Eas
t Ang
lia
Sout
heas
tern
Sout
hern
Stag
ecoa
ch S
outh
Wes
tern
Arriv
a Tr
ains
Wal
es
Firs
t Sco
tRai
l
Firs
t Tra
nspe
nnin
e Ex
pres
s
Lond
on M
idla
nd
Mer
seyR
ail
Nor
ther
nIntercity LSE Regional
Total Income
Net Subsidy
Office of Rail Regulation | November 2012 | Costs and Revenues of UK Passenger Train Operations 49 3219817
3.21 The analysis in this report does not aim to identify the effects that any given controllable or structural
factor has on TOCs’ costs independent of all other factors, and, as such, none of the results presented
below can be understood as a “league table” of TOC efficiency. These findings should not be understood in
isolation as each measure will only capture an aspect of TOCs’ costs. However, the analysis below sheds
some light on the key drivers of TOC costs, as well as some of the relationship between those drivers and
TOCs’ service characteristics.
3.22 The core driver of TOC costs is the volume of service it provides. As previously discussed, there are
several ways of measuring volume of service but, from a cost perspective, two of the main drivers are the
distance travelled by TOCs trains (train kilometres) and the time they have spent travelling (train hours). In
addition to these, because the addition of extra vehicles to a train has a non-negligible effect on TOC costs
(even excluding the vehicle lease) another potentially key cost driver is vehicle kilometres.
3.23 Although seat-kilometres and passenger-kilometres are useful measures of capacity and output from
the perspective of end users and the franchise authorities, they are not significant drivers of costs. As a
measure of output, vehicle-kilometres ought to capture all the influence of seat-kilometres on costs since
TOCs tend to operate vehicles with a pre-determined number of seats and ROSCO leasing charges are, in
general, not determined by that number. With regards to passenger-kilometres, they ought to have some
effect on TOC costs, in particular through staff costs on areas such as revenue protection and cleaning.
However, we would expect this effect on costs to be very minor and therefore would not consider this to be
a key cost driver.
3.24 The analysis below focuses on cost per train and vehicle kilometre and cost per train hour. In addition,
although they are not significant cost drivers, given its importance as a measure of capacity and output for
passengers, we have considered cost per passenger kilometre for each TOC to see how train operators
compare with one another. The analysis provided in the appendix looks at the relationship between each of
these measures of output and operating costs.
3.25 Where significant differences arise between TOCs we highlight these and provide candidate
explanations for these differences; some of this material can be found in the appendix, this is indicated
where relevant.
Comparison of operators’ costs per train-kilometre and vehicle-kilometre
3.26 The number of train kilometres operated is closely correlated with the costs of fuel, electricity and
rolling stock costs. The “cost per train kilometre” measure is calculated for each TOC by dividing their total
annual cost by the number of train kilometres timetabled. The data on timetabled train kilometres are
Office of Rail Regulation | November 2012 | Costs and Revenues of UK Passenger Train Operations 50 3219817
sourced from DeltaRail29 and are the same data used in the National Rail Trends. We have used
timetabled train kilometres in favour of actual values as the former are historically available on a more
reliable basis and, where actual data is available, the deviations from the timetabled values are relatively
small and non-systematic.
3.27 As a measure of volume of service, train kilometres do not precisely reflect the passenger bearing
capacity as it does not differentiate between TOCs that, for example, generally operate 2 or 3 car trains
(Merseyrail, Northern, etc.) and TOCs that typically operate much longer 8 to 12 car formations (Virgin
West Coast, East Coast, Southeastern, Southern, etc.). The operation of fewer but longer trains generally
results in a lower total cost per unit of passenger carrying capacity, but this is not captured when looking at
costs per train kilometre. To put these cost drivers in context, Figure 32 presents total costs per train
kilometre by TOC and Figure 33 presents total costs per vehicle kilometre.
3.28 On average, TOCs spent £11.2 per train kilometre operated and £2.2 per vehicle km operated in
2010-11. Costs per train-kilometre vary from a maximum of £19.4 (East Coast) to a minimum of £7.6
(Arriva Trains Wales). Costs per vehicle-km vary from a maximum of £4.9 (MerseyRail) to a minimum of
£1.7 (National Express East Anglia).
3.29 The main conclusions that can be drawn from these results are:
(a) TOCs with longer train formations (with higher number of vehicles) like Virgin Trains, East Coast and
First Capital Connect had relatively high costs per train kilometre but relatively low costs per vehicle
kilometre – this is likely because, as discussed, the train kilometre measure obscures the cost of running
longer trains30. We discuss the relationship between cost per train-kilometre and the length of the train
formation in the appendix.
(b) LSE TOCs have lower cost per vehicle-kilometre than average, reflecting longer train formations.
(c) Costs per train-kilometre and costs per vehicle-kilometre are not uniform across TOCs. It is important
to note that this does not imply that some TOCs are more efficient than others – there are many
structural factors (e.g. some TOCs are required to use a particular type of rolling stock) that are not
reflected in this analysis. What it does indicate is that there is considerable variation in running costs
between TOCs that cannot be attributed just to differences in volume of service.
29 Train miles are received for both winter and summer timetables for each TOC. Each timetable has train miles for a typical Wednesday, a typical Saturday and typical Sunday. The days chosen relate to the timetable planned to run on the sample ORCATS dates. All trains that are due to run on these days are included regardless of whether they actually do. 30 It should be noted that this effect works in the other direction for vehicle kilometres. That is, whilst looking at costs per train kilometre obscures the effect on costs of running longer trains, costs per vehicle kilometre places disproportionate weight on it – the cost of running the first vehicle is significantly larger than subsequent ones.
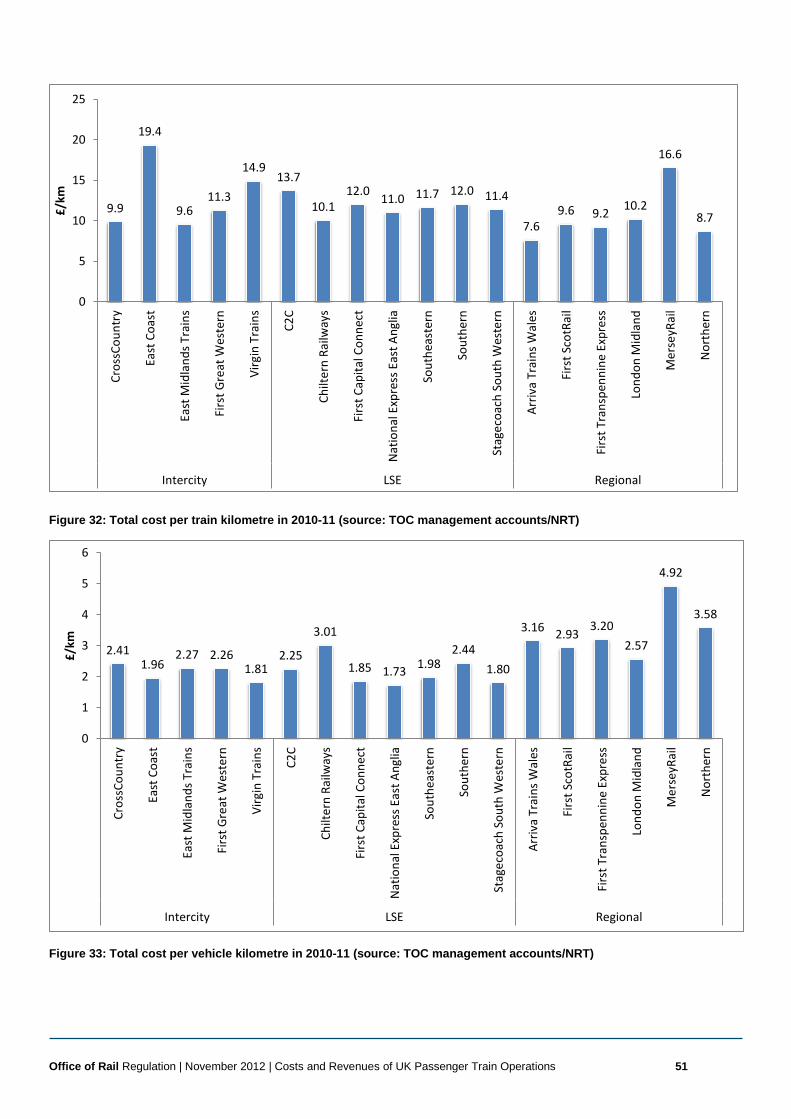
Office of Rail Regulation | November 2012 | Costs and Revenues of UK Passenger Train Operations 51 3219817
Figure 32: Total cost per train kilometre in 2010-11 (source: TOC management accounts/NRT)
Figure 33: Total cost per vehicle kilometre in 2010-11 (source: TOC management accounts/NRT)
9.9
19.4
9.6 11.3
14.9 13.7
10.1 12.0 11.0 11.7 12.0 11.4
7.6 9.6 9.2 10.2
16.6
8.7
0
5
10
15
20
25Cr
ossC
ount
ry
East
Coa
st
East
Mid
land
s Tra
ins
Firs
t Gre
at W
este
rn
Virg
in T
rain
s
C2C
Chilt
ern
Railw
ays
Firs
t Cap
ital C
onne
ct
Nat
iona
l Exp
ress
Eas
t Ang
lia
Sout
heas
tern
Sout
hern
Stag
ecoa
ch S
outh
Wes
tern
Arriv
a Tr
ains
Wal
es
Firs
t Sco
tRai
l
Firs
t Tra
nspe
nnin
e Ex
pres
s
Lond
on M
idla
nd
Mer
seyR
ail
Nor
ther
n
Intercity LSE Regional
£/km
2.41 1.96
2.27 2.26 1.81
2.25
3.01
1.85 1.73 1.98 2.44
1.80
3.16 2.93 3.20 2.57
4.92
3.58
0
1
2
3
4
5
6
Cros
sCou
ntry
East
Coa
st
East
Mid
land
s Tra
ins
Firs
t Gre
at W
este
rn
Virg
in T
rain
s
C2C
Chilt
ern
Railw
ays
Firs
t Cap
ital C
onne
ct
Nat
iona
l Exp
ress
Eas
t Ang
lia
Sout
heas
tern
Sout
hern
Stag
ecoa
ch S
outh
Wes
tern
Arriv
a Tr
ains
Wal
es
Firs
t Sco
tRai
l
Firs
t Tra
nspe
nnin
e Ex
pres
s
Lond
on M
idla
nd
Mer
seyR
ail
Nor
ther
n
Intercity LSE Regional
£/km
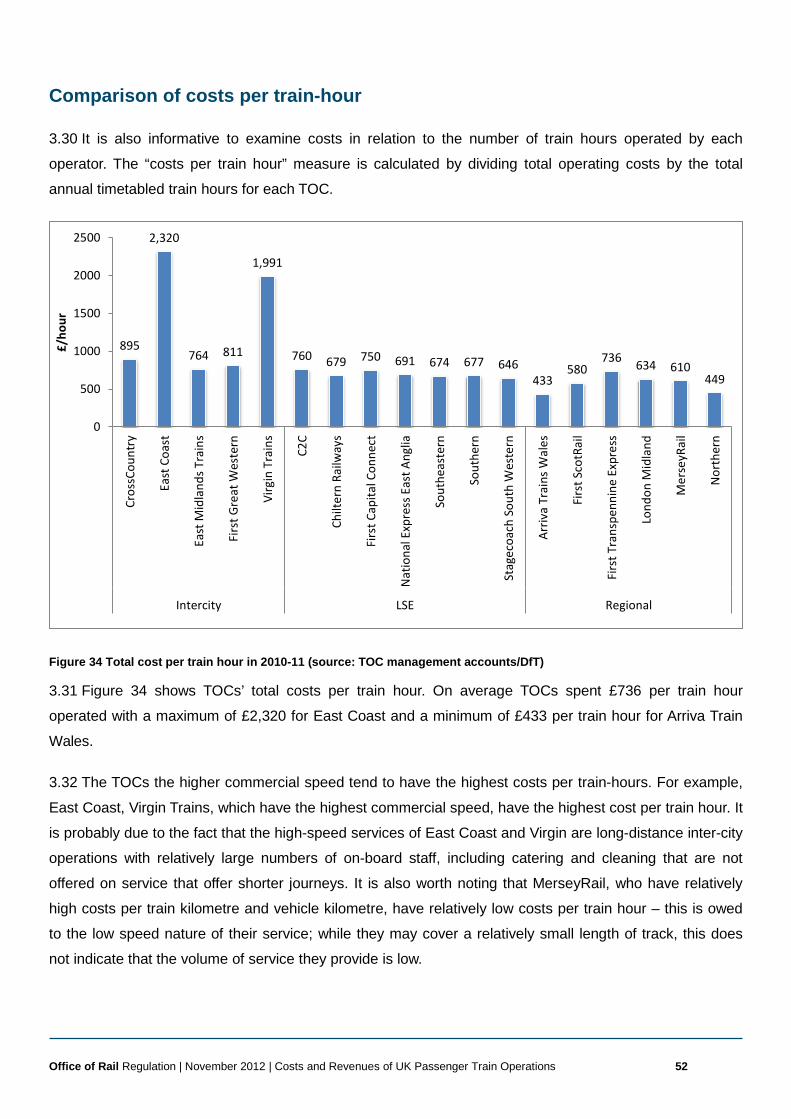
Office of Rail Regulation | November 2012 | Costs and Revenues of UK Passenger Train Operations 52 3219817
Comparison of costs per train-hour
3.30 It is also informative to examine costs in relation to the number of train hours operated by each
operator. The “costs per train hour” measure is calculated by dividing total operating costs by the total
annual timetabled train hours for each TOC.
Figure 34 Total cost per train hour in 2010-11 (source: TOC management accounts/DfT)
3.31 Figure 34 shows TOCs’ total costs per train hour. On average TOCs spent £736 per train hour
operated with a maximum of £2,320 for East Coast and a minimum of £433 per train hour for Arriva Train
Wales.
3.32 The TOCs the higher commercial speed tend to have the highest costs per train-hours. For example,
East Coast, Virgin Trains, which have the highest commercial speed, have the highest cost per train hour. It
is probably due to the fact that the high-speed services of East Coast and Virgin are long-distance inter-city
operations with relatively large numbers of on-board staff, including catering and cleaning that are not
offered on service that offer shorter journeys. It is also worth noting that MerseyRail, who have relatively
high costs per train kilometre and vehicle kilometre, have relatively low costs per train hour – this is owed
to the low speed nature of their service; while they may cover a relatively small length of track, this does
not indicate that the volume of service they provide is low.
895
2,320
764 811
1,991
760 679 750 691 674 677 646 433
580 736 634 610
449
0
500
1000
1500
2000
2500
Cros
sCou
ntry
East
Coa
st
East
Mid
land
s Tra
ins
Firs
t Gre
at W
este
rn
Virg
in T
rain
s
C2C
Chilt
ern
Railw
ays
Firs
t Cap
ital C
onne
ct
Nat
iona
l Exp
ress
Eas
t Ang
lia
Sout
heas
tern
Sout
hern
Stag
ecoa
ch S
outh
Wes
tern
Arriv
a Tr
ains
Wal
es
Firs
t Sco
tRai
l
Firs
t Tra
nspe
nnin
e Ex
pres
s
Lond
on M
idla
nd
Mer
seyR
ail
Nor
ther
n
Intercity LSE Regional
£/ho
ur
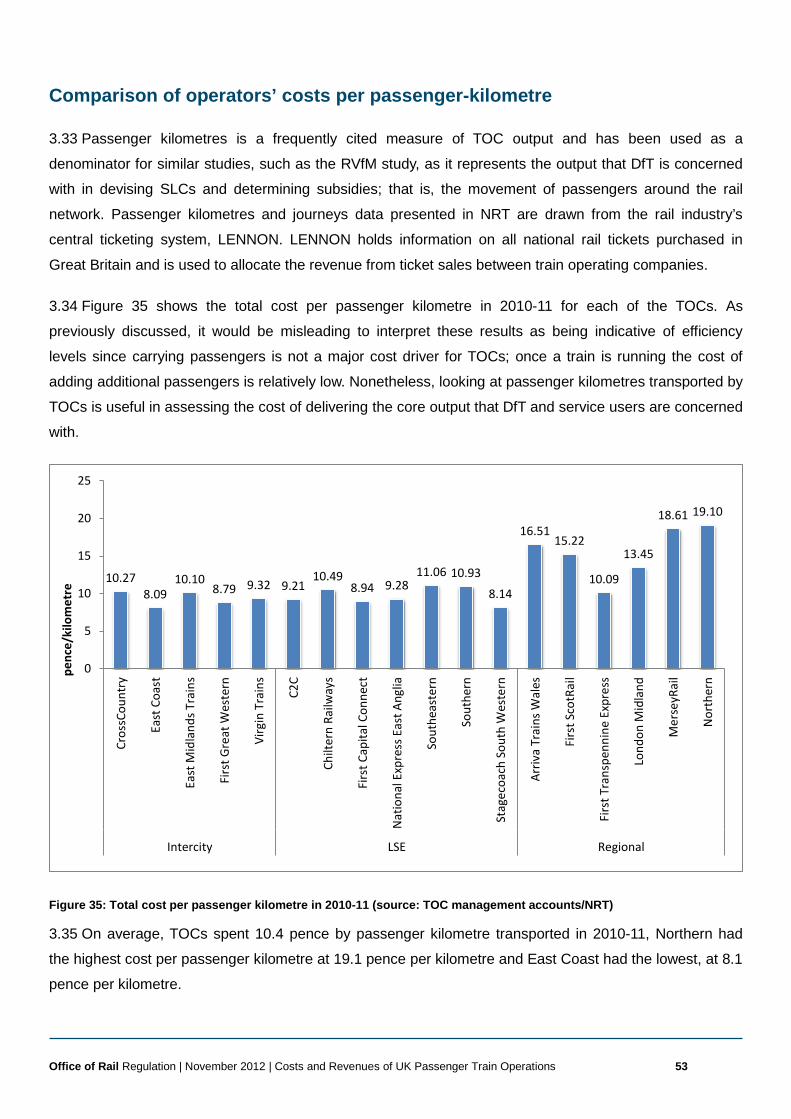
Office of Rail Regulation | November 2012 | Costs and Revenues of UK Passenger Train Operations 53 3219817
Comparison of operators’ costs per passenger-kilometre
3.33 Passenger kilometres is a frequently cited measure of TOC output and has been used as a
denominator for similar studies, such as the RVfM study, as it represents the output that DfT is concerned
with in devising SLCs and determining subsidies; that is, the movement of passengers around the rail
network. Passenger kilometres and journeys data presented in NRT are drawn from the rail industry’s
central ticketing system, LENNON. LENNON holds information on all national rail tickets purchased in
Great Britain and is used to allocate the revenue from ticket sales between train operating companies.
3.34 Figure 35 shows the total cost per passenger kilometre in 2010-11 for each of the TOCs. As
previously discussed, it would be misleading to interpret these results as being indicative of efficiency
levels since carrying passengers is not a major cost driver for TOCs; once a train is running the cost of
adding additional passengers is relatively low. Nonetheless, looking at passenger kilometres transported by
TOCs is useful in assessing the cost of delivering the core output that DfT and service users are concerned
with.
Figure 35: Total cost per passenger kilometre in 2010-11 (source: TOC management accounts/NRT)
3.35 On average, TOCs spent 10.4 pence by passenger kilometre transported in 2010-11, Northern had
the highest cost per passenger kilometre at 19.1 pence per kilometre and East Coast had the lowest, at 8.1
pence per kilometre.
10.27 8.09
10.10 8.79 9.32 9.21
10.49 8.94 9.28
11.06 10.93
8.14
16.51 15.22
10.09
13.45
18.61 19.10
0
5
10
15
20
25
Cros
sCou
ntry
East
Coa
st
East
Mid
land
s Tra
ins
Firs
t Gre
at W
este
rn
Virg
in T
rain
s
C2C
Chilt
ern
Railw
ays
Firs
t Cap
ital C
onne
ct
Nat
iona
l Exp
ress
Eas
t Ang
lia
Sout
heas
tern
Sout
hern
Stag
ecoa
ch S
outh
Wes
tern
Arriv
a Tr
ains
Wal
es
Firs
t Sco
tRai
l
Firs
t Tra
nspe
nnin
e Ex
pres
s
Lond
on M
idla
nd
Mer
seyR
ail
Nor
ther
n
Intercity LSE Regional
penc
e/ki
lom
etre
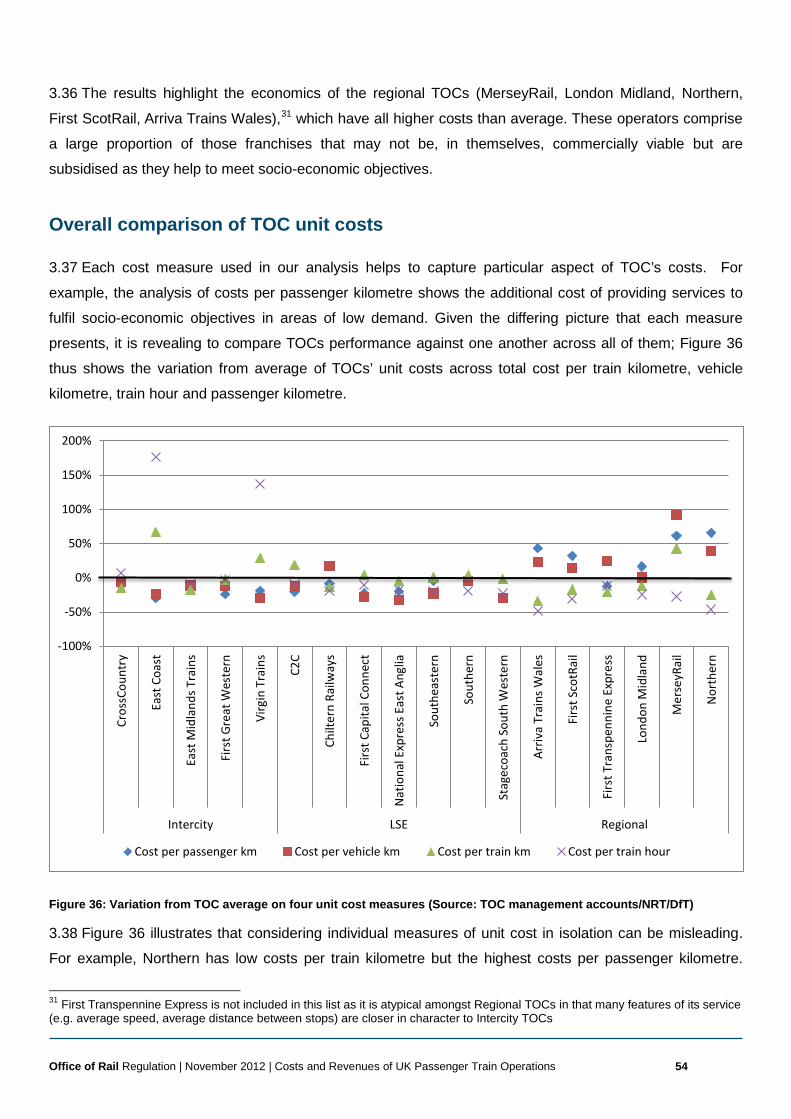
Office of Rail Regulation | November 2012 | Costs and Revenues of UK Passenger Train Operations 54 3219817
3.36 The results highlight the economics of the regional TOCs (MerseyRail, London Midland, Northern,
First ScotRail, Arriva Trains Wales),31 which have all higher costs than average. These operators comprise
a large proportion of those franchises that may not be, in themselves, commercially viable but are
subsidised as they help to meet socio-economic objectives.
Overall comparison of TOC unit costs
3.37 Each cost measure used in our analysis helps to capture particular aspect of TOC’s costs. For
example, the analysis of costs per passenger kilometre shows the additional cost of providing services to
fulfil socio-economic objectives in areas of low demand. Given the differing picture that each measure
presents, it is revealing to compare TOCs performance against one another across all of them; Figure 36
thus shows the variation from average of TOCs’ unit costs across total cost per train kilometre, vehicle
kilometre, train hour and passenger kilometre.
Figure 36: Variation from TOC average on four unit cost measures (Source: TOC management accounts/NRT/DfT)
3.38 Figure 36 illustrates that considering individual measures of unit cost in isolation can be misleading.
For example, Northern has low costs per train kilometre but the highest costs per passenger kilometre.
31 First Transpennine Express is not included in this list as it is atypical amongst Regional TOCs in that many features of its service (e.g. average speed, average distance between stops) are closer in character to Intercity TOCs
-100%
-50%
0%
50%
100%
150%
200%
Cros
sCou
ntry
East
Coa
st
East
Mid
land
s Tra
ins
Firs
t Gre
at W
este
rn
Virg
in T
rain
s
C2C
Chilt
ern
Railw
ays
Firs
t Cap
ital C
onne
ct
Nat
iona
l Exp
ress
Eas
t Ang
lia
Sout
heas
tern
Sout
hern
Stag
ecoa
ch S
outh
Wes
tern
Arriv
a Tr
ains
Wal
es
Firs
t Sco
tRai
l
Firs
t Tra
nspe
nnin
e Ex
pres
s
Lond
on M
idla
nd
Mer
seyR
ail
Nor
ther
n
Intercity LSE Regional
Cost per passenger km Cost per vehicle km Cost per train km Cost per train hour
Office of Rail Regulation | November 2012 | Costs and Revenues of UK Passenger Train Operations 55 3219817
East Coast has the lowest costs per passenger kilometre but the highest cost per train kilometre. Whilst
MerseyRail is significantly above average on measures of cost per train kilometre, vehicle kilometre and
passenger kilometre, they are below average on cost per train hour, which, as previously discussed, can be
attributed to the low speed character of their service.
3.39 Our analysis shows that no TOC is consistently above the average across the four selected unit cost
measures. We have, however, found that four TOCs have costs that are consistently on or below average
across on all measures: Chiltern Railways, First Great Western, National Express East Anglia and
Stagecoach South Western.
3.40 For most of the TOCs that have costs that significantly stand out, we have identified plausible reasons
to explain their difference. As we would expect, these are related to factors such as the number of train
kilometres that a TOC operates, whether or not the frequency of the service, matches its demand, the
length of the train formations, and the offer of services on-board.
Conclusion
3.41 The aim of this report is to increase the transparency of the provision of franchised passenger rail
services and to improve the understanding of costs and cost drivers in the rail industry. This report is a first
step towards further, more detailed analysis of passenger rail provision in the UK.
3.42 At a TOC-wide level, the report sets increases in costs and revenue in the context of increases in
volume of service, both in terms of trains run and passengers carried, and improvements in safety and
punctuality. Comparing between TOCs provides information on the significant differences in key
characteristics between franchises, as well as considering income, subsidy and cost differences between
TOCs. Cost differences between TOCs are placed in the context of differing volumes of service and
different ways of measuring it.
3.43 More in depth analysis of the drivers of train costs would require more detailed and reliable data than
was available at this stage. The initial results presented in this report show the value of and need for
increased transparency in the cost of providing passenger rail services; more detailed information will allow
us to enrich the insights and analysis of this report in subsequent years. Future reports will seek to make
use of more detailed information to conduct more rigorous statistical analysis and to isolate the effects on
costs of particular franchise characteristics.
Office of Rail Regulation | November 2012 | Costs and Revenues of UK Passenger Train Operations 56 3454391
Appendix
This Appendix to the report Costs and Revenues of UK Passenger Train Operators supplements some of
the discussion on cost drivers and service characteristics of the original report.
The Appendix considers the relationship between total costs and the four different measures of output used
in the report: train kilometres, train hours, vehicle kilometres and passenger kilometres. It looks at the
differences in length of route operated and average speed between TOCs, which were not discussed in the
main report. It also looks at identifying other drivers of costs besides differences in output, considering
variation in the average number of vehicles per train and the number of staff employed. It concludes with a
map of franchised UK TOCs for the reader’s reference.
The Appendix is intended to provide context and further analysis to some of the material presented in the
main report. Subsequent versions of this report will aim to develop the kind of analysis looked at in this
Appendix by using econometric analysis to isolate the independent effects of particular cost drivers. This
will enable more reliable comparison between TOCs and a more fruitful discussion of the direct effects of
particular cost drivers.
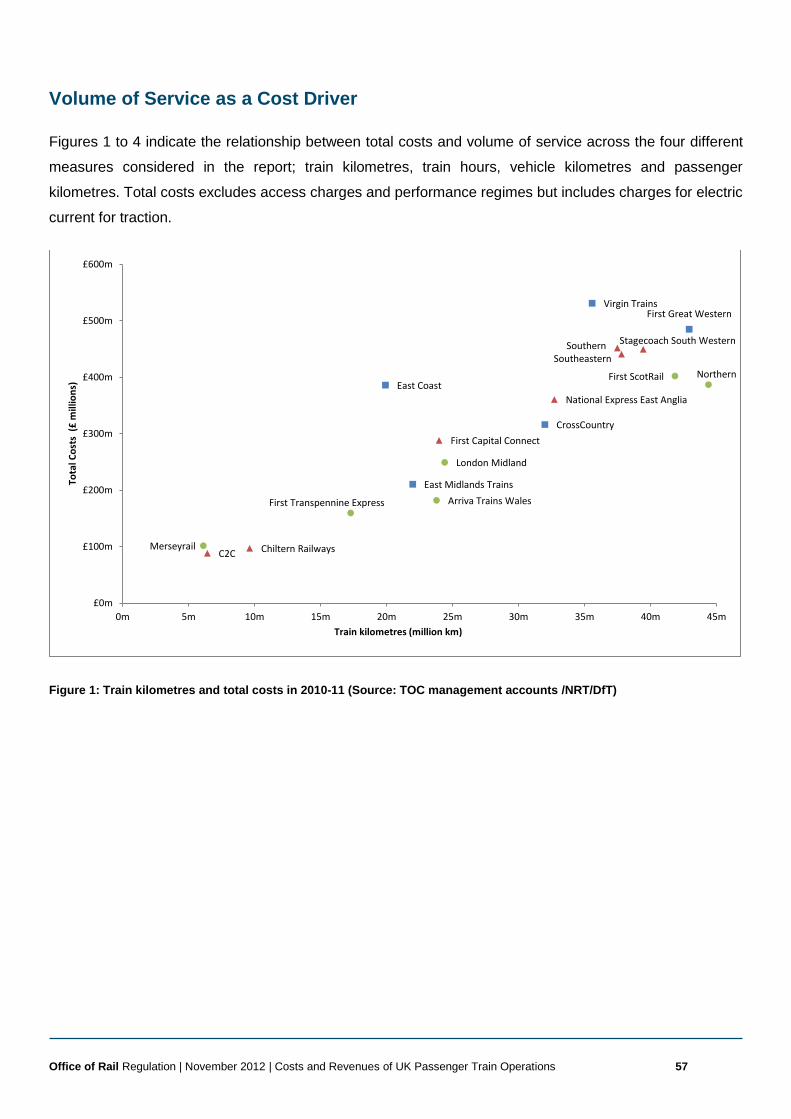
Office of Rail Regulation | November 2012 | Costs and Revenues of UK Passenger Train Operations 57 3454391
Volume of Service as a Cost Driver
Figures 1 to 4 indicate the relationship between total costs and volume of service across the four different
measures considered in the report; train kilometres, train hours, vehicle kilometres and passenger
kilometres. Total costs excludes access charges and performance regimes but includes charges for electric
current for traction.
Figure 1: Train kilometres and total costs in 2010-11 (Source: TOC management accounts /NRT/DfT)
Arriva Trains Wales
CrossCountry
C2C Chiltern Railways
London Midland
First Capital Connect
First Great Western
East Midlands Trains
Southeastern
Northern
National Express East Anglia
Southern Stagecoach South Western
First Transpennine Express
Virgin Trains
East Coast First ScotRail
Merseyrail
£0m
£100m
£200m
£300m
£400m
£500m
£600m
0m 5m 10m 15m 20m 25m 30m 35m 40m 45m
Tota
l Co
sts
(£
mill
ion
s)
Train kilometres (million km)
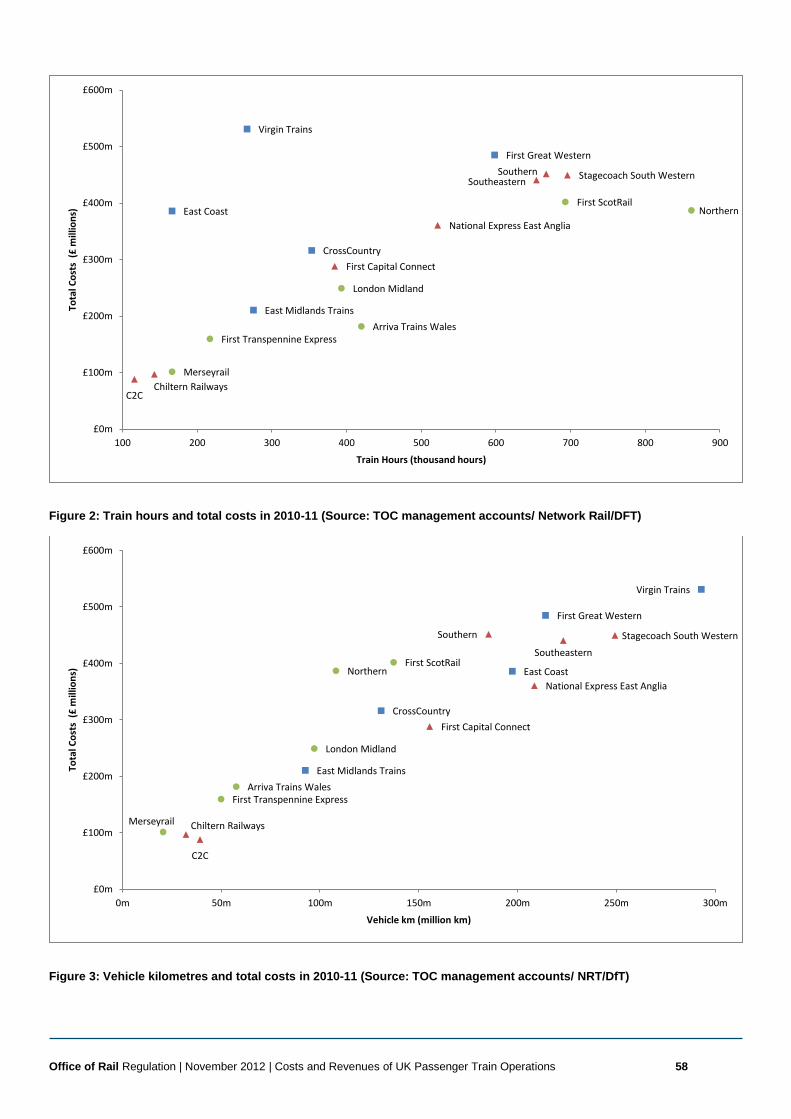
Office of Rail Regulation | November 2012 | Costs and Revenues of UK Passenger Train Operations 58 3454391
Figure 2: Train hours and total costs in 2010-11 (Source: TOC management accounts/ Network Rail/DFT)
Figure 3: Vehicle kilometres and total costs in 2010-11 (Source: TOC management accounts/ NRT/DfT)
Arriva Trains Wales
CrossCountry
C2C Chiltern Railways
London Midland
First Capital Connect
First Great Western
East Midlands Trains
Southeastern
Northern
National Express East Anglia
Southern Stagecoach South Western
First Transpennine Express
Virgin Trains
East Coast First ScotRail
Merseyrail
£0m
£100m
£200m
£300m
£400m
£500m
£600m
100 200 300 400 500 600 700 800 900
Tota
l Co
sts
(£
mill
ion
s)
Train Hours (thousand hours)
Arriva Trains Wales
CrossCountry
C2C
Chiltern Railways
London Midland
First Capital Connect
First Great Western
East Midlands Trains
Southeastern
Northern
National Express East Anglia
Southern Stagecoach South Western
First Transpennine Express
Virgin Trains
East Coast First ScotRail
Merseyrail
£0m
£100m
£200m
£300m
£400m
£500m
£600m
0m 50m 100m 150m 200m 250m 300m
Tota
l Co
sts
(£
mill
ion
s)
Vehicle km (million km)
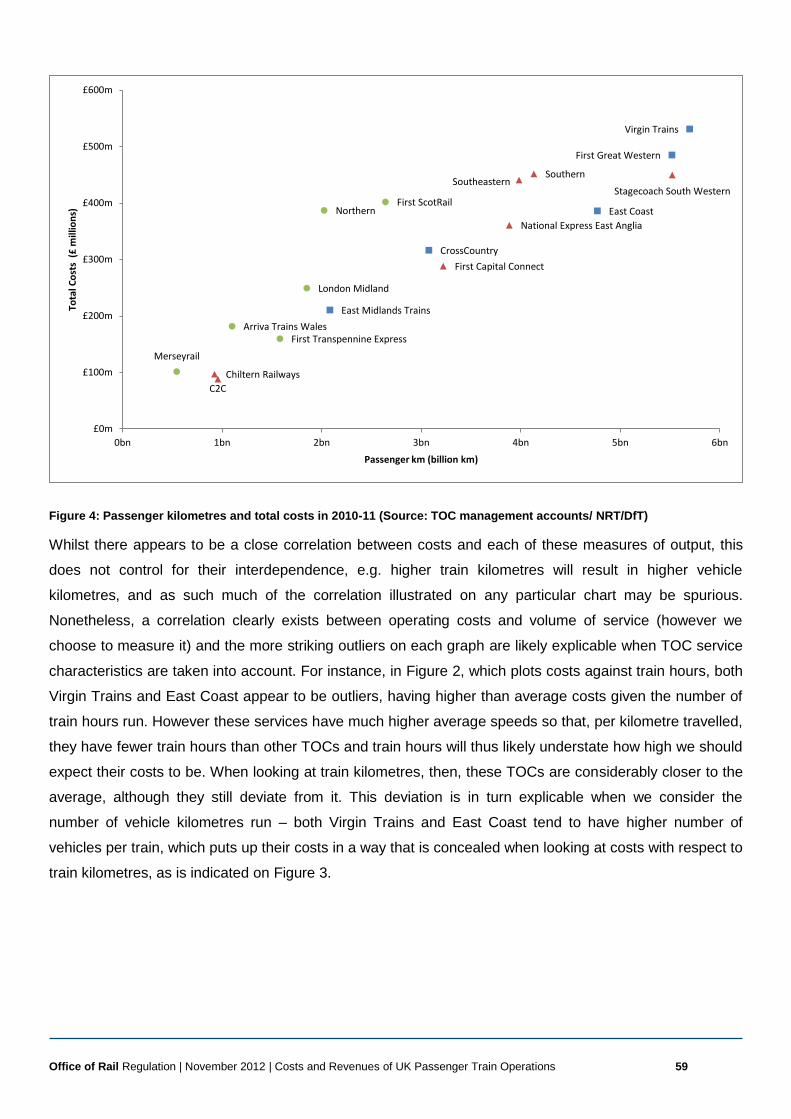
Office of Rail Regulation | November 2012 | Costs and Revenues of UK Passenger Train Operations 59 3454391
Figure 4: Passenger kilometres and total costs in 2010-11 (Source: TOC management accounts/ NRT/DfT)
Whilst there appears to be a close correlation between costs and each of these measures of output, this
does not control for their interdependence, e.g. higher train kilometres will result in higher vehicle
kilometres, and as such much of the correlation illustrated on any particular chart may be spurious.
Nonetheless, a correlation clearly exists between operating costs and volume of service (however we
choose to measure it) and the more striking outliers on each graph are likely explicable when TOC service
characteristics are taken into account. For instance, in Figure 2, which plots costs against train hours, both
Virgin Trains and East Coast appear to be outliers, having higher than average costs given the number of
train hours run. However these services have much higher average speeds so that, per kilometre travelled,
they have fewer train hours than other TOCs and train hours will thus likely understate how high we should
expect their costs to be. When looking at train kilometres, then, these TOCs are considerably closer to the
average, although they still deviate from it. This deviation is in turn explicable when we consider the
number of vehicle kilometres run – both Virgin Trains and East Coast tend to have higher number of
vehicles per train, which puts up their costs in a way that is concealed when looking at costs with respect to
train kilometres, as is indicated on Figure 3.
Arriva Trains Wales
CrossCountry
C2C
Chiltern Railways
London Midland
First Capital Connect
First Great Western
East Midlands Trains
Southeastern
Northern
National Express East Anglia
Southern
Stagecoach South Western
First Transpennine Express
Virgin Trains
East Coast First ScotRail
Merseyrail
£0m
£100m
£200m
£300m
£400m
£500m
£600m
0bn 1bn 2bn 3bn 4bn 5bn 6bn
Tota
l Co
sts
(£
mill
ion
s)
Passenger km (billion km)
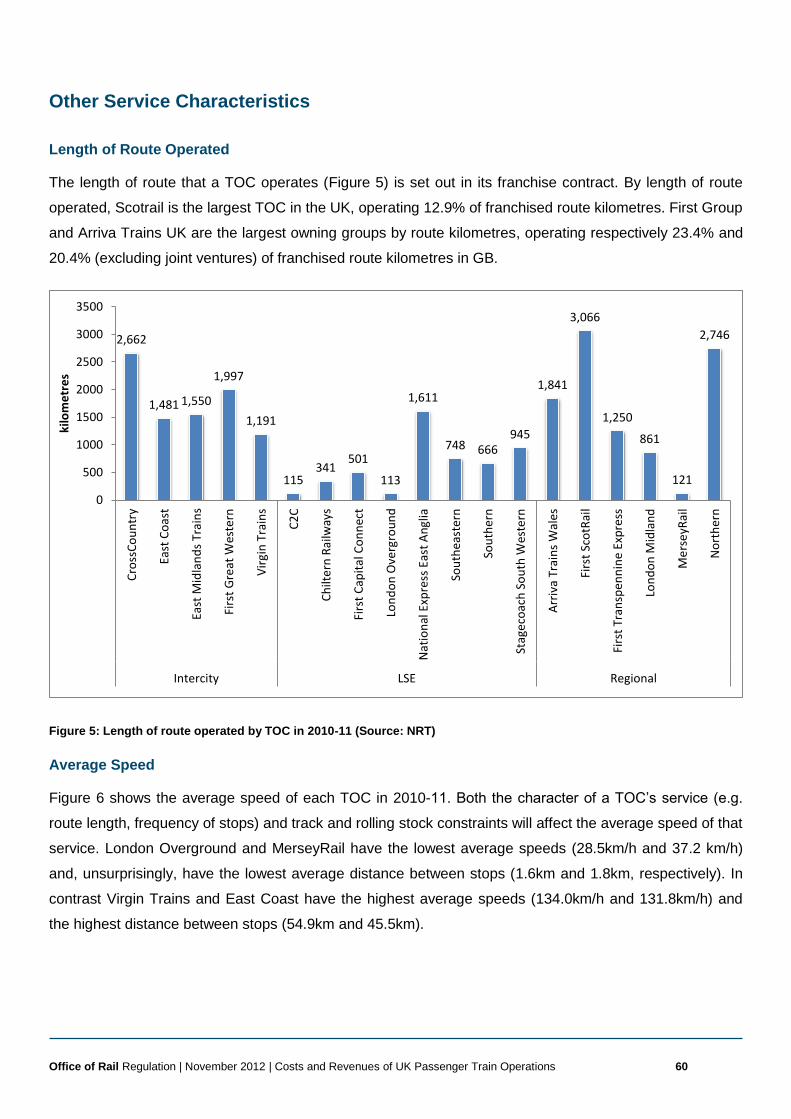
Office of Rail Regulation | November 2012 | Costs and Revenues of UK Passenger Train Operations 60 3454391
Other Service Characteristics
Length of Route Operated
The length of route that a TOC operates (Figure 5) is set out in its franchise contract. By length of route
operated, Scotrail is the largest TOC in the UK, operating 12.9% of franchised route kilometres. First Group
and Arriva Trains UK are the largest owning groups by route kilometres, operating respectively 23.4% and
20.4% (excluding joint ventures) of franchised route kilometres in GB.
Figure 5: Length of route operated by TOC in 2010-11 (Source: NRT)
Average Speed
Figure 6 shows the average speed of each TOC in 2010-11. Both the character of a TOC’s service (e.g.
route length, frequency of stops) and track and rolling stock constraints will affect the average speed of that
service. London Overground and MerseyRail have the lowest average speeds (28.5km/h and 37.2 km/h)
and, unsurprisingly, have the lowest average distance between stops (1.6km and 1.8km, respectively). In
contrast Virgin Trains and East Coast have the highest average speeds (134.0km/h and 131.8km/h) and
the highest distance between stops (54.9km and 45.5km).
2,662
1,481 1,550
1,997
1,191
115 341
501
113
1,611
748 666 945
1,841
3,066
1,250
861
121
2,746
0
500
1000
1500
2000
2500
3000
3500
Cro
ssC
ou
ntr
y
East
Co
ast
East
Mid
lan
ds
Trai
ns
Firs
t G
reat
Wes
tern
Vir
gin
Tra
ins
C2
C
Ch
ilte
rn R
ailw
ays
Firs
t C
apit
al C
on
nec
t
Lon
do
n O
verg
rou
nd
Nat
ion
al E
xpre
ss E
ast
An
glia
Sou
thea
ster
n
Sou
ther
n
Stag
eco
ach
So
uth
Wes
tern
Arr
iva
Trai
ns
Wal
es
Firs
t Sc
otR
ail
Firs
t Tr
ansp
enn
ine
Exp
ress
Lon
do
n M
idla
nd
Me
rse
yRai
l
No
rth
ern
Intercity LSE Regional
kilo
me
tre
s
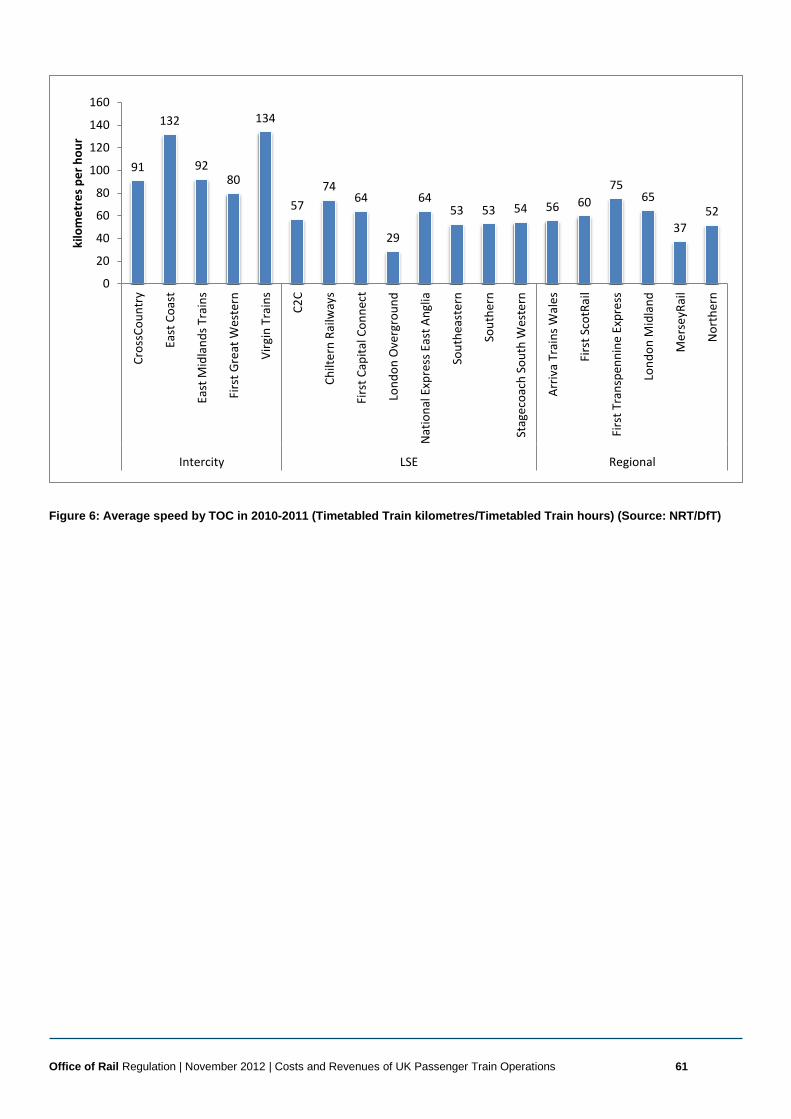
Office of Rail Regulation | November 2012 | Costs and Revenues of UK Passenger Train Operations 61 3454391
Figure 6: Average speed by TOC in 2010-2011 (Timetabled Train kilometres/Timetabled Train hours) (Source: NRT/DfT)
91
132
92 80
134
57
74 64
29
64 53 53 54 56 60
75 65
37
52
0
20
40
60
80
100
120
140
160
Cro
ssC
ou
ntr
y
East
Co
ast
East
Mid
lan
ds
Trai
ns
Firs
t G
reat
Wes
tern
Vir
gin
Tra
ins
C2
C
Ch
ilte
rn R
ailw
ays
Firs
t C
apit
al C
on
nec
t
Lon
do
n O
verg
rou
nd
Nat
ion
al E
xpre
ss E
ast
An
glia
Sou
thea
ster
n
Sou
ther
n
Stag
eco
ach
So
uth
Wes
tern
Arr
iva
Trai
ns
Wal
es
Firs
t Sc
otR
ail
Firs
t Tr
ansp
enn
ine
Exp
ress
Lon
do
n M
idla
nd
Me
rse
yRai
l
No
rth
ern
Intercity LSE Regional
kilo
me
tre
s p
er
ho
ur
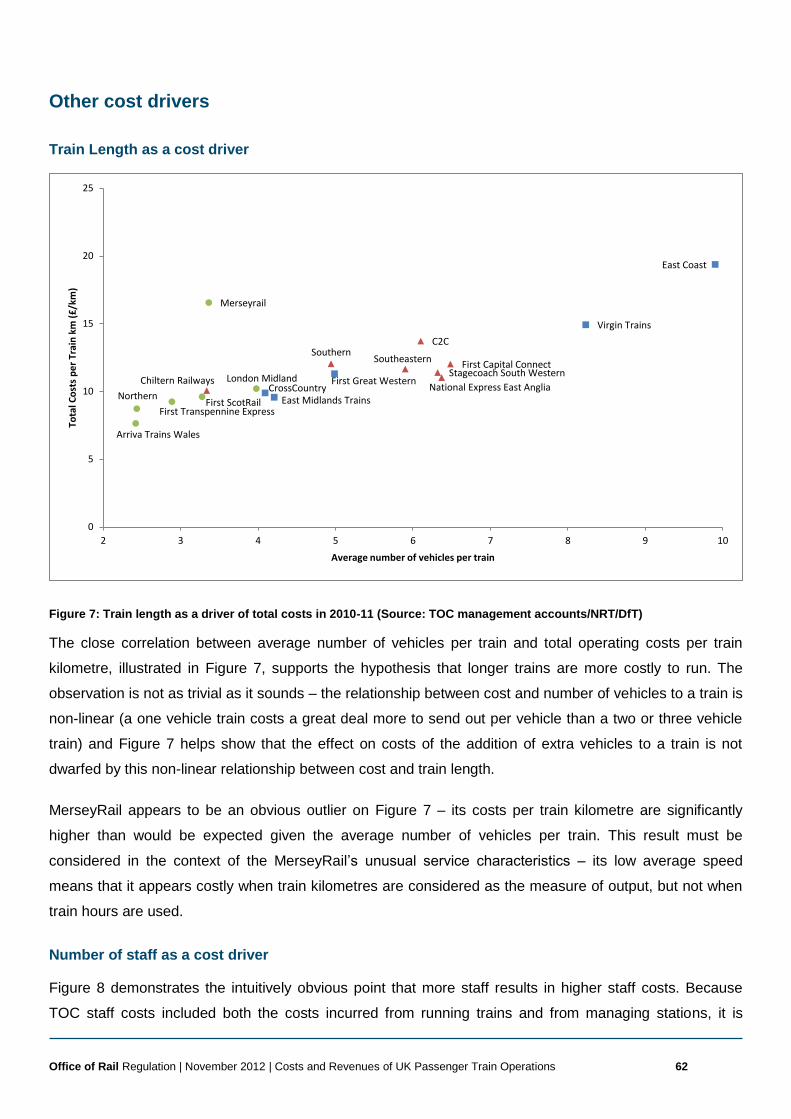
Office of Rail Regulation | November 2012 | Costs and Revenues of UK Passenger Train Operations 62 3454391
Other cost drivers
Train Length as a cost driver
Figure 7: Train length as a driver of total costs in 2010-11 (Source: TOC management accounts/NRT/DfT)
The close correlation between average number of vehicles per train and total operating costs per train
kilometre, illustrated in Figure 7, supports the hypothesis that longer trains are more costly to run. The
observation is not as trivial as it sounds – the relationship between cost and number of vehicles to a train is
non-linear (a one vehicle train costs a great deal more to send out per vehicle than a two or three vehicle
train) and Figure 7 helps show that the effect on costs of the addition of extra vehicles to a train is not
dwarfed by this non-linear relationship between cost and train length.
MerseyRail appears to be an obvious outlier on Figure 7 – its costs per train kilometre are significantly
higher than would be expected given the average number of vehicles per train. This result must be
considered in the context of the MerseyRail’s unusual service characteristics – its low average speed
means that it appears costly when train kilometres are considered as the measure of output, but not when
train hours are used.
Number of staff as a cost driver
Figure 8 demonstrates the intuitively obvious point that more staff results in higher staff costs. Because
TOC staff costs included both the costs incurred from running trains and from managing stations, it is
Arriva Trains Wales
CrossCountry
C2C
Chiltern Railways London Midland
First Capital Connect
First Great Western
East Midlands Trains
Southeastern
Northern National Express East Anglia
Southern
Stagecoach South Western
First Transpennine Express
Virgin Trains
East Coast
First ScotRail
Merseyrail
0
5
10
15
20
25
2 3 4 5 6 7 8 9 10
Tota
l Co
sts
pe
r Tr
ain
km
(£
/km
)
Average number of vehicles per train
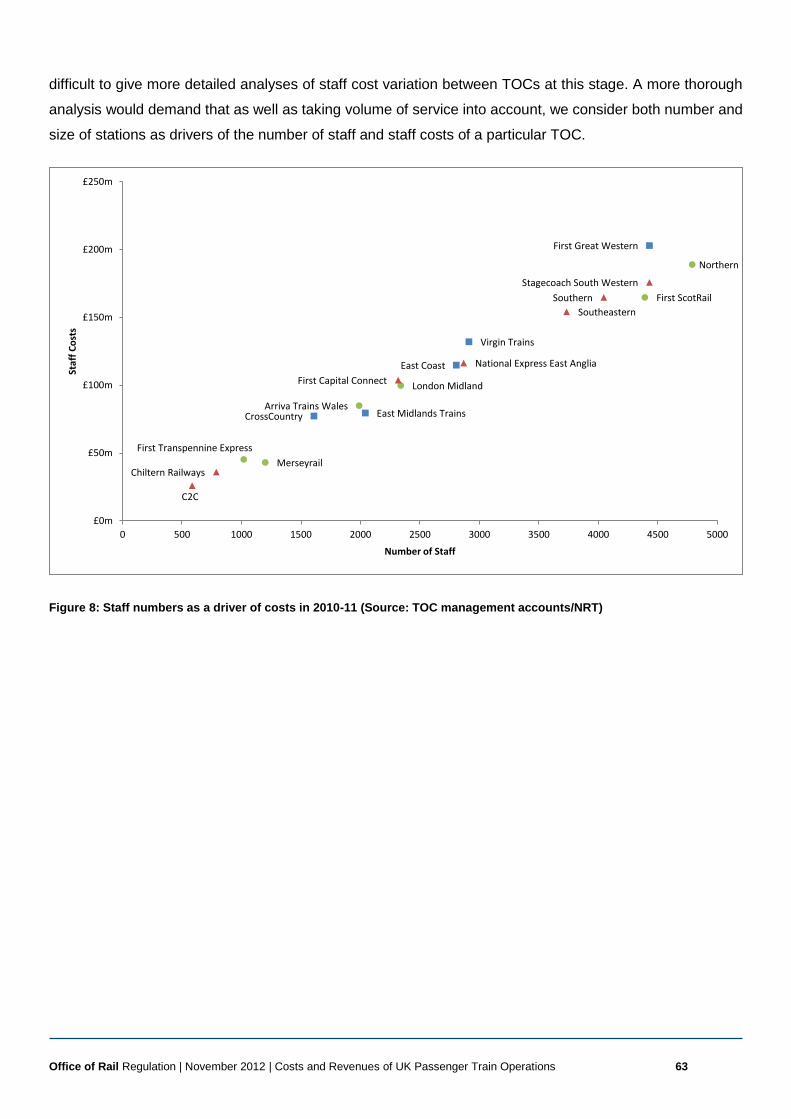
Office of Rail Regulation | November 2012 | Costs and Revenues of UK Passenger Train Operations 63 3454391
difficult to give more detailed analyses of staff cost variation between TOCs at this stage. A more thorough
analysis would demand that as well as taking volume of service into account, we consider both number and
size of stations as drivers of the number of staff and staff costs of a particular TOC.
Figure 8: Staff numbers as a driver of costs in 2010-11 (Source: TOC management accounts/NRT)
Arriva Trains Wales CrossCountry
C2C
Chiltern Railways
London Midland First Capital Connect
First Great Western
East Midlands Trains
Southeastern
Northern
National Express East Anglia
Southern
Stagecoach South Western
First Transpennine Express
Virgin Trains
East Coast
First ScotRail
Merseyrail
£0m
£50m
£100m
£150m
£200m
£250m
0 500 1000 1500 2000 2500 3000 3500 4000 4500 5000
Staf
f C
ost
s
Number of Staff
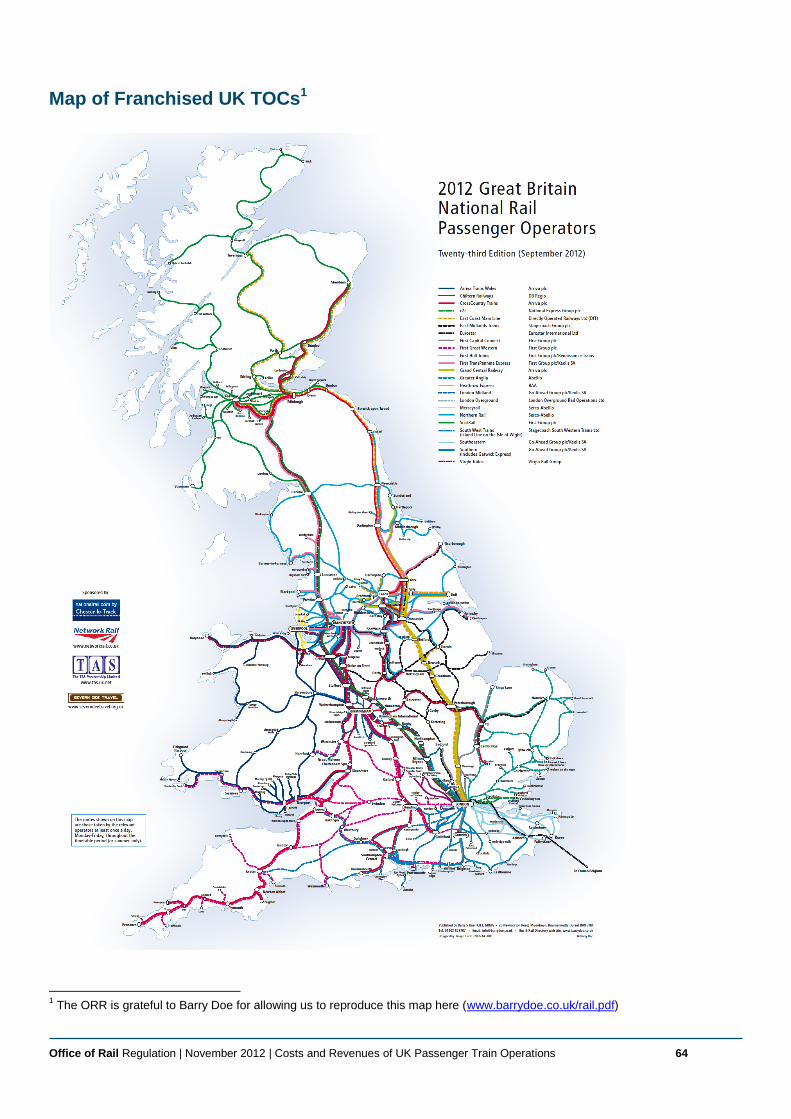
Office of Rail Regulation | November 2012 | Costs and Revenues of UK Passenger Train Operations 64 3454391 3454391
Map of Franchised UK TOCs1
1 The ORR is grateful to Barry Doe for allowing us to reproduce this map here (www.barrydoe.co.uk/rail.pdf)
3219817
© Crown copyright 2012
You may re-use this information (excluding logos) free of charge in any format or medium, under the terms of the Open Government Licence. To view this licence, visit www.nationalarchives.gov.uk/doc/open-government-licence/ or email: [email protected]
Where we have identified any third party copyright information you will need to obtain permission from the copyright holders concerned.


![[Lean 101] Costs & Revenues - Breaking even or Breaking bad???](https://img.pdfslide.us/doc/110x75/58777a001a28ab5b568b76c5/lean-101-costs-revenues-breaking-even-or-breaking-bad.jpg)