Embed Size (px)
Citation preview

REPORT ON THE DEVELOPMENT OF COST OPTIMAL CALCULATIONS AND GAP ANALYSIS FOR BUILDINGS IN IRELAND UNDER DIRECTIVE 2010/31/EU ON THE ENERGY
PERFORMANCE OF BUILDINGS (RECAST)
Section 2 –Non Residential
IRELAND
MARCH 2013

Building Engineering
Department of the Environment, Community and Local Government
22/02/13
Cost Optimal Calculations and Gap Analysis for recast EPBD for Non-Residential Buildings

Prepared by: ............................................................. Checked by: ........................................................................ Chris Pountney and David Ross David Ross Senior Consultant, Regional Director Regional Director Approved by: ............................................................. Andrew Cripps Regional Director
Cost Optimal Calculations and Gap Analysis for recast EPBD for Non-Residential Buildings Rev No Comments Checked by Approved
by Date
1
AECOM House, 63-77 Victoria Street, St Albans, Hertfordshire, AL1 3ER Telephone: 01727 535000 Website: http://www.aecom.com Job No: 60283099 Date Created 22/02/13 This document has been prepared by AECOM Limited for the sole use of our client (the “Client”) and in accordance with generally accepted consultancy principles, the budget for fees and the terms of reference agreed between AECOM Limited and the Client. Any information provided by third parties and referred to herein has not been checked or verified by AECOM Limited, unless otherwise expressly stated in the document. No third party may rely upon this document without the prior and express written agreement of AECOM Limited.

1. Introduction ...................................................................................................................................................... 1
2. Reference Buildings ........................................................................................................................................ 3
3. Measures and Packages ............................................................................................................................... 18
4. Calculation of Primary Energy Demand for the Measures ........................................................................ 28
5. Global Cost Calculation ................................................................................................................................ 43
6. Cost Optimal Level for Reference Buildings .............................................................................................. 78
7. Comparison of Current Regulations and Cost Optimal Level .................................................................. 87
Table of Contents

AECOM Cost Optimal Calculations and Gap Analysis for recast EPBD for Non-Residential Buildings 1
This report details work undertaken for the Department of the Environment, Community and Local Government. It describes work to research and develop draft cost-optimal calculations and a gap analysis for non-residential buildings in accordance with Article 5 of Directive 2010/31/EU of the European Parliament and of the Council of 19 May 2010 on the energy performance of buildings (recast) (hereinafter referred to as the recast EPBD). In doing so, we have paid regard to Commission Delegated Regulation (EU) No 244/2012 of 16 January 2012 supplementing Directive 2010/31/EU of the European Parliament and of the Council on the energy performance of buildings by establishing a comparative methodology framework for calculating cost-optimal levels of minimum energy performance requirements for buildings and building elements (hereinafter referred to as the Cost-Optimal Regulation) and the associated Guidelines accompanying Commission Delegated Regulation (EU) No 244/2012 of 16 January 2012 supplementing Directive 2010/31/EU of the European Parliament and of the Council on the energy performance of buildings by establishing a comparative methodology framework for calculating cost-optimal levels of minimum energy performance requirements for buildings and building elements. We have based the format of this report upon the reporting template provided in Annex 3 of the Cost-Optimal Regulation. We have adapted the template where we have found it easier to present the data, although not losing any of the desired content.
1. Introduction

AECOM Cost Optimal Calculations and Gap Analysis for recast EPBD for Non-Residential Buildings 2

AECOM Cost Optimal Calculations and Gap Analysis for recast EPBD for Non-Residential Buildings 3
2.1 New Buildings
According to Annex 1 of Cost Optimal Regulation, member states should establish at least one reference building for office buildings and also establish reference buildings for other non-residential building categories listed in Annex I of the recast EPBD for which specific energy performance requirements exist. We note that in Ireland, energy performance requirements are set for all non-residential buildings. Hence, we have considered the wider list of non-residential buildings included in the recast EPBD.
We have selected reference buildings based on the following four building categories.
1. Office buildings
2. Educational buildings
3. Hotels and restaurants
4. Wholesale and retail services buildings
In addition, hospitals and sport facilities were included in Annex I of the recast EPBD. We have chosen not to analyse such buildings in this work. The main reason for this is that the other buildings in this list encompass a wide range of servicing strategies and are representative of the majority of the non domestic building stock. Hence, this provides a sufficient understanding of the gap between current Regulations and the Cost Optimal Level. In addition, restricting the number of buildings allows for a more detailed analysis, so that a greater number of measures can be included in the cost-optimal calculations.
For the office building, hotel and restaurants, and wholesale and retail services buildings, we have started from building models used to develop Building Regulations for energy performance requirements within the UK. These typical building models (not actual buildings) have previously been agreed with Government and industry as being appropriate. Given the similar types of building construction in Ireland and the UK, we have adopted similar building models here.
However, we have amended these buildings such that their building floor area reflects Irish data. The planning permissions granted in 2010 were tabulated (Table 2.1). This Table only shows buildings relevant for this analysis. A typical building size for each Reference Building has been suggested by taking the mean building floor area.
The final floor areas for these buildings are shown in Table 2.2. These are slightly amended from those given in Table 2.1. As we are modelling a hotel, it was felt that the floor area should be greater than in Table 2.1 as this also encompassed smaller cafes etc.. The retail floor area has been rounded from that given in Table 2.1.
2. Reference Buildings

AECOM Cost Optimal Calculations and Gap Analysis for recast EPBD for Non-Residential Buildings 4
Table 2.1: 2010 Planning Permissions Granted
Total Number
Total Area
(000 m²)
Reference Building
Mean Area (m²)
Hotels, restaurants and cafes 69 122 Hotel 1,7681 Buildings for trade and administration buildings for other economic activities 188 238 Retail 1,266
Office development, buildings for financing and insurance 92 164 Office 1,783 For the school building, we have used a primary school building. The model is based on an exemplar building provided by the Department of Education and Skills - http://www.education.ie/en/School-Design/Exemplars-Template-Designs/Exemplars-and-Template-Designs.html.
A summary of the buildings, construction type and servicing strategy are shown in Table 2.2. In total five Reference Buildings have been considered. Both natural ventilated and air conditioned serviced buildings have been considered – and splitting office buildings between both types. Furthermore both cavity wall and steel frame constructed buildings have been considered with the most appropriate construction type selected for each building category. This should provide a good estimate of the difference between national Regulations and cost optimal levels.
Table 2.2: Building Models
Building Category Construction type
Cavity Wall Steel Frame Retail (Air Conditioned) 1,250 m² Office (Natural Ventilation) 1,500 m² Office (Air Conditioned) 1,500 m² School (Primary – Natural Ventilation) 2,300 m² Hotel (Air Conditioned) 2,500 m²
Please note that the floor areas are calculated by taking linear measurements between the finished internal faces of the walls.
For the purpose of this work, it has been assumed that the buildings will be constructed in Dublin. This area is the focus of current construction activities. Hence, we have considered climate and cost data relevant for the Dublin geographical area.
Table 2.3 provides a more detailed summary of the Reference Buildings using the template provided with the Cost Optimal Regulation. The component level requirements that set the minimum performance standards for new non-residential buildings are outlined in Appendix A.
1 An analysis of 2005-2007 (period of peak construction) planning permissions for 943 hotels had an average floor area of 2643 m2. This has been reflected in Table 2.2. Other average floor areas in the 2005 to 2007 period were similar to 2010.

AECOM Cost Optimal Calculations and Gap Analysis for recast EPBD for Non-Residential Buildings 5
Table 2.3: Reference Buildings for New Buildings
Building Category
Building Geometry
Shares of window area on the building
envelope and windows with no
solar access
Floor area m2 as used in
building code
Typical energy performance kWh/m2/yr
Component level requirements
Area of N/W/S/E facade (m²)
Volume (m³)
Ratio of window area over total
building envelope area separately for N/W/S/E facades
Primary energy for each building
model according to current national
regulations
These are minimum
requirements for different elemental
components Retail (Air Conditioned) 200 / 100 / 200 / 100 4,900 0 / 0 / 0.3 / 0 1,250 726 See Appendix A
Office (Natural Ventilation) 280 / 126 / 280 / 126 5,040 0.4 / 0.4 / 0.4 / 0.4 1,500 247
Office (Air Conditioned) 280 / 126 / 280 / 126 5,040 0.4 / 0.4 / 0.4 / 0.4 1,500 406
School (Primary – Natural Ventilation)
413 / 339 / 392 / 331 8,700 0.23 / 0.31 / 0.3 / 0 2,300 110
Hotel (Air Conditioned) 413 / 492 / 441 / 415 8,875 0.28 / 0.3 / 0.3 / 0.3 2,500 508
Tables 2.4a-e provides a summary of the energy performance relevant data used in the modelling for each of the five reference buildings.

AECOM Cost Optimal Calculations and Gap Analysis for recast EPBD for Non-Residential Buildings 6
Table 2.4a: Energy Performance Relevant Data – Retail Building
Building: Retail Quantity Unit
Calculation
Method and tool(s) SBEM v.3.5.b
Primary energy conversion factors (averaged over calculation period):
Gas 1.10 kWh/kWh Grid Supplied Electricity 1.97
On-site Generated Electricity 1.97
Climate Location Dublin Climate data SBEM v.3.5.b climate data file Terrain location Sub-urban. The impact of surrounding buildings has not been included.
Geometry Length x Width x Height 50 x 25 x 4 m
Systems
Ventilation system Air changes per hour 1 1/hr Heat recovery efficiency 0 %
Heating system
Generation 86 % Distribution 95 % Emission - % Control - %
Cooling system
Generation 350 % Distribution 66 % Emission - % Control - %
DHW system
Generation 75 % Distribution 60 % Emission - % Control - %
Setpoints and Schedules
Temperature setpoint Winter 20 ºC Summer 23 ºC
Operation schedules All schedules are defined by the SBEM v.3.5.b activity database.
Energy Use
Energy contribution of main passive strategies
Natural ventilation These energy savings are not reported separately. Daylight lighting control
Heating energy 69 kWh/m²/yr Cooling energy 113 kWh/m²/yr DHW energy 2 kWh/m²/yr Lighting energy 179 kWh/m²/yr Auxiliary energy 35 kWh/m²/yr
Energy Generation This building has no on-site energy generation.
Energy Consumption
Delivered energy Fossil fuel 69 kWh/m²/yr Electricity 330 Other 0 kWh/m²/yr
Primary energy 726 kWh/m²/yr

AECOM Cost Optimal Calculations and Gap Analysis for recast EPBD for Non-Residential Buildings 7
Table 2.4b: Energy Performance Relevant Data – Office Naturally Ventilated
Building: Office (NV) Quantity Unit
Calculation
Method and tool(s) SBEM v.3.5.b
Primary energy conversion factors (averaged over calculation period):
Gas 1.10 kWh/kWh Grid Supplied Electricity 1.97
On-site Generated Electricity 1.97
Climate Location Dublin Climate data SBEM v.3.5.b climate data file Terrain location Sub-urban. The impact of surrounding buildings has not been included.
Geometry Length x Width x Height 14 x 18 x 7 m
Systems
Ventilation system Air changes per hour - 1/hr Heat recovery efficiency - %
Heating system
Generation 86 % Distribution 95 % Emission - % Control - %
Cooling system
Generation - % Distribution - % Emission - % Control - %
DHW system
Generation 75 % Distribution 60 % Emission - % Control - %
Setpoints and Schedules
Temperature setpoint Winter 20 ºC Summer - ºC
Operation schedules All schedules are defined by the SBEM v.3.5.b activity database.
Energy Use
Energy contribution of main passive strategies
Natural ventilation These energy savings are not reported separately. Daylight lighting control
Heating energy 91 kWh/m²/yr Cooling energy 0 kWh/m²/yr DHW energy 10 kWh/m²/yr Lighting energy 59 kWh/m²/yr Auxiliary energy 6 kWh/m²/yr
Energy Generation This building has no on-site energy generation.
Energy Consumption
Delivered energy Fossil fuel 91 kWh/m²/yr Electricity 75 kWh/m²/yr Other 0 kWh/m²/yr
Primary energy 247 kWh/m²/yr

AECOM Cost Optimal Calculations and Gap Analysis for recast EPBD for Non-Residential Buildings 8
Table 2.4c: Energy Performance Relevant Data – Office Air Conditioned
Building: Office (AC) Quantity Unit
Calculation
Method and tool(s) SBEM v.3.5.b
Primary energy conversion factors (averaged over calculation period):
Gas 1.10 kWh/kWh Grid Supplied Electricity 1.97
On-site Generated Electricity 1.97
Climate Location Dublin Climate data SBEM v.3.5.b climate data file Terrain location Sub-urban. The impact of surrounding buildings has not been included.
Geometry Length x Width x Height 14 x 18 x 7 m
Systems
Ventilation system Air changes per hour 1.2 1/hr Heat recovery efficiency - %
Heating system
Generation 86 % Distribution 95 % Emission - % Control - %
Cooling system
Generation 350 % Distribution 66 % Emission - % Control - %
DHW system
Generation 75 % Distribution 60 % Emission - % Control - %
Setpoints and Schedules
Temperature setpoint Winter 20 ºC Summer 23 ºC
Operation schedules All schedules are defined by the SBEM v.3.5.b activity database.
Energy Use
Energy contribution of main passive strategies
Natural ventilation These energy savings are not reported separately. Daylight lighting control
Heating energy 81 kWh/m²/yr Cooling energy 66 kWh/m²/yr DHW energy 10 kWh/m²/yr Lighting energy 59 kWh/m²/yr Auxiliary energy 26 kWh/m²/yr
Energy Generation This building has no on-site energy generation.
Energy Consumption
Delivered energy Fossil fuel 81 kWh/m²/yr Electricity 161 kWh/m²/yr Other 0 kWh/m²/yr
Primary energy 406 kWh/m²/yr

AECOM Cost Optimal Calculations and Gap Analysis for recast EPBD for Non-Residential Buildings 9
Table 2.4d: Energy Performance Relevant Data – Primary School
Building: School (Primary) Quantity Unit
Calculation
Method and tool(s) SBEM v.3.5.b
Primary energy conversion factors (averaged over calculation period):
Gas 1.10 kWh/kWh Grid Supplied Electricity 1.85
On-site Generated Electricity 1.85
Climate Location Dublin Climate data SBEM v.3.5.b climate data file Terrain location Sub-urban. The impact of surrounding buildings has not been included.
Geometry Length x Width x Height 60 x 40 x 8 m
Systems
Ventilation system Air changes per hour - 1/hr Heat recovery efficiency - %
Heating system
Generation 86 % Distribution 95 % Emission - % Control - %
Cooling system
Generation - % Distribution - % Emission - % Control - %
DHW system
Generation 75 % Distribution 60 % Emission - % Control - %
Setpoints and Schedules
Temperature setpoint Winter 20 ºC Summer - ºC
Operation schedules All schedules are defined by the SBEM v.3.5.b activity database.
Energy Use
Energy contribution of main passive strategies
Natural ventilation These energy savings are not reported separately. Daylight lighting control
Heating energy 48 kWh/m²/yr Cooling energy 0 kWh/m²/yr DHW energy 5 kWh/m²/yr Lighting energy 27 kWh/m²/yr Auxiliary energy 1 kWh/m²/yr
Energy Generation This building has no on-site energy generation.
Energy Consumption
Delivered energy Fossil fuel 53 kWh/m²/yr Electricity 28 kWh/m²/yr Other 0 kWh/m²/yr
Primary energy 110 kWh/m²/yr

AECOM Cost Optimal Calculations and Gap Analysis for recast EPBD for Non-Residential Buildings 10
Table 2.4e: Energy Performance Relevant Data - Hotel
Building: Hotel Quantity Unit
Calculation
Method and tool(s) SBEM v.3.5.b
Primary energy conversion factors (averaged over calculation period):
Gas 1.10 kWh/kWh Grid Supplied Electricity 1.97
On-site Generated Electricity 1.97
Climate Location Dublin Climate data SBEM v.3.5.b climate data file Terrain location Sub-urban. The impact of surrounding buildings has not been included.
Geometry Length x Width x Height 43 x 12 x 14 m
Systems
Ventilation system Air changes per hour 3 1/hr Heat recovery efficiency 0 %
Heating system
Generation 86 % Distribution 95 % Emission - % Control - %
Cooling system
Generation 350 % Distribution 66 % Emission - % Control - %
DHW system
Generation 75 % Distribution 60 % Emission - % Control - %
Setpoints and Schedules
Temperature setpoint Winter 20 ºC Summer 23 ºC
Operation schedules All schedules are defined by the SBEM v.3.5.b activity database.
Energy Use
Energy contribution of main passive strategies
Natural ventilation These energy savings are not reported separately. Daylight lighting control
Heating energy 84 kWh/m²/yr Cooling energy 23 kWh/m²/yr DHW energy 218 kWh/m²/yr Lighting energy 31 kWh/m²/yr Auxiliary energy 35 kWh/m²/yr
Energy Generation This building has no on-site energy generation.
Energy Consumption
Delivered energy Fossil fuel 302 kWh/m²/yr Electricity 89 kWh/m²/yr Other 0 kWh/m²/yr
Primary energy 508 kWh/m²/yr

AECOM Cost Optimal Calculations and Gap Analysis for recast EPBD for Non-Residential Buildings 11
2.2 Existing Buildings
According to Annex 1 of Cost Optimal Regulation, member states should establish at least two reference buildings for each building category. Hence, we have considered two reference buildings for each of the five building categories considered for new buildings in Section 2.1.
We have chosen to adopt the same five building models used for new build (i.e. same size and geometry). The principal reason for this is that it provides a useful comparison with the new-build results. Furthermore, it would be expected that the new-build floor areas selected are not significantly different to existing building floor areas and that the floor area is much less significant in determining the cost optimum level than the initial energy efficiencies assumed in the base case (i.e. current) existing building models.
For each of the five building models, we have assumed two different initial energy performance levels i.e. we have considered two reference buildings for each building category. For the purpose of this discussion, we have defined these here as energy efficiency 1 (EE1) and energy efficiency 2 (EE2) where EE2 is of a higher standard than EE1.
EE1 and EE2 have been determined by using the energy end-uses recorded for existing non-residential buildings in the Building Energy Rating (BER) certificate database. This is data used to produce energy performance certificates for existing buildings required under Article 7 of the original Energy Performance of Buildings Directive. There are currently 5,000 records, with large datasets for each of the building types we are considering for this study.
• For EE1: For each building type, we have taken the energy end uses from a building with the median primary energy consumption.
• For EE2: For each building type, we have taken the energy end uses from a building with the 75th percentile primary energy consumption.
The BER database also allows us to identify approximate building specifications (fabric u-values, service efficiencies) associated with EE1 and EE2 levels. These initial building specifications have been modified to provide the exact EE1 and EE2 levels.
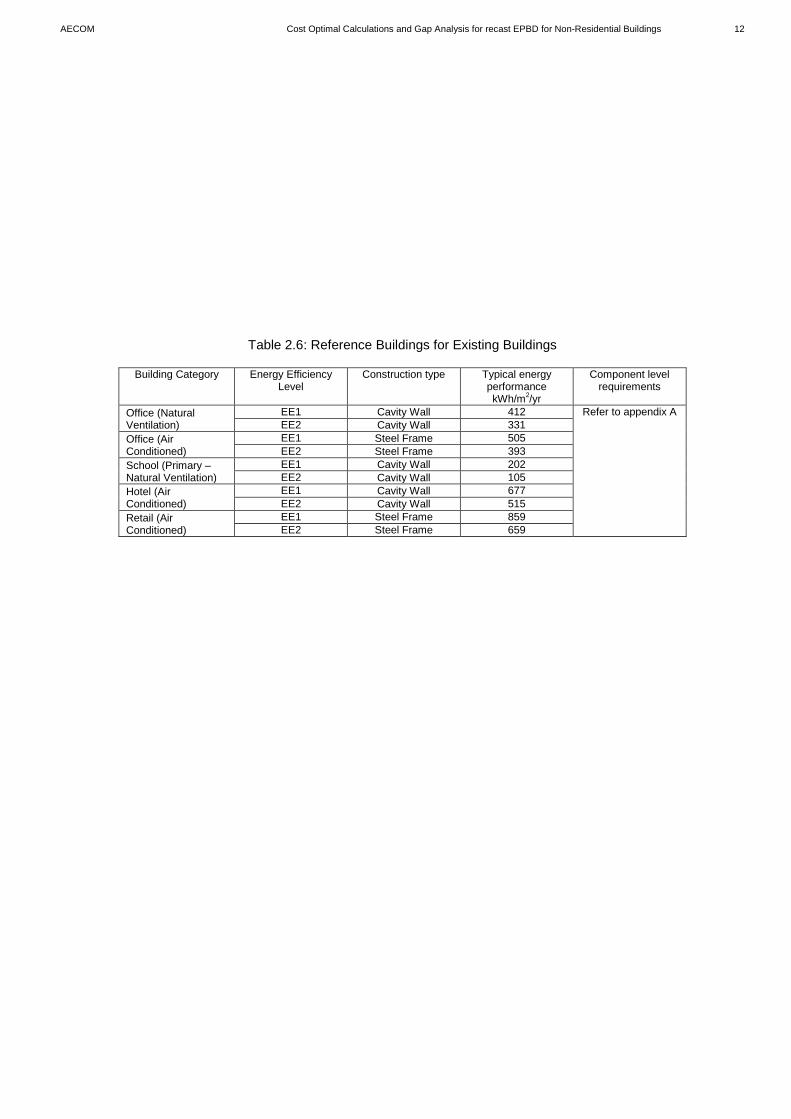
Table 2.6 provides a summary of the reference buildings using the template provided in the Cost Optimal Regulation. We have omitted information on the building geometry, window area and floor area which are already provided in Table 2.3. We have also omitted information on the building technologies as these are provided in more detail in Table 7.
Table 2.7 provides a summary of the energy performance data. Again, we have omitted information on the buildings themselves which were provided in Tables 2.3 and 2.4.
AECOM Cost Optimal Calculations and Gap Analysis for recast EPBD for Non-Residential Buildings 12
Table 2.6: Reference Buildings for Existing Buildings
Building Category Energy Efficiency Level
Construction type Typical energy performance kWh/m2/yr
Component level requirements
Office (Natural Ventilation)
EE1 Cavity Wall 412 Refer to appendix A EE2 Cavity Wall 331
Office (Air Conditioned)
EE1 Steel Frame 505 EE2 Steel Frame 393
School (Primary – Natural Ventilation)
EE1 Cavity Wall 202 EE2 Cavity Wall 105
Hotel (Air Conditioned)
EE1 Cavity Wall 677 EE2 Cavity Wall 515
Retail (Air Conditioned)
EE1 Steel Frame 859 EE2 Steel Frame 659

AECOM Cost Optimal Calculations and Gap Analysis for recast EPBD for Non-Residential Buildings 13
Table 2.7a: Energy Performance Relevant Data - Retail
Building: Retail Quantity Unit EE1 EE2
Systems
Ventilation system Air changes per hour 3 3 1/hr Heat recovery efficiency 0 0 %
Heating system
Generation 74 74 % Distribution 95 95 % Emission - - % Control - - %
Cooling system
Generation 200 300 % Distribution 66 66 % Emission - - % Control - - %
DHW system
Generation 50 70 % Distribution 90 90 % Emission - - % Control - - %
Building Elements
Average U-value
Walls 0.45 0.45 W/m²K Roof 0.25 0.25 W/m²K Floor 0.45 0.45 W/m²K Windows 2.8 2.2 W/m²K
Average g-value of glazing 0.7 0.7 - Air permeability 15 15 m³/m².hr
Lighting Efficacy 25 40 llm/cW Daylight controls N N - Occupancy controls Y Y -
Energy Use
Energy contribution of main passive strategies
Natural ventilation These energy savings are not reported separately. Daylight lighting control
Heating energy 85 93 kWh/m²/yr Cooling energy 88 45 kWh/m²/yr DHW energy 1 1 kWh/m²/yr Lighting energy 158 123 kWh/m²/yr Auxiliary energy 36 36 kWh/m²/yr

AECOM Cost Optimal Calculations and Gap Analysis for recast EPBD for Non-Residential Buildings 14
Table 2.7b: Energy Performance Relevant Data – Office (NV)
Building: Office (NV) Quantity Unit EE1 EE2
Systems
Ventilation system Air changes per hour 3 3 1/hr Heat recovery efficiency 0 0 %
Heating system
Generation 74 84 % Distribution 95 95 % Emission - - % Control - - %
Cooling system
Generation - - % Distribution - - % Emission - - % Control - - %
DHW system
Generation 50 70 % Distribution 90 90 % Emission - - % Control - - %
Building Elements
Average U-value
Walls 0.55 0.45 W/m²K Roof 0.61 0.25 W/m²K Floor 0.45 0.45 W/m²K Windows 3.6 2.8 W/m²K
Average g-value of glazing 0.7 0.7 - Air permeability 15 15 m³/m².hr
Lighting Efficacy 25 30 llm/cW Daylight controls N N - Occupancy controls N N -
Energy Use
Energy contribution of main passive strategies
Natural ventilation These energy savings are not reported separately. Daylight lighting control
Heating energy 175 132 kWh/m²/yr Cooling energy 0 0 kWh/m²/yr DHW energy 5 5 kWh/m²/yr Lighting energy 72 60 kWh/m²/yr Auxiliary energy 4 45 kWh/m²/yr

AECOM Cost Optimal Calculations and Gap Analysis for recast EPBD for Non-Residential Buildings 15
Table 2.7c: Energy Performance Relevant Data – Office (AC)
Building: Office (AC) Quantity Unit EE1 EE2
Systems
Ventilation system Air changes per hour 3 3 1/hr Heat recovery efficiency 0 65 %
Heating system
Generation 78 88 % Distribution 95 95 % Emission - - % Control - - %
Cooling system
Generation 220 220 % Distribution 66 66 % Emission - - % Control - - %
DHW system
Generation 60 70 % Distribution 90 90 % Emission - - % Control - - %
Building Elements
Average U-value
Walls 0.45 0.35 W/m²K Roof 0.25 0.25 W/m²K Floor 0.45 0.25 W/m²K Windows 2.2 2.2 W/m²K
Average g-value of glazing 0.7 0.7 - Air permeability 15 10 m³/m².hr
Lighting Efficacy 45 55 llm/cW Daylight controls N N - Occupancy controls N N -
Energy Use
Energy contribution of main passive strategies
Natural ventilation These energy savings are not reported separately. Daylight lighting control
Heating energy 131 78 kWh/m²/yr Cooling energy 50 46 kWh/m²/yr DHW energy 5 5 kWh/m²/yr Lighting energy 45 33 kWh/m²/yr Auxiliary energy 34 30 kWh/m²/yr

AECOM Cost Optimal Calculations and Gap Analysis for recast EPBD for Non-Residential Buildings 16
Table 2.7e: Energy Performance Relevant Data – School (Primary)
Building: School (Primary) Quantity Unit EE1 EE2
Systems
Ventilation system Air changes per hour 3 3 1/hr Heat recovery efficiency 0 0 %
Heating system
Generation 74 84 % Distribution 95 95 % Emission - - % Control - - %
Cooling system
Generation - - % Distribution - - % Emission - - % Control - - %
DHW system
Generation 50 70 % Distribution 90 90 % Emission - - % Control - - %
Building Elements
Average U-value
Walls 0.45 0.35 W/m²K Roof 0.50 0.25 W/m²K Floor 0.45 0.25 W/m²K Windows 3.6 2.2 W/m²K
Average g-value of glazing 0.7 0.7 - Air permeability 15 10 m³/m².hr
Lighting Efficacy 30 50 llm/cW Daylight controls N N - Occupancy controls N N -
Energy Use
Energy contribution of main passive strategies
Natural ventilation These energy savings are not reported separately. Daylight lighting control
Heating energy 104 61 kWh/m²/yr Cooling energy 0 0 kWh/m²/yr DHW energy 10 3 kWh/m²/yr Lighting energy 25 11 kWh/m²/yr Auxiliary energy 2 2 kWh/m²/yr

AECOM Cost Optimal Calculations and Gap Analysis for recast EPBD for Non-Residential Buildings 17
Table 2.7e: Energy Performance Relevant Data - Hotel
Building: Hotel Quantity Unit EE1 EE2
Systems
Ventilation system Air changes per hour 3 3 1/hr Heat recovery efficiency 0 0 %
Heating system
Generation 80 84 % Distribution 95 95 % Emission - - % Control - - %
Cooling system
Generation 200 220 % Distribution 66 66 % Emission - - % Control - - %
DHW system
Generation 60 70 % Distribution 90 90 % Emission - - % Control - - %
Building Elements
Average U-value
Walls 0.45 0.45 W/m²K Roof 0.25 0.25 W/m²K Floor 0.45 0.45 W/m²K Windows 3.1 2.5 W/m²K
Average g-value of glazing 0.7 0.7 - Air permeability 15 15 m³/m².hr
Lighting Efficacy 15 35 llm/cW Daylight controls N N - Occupancy controls N N -
Energy Use
Energy contribution of main passive strategies
Natural ventilation These energy savings are not reported separately. Daylight lighting control
Heating energy 110 119 kWh/m²/yr Cooling energy 24 14 kWh/m²/yr DHW energy 172 148 kWh/m²/yr Lighting energy 69 30 kWh/m²/yr Auxiliary energy 43 38 kWh/m²/yr

AECOM Cost Optimal Calculations and Gap Analysis for recast EPBD for Non-Residential Buildings 18
3.1 New Buildings
A list of potential measures has been compiled using the Cost Optimisation Guidelines document and design experience. Since it is impractical to evaluate every permutation of the selected measures, we have grouped the measures into packages. These packages are listed in Tables 3.1a and 3.1b. The packages represent four different components of a building design (fabric, services, heating, photovoltaics (PV)), so that selecting one package from each component forms a complete building design. In total, we have considered 225 packages for each building (3 fabric x 3 services x 5 heating x 5 PV), with the exception of air conditioned offices where we have considered 450 packages in total.
The values selected for each of the measures (e.g. the fabric u-values and building services efficiencies) within the packages have been chosen to give a large spread of primary energies and lifecycle costs. This helps to obtain a clear cost optimal front and identification of the optimum point. It includes solutions that together might comprise a building model that performs more poorly than the primary energy target set by the current regulations.
It should be noted that some possible measures have been omitted from these packages. There are a number of reasons for this:
• Site specific measures: Various measures are particularly dependant on site constraints. For example, building orientation and the feasibility of wind turbines are likely to depend on the site and the surrounding context. Our assumption is that the cost optimal point should be based on measures that any designer can typically adopt, if not the cost optimal point may be unrealistic to achieve in many real cases. While we see the availability of Biomass to be site-specific, we do recognise the likelihood of Biomass being considered more widely in the near future. Therefore, have undertaken a sensitivity analysis on one building type to assess the impact of selecting Biomass as a heat source.
• Design measures: Some measures impact on design constraints that are not incorporated in the building
primary energy requirement. In particular, our concern is that by modifying the percentage of glazing or introducing shading to optimise on primary energy, it may result in inadequate daylight levels. Furthermore, this is building dependent – a particular percentage of glazing may provide appropriate day lighting in one building design but not another. Therefore we have not considered these two measures in the list of packages.
• Default measures: There are other measures that are likely to be included in new buildings by default, for
example, monitoring and metering, variable speed pumps and power factor correction. These have not been treated as options - they are simply be added into the base building models assumed in all cases. Since these measures do not vary, there is no need to identify separately costs for them.
Table 3.1c gives the details of the baseline and improved thermal bridging cases. In addition, Table 3.1d shows an example compliant specification to meet current national Regulations for all building types. As the national regulation is performance-based, a building may comply by adopting alternative measures.
3. Measures and Packages

AECOM Cost Optimal Calculations and Gap Analysis for recast EPBD for Non-Residential Buildings 19
Table 3.1a: Measures included in analysis (naturally ventilated buildings)
Fabric (3 options) A B C Wall U-value (W/m²K) 0.3 0.21 0.15 Roof U-value (W/m²K) 0.25 0.2 0.15 Floor U-value (W/m²K) 0.25 0.2 0.15 Window U-value (W/m²K) 1.8 1.4 0.9 Improved Thermal Bridging NO YES YES Air Tightness (m³/m².hr @ 50 Pa) 7 5 3 Services (3 options) 1 2 3 Lighting (llm/cW) 55 60 65 Display Lighting (lm/W) 15 15 22 Daylight Lighting Control NO YES YES Occupancy Lighting Control NO YES YES Heating (5 options)
Heating Source Gas boiler
(86% efficiency)
Gas boiler (91%
efficiency) + Solar Hot
Water
Combined Heat and
Power (45% heat efficiency)
Ground Source Heat Pump (4.0
CoP)
Ground Source Heat Pump (4.0
CoP) + Solar Hot
Water PV (5 options) PV Installation (percentage of foundation area) 0% 10% 20% 30% 40%

AECOM Cost Optimal Calculations and Gap Analysis for recast EPBD for Non-Residential Buildings 20
Table 3.1b: Measures included in analysis (air conditioned buildings)
Fabric (3 options) A B C Wall U-value (W/m²K) 0.3 0.25 0.2 Roof U-value (W/m²K) 0.25 0.2 0.15 Floor U-value (W/m²K) 0.25 0.2 0.15 Window U-value (W/m²K) 1.8 1.4 0.9 Improved Thermal Bridging NO YES YES Air Tightness (m³/m².hr @ 50 Pa) 7 5 3 Services (3 options) 1 2 3 Lighting (llm/cW) 55 60 6 Daylight Lighting Control NO YES YES Occupancy Lighting Control NO YES YES Heat Recovery NO NO 65% Chiller Efficiency (SEER) 3.5 4.5 5.5 AHU SFP 2.2 2 1.8 FCU SFP 0.6 0.3 0.3 Demand Control Ventilation* NO NO YES Additional Services (2 options)* Free Cooling (FC) NO YES Heating (5 options)
Heating Source Gas boiler
(86% efficient)
Gas boiler (91%
efficient) + Solar Hot
Water
Combined Heat and
Power (45% heat efficiency)
Ground Source Heat Pump (4.0
CoP)
Ground Source Heat Pump (4.0
CoP) + Solar Hot
Water PV (5 options) PV Installation (percentage of foundation area) 0% 10% 20% 30% 40%
*Only applicable to Office (air conditioned)

AECOM Cost Optimal Calculations and Gap Analysis for recast EPBD for Non-Residential Buildings 21
Table 3.1c: Thermal Bridging Details (W/mK)
Junction Baseline Improved Roof – Wall 0.18 0.12 Wall – Ground 0.24 0.16 Wall – Wall 0.14 0.09 Wall – Floor 0.11 0.07 Lintel 0.45 0.3 Sill 0.08 0.04 Jamb 0.09 0.05 Roof – Wall (Metal Cladding) 0.42 0.28 Wall – Ground (Metal Cladding) 1.73 1.15 Wall – Wall (Metal Cladding) 0.38 0.25 Wall – Floor (Metal Cladding) 0.04 0.00 Lintel (Metal Cladding) 1.91 1.27 Sill (Metal Cladding) 1.91 1.27 Jamb (Metal Cladding) 1.91 1.27

AECOM Cost Optimal Calculations and Gap Analysis for recast EPBD for Non-Residential Buildings 22
Table 3.1d: Example compliant specification to meet current national Regulations
Fabric Wall U-value (W/m²K) 0.27 Roof U-value (W/m²K) 0.16 Floor U-value (W/m²K) 0.25 Window U-value (W/m²K) 2.2 Thermal Bridging (additional heat loss, %) 16 Air Tightness (m³/m².hr @ 50 Pa) 10 Services Lighting in Occupied Areas (W/m² per 100 lux) 3.75 Lighting in Non-Occupied Areas (W/m² per 100 lux) 5.2 Daylight Lighting Control NO Occupancy Lighting Control NO Heat Recovery NO Chiller Efficiency (SEER) 2.5 AHU SFP (W/l/s) 2.0 FCU SFP (W/l/s) 0.8 Demand Control Ventilation NO Heating Naturally Ventilated Buildings (efficiency, %) Gas boiler, 78% Mechanically Ventilated Buildings (efficiency, %) Gas boiler, 83% Air Conditioned Buildings (efficiency, %) Gas boiler, 88% PV PV Installation (percentage of foundation area) 0%

AECOM Cost Optimal Calculations and Gap Analysis for recast EPBD for Non-Residential Buildings 23
3.2 Existing Buildings We have considered the following building measures. These cover the most common renovation and replacement activities, focussing on those which have the most significant impact on energy use. We have investigated the cost optimum of changing each component in isolation at different levels of energy efficiency. We have undertaken this approach as it is most common to retrofit building components independent of each other and national standards for existing buildings are based on a building component level. Renovation
• Floors: We have investigated the resurfacing of external floors, including varying levels of insulation.
• Walls: There are a number of means of improving the thermal performance of external walls. We will consider including cavity wall insulation where appropriate, as well as internal insulation and the addition of external cladding.
• Roofs: We will consider the impact of varying levels of insulation in the roof-space.
• Heating system: We have included changes to the whole heating system in the building (the costs of pipework and emitters have been assumed to be the same).
Replacement
• Windows
• Packaged chillers
• Central ventilation air handling units (AHUs)
• Light sources (lamp efficacy)
The different levels of energy efficiency investigated are provided in Table 3.2. Additional details of the fabric improvement measures are given in Tables 3.3a-e.

AECOM Cost Optimal Calculations and Gap Analysis for recast EPBD for Non-Residential Buildings 24
Table 3.2: Measures included in analysis
Renovation Building Types Standard
Floors (W/m²K) All 0.6 0.25 0.20 0.15 0.10
Cavity Walls (W/m²K) Office (NV), School, Hotel 0.6 0.30 0.19 0.14 0.16 0.1 0.39 0.21
Metal Frame Walls (W/m²K) Office (AC), Retail 0.6 0.47 0.36 0.27 0.21 0.20 0.151 0.15 0.11
Metal Seam Roof (W/m²K) Retail, Office (AC) 0.35 0.29 0.18 0.14
Pitched Roof (W/m²K) Office (NV), Hotel, School, 0.35 0.25 0.20 0.15
Heating system All Gas (84%) Gas (84%)
Gas (91%)
Gas (91%) + SHW
ASHP Gas CHP
Replacement Building Types Standard
Windows (W/m²K) All 2.2 1.8 1.4 1.1 0.9 Chiller Efficiency (SEER)
Retail, Office (AC), Hotel 1.67 3.5 4.5 5.5
AHU SFP (W/l/s) Retail, Office (AC), Hotel 3.0 2.2 2.0 1.8
Lighting (llm/cW) All 55 55 60 65

AECOM Cost Optimal Calculations and Gap Analysis for recast EPBD for Non-Residential Buildings 25
Table 3.3a: Details of the improvement measures to solid floors
Measure U-Value (W/m²K)
Concrete screed (70mm) Rigid PIR board (60mm) (λ=0.022) 25mm edge insulation (1000 wide along perimeter, rigid PU (λ=0.022))
0.25
Concrete screed (70mm) Rigid PIR board (85mm) (λ=0.022) 25mm edge insulation (1000 wide along perimeter, rigid PU (λ=0.022))
0.20
Concrete screed (70mm) Rigid PIR board (120mm) (λ=0.022) 25mm edge insulation (1000 wide along perimeter, rigid PU (λ=0.022))
0.15
Concrete screed (70mm) Rigid PIR board (180mm) (λ=0.022) 25mm edge insulation (1000 wide along perimeter, rigid PU (λ=0.022))
0.10
Table 3.3b: Details of the improvement measures to cavity walls
Measure U-Value (W/m²K)
Fully filled cavity 0.30
Fully filled cavity and 50mm internal insulation 0.19
Fully filled cavity and 100mm internal insulation 0.14
Fully filled cavity and 100mm external insulation 0.16
Fully filled cavity and 200mm external insulation 0.10
50mm internal insulation (unfilled cavity) 0.39
100mm internal insulation (unfilled cavity) 0.21
Table 3.3c: Details of the improvement measures to metal frame walls
Measure U-Value (W/m²K)
50mm external insulation (EPS (λ=0.031W/mK)) 0.47
100mm external insulation (EPS (λ=0.031W/mK)) 0.27
150mm external insulation (EPS (λ=0.031W/mK)) 0.20
200mm external insulation (EPS (λ=0.031W/mK)) 0.15
50mm external insulation (PIR (λ=0.022W/mK)) 0.36
100mm external insulation (PIR (λ=0.022W/mK)) 0.21
150mm external insulation (PIR (λ=0.022W/mK)) 0.15 (b)
200mm external insulation (PIR (λ=0.022W/mK)) 0.11

AECOM Cost Optimal Calculations and Gap Analysis for recast EPBD for Non-Residential Buildings 26
Table 3.3d: Details of the improvement measures to metal seam roofs
Measure U-Value (W/m²K)
Standing seam liner sheet 50mm PIR Insulation (λ=0.022) over rail 50mm insulation within rail (λ=0.037) Air gap/thermally broken brackets and spacers VCL Profiled metal liner sheet Purlin
0.29
Standing seam liner sheet 100mm PIR Insulation over rail (λ=0.022) 50mm insulation within rail (λ=0.037) Air gap/thermally broken brackets and spacers VCL Profiled metal liner sheet Purlin
0.18
Standing seam liner sheet 150mm PIR Insulation over rail (λ=0.022) 50mm insulation within rail (λ=0.037) Air gap/thermally broken brackets and spacers VCL Profiled metal liner sheet Purlin
0.14

AECOM Cost Optimal Calculations and Gap Analysis for recast EPBD for Non-Residential Buildings 27
Table 3.3e: Details of the improvement measures to pitched roofs
Measure U-Value (W/m²K)
Tiling/batten Breather membrane Counter battens (CBs) Rigid PIR board (λ=0.022W/mK – Celotex/Kingspan) between 150mm rafters (100mm) Rafter space (50mm remaining) VCL Plasterboard
0.25
Tiling/batten Breather membrane Counter battens (CBs) PIR (20mm) over rafters Rigid PIR board (λ=0.022W/mK – Celotex/Kingspan) between 150mm rafters (100mm) Rafter space (50mm remaining) VCL Plasterboard
0.20
Tiling/batten Breather membrane Counter battens (CBs) PIR (50mm) over rafters Rigid PIR board (λ=0.022W/mK – Celotex/Kingspan) between 150mm rafters (110mm) Rafter space (40mm remaining) VCL Plasterboard
0.15

AECOM Cost Optimal Calculations and Gap Analysis for recast EPBD for Non-Residential Buildings 28
4.1 New Buildings
4.1.1 Energy Performance Assessment
This section outlines the procedure for determining the primary energy for each package of measures. Each of the five reference buildings were modelled in SBEM, the software provided by SEAI that implements the Non-domestic Energy Assessment Procedure (NEAP). NEAP is the Republic of Ireland’s response to the requirement of the EPBD to develop a methodology for calculating the energy performance of buildings.
NEAP is Ireland’s calculation methodology and software to the requirements of the EPBD (recast) Annex I and EN 13790 for calculating the energy performance of buildings. The requirements regarding conservation of fuel and energy for dwellings are laid out in Part L of the Second Schedule to the Building Regulations 1997 (Statutory .Instrument . No. 497 of 1997) as amended by the Building Regulations (Part L Amendment) Regulations 2008 (Statutory .Instrument No. 259 of 2008). Part L of the Building regulations provides that the energy performance of the building is such as to limit the calculated primary energy consumption and related carbon dioxide (CO2) emissions insofar as is reasonably practicable, when both energy consumption and carbon dioxide (CO2) emissions are calculated using the Non domestic Energy Assessment Procedure (NEAP) published by Sustainable Energy Authority of Ireland. NEAP calculates whole building energy and carbon emissions performance compliance for the Irish Building Regulations Part L ..
This cost-optimal study identifies the gap (if any) between current whole dwelling energy performance as defined in Part L of the Building Regulations and the cost optimal level as calculated in NEAP.
To test each package of measures, the SBEM building model input files were updated accordingly and run through the SBEM calculation engine. The energy end uses (e.g. heating, cooling) were recorded directly from the SBEM output files. The end use energies were then summed for each energy carrier to find the delivered energy requirement. Any on-site generated energy was also determined at this stage. The primary energy factors were then applied to the delivered energy and on-site generated energy. The latter was subtracted from the former to give the net primary energy.
Annex 1 of the Cost Optimal Regulation state that “Member States shall use a calculation period of 30 years for residential and public buildings, and a calculation period of 20 years for commercial, non-residential buildings”. For the purpose of this work, we have assumed a calculation period of 20 years for all of the buildings with the exception of 30 years for the primary school.
4.1.2 Energy demand calculation
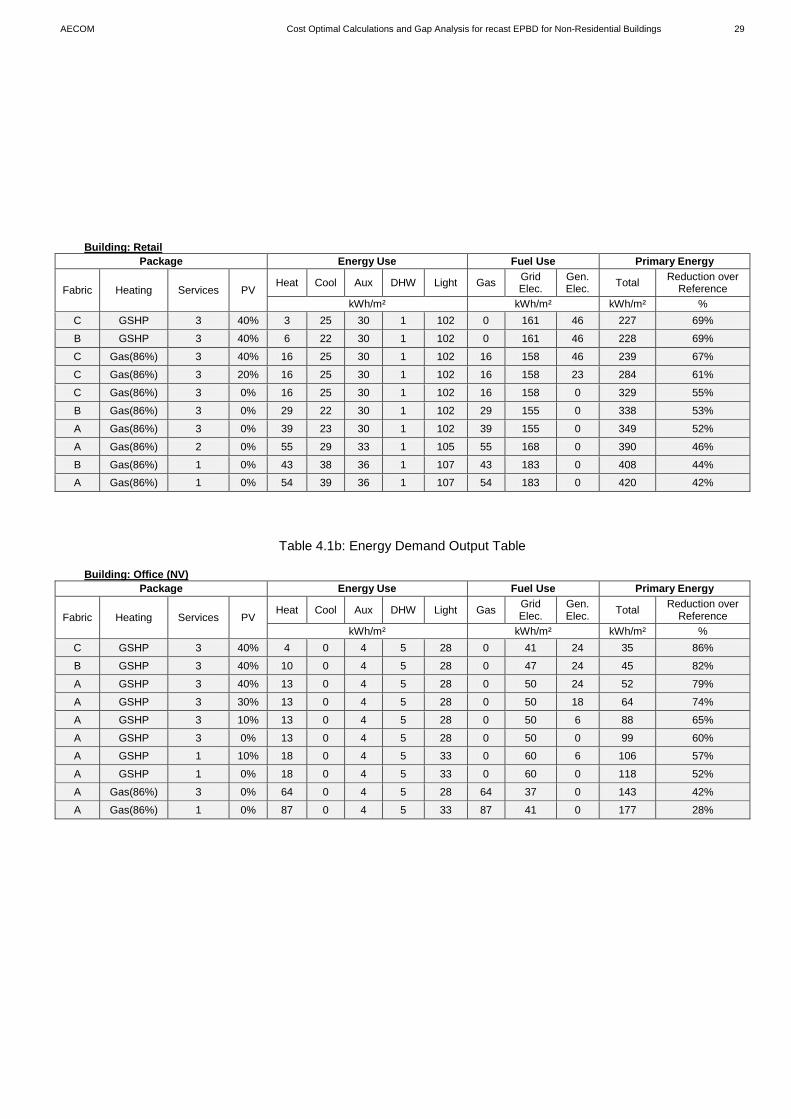
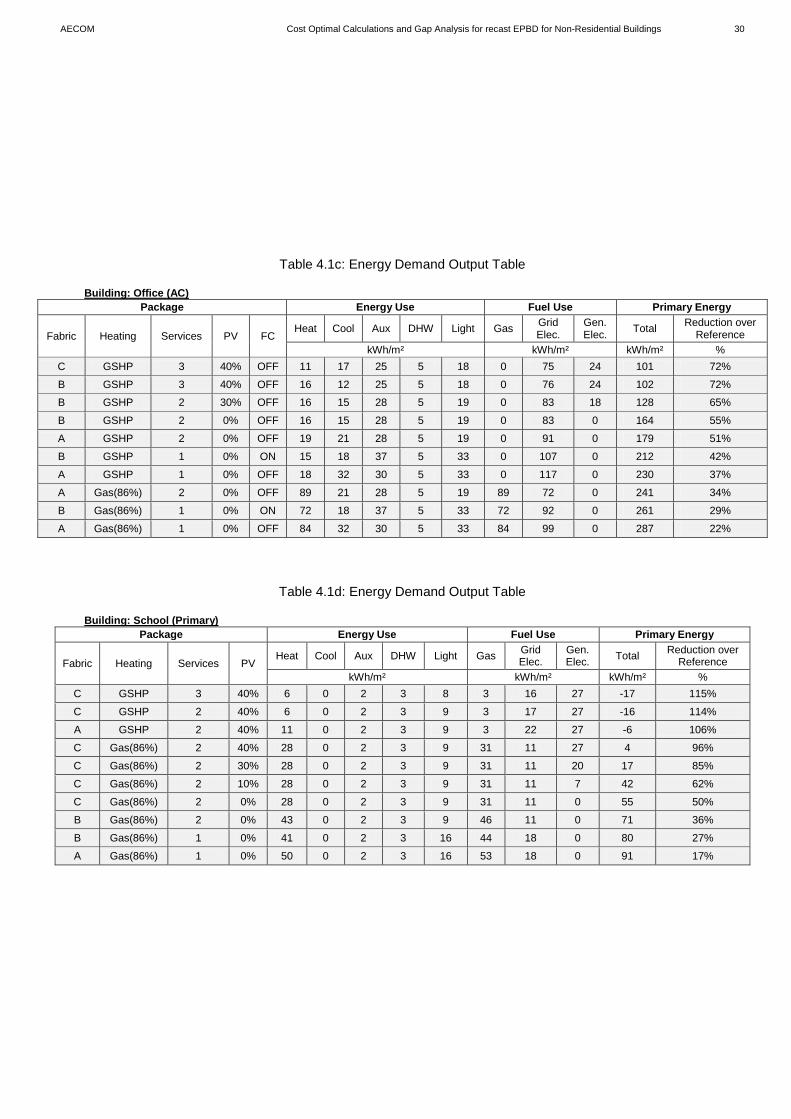
Tables 4.1a – 4.1e summarise the results of the energy performance calculation for the most cost-optimal packages in each of the five reference buildings. These tables include the energy breakdown by end use and the total energy requirement per fuel carrier. The primary energy factors used to calculate the total primary energy requirement and the primary energy reduction over the reference case are listed in Tables 2.4a – 2.4e. The delivered energy per carrier has been incorporated into Tables 4.1 as more helpful than producing separate tables.
Table 4.1a: Energy Demand Output Table
4. Calculation of Primary Energy Demand for the Measures
AECOM Cost Optimal Calculations and Gap Analysis for recast EPBD for Non-Residential Buildings 29
Building: Retail Package Energy Use Fuel Use Primary Energy
Fabric Heating Services PV Heat Cool Aux DHW Light Gas Grid
Elec. Gen. Elec. Total Reduction over
Reference kWh/m² kWh/m² kWh/m² %
C GSHP 3 40% 3 25 30 1 102 0 161 46 227 69%
B GSHP 3 40% 6 22 30 1 102 0 161 46 228 69%
C Gas(86%) 3 40% 16 25 30 1 102 16 158 46 239 67%
C Gas(86%) 3 20% 16 25 30 1 102 16 158 23 284 61%
C Gas(86%) 3 0% 16 25 30 1 102 16 158 0 329 55%
B Gas(86%) 3 0% 29 22 30 1 102 29 155 0 338 53%
A Gas(86%) 3 0% 39 23 30 1 102 39 155 0 349 52%
A Gas(86%) 2 0% 55 29 33 1 105 55 168 0 390 46%
B Gas(86%) 1 0% 43 38 36 1 107 43 183 0 408 44%
A Gas(86%) 1 0% 54 39 36 1 107 54 183 0 420 42%
Table 4.1b: Energy Demand Output Table Building: Office (NV)
Package Energy Use Fuel Use Primary Energy
Fabric Heating Services PV Heat Cool Aux DHW Light Gas Grid
Elec. Gen. Elec. Total Reduction over
Reference kWh/m² kWh/m² kWh/m² %
C GSHP 3 40% 4 0 4 5 28 0 41 24 35 86%
B GSHP 3 40% 10 0 4 5 28 0 47 24 45 82%
A GSHP 3 40% 13 0 4 5 28 0 50 24 52 79%
A GSHP 3 30% 13 0 4 5 28 0 50 18 64 74%
A GSHP 3 10% 13 0 4 5 28 0 50 6 88 65%
A GSHP 3 0% 13 0 4 5 28 0 50 0 99 60%
A GSHP 1 10% 18 0 4 5 33 0 60 6 106 57%
A GSHP 1 0% 18 0 4 5 33 0 60 0 118 52%
A Gas(86%) 3 0% 64 0 4 5 28 64 37 0 143 42%
A Gas(86%) 1 0% 87 0 4 5 33 87 41 0 177 28%
AECOM Cost Optimal Calculations and Gap Analysis for recast EPBD for Non-Residential Buildings 30
Table 4.1c: Energy Demand Output Table
Building: Office (AC)
Package Energy Use Fuel Use Primary Energy
Fabric Heating Services PV FC Heat Cool Aux DHW Light Gas Grid
Elec. Gen. Elec. Total Reduction over
Reference kWh/m² kWh/m² kWh/m² %
C GSHP 3 40% OFF 11 17 25 5 18 0 75 24 101 72%
B GSHP 3 40% OFF 16 12 25 5 18 0 76 24 102 72%
B GSHP 2 30% OFF 16 15 28 5 19 0 83 18 128 65%
B GSHP 2 0% OFF 16 15 28 5 19 0 83 0 164 55%
A GSHP 2 0% OFF 19 21 28 5 19 0 91 0 179 51%
B GSHP 1 0% ON 15 18 37 5 33 0 107 0 212 42%
A GSHP 1 0% OFF 18 32 30 5 33 0 117 0 230 37%
A Gas(86%) 2 0% OFF 89 21 28 5 19 89 72 0 241 34%
B Gas(86%) 1 0% ON 72 18 37 5 33 72 92 0 261 29%
A Gas(86%) 1 0% OFF 84 32 30 5 33 84 99 0 287 22%
Table 4.1d: Energy Demand Output Table Building: School (Primary)
Package Energy Use Fuel Use Primary Energy
Fabric Heating Services PV Heat Cool Aux DHW Light Gas Grid
Elec. Gen. Elec. Total Reduction over
Reference kWh/m² kWh/m² kWh/m² %
C GSHP 3 40% 6 0 2 3 8 3 16 27 -17 115%
C GSHP 2 40% 6 0 2 3 9 3 17 27 -16 114%
A GSHP 2 40% 11 0 2 3 9 3 22 27 -6 106%
C Gas(86%) 2 40% 28 0 2 3 9 31 11 27 4 96%
C Gas(86%) 2 30% 28 0 2 3 9 31 11 20 17 85%
C Gas(86%) 2 10% 28 0 2 3 9 31 11 7 42 62%
C Gas(86%) 2 0% 28 0 2 3 9 31 11 0 55 50%
B Gas(86%) 2 0% 43 0 2 3 9 46 11 0 71 36%
B Gas(86%) 1 0% 41 0 2 3 16 44 18 0 80 27%
A Gas(86%) 1 0% 50 0 2 3 16 53 18 0 91 17%

AECOM Cost Optimal Calculations and Gap Analysis for recast EPBD for Non-Residential Buildings 31
Table 4.1e: Energy Demand Output Table
Building: Hotel
Package Energy Use Fuel Use Primary Energy
Fabric Heating Services PV Heat Cool Aux DHW Light Gas Grid
Elec. Gen. Elec. Total Reduction over
Reference kWh/m² kWh/m² kWh/m² %
C GSHP+SHW 3 40% 8 6 33 132 16 132 63 13 243 52%
B GSHP+SHW 3 40% 12 4 33 132 16 132 65 13 246 51%
A GSHP 3 40% 14 6 33 141 16 141 69 13 266 48%
B GSHP 1 40% 15 6 38 141 19 141 78 13 284 44%
A GSHP 1 30% 17 10 38 141 19 141 84 10 302 41%
A GSHP 1 0% 17 10 38 141 19 141 84 0 321 37%
A Gas(86%) 3 0% 69 6 33 141 16 210 55 0 339 33%
B Gas(86%) 1 10% 71 6 38 141 19 212 64 3 352 31%
B Gas(86%) 1 0% 71 6 38 141 19 212 64 0 359 29%
A Gas(86%) 1 0% 80 10 38 141 19 221 67 0 376 26%
AECOM Cost Optimal Calculations and Gap Analysis for recast EPBD for Non-Residential Buildings 32
4.2 Existing Buildings
4.2.1 Energy Performance Assessment
The primary energy was determined using the same approach as for new buildings.
4.2.2 Energy demand calculation
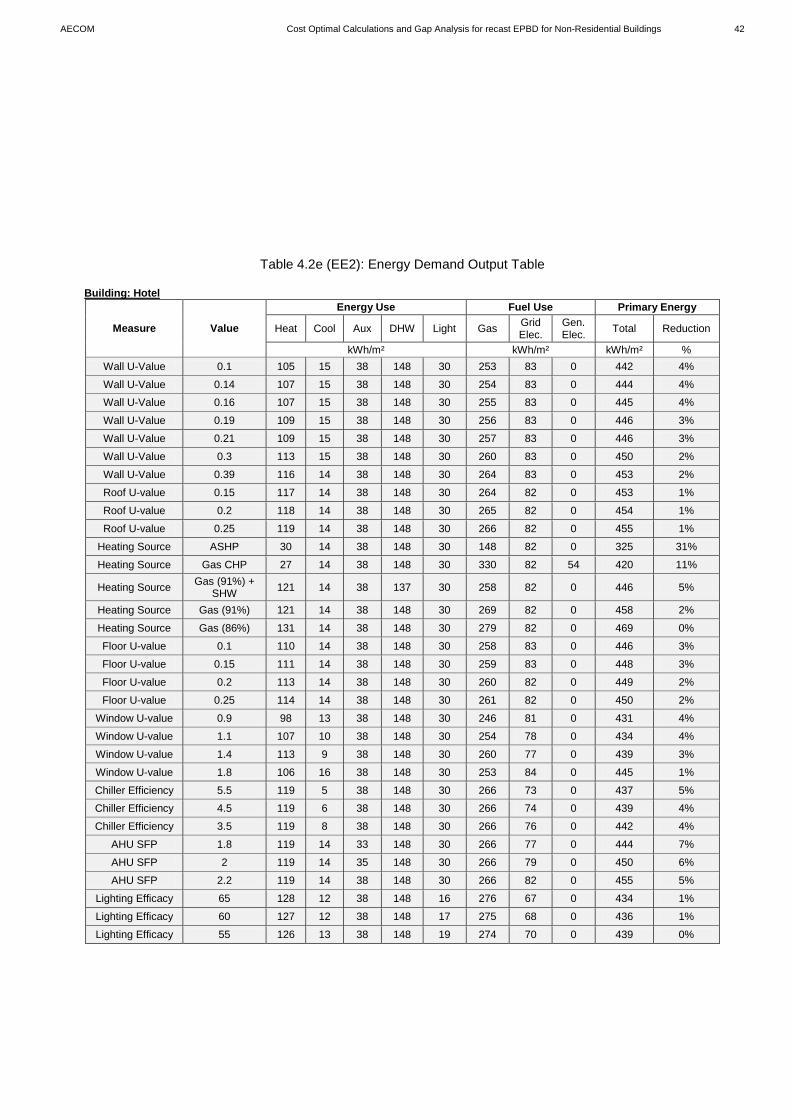
Tables 4.2a – 4.2e summarise the results of the energy performance calculation for each of the five reference buildings. These tables include the energy breakdown by end use and the total energy requirement per fuel carrier. The primary energy factors used to calculate the total primary energy requirement and the primary energy reduction over the reference case are listed in Tables 2.4a – 2.4e. The delivered energy per carrier has been incorporated into Tables 4.2 as more helpful than producing separate tables.

AECOM Cost Optimal Calculations and Gap Analysis for recast EPBD for Non-Residential Buildings 33
Table 4.2a (EE1): Energy Demand Output Table
Building: Retail
Measure Value
Energy Use Fuel Use Primary Energy
Heat Cool Aux DHW Light Gas Grid Elec.
Gen. Elec. Total Reduction
kWh/m² kWh/m² kWh/m² % Wall U-Value 0.11 77 89 36 1 158 77 285 0 646 1%
Wall U-Value 0.15 (b) 78 89 36 1 158 78 284 0 647 1%
Wall U-Value 0.15 78 89 36 1 158 78 284 0 647 1%
Wall U-Value 0.2 80 89 36 1 158 80 284 0 648 1%
Wall U-Value 0.21 80 89 36 1 158 80 284 0 648 1%
Wall U-Value 0.27 81 89 36 1 158 81 284 0 649 1%
Wall U-Value 0.36 83 88 36 1 158 83 284 0 651 1%
Wall U-Value 0.47 86 88 36 1 158 86 283 0 653 0%
Roof U-value 0.14 80 88 36 1 158 80 284 0 648 1%
Roof U-value 0.18 82 88 36 1 158 82 284 0 649 1%
Roof U-value 0.29 87 88 36 1 158 87 283 0 654 0%
Heating Source ASHP 20 88 36 1 158 0 283 0 558 15%
Heating Source Gas CHP 18 88 36 1 158 118 283 35 620 5%
Heating Source Gas (91%) 80 88 36 1 158 80 283 0 646 1%
Heating Source Gas (91%) + SHW 80 88 36 1 158 80 283 0 646 1%
Heating Source Gas (86%) 86 88 36 1 158 86 283 0 653 0%
Floor U-value 0.25 75 94 36 1 158 75 289 0 652 1%
Floor U-value 0.2 72 95 36 1 158 72 291 0 652 1%
Floor U-value 0.15 70 97 36 1 158 70 292 0 653 1%
Floor U-value 0.1 67 98 36 1 158 67 294 0 653 1%
Window U-value 1.4 83 85 36 1 158 83 280 0 644 1%
Window U-value 1.1 82 85 36 1 158 82 281 0 644 1%
Window U-value 0.9 82 87 36 1 158 82 283 0 647 1%
Window U-value 1.8 83 89 36 1 158 83 285 0 653 0%
Chiller Efficiency 5.5 85 28 36 1 158 85 223 0 533 19%
Chiller Efficiency 4.5 85 34 36 1 158 85 229 0 545 17%
Chiller Efficiency 3.5 85 43 36 1 158 85 239 0 564 14%
AHU SFP 1.8 85 88 30 1 158 85 277 0 641 5%
AHU SFP 2 85 88 33 1 158 85 280 0 646 4%
AHU SFP 2.2 85 88 36 1 158 85 283 0 652 3%
Lighting Efficacy 65 100 55 36 1 101 100 193 0 490 4%
Lighting Efficacy 60 99 56 36 1 104 99 197 0 498 2%
Lighting Efficacy 55 98 58 36 1 107 98 203 0 508 0%

AECOM Cost Optimal Calculations and Gap Analysis for recast EPBD for Non-Residential Buildings 34
Table 4.2a (EE2): Energy Demand Output Table
Building: Retail
Measure Value
Energy Use Fuel Use Primary Energy
Heat Cool Aux DHW Light Gas Grid Elec.
Gen. Elec. Total Reduction
kWh/m² kWh/m² kWh/m² % Wall U-Value 0.11 85 46 36 1 123 85 206 0 501 2%
Wall U-Value 0.15 (b) 86 46 36 1 123 86 206 0 502 2%
Wall U-Value 0.15 86 46 36 1 123 86 206 0 502 2%
Wall U-Value 0.2 88 46 36 1 123 88 206 0 503 2%
Wall U-Value 0.21 88 46 36 1 123 88 206 0 503 2%
Wall U-Value 0.27 89 46 36 1 123 89 206 0 504 1%
Wall U-Value 0.36 91 46 36 1 123 91 206 0 506 1%
Wall U-Value 0.47 94 45 36 1 123 94 206 0 509 1%
Roof U-value 0.14 88 45 36 1 123 88 206 0 503 2%
Roof U-value 0.18 90 45 36 1 123 90 206 0 505 2%
Roof U-value 0.29 95 45 36 1 123 95 206 0 511 1%
Heating Source ASHP 22 45 36 1 123 0 206 0 406 20%
Heating Source Gas CHP 19 45 36 1 123 129 206 38 473 7%
Heating Source Gas (91%) 87 45 36 1 123 87 206 0 502 2%
Heating Source Gas (91%) + SHW 87 45 36 1 123 87 206 0 502 2%
Heating Source Gas (86%) 95 45 36 1 123 95 206 0 510 0%
Floor U-value 0.1 71 52 36 1 123 71 212 0 496 3%
Floor U-value 0.15 74 51 36 1 123 74 211 0 497 3%
Floor U-value 0.2 76 50 36 1 123 76 210 0 498 3%
Floor U-value 0.25 82 49 36 1 123 82 209 0 502 2%
Window U-value 1.1 92 43 36 1 123 92 203 0 502 1%
Window U-value 1.4 93 43 36 1 123 93 203 0 502 1%
Window U-value 0.9 91 44 36 1 123 91 205 0 504 1%
Window U-value 1.8 92 46 36 1 123 92 206 0 508 0%
Chiller Efficiency 5.5 93 21 36 1 123 93 182 0 461 17%
Chiller Efficiency 4.5 93 26 36 1 123 93 186 0 470 16%
Chiller Efficiency 3.5 93 33 36 1 123 93 194 0 485 13%
AHU SFP 1.8 93 45 30 1 123 93 200 0 497 7%
AHU SFP 2 93 45 33 1 123 93 203 0 503 5%
AHU SFP 2.2 93 45 36 1 123 93 206 0 508 4%
Lighting Efficacy 65 98 37 36 1 101 98 175 0 453 3%
Lighting Efficacy 60 97 38 36 1 104 97 179 0 460 2%
Lighting Efficacy 55 97 39 36 1 107 97 184 0 469 0%

AECOM Cost Optimal Calculations and Gap Analysis for recast EPBD for Non-Residential Buildings 35
Table 4.2b (EE1): Energy Demand Output Table Building: Office (NV)
Measure Value
Energy Use Fuel Use Primary Energy
Heat Cool Aux DHW Light Gas Grid Elec.
Gen. Elec. Total Reduction
kWh/m² kWh/m² kWh/m² % Wall U-Value 0.1 164 0 4 5 72 164 81 0 340 4%
Wall U-Value 0.14 165 0 4 5 72 165 81 0 341 4%
Wall U-Value 0.16 166 0 4 5 72 166 81 0 342 4%
Wall U-Value 0.19 167 0 4 5 72 167 81 0 343 3%
Wall U-Value 0.21 167 0 4 5 72 167 81 0 343 3%
Wall U-Value 0.3 169 0 4 5 72 169 81 0 346 2%
Wall U-Value 0.39 171 0 4 5 72 171 81 0 348 2%
Roof U-value 0.15 159 0 4 5 72 159 81 0 334 2%
Roof U-value 0.2 161 0 4 5 72 161 81 0 336 2%
Roof U-value 0.25 162 0 4 5 72 162 81 0 338 1%
Heating Source ASHP 35 0 4 5 72 0 81 0 160 52%
Heating Source Gas CHP 36 0 4 5 72 239 81 70 284 14%
Heating Source Gas (91%) + SHW 143 0 4 5 72 143 81 0 316 4%
Heating Source Gas (91%) 143 0 4 5 72 143 81 0 316 4%
Heating Source Gas (86%) 155 0 4 5 72 155 81 0 330 0%
Floor U-value 0.1 162 0 4 5 72 162 81 0 337 6%
Floor U-value 0.15 164 0 4 5 72 164 81 0 340 5%
Floor U-value 0.2 166 0 4 5 72 166 81 0 342 5%
Floor U-value 0.25 168 0 4 5 72 168 81 0 344 4%
Window U-value 0.9 131 0 4 5 72 131 81 0 303 6%
Window U-value 1.1 139 0 4 5 72 139 81 0 312 3%
Window U-value 1.8 141 0 4 5 72 141 81 0 315 3%
Window U-value 1.4 145 0 4 5 72 145 81 0 319 1%
Lighting Efficacy 65 197 0 4 5 28 197 36 0 288 2%
Lighting Efficacy 60 196 0 4 5 30 196 39 0 292 1%
Lighting Efficacy 55 194 0 4 5 33 194 41 0 295 0%

AECOM Cost Optimal Calculations and Gap Analysis for recast EPBD for Non-Residential Buildings 36
Table 4.2b (EE2): Energy Demand Output Table
Building: Office (NV)
Measure Value
Energy Use Fuel Use Primary Energy
Heat Cool Aux DHW Light Gas Grid Elec.
Gen. Elec. Total Reduction
kWh/m² kWh/m² kWh/m² % Wall U-Value 0.1 123 0 4 5 60 123 69 0 271 5%
Wall U-Value 0.14 124 0 4 5 60 124 69 0 272 4%
Wall U-Value 0.16 125 0 4 5 60 125 69 0 273 4%
Wall U-Value 0.19 126 0 4 5 60 126 69 0 274 4%
Wall U-Value 0.21 126 0 4 5 60 126 69 0 275 3%
Wall U-Value 0.3 129 0 4 5 60 129 69 0 277 3%
Wall U-Value 0.39 131 0 4 5 60 131 69 0 279 2%
Roof U-value 0.15 129 0 4 5 60 129 69 0 277 3%
Roof U-value 0.2 130 0 4 5 60 130 69 0 279 2%
Roof U-value 0.25 132 0 4 5 60 132 69 0 281 1%
Heating Source ASHP 30 0 4 5 60 0 69 0 136 52%
Heating Source Gas CHP 30 0 4 5 60 204 69 60 242 14%
Heating Source Gas (91%) + SHW 122 0 4 5 60 122 69 0 270 4%
Heating Source Gas (91%) 122 0 4 5 60 122 69 0 270 4%
Heating Source Gas (86%) 132 0 4 5 60 132 69 0 281 0%
Floor U-value 0.1 119 0 4 5 60 119 69 0 267 7%
Floor U-value 0.15 122 0 4 5 60 122 69 0 269 6%
Floor U-value 0.2 123 0 4 5 60 123 69 0 271 5%
Floor U-value 0.25 125 0 4 5 60 125 69 0 273 5%
Window U-value 0.9 106 0 4 5 60 106 69 0 252 6%
Window U-value 1.1 112 0 4 5 60 112 69 0 259 4%
Window U-value 1.8 115 0 4 5 60 115 69 0 262 3%
Window U-value 1.4 118 0 4 5 60 118 69 0 266 1%
Lighting Efficacy 65 145 0 4 5 28 145 36 0 231 3%
Lighting Efficacy 60 144 0 4 5 30 144 39 0 235 2%
Lighting Efficacy 55 143 0 4 5 33 143 41 0 239 0%

AECOM Cost Optimal Calculations and Gap Analysis for recast EPBD for Non-Residential Buildings 37
Table 4.2c (EE1): Energy Demand Output Table Building: Office (AC)
Measure Value
Energy Use Fuel Use Primary Energy
Heat Cool Aux DHW Light Gas Grid Elec.
Gen. Elec. Total Reduction
kWh/m² kWh/m² kWh/m² % Wall U-Value 0.11 124 51 34 5 45 124 135 0 401 2%
Wall U-Value 0.15 (b) 124 51 34 5 45 124 135 0 402 2%
Wall U-Value 0.15 124 51 34 5 45 124 135 0 402 2%
Wall U-Value 0.2 126 51 34 5 45 126 134 0 403 2%
Wall U-Value 0.21 126 51 34 5 45 126 134 0 403 2%
Wall U-Value 0.27 127 51 34 5 45 127 134 0 404 1%
Wall U-Value 0.36 129 50 34 5 45 129 134 0 406 1%
Wall U-Value 0.47 132 50 34 5 45 132 133 0 408 1%
Roof U-value 0.14 128 50 34 5 45 128 134 0 404 2%
Roof U-value 0.18 129 50 34 5 45 129 134 0 405 1%
Roof U-value 0.29 133 50 34 5 45 133 133 0 409 0%
Heating Source ASHP 32 50 34 5 45 0 133 0 263 37%
Heating Source Gas CHP 28 50 34 5 45 190 133 56 362 14%
Heating Source Gas (91%) 130 50 34 5 45 130 133 0 406 3%
Heating Source Gas (91%) + SHW 130 50 34 5 45 130 133 0 406 3%
Heating Source Gas (86%) 141 50 34 5 45 141 133 0 418 0%
Floor U-value 0.1 119 51 34 5 45 119 134 0 395 4%
Floor U-value 0.15 120 51 34 5 45 120 134 0 397 4%
Floor U-value 0.2 122 50 34 5 45 122 134 0 398 4%
Floor U-value 0.25 124 50 34 5 45 124 134 0 400 3%
Window U-value 1.1 123 40 34 5 45 123 123 0 377 7%
Window U-value 1.4 128 38 34 5 45 128 122 0 380 7%
Window U-value 0.9 115 46 34 5 45 115 130 0 383 6%
Window U-value 1.8 125 52 34 5 45 125 136 0 405 1%
Chiller Efficiency 5.5 131 17 34 5 45 131 100 0 342 18%
Chiller Efficiency 4.5 131 21 34 5 45 131 104 0 349 16%
Chiller Efficiency 3.5 131 26 34 5 45 131 110 0 361 14%
AHU SFP 1.8 131 50 25 5 45 131 125 0 391 7%
AHU SFP 2 131 50 28 5 45 131 127 0 395 6%
AHU SFP 2.2 131 50 30 5 45 131 130 0 400 5%
Lighting Efficacy 65 139 42 34 5 28 139 108 0 366 3%
Lighting Efficacy 60 138 43 34 5 30 138 112 0 371 2%
Lighting Efficacy 55 136 44 34 5 33 136 116 0 378 0%

AECOM Cost Optimal Calculations and Gap Analysis for recast EPBD for Non-Residential Buildings 38
Table 4.2c (EE2): Energy Demand Output Table
Building: Office (AC)
Measure Value
Energy Use Fuel Use Primary Energy
Heat Cool Aux DHW Light Gas Grid Elec.
Gen. Elec. Total Reduction
kWh/m² kWh/m² kWh/m² % Wall U-Value 0.11 71 48 30 5 33 71 115 0 305 3%
Wall U-Value 0.15 (b) 73 47 30 5 33 73 115 0 306 3%
Wall U-Value 0.15 73 47 30 5 33 73 115 0 306 3%
Wall U-Value 0.2 74 47 30 5 33 74 115 0 307 3%
Wall U-Value 0.21 74 47 30 5 33 74 115 0 307 3%
Wall U-Value 0.27 76 47 30 5 33 76 114 0 309 2%
Wall U-Value 0.36 78 46 30 5 33 78 114 0 311 2%
Wall U-Value 0.47 81 46 30 5 33 81 113 0 313 1%
Roof U-value 0.14 74 47 30 5 33 74 114 0 307 2%
Roof U-value 0.18 76 47 30 5 33 76 114 0 308 2%
Roof U-value 0.29 79 46 30 5 33 79 114 0 312 1%
Heating Source ASHP 21 46 30 5 33 0 114 0 225 31%
Heating Source Gas CHP 19 46 30 5 33 125 114 37 290 11%
Heating Source Gas (91%) 86 46 30 5 33 86 114 0 319 2%
Heating Source Gas (91%) + SHW 86 46 30 5 33 86 114 0 319 2%
Heating Source Gas (86%) 93 46 30 5 33 93 114 0 327 0%
Floor U-value 0.1 72 47 30 5 33 72 115 0 305 6%
Floor U-value 0.15 74 47 30 5 33 74 114 0 306 6%
Floor U-value 0.2 76 47 30 5 33 76 114 0 308 5%
Floor U-value 0.25 78 46 30 5 33 78 114 0 310 4%
Window U-value 1.1 64 37 30 5 33 64 104 0 276 11%
Window U-value 1.4 71 35 30 5 33 71 102 0 280 10%
Window U-value 0.9 57 44 30 5 33 57 111 0 282 9%
Window U-value 1.8 70 49 30 5 33 70 116 0 307 1%
Chiller Efficiency 5.5 78 16 30 5 33 78 83 0 250 22%
Chiller Efficiency 4.5 78 20 30 5 33 78 87 0 257 20%
Chiller Efficiency 3.5 78 25 30 5 33 78 93 0 268 17%
AHU SFP 1.8 78 46 25 5 33 78 109 0 301 9%
AHU SFP 2 78 46 28 5 33 78 111 0 306 7%
AHU SFP 2.2 78 46 30 5 33 78 114 0 310 6%
Lighting Efficacy 65 80 44 30 5 28 80 107 0 298 4%
Lighting Efficacy 60 79 45 30 5 30 79 110 0 303 2%
Lighting Efficacy 55 78 46 30 5 33 78 114 0 310 0%

AECOM Cost Optimal Calculations and Gap Analysis for recast EPBD for Non-Residential Buildings 39
Table 4.2d (EE1): Energy Demand Output Table Building: School (Primary)
Measure Value
Energy Use Fuel Use Primary Energy
Heat Cool Aux DHW Light Gas Grid Elec.
Gen. Elec. Total Reduction
kWh/m² kWh/m² kWh/m² % Wall U-Value 0.1 91 0 2 4 29 95 31 0 162 11%
Wall U-Value 0.14 93 0 2 4 29 97 31 0 164 10%
Wall U-Value 0.16 93 0 2 4 29 98 31 0 164 10%
Wall U-Value 0.19 94 0 2 4 29 99 31 0 166 9%
Wall U-Value 0.21 95 0 2 4 29 100 31 0 166 9%
Wall U-Value 0.3 99 0 2 4 29 103 31 0 170 7%
Wall U-Value 0.39 102 0 2 4 29 106 31 0 174 5%
Roof U-value 0.15 101 0 2 4 29 105 31 0 172 1%
Roof U-value 0.2 101 0 2 4 29 105 31 0 173 1%
Roof U-value 0.25 102 0 2 4 29 106 31 0 173 1%
Heating Source ASHP 21 0 2 4 29 4 31 0 62 62%
Heating Source Gas CHP 21 0 2 4 29 146 31 42 140 14%
Heating Source Gas (91%) + SHW 85 0 2 4 29 89 31 0 155 5%
Heating Source Gas (91%) 85 0 2 4 29 89 31 0 155 5%
Heating Source Gas (86%) 92 0 2 4 29 96 31 0 163 0%
Floor U-value 0.1 88 0 2 4 29 92 31 0 158 14%
Floor U-value 0.15 90 0 2 4 29 94 31 0 161 13%
Floor U-value 0.2 92 0 2 4 29 97 31 0 163 11%
Floor U-value 0.25 95 0 2 4 29 99 31 0 166 10%
Window U-value 0.9 73 0 2 4 29 77 31 0 142 9%
Window U-value 1.1 78 0 2 4 29 82 31 0 147 6%
Window U-value 1.8 80 0 2 4 29 85 31 0 150 4%
Window U-value 1.4 82 0 2 4 29 86 31 0 152 3%
Lighting Efficacy 65 113 0 2 4 13 117 15 0 157 2%
Lighting Efficacy 60 112 0 2 4 14 116 16 0 158 1%
Lighting Efficacy 55 111 0 2 4 16 116 18 0 160 0%

AECOM Cost Optimal Calculations and Gap Analysis for recast EPBD for Non-Residential Buildings 40
Table 4.2d (EE2): Energy Demand Output Table
Building: School (Primary)
Measure Value
Energy Use Fuel Use Primary Energy
Heat Cool Aux DHW Light Gas Grid Elec.
Gen. Elec. Total Reduction
kWh/m² kWh/m² kWh/m² % Wall U-Value 0.1 52 0 2 3 11 55 13 0 84 19%
Wall U-Value 0.14 53 0 2 3 11 56 13 0 86 17%
Wall U-Value 0.16 54 0 2 3 11 57 13 0 87 16%
Wall U-Value 0.19 55 0 2 3 11 58 13 0 88 15%
Wall U-Value 0.21 56 0 2 3 11 59 13 0 89 14%
Wall U-Value 0.3 59 0 2 3 11 62 13 0 92 11%
Wall U-Value 0.39 62 0 2 3 11 65 13 0 96 8%
Roof U-value 0.15 60 0 2 3 11 63 13 0 93 2%
Roof U-value 0.2 60 0 2 3 11 64 13 0 94 1%
Roof U-value 0.25 61 0 2 3 11 64 13 0 94 1%
Heating Source ASHP 14 0 2 3 11 3 13 0 27 72%
Heating Source Gas CHP 15 0 2 3 11 102 13 29 82 16%
Heating Source Gas (91%) + SHW 59 0 2 3 11 62 13 0 92 6%
Heating Source Gas (91%) 59 0 2 3 11 62 13 0 92 6%
Heating Source Gas (86%) 64 0 2 3 11 67 13 0 97 0%
Floor U-value 0.1 54 0 2 3 11 57 13 0 87 21%
Floor U-value 0.15 56 0 2 3 11 60 13 0 89 19%
Floor U-value 0.2 59 0 2 3 11 62 13 0 92 17%
Floor U-value 0.25 61 0 2 3 11 64 13 0 94 14%
Window U-value 0.9 49 0 2 3 11 52 13 0 81 14%
Window U-value 1.1 53 0 2 3 11 56 13 0 86 9%
Window U-value 1.8 56 0 2 3 11 59 13 0 89 6%
Window U-value 1.4 57 0 2 3 11 60 13 0 90 4%
Lighting Efficacy 65 62 0 2 3 9 65 10 0 91 2%
Lighting Efficacy 60 62 0 2 3 9 65 11 0 92 1%
Lighting Efficacy 55 61 0 2 3 10 64 12 0 93 0%

AECOM Cost Optimal Calculations and Gap Analysis for recast EPBD for Non-Residential Buildings 41
Table 4.2e (EE1): Energy Demand Output Table
Building: Hotel
Measure Value
Energy Use Fuel Use Primary Energy
Heat Cool Aux DHW Light Gas Grid Elec.
Gen. Elec. Total Reduction
kWh/m² kWh/m² kWh/m² % Wall U-Value 0.1 97 25 43 69 172 269 137 0 566 3%
Wall U-Value 0.14 98 25 43 69 172 271 137 0 568 3%
Wall U-Value 0.16 99 25 43 69 172 271 137 0 568 3%
Wall U-Value 0.19 100 25 43 69 172 272 137 0 569 2%
Wall U-Value 0.21 101 25 43 69 172 273 137 0 570 2%
Wall U-Value 0.3 105 24 43 69 172 277 136 0 573 2%
Wall U-Value 0.39 108 24 43 69 172 280 136 0 576 1%
Roof U-value 0.15 108 24 43 69 172 280 136 0 576 1%
Roof U-value 0.2 109 24 43 69 172 281 136 0 577 1%
Roof U-value 0.25 110 24 43 69 172 282 136 0 578 0%
Heating Source ASHP 27 24 43 69 172 172 136 0 457 22%
Heating Source Gas CHP 24 24 43 69 172 335 136 48 542 8%
Heating Source Gas (91%) + SHW 109 24 43 69 160 268 136 0 563 4%
Heating Source Gas (91%) 109 24 43 69 172 281 136 0 576 2%
Heating Source Gas (86%) 118 24 43 69 172 290 136 0 586 0%
Floor U-value 0.1 102 24 43 69 172 274 136 0 570 2%
Floor U-value 0.15 103 24 43 69 172 275 136 0 571 2%
Floor U-value 0.2 104 24 43 69 172 276 136 0 572 2%
Floor U-value 0.25 105 24 43 69 172 278 136 0 573 1%
Window U-value 1.1 87 21 43 69 172 259 133 0 547 4%
Window U-value 0.9 79 26 43 69 172 251 138 0 548 3%
Window U-value 1.4 92 20 43 69 172 264 132 0 550 3%
Window U-value 1.8 87 29 43 69 172 260 141 0 563 1%
Chiller Efficiency 5.5 110 7 43 69 172 282 119 0 546 6%
Chiller Efficiency 4.5 110 9 43 69 172 282 121 0 549 5%
Chiller Efficiency 3.5 110 11 43 69 172 282 123 0 554 4%
AHU SFP 1.8 110 24 33 69 172 282 125 0 558 6%
AHU SFP 2 110 24 35 69 172 282 128 0 564 5%
AHU SFP 2.2 110 24 38 69 172 282 131 0 569 4%
Lighting Efficacy 65 145 12 43 16 172 317 71 0 489 1%
Lighting Efficacy 60 144 12 43 17 172 316 73 0 491 0%
Lighting Efficacy 55 143 13 43 19 172 315 74 0 493 0%
AECOM Cost Optimal Calculations and Gap Analysis for recast EPBD for Non-Residential Buildings 42
Table 4.2e (EE2): Energy Demand Output Table
Building: Hotel
Measure Value
Energy Use Fuel Use Primary Energy
Heat Cool Aux DHW Light Gas Grid Elec.
Gen. Elec. Total Reduction
kWh/m² kWh/m² kWh/m² % Wall U-Value 0.1 105 15 38 148 30 253 83 0 442 4%
Wall U-Value 0.14 107 15 38 148 30 254 83 0 444 4%
Wall U-Value 0.16 107 15 38 148 30 255 83 0 445 4%
Wall U-Value 0.19 109 15 38 148 30 256 83 0 446 3%
Wall U-Value 0.21 109 15 38 148 30 257 83 0 446 3%
Wall U-Value 0.3 113 15 38 148 30 260 83 0 450 2%
Wall U-Value 0.39 116 14 38 148 30 264 83 0 453 2%
Roof U-value 0.15 117 14 38 148 30 264 82 0 453 1%
Roof U-value 0.2 118 14 38 148 30 265 82 0 454 1%
Roof U-value 0.25 119 14 38 148 30 266 82 0 455 1%
Heating Source ASHP 30 14 38 148 30 148 82 0 325 31%
Heating Source Gas CHP 27 14 38 148 30 330 82 54 420 11%
Heating Source Gas (91%) + SHW 121 14 38 137 30 258 82 0 446 5%
Heating Source Gas (91%) 121 14 38 148 30 269 82 0 458 2%
Heating Source Gas (86%) 131 14 38 148 30 279 82 0 469 0%
Floor U-value 0.1 110 14 38 148 30 258 83 0 446 3%
Floor U-value 0.15 111 14 38 148 30 259 83 0 448 3%
Floor U-value 0.2 113 14 38 148 30 260 82 0 449 2%
Floor U-value 0.25 114 14 38 148 30 261 82 0 450 2%
Window U-value 0.9 98 13 38 148 30 246 81 0 431 4%
Window U-value 1.1 107 10 38 148 30 254 78 0 434 4%
Window U-value 1.4 113 9 38 148 30 260 77 0 439 3%
Window U-value 1.8 106 16 38 148 30 253 84 0 445 1%
Chiller Efficiency 5.5 119 5 38 148 30 266 73 0 437 5%
Chiller Efficiency 4.5 119 6 38 148 30 266 74 0 439 4%
Chiller Efficiency 3.5 119 8 38 148 30 266 76 0 442 4%
AHU SFP 1.8 119 14 33 148 30 266 77 0 444 7%
AHU SFP 2 119 14 35 148 30 266 79 0 450 6%
AHU SFP 2.2 119 14 38 148 30 266 82 0 455 5%
Lighting Efficacy 65 128 12 38 148 16 276 67 0 434 1%
Lighting Efficacy 60 127 12 38 148 17 275 68 0 436 1%
Lighting Efficacy 55 126 13 38 148 19 274 70 0 439 0%
AECOM Cost Optimal Calculations and Gap Analysis for recast EPBD for Non-Residential Buildings 43
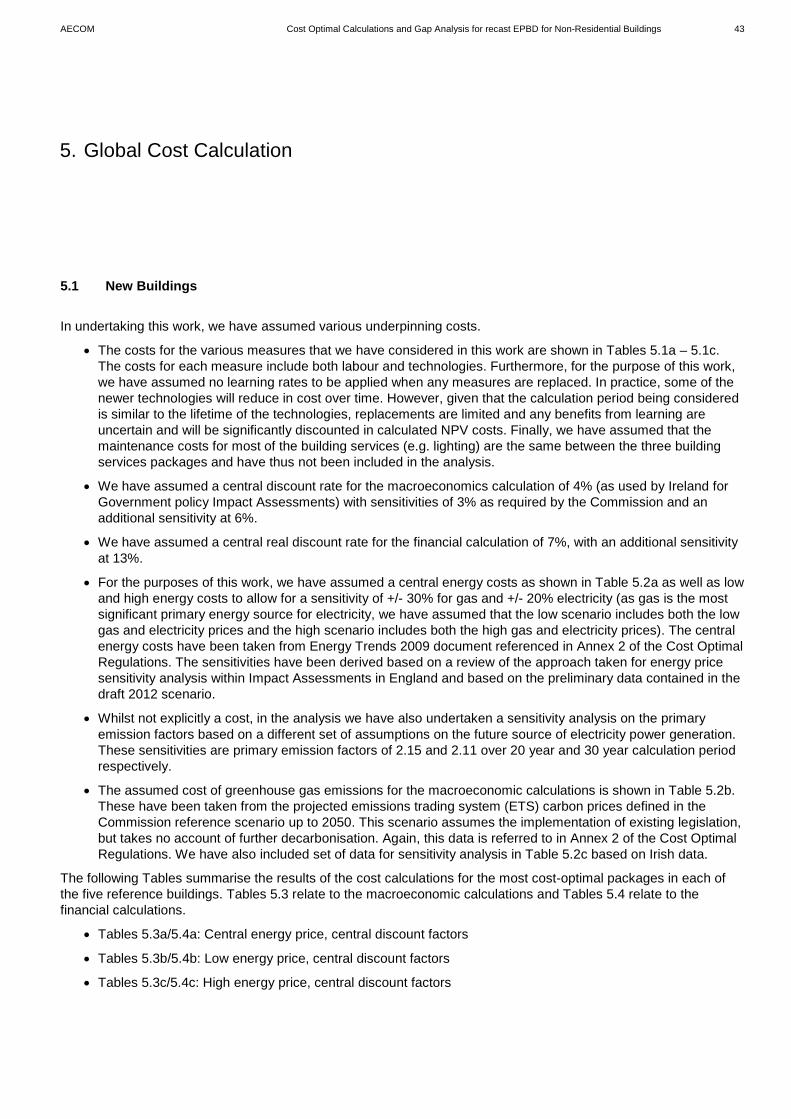
5.1 New Buildings
In undertaking this work, we have assumed various underpinning costs.
• The costs for the various measures that we have considered in this work are shown in Tables 5.1a – 5.1c. The costs for each measure include both labour and technologies. Furthermore, for the purpose of this work, we have assumed no learning rates to be applied when any measures are replaced. In practice, some of the newer technologies will reduce in cost over time. However, given that the calculation period being considered is similar to the lifetime of the technologies, replacements are limited and any benefits from learning are uncertain and will be significantly discounted in calculated NPV costs. Finally, we have assumed that the maintenance costs for most of the building services (e.g. lighting) are the same between the three building services packages and have thus not been included in the analysis.
• We have assumed a central discount rate for the macroeconomics calculation of 4% (as used by Ireland for Government policy Impact Assessments) with sensitivities of 3% as required by the Commission and an additional sensitivity at 6%.
• We have assumed a central real discount rate for the financial calculation of 7%, with an additional sensitivity at 13%.
• For the purposes of this work, we have assumed a central energy costs as shown in Table 5.2a as well as low and high energy costs to allow for a sensitivity of +/- 30% for gas and +/- 20% electricity (as gas is the most significant primary energy source for electricity, we have assumed that the low scenario includes both the low gas and electricity prices and the high scenario includes both the high gas and electricity prices). The central energy costs have been taken from Energy Trends 2009 document referenced in Annex 2 of the Cost Optimal Regulations. The sensitivities have been derived based on a review of the approach taken for energy price sensitivity analysis within Impact Assessments in England and based on the preliminary data contained in the draft 2012 scenario.
• Whilst not explicitly a cost, in the analysis we have also undertaken a sensitivity analysis on the primary emission factors based on a different set of assumptions on the future source of electricity power generation. These sensitivities are primary emission factors of 2.15 and 2.11 over 20 year and 30 year calculation period respectively.
• The assumed cost of greenhouse gas emissions for the macroeconomic calculations is shown in Table 5.2b. These have been taken from the projected emissions trading system (ETS) carbon prices defined in the Commission reference scenario up to 2050. This scenario assumes the implementation of existing legislation, but takes no account of further decarbonisation. Again, this data is referred to in Annex 2 of the Cost Optimal Regulations. We have also included set of data for sensitivity analysis in Table 5.2c based on Irish data.
The following Tables summarise the results of the cost calculations for the most cost-optimal packages in each of the five reference buildings. Tables 5.3 relate to the macroeconomic calculations and Tables 5.4 relate to the financial calculations.
• Tables 5.3a/5.4a: Central energy price, central discount factors
• Tables 5.3b/5.4b: Low energy price, central discount factors
• Tables 5.3c/5.4c: High energy price, central discount factors
5. Global Cost Calculation

AECOM Cost Optimal Calculations and Gap Analysis for recast EPBD for Non-Residential Buildings 44
• Tables 5.3d/5.4d: Central energy price, low discount factors for macro-economic and high discount factor for financial.
• Table 5.3e: Central energy price, high discount factor (macro-economic calculation only)
• Table 5.3f: Central energy price, central discount factors, alternative primary emission factors (macro-economic calculation only)
• Table 5.3g: Central energy price, central discount factors, alternative carbon price (macro-economic calculation only)
The sensitivity analysis shows the following.
• Discount rate: Increasing the discount rate had the tendency to make solutions with higher primary energy demand relatively more attractive. This is presumably due to the cost of energy consumption over the calculation period becoming cheaper in terms of net present value. For the macro-economic calculations, going from the low to high discount rates, as much as doubled the cost optimal primary energy.
• Energy price: There is a tendency for the solutions with higher primary energy to become relatively less attractive as energy prices increase. For the macro-economic calculations, going from the low to high energy prices, reduced the cost optimum primary energy by up to 20%. This is due to the preference for lower net energy consumption as energy prices increase.
• Primary emission factor (PEF): The higher PEFs in the sensitivity case simply increased the cost optimum primary energy in most cases. For the air conditioned office building, it changed the optimum technology to one of a less energy efficient servicing strategy.
• Price of carbon: The sensitivity case for the price of carbon was approximately 25% less than the central case. The impact on the overall macroeconomic costs was very small and, in the main, did not impact on the cost optimal level. The exception was an increase in cost optimum primary energy of 25% for the air conditioned office.
When comparing the results from the central macro-economic and financial calculations, there is a tendency for solutions with higher primary energy to be more attractive and for lower primary energy to be less attractive in the financial case. This is partly explained by the higher discount rates used for the financial calculations which effectively make energy consumption cheaper in a net present value calculation.

AECOM Cost Optimal Calculations and Gap Analysis for recast EPBD for Non-Residential Buildings 45
Table 5.1a: Elemental Capital Costs per m² of Fabric (EUR/m²)
Construction Value (W/m²K) Cost (EUR/m²)
Roof: Tiled Pitched
0.25 26 0.2 31
0.15 34 0.1 45
Roof: Profiled Metal
0.25 3 0.2 4
0.15 5 0.1 8
Roof: Flat
0.25 15 0.2 19
0.15 25 0.1 37
Wall: Masonry Cavity
0.3 6 0.25 8 0.21 12 0.15 20
Wall: Lightweight Metal Frame (LMF)
0.3 11 0.25 12 0.21 14 0.15 18
Floor: Solid
0.25 12 0.2 14
0.15 19 0.1 26
Window: Timber Frame 1.8 300 1.4 385 0.9 530
Window: uPVC 1.8 265 1.4 310 0.9 427
AECOM Cost Optimal Calculations and Gap Analysis for recast EPBD for Non-Residential Buildings 46
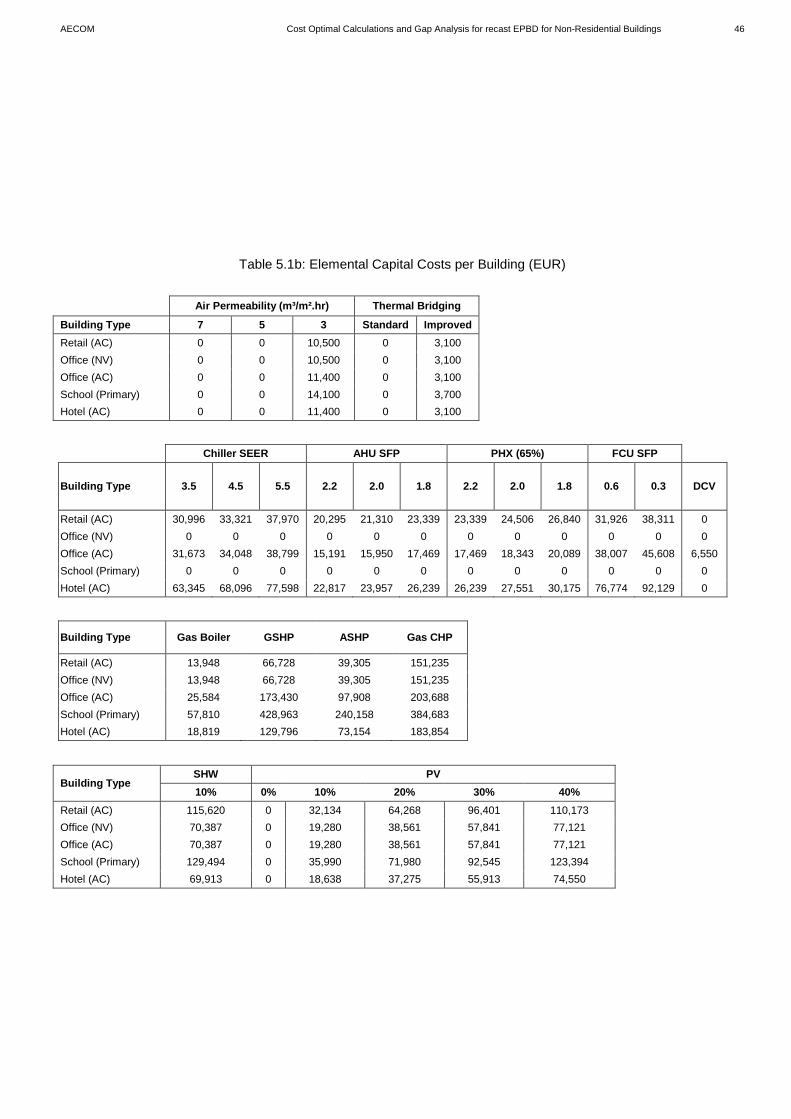
Table 5.1b: Elemental Capital Costs per Building (EUR)
Air Permeability (m³/m².hr) Thermal Bridging
Building Type 7 5 3 Standard Improved Retail (AC) 0 0 10,500 0 3,100 Office (NV) 0 0 10,500 0 3,100 Office (AC) 0 0 11,400 0 3,100 School (Primary) 0 0 14,100 0 3,700 Hotel (AC) 0 0 11,400 0 3,100
Chiller SEER AHU SFP PHX (65%) FCU SFP
Building Type 3.5 4.5 5.5 2.2 2.0 1.8 2.2 2.0 1.8 0.6 0.3 DCV
Retail (AC) 30,996 33,321 37,970 20,295 21,310 23,339 23,339 24,506 26,840 31,926 38,311 0 Office (NV) 0 0 0 0 0 0 0 0 0 0 0 0 Office (AC) 31,673 34,048 38,799 15,191 15,950 17,469 17,469 18,343 20,089 38,007 45,608 6,550 School (Primary) 0 0 0 0 0 0 0 0 0 0 0 0 Hotel (AC) 63,345 68,096 77,598 22,817 23,957 26,239 26,239 27,551 30,175 76,774 92,129 0
Building Type Gas Boiler GSHP ASHP Gas CHP
Retail (AC) 13,948 66,728 39,305 151,235 Office (NV) 13,948 66,728 39,305 151,235 Office (AC) 25,584 173,430 97,908 203,688 School (Primary) 57,810 428,963 240,158 384,683 Hotel (AC) 18,819 129,796 73,154 183,854
Building Type SHW PV 10% 0% 10% 20% 30% 40%
Retail (AC) 115,620 0 32,134 64,268 96,401 110,173 Office (NV) 70,387 0 19,280 38,561 57,841 77,121 Office (AC) 70,387 0 19,280 38,561 57,841 77,121 School (Primary) 129,494 0 35,990 71,980 92,545 123,394 Hotel (AC) 69,913 0 18,638 37,275 55,913 74,550

AECOM Cost Optimal Calculations and Gap Analysis for recast EPBD for Non-Residential Buildings 47
Table 5.1c: Elemental Maintenance Costs per Building per Year (EUR)
Building Type DCV
Retail (AC) 0 Office (NV) 0 Office (AC) 400 School (Primary) 0 Hotel (AC) 0
Building Type Gas Boiler GSHP ASHP Gas CHP
Retail (AC) 738 738 747 4,705 Office (NV) 738 738 747 4,705 Office (AC) 2,460 2,460 2,491 10,978 School (Primary) 6,150 6,150 6,227 18,494 Hotel (AC) 1,845 1,845 1,868 9,133
Building Type SHW PV 10% 0% 10% 20% 30% 40%
Retail (AC) 191 0 154 246 277 369 Office (NV) 160 0 123 185 215 277 Office (AC) 160 0 123 185 215 277 School (Primary) 191 0 154 246 308 369 Hotel (AC) 129 0 92 154 215 246

AECOM Cost Optimal Calculations and Gap Analysis for recast EPBD for Non-Residential Buildings 48
Table 5.2a: Energy Costs
2013 2014 2015 2016 2017 2018 2019 2020 2021 2022
Low Electricity c/kWh 12.5 12.8 13.1 13.4 13.6 13.8 14.1 14.3 14.5 14.6 Low Gas c/kWh 4.9 5.1 5.3 5.6 5.8 6.0 6.3 6.5 6.7 6.8
Central Electricity c/kWh 15.7 16.0 16.4 16.7 17.0 17.3 17.6 17.9 18.1 18.3 Central Gas c/kWh 7.0 7.3 7.6 8.0 8.3 8.6 9.0 9.3 9.5 9.7
High Electricity c/kWh 18.8 19.2 19.7 20.0 20.4 20.8 21.1 21.5 21.7 21.9 High Gas c/kWh 9.1 9.5 9.9 10.4 10.8 11.2 11.6 12.1 12.4 12.6
2023 2024 2025 2026 2027 2028 2029 2030 2031 2032
Low Electricity c/kWh 14.7 14.9 15.0 15.0 15.0 15.0 15.0 15.0 15.0 15.0 Low Gas c/kWh 7.0 7.1 7.3 7.4 7.6 7.8 7.9 8.1 8.3 8.5
Central Electricity c/kWh 18.4 18.6 18.7 18.7 18.7 18.7 18.7 18.7 18.7 18.7 Central Gas c/kWh 10.0 10.2 10.4 10.6 10.9 11.1 11.3 11.5 11.8 12.2
High Electricity c/kWh 22.1 22.3 22.5 22.5 22.5 22.5 22.5 22.5 22.5 22.5 High Gas c/kWh 12.9 13.2 13.5 13.8 14.1 14.4 14.7 15.0 15.4 15.8
2033 2034 2035 2036 2037 2038 2039 2040 2041 2042
Low Electricity c/kWh 15.0 15.0 15.0 15.0 15.0 15.0 15.0 15.0 15.0 15.0 Low Gas c/kWh 8.8 9.0 9.3 9.5 9.8 10.1 10.3 10.6 10.9 11.2
Central Electricity c/kWh 18.7 18.7 18.7 18.7 18.7 18.7 18.7 18.7 18.7 18.7 Central Gas c/kWh 12.5 12.9 13.2 13.6 14.0 14.4 14.8 15.2 15.6 16.1
High Electricity c/kWh 22.5 22.5 22.5 22.5 22.5 22.5 22.5 22.5 22.5 22.5 High Gas c/kWh 16.3 16.7 17.2 17.7 18.2 18.7 19.2 19.7 20.3 20.9
Table 5.2b: Cost of Carbon
2013 2014 2015 2016 2017 2018 2019 2020 2021 2022 Reference (frag. action, ref. fossil f. prices) EUR/TCO2 18.0 18.0 18.0 18.0 18.0 18.0 18.0 18.0 21.9 21.9 2023 2024 2025 2026 2027 2028 2029 2030 2031 2032 Reference (frag. action, ref. fossil f. prices) EUR/TCO2 21.9 21.9 21.9 39.4 39.4 39.4 39.4 39.4 54.7 54.7 2033 2034 2035 2036 2037 2038 2039 2040 2041 2042 Reference (frag. action, ref. fossil f. prices) EUR/TCO2 54.7 54.7 54.7 56.9 56.9 56.9 56.9 56.9 55.8 55.8

AECOM Cost Optimal Calculations and Gap Analysis for recast EPBD for Non-Residential Buildings 49
Table 5.2c: Cost of Carbon Sensitivity
2013 2014 2015 2016 2017 2018 2019 2020 2021 2022 Ireland Reference Scenario EUR/TCO2 12.0 12.0 8.6 8.6 8.6 8.6 8.6 10.7 10.7 10.7 2023 2024 2025 2026 2027 2028 2029 2030 2031 2032 Ireland Reference Scenario EUR/TCO2 10.7 10.7 15.0 15.0 15.0 15.0 15.0 34.3 34.3 34.3 2033 2034 2035 2036 2037 2038 2039 2040 2041 2042 Ireland Reference Scenario EUR/TCO2 34.3 34.3 53.6 53.6 53.6 53.6 53.6 73.0 73.0 73.0
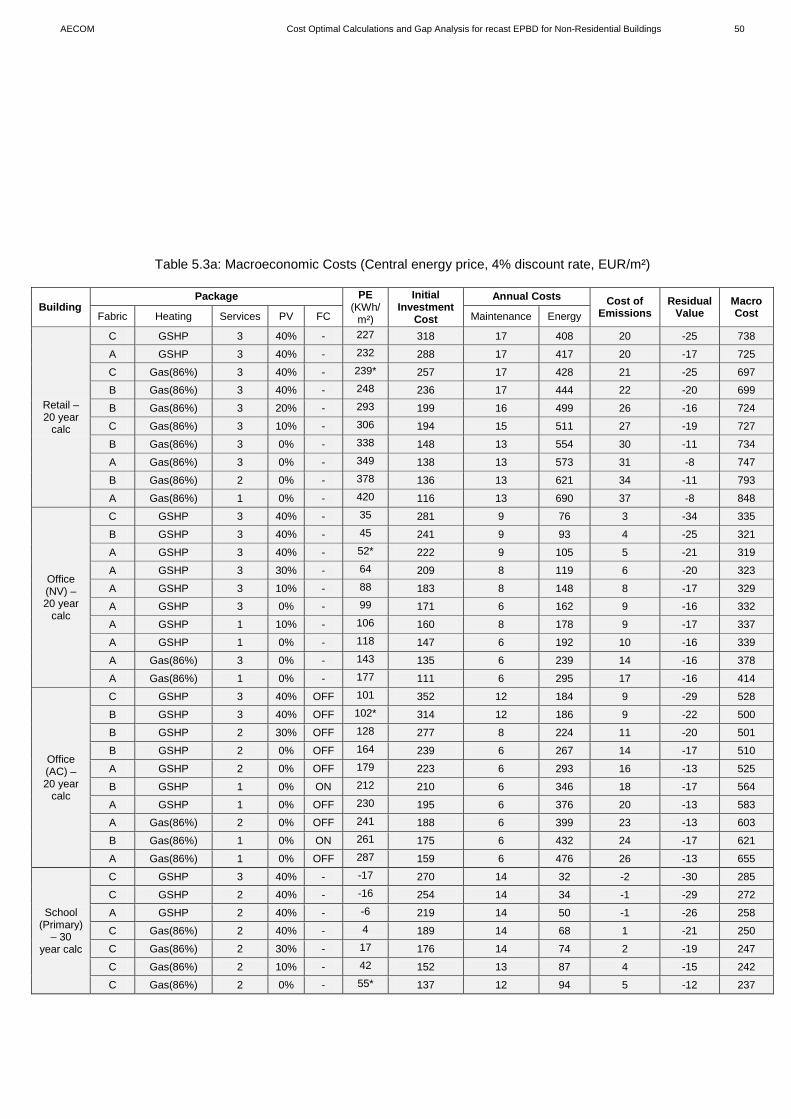
AECOM Cost Optimal Calculations and Gap Analysis for recast EPBD for Non-Residential Buildings 50
Table 5.3a: Macroeconomic Costs (Central energy price, 4% discount rate, EUR/m²)
Building Package PE
(KWh/m²)
Initial Investment
Cost
Annual Costs Cost of Emissions
Residual Value
Macro Cost Fabric Heating Services PV FC Maintenance Energy
Retail – 20 year
calc
C GSHP 3 40% - 227 318 17 408 20 -25 738
A GSHP 3 40% - 232 288 17 417 20 -17 725
C Gas(86%) 3 40% - 239* 257 17 428 21 -25 697
B Gas(86%) 3 40% - 248 236 17 444 22 -20 699
B Gas(86%) 3 20% - 293 199 16 499 26 -16 724
C Gas(86%) 3 10% - 306 194 15 511 27 -19 727
B Gas(86%) 3 0% - 338 148 13 554 30 -11 734
A Gas(86%) 3 0% - 349 138 13 573 31 -8 747
B Gas(86%) 2 0% - 378 136 13 621 34 -11 793
A Gas(86%) 1 0% - 420 116 13 690 37 -8 848
Office (NV) – 20 year
calc
C GSHP 3 40% - 35 281 9 76 3 -34 335
B GSHP 3 40% - 45 241 9 93 4 -25 321
A GSHP 3 40% - 52* 222 9 105 5 -21 319
A GSHP 3 30% - 64 209 8 119 6 -20 323
A GSHP 3 10% - 88 183 8 148 8 -17 329
A GSHP 3 0% - 99 171 6 162 9 -16 332
A GSHP 1 10% - 106 160 8 178 9 -17 337
A GSHP 1 0% - 118 147 6 192 10 -16 339
A Gas(86%) 3 0% - 143 135 6 239 14 -16 378
A Gas(86%) 1 0% - 177 111 6 295 17 -16 414
Office (AC) – 20 year
calc
C GSHP 3 40% OFF 101 352 12 184 9 -29 528
B GSHP 3 40% OFF 102* 314 12 186 9 -22 500
B GSHP 2 30% OFF 128 277 8 224 11 -20 501
B GSHP 2 0% OFF 164 239 6 267 14 -17 510
A GSHP 2 0% OFF 179 223 6 293 16 -13 525
B GSHP 1 0% ON 212 210 6 346 18 -17 564
A GSHP 1 0% OFF 230 195 6 376 20 -13 583
A Gas(86%) 2 0% OFF 241 188 6 399 23 -13 603
B Gas(86%) 1 0% ON 261 175 6 432 24 -17 621
A Gas(86%) 1 0% OFF 287 159 6 476 26 -13 655
School (Primary)
– 30 year calc
C GSHP 3 40% - -17 270 14 32 -2 -30 285
C GSHP 2 40% - -16 254 14 34 -1 -29 272
A GSHP 2 40% - -6 219 14 50 -1 -26 258
C Gas(86%) 2 40% - 4 189 14 68 1 -21 250
C Gas(86%) 2 30% - 17 176 14 74 2 -19 247
C Gas(86%) 2 10% - 42 152 13 87 4 -15 242
C Gas(86%) 2 0% - 55* 137 12 94 5 -12 237

AECOM Cost Optimal Calculations and Gap Analysis for recast EPBD for Non-Residential Buildings 51
B Gas(86%) 2 0% - 71 115 12 122 7 -10 246
B Gas(86%) 1 0% - 80 100 12 138 8 -9 249
A Gas(86%) 1 0% - 91 88 12 156 9 -7 258
Hotel – 20 year
calc
C GSHP+SHW 3 40% - 243 396 12 417 24 -29 819
B GSHP+SHW 3 40% - 246 358 12 423 24 -21 795
A GSHP 3 40% - 266 312 11 455 26 -17 787
B GSHP 1 40% - 284* 277 11 484 27 -21 779
A GSHP 1 30% - 302 252 11 511 29 -16 786
A GSHP 1 0% - 321 229 10 535 31 -14 791
A Gas(86%) 3 0% - 339 238 10 569 33 -14 836
B Gas(86%) 1 10% - 352 210 10 593 35 -19 829
B Gas(86%) 1 0% - 359 203 10 601 35 -18 831
A Gas(86%) 1 0% - 376 185 10 630 37 -14 847
Table 5.3b: Macroeconomic Costs (Low energy price, 4% discount rate, EUR/m²)
Building Package PE
(KWh/m²)
Initial Investment
Cost
Annual Costs Cost of Emissions
Residual Value
Macro Cost Fabric Heating Services PV FC Maintenance Energy
Retail – 20 year
calc
C GSHP 3 40% - 227 318 17 327 20 -25 656
A GSHP 3 40% - 232 288 17 333 20 -17 641
C Gas(86%) 3 40% - 239 257 17 339 21 -25 608
B Gas(86%) 3 40% - 248* 236 17 350 22 -20 605
B Gas(86%) 3 20% - 293 199 16 394 26 -16 619
C Gas(86%) 3 10% - 306 194 15 405 27 -19 622
B Gas(86%) 3 0% - 338 148 13 438 30 -11 618
A Gas(86%) 3 0% - 349 138 13 451 31 -8 625
B Gas(86%) 2 0% - 378 136 13 489 34 -11 660
A Gas(86%) 1 0% - 420 116 13 542 37 -8 700
Office (NV) – 20 year
calc
C GSHP 3 40% - 35 281 9 61 3 -34 320
B GSHP 3 40% - 45 241 9 74 4 -25 303
A GSHP 3 40% - 52* 222 9 84 5 -21 298
A GSHP 3 30% - 64 209 8 95 6 -20 299
A GSHP 3 10% - 88 183 8 118 8 -17 300
A GSHP 3 0% - 99 171 6 130 9 -16 300
A GSHP 1 10% - 106 160 8 142 9 -17 301
A GSHP 1 0% - 118 147 6 154 10 -16 301
A Gas(86%) 3 0% - 143 135 6 179 14 -16 318
A Gas(86%) 1 0% - 177 111 6 220 17 -16 339 Office (AC) – 20 year
calc
C GSHP 3 40% OFF 101 352 12 147 9 -29 491
B GSHP 3 40% OFF 102 314 12 149 9 -22 463
B GSHP 2 30% OFF 128* 277 8 179 11 -20 456

AECOM Cost Optimal Calculations and Gap Analysis for recast EPBD for Non-Residential Buildings 52
B GSHP 2 0% OFF 164 239 6 214 14 -17 457
A GSHP 2 0% OFF 179 223 6 234 16 -13 466
B GSHP 1 0% ON 212 210 6 277 18 -17 495
A GSHP 1 0% OFF 230 195 6 301 20 -13 508
A Gas(86%) 2 0% OFF 241 188 6 303 23 -13 507
B Gas(86%) 1 0% ON 261 175 6 332 24 -17 521
A Gas(86%) 1 0% OFF 287 159 6 365 26 -13 544
School (Primary)
– 30 year calc
C GSHP 3 40% - -17 270 14 25 -2 -30 278
C GSHP 2 40% - -16 254 14 26 -1 -29 265
A GSHP 2 40% - -6 219 14 40 -1 -26 247
C Gas(86%) 2 40% - 4 189 14 48 1 -21 230
C Gas(86%) 2 30% - 17 176 14 53 2 -19 226
C Gas(86%) 2 10% - 42 152 13 64 4 -15 219
C Gas(86%) 2 0% - 55* 137 12 69 5 -12 212
B Gas(86%) 2 0% - 71 115 12 89 7 -10 213
B Gas(86%) 1 0% - 80 100 12 102 8 -9 214
A Gas(86%) 1 0% - 91 88 12 115 9 -7 217
Hotel – 20 year
calc
C GSHP+SHW 3 40% - 243 396 12 309 24 -29 711
B GSHP+SHW 3 40% - 246 358 12 314 24 -21 686
A GSHP 3 40% - 266 312 11 337 26 -17 670
B GSHP 1 40% - 284* 277 11 361 27 -21 655
A GSHP 1 30% - 302 252 11 382 29 -16 658
A GSHP 1 0% - 321 229 10 402 31 -14 657
A Gas(86%) 3 0% - 339 238 10 416 33 -14 683
B Gas(86%) 1 10% - 352 210 10 435 35 -19 671
B Gas(86%) 1 0% - 359 203 10 441 35 -18 671
A Gas(86%) 1 0% - 376 185 10 463 37 -14 680
Table 5.3c: Macroeconomic Costs (High energy price, 4% discount rate, EUR/m²)
Building Package PE
(KWh/m²)
Initial Investment
Cost
Annual Costs Cost of Emissions
Residual Value
Macro Cost Fabric Heating Services PV FC Maintenance Energy
Retail – 20 year
calc
C GSHP 3 40% - 227 318 17 490 20 -25 819
B GSHP 3 40% - 228 298 17 491 20 -20 806
C Gas(86%) 3 40% - 239* 257 17 517 21 -25 786
C Gas(86%) 3 20% - 284 220 16 583 25 -22 821
C Gas(86%) 3 0% - 329 168 13 649 29 -17 842
B Gas(86%) 3 0% - 338 148 13 671 30 -11 850
A Gas(86%) 3 0% - 349 138 13 695 31 -8 869
A Gas(86%) 2 0% - 390 126 13 781 35 -8 946
B Gas(86%) 1 0% - 408 125 13 811 36 -11 975

AECOM Cost Optimal Calculations and Gap Analysis for recast EPBD for Non-Residential Buildings 53
A Gas(86%) 1 0% - 420 116 13 838 37 -8 996
Office (NV) – 20 year
calc
C GSHP 3 40% - 35 281 9 91 3 -34 350
B GSHP 3 40% - 45* 241 9 111 4 -25 340
A GSHP 3 40% - 52 222 9 126 5 -21 340
A GSHP 3 30% - 64 209 8 143 6 -20 347
A GSHP 3 10% - 88 183 8 178 8 -17 359
A GSHP 3 0% - 99 171 6 195 9 -16 365
A GSHP 1 10% - 106 160 8 213 9 -17 372
A GSHP 1 0% - 118 147 6 231 10 -16 378
A Gas(86%) 3 0% - 143 135 6 298 14 -16 438
A Gas(86%) 1 0% - 177 111 6 371 17 -16 489
Office (AC) – 20 year
calc
C GSHP 3 40% OFF 101 352 12 221 9 -29 565
B GSHP 3 40% OFF 102* 314 12 224 9 -22 538
B GSHP 2 30% OFF 128 277 8 269 11 -20 546
B GSHP 2 0% OFF 164 239 6 321 14 -17 564
A GSHP 2 0% OFF 179 223 6 351 16 -13 583
B GSHP 1 0% ON 212 210 6 415 18 -17 633
A GSHP 1 0% OFF 230 195 6 451 20 -13 659
A Gas(86%) 2 0% OFF 241 188 6 496 23 -13 700
B Gas(86%) 1 0% ON 261 175 6 532 24 -17 720
A Gas(86%) 1 0% OFF 287 159 6 586 26 -13 765
School (Primary)
– 30 year calc
C GSHP 3 40% - -17 270 14 39 -2 -30 291
C GSHP 2 40% - -16 254 14 41 -1 -29 279
A GSHP 2 40% - -6 219 14 61 -1 -26 268
C Gas(86%) 2 40% - 4 189 14 87 1 -21 269
C Gas(86%) 2 30% - 17 176 14 95 2 -19 268
C Gas(86%) 2 10% - 42 152 13 111 4 -15 266
C Gas(86%) 2 0% - 55* 137 12 119 5 -12 262
B Gas(86%) 2 0% - 71 115 12 155 7 -10 279
B Gas(86%) 1 0% - 80 100 12 174 8 -9 285
A Gas(86%) 1 0% - 91 88 12 197 9 -7 299
Hotel – 20 year
calc
C GSHP+SHW 3 40% - 243 396 12 525 24 -29 927
B GSHP+SHW 3 40% - 246 358 12 532 24 -21 905
A GSHP 3 40% - 266 312 11 572 26 -17 904
B GSHP 1 40% - 284* 277 11 608 27 -21 902
A GSHP 1 30% - 302 252 11 639 29 -16 915
A GSHP 1 0% - 321 229 10 668 31 -14 924
A Gas(86%) 3 0% - 339 238 10 722 33 -14 989
B Gas(86%) 1 10% - 352 210 10 751 35 -19 987
B Gas(86%) 1 0% - 359 203 10 761 35 -18 990
A Gas(86%) 1 0% - 376 185 10 797 37 -14 1015

AECOM Cost Optimal Calculations and Gap Analysis for recast EPBD for Non-Residential Buildings 54
Table 5.3d: Macroeconomic Costs (Central energy price, 3% discount rate, EUR/m²)
Building Package PE
(KWh/m²)
Initial Investment
Cost
Annual Costs Cost of Emissions
Residual Value
Macro Cost Fabric Heating Services PV FC Maintenance Energy
Retail – 20 year
calc
C GSHP 3 40% - 227 318 18 460 22 -30 789
B GSHP 3 40% - 228 298 18 461 22 -24 776
C Gas(86%) 3 40% - 239* 257 18 483 24 -30 751
C Gas(86%) 3 30% - 261 245 17 514 26 -29 774
C Gas(86%) 3 0% - 329 168 14 607 33 -20 802
B Gas(86%) 3 0% - 338 148 14 626 34 -13 808
A Gas(86%) 3 0% - 349 138 14 647 35 -10 825
B Gas(86%) 2 0% - 378 136 14 701 38 -13 877
A Gas(86%) 2 0% - 390 126 14 725 40 -10 895
A Gas(86%) 1 0% - 420 116 14 779 43 -10 942
Office (NV) – 20 year
calc
C GSHP 3 40% - 35 281 10 86 3 -41 339
B GSHP 3 40% - 45* 241 10 104 4 -31 329
A GSHP 3 40% - 52 222 10 118 5 -25 330
A GSHP 3 30% - 64 209 9 134 6 -24 335
A GSHP 3 10% - 88 183 8 167 9 -21 346
A GSHP 3 0% - 99 171 7 183 10 -19 351
A GSHP 1 10% - 106 160 8 200 10 -21 358
A GSHP 1 0% - 118 147 7 217 12 -19 362
A Gas(86%) 3 0% - 143 135 7 271 16 -19 410
A Gas(86%) 1 0% - 177 111 7 336 20 -19 454
Office (AC) – 20 year
calc
C GSHP 3 40% OFF 101 352 14 208 10 -35 547
B GSHP 3 40% OFF 102* 314 14 210 10 -26 522
B GSHP 2 30% OFF 128 277 9 253 13 -24 527
B GSHP 2 0% OFF 164 239 7 301 16 -20 543
A GSHP 2 0% OFF 179 223 7 330 18 -16 562
B GSHP 1 0% ON 212 210 7 390 21 -20 608
A GSHP 1 0% OFF 230 195 7 424 23 -16 632
A Gas(86%) 2 0% OFF 241 188 7 453 26 -16 658
B Gas(86%) 1 0% ON 261 175 7 489 28 -20 679
A Gas(86%) 1 0% OFF 287 159 7 539 30 -16 719
School (Primary)
– 30 year calc
C GSHP 3 40% - -17 283 16 36 -2 -40 293
C GSHP 2 40% - -16 266 16 38 -2 -38 280
A GSHP 2 40% - -6 231 16 57 -1 -34 269
C Gas(86%) 2 40% - 4 196 16 77 1 -28 262
C Gas(86%) 2 30% - 17 182 16 85 2 -25 260
C Gas(86%) 2 10% - 42 157 15 99 5 -19 257
C Gas(86%) 2 0% - 55* 141 14 107 6 -16 252

AECOM Cost Optimal Calculations and Gap Analysis for recast EPBD for Non-Residential Buildings 55
B Gas(86%) 2 0% - 71 118 14 139 8 -13 266
B Gas(86%) 1 0% - 80 102 14 157 9 -11 271
A Gas(86%) 1 0% - 91 90 14 178 11 -10 283
Hotel – 20 year
calc
C GSHP+SHW 3 40% - 243 396 13 474 27 -35 875
B GSHP+SHW 3 40% - 246 358 13 481 28 -25 854
A GSHP 3 40% - 266 312 12 517 30 -20 851
B GSHP 1 40% - 284* 277 12 550 32 -25 846
A GSHP 1 30% - 302 252 12 580 33 -19 858
A GSHP 1 0% - 321 229 11 607 35 -17 866
A Gas(86%) 3 0% - 339 238 11 648 39 -17 919
B Gas(86%) 1 10% - 352 210 11 675 40 -23 914
B Gas(86%) 1 0% - 359 203 11 684 41 -22 916
A Gas(86%) 1 0% - 376 185 11 717 43 -17 938
Table 5.3e: Macroeconomic Costs (Central energy price, 6% discount rate, EUR/m²)
Building Package PE
(KWh/m²)
Initial Investment
Cost
Annual Costs Cost of Emissions
Residual Value
Macro Cost Fabric Heating Services PV FC Maintenance Energy
Retail – 20 year
calc
C GSHP 3 40% - 227 318 14 329 16 -18 659
B GSHP 3 40% - 228 298 14 329 16 -14 643
C Gas(86%) 3 40% - 239 257 14 344 16 -18 613
B Gas(86%) 3 40% - 248* 236 14 356 17 -14 610
C Gas(86%) 3 0% - 329 168 11 433 23 -12 623
B Gas(86%) 3 0% - 338 148 11 445 23 -8 620
A Gas(86%) 3 0% - 349 138 11 460 24 -6 628
A Gas(86%) 2 0% - 390 126 11 515 27 -6 673
B Gas(86%) 1 0% - 408 125 11 537 28 -8 694
A Gas(86%) 1 0% - 420 116 11 553 29 -6 703
Office (NV) – 20 year
calc
C GSHP 3 40% - 35 281 8 61 2 -24 328
B GSHP 3 40% - 45 241 8 75 3 -18 309
A GSHP 3 40% - 52 222 8 84 4 -15 303
A GSHP 3 30% - 64 209 7 96 4 -14 303
A GSHP 3 10% - 88 183 6 119 6 -12 303
A GSHP 3 0% - 99* 171 5 131 7 -11 302
A GSHP 1 10% - 106 160 6 143 7 -12 304
A GSHP 1 0% - 118 147 5 155 8 -11 304
A Gas(86%) 3 0% - 143 135 5 189 10 -11 330
A Gas(86%) 1 0% - 177 111 5 234 13 -11 353 Office (AC) – 20 year
calc
C GSHP 3 40% OFF 101 352 11 148 7 -20 497
B GSHP 3 40% OFF 102 314 11 150 7 -15 467
B GSHP 2 30% OFF 128 277 7 181 9 -14 460

AECOM Cost Optimal Calculations and Gap Analysis for recast EPBD for Non-Residential Buildings 56
B GSHP 2 0% OFF 164* 239 5 215 11 -12 459
A GSHP 2 0% OFF 179 223 5 236 12 -9 467
B GSHP 1 0% ON 212 210 5 279 14 -12 497
A GSHP 1 0% OFF 230 195 5 303 16 -9 509
A Gas(86%) 2 0% OFF 241 188 5 318 17 -9 519
B Gas(86%) 1 0% ON 261 175 5 345 19 -12 532
A Gas(86%) 1 0% OFF 287 159 5 379 21 -9 555
School (Primary)
– 30 year calc
C GSHP 3 40% - -17 252 11 25 -1 -17 270
C GSHP 2 40% - -16 237 11 27 -1 -16 258
A GSHP 2 40% - -6 202 11 40 0 -15 239
C Gas(86%) 2 40% - 4 178 11 53 1 -12 231
C Gas(86%) 2 30% - 17 166 11 58 1 -11 226
C Gas(86%) 2 10% - 42 145 11 69 3 -8 220
C Gas(86%) 2 0% - 55* 132 10 74 4 -7 213
B Gas(86%) 2 0% - 71 109 10 96 5 -6 215
B Gas(86%) 1 0% - 80 96 10 109 6 -5 216
A Gas(86%) 1 0% - 91 84 10 123 7 -4 220
Hotel – 20 year
calc
C GSHP+SHW 3 40% - 243 396 10 330 18 -20 734
B GSHP+SHW 3 40% - 246 358 10 335 18 -15 707
A GSHP 3 40% - 266 312 9 360 20 -12 690
B GSHP 1 40% - 284 277 9 384 21 -15 677
A GSHP 1 30% - 302 252 9 405 22 -11 677
A GSHP 1 0% - 321* 229 8 425 24 -10 676
A Gas(86%) 3 0% - 339 238 8 449 26 -10 711
B Gas(86%) 1 10% - 352 210 9 468 26 -13 701
B Gas(86%) 1 0% - 359 203 8 475 27 -13 700
A Gas(86%) 1 0% - 376 185 8 498 28 -10 709
Table 5.3f: Macroeconomic Costs (Central energy price, 4% discount rate, Alternative PEF, EUR/m²)
Building Package PE
(KWh/m²)
Initial Investment
Cost
Annual Costs Cost of Emissions
Residual Value
Macro Cost Fabric Heating Services PV FC Maintenance Energy
Retail – 20 year
calc
C GSHP 3 40% - 248 318 17 408 23 -25 741
A GSHP 3 40% - 254 288 17 417 23 -17 728
C Gas(86%) 3 40% - 259* 257 17 428 24 -25 700
B Gas(86%) 3 40% - 268 236 17 444 25 -20 702
B Gas(86%) 3 20% - 317 199 16 499 30 -16 728
C Gas(86%) 3 10% - 332 194 15 511 31 -19 731
B Gas(86%) 3 0% - 366 148 13 554 34 -11 738
A Gas(86%) 3 0% - 377 138 13 573 35 -8 752
B Gas(86%) 2 0% - 408 136 13 621 38 -11 797

AECOM Cost Optimal Calculations and Gap Analysis for recast EPBD for Non-Residential Buildings 57
A Gas(86%) 1 0% - 453 116 13 690 43 -8 853
Office (NV) – 20 year
calc
C GSHP 3 40% - 38 281 9 76 4 -34 335
B GSHP 3 40% - 49 241 9 93 5 -25 322
A GSHP 3 40% - 57* 222 9 105 5 -21 320
A GSHP 3 30% - 70 209 8 119 6 -20 324
A GSHP 3 20% - 83 196 8 134 8 -19 327
A GSHP 3 0% - 108 171 6 162 10 -16 333
A GSHP 1 0% - 128 147 6 192 12 -16 341
A Gas(86%) 3 0% - 150 135 6 239 15 -16 379
B Gas(86%) 1 0% - 170 131 6 272 17 -21 405
A Gas(86%) 1 0% - 184 111 6 295 18 -16 415
Office (AC) – 20 year
calc
C GSHP 3 40% OFF 110 352 12 184 10 -29 529
B GSHP 3 40% OFF 112 314 12 186 10 -22 502
B GSHP 2 40% OFF 127* 290 9 210 12 -22 499
B GSHP 2 10% OFF 166 252 8 253 15 -18 510
A GSHP 2 0% OFF 195 223 6 293 18 -13 527
B GSHP 1 0% ON 231 210 6 346 21 -17 567
A GSHP 1 0% OFF 251 195 6 376 23 -13 587
A Gas(86%) 2 0% OFF 253 188 6 399 25 -13 605
B Gas(86%) 1 0% ON 278 175 6 432 27 -17 623
A Gas(86%) 1 0% OFF 305 159 6 476 29 -13 657
School (Primary)
– 30 year calc
C GSHP 3 40% - -20 270 14 32 -2 -30 284
C GSHP 2 40% - -18 254 14 34 -2 -29 272
A GSHP 2 40% - -7 219 14 50 -1 -26 257
C Gas(86%) 2 40% - 0 189 14 68 0 -21 249
C Gas(86%) 2 30% - 15 176 14 74 2 -19 247
C Gas(86%) 2 10% - 43 152 13 87 4 -15 242
C Gas(86%) 2 0% - 58* 137 12 94 6 -12 237
B Gas(86%) 2 0% - 74 115 12 122 7 -10 246
A Gas(86%) 2 0% - 85 103 12 140 9 -9 254
A Gas(86%) 1 0% - 96 88 12 156 10 -7 258
Hotel – 20 year
calc
C GSHP+SHW 3 40% - 252 396 12 417 25 -29 820
B GSHP+SHW 3 40% - 256 358 12 423 25 -21 797
A GSHP 3 40% - 276 312 11 455 27 -17 789
B GSHP 1 40% - 295* 277 11 484 29 -21 781
A GSHP 1 30% - 315 252 11 511 31 -16 788
B GSHP 1 0% - 324 247 10 517 32 -18 787
A GSHP 1 0% - 336 229 10 535 33 -14 793
A Gas(86%) 3 0% - 349 238 10 569 35 -14 838
B Gas(86%) 1 0% - 370 203 10 601 37 -18 832
A Gas(86%) 1 0% - 388 185 10 630 39 -14 849

AECOM Cost Optimal Calculations and Gap Analysis for recast EPBD for Non-Residential Buildings 58
Table 5.3g: Macroeconomic Costs (Central energy price, 4% discount rate, Alternative Cost of Carbon, EUR/m²)
Building Package PE
(KWh/m²)
Initial Investment
Cost
Annual Costs Cost of Emissions
Residual Value
Macro Cost Fabric Heating Services PV FC Maintenance Energy
Retail – 20 year
calc
C GSHP 3 40% - 227 318 17 408 13 -25 731
A GSHP 3 40% - 232 288 17 417 13 -17 718
C Gas(86%) 3 40% - 239* 257 17 428 14 -25 690
B Gas(86%) 3 40% - 248 236 17 444 15 -20 692
B Gas(86%) 3 20% - 293 199 16 499 17 -16 715
C Gas(86%) 3 10% - 306 194 15 511 18 -19 718
B Gas(86%) 3 0% - 338 148 13 554 20 -11 724
A Gas(86%) 3 0% - 349 138 13 573 21 -8 737
B Gas(86%) 2 0% - 378 136 13 621 22 -11 781
A Gas(86%) 1 0% - 420 116 13 690 25 -8 835
Office (NV) – 20 year
calc
C GSHP 3 40% - 35 281 9 76 2 -34 334
B GSHP 3 40% - 45 241 9 93 3 -25 320
A GSHP 3 40% - 52* 222 9 105 3 -21 318
A GSHP 3 30% - 64 209 8 119 4 -20 321
A GSHP 3 10% - 88 183 8 148 5 -17 327
A GSHP 3 0% - 99 171 6 162 6 -16 329
A GSHP 1 10% - 106 160 8 178 6 -17 334
A GSHP 1 0% - 118 147 6 192 7 -16 336
A Gas(86%) 3 0% - 143 135 6 239 9 -16 374
A Gas(86%) 1 0% - 177 111 6 295 12 -16 409
Office (AC) – 20 year
calc
C GSHP 3 40% OFF 101 352 12 184 6 -29 525
B GSHP 3 40% OFF 102 314 12 186 6 -22 497
B GSHP 2 30% OFF 128* 277 8 224 7 -20 497
B GSHP 2 0% OFF 164 239 6 267 9 -17 505
A GSHP 2 0% OFF 179 223 6 293 10 -13 519
B GSHP 1 0% ON 212 210 6 346 12 -17 558
A GSHP 1 0% OFF 230 195 6 376 13 -13 577
A Gas(86%) 2 0% OFF 241 188 6 399 15 -13 596
B Gas(86%) 1 0% ON 261 175 6 432 16 -17 613
A Gas(86%) 1 0% OFF 287 159 6 476 18 -13 646
School (Primary)
– 30 year calc
C GSHP 3 40% - -17 270 14 32 -1 -30 285
C GSHP 2 40% - -16 254 14 34 -1 -29 272
A GSHP 2 40% - -6 219 14 50 0 -26 258
C Gas(86%) 2 40% - 4 189 14 68 1 -21 250
C Gas(86%) 2 30% - 17 176 14 74 1 -19 246
C Gas(86%) 2 10% - 42 152 13 87 3 -15 241
C Gas(86%) 2 0% - 55* 137 12 94 4 -12 235

AECOM Cost Optimal Calculations and Gap Analysis for recast EPBD for Non-Residential Buildings 59
B Gas(86%) 2 0% - 71 115 12 122 5 -10 243
B Gas(86%) 1 0% - 80 100 12 138 5 -9 247
A Gas(86%) 1 0% - 91 88 12 156 6 -7 255
Hotel – 20 year
calc
C GSHP+SHW 3 40% - 243 396 12 417 16 -29 811
B GSHP+SHW 3 40% - 246 358 12 423 16 -21 788
A GSHP 3 40% - 266 312 11 455 18 -17 779
B GSHP 1 40% - 284* 277 11 484 19 -21 770
A GSHP 1 30% - 302 252 11 511 20 -16 777
A GSHP 1 0% - 321 229 10 535 21 -14 781
A Gas(86%) 3 0% - 339 238 10 569 23 -14 826
B Gas(86%) 1 10% - 352 210 10 593 24 -19 818
B Gas(86%) 1 0% - 359 203 10 601 24 -18 819
A Gas(86%) 1 0% - 376 185 10 630 25 -14 836

AECOM Cost Optimal Calculations and Gap Analysis for recast EPBD for Non-Residential Buildings 60
Table 5.4a: Financial Costs (Central energy price, 7% discount rate, EUR/m²)
Building Package PE
(KWh/m²)
Initial Investment
Cost
Annual Costs Cost of Emissions
Residual Value
Macro Cost Fabric Heating Services PV FC Maintenance Energy
Retail – 20 year
calc
C GSHP 3 40% - 227 361 13 338 - -17 696
A GSHP 3 40% - 232 327 13 345 - -11 674
C Gas(86%) 3 40% - 239 291 13 353 - -17 641
B Gas(86%) 3 40% - 248 268 13 366 - -13 634
B Gas(86%) 3 20% - 293 226 12 412 - -11 640
C Gas(86%) 3 10% - 306 220 11 422 - -13 641
B Gas(86%) 3 0% - 338* 168 10 457 - -7 628
A Gas(86%) 3 0% - 349 157 10 473 - -6 634
A Gas(86%) 2 0% - 390 144 10 528 - -6 676
A Gas(86%) 1 0% - 420 131 10 568 - -6 704
Office (NV) – 20 year
calc
C GSHP 3 40% - 35 319 7 63 - -23 366
B GSHP 3 40% - 45 274 7 77 - -17 341
A GSHP 3 40% - 52 252 7 87 - -14 332
A GSHP 3 30% - 64 237 7 99 - -13 330
A GSHP 3 10% - 88 208 6 123 - -11 325
A GSHP 3 0% - 99 194 5 135 - -11 323
A GSHP 1 10% - 106 181 6 147 - -11 323
A GSHP 1 0% - 118* 166 5 159 - -11 320
A Gas(86%) 3 0% - 143 154 5 194 - -11 342
A Gas(86%) 1 0% - 177 127 5 239 - -11 360
Office (AC) – 20 year
calc
C GSHP 3 40% OFF 101 399 10 153 - -19 542
B GSHP 3 40% OFF 102 357 10 154 - -14 507
B GSHP 2 30% OFF 128 315 7 186 - -13 494
B GSHP 2 0% OFF 164* 271 5 221 - -11 486
A GSHP 2 0% OFF 179 253 5 242 - -9 492
B GSHP 1 0% ON 212 238 5 287 - -11 519
A GSHP 1 0% OFF 230 221 5 311 - -9 528
A Gas(86%) 2 0% OFF 241 214 5 325 - -9 535
B Gas(86%) 1 0% ON 261 198 5 353 - -11 546
A Gas(86%) 1 0% OFF 287 181 5 389 - -9 566
School (Primary)
– 30 year calc
C GSHP 3 40% - -17 278 10 26 - -15 299
C GSHP 2 40% - -16 261 10 28 - -14 285
A GSHP 2 40% - -6 222 10 42 - -13 261
C Gas(86%) 2 40% - 4 197 10 54 - -11 251
C Gas(86%) 2 30% - 17 185 10 59 - -9 245
C Gas(86%) 2 10% - 42 162 10 70 - -7 235
C Gas(86%) 2 0% - 55 147 9 76 - -6 226
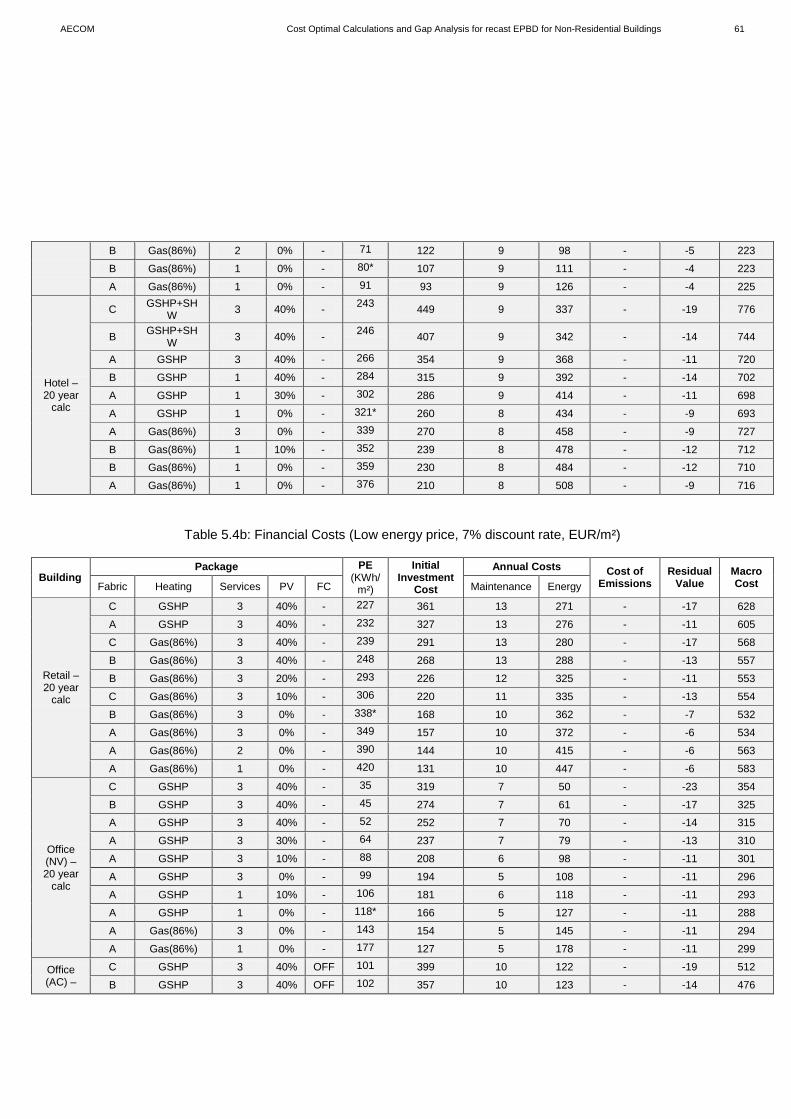
AECOM Cost Optimal Calculations and Gap Analysis for recast EPBD for Non-Residential Buildings 61
B Gas(86%) 2 0% - 71 122 9 98 - -5 223
B Gas(86%) 1 0% - 80* 107 9 111 - -4 223
A Gas(86%) 1 0% - 91 93 9 126 - -4 225
Hotel – 20 year
calc
C GSHP+SHW 3 40% - 243 449 9 337 - -19 776
B GSHP+SHW 3 40% - 246 407 9 342 - -14 744
A GSHP 3 40% - 266 354 9 368 - -11 720
B GSHP 1 40% - 284 315 9 392 - -14 702
A GSHP 1 30% - 302 286 9 414 - -11 698
A GSHP 1 0% - 321* 260 8 434 - -9 693
A Gas(86%) 3 0% - 339 270 8 458 - -9 727
B Gas(86%) 1 10% - 352 239 8 478 - -12 712
B Gas(86%) 1 0% - 359 230 8 484 - -12 710
A Gas(86%) 1 0% - 376 210 8 508 - -9 716
Table 5.4b: Financial Costs (Low energy price, 7% discount rate, EUR/m²)
Building Package PE
(KWh/m²)
Initial Investment
Cost
Annual Costs Cost of Emissions
Residual Value
Macro Cost Fabric Heating Services PV FC Maintenance Energy
Retail – 20 year
calc
C GSHP 3 40% - 227 361 13 271 - -17 628
A GSHP 3 40% - 232 327 13 276 - -11 605
C Gas(86%) 3 40% - 239 291 13 280 - -17 568
B Gas(86%) 3 40% - 248 268 13 288 - -13 557
B Gas(86%) 3 20% - 293 226 12 325 - -11 553
C Gas(86%) 3 10% - 306 220 11 335 - -13 554
B Gas(86%) 3 0% - 338* 168 10 362 - -7 532
A Gas(86%) 3 0% - 349 157 10 372 - -6 534
A Gas(86%) 2 0% - 390 144 10 415 - -6 563
A Gas(86%) 1 0% - 420 131 10 447 - -6 583
Office (NV) – 20 year
calc
C GSHP 3 40% - 35 319 7 50 - -23 354
B GSHP 3 40% - 45 274 7 61 - -17 325
A GSHP 3 40% - 52 252 7 70 - -14 315
A GSHP 3 30% - 64 237 7 79 - -13 310
A GSHP 3 10% - 88 208 6 98 - -11 301
A GSHP 3 0% - 99 194 5 108 - -11 296
A GSHP 1 10% - 106 181 6 118 - -11 293
A GSHP 1 0% - 118* 166 5 127 - -11 288
A Gas(86%) 3 0% - 143 154 5 145 - -11 294
A Gas(86%) 1 0% - 177 127 5 178 - -11 299
Office (AC) –
C GSHP 3 40% OFF 101 399 10 122 - -19 512
B GSHP 3 40% OFF 102 357 10 123 - -14 476

AECOM Cost Optimal Calculations and Gap Analysis for recast EPBD for Non-Residential Buildings 62
20 year calc
B GSHP 2 30% OFF 128 315 7 149 - -13 456
B GSHP 2 0% OFF 164* 271 5 177 - -11 442
A GSHP 2 0% OFF 179 253 5 194 - -9 444
B GSHP 1 0% ON 212 238 5 229 - -11 462
A GSHP 1 0% OFF 230 221 5 249 - -9 466
A Gas(86%) 2 0% OFF 241 214 5 247 - -9 457
B Gas(86%) 1 0% ON 261 198 5 272 - -11 464
A Gas(86%) 1 0% OFF 287 181 5 299 - -9 476
School (Primary)
– 30 year calc
C GSHP 3 40% - -17 278 10 20 - -15 293
C GSHP 2 40% - -16 261 10 22 - -14 279
A GSHP 2 40% - -6 222 10 33 - -13 252
C Gas(86%) 2 40% - 4 197 10 39 - -11 236
C Gas(86%) 2 30% - 17 185 10 43 - -9 228
C Gas(86%) 2 10% - 42 162 10 52 - -7 216
C Gas(86%) 2 0% - 55 147 9 56 - -6 206
B Gas(86%) 2 0% - 71 122 9 71 - -5 197
B Gas(86%) 1 0% - 80 107 9 83 - -4 194
A Gas(86%) 1 0% - 91* 93 9 93 - -4 191
Hotel – 20 year
calc
C GSHP+SHW 3 40% - 243 449 9 250 - -19 689
B GSHP+SHW 3 40% - 246 407 9 254 - -14 656
A GSHP 3 40% - 266 354 9 273 - -11 625
B GSHP 1 40% - 284 315 9 293 - -14 602
A GSHP 1 30% - 302 286 9 310 - -11 594
A GSHP 1 0% - 321 260 8 326 - -9 585
A Gas(86%) 3 0% - 339 270 8 335 - -9 604
B Gas(86%) 1 10% - 352 239 8 351 - -12 585
B Gas(86%) 1 0% - 359 230 8 356 - -12 582
A Gas(86%) 1 0% - 376* 210 8 374 - -9 582
Table 5.4c: Financial Costs (High energy price, 7% discount rate, EUR/m²)
Building Package PE
(KWh/m²)
Initial Investment
Cost
Annual Costs Cost of Emissions
Residual Value
Macro Cost Fabric Heating Services PV FC Maintenance Energy
Retail – 20 year
calc
C GSHP 3 40% - 227 361 13 406 - -17 763
A GSHP 3 40% - 232 327 13 414 - -11 743
C Gas(86%) 3 40% - 239 291 13 426 - -17 714
B Gas(86%) 3 40% - 248* 268 13 443 - -13 712
B Gas(86%) 3 20% - 293 226 12 498 - -11 726
C Gas(86%) 3 10% - 306 220 11 509 - -13 728
B Gas(86%) 3 0% - 338 168 10 553 - -7 724
A Gas(86%) 3 0% - 349 157 10 573 - -6 734

AECOM Cost Optimal Calculations and Gap Analysis for recast EPBD for Non-Residential Buildings 63
A Gas(86%) 2 0% - 390 144 10 642 - -6 790
A Gas(86%) 1 0% - 420 131 10 690 - -6 826
Office (NV) – 20 year
calc
C GSHP 3 40% - 35 319 7 76 - -23 379
B GSHP 3 40% - 45 274 7 92 - -17 356
A GSHP 3 40% - 52* 252 7 104 - -14 349
A GSHP 3 30% - 64 237 7 119 - -13 350
A GSHP 3 10% - 88 208 6 147 - -11 350
A GSHP 3 0% - 99 194 5 161 - -11 350
A GSHP 1 10% - 106 181 6 177 - -11 352
A GSHP 1 0% - 118 166 5 191 - -11 352
A Gas(86%) 3 0% - 143 154 5 242 - -11 390
A Gas(86%) 1 0% - 177 127 5 300 - -11 421
Office (AC) – 20 year
calc
C GSHP 3 40% OFF 101 399 10 183 - -19 573
B GSHP 3 40% OFF 102 357 10 185 - -14 538
B GSHP 2 30% OFF 128* 315 7 223 - -13 531
B GSHP 2 0% OFF 164 271 5 266 - -11 531
A GSHP 2 0% OFF 179 253 5 291 - -9 541
B GSHP 1 0% ON 212 238 5 344 - -11 576
A GSHP 1 0% OFF 230 221 5 374 - -9 591
A Gas(86%) 2 0% OFF 241 214 5 403 - -9 613
B Gas(86%) 1 0% ON 261 198 5 435 - -11 627
A Gas(86%) 1 0% OFF 287 181 5 479 - -9 656
School (Primary)
– 30 year calc
C GSHP 3 40% - -17 278 10 32 - -15 305
C GSHP 2 40% - -16 261 10 34 - -14 291
A GSHP 2 40% - -6 222 10 50 - -13 270
C Gas(86%) 2 40% - 4 197 10 70 - -11 267
C Gas(86%) 2 30% - 17 185 10 76 - -9 262
C Gas(86%) 2 10% - 42 162 10 89 - -7 253
C Gas(86%) 2 0% - 55* 147 9 96 - -6 246
B Gas(86%) 2 0% - 71 122 9 124 - -5 250
B Gas(86%) 1 0% - 80 107 9 140 - -4 252
A Gas(86%) 1 0% - 91 93 9 159 - -4 258
Hotel – 20 year
calc
C GSHP+SHW 3 40% - 243 449 9 424 - -19 863
B GSHP+SHW 3 40% - 246 407 9 430 - -14 832
A GSHP 3 40% - 266 354 9 462 - -11 814
B GSHP 1 40% - 284 315 9 492 - -14 801
A GSHP 1 30% - 302 286 9 518 - -11 802
A GSHP 1 0% - 321* 260 8 542 - -9 801
A Gas(86%) 3 0% - 339 270 8 581 - -9 850
B Gas(86%) 1 10% - 352 239 8 605 - -12 839
B Gas(86%) 1 0% - 359 230 8 613 - -12 839
A Gas(86%) 1 0% - 376 210 8 642 - -9 851

AECOM Cost Optimal Calculations and Gap Analysis for recast EPBD for Non-Residential Buildings 64
Table 5.4d: Financial Costs (Central energy price, 13% discount rate, EUR/m²)
Building Package PE
(KWh/m²)
Initial Investment
Cost
Annual Costs Cost of Emissions
Residual Value
Macro Cost Fabric Services Heating PV FC Maintenance Energy
Retail – 20 year
calc
C GSHP 3 40% - 227 361 9 211 - -6 575
A GSHP 3 40% - 232 327 9 215 - -4 547
C Gas(86%) 3 40% - 239 291 9 220 - -6 514
B Gas(86%) 3 40% - 248 268 9 227 - -5 499
B Gas(86%) 3 20% - 293 226 8 255 - -4 486
C Gas(86%) 3 10% - 306 220 8 263 - -5 486
B Gas(86%) 3 0% - 338 168 7 284 - -3 456
A Gas(86%) 3 0% - 349* 157 7 293 - -2 455
A Gas(86%) 2 0% - 390 144 7 327 - -2 475
A Gas(86%) 1 0% - 420 131 7 352 - -2 488
Office (NV) – 20 year
calc
C GSHP 3 40% - 35 319 5 39 - -8 355
B GSHP 3 40% - 45 274 5 48 - -6 320
A GSHP 3 40% - 52 252 5 54 - -5 306
A GSHP 3 30% - 64 237 4 62 - -5 299
A GSHP 3 10% - 88 208 4 77 - -4 285
A GSHP 3 0% - 99 194 3 84 - -4 277
A GSHP 1 10% - 106 181 4 92 - -4 273
A GSHP 1 0% - 118* 166 3 99 - -4 265
A Gas(86%) 3 0% - 143 154 3 117 - -4 271
A Gas(86%) 1 0% - 177 127 3 144 - -4 271
Office (AC) – 20 year
calc
C GSHP 3 40% OFF 101 399 7 95 - -7 494
B GSHP 3 40% OFF 102 357 7 96 - -5 455
B GSHP 2 30% OFF 128 315 4 116 - -5 430
B GSHP 2 0% OFF 164 271 3 138 - -4 409
A GSHP 2 0% OFF 179* 253 3 151 - -3 405
B GSHP 1 0% ON 212 238 3 179 - -4 417
A GSHP 1 0% OFF 230 221 3 194 - -3 415
A Gas(86%) 2 0% OFF 241 214 3 198 - -3 412
B Gas(86%) 1 0% ON 261 198 3 216 - -4 414
A Gas(86%) 1 0% OFF 287 181 3 238 - -3 419
School (Primary)
– 30 year calc
C GSHP 3 40% - -17 254 6 16 - -3 273
C GSHP 2 40% - -16 240 6 17 - -3 260
A GSHP 2 40% - -6 200 6 26 - -3 230
C Gas(86%) 2 40% - 4 184 6 32 - -2 220
C Gas(86%) 2 30% - 17 173 6 35 - -2 213
C Gas(86%) 2 10% - 42 153 6 42 - -1 199
C Gas(86%) 2 0% - 55 140 6 46 - -1 190

AECOM Cost Optimal Calculations and Gap Analysis for recast EPBD for Non-Residential Buildings 65
B Gas(86%) 2 0% - 71 114 6 58 - -1 177
B Gas(86%) 1 0% - 80 102 6 67 - -1 173
A Gas(86%) 1 0% - 91* 88 6 76 - -1 168
Hotel – 20 year
calc
C GSHP+SHW 3 40% - 243 449 6 203 - -7 651
B GSHP+SHW 3 40% - 246 407 6 206 - -5 614
A GSHP 3 40% - 266 354 6 222 - -4 578
B GSHP 1 40% - 284 315 6 237 - -5 552
A GSHP 1 30% - 302 286 6 251 - -4 538
A GSHP 1 0% - 321 260 5 263 - -3 525
A Gas(86%) 3 0% - 339 270 5 274 - -3 546
B Gas(86%) 1 10% - 352 239 5 286 - -4 526
B Gas(86%) 1 0% - 359 230 5 290 - -4 521
A Gas(86%) 1 0% - 376* 210 5 304 - -3 516

AECOM Cost Optimal Calculations and Gap Analysis for recast EPBD for Non-Residential Buildings 66
5.2 Existing Buildings
As with the new buildings analysis, we have assumed various underpinning costs for the existing building analysis.
• Where appropriate we have used the cost of new build measures for the equivalent renovation or replacement measures. We have followed the allowance in the regulation to omit disposal costs; hence there is often no cost difference between applying the measures to new or existing buildings.
• Additional costs have been included for renovating floors, walls and roofs. These measures are restricted by the existing building structure which for some fabric types limits the potential improvements. We have analysed a range of wall insulation options, including permutations incorporating cavity in-fill (where appropriate), external and internal insulation. These costs are recorded in Table 5.5a.
• In a similar manner to the new buildings analysis, we applied sensitivity analysis to the energy and discount rates. We did not include analysis of the variation in primary energy factor and the cost of carbon.
Due to the large number of permutations, it is not possible to include all the results tables in the body of this report. The full set of tables is included in Annex A. However, Tables 5.6a-e details the results of the macroeconomic analysis using the central discount rate and energy cost.
The sensitivity analysis showed that lower energy prices improved the relative cost-effectiveness of less energy efficient products and higher energy prices improved the relative cost-effectiveness of more energy efficient products. Higher discount rates devalued (and thus effectively lowered) the price of energy over the calculation period and thus tended to favour less energy efficient products.

AECOM Cost Optimal Calculations and Gap Analysis for recast EPBD for Non-Residential Buildings 67
Table 5.5a: Elemental Capital Costs per m² of Fabric (£/m²)
Construction Value (W/m²K) Cost (£/m²)
Roof: Tiled Pitched
0.25 26.7 0.2 33.2
0.15 39.4 0.1 53.2
Roof: Profiled Metal 0.29 11.4 0.18 19.2 0.14 26.8
Roof: Flat 0.25 16.9 0.2 20.7
0.15 26.8
Wall: Masonry Cavity
0.3 4.7 0.19 24.1 0.14 39.7 0.16 35.5 0.1 44.8
0.39 9.5 0.21 16.3
Wall: Lightweight Metal Frame (LMF)
0.47 25.4 0.36 30.7 0.27 35.4 0.21 40.1 0.2 28.7
0.15 (b) 36.6 0.15 44.1 0.11 51.8
Floor: Solid
0.25 19.5 0.2 23.5
0.15 28.0 0.1 37.8

AECOM Cost Optimal Calculations and Gap Analysis for recast EPBD for Non-Residential Buildings 68
Table 5.6a: Retail (EE1): Macroeconomic Costs (Central energy price, 4% discount rate, EUR/m²)
Package Value PE (KWh/m²)
Initial Investment
Cost
Annual Costs Cost of Emissions
Residual Value
Macro Cost Maintenance Energy
Wall U-Value 0.11 646 66 0 1062 57 -21 1164
Wall U-Value 0.15 (b) 647 55 0 1063 58 -17 1158
Wall U-Value 0.15 647 59 0 1063 58 -19 1161
Wall U-Value 0.2 648 50 0 1064 58 -16 1156
Wall U-Value 0.21 648 57 0 1065 58 -18 1161
Wall U-Value 0.27 649 54 0 1066 58 -17 1161
Wall U-Value 0.36 651 51 0 1069 58 -16 1162
Wall U-Value 0.47 653 48 0 1072 58 -15 1163
Roof U-value 0.14 648 0 0 1064 58 0 1122
Roof U-value 0.18 649 0 0 1067 58 0 1125
Roof U-value 0.29 654 0 0 1075 58 0 1133
Heating Source ASHP 558 41 13 913 48 0 1015
Heating Source Gas CHP 620 132 99 1049 56 0 1335
Heating Source Gas (91%) 646 11 15 1062 57 0 1145
Heating Source Gas (91%) + SHW 646 104 15 1062 57 0 1237
Heating Source Gas (86%) 653 11 15 1074 58 0 1158
Floor U-value 0.25 652 12 0 1071 58 -4 1137
Floor U-value 0.2 652 14 0 1071 58 -5 1139
Floor U-value 0.15 653 18 0 1072 58 -6 1142
Floor U-value 0.1 653 26 0 1072 58 -8 1148
Window U-value 1.4 644 15 0 1058 57 -2 1128
Window U-value 1.1 644 19 0 1058 57 -3 1132
Window U-value 0.9 647 20 0 1064 58 -3 1138
Window U-value 1.8 653 13 0 1073 58 -2 1142
Chiller Efficiency 5.5 533 30 0 877 48 0 955
Chiller Efficiency 4.5 545 27 0 897 49 0 972
Chiller Efficiency 3.5 564 25 0 928 50 0 1003
AHU SFP 1.8 641 19 0 1053 57 0 1129
AHU SFP 2 646 17 0 1062 58 0 1137
AHU SFP 2.2 652 16 0 1072 58 0 1146
Lighting Efficacy 65 490 6 0 807 44 0 858
Lighting Efficacy 60 498 5 0 821 45 0 871
Lighting Efficacy 55 508 5 0 837 46 0 888

AECOM Cost Optimal Calculations and Gap Analysis for recast EPBD for Non-Residential Buildings 69
Table 5.6a: Retail (EE2): Macroeconomic Costs (Central energy price, 4% discount rate, EUR/m²)
Package Value PE (KWh/m²)
Initial Investment
Cost
Annual Costs Cost of Emissions
Residual Value
Macro Cost Maintenance Energy
Wall U-Value 0.11 501 66 0 824 45 -21 914
Wall U-Value 0.15 (b) 502 55 0 826 45 -17 909
Wall U-Value 0.15 502 59 0 826 45 -19 911
Wall U-Value 0.2 503 50 0 828 45 -16 907
Wall U-Value 0.21 503 57 0 828 45 -18 912
Wall U-Value 0.27 504 54 0 830 45 -17 913
Wall U-Value 0.36 506 51 0 834 46 -16 914
Wall U-Value 0.47 509 48 0 838 46 -15 917
Roof U-value 0.14 503 0 0 828 45 0 873
Roof U-value 0.18 505 0 0 831 45 0 877
Roof U-value 0.29 511 0 0 841 46 0 887
Heating Source ASHP 406 41 13 663 35 0 752
Heating Source Gas CHP 473 132 99 812 43 0 1086
Heating Source Gas (91%) 502 11 15 826 45 0 897
Heating Source Gas (91%) + SHW 502 104 15 826 45 0 990
Heating Source Gas (86%) 510 11 15 840 46 0 912
Floor U-value 0.1 496 26 0 815 44 -8 877
Floor U-value 0.15 497 18 0 817 44 -6 874
Floor U-value 0.2 498 14 0 819 45 -5 873
Floor U-value 0.25 502 12 0 827 45 -4 880
Window U-value 1.1 502 19 0 827 45 -3 888
Window U-value 1.4 502 15 0 828 45 -2 885
Window U-value 0.9 504 20 0 829 45 -3 892
Window U-value 1.8 508 13 0 837 46 -2 893
Chiller Efficiency 5.5 461 30 0 760 42 0 832
Chiller Efficiency 4.5 470 27 0 775 43 0 844
Chiller Efficiency 3.5 485 25 0 799 44 0 868
AHU SFP 1.8 497 19 0 818 45 0 882
AHU SFP 2 503 17 0 828 45 0 890
AHU SFP 2.2 508 16 0 837 46 0 900
Lighting Efficacy 65 453 6 0 747 41 0 794
Lighting Efficacy 60 460 5 0 759 42 0 806
Lighting Efficacy 55 469 5 0 773 42 0 820

AECOM Cost Optimal Calculations and Gap Analysis for recast EPBD for Non-Residential Buildings 70
Table 5.6b: Office (NV) (EE1): Macroeconomic Costs (Central energy price, 4% discount rate, EUR/m²)
Package Value PE (KWh/m²)
Initial Investment
Cost
Annual Costs Cost of Emissions
Residual Value
Macro Cost Maintenance Energy
Wall U-Value 0.1 340 69 0 567 33 -22 646
Wall U-Value 0.14 341 32 0 569 33 -10 624
Wall U-Value 0.16 342 62 0 570 33 -20 645
Wall U-Value 0.19 343 16 0 572 33 -5 616
Wall U-Value 0.21 343 28 0 573 33 -9 625
Wall U-Value 0.3 346 4 0 577 33 -1 613
Wall U-Value 0.39 348 12 0 581 33 -4 623
Roof U-value 0.15 334 17 0 557 32 -5 601
Roof U-value 0.2 336 16 0 561 32 -5 604
Roof U-value 0.25 338 13 0 564 32 -4 605
Heating Source ASHP 160 26 7 261 14 0 307
Heating Source Gas CHP 284 101 41 537 29 0 708
Heating Source Gas (91%) + SHW 316 56 8 527 30 0 621
Heating Source Gas (91%) 316 9 8 527 30 0 574
Heating Source Gas (86%) 330 9 8 549 31 0 598
Floor U-value 0.1 337 13 0 563 32 -4 604
Floor U-value 0.15 340 9 0 566 33 -3 605
Floor U-value 0.2 342 7 0 570 33 -2 608
Floor U-value 0.25 344 6 0 574 33 -2 611
Window U-value 0.9 303 92 0 505 29 -15 611
Window U-value 1.1 312 87 0 519 30 -14 622
Window U-value 1.8 315 57 0 524 30 -9 602
Window U-value 1.4 319 67 0 531 30 -11 618
Lighting Efficacy 65 288 28 0 485 29 0 542
Lighting Efficacy 60 292 23 0 491 29 0 542
Lighting Efficacy 55 295 23 0 496 29 0 547

AECOM Cost Optimal Calculations and Gap Analysis for recast EPBD for Non-Residential Buildings 71
Table 5.6b: Office (NV) (EE2): Macroeconomic Costs (Central energy price, 4% discount rate, EUR/m²)
Package Value PE (KWh/m²)
Initial Investment
Cost
Annual Costs Cost of Emissions
Residual Value
Macro Cost Maintenance Energy
Wall U-Value 0.1 271 69 0 452 26 -22 525
Wall U-Value 0.14 272 32 0 454 26 -10 502
Wall U-Value 0.16 273 62 0 455 26 -20 523
Wall U-Value 0.19 274 16 0 457 26 -5 494
Wall U-Value 0.21 275 28 0 458 26 -9 503
Wall U-Value 0.3 277 4 0 462 26 -1 491
Wall U-Value 0.39 279 12 0 466 27 -4 501
Roof U-value 0.15 277 17 0 462 26 -5 500
Roof U-value 0.2 279 16 0 465 27 -5 502
Roof U-value 0.25 281 13 0 468 27 -4 504
Heating Source ASHP 136 26 7 222 12 0 266
Heating Source Gas CHP 242 101 41 458 25 0 624
Heating Source Gas (91%) + SHW 270 56 8 449 26 0 539
Heating Source Gas (91%) 270 9 8 449 26 0 492
Heating Source Gas (86%) 281 9 8 468 27 0 512
Floor U-value 0.1 267 13 0 445 25 -4 479
Floor U-value 0.15 269 9 0 449 26 -3 481
Floor U-value 0.2 271 7 0 452 26 -2 483
Floor U-value 0.25 273 6 0 455 26 -2 486
Window U-value 0.9 252 92 0 419 24 -15 521
Window U-value 1.1 259 87 0 432 25 -14 529
Window U-value 1.8 262 57 0 437 25 -9 510
Window U-value 1.4 266 67 0 442 25 -11 524
Lighting Efficacy 65 231 28 0 388 23 0 439
Lighting Efficacy 60 235 23 0 394 23 0 440
Lighting Efficacy 55 239 23 0 401 23 0 447
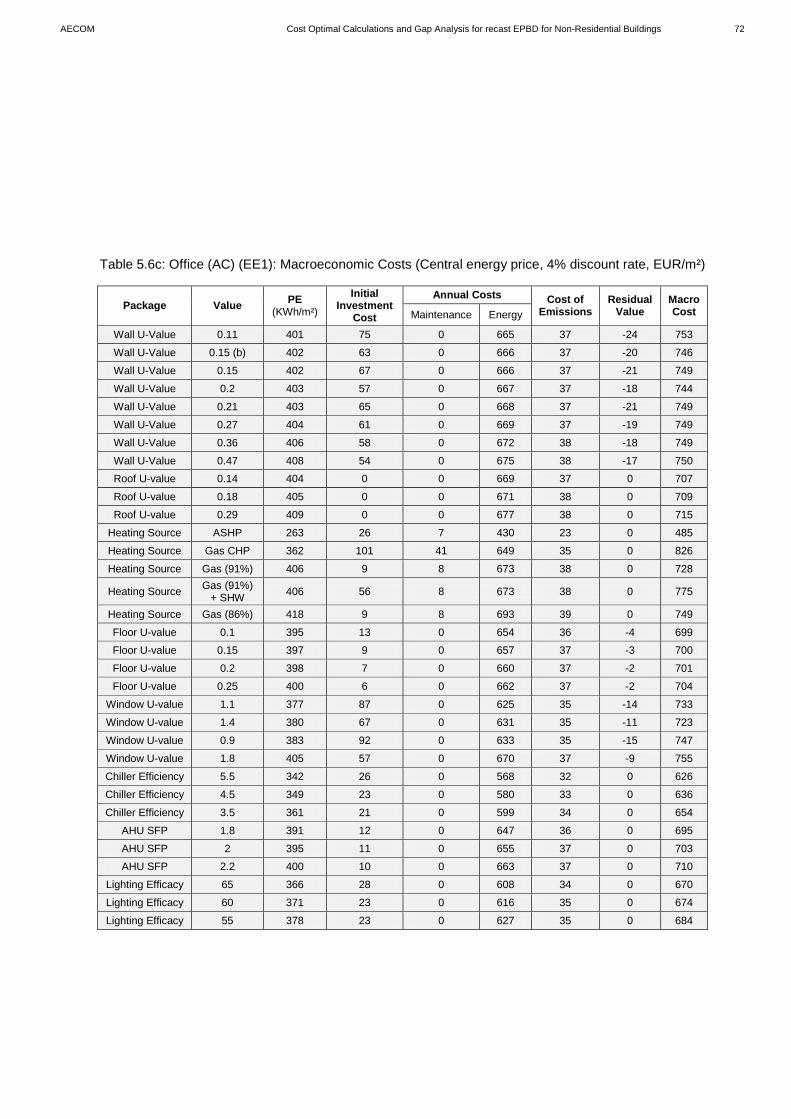
AECOM Cost Optimal Calculations and Gap Analysis for recast EPBD for Non-Residential Buildings 72
Table 5.6c: Office (AC) (EE1): Macroeconomic Costs (Central energy price, 4% discount rate, EUR/m²)
Package Value PE (KWh/m²)
Initial Investment
Cost
Annual Costs Cost of Emissions
Residual Value
Macro Cost Maintenance Energy
Wall U-Value 0.11 401 75 0 665 37 -24 753
Wall U-Value 0.15 (b) 402 63 0 666 37 -20 746
Wall U-Value 0.15 402 67 0 666 37 -21 749
Wall U-Value 0.2 403 57 0 667 37 -18 744
Wall U-Value 0.21 403 65 0 668 37 -21 749
Wall U-Value 0.27 404 61 0 669 37 -19 749
Wall U-Value 0.36 406 58 0 672 38 -18 749
Wall U-Value 0.47 408 54 0 675 38 -17 750
Roof U-value 0.14 404 0 0 669 37 0 707
Roof U-value 0.18 405 0 0 671 38 0 709
Roof U-value 0.29 409 0 0 677 38 0 715
Heating Source ASHP 263 26 7 430 23 0 485
Heating Source Gas CHP 362 101 41 649 35 0 826
Heating Source Gas (91%) 406 9 8 673 38 0 728
Heating Source Gas (91%) + SHW 406 56 8 673 38 0 775
Heating Source Gas (86%) 418 9 8 693 39 0 749
Floor U-value 0.1 395 13 0 654 36 -4 699
Floor U-value 0.15 397 9 0 657 37 -3 700
Floor U-value 0.2 398 7 0 660 37 -2 701
Floor U-value 0.25 400 6 0 662 37 -2 704
Window U-value 1.1 377 87 0 625 35 -14 733
Window U-value 1.4 380 67 0 631 35 -11 723
Window U-value 0.9 383 92 0 633 35 -15 747
Window U-value 1.8 405 57 0 670 37 -9 755
Chiller Efficiency 5.5 342 26 0 568 32 0 626
Chiller Efficiency 4.5 349 23 0 580 33 0 636
Chiller Efficiency 3.5 361 21 0 599 34 0 654
AHU SFP 1.8 391 12 0 647 36 0 695
AHU SFP 2 395 11 0 655 37 0 703
AHU SFP 2.2 400 10 0 663 37 0 710
Lighting Efficacy 65 366 28 0 608 34 0 670
Lighting Efficacy 60 371 23 0 616 35 0 674
Lighting Efficacy 55 378 23 0 627 35 0 684
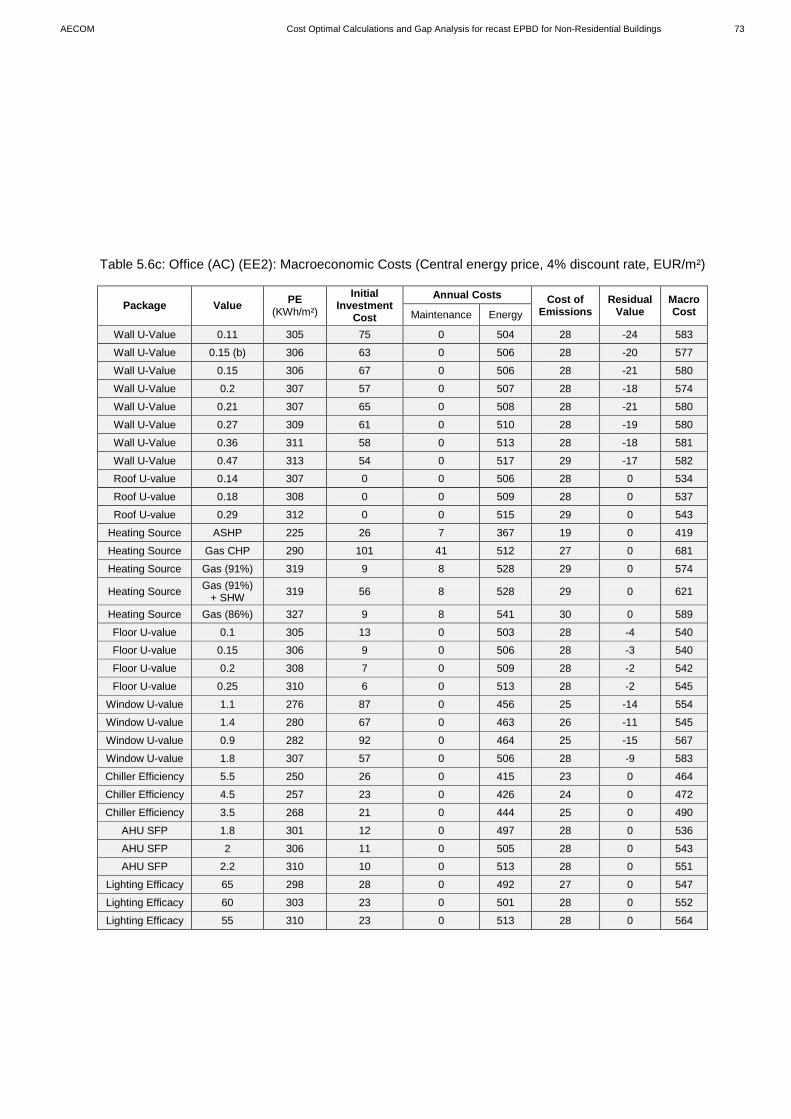
AECOM Cost Optimal Calculations and Gap Analysis for recast EPBD for Non-Residential Buildings 73
Table 5.6c: Office (AC) (EE2): Macroeconomic Costs (Central energy price, 4% discount rate, EUR/m²)
Package Value PE (KWh/m²)
Initial Investment
Cost
Annual Costs Cost of Emissions
Residual Value
Macro Cost Maintenance Energy
Wall U-Value 0.11 305 75 0 504 28 -24 583
Wall U-Value 0.15 (b) 306 63 0 506 28 -20 577
Wall U-Value 0.15 306 67 0 506 28 -21 580
Wall U-Value 0.2 307 57 0 507 28 -18 574
Wall U-Value 0.21 307 65 0 508 28 -21 580
Wall U-Value 0.27 309 61 0 510 28 -19 580
Wall U-Value 0.36 311 58 0 513 28 -18 581
Wall U-Value 0.47 313 54 0 517 29 -17 582
Roof U-value 0.14 307 0 0 506 28 0 534
Roof U-value 0.18 308 0 0 509 28 0 537
Roof U-value 0.29 312 0 0 515 29 0 543
Heating Source ASHP 225 26 7 367 19 0 419
Heating Source Gas CHP 290 101 41 512 27 0 681
Heating Source Gas (91%) 319 9 8 528 29 0 574
Heating Source Gas (91%) + SHW 319 56 8 528 29 0 621
Heating Source Gas (86%) 327 9 8 541 30 0 589
Floor U-value 0.1 305 13 0 503 28 -4 540
Floor U-value 0.15 306 9 0 506 28 -3 540
Floor U-value 0.2 308 7 0 509 28 -2 542
Floor U-value 0.25 310 6 0 513 28 -2 545
Window U-value 1.1 276 87 0 456 25 -14 554
Window U-value 1.4 280 67 0 463 26 -11 545
Window U-value 0.9 282 92 0 464 25 -15 567
Window U-value 1.8 307 57 0 506 28 -9 583
Chiller Efficiency 5.5 250 26 0 415 23 0 464
Chiller Efficiency 4.5 257 23 0 426 24 0 472
Chiller Efficiency 3.5 268 21 0 444 25 0 490
AHU SFP 1.8 301 12 0 497 28 0 536
AHU SFP 2 306 11 0 505 28 0 543
AHU SFP 2.2 310 10 0 513 28 0 551
Lighting Efficacy 65 298 28 0 492 27 0 547
Lighting Efficacy 60 303 23 0 501 28 0 552
Lighting Efficacy 55 310 23 0 513 28 0 564

AECOM Cost Optimal Calculations and Gap Analysis for recast EPBD for Non-Residential Buildings 74
Table 5.6d: Primary (EE1): Macroeconomic Costs (Central energy price, 4% discount rate, EUR/m²)
Package Value PE (KWh/m²)
Initial Investment
Cost
Annual Costs Cost of Emissions
Residual Value
Macro Cost Maintenance Energy
Wall U-Value 0.1 162 57 0 277 16 -9 341
Wall U-Value 0.14 164 27 0 280 16 -4 319
Wall U-Value 0.16 164 51 0 281 16 -8 341
Wall U-Value 0.19 166 13 0 283 17 -2 311
Wall U-Value 0.21 166 24 0 285 17 -4 321
Wall U-Value 0.3 170 3 0 291 17 -1 311
Wall U-Value 0.39 174 10 0 297 17 -2 323
Roof U-value 0.15 172 15 0 295 17 -2 324
Roof U-value 0.2 173 13 0 296 17 -2 324
Roof U-value 0.25 173 11 0 297 17 -2 323
Heating Source ASHP 62 30 13 107 6 0 155
Heating Source Gas CHP 140 62 56 331 15 0 464
Heating Source Gas (91%) + SHW 155 47 14 265 15 0 341
Heating Source Gas (91%) 155 8 14 265 15 0 302
Heating Source Gas (86%) 163 8 14 278 16 0 316
Floor U-value 0.1 158 11 0 271 16 -2 295
Floor U-value 0.15 161 8 0 275 16 -1 298
Floor U-value 0.2 163 6 0 279 16 -1 301
Floor U-value 0.25 166 5 0 284 17 -1 304
Window U-value 0.9 142 47 0 243 14 0 304
Window U-value 1.1 147 44 0 252 15 0 311
Window U-value 1.8 150 29 0 257 15 0 301
Window U-value 1.4 152 34 0 260 15 0 309
Lighting Efficacy 65 157 23 0 267 16 0 306
Lighting Efficacy 60 158 21 0 270 16 0 306
Lighting Efficacy 55 160 20 0 272 16 0 308
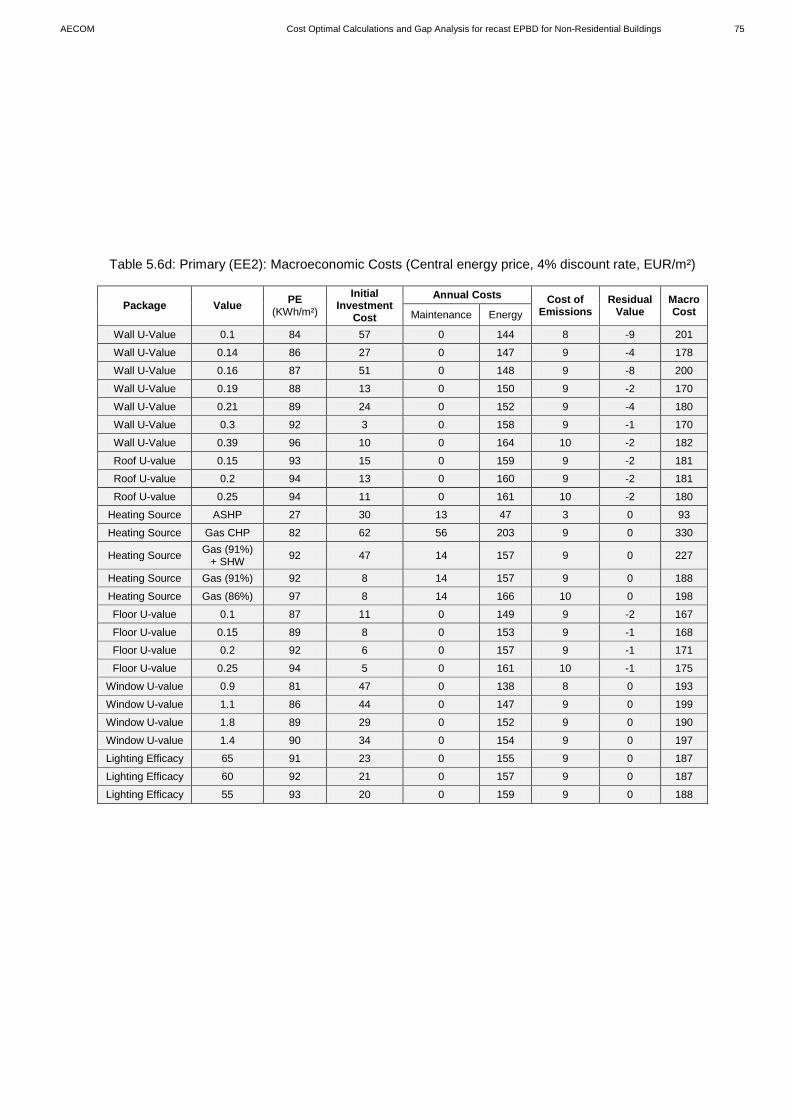
AECOM Cost Optimal Calculations and Gap Analysis for recast EPBD for Non-Residential Buildings 75
Table 5.6d: Primary (EE2): Macroeconomic Costs (Central energy price, 4% discount rate, EUR/m²)
Package Value PE (KWh/m²)
Initial Investment
Cost
Annual Costs Cost of Emissions
Residual Value
Macro Cost Maintenance Energy
Wall U-Value 0.1 84 57 0 144 8 -9 201
Wall U-Value 0.14 86 27 0 147 9 -4 178
Wall U-Value 0.16 87 51 0 148 9 -8 200
Wall U-Value 0.19 88 13 0 150 9 -2 170
Wall U-Value 0.21 89 24 0 152 9 -4 180
Wall U-Value 0.3 92 3 0 158 9 -1 170
Wall U-Value 0.39 96 10 0 164 10 -2 182
Roof U-value 0.15 93 15 0 159 9 -2 181
Roof U-value 0.2 94 13 0 160 9 -2 181
Roof U-value 0.25 94 11 0 161 10 -2 180
Heating Source ASHP 27 30 13 47 3 0 93
Heating Source Gas CHP 82 62 56 203 9 0 330
Heating Source Gas (91%) + SHW 92 47 14 157 9 0 227
Heating Source Gas (91%) 92 8 14 157 9 0 188
Heating Source Gas (86%) 97 8 14 166 10 0 198
Floor U-value 0.1 87 11 0 149 9 -2 167
Floor U-value 0.15 89 8 0 153 9 -1 168
Floor U-value 0.2 92 6 0 157 9 -1 171
Floor U-value 0.25 94 5 0 161 10 -1 175
Window U-value 0.9 81 47 0 138 8 0 193
Window U-value 1.1 86 44 0 147 9 0 199
Window U-value 1.8 89 29 0 152 9 0 190
Window U-value 1.4 90 34 0 154 9 0 197
Lighting Efficacy 65 91 23 0 155 9 0 187
Lighting Efficacy 60 92 21 0 157 9 0 187
Lighting Efficacy 55 93 20 0 159 9 0 188

AECOM Cost Optimal Calculations and Gap Analysis for recast EPBD for Non-Residential Buildings 76
Table 5.6e: Hotel (EE1): Macroeconomic Costs (Central energy price, 4% discount rate, EUR/m²)
Package Value PE (KWh/m²)
Initial Investment
Cost
Annual Costs Cost of Emissions
Residual Value
Macro Cost Maintenance Energy
Wall U-Value 0.1 566 94 0 944 54 -30 1063
Wall U-Value 0.14 568 44 0 947 54 -14 1031
Wall U-Value 0.16 568 84 0 948 54 -27 1060
Wall U-Value 0.19 569 22 0 949 55 -7 1019
Wall U-Value 0.21 570 39 0 951 55 -12 1032
Wall U-Value 0.3 573 5 0 956 55 -2 1014
Wall U-Value 0.39 576 17 0 961 55 -5 1028
Roof U-value 0.15 576 10 0 960 55 -3 1022
Roof U-value 0.2 577 9 0 962 55 -3 1024
Roof U-value 0.25 578 7 0 965 55 -2 1025
Heating Source ASHP 457 29 10 759 43 0 841
Heating Source Gas CHP 542 74 48 948 53 0 1122
Heating Source Gas (91%) + SHW 563 35 10 939 54 0 1039
Heating Source Gas (91%) 576 8 10 961 55 0 1035
Heating Source Gas (86%) 586 8 10 978 56 0 1053
Floor U-value 0.1 570 7 0 951 55 -2 1010
Floor U-value 0.15 571 5 0 953 55 -2 1011
Floor U-value 0.2 572 4 0 955 55 -1 1012
Floor U-value 0.25 573 3 0 957 55 -1 1014
Window U-value 1.1 547 87 0 911 52 -14 1037
Window U-value 0.9 548 93 0 913 52 -15 1043
Window U-value 1.4 550 68 0 918 53 -11 1028
Window U-value 1.8 563 58 0 938 54 -9 1041
Chiller Efficiency 5.5 546 31 0 912 53 0 995
Chiller Efficiency 4.5 549 27 0 917 53 0 997
Chiller Efficiency 3.5 554 25 0 925 53 0 1004
AHU SFP 1.8 558 10 0 931 54 0 995
AHU SFP 2 564 10 0 941 54 0 1005
AHU SFP 2.2 569 9 0 950 55 0 1014
Lighting Efficacy 65 489 51 0 821 48 0 920
Lighting Efficacy 60 491 46 0 824 49 0 918
Lighting Efficacy 55 493 39 0 828 49 0 915

AECOM Cost Optimal Calculations and Gap Analysis for recast EPBD for Non-Residential Buildings 77
Table 5.6e: Hotel (EE2): Macroeconomic Costs (Central energy price, 4% discount rate, EUR/m²)
Package Value PE (KWh/m²)
Initial Investment
Cost
Annual Costs Cost of Emissions
Residual Value
Macro Cost Maintenance Energy
Wall U-Value 0.1 442 94 0 741 43 -30 848
Wall U-Value 0.14 444 44 0 743 43 -14 817
Wall U-Value 0.16 445 84 0 744 43 -27 845
Wall U-Value 0.19 446 22 0 746 44 -7 805
Wall U-Value 0.21 446 39 0 747 44 -12 818
Wall U-Value 0.3 450 5 0 753 44 -2 801
Wall U-Value 0.39 453 17 0 759 44 -5 815
Roof U-value 0.15 453 10 0 758 44 -3 810
Roof U-value 0.2 454 9 0 761 44 -3 811
Roof U-value 0.25 455 7 0 763 45 -2 812
Heating Source ASHP 325 29 10 541 31 0 611
Heating Source Gas CHP 420 74 48 752 43 0 916
Heating Source Gas (91%) + SHW 446 35 10 748 44 0 837
Heating Source Gas (91%) 458 8 10 767 45 0 830
Heating Source Gas (86%) 469 8 10 786 46 0 850
Floor U-value 0.1 446 7 0 747 44 -2 796
Floor U-value 0.15 448 5 0 749 44 -2 797
Floor U-value 0.2 449 4 0 752 44 -1 798
Floor U-value 0.25 450 3 0 754 44 -1 800
Window U-value 0.9 431 93 0 721 42 -15 841
Window U-value 1.1 434 87 0 727 42 -14 842
Window U-value 1.4 439 68 0 735 43 -11 835
Window U-value 1.8 445 58 0 745 43 -9 837
Chiller Efficiency 5.5 437 31 0 732 43 0 806
Chiller Efficiency 4.5 439 27 0 736 43 0 806
Chiller Efficiency 3.5 442 25 0 741 43 0 810
AHU SFP 1.8 444 10 0 744 44 0 798
AHU SFP 2 450 10 0 753 44 0 807
AHU SFP 2.2 455 9 0 763 45 0 816
Lighting Efficacy 65 434 51 0 729 43 0 823
Lighting Efficacy 60 436 46 0 732 43 0 821
Lighting Efficacy 55 439 39 0 736 43 0 818

AECOM Cost Optimal Calculations and Gap Analysis for recast EPBD for Non-Residential Buildings 78
6.1 New Buildings
We have elected to undertake the gap analysis based on the macro-economic calculations. Macro-economic analysis is used by the Government for the purpose of evaluating different options for technical standards for Building Regulations. Furthermore, we have elected to use the discount rate of 4% to mirror that used by the Government policy analysis. For completeness, the macro-economic cost optimal curves for each of the reference buildings are shown in Figures 6.1a – 6.1e. The costs are based on the central energy price and 4% discount rate.
-100
100
300
500
700
900
1100
1300
0 100 200 300 400 500 600 700 800
Mac
roec
onom
ic C
ost
(EUR
/m²)
Primary Energy (kWh/m²)
Macroeconomic Costs (Central energy price, 4% discount rate, EUR/m²)
Figure 6.1a: Results of the cost-optimal analysis (Retail, Macroeconomic costs, 4% discount rate)
6. Cost Optimal Level for Reference Buildings

AECOM Cost Optimal Calculations and Gap Analysis for recast EPBD for Non-Residential Buildings 79
0
100
200
300
400
500
600
700
0 50 100 150 200 250 300
Mac
roec
onom
ic C
ost
(EUR
/m²)
Primary Energy (kWh/m²)
Macroeconomic Costs (Central energy price, 4% discount rate, EUR/m²)
Figure 6.1b: Results of the cost-optimal analysis (Office (NV), Macroeconomic costs, 4% discount rate)

AECOM Cost Optimal Calculations and Gap Analysis for recast EPBD for Non-Residential Buildings 80
0
100
200
300
400
500
600
700
800
0 50 100 150 200 250 300 350 400
Mac
roec
onom
ic C
ost
(EUR
/m²)
Primary Energy (kWh/m²)
Macroeconomic Costs (Central energy price, 4% discount rate, EUR/m²)
Figure 6.1c: Results of the cost-optimal analysis (Office (AC), Macroeconomic costs, 4% discount rate)

AECOM Cost Optimal Calculations and Gap Analysis for recast EPBD for Non-Residential Buildings 81
0
50
100
150
200
250
300
350
400
450
500
-40 -20 0 20 40 60 80 100 120
Mac
roec
onom
ic C
ost
(EUR
/m²)
Primary Energy (kWh/m²)
Macroeconomic Costs (Central energy price, 4% discount rate, EUR/m²)
Figure 6.1d: Results of the cost-optimal analysis (School (Primary), Macroeconomic costs, 4% discount rate)

AECOM Cost Optimal Calculations and Gap Analysis for recast EPBD for Non-Residential Buildings 82
0
200
400
600
800
1000
1200
0 100 200 300 400 500 600
Mac
roec
onom
ic C
ost
(EUR
/m²)
Primary Energy (kWh/m²)
Macroeconomic Costs (Central energy price, 4% discount rate, EUR/m²)
Figure 6.1e: Results of the cost-optimal analysis (Hotel, Macroeconomic costs, 4% discount rate)

AECOM Cost Optimal Calculations and Gap Analysis for recast EPBD for Non-Residential Buildings 83
From these curves, the economic optimal energy performance level in primary energy (kWh/m2/yr) is shown in Table 6.1. We have also included a range to cover the sensitivity cases investigated in Section 5. Furthermore, to allow for sensitivity in the price of the fabric/services/LZC measures, we have included those primary energies within 5% of the lowest macro-economic cost. This approximately allows for a +/-20% change in the building component prices. As noted earlier, we also undertook some sensitivity analyses, assessing the impact of introducing biomass within the naturally ventilated office building (see Appendix B). Key outcomes from the analysis of the results were as follows.
• The biomass options tend to have a higher primary energy than those of gas. Biomass has approximately the same primary energy factor as that of gas, but the boilers are less efficient.
• The optimum point moved from a primary energy of 52 kWh/m² to 102 kWh/m². This corresponds to the same technology solution, with the exception of the heating technology, which in this case is changed from a GSHP to a biomass boiler. This reflects the significantly lower fuel cost compared to other technologies.
.
Table 6.1: Economic Optimal Energy Performance Level in Primary Energy
Reference building Primary Energy (kWh/m2/yr) Sensitivity Range(kWh/m2/yr) Retail (Air Conditioned) 239 227-338 Office (Natural Ventilation) 52 35-103 Office (Air Conditioned) 102 101-179 School (Primary – Natural Ventilation) 55 8-80 Hotel (Air Conditioned) 284 243-330
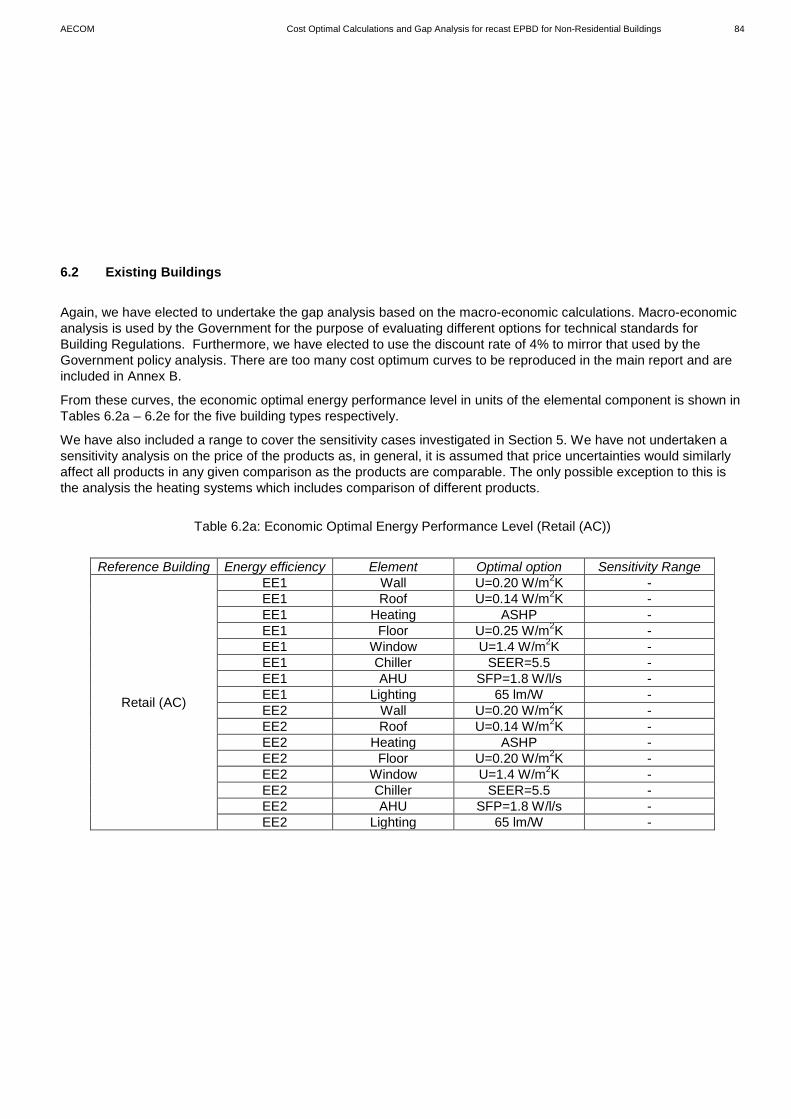
AECOM Cost Optimal Calculations and Gap Analysis for recast EPBD for Non-Residential Buildings 84
6.2 Existing Buildings
Again, we have elected to undertake the gap analysis based on the macro-economic calculations. Macro-economic analysis is used by the Government for the purpose of evaluating different options for technical standards for Building Regulations. Furthermore, we have elected to use the discount rate of 4% to mirror that used by the Government policy analysis. There are too many cost optimum curves to be reproduced in the main report and are included in Annex B.
From these curves, the economic optimal energy performance level in units of the elemental component is shown in Tables 6.2a – 6.2e for the five building types respectively.
We have also included a range to cover the sensitivity cases investigated in Section 5. We have not undertaken a sensitivity analysis on the price of the products as, in general, it is assumed that price uncertainties would similarly affect all products in any given comparison as the products are comparable. The only possible exception to this is the analysis the heating systems which includes comparison of different products.
Table 6.2a: Economic Optimal Energy Performance Level (Retail (AC))
Reference Building Energy efficiency Element Optimal option Sensitivity Range
Retail (AC)
EE1 Wall U=0.20 W/m2K - EE1 Roof U=0.14 W/m2K - EE1 Heating ASHP - EE1 Floor U=0.25 W/m2K - EE1 Window U=1.4 W/m2K - EE1 Chiller SEER=5.5 - EE1 AHU SFP=1.8 W/l/s - EE1 Lighting 65 lm/W - EE2 Wall U=0.20 W/m2K - EE2 Roof U=0.14 W/m2K - EE2 Heating ASHP - EE2 Floor U=0.20 W/m2K - EE2 Window U=1.4 W/m2K - EE2 Chiller SEER=5.5 - EE2 AHU SFP=1.8 W/l/s - EE2 Lighting 65 lm/W -

AECOM Cost Optimal Calculations and Gap Analysis for recast EPBD for Non-Residential Buildings 85
Table 6.2b: Economic Optimal Energy Performance Level (Office (NV))
Reference building Energy efficiency Element Optimal option Sensitivity Range
Office (NV)
EE1 Wall U=0.30 W/m2K - EE1 Roof U=0.15 W/m2K - EE1 Heating ASHP - EE1 Floor U=0.10 W/m2K - EE1 Window U=1.8 W/m2K - EE1 Lighting 65 lm/W - EE2 Wall U=0.30 W/m2K - EE2 Roof U=0.15 W/m2K - EE2 Heating ASHP - EE2 Floor U=0.10 W/m2K - EE2 Window U=1.8 W/m2K - EE2 Lighting 65 lm/W -
Table 6.2c: Economic Optimal Energy Performance Level (Office (AC))
Reference building Energy efficiency Element Optimal option Sensitivity Range
Office (AC)
EE1 Wall U=0.20 W/m2K - EE1 Roof U=0.14 W/m2K - EE1 Heating ASHP - EE1 Floor U=0.10 W/m2K - EE1 Window U=1.4 W/m2K - EE1 Chiller SEER=5.5 - EE1 AHU SFP=1.8 W/l/s - EE1 Lighting 65 lm/W - EE2 Wall U=0.20 W/m2K - EE2 Roof U=0.14 W/m2K - EE2 Heating ASHP - EE2 Floor U=0.10 W/m2K - EE2 Window U=1.4 W/m2K - EE2 Chiller SEER=5.5 - EE2 AHU SFP=1.8 W/l/s - EE2 Lighting 65 lm/W -

AECOM Cost Optimal Calculations and Gap Analysis for recast EPBD for Non-Residential Buildings 86
Table 6.2d: Economic Optimal Energy Performance Level (School (Primary))
Reference building Energy efficiency Element Optimal option Sensitivity Range School (Primary)
EE1 Wall U=0.30 W/m2K 0.19 – 0.30 W/m2K EE1 Roof U=0.25 W/m2K - EE1 Heating ASHP - EE1 Floor U=0.10 W/m2K - EE1 Window U=1.8 W/m2K 0.9-1.8 W/m2K EE1 Lighting 65 lm/W - EE2 Wall U=0.30 W/m2K 0.19 – 0.30 W/m2K EE2 Roof U=0.25 W/m2K - EE2 Heating ASHP - EE2 Floor U=0.10 W/m2K - EE2 Window U=1.8 W/m2K 0.9-1.8 W/m2K EE2 Lighting 60 lm/W -
Table 6.2e: Economic Optimal Energy Performance Level (Hotel (AC))
Reference building Energy efficiency Element Optimal option Sensitivity Range
Hotel (AC)
EE1 Wall U=0.30 W/m2K - EE1 Roof U=0.15 W/m2K - EE1 Heating ASHP - EE1 Floor U=0.10 W/m2K - EE1 Window U=1.4 W/m2K - EE1 Chiller SEER=5.5 - EE1 AHU SFP=1.8 W/l/s - EE1 Lighting 55 lm/W - EE2 Wall U=0.30 W/m2K - EE2 Roof U=0.15 W/m2K - EE2 Heating ASHP - EE2 Floor U=0.10 W/m2K - EE2 Window U=1.4 W/m2K - EE2 Chiller SEER=5.5 - EE2 AHU SFP=1.8 W/l/s - EE2 Lighting 55 lm/W -
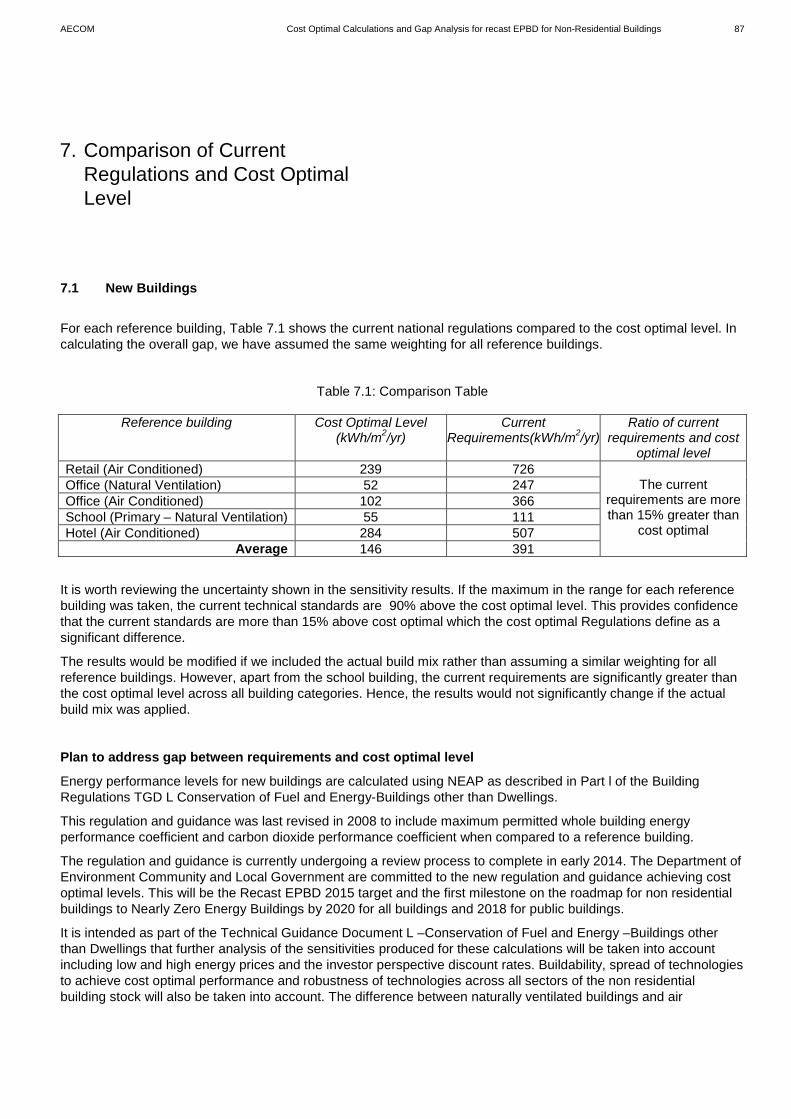
AECOM Cost Optimal Calculations and Gap Analysis for recast EPBD for Non-Residential Buildings 87
7.1 New Buildings
For each reference building, Table 7.1 shows the current national regulations compared to the cost optimal level. In calculating the overall gap, we have assumed the same weighting for all reference buildings.
Table 7.1: Comparison Table
Reference building Cost Optimal Level (kWh/m2/yr)
Current Requirements(kWh/m2/yr)
Ratio of current requirements and cost
optimal level Retail (Air Conditioned) 239 726
The current requirements are more than 15% greater than
cost optimal
Office (Natural Ventilation) 52 247 Office (Air Conditioned) 102 366 School (Primary – Natural Ventilation) 55 111 Hotel (Air Conditioned) 284 507
Average 146 391
It is worth reviewing the uncertainty shown in the sensitivity results. If the maximum in the range for each reference building was taken, the current technical standards are 90% above the cost optimal level. This provides confidence that the current standards are more than 15% above cost optimal which the cost optimal Regulations define as a significant difference.
The results would be modified if we included the actual build mix rather than assuming a similar weighting for all reference buildings. However, apart from the school building, the current requirements are significantly greater than the cost optimal level across all building categories. Hence, the results would not significantly change if the actual build mix was applied.
Plan to address gap between requirements and cost optimal level
Energy performance levels for new buildings are calculated using NEAP as described in Part l of the Building Regulations TGD L Conservation of Fuel and Energy-Buildings other than Dwellings.
This regulation and guidance was last revised in 2008 to include maximum permitted whole building energy performance coefficient and carbon dioxide performance coefficient when compared to a reference building.
The regulation and guidance is currently undergoing a review process to complete in early 2014. The Department of Environment Community and Local Government are committed to the new regulation and guidance achieving cost optimal levels. This will be the Recast EPBD 2015 target and the first milestone on the roadmap for non residential buildings to Nearly Zero Energy Buildings by 2020 for all buildings and 2018 for public buildings.
It is intended as part of the Technical Guidance Document L –Conservation of Fuel and Energy –Buildings other than Dwellings that further analysis of the sensitivities produced for these calculations will be taken into account including low and high energy prices and the investor perspective discount rates. Buildability, spread of technologies to achieve cost optimal performance and robustness of technologies across all sectors of the non residential building stock will also be taken into account. The difference between naturally ventilated buildings and air
7. Comparison of Current Regulations and Cost Optimal Level

AECOM Cost Optimal Calculations and Gap Analysis for recast EPBD for Non-Residential Buildings 88
conditioned buildings will also be considered. The significance of the effect of services on the energy performance of new buildings and the retrofit of existing buildings will also be a consideration.
As part of the review of Part L – Buildings other than Dwellings a review of the Non–domestic Energy Assessment Procedure will also take place. In particular a review of the performance parameters for the reference buildings will also take place.

AECOM Cost Optimal Calculations and Gap Analysis for recast EPBD for Non-Residential Buildings 89
7.2 Existing Buildings
For each reference building and improvement measure, Table 7.2 shows the current national regulations compared to the cost optimal solution. Due to the different energy efficiency, we have calculated EE1 and EE2 separately to assess any significant difference. In calculating the overall gap, we have assumed the same weighting for all reference buildings.
Table 7.2a: Comparison Table (Cavity Walls)
Reference building Energy Efficiency Cost Optimal Current Requirements Gap
Retail (Air Conditioned) EE1 - - The gap is greater than
15% between requirements
and cost optimal
Office (Natural Ventilation) EE1 0.3 W/m2K 0.6 W/m2K Office (Air Conditioned) EE1 - - School (Primary – Natural Ventilation) EE1 0.3 W/m2K 0.6 W/m2K Hotel (Air Conditioned) EE1 0.3 W/m2K 0.6 W/m2K
Average 0.3 W/m2K 0.6 W/m2K
Retail (Air Conditioned) EE2 - - The gap is greater than
15% between requirements
and cost optimal
Office (Natural Ventilation) EE2 0.3 W/m2K 0.6 W/m2K Office (Air Conditioned) EE2 - - School (Primary – Natural Ventilation) EE2 0.3 W/m2K 0.6 W/m2K Hotel (Air Conditioned) EE2 0.3 W/m2K 0.6 W/m2K
Average 0.3 W/m2K 0.6 W/m2K
Table 7.2b: Comparison Table (Other Walls)
Reference building Energy Efficiency Cost Optimal Current Requirements Gap
Retail (Air Conditioned) EE1 0.2 W/m2K 0.6 W/m2K The gap is greater than
15% between requirements
and cost optimal
Office (Natural Ventilation) EE1 - - Office (Air Conditioned) EE1 0.2 W/m2K 0.6 W/m2K School (Primary – Natural Ventilation) EE1 - - Hotel (Air Conditioned) EE1 - -
Average 0.2 W/m2K 0.6 W/m2K
Retail (Air Conditioned) EE2 0.2 W/m2K 0.6 W/m2K The gap is greater than
15% between requirements
and cost optimal
Office (Natural Ventilation) EE2 - - Office (Air Conditioned) EE2 0.2 W/m2K 0.6 W/m2K School (Primary – Natural Ventilation) EE2 - - Hotel (Air Conditioned) EE2 - -
Average 0.2 W/m2K 0.6 W/m2K

AECOM Cost Optimal Calculations and Gap Analysis for recast EPBD for Non-Residential Buildings 90
Table 7.2c: Comparison Table (Roof)
Reference building Energy Efficiency Cost Optimal Current Requirements Gap
Retail (Air Conditioned) EE1 0.14 W/m2K 0.35 W/m2K The gap is greater than
15% between
requirements and cost optimal
Office (Natural Ventilation) EE1 0.15 W/m2K 0.35 W/m2K Office (Air Conditioned) EE1 0.14 W/m2K 0.35 W/m2K School (Primary – Natural Ventilation) EE1 0.25 W/m2K 0.35 W/m2K Hotel (Air Conditioned) EE1 0.15 W/m2K 0.35 W/m2K
Average 0.17 W/m2K
0.35 W/m2K
Retail (Air Conditioned) EE2 0.14 W/m2K 0.35 W/m2K The gap is
greater than 15%
between requirements
and cost optimal
Office (Natural Ventilation) EE2 0.15 W/m2K 0.35 W/m2K Office (Air Conditioned) EE2 0.14 W/m2K 0.35 W/m2K School (Primary – Natural Ventilation) EE2 0.25 W/m2K 0.35 W/m2K Hotel (Air Conditioned) EE2 0.15 W/m2K 0.35 W/m2K
Average 0.17 W/m2K 0.35 W/m2K
Table 7.2d: Comparison Table (Heating)
Reference building Energy Efficiency Cost Optimal Current Requirements Gap
Retail (Air Conditioned) EE1 ASHP For replacement boilers (84+ 2 Log Pn)% as per
SI 260 of 19942
There are no requirements
for renewables in current Building
Regulations for non-residential
Office (Natural Ventilation) EE1 ASHP/Biomass Office (Air Conditioned) EE1 ASHP School (Primary – Natural Ventilation) EE1 ASHP Hotel (Air Conditioned) EE1 ASHP
Average ASHP
Retail (Air Conditioned) EE2 ASHP For replacement boilers
(84+ 2 Log Pn)% as per SI 260 of 19942
There are no requirements
for renewables in current Building
Regulations for non-residential
Office (Natural Ventilation) EE2 ASHP/Biomass Office (Air Conditioned) EE2 ASHP School (Primary – Natural Ventilation) EE2 ASHP Hotel (Air Conditioned) EE2 ASHP
Average ASHP
2 http://www.irishstatutebook.ie/1994/en/si/0260.html

AECOM Cost Optimal Calculations and Gap Analysis for recast EPBD for Non-Residential Buildings 91

AECOM Cost Optimal Calculations and Gap Analysis for recast EPBD for Non-Residential Buildings 92
Table 7.2e: Comparison Table (Floor)
Reference building Energy Efficiency Cost Optimal Current Requirements Gap
Retail (Air Conditioned) EE1 0.25 W/m2K 0.60 W/m2K The gap is greater than
15% between
requirements and cost optimal
Office (Natural Ventilation) EE1 0.10 W/m2K 0.60 W/m2K Office (Air Conditioned) EE1 0.10 W/m2K 0.60 W/m2K School (Primary – Natural Ventilation) EE1 0.10 W/m2K 0.60 W/m2K Hotel (Air Conditioned) EE1 0.10 W/m2K 0.60 W/m2K
Average
0.13 W/m2K 0.60 W/m2K
Retail (Air Conditioned) EE2 0.20 W/m2K 0.60 W/m2K The gap is
greater than 15%
between requirements
and cost optimal
Office (Natural Ventilation) EE2 0.10 W/m2K 0.60 W/m2K Office (Air Conditioned) EE2 0.10 W/m2K 0.60 W/m2K School (Primary – Natural Ventilation) EE2 0.10 W/m2K 0.60 W/m2K Hotel (Air Conditioned) EE2 0.10 W/m2K 0.60 W/m2K
Average
0.12 W/m2K 0.60 W/m2K
Table 7.2f: Comparison Table (Windows)
Reference building Energy Efficiency Cost Optimal Current Requirements Gap
Retail (Air Conditioned) EE1 1.4 W/m2K 2.2 W/m2K The gap is greater than
15% between
requirements and cost optimal
Office (Natural Ventilation) EE1 1.8 W/m2K 2.2 W/m2K Office (Air Conditioned) EE1 1.4 W/m2K 2.2 W/m2K School (Primary – Natural Ventilation) EE1 1.8 W/m2K 2.2 W/m2K Hotel (Air Conditioned) EE1 1.4 W/m2K 2.2 W/m2K
Average 1.56 W/m2K 2.2 W/m2K
Retail (Air Conditioned) EE2 1.4 W/m2K 2.2 W/m2K The gap is
greater than 15%
between requirements
and cost optimal
Office (Natural Ventilation) EE2 1.8 W/m2K 2.2 W/m2K Office (Air Conditioned) EE2 1.4 W/m2K 2.2 W/m2K School (Primary – Natural Ventilation) EE2 1.8 W/m2K 2.2 W/m2K Hotel (Air Conditioned) EE2 1.4 W/m2K 2.2 W/m2K
Average 1.56 W/m2K 2.2 W/m2K
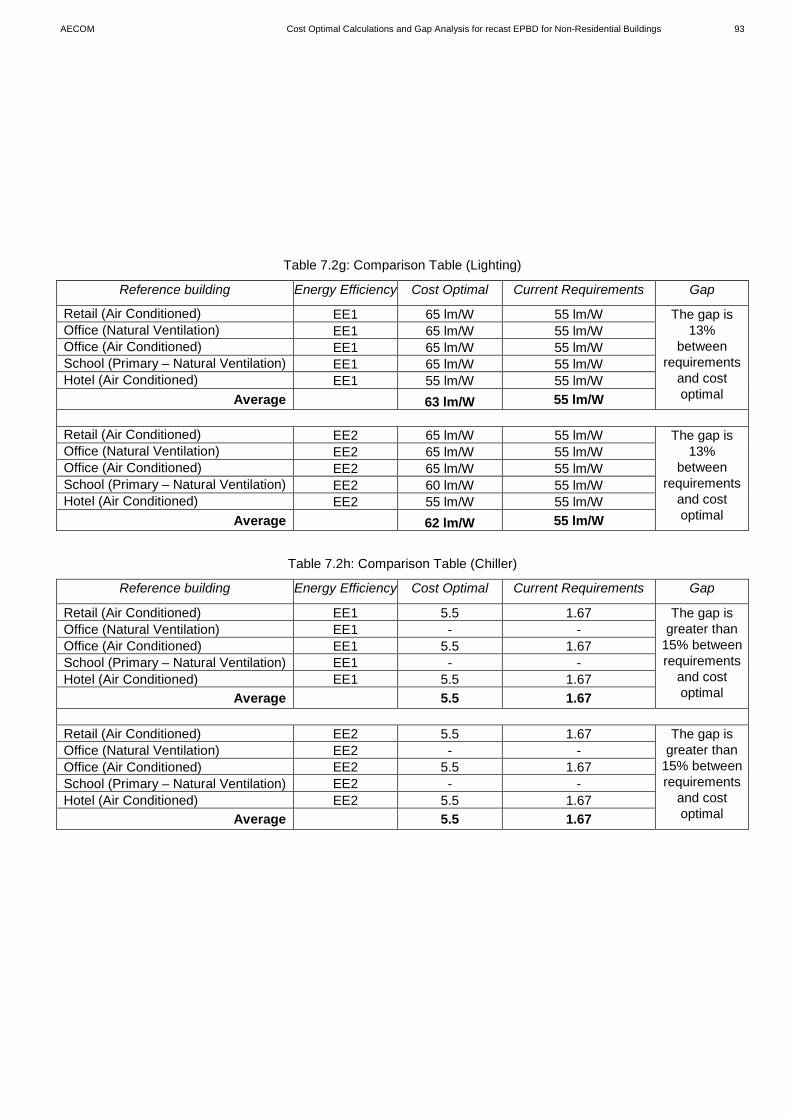
AECOM Cost Optimal Calculations and Gap Analysis for recast EPBD for Non-Residential Buildings 93
Table 7.2g: Comparison Table (Lighting)
Reference building Energy Efficiency Cost Optimal Current Requirements Gap
Retail (Air Conditioned) EE1 65 lm/W 55 lm/W The gap is 13%
between requirements
and cost optimal
Office (Natural Ventilation) EE1 65 lm/W 55 lm/W Office (Air Conditioned) EE1 65 lm/W 55 lm/W School (Primary – Natural Ventilation) EE1 65 lm/W 55 lm/W Hotel (Air Conditioned) EE1 55 lm/W 55 lm/W
Average 63 lm/W 55 lm/W
Retail (Air Conditioned) EE2 65 lm/W 55 lm/W The gap is 13%
between requirements
and cost optimal
Office (Natural Ventilation) EE2 65 lm/W 55 lm/W Office (Air Conditioned) EE2 65 lm/W 55 lm/W School (Primary – Natural Ventilation) EE2 60 lm/W 55 lm/W Hotel (Air Conditioned) EE2 55 lm/W 55 lm/W
Average 62 lm/W 55 lm/W
Table 7.2h: Comparison Table (Chiller)
Reference building Energy Efficiency Cost Optimal Current Requirements Gap
Retail (Air Conditioned) EE1 5.5 1.67 The gap is greater than
15% between requirements
and cost optimal
Office (Natural Ventilation) EE1 - - Office (Air Conditioned) EE1 5.5 1.67 School (Primary – Natural Ventilation) EE1 - - Hotel (Air Conditioned) EE1 5.5 1.67
Average 5.5 1.67
Retail (Air Conditioned) EE2 5.5 1.67 The gap is greater than
15% between requirements
and cost optimal
Office (Natural Ventilation) EE2 - - Office (Air Conditioned) EE2 5.5 1.67 School (Primary – Natural Ventilation) EE2 - - Hotel (Air Conditioned) EE2 5.5 1.67
Average 5.5 1.67

AECOM Cost Optimal Calculations and Gap Analysis for recast EPBD for Non-Residential Buildings 94
Table 7.2i: Comparison Table (AHU)
Reference building Energy Efficiency Cost Optimal Current Requirements Gap
Retail (Air Conditioned) EE1 1.8 W/l/s 3.0 W/l/s The gap is greater than
15% between requirements
and cost optimal
Office (Natural Ventilation) EE1 - - Office (Air Conditioned) EE1 1.8 W/l/s 3.0 W/l/s School (Primary – Natural Ventilation) EE1 - - Hotel (Air Conditioned) EE1 1.8 W/l/s 3.0 W/l/s
Average 1.8 W/l/s 3.0 W/l/s
Retail (Air Conditioned) EE2 1.8 W/l/s 3.0 W/l/s The gap is greater than
15% between requirements
and cost optimal
Office (Natural Ventilation) EE2 - - Office (Air Conditioned) EE2 1.8 W/l/s 3.0 W/l/s School (Primary – Natural Ventilation) EE2 - - Hotel (Air Conditioned) EE2 1.8 W/l/s 3.0 W/l/s
Average 1.8 W/l/s 3.0 W/l/s

AECOM Cost Optimal Calculations and Gap Analysis for recast EPBD for Non-Residential Buildings 95
We discuss further those cases where the gap between current requirements and cost optimal was greater than 15%.
• The current standard for walls is U=0.60W/m²K. By comparison, the cost optimum solution for cavity walls was U=0.30W/m²K (fully filled cavity) and for other walls was U=0.2W/m²K (150 external insulation - EPS).
• The current standard for roofs is U=0.35W/m²K. By comparison, the cost optimum solution for pitched roofs and metal roofs both ranged from U=0.14W/m²K to 0.25W/m²K. In practice, any technical requirement would need to take account of the impact on the available space in flat roof voids and parapet heights. From a buildability perspective this may restrict the depth of insulation that may be practically installed.
• The current standard for floors is U=0.6W/m²K. By comparison, the cost optimum solution ranged from U=0.1W/m²K to 0.25W/m²K. In practice, any technical requirement would need to take account of the impact on usable room volume and available foundation depth. From a buildability perspective this may restrict the depth of insulation that may be practically installed.
• The current standard for windows is U=2.2W/m²K. By comparison, the cost optimum solution ranged from U=1.4W/m²K to 1.8W/m²K.
• The current standard for chillers is a SEER of 1.67. By comparison, the cost optimum solution was 5.5 for all air conditioned buildings modelled.
• The current standard for air handling units (AHU) is 3.0 W/l/s. By comparison, the cost optimum solution was 1.8 W/l/s for all mechanically ventilated buildings.
• The current standard for replacement boilers for non residential buildings is 84% as per S.I. No. 260 of 1994: European Communities (Efficiency requirements for new hot water boilers fired with liquid or gaseous fuels) Regulations, 1994.. The cost optimal study has identified renewables as being a cost optimal solution for heating of buildings. Currently SI 243 of 2012 European Union (Energy Performance of Buildings) Regulations 2012 encourages feasibility studies for alternative energies for existing buildings undergoing major renovation.
Plan to address gap between requirements and cost optimal level
Energy performance levels for existing buildings are set on a component basis as set out in Part L of the Building Regulations TGD L Conservation of Fuel and Energy-Buildings other than Dwellings.
The component level performance standards in this regulation were last reviewed in 2002.
The Regulation and Technical Guidance Document is currently undergoing a review process to complete in early 2014. It is intended that the new Regulation and Guidance for components will be reviewed in light of cost optimal levels for components.
It is intended as part of the Technical Guidance Document L –Conservation of Fuel and Energy –Buildings other than Dwellings that further analysis of the sensitivities produced for these calculations will be taken into account including low and high energy prices and the investor perspective discount rates. Other influencing parameters such as buildability, available spread of technologies to achieve cost optimal performance and robustness of technologies across all sectors of the non residential building stock will also be taken into account. The difference between naturally ventilated buildings and air conditioned buildings will also be considered. The significance of the effect of

AECOM Cost Optimal Calculations and Gap Analysis for recast EPBD for Non-Residential Buildings 96
services on the energy performance of new buildings and the retrofit of existing buildings will also be a consideration.

AECOM Cost Optimal Calculations and Gap Analysis for recast EPBD for Non-Residential Buildings 97
The following calculation methods from Section 1.2 of TGD L Conservation of Fuel and Energy –Buildings other than Dwellings3
sets out the maximum performance levels for fabric for new and existing buildings. Whilst these are the maximum values permitted it is likely that actual values will need to be significantly better than these “backstop” values
1.2.2 OVERALL HEAT LOSS METHOD 1.2.2.1 This method sets a maximum acceptable level of transmission heat loss through the fabric of a building, in terms of the maximum average U-value (Um) of all fabric elements contributing to heat loss. The level depends on the ratio of the total area of these elements (At) to the building volume (V), and is specified in Table 1. The acceptable level of heat loss is expressed graphically in Diagram 1. 1.2.2.2 In addition to not exceeding the maximum average value set, average elemental U-values should not exceed the following:
• roofs 0.25 W/m2K • walls 0.37 W/m2K • exposed floors 0.37 W/m2K • ground floors 0.37 W/m2K
3 http://www.environ.ie/en/Publications/DevelopmentandHousing/BuildingStandards/FileDownLoad,20322,en.pdf
Appendix A: Irish standards

AECOM Cost Optimal Calculations and Gap Analysis for recast EPBD for Non-Residential Buildings 98

AECOM Cost Optimal Calculations and Gap Analysis for recast EPBD for Non-Residential Buildings 99

AECOM Cost Optimal Calculations and Gap Analysis for recast EPBD for Non-Residential Buildings 100
Elemental heat loss method for existing buildings The following table sets out Maximum average elemental U-Value Material Alterations to, or Material Changes of Use of, Existing Buildings

AECOM Cost Optimal Calculations and Gap Analysis for recast EPBD for Non-Residential Buildings 101
This appendix outlines the sensitivity analysis undertaken on the Office (NV) building to assess the macro-economic costs associated with the use of biomass boilers. We modelled a biomass boiler of 80% efficiency. The technology costs assumed are recorded in Table B1.
Table B1: Biomass capital costs
Building Type Biomass
Boiler Capital Office (NV) 43,921 Maintenance Office (NV) 818
The energy costs assumed for the analysis were provided by SEAI and are recorded in Table B2.
Table B2: Biomass energy costs
2013 2014 2015 2016 2017 2018 2019 2020 2021 2022 Low Biomass c/kWh 4.3 3.9 3.6 3.4 3.2 3.1 2.9 2.8 2.7 2.6
Central Biomass c/kWh 4.6 4.4 4.1 3.9 3.8 3.6 3.5 3.3 3.2 3.1 High Biomass c/kWh 5.1 5.0 4.9 4.8 4.6 4.5 4.3 4.2 4.1 4.0
2023 2024 2025 2026 2027 2028 2029 2030 2031 2032
Low Biomass c/kWh 2.5 2.4 2.3 2.3 2.2 2.2 2.2 2.1 2.1 2.1 Central Biomass c/kWh 3.0 2.9 2.8 2.8 2.8 2.7 2.7 2.7 2.7 2.7
High Biomass c/kWh 4.0 3.9 3.9 3.9 3.9 3.9 3.9 3.9 3.9 3.9 2033 2034 2035 2036 2037 2038 2039 2040 2041 2042
Low Biomass c/kWh 2.1 2.1 2.1 2.1 2.1 2.1 2.1 2.1 2.1 2.1 Central Biomass c/kWh 2.7 2.7 2.7 2.7 2.7 2.7 2.7 2.7 2.7 2.7
High Biomass c/kWh 3.9 3.9 3.9 3.9 3.9 3.9 3.9 3.9 3.9 3.9
The detailed breakdown for the macroeconomic cost (central energy price and 4% discount rate) is shown in Table B3. This shows the original points from the previous analysis, plus key additional points from the inclusion of a biomass boiler for comparison. Key outcomes from the analysis of the results were as follows.
• The biomass options tend to have a higher primary energy than those of gas. Biomass has approximately the same primary energy factor as that of gas, but the boilers are less efficient.
• The optimum point has now moved from a primary energy of 52 kWh/m² to 102 kWh/m². This corresponds to the same technology solution, with the exception of the heating technology, which in this case is changed from a GSHP to a biomass boiler. This reflects the significantly lower fuel cost compared to other technologies.
Appendix B: Biomass Boiler Sensitivity

AECOM Cost Optimal Calculations and Gap Analysis for recast EPBD for Non-Residential Buildings 102
Table B3: Comparing macroeconomic costs (Central energy price, 4% discount rate, EUR/m²)
Building Package PE
(KWh/m²)
Initial Investment
Cost
Annual Costs Cost of Emissions
Residual Value
Macro Cost Fabric Heating Services PV FC Maintenance Energy
Office (NV) – 20 year
calc
C GSHP 3 40% - 35 281 9 76 3 -34 335
B GSHP 3 40% - 45 241 9 93 4 -25 321
C Biomass (80%) 3 40% - 51 266 10 75 2 -34 319
A GSHP 3 40% - 52* 222 9 105 5 -21 319
A GSHP 3 30% - 64 209 8 119 6 -20 323
B Biomass (80%) 3 40% - 80 226 10 90 2 -25 303
A GSHP 3 10% - 88 183 8 148 8 -17 329
A GSHP 3 0% - 99 171 6 162 9 -16 332
A Biomass (80%) 3 40% - 102* 207 10 102 2 -21 300
A GSHP 1 10% - 106 160 8 178 9 -17 337
A Biomass (80%) 3 30% - 113 194 9 116 3 -20 303
A GSHP 1 0% - 118 147 6 192 10 -16 339
A Biomass (80%) 1 40% - 137 183 10 130 3 -21 305
A Gas(86%) 3 0% - 143 135 6 239 14 -16 378
A Biomass (80%) 1 30% - 149 170 9 145 4 -20 308
A Biomass (80%) 1 20% - 161 157 9 159 5 -19 312
A Gas(86%) 1 0% - 177 111 6 295 17 -16 414
A Biomass (80%) 1 0% - 184 131 7 188 7 -16 318

AECOM Ireland Existing Domestic Building Results – Draft 12/02/13 1 Capabilities on project: Building Engineering
Cost Optimal Calculations and Gap Analysis for recast EPBD for Non-Residential Buildings: Annex A

AECOM Ireland Existing Domestic Building Results – Draft 12/02/13 2 Capabilities on project: Building Engineering
Table A: Macroeconomic Costs Central energy price 4% discount rate

AECOM Ireland Existing Domestic Building Results – Draft 12/02/13 3 Capabilities on project: Building Engineering
Retail (EE1): Macroeconomic Costs (Central energy price, 4% discount rate, EUR/m²)
Package Value PE (KWh/m²)
Initial Investment
Cost
Annual Costs Cost of Emissions
Residual Value
Macro Cost Maintenance Energy
Wall U-Value 0.11 646 66 0 1062 57 -21 1164
Wall U-Value 0.15 (b) 647 55 0 1063 58 -17 1158
Wall U-Value 0.15 647 59 0 1063 58 -19 1161
Wall U-Value 0.2 648 50 0 1064 58 -16 1156
Wall U-Value 0.21 648 57 0 1065 58 -18 1161
Wall U-Value 0.27 649 54 0 1066 58 -17 1161
Wall U-Value 0.36 651 51 0 1069 58 -16 1162
Wall U-Value 0.47 653 48 0 1072 58 -15 1163
Roof U-value 0.14 648 0 0 1064 58 0 1122
Roof U-value 0.18 649 0 0 1067 58 0 1125
Roof U-value 0.29 654 0 0 1075 58 0 1133
Heating Source ASHP 558 41 13 913 48 0 1015
Heating Source Gas CHP 620 132 99 1049 56 0 1335
Heating Source Gas (91%) 646 11 15 1062 57 0 1145
Heating Source Gas (91%) + SHW 646 104 15 1062 57 0 1237
Heating Source Gas (86%) 653 11 15 1074 58 0 1158
Floor U-value 0.25 652 12 0 1071 58 -4 1137
Floor U-value 0.2 652 14 0 1071 58 -5 1139
Floor U-value 0.15 653 18 0 1072 58 -6 1142
Floor U-value 0.1 653 26 0 1072 58 -8 1148
Window U-value 1.4 644 15 0 1058 57 -2 1128
Window U-value 1.1 644 19 0 1058 57 -3 1132
Window U-value 0.9 647 20 0 1064 58 -3 1138
Window U-value 1.8 653 13 0 1073 58 -2 1142
Chiller Efficiency 5.5 533 30 0 877 48 0 955
Chiller Efficiency 4.5 545 27 0 897 49 0 972
Chiller Efficiency 3.5 564 25 0 928 50 0 1003
AHU SFP 1.8 641 19 0 1053 57 0 1129
AHU SFP 2 646 17 0 1062 58 0 1137
AHU SFP 2.2 652 16 0 1072 58 0 1146
Lighting Efficacy 65 490 6 0 807 44 0 858
Lighting Efficacy 60 498 5 0 821 45 0 871
Lighting Efficacy 55 508 5 0 837 46 0 888

AECOM Ireland Existing Domestic Building Results – Draft 12/02/13 4 Capabilities on project: Building Engineering
Retail (EE2): Macroeconomic Costs (Central energy price, 4% discount rate, EUR/m²)
Package Value PE (KWh/m²)
Initial Investment
Cost
Annual Costs Cost of Emissions
Residual Value
Macro Cost Maintenance Energy
Wall U-Value 0.11 501 66 0 824 45 -21 914
Wall U-Value 0.15 (b) 502 55 0 826 45 -17 909
Wall U-Value 0.15 502 59 0 826 45 -19 911
Wall U-Value 0.2 503 50 0 828 45 -16 907
Wall U-Value 0.21 503 57 0 828 45 -18 912
Wall U-Value 0.27 504 54 0 830 45 -17 913
Wall U-Value 0.36 506 51 0 834 46 -16 914
Wall U-Value 0.47 509 48 0 838 46 -15 917
Roof U-value 0.14 503 0 0 828 45 0 873
Roof U-value 0.18 505 0 0 831 45 0 877
Roof U-value 0.29 511 0 0 841 46 0 887
Heating Source ASHP 406 41 13 663 35 0 752
Heating Source Gas CHP 473 132 99 812 43 0 1086
Heating Source Gas (91%) 502 11 15 826 45 0 897
Heating Source Gas (91%) + SHW 502 104 15 826 45 0 990
Heating Source Gas (86%) 510 11 15 840 46 0 912
Floor U-value 0.1 496 26 0 815 44 -8 877
Floor U-value 0.15 497 18 0 817 44 -6 874
Floor U-value 0.2 498 14 0 819 45 -5 873
Floor U-value 0.25 502 12 0 827 45 -4 880
Window U-value 1.1 502 19 0 827 45 -3 888
Window U-value 1.4 502 15 0 828 45 -2 885
Window U-value 0.9 504 20 0 829 45 -3 892
Window U-value 1.8 508 13 0 837 46 -2 893
Chiller Efficiency 5.5 461 30 0 760 42 0 832
Chiller Efficiency 4.5 470 27 0 775 43 0 844
Chiller Efficiency 3.5 485 25 0 799 44 0 868
AHU SFP 1.8 497 19 0 818 45 0 882
AHU SFP 2 503 17 0 828 45 0 890
AHU SFP 2.2 508 16 0 837 46 0 900
Lighting Efficacy 65 453 6 0 747 41 0 794
Lighting Efficacy 60 460 5 0 759 42 0 806
Lighting Efficacy 55 469 5 0 773 42 0 820

AECOM Ireland Existing Domestic Building Results – Draft 12/02/13 5 Capabilities on project: Building Engineering
Office (NV) (EE1): Macroeconomic Costs (Central energy price, 4% discount rate, EUR/m²)
Package Value PE (KWh/m²)
Initial Investment
Cost
Annual Costs Cost of Emissions
Residual Value
Macro Cost Maintenance Energy
Wall U-Value 0.1 340 69 0 567 33 -22 646
Wall U-Value 0.14 341 32 0 569 33 -10 624
Wall U-Value 0.16 342 62 0 570 33 -20 645
Wall U-Value 0.19 343 16 0 572 33 -5 616
Wall U-Value 0.21 343 28 0 573 33 -9 625
Wall U-Value 0.3 346 4 0 577 33 -1 613
Wall U-Value 0.39 348 12 0 581 33 -4 623
Roof U-value 0.15 334 17 0 557 32 -5 601
Roof U-value 0.2 336 16 0 561 32 -5 604
Roof U-value 0.25 338 13 0 564 32 -4 605
Heating Source GSHP 160 26 7 261 14 0 307
Heating Source Gas CHP 284 101 41 537 29 0 708
Heating Source Gas (91%) + SHW 316 56 8 527 30 0 621
Heating Source Gas (91%) 316 9 8 527 30 0 574
Heating Source Gas (86%) 330 9 8 549 31 0 598
Floor U-value 0.1 337 13 0 563 32 -4 604
Floor U-value 0.15 340 9 0 566 33 -3 605
Floor U-value 0.2 342 7 0 570 33 -2 608
Floor U-value 0.25 344 6 0 574 33 -2 611
Window U-value 0.9 303 92 0 505 29 -15 611
Window U-value 1.1 312 87 0 519 30 -14 622
Window U-value 1.8 315 57 0 524 30 -9 602
Window U-value 1.4 319 67 0 531 30 -11 618
Lighting Efficacy 65 288 28 0 485 29 0 542
Lighting Efficacy 60 292 23 0 491 29 0 542
Lighting Efficacy 55 295 23 0 496 29 0 547

AECOM Ireland Existing Domestic Building Results – Draft 12/02/13 6 Capabilities on project: Building Engineering
Office (NV) (EE2): Macroeconomic Costs (Central energy price, 4% discount rate, EUR/m²)
Package Value PE (KWh/m²)
Initial Investment
Cost
Annual Costs Cost of Emissions
Residual Value
Macro Cost Maintenance Energy
Wall U-Value 0.1 271 69 0 452 26 -22 525
Wall U-Value 0.14 272 32 0 454 26 -10 502
Wall U-Value 0.16 273 62 0 455 26 -20 523
Wall U-Value 0.19 274 16 0 457 26 -5 494
Wall U-Value 0.21 275 28 0 458 26 -9 503
Wall U-Value 0.3 277 4 0 462 26 -1 491
Wall U-Value 0.39 279 12 0 466 27 -4 501
Roof U-value 0.15 277 17 0 462 26 -5 500
Roof U-value 0.2 279 16 0 465 27 -5 502
Roof U-value 0.25 281 13 0 468 27 -4 504
Heating Source GSHP 136 26 7 222 12 0 266
Heating Source Gas CHP 242 101 41 458 25 0 624
Heating Source Gas (91%) + SHW 270 56 8 449 26 0 539
Heating Source Gas (91%) 270 9 8 449 26 0 492
Heating Source Gas (86%) 281 9 8 468 27 0 512
Floor U-value 0.1 267 13 0 445 25 -4 479
Floor U-value 0.15 269 9 0 449 26 -3 481
Floor U-value 0.2 271 7 0 452 26 -2 483
Floor U-value 0.25 273 6 0 455 26 -2 486
Window U-value 0.9 252 92 0 419 24 -15 521
Window U-value 1.1 259 87 0 432 25 -14 529
Window U-value 1.8 262 57 0 437 25 -9 510
Window U-value 1.4 266 67 0 442 25 -11 524
Lighting Efficacy 65 231 28 0 388 23 0 439
Lighting Efficacy 60 235 23 0 394 23 0 440
Lighting Efficacy 55 239 23 0 401 23 0 447

AECOM Ireland Existing Domestic Building Results – Draft 12/02/13 7 Capabilities on project: Building Engineering
Office (AC) (EE1): Macroeconomic Costs (Central energy price, 4% discount rate, EUR/m²)
Package Value PE (KWh/m²)
Initial Investment
Cost
Annual Costs Cost of Emissions
Residual Value
Macro Cost Maintenance Energy
Wall U-Value 0.11 401 75 0 665 37 -24 753
Wall U-Value 0.15 (b) 402 63 0 666 37 -20 746
Wall U-Value 0.15 402 67 0 666 37 -21 749
Wall U-Value 0.2 403 57 0 667 37 -18 744
Wall U-Value 0.21 403 65 0 668 37 -21 749
Wall U-Value 0.27 404 61 0 669 37 -19 749
Wall U-Value 0.36 406 58 0 672 38 -18 749
Wall U-Value 0.47 408 54 0 675 38 -17 750
Roof U-value 0.14 404 0 0 669 37 0 707
Roof U-value 0.18 405 0 0 671 38 0 709
Roof U-value 0.29 409 0 0 677 38 0 715
Heating Source GSHP 263 26 7 430 23 0 485
Heating Source Gas CHP 362 101 41 649 35 0 826
Heating Source Gas (91%) 406 9 8 673 38 0 728
Heating Source Gas (91%) + SHW 406 56 8 673 38 0 775
Heating Source Gas (86%) 418 9 8 693 39 0 749
Floor U-value 0.1 395 13 0 654 36 -4 699
Floor U-value 0.15 397 9 0 657 37 -3 700
Floor U-value 0.2 398 7 0 660 37 -2 701
Floor U-value 0.25 400 6 0 662 37 -2 704
Window U-value 1.1 377 87 0 625 35 -14 733
Window U-value 1.4 380 67 0 631 35 -11 723
Window U-value 0.9 383 92 0 633 35 -15 747
Window U-value 1.8 405 57 0 670 37 -9 755
Chiller Efficiency 5.5 342 26 0 568 32 0 626
Chiller Efficiency 4.5 349 23 0 580 33 0 636
Chiller Efficiency 3.5 361 21 0 599 34 0 654
AHU SFP 1.8 391 12 0 647 36 0 695
AHU SFP 2 395 11 0 655 37 0 703
AHU SFP 2.2 400 10 0 663 37 0 710
Lighting Efficacy 65 366 28 0 608 34 0 670
Lighting Efficacy 60 371 23 0 616 35 0 674
Lighting Efficacy 55 378 23 0 627 35 0 684

AECOM Ireland Existing Domestic Building Results – Draft 12/02/13 8 Capabilities on project: Building Engineering
Office (AC) (EE2): Macroeconomic Costs (Central energy price, 4% discount rate, EUR/m²)
Package Value PE (KWh/m²)
Initial Investment
Cost
Annual Costs Cost of Emissions
Residual Value
Macro Cost Maintenance Energy
Wall U-Value 0.11 305 75 0 504 28 -24 583
Wall U-Value 0.15 (b) 306 63 0 506 28 -20 577
Wall U-Value 0.15 306 67 0 506 28 -21 580
Wall U-Value 0.2 307 57 0 507 28 -18 574
Wall U-Value 0.21 307 65 0 508 28 -21 580
Wall U-Value 0.27 309 61 0 510 28 -19 580
Wall U-Value 0.36 311 58 0 513 28 -18 581
Wall U-Value 0.47 313 54 0 517 29 -17 582
Roof U-value 0.14 307 0 0 506 28 0 534
Roof U-value 0.18 308 0 0 509 28 0 537
Roof U-value 0.29 312 0 0 515 29 0 543
Heating Source GSHP 225 26 7 367 19 0 419
Heating Source Gas CHP 290 101 41 512 27 0 681
Heating Source Gas (91%) 319 9 8 528 29 0 574
Heating Source Gas (91%) + SHW 319 56 8 528 29 0 621
Heating Source Gas (86%) 327 9 8 541 30 0 589
Floor U-value 0.1 305 13 0 503 28 -4 540
Floor U-value 0.15 306 9 0 506 28 -3 540
Floor U-value 0.2 308 7 0 509 28 -2 542
Floor U-value 0.25 310 6 0 513 28 -2 545
Window U-value 1.1 276 87 0 456 25 -14 554
Window U-value 1.4 280 67 0 463 26 -11 545
Window U-value 0.9 282 92 0 464 25 -15 567
Window U-value 1.8 307 57 0 506 28 -9 583
Chiller Efficiency 5.5 250 26 0 415 23 0 464
Chiller Efficiency 4.5 257 23 0 426 24 0 472
Chiller Efficiency 3.5 268 21 0 444 25 0 490
AHU SFP 1.8 301 12 0 497 28 0 536
AHU SFP 2 306 11 0 505 28 0 543
AHU SFP 2.2 310 10 0 513 28 0 551
Lighting Efficacy 65 298 28 0 492 27 0 547
Lighting Efficacy 60 303 23 0 501 28 0 552
Lighting Efficacy 55 310 23 0 513 28 0 564

AECOM Ireland Existing Domestic Building Results – Draft 12/02/13 9 Capabilities on project: Building Engineering
Primary (EE1): Macroeconomic Costs (Central energy price, 4% discount rate, EUR/m²)
Package Value PE (KWh/m²)
Initial Investment
Cost
Annual Costs Cost of Emissions
Residual Value
Macro Cost Maintenance Energy
Wall U-Value 0.1 162 57 0 277 16 -9 341
Wall U-Value 0.14 164 27 0 280 16 -4 319
Wall U-Value 0.16 164 51 0 281 16 -8 341
Wall U-Value 0.19 166 13 0 283 17 -2 311
Wall U-Value 0.21 166 24 0 285 17 -4 321
Wall U-Value 0.3 170 3 0 291 17 -1 311
Wall U-Value 0.39 174 10 0 297 17 -2 323
Roof U-value 0.15 172 15 0 295 17 -2 324
Roof U-value 0.2 173 13 0 296 17 -2 324
Roof U-value 0.25 173 11 0 297 17 -2 323
Heating Source GSHP 62 30 13 107 6 0 155
Heating Source Gas CHP 140 62 56 331 15 0 464
Heating Source Gas (91%) + SHW 155 47 14 265 15 0 341
Heating Source Gas (91%) 155 8 14 265 15 0 302
Heating Source Gas (86%) 163 8 14 278 16 0 316
Floor U-value 0.1 158 11 0 271 16 -2 295
Floor U-value 0.15 161 8 0 275 16 -1 298
Floor U-value 0.2 163 6 0 279 16 -1 301
Floor U-value 0.25 166 5 0 284 17 -1 304
Window U-value 0.9 142 47 0 243 14 0 304
Window U-value 1.1 147 44 0 252 15 0 311
Window U-value 1.8 150 29 0 257 15 0 301
Window U-value 1.4 152 34 0 260 15 0 309
Lighting Efficacy 65 157 23 0 267 16 0 306
Lighting Efficacy 60 158 21 0 270 16 0 306
Lighting Efficacy 55 160 20 0 272 16 0 308

AECOM Ireland Existing Domestic Building Results – Draft 12/02/13 10 Capabilities on project: Building Engineering
Primary (EE2): Macroeconomic Costs (Central energy price, 4% discount rate, EUR/m²)
Package Value PE (KWh/m²)
Initial Investment
Cost
Annual Costs Cost of Emissions
Residual Value
Macro Cost Maintenance Energy
Wall U-Value 0.1 84 57 0 144 8 -9 201
Wall U-Value 0.14 86 27 0 147 9 -4 178
Wall U-Value 0.16 87 51 0 148 9 -8 200
Wall U-Value 0.19 88 13 0 150 9 -2 170
Wall U-Value 0.21 89 24 0 152 9 -4 180
Wall U-Value 0.3 92 3 0 158 9 -1 170
Wall U-Value 0.39 96 10 0 164 10 -2 182
Roof U-value 0.15 93 15 0 159 9 -2 181
Roof U-value 0.2 94 13 0 160 9 -2 181
Roof U-value 0.25 94 11 0 161 10 -2 180
Heating Source GSHP 27 30 13 47 3 0 93
Heating Source Gas CHP 82 62 56 203 9 0 330
Heating Source Gas (91%) + SHW 92 47 14 157 9 0 227
Heating Source Gas (91%) 92 8 14 157 9 0 188
Heating Source Gas (86%) 97 8 14 166 10 0 198
Floor U-value 0.1 87 11 0 149 9 -2 167
Floor U-value 0.15 89 8 0 153 9 -1 168
Floor U-value 0.2 92 6 0 157 9 -1 171
Floor U-value 0.25 94 5 0 161 10 -1 175
Window U-value 0.9 81 47 0 138 8 0 193
Window U-value 1.1 86 44 0 147 9 0 199
Window U-value 1.8 89 29 0 152 9 0 190
Window U-value 1.4 90 34 0 154 9 0 197
Lighting Efficacy 65 91 23 0 155 9 0 187
Lighting Efficacy 60 92 21 0 157 9 0 187
Lighting Efficacy 55 93 20 0 159 9 0 188

AECOM Ireland Existing Domestic Building Results – Draft 12/02/13 11 Capabilities on project: Building Engineering
Hotel (EE1): Macroeconomic Costs (Central energy price, 4% discount rate, EUR/m²)
Package Value PE (KWh/m²)
Initial Investment
Cost
Annual Costs Cost of Emissions
Residual Value
Macro Cost Maintenance Energy
Wall U-Value 0.1 566 94 0 944 54 -30 1063
Wall U-Value 0.14 568 44 0 947 54 -14 1031
Wall U-Value 0.16 568 84 0 948 54 -27 1060
Wall U-Value 0.19 569 22 0 949 55 -7 1019
Wall U-Value 0.21 570 39 0 951 55 -12 1032
Wall U-Value 0.3 573 5 0 956 55 -2 1014
Wall U-Value 0.39 576 17 0 961 55 -5 1028
Roof U-value 0.15 576 10 0 960 55 -3 1022
Roof U-value 0.2 577 9 0 962 55 -3 1024
Roof U-value 0.25 578 7 0 965 55 -2 1025
Heating Source GSHP 457 29 10 759 43 0 841
Heating Source Gas CHP 542 74 48 948 53 0 1122
Heating Source Gas (91%) + SHW 563 35 10 939 54 0 1039
Heating Source Gas (91%) 576 8 10 961 55 0 1035
Heating Source Gas (86%) 586 8 10 978 56 0 1053
Floor U-value 0.1 570 7 0 951 55 -2 1010
Floor U-value 0.15 571 5 0 953 55 -2 1011
Floor U-value 0.2 572 4 0 955 55 -1 1012
Floor U-value 0.25 573 3 0 957 55 -1 1014
Window U-value 1.1 547 87 0 911 52 -14 1037
Window U-value 0.9 548 93 0 913 52 -15 1043
Window U-value 1.4 550 68 0 918 53 -11 1028
Window U-value 1.8 563 58 0 938 54 -9 1041
Chiller Efficiency 5.5 546 31 0 912 53 0 995
Chiller Efficiency 4.5 549 27 0 917 53 0 997
Chiller Efficiency 3.5 554 25 0 925 53 0 1004
AHU SFP 1.8 558 10 0 931 54 0 995
AHU SFP 2 564 10 0 941 54 0 1005
AHU SFP 2.2 569 9 0 950 55 0 1014
Lighting Efficacy 65 489 51 0 821 48 0 920
Lighting Efficacy 60 491 46 0 824 49 0 918
Lighting Efficacy 55 493 39 0 828 49 0 915

AECOM Ireland Existing Domestic Building Results – Draft 12/02/13 12 Capabilities on project: Building Engineering
Hotel (EE2): Macroeconomic Costs (Central energy price, 4% discount rate, EUR/m²)
Package Value PE (KWh/m²)
Initial Investment
Cost
Annual Costs Cost of Emissions
Residual Value
Macro Cost Maintenance Energy
Wall U-Value 0.1 442 94 0 741 43 -30 848
Wall U-Value 0.14 444 44 0 743 43 -14 817
Wall U-Value 0.16 445 84 0 744 43 -27 845
Wall U-Value 0.19 446 22 0 746 44 -7 805
Wall U-Value 0.21 446 39 0 747 44 -12 818
Wall U-Value 0.3 450 5 0 753 44 -2 801
Wall U-Value 0.39 453 17 0 759 44 -5 815
Roof U-value 0.15 453 10 0 758 44 -3 810
Roof U-value 0.2 454 9 0 761 44 -3 811
Roof U-value 0.25 455 7 0 763 45 -2 812
Heating Source GSHP 325 29 10 541 31 0 611
Heating Source Gas CHP 420 74 48 752 43 0 916
Heating Source Gas (91%) + SHW 446 35 10 748 44 0 837
Heating Source Gas (91%) 458 8 10 767 45 0 830
Heating Source Gas (86%) 469 8 10 786 46 0 850
Floor U-value 0.1 446 7 0 747 44 -2 796
Floor U-value 0.15 448 5 0 749 44 -2 797
Floor U-value 0.2 449 4 0 752 44 -1 798
Floor U-value 0.25 450 3 0 754 44 -1 800
Window U-value 0.9 431 93 0 721 42 -15 841
Window U-value 1.1 434 87 0 727 42 -14 842
Window U-value 1.4 439 68 0 735 43 -11 835
Window U-value 1.8 445 58 0 745 43 -9 837
Chiller Efficiency 5.5 437 31 0 732 43 0 806
Chiller Efficiency 4.5 439 27 0 736 43 0 806
Chiller Efficiency 3.5 442 25 0 741 43 0 810
AHU SFP 1.8 444 10 0 744 44 0 798
AHU SFP 2 450 10 0 753 44 0 807
AHU SFP 2.2 455 9 0 763 45 0 816
Lighting Efficacy 65 434 51 0 729 43 0 823
Lighting Efficacy 60 436 46 0 732 43 0 821
Lighting Efficacy 55 439 39 0 736 43 0 818

AECOM Ireland Existing Domestic Building Results – Draft 12/02/13 13 Capabilities on project: Building Engineering
Table B: Macroeconomic Costs Low energy price 4% discount rate

AECOM Ireland Existing Domestic Building Results – Draft 12/02/13 14 Capabilities on project: Building Engineering
Retail (EE1): Macroeconomic Costs (Low energy price, 4% discount rate, EUR/m²)
Package Value PE (KWh/m²)
Initial Investment
Cost
Annual Costs Cost of Emissions
Residual Value
Macro Cost Maintenance Energy
Wall U-Value 0.11 646 66 0 835 57 -21 937
Wall U-Value 0.15 (b) 647 55 0 836 58 -17 931
Wall U-Value 0.15 647 59 0 836 58 -19 934
Wall U-Value 0.2 648 50 0 837 58 -16 929
Wall U-Value 0.21 648 57 0 837 58 -18 933
Wall U-Value 0.27 649 54 0 838 58 -17 933
Wall U-Value 0.36 651 51 0 840 58 -16 932
Wall U-Value 0.47 653 48 0 842 58 -15 933
Roof U-value 0.14 648 0 0 836 58 0 894
Roof U-value 0.18 649 0 0 838 58 0 896
Roof U-value 0.29 654 0 0 844 58 0 902
Heating Source ASHP 558 41 13 730 48 0 833
Heating Source Gas CHP 620 132 99 817 56 0 1103
Heating Source Gas (91%) 646 11 15 834 57 0 918
Heating Source Gas (91%) + SHW 646 104 15 834 57 0 1010
Heating Source Gas (86%) 653 11 15 843 58 0 927
Floor U-value 0.25 652 12 0 843 58 -4 909
Floor U-value 0.2 652 14 0 843 58 -5 911
Floor U-value 0.15 653 18 0 844 58 -6 915
Floor U-value 0.1 653 26 0 845 58 -8 921
Window U-value 1.4 644 15 0 831 57 -2 901
Window U-value 1.1 644 19 0 831 57 -3 905
Window U-value 0.9 647 20 0 836 58 -3 910
Window U-value 1.8 653 13 0 843 58 -2 912
Chiller Efficiency 5.5 533 30 0 686 48 0 764
Chiller Efficiency 4.5 545 27 0 702 49 0 777
Chiller Efficiency 3.5 564 25 0 726 50 0 802
AHU SFP 1.8 641 19 0 826 57 0 902
AHU SFP 2 646 17 0 834 58 0 909
AHU SFP 2.2 652 16 0 842 58 0 916
Lighting Efficacy 65 490 6 0 627 44 0 678
Lighting Efficacy 60 498 5 0 638 45 0 689
Lighting Efficacy 55 508 5 0 651 46 0 702

AECOM Ireland Existing Domestic Building Results – Draft 12/02/13 15 Capabilities on project: Building Engineering
Retail (EE2): Macroeconomic Costs (Low energy price, 4% discount rate, EUR/m²)
Package Value PE (KWh/m²)
Initial Investment
Cost
Annual Costs Cost of Emissions
Residual Value
Macro Cost Maintenance Energy
Wall U-Value 0.11 501 66 0 644 45 -21 734
Wall U-Value 0.15 (b) 502 55 0 645 45 -17 727
Wall U-Value 0.15 502 59 0 645 45 -19 730
Wall U-Value 0.2 503 50 0 646 45 -16 725
Wall U-Value 0.21 503 57 0 646 45 -18 730
Wall U-Value 0.27 504 54 0 648 45 -17 730
Wall U-Value 0.36 506 51 0 650 46 -16 730
Wall U-Value 0.47 509 48 0 653 46 -15 731
Roof U-value 0.14 503 0 0 646 45 0 691
Roof U-value 0.18 505 0 0 648 45 0 694
Roof U-value 0.29 511 0 0 655 46 0 701
Heating Source ASHP 406 41 13 530 35 0 620
Heating Source Gas CHP 473 132 99 626 43 0 899
Heating Source Gas (91%) 502 11 15 645 45 0 716
Heating Source Gas (91%) + SHW 502 104 15 645 45 0 808
Heating Source Gas (86%) 510 11 15 654 46 0 726
Floor U-value 0.1 496 26 0 639 44 -8 701
Floor U-value 0.15 497 18 0 640 44 -6 697
Floor U-value 0.2 498 14 0 641 45 -5 695
Floor U-value 0.25 502 12 0 646 45 -4 699
Window U-value 1.1 502 19 0 644 45 -3 706
Window U-value 1.4 502 15 0 645 45 -2 703
Window U-value 0.9 504 20 0 647 45 -3 709
Window U-value 1.8 508 13 0 652 46 -2 709
Chiller Efficiency 5.5 461 30 0 590 42 0 662
Chiller Efficiency 4.5 470 27 0 603 43 0 672
Chiller Efficiency 3.5 485 25 0 622 44 0 690
AHU SFP 1.8 497 19 0 637 45 0 701
AHU SFP 2 503 17 0 645 45 0 707
AHU SFP 2.2 508 16 0 653 46 0 715
Lighting Efficacy 65 453 6 0 579 41 0 626
Lighting Efficacy 60 460 5 0 589 42 0 636
Lighting Efficacy 55 469 5 0 600 42 0 648

AECOM Ireland Existing Domestic Building Results – Draft 12/02/13 16 Capabilities on project: Building Engineering
Office (NV) (EE1): Macroeconomic Costs (Low energy price, 4% discount rate, EUR/m²)
Package Value PE (KWh/m²)
Initial Investment
Cost
Annual Costs Cost of Emissions
Residual Value
Macro Cost Maintenance Energy
Wall U-Value 0.1 340 69 0 423 33 -22 502
Wall U-Value 0.14 341 32 0 425 33 -10 479
Wall U-Value 0.16 342 62 0 425 33 -20 500
Wall U-Value 0.19 343 16 0 426 33 -5 470
Wall U-Value 0.21 343 28 0 427 33 -9 479
Wall U-Value 0.3 346 4 0 430 33 -1 466
Wall U-Value 0.39 348 12 0 433 33 -4 475
Roof U-value 0.15 334 17 0 416 32 -5 460
Roof U-value 0.2 336 16 0 419 32 -5 462
Roof U-value 0.25 338 13 0 421 32 -4 462
Heating Source GSHP 160 26 7 209 14 0 255
Heating Source Gas CHP 284 101 41 385 29 0 556
Heating Source Gas (91%) + SHW 316 56 8 395 30 0 489
Heating Source Gas (91%) 316 9 8 395 30 0 442
Heating Source Gas (86%) 330 9 8 411 31 0 459
Floor U-value 0.1 337 13 0 420 32 -4 461
Floor U-value 0.15 340 9 0 423 33 -3 461
Floor U-value 0.2 342 7 0 425 33 -2 463
Floor U-value 0.25 344 6 0 428 33 -2 465
Window U-value 0.9 303 92 0 379 29 -15 486
Window U-value 1.1 312 87 0 390 30 -14 492
Window U-value 1.8 315 57 0 393 30 -9 471
Window U-value 1.4 319 67 0 398 30 -11 485
Lighting Efficacy 65 288 28 0 351 29 0 408
Lighting Efficacy 60 292 23 0 356 29 0 408
Lighting Efficacy 55 295 23 0 360 29 0 412

AECOM Ireland Existing Domestic Building Results – Draft 12/02/13 17 Capabilities on project: Building Engineering
Office (NV) (EE2): Macroeconomic Costs (Low energy price, 4% discount rate, EUR/m²)
Package Value PE (KWh/m²)
Initial Investment
Cost
Annual Costs Cost of Emissions
Residual Value
Macro Cost Maintenance Energy
Wall U-Value 0.1 271 69 0 339 26 -22 412
Wall U-Value 0.14 272 32 0 340 26 -10 388
Wall U-Value 0.16 273 62 0 341 26 -20 409
Wall U-Value 0.19 274 16 0 342 26 -5 379
Wall U-Value 0.21 275 28 0 343 26 -9 388
Wall U-Value 0.3 277 4 0 346 26 -1 375
Wall U-Value 0.39 279 12 0 348 27 -4 383
Roof U-value 0.15 277 17 0 346 26 -5 384
Roof U-value 0.2 279 16 0 348 27 -5 385
Roof U-value 0.25 281 13 0 350 27 -4 386
Heating Source GSHP 136 26 7 178 12 0 222
Heating Source Gas CHP 242 101 41 328 25 0 495
Heating Source Gas (91%) + SHW 270 56 8 337 26 0 426
Heating Source Gas (91%) 270 9 8 337 26 0 380
Heating Source Gas (86%) 281 9 8 350 27 0 394
Floor U-value 0.1 267 13 0 334 25 -4 368
Floor U-value 0.15 269 9 0 336 26 -3 368
Floor U-value 0.2 271 7 0 339 26 -2 369
Floor U-value 0.25 273 6 0 341 26 -2 371
Window U-value 0.9 252 92 0 315 24 -15 417
Window U-value 1.1 259 87 0 325 25 -14 422
Window U-value 1.8 262 57 0 328 25 -9 401
Window U-value 1.4 266 67 0 332 25 -11 414
Lighting Efficacy 65 231 28 0 283 23 0 334
Lighting Efficacy 60 235 23 0 288 23 0 334
Lighting Efficacy 55 239 23 0 294 23 0 340

AECOM Ireland Existing Domestic Building Results – Draft 12/02/13 18 Capabilities on project: Building Engineering
Office (AC) (EE1): Macroeconomic Costs (Low energy price, 4% discount rate, EUR/m²)
Package Value PE (KWh/m²)
Initial Investment
Cost
Annual Costs Cost of Emissions
Residual Value
Macro Cost Maintenance Energy
Wall U-Value 0.11 401 75 0 509 37 -24 597
Wall U-Value 0.15 (b) 402 63 0 509 37 -20 590
Wall U-Value 0.15 402 67 0 509 37 -21 593
Wall U-Value 0.2 403 57 0 510 37 -18 587
Wall U-Value 0.21 403 65 0 511 37 -21 592
Wall U-Value 0.27 404 61 0 512 37 -19 591
Wall U-Value 0.36 406 58 0 514 38 -18 591
Wall U-Value 0.47 408 54 0 516 38 -17 591
Roof U-value 0.14 404 0 0 511 37 0 549
Roof U-value 0.18 405 0 0 513 38 0 550
Roof U-value 0.29 409 0 0 517 38 0 555
Heating Source GSHP 263 26 7 344 23 0 399
Heating Source Gas CHP 362 101 41 484 35 0 661
Heating Source Gas (91%) 406 9 8 514 38 0 569
Heating Source Gas (91%) + SHW 406 56 8 514 38 0 616
Heating Source Gas (86%) 418 9 8 528 39 0 584
Floor U-value 0.1 395 13 0 501 36 -4 546
Floor U-value 0.15 397 9 0 503 37 -3 546
Floor U-value 0.2 398 7 0 505 37 -2 547
Floor U-value 0.25 400 6 0 507 37 -2 548
Window U-value 1.1 377 87 0 477 35 -14 585
Window U-value 1.4 380 67 0 481 35 -11 573
Window U-value 0.9 383 92 0 485 35 -15 598
Window U-value 1.8 405 57 0 513 37 -9 598
Chiller Efficiency 5.5 342 26 0 430 32 0 488
Chiller Efficiency 4.5 349 23 0 440 33 0 495
Chiller Efficiency 3.5 361 21 0 455 34 0 510
AHU SFP 1.8 391 12 0 493 36 0 541
AHU SFP 2 395 11 0 500 37 0 547
AHU SFP 2.2 400 10 0 506 37 0 553
Lighting Efficacy 65 366 28 0 460 34 0 523
Lighting Efficacy 60 371 23 0 467 35 0 525
Lighting Efficacy 55 378 23 0 476 35 0 534

AECOM Ireland Existing Domestic Building Results – Draft 12/02/13 19 Capabilities on project: Building Engineering
Office (AC) (EE2): Macroeconomic Costs (Low energy price, 4% discount rate, EUR/m²)
Package Value PE (KWh/m²)
Initial Investment
Cost
Annual Costs Cost of Emissions
Residual Value
Macro Cost Maintenance Energy
Wall U-Value 0.11 305 75 0 390 28 -24 469
Wall U-Value 0.15 (b) 306 63 0 391 28 -20 462
Wall U-Value 0.15 306 67 0 391 28 -21 465
Wall U-Value 0.2 307 57 0 392 28 -18 459
Wall U-Value 0.21 307 65 0 392 28 -21 465
Wall U-Value 0.27 309 61 0 394 28 -19 464
Wall U-Value 0.36 311 58 0 396 28 -18 464
Wall U-Value 0.47 313 54 0 398 29 -17 464
Roof U-value 0.14 307 0 0 391 28 0 419
Roof U-value 0.18 308 0 0 393 28 0 421
Roof U-value 0.29 312 0 0 397 29 0 426
Heating Source GSHP 225 26 7 294 19 0 346
Heating Source Gas CHP 290 101 41 386 27 0 556
Heating Source Gas (91%) 319 9 8 406 29 0 453
Heating Source Gas (91%) + SHW 319 56 8 406 29 0 500
Heating Source Gas (86%) 327 9 8 416 30 0 463
Floor U-value 0.1 305 13 0 389 28 -4 426
Floor U-value 0.15 306 9 0 391 28 -3 425
Floor U-value 0.2 308 7 0 393 28 -2 426
Floor U-value 0.25 310 6 0 396 28 -2 428
Window U-value 1.1 276 87 0 352 25 -14 451
Window U-value 1.4 280 67 0 357 26 -11 439
Window U-value 0.9 282 92 0 361 25 -15 464
Window U-value 1.8 307 57 0 392 28 -9 468
Chiller Efficiency 5.5 250 26 0 317 23 0 366
Chiller Efficiency 4.5 257 23 0 326 24 0 373
Chiller Efficiency 3.5 268 21 0 341 25 0 386
AHU SFP 1.8 301 12 0 383 28 0 422
AHU SFP 2 306 11 0 389 28 0 428
AHU SFP 2.2 310 10 0 396 28 0 434
Lighting Efficacy 65 298 28 0 379 27 0 434
Lighting Efficacy 60 303 23 0 386 28 0 437
Lighting Efficacy 55 310 23 0 396 28 0 447

AECOM Ireland Existing Domestic Building Results – Draft 12/02/13 20 Capabilities on project: Building Engineering
Primary (EE1): Macroeconomic Costs (Low energy price, 4% discount rate, EUR/m²)
Package Value PE (KWh/m²)
Initial Investment
Cost
Annual Costs Cost of Emissions
Residual Value
Macro Cost Maintenance Energy
Wall U-Value 0.1 162 57 0 204 16 -9 268
Wall U-Value 0.14 164 27 0 206 16 -4 245
Wall U-Value 0.16 164 51 0 207 16 -8 266
Wall U-Value 0.19 166 13 0 208 17 -2 236
Wall U-Value 0.21 166 24 0 209 17 -4 246
Wall U-Value 0.3 170 3 0 214 17 -1 233
Wall U-Value 0.39 174 10 0 218 17 -2 244
Roof U-value 0.15 172 15 0 216 17 -2 246
Roof U-value 0.2 173 13 0 217 17 -2 245
Roof U-value 0.25 173 11 0 218 17 -2 244
Heating Source GSHP 62 30 13 85 6 0 133
Heating Source Gas CHP 140 62 56 238 15 0 371
Heating Source Gas (91%) + SHW 155 47 14 195 15 0 271
Heating Source Gas (91%) 155 8 14 195 15 0 232
Heating Source Gas (86%) 163 8 14 205 16 0 242
Floor U-value 0.1 158 11 0 199 16 -2 224
Floor U-value 0.15 161 8 0 202 16 -1 225
Floor U-value 0.2 163 6 0 205 16 -1 227
Floor U-value 0.25 166 5 0 208 17 -1 229
Window U-value 0.9 142 47 0 180 14 0 241
Window U-value 1.1 147 44 0 187 15 0 245
Window U-value 1.8 150 29 0 190 15 0 234
Window U-value 1.4 152 34 0 192 15 0 241
Lighting Efficacy 65 157 23 0 192 16 0 231
Lighting Efficacy 60 158 21 0 194 16 0 231
Lighting Efficacy 55 160 20 0 196 16 0 232

AECOM Ireland Existing Domestic Building Results – Draft 12/02/13 21 Capabilities on project: Building Engineering
Primary (EE2): Macroeconomic Costs (Low energy price, 4% discount rate, EUR/m²)
Package Value PE (KWh/m²)
Initial Investment
Cost
Annual Costs Cost of Emissions
Residual Value
Macro Cost Maintenance Energy
Wall U-Value 0.1 84 57 0 105 8 -9 162
Wall U-Value 0.14 86 27 0 107 9 -4 138
Wall U-Value 0.16 87 51 0 108 9 -8 160
Wall U-Value 0.19 88 13 0 109 9 -2 130
Wall U-Value 0.21 89 24 0 110 9 -4 139
Wall U-Value 0.3 92 3 0 115 9 -1 127
Wall U-Value 0.39 96 10 0 119 10 -2 137
Roof U-value 0.15 93 15 0 116 9 -2 137
Roof U-value 0.2 94 13 0 116 9 -2 137
Roof U-value 0.25 94 11 0 117 10 -2 136
Heating Source GSHP 27 30 13 37 3 0 82
Heating Source Gas CHP 82 62 56 144 9 0 271
Heating Source Gas (91%) + SHW 92 47 14 114 9 0 184
Heating Source Gas (91%) 92 8 14 114 9 0 145
Heating Source Gas (86%) 97 8 14 121 10 0 152
Floor U-value 0.1 87 11 0 108 9 -2 126
Floor U-value 0.15 89 8 0 111 9 -1 127
Floor U-value 0.2 92 6 0 114 9 -1 128
Floor U-value 0.25 94 5 0 117 10 -1 131
Window U-value 0.9 81 47 0 101 8 0 156
Window U-value 1.1 86 44 0 107 9 0 159
Window U-value 1.8 89 29 0 110 9 0 148
Window U-value 1.4 90 34 0 112 9 0 155
Lighting Efficacy 65 91 23 0 112 9 0 144
Lighting Efficacy 60 92 21 0 113 9 0 143
Lighting Efficacy 55 93 20 0 115 9 0 144

AECOM Ireland Existing Domestic Building Results – Draft 12/02/13 22 Capabilities on project: Building Engineering
Hotel (EE1): Macroeconomic Costs (Low energy price, 4% discount rate, EUR/m²)
Package Value PE (KWh/m²)
Initial Investment
Cost
Annual Costs Cost of Emissions
Residual Value
Macro Cost Maintenance Energy
Wall U-Value 0.1 566 94 0 705 54 -30 824
Wall U-Value 0.14 568 44 0 707 54 -14 791
Wall U-Value 0.16 568 84 0 707 54 -27 819
Wall U-Value 0.19 569 22 0 709 55 -7 778
Wall U-Value 0.21 570 39 0 709 55 -12 791
Wall U-Value 0.3 573 5 0 713 55 -2 772
Wall U-Value 0.39 576 17 0 717 55 -5 783
Roof U-value 0.15 576 10 0 716 55 -3 778
Roof U-value 0.2 577 9 0 717 55 -3 779
Roof U-value 0.25 578 7 0 719 55 -2 780
Heating Source GSHP 457 29 10 575 43 0 657
Heating Source Gas CHP 542 74 48 695 53 0 870
Heating Source Gas (91%) + SHW 563 35 10 701 54 0 801
Heating Source Gas (91%) 576 8 10 717 55 0 790
Heating Source Gas (86%) 586 8 10 729 56 0 803
Floor U-value 0.1 570 7 0 709 55 -2 769
Floor U-value 0.15 571 5 0 711 55 -2 769
Floor U-value 0.2 572 4 0 712 55 -1 770
Floor U-value 0.25 573 3 0 713 55 -1 771
Window U-value 1.1 547 87 0 681 52 -14 807
Window U-value 0.9 548 93 0 683 52 -15 814
Window U-value 1.4 550 68 0 685 53 -11 795
Window U-value 1.8 563 58 0 702 54 -9 805
Chiller Efficiency 5.5 546 31 0 677 53 0 760
Chiller Efficiency 4.5 549 27 0 681 53 0 761
Chiller Efficiency 3.5 554 25 0 687 53 0 766
AHU SFP 1.8 558 10 0 692 54 0 757
AHU SFP 2 564 10 0 700 54 0 764
AHU SFP 2.2 569 9 0 708 55 0 771
Lighting Efficacy 65 489 51 0 598 48 0 697
Lighting Efficacy 60 491 46 0 600 49 0 694
Lighting Efficacy 55 493 39 0 603 49 0 691
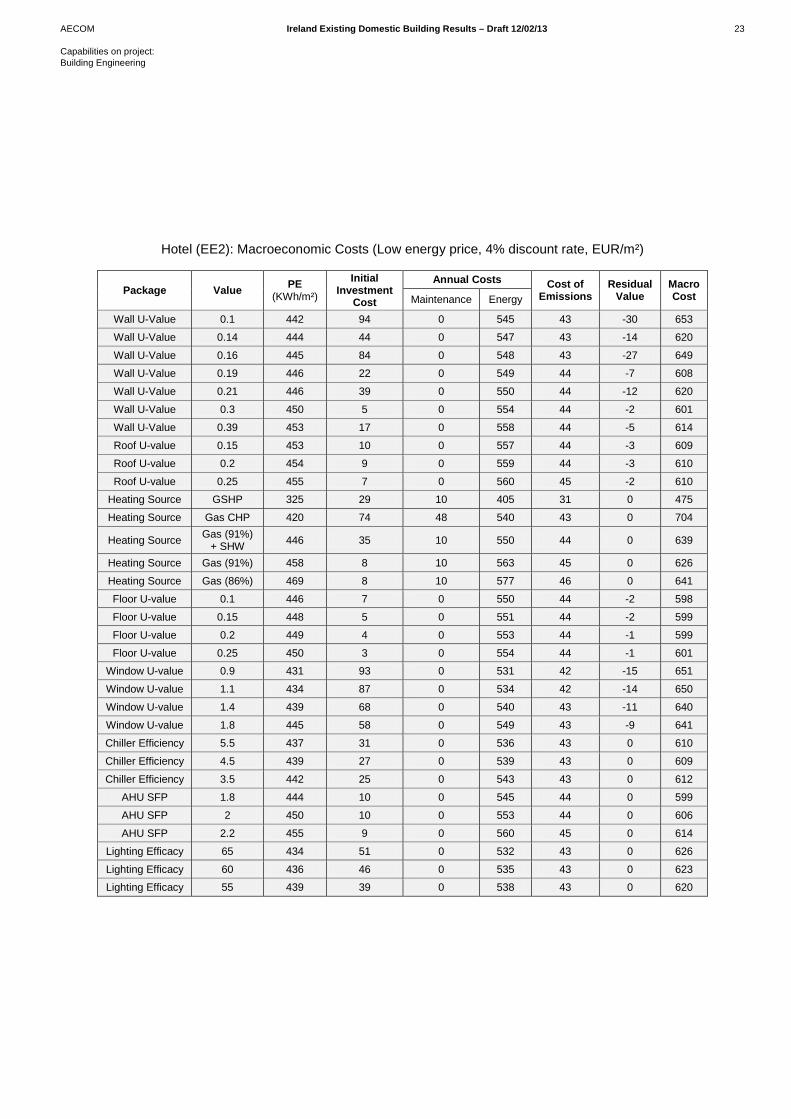
AECOM Ireland Existing Domestic Building Results – Draft 12/02/13 23 Capabilities on project: Building Engineering
Hotel (EE2): Macroeconomic Costs (Low energy price, 4% discount rate, EUR/m²)
Package Value PE (KWh/m²)
Initial Investment
Cost
Annual Costs Cost of Emissions
Residual Value
Macro Cost Maintenance Energy
Wall U-Value 0.1 442 94 0 545 43 -30 653
Wall U-Value 0.14 444 44 0 547 43 -14 620
Wall U-Value 0.16 445 84 0 548 43 -27 649
Wall U-Value 0.19 446 22 0 549 44 -7 608
Wall U-Value 0.21 446 39 0 550 44 -12 620
Wall U-Value 0.3 450 5 0 554 44 -2 601
Wall U-Value 0.39 453 17 0 558 44 -5 614
Roof U-value 0.15 453 10 0 557 44 -3 609
Roof U-value 0.2 454 9 0 559 44 -3 610
Roof U-value 0.25 455 7 0 560 45 -2 610
Heating Source GSHP 325 29 10 405 31 0 475
Heating Source Gas CHP 420 74 48 540 43 0 704
Heating Source Gas (91%) + SHW 446 35 10 550 44 0 639
Heating Source Gas (91%) 458 8 10 563 45 0 626
Heating Source Gas (86%) 469 8 10 577 46 0 641
Floor U-value 0.1 446 7 0 550 44 -2 598
Floor U-value 0.15 448 5 0 551 44 -2 599
Floor U-value 0.2 449 4 0 553 44 -1 599
Floor U-value 0.25 450 3 0 554 44 -1 601
Window U-value 0.9 431 93 0 531 42 -15 651
Window U-value 1.1 434 87 0 534 42 -14 650
Window U-value 1.4 439 68 0 540 43 -11 640
Window U-value 1.8 445 58 0 549 43 -9 641
Chiller Efficiency 5.5 437 31 0 536 43 0 610
Chiller Efficiency 4.5 439 27 0 539 43 0 609
Chiller Efficiency 3.5 442 25 0 543 43 0 612
AHU SFP 1.8 444 10 0 545 44 0 599
AHU SFP 2 450 10 0 553 44 0 606
AHU SFP 2.2 455 9 0 560 45 0 614
Lighting Efficacy 65 434 51 0 532 43 0 626
Lighting Efficacy 60 436 46 0 535 43 0 623
Lighting Efficacy 55 439 39 0 538 43 0 620

AECOM Ireland Existing Domestic Building Results – Draft 12/02/13 24 Capabilities on project: Building Engineering
Table C: Macroeconomic Costs High energy price 4% discount rate
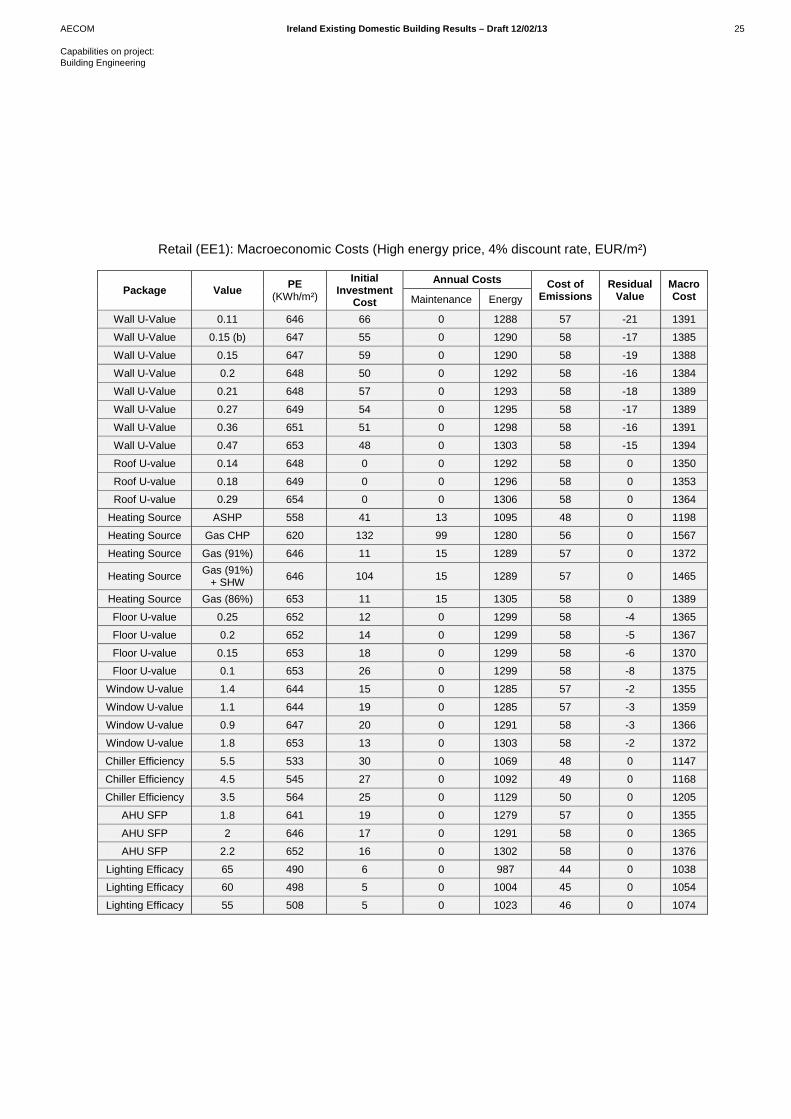
AECOM Ireland Existing Domestic Building Results – Draft 12/02/13 25 Capabilities on project: Building Engineering
Retail (EE1): Macroeconomic Costs (High energy price, 4% discount rate, EUR/m²)
Package Value PE (KWh/m²)
Initial Investment
Cost
Annual Costs Cost of Emissions
Residual Value
Macro Cost Maintenance Energy
Wall U-Value 0.11 646 66 0 1288 57 -21 1391
Wall U-Value 0.15 (b) 647 55 0 1290 58 -17 1385
Wall U-Value 0.15 647 59 0 1290 58 -19 1388
Wall U-Value 0.2 648 50 0 1292 58 -16 1384
Wall U-Value 0.21 648 57 0 1293 58 -18 1389
Wall U-Value 0.27 649 54 0 1295 58 -17 1389
Wall U-Value 0.36 651 51 0 1298 58 -16 1391
Wall U-Value 0.47 653 48 0 1303 58 -15 1394
Roof U-value 0.14 648 0 0 1292 58 0 1350
Roof U-value 0.18 649 0 0 1296 58 0 1353
Roof U-value 0.29 654 0 0 1306 58 0 1364
Heating Source ASHP 558 41 13 1095 48 0 1198
Heating Source Gas CHP 620 132 99 1280 56 0 1567
Heating Source Gas (91%) 646 11 15 1289 57 0 1372
Heating Source Gas (91%) + SHW 646 104 15 1289 57 0 1465
Heating Source Gas (86%) 653 11 15 1305 58 0 1389
Floor U-value 0.25 652 12 0 1299 58 -4 1365
Floor U-value 0.2 652 14 0 1299 58 -5 1367
Floor U-value 0.15 653 18 0 1299 58 -6 1370
Floor U-value 0.1 653 26 0 1299 58 -8 1375
Window U-value 1.4 644 15 0 1285 57 -2 1355
Window U-value 1.1 644 19 0 1285 57 -3 1359
Window U-value 0.9 647 20 0 1291 58 -3 1366
Window U-value 1.8 653 13 0 1303 58 -2 1372
Chiller Efficiency 5.5 533 30 0 1069 48 0 1147
Chiller Efficiency 4.5 545 27 0 1092 49 0 1168
Chiller Efficiency 3.5 564 25 0 1129 50 0 1205
AHU SFP 1.8 641 19 0 1279 57 0 1355
AHU SFP 2 646 17 0 1291 58 0 1365
AHU SFP 2.2 652 16 0 1302 58 0 1376
Lighting Efficacy 65 490 6 0 987 44 0 1038
Lighting Efficacy 60 498 5 0 1004 45 0 1054
Lighting Efficacy 55 508 5 0 1023 46 0 1074

AECOM Ireland Existing Domestic Building Results – Draft 12/02/13 26 Capabilities on project: Building Engineering
Retail (EE2): Macroeconomic Costs (High energy price, 4% discount rate, EUR/m²)
Package Value PE (KWh/m²)
Initial Investment
Cost
Annual Costs Cost of Emissions
Residual Value
Macro Cost Maintenance Energy
Wall U-Value 0.11 501 66 0 1005 45 -21 1095
Wall U-Value 0.15 (b) 502 55 0 1007 45 -17 1090
Wall U-Value 0.15 502 59 0 1007 45 -19 1093
Wall U-Value 0.2 503 50 0 1010 45 -16 1089
Wall U-Value 0.21 503 57 0 1010 45 -18 1094
Wall U-Value 0.27 504 54 0 1013 45 -17 1095
Wall U-Value 0.36 506 51 0 1018 46 -16 1098
Wall U-Value 0.47 509 48 0 1023 46 -15 1102
Roof U-value 0.14 503 0 0 1010 45 0 1055
Roof U-value 0.18 505 0 0 1014 45 0 1060
Roof U-value 0.29 511 0 0 1027 46 0 1073
Heating Source ASHP 406 41 13 795 35 0 885
Heating Source Gas CHP 473 132 99 998 43 0 1272
Heating Source Gas (91%) 502 11 15 1008 45 0 1079
Heating Source Gas (91%) + SHW 502 104 15 1008 45 0 1171
Heating Source Gas (86%) 510 11 15 1025 46 0 1097
Floor U-value 0.1 496 26 0 992 44 -8 1054
Floor U-value 0.15 497 18 0 994 44 -6 1052
Floor U-value 0.2 498 14 0 997 45 -5 1052
Floor U-value 0.25 502 12 0 1007 45 -4 1061
Window U-value 1.1 502 19 0 1010 45 -3 1071
Window U-value 1.4 502 15 0 1010 45 -2 1068
Window U-value 0.9 504 20 0 1012 45 -3 1075
Window U-value 1.8 508 13 0 1021 46 -2 1078
Chiller Efficiency 5.5 461 30 0 929 42 0 1001
Chiller Efficiency 4.5 470 27 0 948 43 0 1017
Chiller Efficiency 3.5 485 25 0 976 44 0 1045
AHU SFP 1.8 497 19 0 1000 45 0 1063
AHU SFP 2 503 17 0 1011 45 0 1073
AHU SFP 2.2 508 16 0 1022 46 0 1084
Lighting Efficacy 65 453 6 0 915 41 0 962
Lighting Efficacy 60 460 5 0 929 42 0 976
Lighting Efficacy 55 469 5 0 946 42 0 993

AECOM Ireland Existing Domestic Building Results – Draft 12/02/13 27 Capabilities on project: Building Engineering
Office (NV) (EE1): Macroeconomic Costs (High energy price, 4% discount rate, EUR/m²)
Package Value PE (KWh/m²)
Initial Investment
Cost
Annual Costs Cost of Emissions
Residual Value
Macro Cost Maintenance Energy
Wall U-Value 0.1 340 69 0 711 33 -22 790
Wall U-Value 0.14 341 32 0 714 33 -10 769
Wall U-Value 0.16 342 62 0 715 33 -20 790
Wall U-Value 0.19 343 16 0 717 33 -5 761
Wall U-Value 0.21 343 28 0 718 33 -9 771
Wall U-Value 0.3 346 4 0 724 33 -1 759
Wall U-Value 0.39 348 12 0 729 33 -4 771
Roof U-value 0.15 334 17 0 698 32 -5 742
Roof U-value 0.2 336 16 0 703 32 -5 746
Roof U-value 0.25 338 13 0 707 32 -4 748
Heating Source GSHP 160 26 7 313 14 0 359
Heating Source Gas CHP 284 101 41 689 29 0 860
Heating Source Gas (91%) + SHW 316 56 8 659 30 0 753
Heating Source Gas (91%) 316 9 8 659 30 0 706
Heating Source Gas (86%) 330 9 8 688 31 0 737
Floor U-value 0.1 337 13 0 706 32 -4 747
Floor U-value 0.15 340 9 0 710 33 -3 749
Floor U-value 0.2 342 7 0 715 33 -2 753
Floor U-value 0.25 344 6 0 720 33 -2 757
Window U-value 0.9 303 92 0 630 29 -15 736
Window U-value 1.1 312 87 0 649 30 -14 752
Window U-value 1.8 315 57 0 655 30 -9 733
Window U-value 1.4 319 67 0 664 30 -11 751
Lighting Efficacy 65 288 28 0 619 29 0 676
Lighting Efficacy 60 292 23 0 625 29 0 677
Lighting Efficacy 55 295 23 0 631 29 0 683

AECOM Ireland Existing Domestic Building Results – Draft 12/02/13 28 Capabilities on project: Building Engineering
Office (NV) (EE2): Macroeconomic Costs (High energy price, 4% discount rate, EUR/m²)
Package Value PE (KWh/m²)
Initial Investment
Cost
Annual Costs Cost of Emissions
Residual Value
Macro Cost Maintenance Energy
Wall U-Value 0.1 271 69 0 565 26 -22 638
Wall U-Value 0.14 272 32 0 568 26 -10 616
Wall U-Value 0.16 273 62 0 570 26 -20 638
Wall U-Value 0.19 274 16 0 572 26 -5 609
Wall U-Value 0.21 275 28 0 573 26 -9 619
Wall U-Value 0.3 277 4 0 579 26 -1 608
Wall U-Value 0.39 279 12 0 583 27 -4 618
Roof U-value 0.15 277 17 0 578 26 -5 617
Roof U-value 0.2 279 16 0 582 27 -5 620
Roof U-value 0.25 281 13 0 587 27 -4 622
Heating Source GSHP 136 26 7 266 12 0 311
Heating Source Gas CHP 242 101 41 587 25 0 754
Heating Source Gas (91%) + SHW 270 56 8 562 26 0 652
Heating Source Gas (91%) 270 9 8 562 26 0 605
Heating Source Gas (86%) 281 9 8 587 27 0 631
Floor U-value 0.1 267 13 0 556 25 -4 590
Floor U-value 0.15 269 9 0 561 26 -3 593
Floor U-value 0.2 271 7 0 566 26 -2 596
Floor U-value 0.25 273 6 0 570 26 -2 600
Window U-value 0.9 252 92 0 522 24 -15 624
Window U-value 1.1 259 87 0 539 25 -14 637
Window U-value 1.8 262 57 0 546 25 -9 619
Window U-value 1.4 266 67 0 553 25 -11 635
Lighting Efficacy 65 231 28 0 493 23 0 544
Lighting Efficacy 60 235 23 0 499 23 0 545
Lighting Efficacy 55 239 23 0 507 23 0 553

AECOM Ireland Existing Domestic Building Results – Draft 12/02/13 29 Capabilities on project: Building Engineering
Office (AC) (EE1): Macroeconomic Costs (High energy price, 4% discount rate, EUR/m²)
Package Value PE (KWh/m²)
Initial Investment
Cost
Annual Costs Cost of Emissions
Residual Value
Macro Cost Maintenance Energy
Wall U-Value 0.11 401 75 0 821 37 -24 909
Wall U-Value 0.15 (b) 402 63 0 822 37 -20 902
Wall U-Value 0.15 402 67 0 822 37 -21 905
Wall U-Value 0.2 403 57 0 824 37 -18 901
Wall U-Value 0.21 403 65 0 825 37 -21 906
Wall U-Value 0.27 404 61 0 827 37 -19 906
Wall U-Value 0.36 406 58 0 831 38 -18 908
Wall U-Value 0.47 408 54 0 835 38 -17 910
Roof U-value 0.14 404 0 0 827 37 0 864
Roof U-value 0.18 405 0 0 829 38 0 867
Roof U-value 0.29 409 0 0 837 38 0 875
Heating Source GSHP 263 26 7 516 23 0 571
Heating Source Gas CHP 362 101 41 815 35 0 992
Heating Source Gas (91%) 406 9 8 832 38 0 887
Heating Source Gas (91%) + SHW 406 56 8 832 38 0 934
Heating Source Gas (86%) 418 9 8 858 39 0 915
Floor U-value 0.1 395 13 0 807 36 -4 852
Floor U-value 0.15 397 9 0 810 37 -3 853
Floor U-value 0.2 398 7 0 814 37 -2 856
Floor U-value 0.25 400 6 0 818 37 -2 859
Window U-value 1.1 377 87 0 773 35 -14 881
Window U-value 1.4 380 67 0 781 35 -11 873
Window U-value 0.9 383 92 0 782 35 -15 895
Window U-value 1.8 405 57 0 827 37 -9 913
Chiller Efficiency 5.5 342 26 0 706 32 0 764
Chiller Efficiency 4.5 349 23 0 721 33 0 776
Chiller Efficiency 3.5 361 21 0 743 34 0 798
AHU SFP 1.8 391 12 0 801 36 0 849
AHU SFP 2 395 11 0 811 37 0 858
AHU SFP 2.2 400 10 0 820 37 0 868
Lighting Efficacy 65 366 28 0 755 34 0 817
Lighting Efficacy 60 371 23 0 765 35 0 823
Lighting Efficacy 55 378 23 0 777 35 0 835

AECOM Ireland Existing Domestic Building Results – Draft 12/02/13 30 Capabilities on project: Building Engineering
Office (AC) (EE2): Macroeconomic Costs (High energy price, 4% discount rate, EUR/m²)
Package Value PE (KWh/m²)
Initial Investment
Cost
Annual Costs Cost of Emissions
Residual Value
Macro Cost Maintenance Energy
Wall U-Value 0.11 305 75 0 618 28 -24 697
Wall U-Value 0.15 (b) 306 63 0 620 28 -20 691
Wall U-Value 0.15 306 67 0 620 28 -21 694
Wall U-Value 0.2 307 57 0 623 28 -18 690
Wall U-Value 0.21 307 65 0 623 28 -21 695
Wall U-Value 0.27 309 61 0 626 28 -19 696
Wall U-Value 0.36 311 58 0 630 28 -18 698
Wall U-Value 0.47 313 54 0 635 29 -17 701
Roof U-value 0.14 307 0 0 621 28 0 649
Roof U-value 0.18 308 0 0 625 28 0 653
Roof U-value 0.29 312 0 0 633 29 0 661
Heating Source GSHP 225 26 7 440 19 0 493
Heating Source Gas CHP 290 101 41 638 27 0 807
Heating Source Gas (91%) 319 9 8 650 29 0 696
Heating Source Gas (91%) + SHW 319 56 8 650 29 0 743
Heating Source Gas (86%) 327 9 8 667 30 0 714
Floor U-value 0.1 305 13 0 617 28 -4 654
Floor U-value 0.15 306 9 0 621 28 -3 655
Floor U-value 0.2 308 7 0 625 28 -2 658
Floor U-value 0.25 310 6 0 630 28 -2 662
Window U-value 1.1 276 87 0 559 25 -14 657
Window U-value 1.4 280 67 0 569 26 -11 651
Window U-value 0.9 282 92 0 567 25 -15 671
Window U-value 1.8 307 57 0 621 28 -9 697
Chiller Efficiency 5.5 250 26 0 512 23 0 561
Chiller Efficiency 4.5 257 23 0 526 24 0 572
Chiller Efficiency 3.5 268 21 0 547 25 0 593
AHU SFP 1.8 301 12 0 611 28 0 650
AHU SFP 2 306 11 0 620 28 0 659
AHU SFP 2.2 310 10 0 630 28 0 668
Lighting Efficacy 65 298 28 0 605 27 0 660
Lighting Efficacy 60 303 23 0 616 28 0 667
Lighting Efficacy 55 310 23 0 630 28 0 681

AECOM Ireland Existing Domestic Building Results – Draft 12/02/13 31 Capabilities on project: Building Engineering
Primary (EE1): Macroeconomic Costs (High energy price, 4% discount rate, EUR/m²)
Package Value PE (KWh/m²)
Initial Investment
Cost
Annual Costs Cost of Emissions
Residual Value
Macro Cost Maintenance Energy
Wall U-Value 0.1 162 57 0 350 16 -9 414
Wall U-Value 0.14 164 27 0 354 16 -4 393
Wall U-Value 0.16 164 51 0 356 16 -8 415
Wall U-Value 0.19 166 13 0 358 17 -2 386
Wall U-Value 0.21 166 24 0 360 17 -4 397
Wall U-Value 0.3 170 3 0 368 17 -1 388
Wall U-Value 0.39 174 10 0 376 17 -2 402
Roof U-value 0.15 172 15 0 373 17 -2 403
Roof U-value 0.2 173 13 0 375 17 -2 403
Roof U-value 0.25 173 11 0 376 17 -2 402
Heating Source GSHP 62 30 13 129 6 0 178
Heating Source Gas CHP 140 62 56 425 15 0 558
Heating Source Gas (91%) + SHW 155 47 14 335 15 0 411
Heating Source Gas (91%) 155 8 14 335 15 0 371
Heating Source Gas (86%) 163 8 14 352 16 0 389
Floor U-value 0.1 158 11 0 342 16 -2 367
Floor U-value 0.15 161 8 0 348 16 -1 370
Floor U-value 0.2 163 6 0 353 16 -1 375
Floor U-value 0.25 166 5 0 359 17 -1 380
Window U-value 0.9 142 47 0 306 14 0 367
Window U-value 1.1 147 44 0 318 15 0 376
Window U-value 1.8 150 29 0 324 15 0 368
Window U-value 1.4 152 34 0 328 15 0 377
Lighting Efficacy 65 157 23 0 343 16 0 382
Lighting Efficacy 60 158 21 0 345 16 0 382
Lighting Efficacy 55 160 20 0 349 16 0 384

AECOM Ireland Existing Domestic Building Results – Draft 12/02/13 32 Capabilities on project: Building Engineering
Primary (EE2): Macroeconomic Costs (High energy price, 4% discount rate, EUR/m²)
Package Value PE (KWh/m²)
Initial Investment
Cost
Annual Costs Cost of Emissions
Residual Value
Macro Cost Maintenance Energy
Wall U-Value 0.1 84 57 0 183 8 -9 240
Wall U-Value 0.14 86 27 0 187 9 -4 218
Wall U-Value 0.16 87 51 0 189 9 -8 240
Wall U-Value 0.19 88 13 0 191 9 -2 211
Wall U-Value 0.21 89 24 0 193 9 -4 222
Wall U-Value 0.3 92 3 0 201 9 -1 213
Wall U-Value 0.39 96 10 0 209 10 -2 227
Roof U-value 0.15 93 15 0 203 9 -2 225
Roof U-value 0.2 94 13 0 204 9 -2 225
Roof U-value 0.25 94 11 0 205 10 -2 224
Heating Source GSHP 27 30 13 58 3 0 103
Heating Source Gas CHP 82 62 56 263 9 0 390
Heating Source Gas (91%) + SHW 92 47 14 200 9 0 270
Heating Source Gas (91%) 92 8 14 200 9 0 231
Heating Source Gas (86%) 97 8 14 212 10 0 243
Floor U-value 0.1 87 11 0 189 9 -2 207
Floor U-value 0.15 89 8 0 194 9 -1 210
Floor U-value 0.2 92 6 0 200 9 -1 214
Floor U-value 0.25 94 5 0 205 10 -1 219
Window U-value 0.9 81 47 0 176 8 0 230
Window U-value 1.1 86 44 0 187 9 0 239
Window U-value 1.8 89 29 0 193 9 0 231
Window U-value 1.4 90 34 0 196 9 0 239
Lighting Efficacy 65 91 23 0 199 9 0 231
Lighting Efficacy 60 92 21 0 200 9 0 230
Lighting Efficacy 55 93 20 0 203 9 0 232

AECOM Ireland Existing Domestic Building Results – Draft 12/02/13 33 Capabilities on project: Building Engineering
Hotel (EE1): Macroeconomic Costs (High energy price, 4% discount rate, EUR/m²)
Package Value PE (KWh/m²)
Initial Investment
Cost
Annual Costs Cost of Emissions
Residual Value
Macro Cost Maintenance Energy
Wall U-Value 0.1 566 94 0 1183 54 -30 1302
Wall U-Value 0.14 568 44 0 1186 54 -14 1271
Wall U-Value 0.16 568 84 0 1188 54 -27 1300
Wall U-Value 0.19 569 22 0 1190 55 -7 1260
Wall U-Value 0.21 570 39 0 1192 55 -12 1273
Wall U-Value 0.3 573 5 0 1199 55 -2 1257
Wall U-Value 0.39 576 17 0 1206 55 -5 1272
Roof U-value 0.15 576 10 0 1205 55 -3 1267
Roof U-value 0.2 577 9 0 1208 55 -3 1269
Roof U-value 0.25 578 7 0 1210 55 -2 1271
Heating Source GSHP 457 29 10 943 43 0 1025
Heating Source Gas CHP 542 74 48 1200 53 0 1375
Heating Source Gas (91%) + SHW 563 35 10 1177 54 0 1276
Heating Source Gas (91%) 576 8 10 1206 55 0 1279
Heating Source Gas (86%) 586 8 10 1228 56 0 1302
Floor U-value 0.1 570 7 0 1192 55 -2 1252
Floor U-value 0.15 571 5 0 1194 55 -2 1253
Floor U-value 0.2 572 4 0 1197 55 -1 1255
Floor U-value 0.25 573 3 0 1200 55 -1 1257
Window U-value 1.1 547 87 0 1142 52 -14 1268
Window U-value 0.9 548 93 0 1142 52 -15 1272
Window U-value 1.4 550 68 0 1151 53 -11 1260
Window U-value 1.8 563 58 0 1174 54 -9 1277
Chiller Efficiency 5.5 546 31 0 1147 53 0 1230
Chiller Efficiency 4.5 549 27 0 1153 53 0 1233
Chiller Efficiency 3.5 554 25 0 1163 53 0 1241
AHU SFP 1.8 558 10 0 1170 54 0 1234
AHU SFP 2 564 10 0 1182 54 0 1245
AHU SFP 2.2 569 9 0 1193 55 0 1257
Lighting Efficacy 65 489 51 0 1044 48 0 1144
Lighting Efficacy 60 491 46 0 1048 49 0 1142
Lighting Efficacy 55 493 39 0 1052 49 0 1140

AECOM Ireland Existing Domestic Building Results – Draft 12/02/13 34 Capabilities on project: Building Engineering
Hotel (EE2): Macroeconomic Costs (High energy price, 4% discount rate, EUR/m²)
Package Value PE (KWh/m²)
Initial Investment
Cost
Annual Costs Cost of Emissions
Residual Value
Macro Cost Maintenance Energy
Wall U-Value 0.1 442 94 0 936 43 -30 1043
Wall U-Value 0.14 444 44 0 939 43 -14 1013
Wall U-Value 0.16 445 84 0 941 43 -27 1042
Wall U-Value 0.19 446 22 0 943 44 -7 1002
Wall U-Value 0.21 446 39 0 945 44 -12 1015
Wall U-Value 0.3 450 5 0 952 44 -2 1000
Wall U-Value 0.39 453 17 0 960 44 -5 1016
Roof U-value 0.15 453 10 0 959 44 -3 1011
Roof U-value 0.2 454 9 0 962 44 -3 1013
Roof U-value 0.25 455 7 0 965 45 -2 1015
Heating Source GSHP 325 29 10 677 31 0 747
Heating Source Gas CHP 420 74 48 964 43 0 1128
Heating Source Gas (91%) + SHW 446 35 10 945 44 0 1035
Heating Source Gas (91%) 458 8 10 971 45 0 1033
Heating Source Gas (86%) 469 8 10 995 46 0 1059
Floor U-value 0.1 446 7 0 945 44 -2 994
Floor U-value 0.15 448 5 0 948 44 -2 995
Floor U-value 0.2 449 4 0 950 44 -1 997
Floor U-value 0.25 450 3 0 953 44 -1 1000
Window U-value 0.9 431 93 0 911 42 -15 1031
Window U-value 1.1 434 87 0 919 42 -14 1035
Window U-value 1.4 439 68 0 931 43 -11 1031
Window U-value 1.8 445 58 0 941 43 -9 1034
Chiller Efficiency 5.5 437 31 0 929 43 0 1003
Chiller Efficiency 4.5 439 27 0 933 43 0 1003
Chiller Efficiency 3.5 442 25 0 939 43 0 1008
AHU SFP 1.8 444 10 0 942 44 0 996
AHU SFP 2 450 10 0 953 44 0 1007
AHU SFP 2.2 455 9 0 965 45 0 1019
Lighting Efficacy 65 434 51 0 927 43 0 1020
Lighting Efficacy 60 436 46 0 930 43 0 1019
Lighting Efficacy 55 439 39 0 934 43 0 1017

AECOM Ireland Existing Domestic Building Results – Draft 12/02/13 35 Capabilities on project: Building Engineering
Table D: Macroeconomic Costs Central energy price 3% discount rate

AECOM Ireland Existing Domestic Building Results – Draft 12/02/13 36 Capabilities on project: Building Engineering
Retail (EE1): Macroeconomic Costs (Central energy price, 3% discount rate, EUR/m²)
Package Value PE (KWh/m²)
Initial Investment
Cost
Annual Costs Cost of Emissions
Residual Value
Macro Cost Maintenance Energy
Wall U-Value 0.11 646 66 0 1199 66 -25 1305
Wall U-Value 0.15 (b) 647 55 0 1200 66 -21 1300
Wall U-Value 0.15 647 59 0 1200 66 -22 1303
Wall U-Value 0.2 648 50 0 1202 66 -19 1299
Wall U-Value 0.21 648 57 0 1202 66 -22 1304
Wall U-Value 0.27 649 54 0 1204 66 -20 1304
Wall U-Value 0.36 651 51 0 1207 66 -19 1305
Wall U-Value 0.47 653 48 0 1211 67 -18 1307
Roof U-value 0.14 648 0 0 1202 66 0 1268
Roof U-value 0.18 649 0 0 1205 66 0 1271
Roof U-value 0.29 654 0 0 1214 67 0 1281
Heating Source ASHP 558 41 14 1028 55 0 1139
Heating Source Gas CHP 620 132 108 1185 64 0 1489
Heating Source Gas (91%) 646 11 16 1199 66 0 1292
Heating Source Gas (91%) + SHW 646 104 16 1199 66 0 1384
Heating Source Gas (86%) 653 11 16 1213 67 0 1307
Floor U-value 0.25 652 12 0 1209 66 -5 1283
Floor U-value 0.2 652 14 0 1209 66 -5 1285
Floor U-value 0.15 653 18 0 1210 66 -7 1288
Floor U-value 0.1 653 26 0 1211 66 -10 1293
Window U-value 1.4 644 15 0 1195 66 -3 1273
Window U-value 1.1 644 19 0 1195 66 -4 1276
Window U-value 0.9 647 20 0 1201 66 -4 1284
Window U-value 1.8 653 13 0 1212 67 -2 1288
Chiller Efficiency 5.5 533 30 0 991 55 0 1076
Chiller Efficiency 4.5 545 27 0 1013 56 0 1096
Chiller Efficiency 3.5 564 25 0 1048 58 0 1131
AHU SFP 1.8 641 19 0 1189 65 0 1273
AHU SFP 2 646 17 0 1200 66 0 1283
AHU SFP 2.2 652 16 0 1211 67 0 1293
Lighting Efficacy 65 490 6 0 913 51 0 970
Lighting Efficacy 60 498 5 0 928 52 0 985
Lighting Efficacy 55 508 5 0 946 53 0 1004

AECOM Ireland Existing Domestic Building Results – Draft 12/02/13 37 Capabilities on project: Building Engineering
Retail (EE2): Macroeconomic Costs (Central energy price, 3% discount rate, EUR/m²)
Package Value PE (KWh/m²)
Initial Investment
Cost
Annual Costs Cost of Emissions
Residual Value
Macro Cost Maintenance Energy
Wall U-Value 0.11 501 66 0 932 52 -25 1024
Wall U-Value 0.15 (b) 502 55 0 933 52 -21 1019
Wall U-Value 0.15 502 59 0 933 52 -22 1022
Wall U-Value 0.2 503 50 0 936 52 -19 1019
Wall U-Value 0.21 503 57 0 936 52 -22 1023
Wall U-Value 0.27 504 54 0 939 52 -20 1024
Wall U-Value 0.36 506 51 0 943 52 -19 1026
Wall U-Value 0.47 509 48 0 948 53 -18 1030
Roof U-value 0.14 503 0 0 936 52 0 987
Roof U-value 0.18 505 0 0 940 52 0 992
Roof U-value 0.29 511 0 0 951 53 0 1004
Heating Source ASHP 406 41 14 747 40 0 843
Heating Source Gas CHP 473 132 108 919 50 0 1208
Heating Source Gas (91%) 502 11 16 934 52 0 1013
Heating Source Gas (91%) + SHW 502 104 16 934 52 0 1105
Heating Source Gas (86%) 510 11 16 949 53 0 1029
Floor U-value 0.1 496 26 0 921 51 -10 988
Floor U-value 0.15 497 18 0 923 51 -7 986
Floor U-value 0.2 498 14 0 925 51 -5 985
Floor U-value 0.25 502 12 0 934 52 -5 993
Window U-value 1.1 502 19 0 935 52 -4 1002
Window U-value 1.4 502 15 0 936 52 -3 1000
Window U-value 0.9 504 20 0 938 52 -4 1006
Window U-value 1.8 508 13 0 946 52 -2 1009
Chiller Efficiency 5.5 461 30 0 859 48 0 937
Chiller Efficiency 4.5 470 27 0 876 49 0 952
Chiller Efficiency 3.5 485 25 0 903 50 0 978
AHU SFP 1.8 497 19 0 925 51 0 995
AHU SFP 2 503 17 0 936 52 0 1005
AHU SFP 2.2 508 16 0 947 53 0 1015
Lighting Efficacy 65 453 6 0 845 47 0 898
Lighting Efficacy 60 460 5 0 858 48 0 912
Lighting Efficacy 55 469 5 0 874 49 0 928
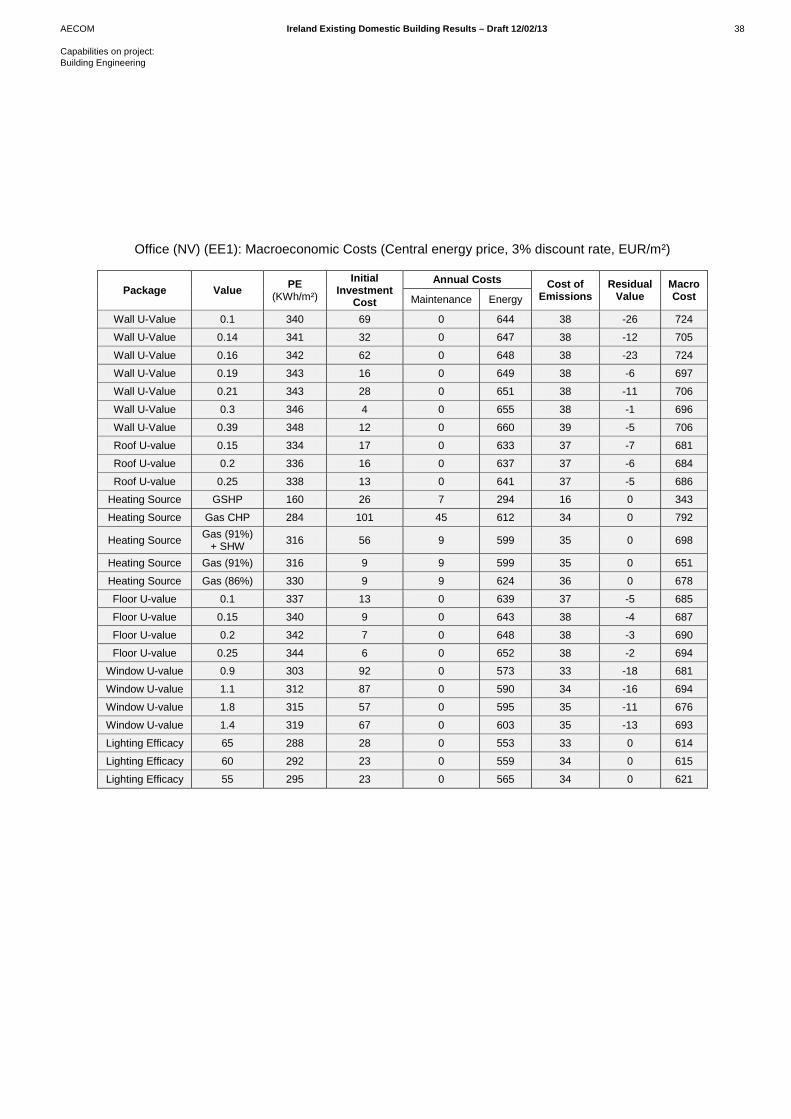
AECOM Ireland Existing Domestic Building Results – Draft 12/02/13 38 Capabilities on project: Building Engineering
Office (NV) (EE1): Macroeconomic Costs (Central energy price, 3% discount rate, EUR/m²)
Package Value PE (KWh/m²)
Initial Investment
Cost
Annual Costs Cost of Emissions
Residual Value
Macro Cost Maintenance Energy
Wall U-Value 0.1 340 69 0 644 38 -26 724
Wall U-Value 0.14 341 32 0 647 38 -12 705
Wall U-Value 0.16 342 62 0 648 38 -23 724
Wall U-Value 0.19 343 16 0 649 38 -6 697
Wall U-Value 0.21 343 28 0 651 38 -11 706
Wall U-Value 0.3 346 4 0 655 38 -1 696
Wall U-Value 0.39 348 12 0 660 39 -5 706
Roof U-value 0.15 334 17 0 633 37 -7 681
Roof U-value 0.2 336 16 0 637 37 -6 684
Roof U-value 0.25 338 13 0 641 37 -5 686
Heating Source GSHP 160 26 7 294 16 0 343
Heating Source Gas CHP 284 101 45 612 34 0 792
Heating Source Gas (91%) + SHW 316 56 9 599 35 0 698
Heating Source Gas (91%) 316 9 9 599 35 0 651
Heating Source Gas (86%) 330 9 9 624 36 0 678
Floor U-value 0.1 337 13 0 639 37 -5 685
Floor U-value 0.15 340 9 0 643 38 -4 687
Floor U-value 0.2 342 7 0 648 38 -3 690
Floor U-value 0.25 344 6 0 652 38 -2 694
Window U-value 0.9 303 92 0 573 33 -18 681
Window U-value 1.1 312 87 0 590 34 -16 694
Window U-value 1.8 315 57 0 595 35 -11 676
Window U-value 1.4 319 67 0 603 35 -13 693
Lighting Efficacy 65 288 28 0 553 33 0 614
Lighting Efficacy 60 292 23 0 559 34 0 615
Lighting Efficacy 55 295 23 0 565 34 0 621

AECOM Ireland Existing Domestic Building Results – Draft 12/02/13 39 Capabilities on project: Building Engineering
Office (NV) (EE2): Macroeconomic Costs (Central energy price, 3% discount rate, EUR/m²)
Package Value PE (KWh/m²)
Initial Investment
Cost
Annual Costs Cost of Emissions
Residual Value
Macro Cost Maintenance Energy
Wall U-Value 0.1 271 69 0 513 30 -26 586
Wall U-Value 0.14 272 32 0 515 30 -12 565
Wall U-Value 0.16 273 62 0 517 30 -23 585
Wall U-Value 0.19 274 16 0 519 30 -6 559
Wall U-Value 0.21 275 28 0 520 30 -11 568
Wall U-Value 0.3 277 4 0 525 31 -1 558
Wall U-Value 0.39 279 12 0 529 31 -5 568
Roof U-value 0.15 277 17 0 525 31 -7 566
Roof U-value 0.2 279 16 0 528 31 -6 569
Roof U-value 0.25 281 13 0 532 31 -5 571
Heating Source GSHP 136 26 7 250 13 0 297
Heating Source Gas CHP 242 101 45 522 29 0 697
Heating Source Gas (91%) + SHW 270 56 9 510 30 0 605
Heating Source Gas (91%) 270 9 9 510 30 0 558
Heating Source Gas (86%) 281 9 9 532 31 0 581
Floor U-value 0.1 267 13 0 505 29 -5 543
Floor U-value 0.15 269 9 0 510 30 -4 545
Floor U-value 0.2 271 7 0 513 30 -3 548
Floor U-value 0.25 273 6 0 517 30 -2 551
Window U-value 0.9 252 92 0 475 27 -18 578
Window U-value 1.1 259 87 0 490 28 -16 589
Window U-value 1.8 262 57 0 496 29 -11 571
Window U-value 1.4 266 67 0 502 29 -13 586
Lighting Efficacy 65 231 28 0 442 26 0 496
Lighting Efficacy 60 235 23 0 448 27 0 498
Lighting Efficacy 55 239 23 0 456 27 0 506

AECOM Ireland Existing Domestic Building Results – Draft 12/02/13 40 Capabilities on project: Building Engineering
Office (AC) (EE1): Macroeconomic Costs (Central energy price, 3% discount rate, EUR/m²)
Package Value PE (KWh/m²)
Initial Investment
Cost
Annual Costs Cost of Emissions
Residual Value
Macro Cost Maintenance Energy
Wall U-Value 0.11 401 75 0 753 43 -29 842
Wall U-Value 0.15 (b) 402 63 0 754 43 -24 836
Wall U-Value 0.15 402 67 0 754 43 -26 839
Wall U-Value 0.2 403 57 0 756 43 -22 834
Wall U-Value 0.21 403 65 0 756 43 -25 839
Wall U-Value 0.27 404 61 0 758 43 -23 839
Wall U-Value 0.36 406 58 0 761 43 -22 841
Wall U-Value 0.47 408 54 0 765 44 -21 843
Roof U-value 0.14 404 0 0 758 43 0 801
Roof U-value 0.18 405 0 0 760 43 0 804
Roof U-value 0.29 409 0 0 767 44 0 811
Heating Source GSHP 263 26 7 484 26 0 544
Heating Source Gas CHP 362 101 45 738 40 0 924
Heating Source Gas (91%) 406 9 9 763 43 0 824
Heating Source Gas (91%) + SHW 406 56 9 763 43 0 871
Heating Source Gas (86%) 418 9 9 786 45 0 849
Floor U-value 0.1 395 13 0 741 42 -5 790
Floor U-value 0.15 397 9 0 744 42 -4 792
Floor U-value 0.2 398 7 0 747 42 -3 794
Floor U-value 0.25 400 6 0 751 43 -2 797
Window U-value 1.1 377 87 0 709 40 -16 819
Window U-value 1.4 380 67 0 715 41 -13 810
Window U-value 0.9 383 92 0 717 41 -18 833
Window U-value 1.8 405 57 0 759 43 -11 848
Chiller Efficiency 5.5 342 26 0 644 37 0 707
Chiller Efficiency 4.5 349 23 0 658 38 0 718
Chiller Efficiency 3.5 361 21 0 679 39 0 739
AHU SFP 1.8 391 12 0 734 42 0 787
AHU SFP 2 395 11 0 743 42 0 796
AHU SFP 2.2 400 10 0 751 43 0 804
Lighting Efficacy 65 366 28 0 689 40 0 757
Lighting Efficacy 60 371 23 0 699 40 0 762
Lighting Efficacy 55 378 23 0 710 41 0 774

AECOM Ireland Existing Domestic Building Results – Draft 12/02/13 41 Capabilities on project: Building Engineering
Office (AC) (EE2): Macroeconomic Costs (Central energy price, 3% discount rate, EUR/m²)
Package Value PE (KWh/m²)
Initial Investment
Cost
Annual Costs Cost of Emissions
Residual Value
Macro Cost Maintenance Energy
Wall U-Value 0.11 305 75 0 570 32 -29 649
Wall U-Value 0.15 (b) 306 63 0 572 32 -24 643
Wall U-Value 0.15 306 67 0 572 32 -26 646
Wall U-Value 0.2 307 57 0 574 32 -22 642
Wall U-Value 0.21 307 65 0 574 32 -25 647
Wall U-Value 0.27 309 61 0 577 32 -23 647
Wall U-Value 0.36 311 58 0 581 33 -22 649
Wall U-Value 0.47 313 54 0 585 33 -21 651
Roof U-value 0.14 307 0 0 573 32 0 605
Roof U-value 0.18 308 0 0 576 32 0 608
Roof U-value 0.29 312 0 0 583 33 0 615
Heating Source GSHP 225 26 7 414 22 0 469
Heating Source Gas CHP 290 101 45 581 32 0 758
Heating Source Gas (91%) 319 9 9 598 34 0 649
Heating Source Gas (91%) + SHW 319 56 9 598 34 0 696
Heating Source Gas (86%) 327 9 9 613 35 0 665
Floor U-value 0.1 305 13 0 569 32 -5 609
Floor U-value 0.15 306 9 0 573 32 -4 610
Floor U-value 0.2 308 7 0 576 32 -3 613
Floor U-value 0.25 310 6 0 580 33 -2 616
Window U-value 1.1 276 87 0 516 29 -16 615
Window U-value 1.4 280 67 0 524 29 -13 608
Window U-value 0.9 282 92 0 525 29 -18 629
Window U-value 1.8 307 57 0 573 32 -11 651
Chiller Efficiency 5.5 250 26 0 470 27 0 522
Chiller Efficiency 4.5 257 23 0 482 27 0 533
Chiller Efficiency 3.5 268 21 0 503 28 0 552
AHU SFP 1.8 301 12 0 562 32 0 606
AHU SFP 2 306 11 0 571 32 0 614
AHU SFP 2.2 310 10 0 580 33 0 623
Lighting Efficacy 65 298 28 0 557 31 0 616
Lighting Efficacy 60 303 23 0 567 32 0 622
Lighting Efficacy 55 310 23 0 580 33 0 635

AECOM Ireland Existing Domestic Building Results – Draft 12/02/13 42 Capabilities on project: Building Engineering
Primary (EE1): Macroeconomic Costs (Central energy price, 3% discount rate, EUR/m²)
Package Value PE (KWh/m²)
Initial Investment
Cost
Annual Costs Cost of Emissions
Residual Value
Macro Cost Maintenance Energy
Wall U-Value 0.1 162 57 0 315 19 -12 379
Wall U-Value 0.14 164 27 0 318 19 -6 358
Wall U-Value 0.16 164 51 0 320 19 -11 379
Wall U-Value 0.19 166 13 0 322 19 -3 352
Wall U-Value 0.21 166 24 0 324 19 -5 362
Wall U-Value 0.3 170 3 0 331 20 -1 354
Wall U-Value 0.39 174 10 0 338 20 -2 367
Roof U-value 0.15 172 15 0 336 20 -3 367
Roof U-value 0.2 173 13 0 337 20 -3 367
Roof U-value 0.25 173 11 0 338 20 -2 366
Heating Source GSHP 62 30 14 121 7 0 172
Heating Source Gas CHP 140 62 64 378 17 0 521
Heating Source Gas (91%) + SHW 155 47 15 301 18 0 382
Heating Source Gas (91%) 155 8 15 301 18 0 342
Heating Source Gas (86%) 163 8 15 317 19 0 358
Floor U-value 0.1 158 11 0 308 18 -2 335
Floor U-value 0.15 161 8 0 313 19 -2 338
Floor U-value 0.2 163 6 0 318 19 -1 342
Floor U-value 0.25 166 5 0 323 19 -1 346
Window U-value 0.9 142 47 0 276 16 0 339
Window U-value 1.1 147 44 0 287 17 0 348
Window U-value 1.8 150 29 0 293 17 0 339
Window U-value 1.4 152 34 0 296 17 0 347
Lighting Efficacy 65 157 23 0 305 19 0 346
Lighting Efficacy 60 158 21 0 308 19 0 347
Lighting Efficacy 55 160 20 0 311 19 0 349

AECOM Ireland Existing Domestic Building Results – Draft 12/02/13 43 Capabilities on project: Building Engineering
Primary (EE2): Macroeconomic Costs (Central energy price, 3% discount rate, EUR/m²)
Package Value PE (KWh/m²)
Initial Investment
Cost
Annual Costs Cost of Emissions
Residual Value
Macro Cost Maintenance Energy
Wall U-Value 0.1 84 57 0 164 10 -12 219
Wall U-Value 0.14 86 27 0 167 10 -6 199
Wall U-Value 0.16 87 51 0 169 10 -11 219
Wall U-Value 0.19 88 13 0 171 10 -3 192
Wall U-Value 0.21 89 24 0 173 10 -5 202
Wall U-Value 0.3 92 3 0 180 11 -1 193
Wall U-Value 0.39 96 10 0 187 11 -2 206
Roof U-value 0.15 93 15 0 182 11 -3 204
Roof U-value 0.2 94 13 0 183 11 -3 204
Roof U-value 0.25 94 11 0 184 11 -2 203
Heating Source GSHP 27 30 14 54 3 0 101
Heating Source Gas CHP 82 62 64 232 10 0 368
Heating Source Gas (91%) + SHW 92 47 15 179 11 0 252
Heating Source Gas (91%) 92 8 15 179 11 0 213
Heating Source Gas (86%) 97 8 15 190 11 0 224
Floor U-value 0.1 87 11 0 170 10 -2 188
Floor U-value 0.15 89 8 0 174 10 -2 191
Floor U-value 0.2 92 6 0 179 11 -1 194
Floor U-value 0.25 94 5 0 184 11 -1 199
Window U-value 0.9 81 47 0 158 9 0 214
Window U-value 1.1 86 44 0 167 10 0 221
Window U-value 1.8 89 29 0 173 10 0 212
Window U-value 1.4 90 34 0 176 11 0 220
Lighting Efficacy 65 91 23 0 177 11 0 211
Lighting Efficacy 60 92 21 0 179 11 0 210
Lighting Efficacy 55 93 20 0 181 11 0 212

AECOM Ireland Existing Domestic Building Results – Draft 12/02/13 44 Capabilities on project: Building Engineering
Hotel (EE1): Macroeconomic Costs (Central energy price, 3% discount rate, EUR/m²)
Package Value PE (KWh/m²)
Initial Investment
Cost
Annual Costs Cost of Emissions
Residual Value
Macro Cost Maintenance Energy
Wall U-Value 0.1 566 94 0 1073 63 -36 1194
Wall U-Value 0.14 568 44 0 1075 63 -17 1165
Wall U-Value 0.16 568 84 0 1077 63 -32 1192
Wall U-Value 0.19 569 22 0 1079 63 -8 1155
Wall U-Value 0.21 570 39 0 1080 63 -15 1167
Wall U-Value 0.3 573 5 0 1086 63 -2 1153
Wall U-Value 0.39 576 17 0 1092 64 -6 1166
Roof U-value 0.15 576 10 0 1091 64 -4 1161
Roof U-value 0.2 577 9 0 1094 64 -3 1163
Roof U-value 0.25 578 7 0 1096 64 -3 1165
Heating Source GSHP 457 29 11 861 49 0 950
Heating Source Gas CHP 542 74 52 1079 62 0 1266
Heating Source Gas (91%) + SHW 563 35 11 1066 62 0 1176
Heating Source Gas (91%) 576 8 11 1092 64 0 1175
Heating Source Gas (86%) 586 8 11 1112 65 0 1196
Floor U-value 0.1 570 7 0 1080 63 -3 1148
Floor U-value 0.15 571 5 0 1082 63 -2 1149
Floor U-value 0.2 572 4 0 1084 63 -2 1150
Floor U-value 0.25 573 3 0 1087 64 -1 1152
Window U-value 1.1 547 87 0 1035 60 -17 1166
Window U-value 0.9 548 93 0 1036 60 -18 1172
Window U-value 1.4 550 68 0 1043 61 -13 1159
Window U-value 1.8 563 58 0 1066 62 -11 1175
Chiller Efficiency 5.5 546 31 0 1036 61 0 1128
Chiller Efficiency 4.5 549 27 0 1042 61 0 1131
Chiller Efficiency 3.5 554 25 0 1051 62 0 1138
AHU SFP 1.8 558 10 0 1058 62 0 1131
AHU SFP 2 564 10 0 1069 63 0 1141
AHU SFP 2.2 569 9 0 1080 63 0 1152
Lighting Efficacy 65 489 51 0 935 56 0 1042
Lighting Efficacy 60 491 46 0 939 56 0 1040
Lighting Efficacy 55 493 39 0 943 56 0 1038

AECOM Ireland Existing Domestic Building Results – Draft 12/02/13 45 Capabilities on project: Building Engineering
Hotel (EE2): Macroeconomic Costs (Central energy price, 3% discount rate, EUR/m²)
Package Value PE (KWh/m²)
Initial Investment
Cost
Annual Costs Cost of Emissions
Residual Value
Macro Cost Maintenance Energy
Wall U-Value 0.1 442 94 0 843 50 -36 951
Wall U-Value 0.14 444 44 0 846 50 -17 923
Wall U-Value 0.16 445 84 0 847 50 -32 949
Wall U-Value 0.19 446 22 0 849 50 -8 913
Wall U-Value 0.21 446 39 0 851 50 -15 925
Wall U-Value 0.3 450 5 0 857 51 -2 911
Wall U-Value 0.39 453 17 0 864 51 -6 925
Roof U-value 0.15 453 10 0 863 51 -4 921
Roof U-value 0.2 454 9 0 866 51 -3 923
Roof U-value 0.25 455 7 0 868 52 -3 924
Heating Source GSHP 325 29 11 614 36 0 690
Heating Source Gas CHP 420 74 52 858 50 0 1033
Heating Source Gas (91%) + SHW 446 35 11 851 50 0 948
Heating Source Gas (91%) 458 8 11 873 52 0 944
Heating Source Gas (86%) 469 8 11 894 53 0 967
Floor U-value 0.1 446 7 0 850 50 -3 905
Floor U-value 0.15 448 5 0 853 51 -2 907
Floor U-value 0.2 449 4 0 855 51 -2 909
Floor U-value 0.25 450 3 0 858 51 -1 911
Window U-value 0.9 431 93 0 820 49 -18 944
Window U-value 1.1 434 87 0 827 49 -17 947
Window U-value 1.4 439 68 0 837 50 -13 942
Window U-value 1.8 445 58 0 848 50 -11 945
Chiller Efficiency 5.5 437 31 0 834 50 0 915
Chiller Efficiency 4.5 439 27 0 838 50 0 915
Chiller Efficiency 3.5 442 25 0 844 50 0 920
AHU SFP 1.8 444 10 0 846 50 0 907
AHU SFP 2 450 10 0 857 51 0 918
AHU SFP 2.2 455 9 0 868 52 0 929
Lighting Efficacy 65 434 51 0 831 50 0 931
Lighting Efficacy 60 436 46 0 834 50 0 930
Lighting Efficacy 55 439 39 0 838 50 0 927
AECOM Ireland Existing Domestic Building Results – Draft 12/02/13 46 Capabilities on project: Building Engineering
Table E: Macroeconomic Costs Central energy price 6% discount rate

AECOM Ireland Existing Domestic Building Results – Draft 12/02/13 47 Capabilities on project: Building Engineering
Retail (EE1): Macroeconomic Costs (Central energy price, 6% discount rate, EUR/m²)
Package Value PE (KWh/m²)
Initial Investment
Cost
Annual Costs Cost of Emissions
Residual Value
Macro Cost Maintenance Energy
Wall U-Value 0.11 646 66 0 851 45 -15 948
Wall U-Value 0.15 (b) 647 55 0 852 45 -12 940
Wall U-Value 0.15 647 59 0 852 45 -13 943
Wall U-Value 0.2 648 50 0 854 45 -11 938
Wall U-Value 0.21 648 57 0 854 45 -13 943
Wall U-Value 0.27 649 54 0 855 45 -12 942
Wall U-Value 0.36 651 51 0 857 45 -11 942
Wall U-Value 0.47 653 48 0 860 45 -10 942
Roof U-value 0.14 648 0 0 853 45 0 898
Roof U-value 0.18 649 0 0 855 45 0 901
Roof U-value 0.29 654 0 0 862 46 0 907
Heating Source ASHP 558 41 11 735 38 0 825
Heating Source Gas CHP 620 132 84 839 44 0 1098
Heating Source Gas (91%) 646 11 13 851 45 0 920
Heating Source Gas (91%) + SHW 646 104 13 851 45 0 1012
Heating Source Gas (86%) 653 11 13 861 46 0 930
Floor U-value 0.25 652 12 0 859 45 -3 914
Floor U-value 0.2 652 14 0 859 45 -3 916
Floor U-value 0.15 653 18 0 860 45 -4 920
Floor U-value 0.1 653 26 0 860 45 -6 926
Window U-value 1.4 644 15 0 848 45 -2 906
Window U-value 1.1 644 19 0 848 45 -2 910
Window U-value 0.9 647 20 0 853 45 -2 916
Window U-value 1.8 653 13 0 860 45 -1 917
Chiller Efficiency 5.5 533 30 0 703 37 0 770
Chiller Efficiency 4.5 545 27 0 718 38 0 783
Chiller Efficiency 3.5 564 25 0 743 39 0 808
AHU SFP 1.8 641 19 0 844 45 0 907
AHU SFP 2 646 17 0 852 45 0 914
AHU SFP 2.2 652 16 0 859 45 0 921
Lighting Efficacy 65 490 6 0 646 35 0 686
Lighting Efficacy 60 498 5 0 657 35 0 697
Lighting Efficacy 55 508 5 0 670 36 0 710

AECOM Ireland Existing Domestic Building Results – Draft 12/02/13 48 Capabilities on project: Building Engineering
Retail (EE2): Macroeconomic Costs (Central energy price, 6% discount rate, EUR/m²)
Package Value PE (KWh/m²)
Initial Investment
Cost
Annual Costs Cost of Emissions
Residual Value
Macro Cost Maintenance Energy
Wall U-Value 0.11 501 66 0 660 35 -15 747
Wall U-Value 0.15 (b) 502 55 0 661 35 -12 739
Wall U-Value 0.15 502 59 0 661 35 -13 743
Wall U-Value 0.2 503 50 0 663 35 -11 737
Wall U-Value 0.21 503 57 0 663 35 -13 743
Wall U-Value 0.27 504 54 0 665 35 -12 742
Wall U-Value 0.36 506 51 0 668 36 -11 743
Wall U-Value 0.47 509 48 0 671 36 -10 744
Roof U-value 0.14 503 0 0 663 35 0 698
Roof U-value 0.18 505 0 0 665 35 0 701
Roof U-value 0.29 511 0 0 673 36 0 709
Heating Source ASHP 406 41 11 534 28 0 614
Heating Source Gas CHP 473 132 84 648 34 0 898
Heating Source Gas (91%) 502 11 13 661 35 0 720
Heating Source Gas (91%) + SHW 502 104 13 661 35 0 813
Heating Source Gas (86%) 510 11 13 672 36 0 732
Floor U-value 0.1 496 26 0 653 35 -6 708
Floor U-value 0.15 497 18 0 655 35 -4 704
Floor U-value 0.2 498 14 0 656 35 -3 702
Floor U-value 0.25 502 12 0 662 35 -3 707
Window U-value 1.1 502 19 0 662 35 -2 714
Window U-value 1.4 502 15 0 662 35 -2 711
Window U-value 0.9 504 20 0 664 35 -2 718
Window U-value 1.8 508 13 0 670 36 -1 717
Chiller Efficiency 5.5 461 30 0 608 33 0 671
Chiller Efficiency 4.5 470 27 0 620 33 0 680
Chiller Efficiency 3.5 485 25 0 639 34 0 698
AHU SFP 1.8 497 19 0 655 35 0 709
AHU SFP 2 503 17 0 663 35 0 715
AHU SFP 2.2 508 16 0 670 36 0 722
Lighting Efficacy 65 453 6 0 597 32 0 635
Lighting Efficacy 60 460 5 0 607 32 0 645
Lighting Efficacy 55 469 5 0 618 33 0 656

AECOM Ireland Existing Domestic Building Results – Draft 12/02/13 49 Capabilities on project: Building Engineering
Office (NV) (EE1): Macroeconomic Costs (Central energy price, 6% discount rate, EUR/m²)
Package Value PE (KWh/m²)
Initial Investment
Cost
Annual Costs Cost of Emissions
Residual Value
Macro Cost Maintenance Energy
Wall U-Value 0.1 340 69 0 449 25 -15 528
Wall U-Value 0.14 341 32 0 451 25 -7 502
Wall U-Value 0.16 342 62 0 452 25 -14 525
Wall U-Value 0.19 343 16 0 453 25 -4 491
Wall U-Value 0.21 343 28 0 454 25 -6 501
Wall U-Value 0.3 346 4 0 457 25 -1 486
Wall U-Value 0.39 348 12 0 460 26 -3 496
Roof U-value 0.15 334 17 0 442 25 -4 480
Roof U-value 0.2 336 16 0 445 25 -3 482
Roof U-value 0.25 338 13 0 447 25 -3 482
Heating Source GSHP 160 26 6 210 11 0 253
Heating Source Gas CHP 284 101 35 422 22 0 580
Heating Source Gas (91%) + SHW 316 56 7 418 23 0 504
Heating Source Gas (91%) 316 9 7 418 23 0 458
Heating Source Gas (86%) 330 9 7 436 24 0 476
Floor U-value 0.1 337 13 0 446 25 -3 481
Floor U-value 0.15 340 9 0 449 25 -2 481
Floor U-value 0.2 342 7 0 452 25 -2 483
Floor U-value 0.25 344 6 0 455 25 -1 485
Window U-value 0.9 303 92 0 401 22 -10 505
Window U-value 1.1 312 87 0 412 23 -10 512
Window U-value 1.8 315 57 0 416 23 -6 490
Window U-value 1.4 319 67 0 421 23 -7 505
Lighting Efficacy 65 288 28 0 382 22 0 432
Lighting Efficacy 60 292 23 0 387 22 0 432
Lighting Efficacy 55 295 23 0 391 22 0 436

AECOM Ireland Existing Domestic Building Results – Draft 12/02/13 50 Capabilities on project: Building Engineering
Office (NV) (EE2): Macroeconomic Costs (Central energy price, 6% discount rate, EUR/m²)
Package Value PE (KWh/m²)
Initial Investment
Cost
Annual Costs Cost of Emissions
Residual Value
Macro Cost Maintenance Energy
Wall U-Value 0.1 271 69 0 359 20 -15 432
Wall U-Value 0.14 272 32 0 360 20 -7 405
Wall U-Value 0.16 273 62 0 361 20 -14 429
Wall U-Value 0.19 274 16 0 363 20 -4 395
Wall U-Value 0.21 275 28 0 363 20 -6 406
Wall U-Value 0.3 277 4 0 367 20 -1 390
Wall U-Value 0.39 279 12 0 369 21 -3 400
Roof U-value 0.15 277 17 0 367 20 -4 400
Roof U-value 0.2 279 16 0 369 20 -3 402
Roof U-value 0.25 281 13 0 371 21 -3 402
Heating Source GSHP 136 26 6 179 9 0 220
Heating Source Gas CHP 242 101 35 360 19 0 514
Heating Source Gas (91%) + SHW 270 56 7 357 20 0 439
Heating Source Gas (91%) 270 9 7 357 20 0 392
Heating Source Gas (86%) 281 9 7 371 21 0 408
Floor U-value 0.1 267 13 0 353 20 -3 383
Floor U-value 0.15 269 9 0 356 20 -2 383
Floor U-value 0.2 271 7 0 359 20 -2 384
Floor U-value 0.25 273 6 0 361 20 -1 386
Window U-value 0.9 252 92 0 333 18 -10 433
Window U-value 1.1 259 87 0 343 19 -10 439
Window U-value 1.8 262 57 0 347 19 -6 417
Window U-value 1.4 266 67 0 351 19 -7 430
Lighting Efficacy 65 231 28 0 306 17 0 352
Lighting Efficacy 60 235 23 0 311 18 0 351
Lighting Efficacy 55 239 23 0 316 18 0 357

AECOM Ireland Existing Domestic Building Results – Draft 12/02/13 51 Capabilities on project: Building Engineering
Office (AC) (EE1): Macroeconomic Costs (Central energy price, 6% discount rate, EUR/m²)
Package Value PE (KWh/m²)
Initial Investment
Cost
Annual Costs Cost of Emissions
Residual Value
Macro Cost Maintenance Energy
Wall U-Value 0.11 401 75 0 530 29 -17 617
Wall U-Value 0.15 (b) 402 63 0 531 29 -14 609
Wall U-Value 0.15 402 67 0 531 29 -15 612
Wall U-Value 0.2 403 57 0 532 29 -13 605
Wall U-Value 0.21 403 65 0 532 29 -14 612
Wall U-Value 0.27 404 61 0 533 29 -14 610
Wall U-Value 0.36 406 58 0 536 29 -13 610
Wall U-Value 0.47 408 54 0 538 29 -12 610
Roof U-value 0.14 404 0 0 533 29 0 562
Roof U-value 0.18 405 0 0 535 29 0 564
Roof U-value 0.29 409 0 0 539 29 0 569
Heating Source GSHP 263 26 6 346 18 0 396
Heating Source Gas CHP 362 101 35 515 27 0 677
Heating Source Gas (91%) 406 9 7 536 29 0 582
Heating Source Gas (91%) + SHW 406 56 7 536 29 0 628
Heating Source Gas (86%) 418 9 7 552 30 0 598
Floor U-value 0.1 395 13 0 521 28 -3 560
Floor U-value 0.15 397 9 0 524 28 -2 559
Floor U-value 0.2 398 7 0 526 29 -2 560
Floor U-value 0.25 400 6 0 528 29 -1 561
Window U-value 1.1 377 87 0 498 27 -10 603
Window U-value 1.4 380 67 0 502 27 -7 589
Window U-value 0.9 383 92 0 505 27 -10 615
Window U-value 1.8 405 57 0 534 29 -6 614
Chiller Efficiency 5.5 342 26 0 452 25 0 503
Chiller Efficiency 4.5 349 23 0 462 25 0 510
Chiller Efficiency 3.5 361 21 0 477 26 0 524
AHU SFP 1.8 391 12 0 516 28 0 555
AHU SFP 2 395 11 0 522 28 0 561
AHU SFP 2.2 400 10 0 528 29 0 567
Lighting Efficacy 65 366 28 0 483 27 0 538
Lighting Efficacy 60 371 23 0 491 27 0 540
Lighting Efficacy 55 378 23 0 499 27 0 549

AECOM Ireland Existing Domestic Building Results – Draft 12/02/13 52 Capabilities on project: Building Engineering
Office (AC) (EE2): Macroeconomic Costs (Central energy price, 6% discount rate, EUR/m²)
Package Value PE (KWh/m²)
Initial Investment
Cost
Annual Costs Cost of Emissions
Residual Value
Macro Cost Maintenance Energy
Wall U-Value 0.11 305 75 0 403 22 -17 483
Wall U-Value 0.15 (b) 306 63 0 404 22 -14 475
Wall U-Value 0.15 306 67 0 404 22 -15 478
Wall U-Value 0.2 307 57 0 405 22 -13 472
Wall U-Value 0.21 307 65 0 406 22 -14 478
Wall U-Value 0.27 309 61 0 407 22 -14 477
Wall U-Value 0.36 311 58 0 410 22 -13 477
Wall U-Value 0.47 313 54 0 412 22 -12 477
Roof U-value 0.14 307 0 0 405 22 0 426
Roof U-value 0.18 308 0 0 407 22 0 428
Roof U-value 0.29 312 0 0 411 22 0 433
Heating Source GSHP 225 26 6 295 15 0 343
Heating Source Gas CHP 290 101 35 407 21 0 564
Heating Source Gas (91%) 319 9 7 421 23 0 460
Heating Source Gas (91%) + SHW 319 56 7 421 23 0 507
Heating Source Gas (86%) 327 9 7 432 23 0 471
Floor U-value 0.1 305 13 0 402 22 -3 434
Floor U-value 0.15 306 9 0 404 22 -2 433
Floor U-value 0.2 308 7 0 407 22 -2 434
Floor U-value 0.25 310 6 0 409 22 -1 436
Window U-value 1.1 276 87 0 364 20 -10 461
Window U-value 1.4 280 67 0 370 20 -7 449
Window U-value 0.9 282 92 0 371 20 -10 473
Window U-value 1.8 307 57 0 405 22 -6 478
Chiller Efficiency 5.5 250 26 0 330 18 0 374
Chiller Efficiency 4.5 257 23 0 340 18 0 381
Chiller Efficiency 3.5 268 21 0 354 19 0 394
AHU SFP 1.8 301 12 0 397 21 0 430
AHU SFP 2 306 11 0 403 22 0 435
AHU SFP 2.2 310 10 0 409 22 0 442
Lighting Efficacy 65 298 28 0 393 21 0 442
Lighting Efficacy 60 303 23 0 400 22 0 445
Lighting Efficacy 55 310 23 0 409 22 0 454

AECOM Ireland Existing Domestic Building Results – Draft 12/02/13 53 Capabilities on project: Building Engineering
Primary (EE1): Macroeconomic Costs (Central energy price, 6% discount rate, EUR/m²)
Package Value PE (KWh/m²)
Initial Investment
Cost
Annual Costs Cost of Emissions
Residual Value
Macro Cost Maintenance Energy
Wall U-Value 0.1 162 57 0 219 12 -5 283
Wall U-Value 0.14 164 27 0 221 12 -2 258
Wall U-Value 0.16 164 51 0 222 13 -5 281
Wall U-Value 0.19 166 13 0 224 13 -1 249
Wall U-Value 0.21 166 24 0 225 13 -2 259
Wall U-Value 0.3 170 3 0 230 13 0 246
Wall U-Value 0.39 174 10 0 235 13 -1 257
Roof U-value 0.15 172 15 0 233 13 -1 259
Roof U-value 0.2 173 13 0 234 13 -1 259
Roof U-value 0.25 173 11 0 234 13 -1 258
Heating Source GSHP 62 30 10 86 5 0 130
Heating Source Gas CHP 140 62 45 260 11 0 379
Heating Source Gas (91%) + SHW 155 47 11 210 12 0 279
Heating Source Gas (91%) 155 8 11 210 12 0 240
Heating Source Gas (86%) 163 8 11 220 12 0 251
Floor U-value 0.1 158 11 0 214 12 -1 236
Floor U-value 0.15 161 8 0 217 12 -1 237
Floor U-value 0.2 163 6 0 221 12 -1 239
Floor U-value 0.25 166 5 0 224 13 0 241
Window U-value 0.9 142 47 0 192 11 0 250
Window U-value 1.1 147 44 0 200 11 0 255
Window U-value 1.8 150 29 0 204 11 0 244
Window U-value 1.4 152 34 0 206 12 0 251
Lighting Efficacy 65 157 23 0 210 12 0 245
Lighting Efficacy 60 158 21 0 212 12 0 245
Lighting Efficacy 55 160 20 0 214 12 0 247

AECOM Ireland Existing Domestic Building Results – Draft 12/02/13 54 Capabilities on project: Building Engineering
Primary (EE2): Macroeconomic Costs (Central energy price, 6% discount rate, EUR/m²)
Package Value PE (KWh/m²)
Initial Investment
Cost
Annual Costs Cost of Emissions
Residual Value
Macro Cost Maintenance Energy
Wall U-Value 0.1 84 57 0 114 6 -5 172
Wall U-Value 0.14 86 27 0 116 7 -2 147
Wall U-Value 0.16 87 51 0 117 7 -5 170
Wall U-Value 0.19 88 13 0 119 7 -1 138
Wall U-Value 0.21 89 24 0 120 7 -2 148
Wall U-Value 0.3 92 3 0 124 7 0 134
Wall U-Value 0.39 96 10 0 129 7 -1 146
Roof U-value 0.15 93 15 0 126 7 -1 146
Roof U-value 0.2 94 13 0 126 7 -1 146
Roof U-value 0.25 94 11 0 127 7 -1 144
Heating Source GSHP 27 30 10 38 2 0 80
Heating Source Gas CHP 82 62 45 159 7 0 273
Heating Source Gas (91%) + SHW 92 47 11 124 7 0 189
Heating Source Gas (91%) 92 8 11 124 7 0 150
Heating Source Gas (86%) 97 8 11 131 8 0 157
Floor U-value 0.1 87 11 0 117 7 -1 134
Floor U-value 0.15 89 8 0 121 7 -1 135
Floor U-value 0.2 92 6 0 124 7 -1 136
Floor U-value 0.25 94 5 0 127 7 0 139
Window U-value 0.9 81 47 0 109 6 0 162
Window U-value 1.1 86 44 0 116 7 0 166
Window U-value 1.8 89 29 0 120 7 0 156
Window U-value 1.4 90 34 0 122 7 0 162
Lighting Efficacy 65 91 23 0 122 7 0 152
Lighting Efficacy 60 92 21 0 124 7 0 151
Lighting Efficacy 55 93 20 0 125 7 0 152

AECOM Ireland Existing Domestic Building Results – Draft 12/02/13 55 Capabilities on project: Building Engineering
Hotel (EE1): Macroeconomic Costs (Central energy price, 6% discount rate, EUR/m²)
Package Value PE (KWh/m²)
Initial Investment
Cost
Annual Costs Cost of Emissions
Residual Value
Macro Cost Maintenance Energy
Wall U-Value 0.1 566 94 0 749 42 -21 864
Wall U-Value 0.14 568 44 0 751 42 -10 827
Wall U-Value 0.16 568 84 0 752 42 -19 859
Wall U-Value 0.19 569 22 0 753 42 -5 812
Wall U-Value 0.21 570 39 0 754 42 -9 826
Wall U-Value 0.3 573 5 0 758 42 -1 804
Wall U-Value 0.39 576 17 0 762 42 -4 818
Roof U-value 0.15 576 10 0 761 42 -2 812
Roof U-value 0.2 577 9 0 763 43 -2 813
Roof U-value 0.25 578 7 0 765 43 -2 813
Heating Source GSHP 457 29 8 604 33 0 674
Heating Source Gas CHP 542 74 41 749 41 0 904
Heating Source Gas (91%) + SHW 563 35 9 744 41 0 830
Heating Source Gas (91%) 576 8 9 762 42 0 821
Heating Source Gas (86%) 586 8 9 775 43 0 835
Floor U-value 0.1 570 7 0 754 42 -2 802
Floor U-value 0.15 571 5 0 755 42 -1 802
Floor U-value 0.2 572 4 0 757 42 -1 802
Floor U-value 0.25 573 3 0 758 42 -1 803
Window U-value 1.1 547 87 0 723 40 -10 841
Window U-value 0.9 548 93 0 724 40 -10 847
Window U-value 1.4 550 68 0 728 41 -7 829
Window U-value 1.8 563 58 0 745 41 -6 837
Chiller Efficiency 5.5 546 31 0 722 40 0 794
Chiller Efficiency 4.5 549 27 0 726 41 0 794
Chiller Efficiency 3.5 554 25 0 733 41 0 799
AHU SFP 1.8 558 10 0 738 41 0 790
AHU SFP 2 564 10 0 746 42 0 797
AHU SFP 2.2 569 9 0 753 42 0 804
Lighting Efficacy 65 489 51 0 648 37 0 736
Lighting Efficacy 60 491 46 0 650 37 0 733
Lighting Efficacy 55 493 39 0 653 37 0 729

AECOM Ireland Existing Domestic Building Results – Draft 12/02/13 56 Capabilities on project: Building Engineering
Hotel (EE2): Macroeconomic Costs (Central energy price, 6% discount rate, EUR/m²)
Package Value PE (KWh/m²)
Initial Investment
Cost
Annual Costs Cost of Emissions
Residual Value
Macro Cost Maintenance Energy
Wall U-Value 0.1 442 94 0 586 33 -21 692
Wall U-Value 0.14 444 44 0 588 33 -10 655
Wall U-Value 0.16 445 84 0 589 33 -19 687
Wall U-Value 0.19 446 22 0 590 33 -5 640
Wall U-Value 0.21 446 39 0 591 33 -9 655
Wall U-Value 0.3 450 5 0 595 34 -1 633
Wall U-Value 0.39 453 17 0 600 34 -4 647
Roof U-value 0.15 453 10 0 599 34 -2 641
Roof U-value 0.2 454 9 0 601 34 -2 642
Roof U-value 0.25 455 7 0 603 34 -2 643
Heating Source GSHP 325 29 8 429 24 0 491
Heating Source Gas CHP 420 74 41 591 32 0 738
Heating Source Gas (91%) + SHW 446 35 9 591 33 0 669
Heating Source Gas (91%) 458 8 9 606 34 0 657
Heating Source Gas (86%) 469 8 9 621 35 0 672
Floor U-value 0.1 446 7 0 591 33 -2 630
Floor U-value 0.15 448 5 0 592 33 -1 630
Floor U-value 0.2 449 4 0 594 34 -1 631
Floor U-value 0.25 450 3 0 596 34 -1 632
Window U-value 0.9 431 93 0 570 32 -10 685
Window U-value 1.1 434 87 0 574 32 -10 684
Window U-value 1.4 439 68 0 581 33 -7 674
Window U-value 1.8 445 58 0 589 33 -6 674
Chiller Efficiency 5.5 437 31 0 578 33 0 642
Chiller Efficiency 4.5 439 27 0 581 33 0 641
Chiller Efficiency 3.5 442 25 0 586 33 0 644
AHU SFP 1.8 444 10 0 587 33 0 631
AHU SFP 2 450 10 0 595 34 0 638
AHU SFP 2.2 455 9 0 603 34 0 646
Lighting Efficacy 65 434 51 0 576 33 0 659
Lighting Efficacy 60 436 46 0 578 33 0 657
Lighting Efficacy 55 439 39 0 581 33 0 653

AECOM Ireland Existing Domestic Building Results – Draft 12/02/13 57 Capabilities on project: Building Engineering
Table F: Financial Costs Central energy price 7% discount rate

AECOM Ireland Existing Domestic Building Results – Draft 12/02/13 58 Capabilities on project: Building Engineering
Retail (EE1): Financial Costs (Central energy price, 7% discount rate, EUR/m²)
Package Value PE (KWh/m²)
Initial Investment
Cost
Annual Costs Cost of Emissions
Residual Value
Macro Cost Maintenance Energy
Wall U-Value 0.11 646 66 0 874 - -12 928
Wall U-Value 0.15 (b) 647 55 0 875 - -10 920
Wall U-Value 0.15 647 59 0 875 - -11 924
Wall U-Value 0.2 648 50 0 877 - -9 918
Wall U-Value 0.21 648 57 0 877 - -11 923
Wall U-Value 0.27 649 54 0 878 - -10 922
Wall U-Value 0.36 651 51 0 880 - -9 922
Wall U-Value 0.47 653 48 0 883 - -9 922
Roof U-value 0.14 648 0 0 876 - 0 876
Roof U-value 0.18 649 0 0 879 - 0 879
Roof U-value 0.29 654 0 0 885 - 0 885
Heating Source ASHP 558 41 10 756 - 0 807
Heating Source Gas CHP 620 132 78 861 - 0 1071
Heating Source Gas (91%) 646 11 12 874 - 0 897
Heating Source Gas (91%) + SHW 646 104 12 874 - 0 990
Heating Source Gas (86%) 653 11 12 884 - 0 907
Floor U-value 0.25 652 12 0 882 - -2 892
Floor U-value 0.2 652 14 0 883 - -3 894
Floor U-value 0.15 653 18 0 883 - -3 898
Floor U-value 0.1 653 26 0 884 - -5 905
Window U-value 1.4 644 15 0 871 - -1 885
Window U-value 1.1 644 19 0 871 - -2 889
Window U-value 0.9 647 20 0 876 - -2 894
Window U-value 1.8 653 13 0 883 - -1 895
Chiller Efficiency 5.5 533 30 0 721 - 0 752
Chiller Efficiency 4.5 545 27 0 737 - 0 764
Chiller Efficiency 3.5 564 25 0 763 - 0 788
AHU SFP 1.8 641 19 0 867 - 0 885
AHU SFP 2 646 17 0 875 - 0 892
AHU SFP 2.2 652 16 0 882 - 0 899
Lighting Efficacy 65 490 6 0 662 - 0 668
Lighting Efficacy 60 498 5 0 674 - 0 679
Lighting Efficacy 55 508 5 0 687 - 0 692

AECOM Ireland Existing Domestic Building Results – Draft 12/02/13 59 Capabilities on project: Building Engineering
Retail (EE2): Financial Costs (Central energy price, 7% discount rate, EUR/m²)
Package Value PE (KWh/m²)
Initial Investment
Cost
Annual Costs Cost of Emissions
Residual Value
Macro Cost Maintenance Energy
Wall U-Value 0.11 501 66 0 677 - -12 731
Wall U-Value 0.15 (b) 502 55 0 679 - -10 724
Wall U-Value 0.15 502 59 0 679 - -11 727
Wall U-Value 0.2 503 50 0 680 - -9 721
Wall U-Value 0.21 503 57 0 680 - -11 727
Wall U-Value 0.27 504 54 0 682 - -10 726
Wall U-Value 0.36 506 51 0 685 - -9 726
Wall U-Value 0.47 509 48 0 688 - -9 727
Roof U-value 0.14 503 0 0 680 - 0 680
Roof U-value 0.18 505 0 0 683 - 0 683
Roof U-value 0.29 511 0 0 691 - 0 691
Heating Source ASHP 406 41 10 549 - 0 601
Heating Source Gas CHP 473 132 78 664 - 0 874
Heating Source Gas (91%) 502 11 12 679 - 0 702
Heating Source Gas (91%) + SHW 502 104 12 679 - 0 794
Heating Source Gas (86%) 510 11 12 690 - 0 712
Floor U-value 0.1 496 26 0 671 - -5 692
Floor U-value 0.15 497 18 0 672 - -3 687
Floor U-value 0.2 498 14 0 674 - -3 685
Floor U-value 0.25 502 12 0 680 - -2 689
Window U-value 1.1 502 19 0 679 - -2 697
Window U-value 1.4 502 15 0 680 - -1 693
Window U-value 0.9 504 20 0 681 - -2 700
Window U-value 1.8 508 13 0 687 - -1 699
Chiller Efficiency 5.5 461 30 0 623 - 0 654
Chiller Efficiency 4.5 470 27 0 636 - 0 663
Chiller Efficiency 3.5 485 25 0 656 - 0 681
AHU SFP 1.8 497 19 0 672 - 0 691
AHU SFP 2 503 17 0 680 - 0 697
AHU SFP 2.2 508 16 0 688 - 0 704
Lighting Efficacy 65 453 6 0 612 - 0 619
Lighting Efficacy 60 460 5 0 622 - 0 628
Lighting Efficacy 55 469 5 0 634 - 0 639

AECOM Ireland Existing Domestic Building Results – Draft 12/02/13 60 Capabilities on project: Building Engineering
Office (NV) (EE1): Financial Costs (Central energy price, 7% discount rate, EUR/m²)
Package Value PE (KWh/m²)
Initial Investment
Cost
Annual Costs Cost of Emissions
Residual Value
Macro Cost Maintenance Energy
Wall U-Value 0.1 340 69 0 459 - -13 515
Wall U-Value 0.14 341 32 0 461 - -6 488
Wall U-Value 0.16 342 62 0 462 - -11 512
Wall U-Value 0.19 343 16 0 463 - -3 476
Wall U-Value 0.21 343 28 0 464 - -5 487
Wall U-Value 0.3 346 4 0 467 - -1 470
Wall U-Value 0.39 348 12 0 470 - -2 480
Roof U-value 0.15 334 17 0 452 - -3 466
Roof U-value 0.2 336 16 0 454 - -3 467
Roof U-value 0.25 338 13 0 457 - -2 468
Heating Source GSHP 160 26 5 216 - 0 247
Heating Source Gas CHP 284 101 32 430 - 0 563
Heating Source Gas (91%) + SHW 316 56 6 428 - 0 490
Heating Source Gas (91%) 316 9 6 428 - 0 443
Heating Source Gas (86%) 330 9 6 445 - 0 461
Floor U-value 0.1 337 13 0 456 - -2 466
Floor U-value 0.15 340 9 0 459 - -2 466
Floor U-value 0.2 342 7 0 462 - -1 468
Floor U-value 0.25 344 6 0 465 - -1 470
Window U-value 0.9 303 92 0 410 - -9 494
Window U-value 1.1 312 87 0 422 - -8 500
Window U-value 1.8 315 57 0 425 - -5 477
Window U-value 1.4 319 67 0 431 - -6 492
Lighting Efficacy 65 288 28 0 389 - 0 418
Lighting Efficacy 60 292 23 0 394 - 0 417
Lighting Efficacy 55 295 23 0 398 - 0 421

AECOM Ireland Existing Domestic Building Results – Draft 12/02/13 61 Capabilities on project: Building Engineering
Office (NV) (EE2): Financial Costs (Central energy price, 7% discount rate, EUR/m²)
Package Value PE (KWh/m²)
Initial Investment
Cost
Annual Costs Cost of Emissions
Residual Value
Macro Cost Maintenance Energy
Wall U-Value 0.1 271 69 0 367 - -13 423
Wall U-Value 0.14 272 32 0 368 - -6 394
Wall U-Value 0.16 273 62 0 369 - -11 419
Wall U-Value 0.19 274 16 0 371 - -3 384
Wall U-Value 0.21 275 28 0 371 - -5 394
Wall U-Value 0.3 277 4 0 375 - -1 378
Wall U-Value 0.39 279 12 0 378 - -2 388
Roof U-value 0.15 277 17 0 375 - -3 389
Roof U-value 0.2 279 16 0 377 - -3 390
Roof U-value 0.25 281 13 0 380 - -2 390
Heating Source GSHP 136 26 5 184 - 0 215
Heating Source Gas CHP 242 101 32 366 - 0 499
Heating Source Gas (91%) + SHW 270 56 6 365 - 0 427
Heating Source Gas (91%) 270 9 6 365 - 0 380
Heating Source Gas (86%) 281 9 6 380 - 0 395
Floor U-value 0.1 267 13 0 361 - -2 372
Floor U-value 0.15 269 9 0 364 - -2 372
Floor U-value 0.2 271 7 0 367 - -1 373
Floor U-value 0.25 273 6 0 369 - -1 374
Window U-value 0.9 252 92 0 340 - -9 424
Window U-value 1.1 259 87 0 351 - -8 429
Window U-value 1.8 262 57 0 355 - -5 407
Window U-value 1.4 266 67 0 359 - -6 420
Lighting Efficacy 65 231 28 0 312 - 0 340
Lighting Efficacy 60 235 23 0 317 - 0 340
Lighting Efficacy 55 239 23 0 323 - 0 345

AECOM Ireland Existing Domestic Building Results – Draft 12/02/13 62 Capabilities on project: Building Engineering
Office (AC) (EE1): Financial Costs (Central energy price, 7% discount rate, EUR/m²)
Package Value PE (KWh/m²)
Initial Investment
Cost
Annual Costs Cost of Emissions
Residual Value
Macro Cost Maintenance Energy
Wall U-Value 0.11 401 75 0 543 - -14 604
Wall U-Value 0.15 (b) 402 63 0 544 - -12 595
Wall U-Value 0.15 402 67 0 544 - -12 599
Wall U-Value 0.2 403 57 0 545 - -11 591
Wall U-Value 0.21 403 65 0 545 - -12 598
Wall U-Value 0.27 404 61 0 546 - -11 596
Wall U-Value 0.36 406 58 0 549 - -11 596
Wall U-Value 0.47 408 54 0 551 - -10 595
Roof U-value 0.14 404 0 0 546 - 0 546
Roof U-value 0.18 405 0 0 548 - 0 548
Roof U-value 0.29 409 0 0 552 - 0 552
Heating Source GSHP 263 26 5 356 - 0 387
Heating Source Gas CHP 362 101 32 526 - 0 659
Heating Source Gas (91%) 406 9 6 549 - 0 565
Heating Source Gas (91%) + SHW 406 56 6 549 - 0 612
Heating Source Gas (86%) 418 9 6 565 - 0 581
Floor U-value 0.1 395 13 0 534 - -2 545
Floor U-value 0.15 397 9 0 536 - -2 544
Floor U-value 0.2 398 7 0 539 - -1 544
Floor U-value 0.25 400 6 0 541 - -1 546
Window U-value 1.1 377 87 0 510 - -8 589
Window U-value 1.4 380 67 0 514 - -6 575
Window U-value 0.9 383 92 0 517 - -9 601
Window U-value 1.8 405 57 0 547 - -5 599
Chiller Efficiency 5.5 342 26 0 462 - 0 488
Chiller Efficiency 4.5 349 23 0 472 - 0 495
Chiller Efficiency 3.5 361 21 0 488 - 0 509
AHU SFP 1.8 391 12 0 528 - 0 540
AHU SFP 2 395 11 0 534 - 0 545
AHU SFP 2.2 400 10 0 541 - 0 551
Lighting Efficacy 65 366 28 0 495 - 0 523
Lighting Efficacy 60 371 23 0 502 - 0 525
Lighting Efficacy 55 378 23 0 510 - 0 533

AECOM Ireland Existing Domestic Building Results – Draft 12/02/13 63 Capabilities on project: Building Engineering
Office (AC) (EE2): Financial Costs (Central energy price, 7% discount rate, EUR/m²)
Package Value PE (KWh/m²)
Initial Investment
Cost
Annual Costs Cost of Emissions
Residual Value
Macro Cost Maintenance Energy
Wall U-Value 0.11 305 75 0 413 - -14 474
Wall U-Value 0.15 (b) 306 63 0 414 - -12 466
Wall U-Value 0.15 306 67 0 414 - -12 469
Wall U-Value 0.2 307 57 0 416 - -11 462
Wall U-Value 0.21 307 65 0 416 - -12 469
Wall U-Value 0.27 309 61 0 417 - -11 467
Wall U-Value 0.36 311 58 0 420 - -11 467
Wall U-Value 0.47 313 54 0 423 - -10 467
Roof U-value 0.14 307 0 0 415 - 0 415
Roof U-value 0.18 308 0 0 417 - 0 417
Roof U-value 0.29 312 0 0 421 - 0 421
Heating Source GSHP 225 26 5 304 - 0 335
Heating Source Gas CHP 290 101 32 416 - 0 549
Heating Source Gas (91%) 319 9 6 432 - 0 447
Heating Source Gas (91%) + SHW 319 56 6 432 - 0 494
Heating Source Gas (86%) 327 9 6 442 - 0 458
Floor U-value 0.1 305 13 0 412 - -2 423
Floor U-value 0.15 306 9 0 414 - -2 422
Floor U-value 0.2 308 7 0 417 - -1 423
Floor U-value 0.25 310 6 0 420 - -1 425
Window U-value 1.1 276 87 0 373 - -8 452
Window U-value 1.4 280 67 0 379 - -6 440
Window U-value 0.9 282 92 0 381 - -9 465
Window U-value 1.8 307 57 0 415 - -5 467
Chiller Efficiency 5.5 250 26 0 338 - 0 364
Chiller Efficiency 4.5 257 23 0 348 - 0 371
Chiller Efficiency 3.5 268 21 0 363 - 0 384
AHU SFP 1.8 301 12 0 407 - 0 418
AHU SFP 2 306 11 0 413 - 0 424
AHU SFP 2.2 310 10 0 420 - 0 430
Lighting Efficacy 65 298 28 0 402 - 0 430
Lighting Efficacy 60 303 23 0 410 - 0 433
Lighting Efficacy 55 310 23 0 420 - 0 442

AECOM Ireland Existing Domestic Building Results – Draft 12/02/13 64 Capabilities on project: Building Engineering
Primary (EE1): Financial Costs (Central energy price, 7% discount rate, EUR/m²)
Package Value PE (KWh/m²)
Initial Investment
Cost
Annual Costs Cost of Emissions
Residual Value
Macro Cost Maintenance Energy
Wall U-Value 0.1 162 57 0 223 - -4 277
Wall U-Value 0.14 164 27 0 226 - -2 251
Wall U-Value 0.16 164 51 0 227 - -4 274
Wall U-Value 0.19 166 13 0 228 - -1 241
Wall U-Value 0.21 166 24 0 230 - -2 252
Wall U-Value 0.3 170 3 0 235 - 0 238
Wall U-Value 0.39 174 10 0 240 - -1 249
Roof U-value 0.15 172 15 0 238 - -1 251
Roof U-value 0.2 173 13 0 238 - -1 251
Roof U-value 0.25 173 11 0 239 - -1 249
Heating Source GSHP 62 30 9 88 - 0 127
Heating Source Gas CHP 140 62 41 265 - 0 368
Heating Source Gas (91%) + SHW 155 47 10 214 - 0 271
Heating Source Gas (91%) 155 8 10 214 - 0 232
Heating Source Gas (86%) 163 8 10 224 - 0 242
Floor U-value 0.1 158 11 0 218 - -1 228
Floor U-value 0.15 161 8 0 222 - -1 229
Floor U-value 0.2 163 6 0 225 - 0 231
Floor U-value 0.25 166 5 0 229 - 0 233
Window U-value 0.9 142 47 0 196 - 0 243
Window U-value 1.1 147 44 0 204 - 0 247
Window U-value 1.8 150 29 0 208 - 0 237
Window U-value 1.4 152 34 0 210 - 0 244
Lighting Efficacy 65 157 23 0 214 - 0 237
Lighting Efficacy 60 158 21 0 216 - 0 237
Lighting Efficacy 55 160 20 0 218 - 0 238

AECOM Ireland Existing Domestic Building Results – Draft 12/02/13 65 Capabilities on project: Building Engineering
Primary (EE2): Financial Costs (Central energy price, 7% discount rate, EUR/m²)
Package Value PE (KWh/m²)
Initial Investment
Cost
Annual Costs Cost of Emissions
Residual Value
Macro Cost Maintenance Energy
Wall U-Value 0.1 84 57 0 116 - -4 169
Wall U-Value 0.14 86 27 0 118 - -2 143
Wall U-Value 0.16 87 51 0 119 - -4 167
Wall U-Value 0.19 88 13 0 121 - -1 133
Wall U-Value 0.21 89 24 0 122 - -2 144
Wall U-Value 0.3 92 3 0 127 - 0 130
Wall U-Value 0.39 96 10 0 131 - -1 141
Roof U-value 0.15 93 15 0 128 - -1 142
Roof U-value 0.2 94 13 0 129 - -1 141
Roof U-value 0.25 94 11 0 129 - -1 139
Heating Source GSHP 27 30 9 39 - 0 78
Heating Source Gas CHP 82 62 41 162 - 0 265
Heating Source Gas (91%) + SHW 92 47 10 126 - 0 183
Heating Source Gas (91%) 92 8 10 126 - 0 144
Heating Source Gas (86%) 97 8 10 134 - 0 151
Floor U-value 0.1 87 11 0 120 - -1 130
Floor U-value 0.15 89 8 0 123 - -1 130
Floor U-value 0.2 92 6 0 126 - 0 132
Floor U-value 0.25 94 5 0 129 - 0 134
Window U-value 0.9 81 47 0 111 - 0 158
Window U-value 1.1 86 44 0 118 - 0 162
Window U-value 1.8 89 29 0 122 - 0 151
Window U-value 1.4 90 34 0 124 - 0 158
Lighting Efficacy 65 91 23 0 125 - 0 147
Lighting Efficacy 60 92 21 0 126 - 0 147
Lighting Efficacy 55 93 20 0 127 - 0 147

AECOM Ireland Existing Domestic Building Results – Draft 12/02/13 66 Capabilities on project: Building Engineering
Hotel (EE1): Financial Costs (Central energy price, 7% discount rate, EUR/m²)
Package Value PE (KWh/m²)
Initial Investment
Cost
Annual Costs Cost of Emissions
Residual Value
Macro Cost Maintenance Energy
Wall U-Value 0.1 566 94 0 765 - -17 842
Wall U-Value 0.14 568 44 0 767 - -8 803
Wall U-Value 0.16 568 84 0 768 - -16 837
Wall U-Value 0.19 569 22 0 769 - -4 787
Wall U-Value 0.21 570 39 0 770 - -7 802
Wall U-Value 0.3 573 5 0 774 - -1 779
Wall U-Value 0.39 576 17 0 778 - -3 792
Roof U-value 0.15 576 10 0 778 - -2 786
Roof U-value 0.2 577 9 0 780 - -2 787
Roof U-value 0.25 578 7 0 781 - -1 787
Heating Source GSHP 457 29 8 618 - 0 655
Heating Source Gas CHP 542 74 38 764 - 0 875
Heating Source Gas (91%) + SHW 563 35 8 761 - 0 804
Heating Source Gas (91%) 576 8 8 779 - 0 794
Heating Source Gas (86%) 586 8 8 792 - 0 808
Floor U-value 0.1 570 7 0 770 - -1 776
Floor U-value 0.15 571 5 0 772 - -1 776
Floor U-value 0.2 572 4 0 773 - -1 777
Floor U-value 0.25 573 3 0 775 - -1 778
Window U-value 1.1 547 87 0 739 - -8 818
Window U-value 0.9 548 93 0 740 - -9 824
Window U-value 1.4 550 68 0 744 - -6 805
Window U-value 1.8 563 58 0 761 - -5 813
Chiller Efficiency 5.5 546 31 0 737 - 0 768
Chiller Efficiency 4.5 549 27 0 742 - 0 769
Chiller Efficiency 3.5 554 25 0 748 - 0 774
AHU SFP 1.8 558 10 0 754 - 0 764
AHU SFP 2 564 10 0 762 - 0 771
AHU SFP 2.2 569 9 0 769 - 0 779
Lighting Efficacy 65 489 51 0 660 - 0 711
Lighting Efficacy 60 491 46 0 663 - 0 708
Lighting Efficacy 55 493 39 0 666 - 0 705

AECOM Ireland Existing Domestic Building Results – Draft 12/02/13 67 Capabilities on project: Building Engineering
Hotel (EE2): Financial Costs (Central energy price, 7% discount rate, EUR/m²)
Package Value PE (KWh/m²)
Initial Investment
Cost
Annual Costs Cost of Emissions
Residual Value
Macro Cost Maintenance Energy
Wall U-Value 0.1 442 94 0 598 - -17 674
Wall U-Value 0.14 444 44 0 600 - -8 636
Wall U-Value 0.16 445 84 0 601 - -16 669
Wall U-Value 0.19 446 22 0 602 - -4 620
Wall U-Value 0.21 446 39 0 603 - -7 635
Wall U-Value 0.3 450 5 0 607 - -1 612
Wall U-Value 0.39 453 17 0 612 - -3 626
Roof U-value 0.15 453 10 0 612 - -2 620
Roof U-value 0.2 454 9 0 613 - -2 621
Roof U-value 0.25 455 7 0 615 - -1 621
Heating Source GSHP 325 29 8 439 - 0 476
Heating Source Gas CHP 420 74 38 602 - 0 713
Heating Source Gas (91%) + SHW 446 35 8 603 - 0 647
Heating Source Gas (91%) 458 8 8 618 - 0 634
Heating Source Gas (86%) 469 8 8 633 - 0 649
Floor U-value 0.1 446 7 0 603 - -1 609
Floor U-value 0.15 448 5 0 604 - -1 609
Floor U-value 0.2 449 4 0 606 - -1 610
Floor U-value 0.25 450 3 0 608 - -1 611
Window U-value 0.9 431 93 0 582 - -9 666
Window U-value 1.1 434 87 0 586 - -8 665
Window U-value 1.4 439 68 0 593 - -6 654
Window U-value 1.8 445 58 0 601 - -5 654
Chiller Efficiency 5.5 437 31 0 590 - 0 621
Chiller Efficiency 4.5 439 27 0 593 - 0 620
Chiller Efficiency 3.5 442 25 0 597 - 0 623
AHU SFP 1.8 444 10 0 599 - 0 610
AHU SFP 2 450 10 0 607 - 0 617
AHU SFP 2.2 455 9 0 615 - 0 624
Lighting Efficacy 65 434 51 0 587 - 0 638
Lighting Efficacy 60 436 46 0 589 - 0 635
Lighting Efficacy 55 439 39 0 593 - 0 632

AECOM Ireland Existing Domestic Building Results – Draft 12/02/13 68 Capabilities on project: Building Engineering
Table G: Financial Costs Low energy price 7% discount rate

AECOM Ireland Existing Domestic Building Results – Draft 12/02/13 69 Capabilities on project: Building Engineering
Retail (EE1): Financial Costs (Low energy price, 7% discount rate, EUR/m²)
Package Value PE (KWh/m²)
Initial Investment
Cost
Annual Costs Cost of Emissions
Residual Value
Macro Cost Maintenance Energy
Wall U-Value 0.11 646 66 0 688 - -12 742
Wall U-Value 0.15 (b) 647 55 0 689 - -10 734
Wall U-Value 0.15 647 59 0 689 - -11 737
Wall U-Value 0.2 648 50 0 689 - -9 730
Wall U-Value 0.21 648 57 0 690 - -11 736
Wall U-Value 0.27 649 54 0 691 - -10 734
Wall U-Value 0.36 651 51 0 692 - -9 733
Wall U-Value 0.47 653 48 0 694 - -9 732
Roof U-value 0.14 648 0 0 689 - 0 689
Roof U-value 0.18 649 0 0 691 - 0 691
Roof U-value 0.29 654 0 0 695 - 0 695
Heating Source ASHP 558 41 10 605 - 0 656
Heating Source Gas CHP 620 132 78 671 - 0 881
Heating Source Gas (91%) 646 11 12 688 - 0 710
Heating Source Gas (91%) + SHW 646 104 12 688 - 0 803
Heating Source Gas (86%) 653 11 12 694 - 0 717
Floor U-value 0.25 652 12 0 695 - -2 705
Floor U-value 0.2 652 14 0 695 - -3 707
Floor U-value 0.15 653 18 0 696 - -3 711
Floor U-value 0.1 653 26 0 697 - -5 718
Window U-value 1.4 644 15 0 685 - -1 698
Window U-value 1.1 644 19 0 685 - -2 702
Window U-value 0.9 647 20 0 688 - -2 707
Window U-value 1.8 653 13 0 694 - -1 706
Chiller Efficiency 5.5 533 30 0 564 - 0 595
Chiller Efficiency 4.5 545 27 0 577 - 0 604
Chiller Efficiency 3.5 564 25 0 598 - 0 623
AHU SFP 1.8 641 19 0 681 - 0 699
AHU SFP 2 646 17 0 687 - 0 704
AHU SFP 2.2 652 16 0 693 - 0 710
Lighting Efficacy 65 490 6 0 515 - 0 521
Lighting Efficacy 60 498 5 0 524 - 0 530
Lighting Efficacy 55 508 5 0 535 - 0 540

AECOM Ireland Existing Domestic Building Results – Draft 12/02/13 70 Capabilities on project: Building Engineering
Retail (EE2): Financial Costs (Low energy price, 7% discount rate, EUR/m²)
Package Value PE (KWh/m²)
Initial Investment
Cost
Annual Costs Cost of Emissions
Residual Value
Macro Cost Maintenance Energy
Wall U-Value 0.11 501 66 0 529 - -12 583
Wall U-Value 0.15 (b) 502 55 0 530 - -10 575
Wall U-Value 0.15 502 59 0 530 - -11 578
Wall U-Value 0.2 503 50 0 531 - -9 572
Wall U-Value 0.21 503 57 0 531 - -11 578
Wall U-Value 0.27 504 54 0 533 - -10 577
Wall U-Value 0.36 506 51 0 534 - -9 576
Wall U-Value 0.47 509 48 0 537 - -9 576
Roof U-value 0.14 503 0 0 531 - 0 531
Roof U-value 0.18 505 0 0 533 - 0 533
Roof U-value 0.29 511 0 0 538 - 0 538
Heating Source ASHP 406 41 10 439 - 0 491
Heating Source Gas CHP 473 132 78 512 - 0 722
Heating Source Gas (91%) 502 11 12 530 - 0 553
Heating Source Gas (91%) + SHW 502 104 12 530 - 0 645
Heating Source Gas (86%) 510 11 12 538 - 0 560
Floor U-value 0.1 496 26 0 526 - -5 547
Floor U-value 0.15 497 18 0 527 - -3 542
Floor U-value 0.2 498 14 0 528 - -3 539
Floor U-value 0.25 502 12 0 531 - -2 541
Window U-value 1.1 502 19 0 530 - -2 547
Window U-value 1.4 502 15 0 530 - -1 543
Window U-value 0.9 504 20 0 532 - -2 550
Window U-value 1.8 508 13 0 536 - -1 548
Chiller Efficiency 5.5 461 30 0 485 - 0 515
Chiller Efficiency 4.5 470 27 0 495 - 0 522
Chiller Efficiency 3.5 485 25 0 511 - 0 536
AHU SFP 1.8 497 19 0 524 - 0 542
AHU SFP 2 503 17 0 530 - 0 547
AHU SFP 2.2 508 16 0 536 - 0 553
Lighting Efficacy 65 453 6 0 475 - 0 481
Lighting Efficacy 60 460 5 0 483 - 0 489
Lighting Efficacy 55 469 5 0 493 - 0 498
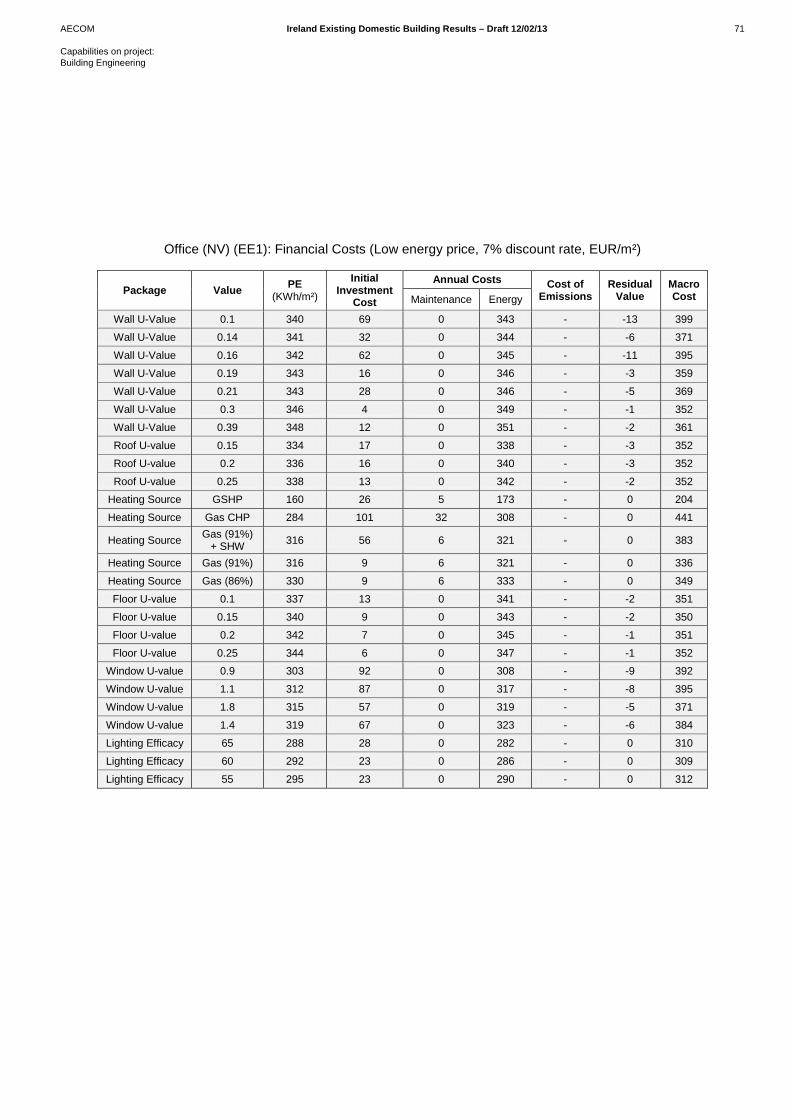
AECOM Ireland Existing Domestic Building Results – Draft 12/02/13 71 Capabilities on project: Building Engineering
Office (NV) (EE1): Financial Costs (Low energy price, 7% discount rate, EUR/m²)
Package Value PE (KWh/m²)
Initial Investment
Cost
Annual Costs Cost of Emissions
Residual Value
Macro Cost Maintenance Energy
Wall U-Value 0.1 340 69 0 343 - -13 399
Wall U-Value 0.14 341 32 0 344 - -6 371
Wall U-Value 0.16 342 62 0 345 - -11 395
Wall U-Value 0.19 343 16 0 346 - -3 359
Wall U-Value 0.21 343 28 0 346 - -5 369
Wall U-Value 0.3 346 4 0 349 - -1 352
Wall U-Value 0.39 348 12 0 351 - -2 361
Roof U-value 0.15 334 17 0 338 - -3 352
Roof U-value 0.2 336 16 0 340 - -3 352
Roof U-value 0.25 338 13 0 342 - -2 352
Heating Source GSHP 160 26 5 173 - 0 204
Heating Source Gas CHP 284 101 32 308 - 0 441
Heating Source Gas (91%) + SHW 316 56 6 321 - 0 383
Heating Source Gas (91%) 316 9 6 321 - 0 336
Heating Source Gas (86%) 330 9 6 333 - 0 349
Floor U-value 0.1 337 13 0 341 - -2 351
Floor U-value 0.15 340 9 0 343 - -2 350
Floor U-value 0.2 342 7 0 345 - -1 351
Floor U-value 0.25 344 6 0 347 - -1 352
Window U-value 0.9 303 92 0 308 - -9 392
Window U-value 1.1 312 87 0 317 - -8 395
Window U-value 1.8 315 57 0 319 - -5 371
Window U-value 1.4 319 67 0 323 - -6 384
Lighting Efficacy 65 288 28 0 282 - 0 310
Lighting Efficacy 60 292 23 0 286 - 0 309
Lighting Efficacy 55 295 23 0 290 - 0 312

AECOM Ireland Existing Domestic Building Results – Draft 12/02/13 72 Capabilities on project: Building Engineering
Office (NV) (EE2): Financial Costs (Low energy price, 7% discount rate, EUR/m²)
Package Value PE (KWh/m²)
Initial Investment
Cost
Annual Costs Cost of Emissions
Residual Value
Macro Cost Maintenance Energy
Wall U-Value 0.1 271 69 0 275 - -13 331
Wall U-Value 0.14 272 32 0 276 - -6 302
Wall U-Value 0.16 273 62 0 277 - -11 327
Wall U-Value 0.19 274 16 0 278 - -3 291
Wall U-Value 0.21 275 28 0 278 - -5 301
Wall U-Value 0.3 277 4 0 281 - -1 284
Wall U-Value 0.39 279 12 0 283 - -2 293
Roof U-value 0.15 277 17 0 281 - -3 295
Roof U-value 0.2 279 16 0 282 - -3 295
Roof U-value 0.25 281 13 0 284 - -2 295
Heating Source GSHP 136 26 5 147 - 0 178
Heating Source Gas CHP 242 101 32 263 - 0 396
Heating Source Gas (91%) + SHW 270 56 6 274 - 0 336
Heating Source Gas (91%) 270 9 6 274 - 0 289
Heating Source Gas (86%) 281 9 6 284 - 0 300
Floor U-value 0.1 267 13 0 271 - -2 282
Floor U-value 0.15 269 9 0 273 - -2 281
Floor U-value 0.2 271 7 0 275 - -1 281
Floor U-value 0.25 273 6 0 277 - -1 282
Window U-value 0.9 252 92 0 257 - -9 341
Window U-value 1.1 259 87 0 264 - -8 343
Window U-value 1.8 262 57 0 267 - -5 319
Window U-value 1.4 266 67 0 270 - -6 331
Lighting Efficacy 65 231 28 0 228 - 0 256
Lighting Efficacy 60 235 23 0 232 - 0 255
Lighting Efficacy 55 239 23 0 237 - 0 260

AECOM Ireland Existing Domestic Building Results – Draft 12/02/13 73 Capabilities on project: Building Engineering
Office (AC) (EE1): Financial Costs (Low energy price, 7% discount rate, EUR/m²)
Package Value PE (KWh/m²)
Initial Investment
Cost
Annual Costs Cost of Emissions
Residual Value
Macro Cost Maintenance Energy
Wall U-Value 0.11 401 75 0 416 - -14 477
Wall U-Value 0.15 (b) 402 63 0 416 - -12 468
Wall U-Value 0.15 402 67 0 416 - -12 471
Wall U-Value 0.2 403 57 0 417 - -11 464
Wall U-Value 0.21 403 65 0 417 - -12 470
Wall U-Value 0.27 404 61 0 418 - -11 468
Wall U-Value 0.36 406 58 0 420 - -11 467
Wall U-Value 0.47 408 54 0 421 - -10 466
Roof U-value 0.14 404 0 0 418 - 0 418
Roof U-value 0.18 405 0 0 419 - 0 419
Roof U-value 0.29 409 0 0 422 - 0 422
Heating Source GSHP 263 26 5 285 - 0 316
Heating Source Gas CHP 362 101 32 393 - 0 526
Heating Source Gas (91%) 406 9 6 420 - 0 436
Heating Source Gas (91%) + SHW 406 56 6 420 - 0 483
Heating Source Gas (86%) 418 9 6 431 - 0 447
Floor U-value 0.1 395 13 0 410 - -2 420
Floor U-value 0.15 397 9 0 411 - -2 419
Floor U-value 0.2 398 7 0 413 - -1 419
Floor U-value 0.25 400 6 0 414 - -1 419
Window U-value 1.1 377 87 0 390 - -8 469
Window U-value 1.4 380 67 0 392 - -6 453
Window U-value 0.9 383 92 0 397 - -9 481
Window U-value 1.8 405 57 0 419 - -5 471
Chiller Efficiency 5.5 342 26 0 350 - 0 376
Chiller Efficiency 4.5 349 23 0 358 - 0 381
Chiller Efficiency 3.5 361 21 0 371 - 0 392
AHU SFP 1.8 391 12 0 403 - 0 415
AHU SFP 2 395 11 0 408 - 0 419
AHU SFP 2.2 400 10 0 413 - 0 423
Lighting Efficacy 65 366 28 0 375 - 0 403
Lighting Efficacy 60 371 23 0 381 - 0 404
Lighting Efficacy 55 378 23 0 388 - 0 411

AECOM Ireland Existing Domestic Building Results – Draft 12/02/13 74 Capabilities on project: Building Engineering
Office (AC) (EE2): Financial Costs (Low energy price, 7% discount rate, EUR/m²)
Package Value PE (KWh/m²)
Initial Investment
Cost
Annual Costs Cost of Emissions
Residual Value
Macro Cost Maintenance Energy
Wall U-Value 0.11 305 75 0 320 - -14 381
Wall U-Value 0.15 (b) 306 63 0 321 - -12 372
Wall U-Value 0.15 306 67 0 321 - -12 376
Wall U-Value 0.2 307 57 0 321 - -11 368
Wall U-Value 0.21 307 65 0 322 - -12 375
Wall U-Value 0.27 309 61 0 323 - -11 373
Wall U-Value 0.36 311 58 0 324 - -11 371
Wall U-Value 0.47 313 54 0 326 - -10 370
Roof U-value 0.14 307 0 0 321 - 0 321
Roof U-value 0.18 308 0 0 322 - 0 322
Roof U-value 0.29 312 0 0 325 - 0 325
Heating Source GSHP 225 26 5 243 - 0 275
Heating Source Gas CHP 290 101 32 314 - 0 447
Heating Source Gas (91%) 319 9 6 333 - 0 348
Heating Source Gas (91%) + SHW 319 56 6 333 - 0 395
Heating Source Gas (86%) 327 9 6 340 - 0 356
Floor U-value 0.1 305 13 0 319 - -2 329
Floor U-value 0.15 306 9 0 321 - -2 328
Floor U-value 0.2 308 7 0 322 - -1 328
Floor U-value 0.25 310 6 0 324 - -1 329
Window U-value 1.1 276 87 0 289 - -8 368
Window U-value 1.4 280 67 0 292 - -6 353
Window U-value 0.9 282 92 0 296 - -9 380
Window U-value 1.8 307 57 0 322 - -5 374
Chiller Efficiency 5.5 250 26 0 259 - 0 285
Chiller Efficiency 4.5 257 23 0 267 - 0 289
Chiller Efficiency 3.5 268 21 0 279 - 0 300
AHU SFP 1.8 301 12 0 314 - 0 325
AHU SFP 2 306 11 0 319 - 0 330
AHU SFP 2.2 310 10 0 324 - 0 334
Lighting Efficacy 65 298 28 0 310 - 0 338
Lighting Efficacy 60 303 23 0 316 - 0 339
Lighting Efficacy 55 310 23 0 324 - 0 347

AECOM Ireland Existing Domestic Building Results – Draft 12/02/13 75 Capabilities on project: Building Engineering
Primary (EE1): Financial Costs (Low energy price, 7% discount rate, EUR/m²)
Package Value PE (KWh/m²)
Initial Investment
Cost
Annual Costs Cost of Emissions
Residual Value
Macro Cost Maintenance Energy
Wall U-Value 0.1 162 57 0 164 - -4 218
Wall U-Value 0.14 164 27 0 166 - -2 191
Wall U-Value 0.16 164 51 0 167 - -4 215
Wall U-Value 0.19 166 13 0 168 - -1 181
Wall U-Value 0.21 166 24 0 169 - -2 191
Wall U-Value 0.3 170 3 0 172 - 0 175
Wall U-Value 0.39 174 10 0 176 - -1 185
Roof U-value 0.15 172 15 0 175 - -1 188
Roof U-value 0.2 173 13 0 175 - -1 187
Roof U-value 0.25 173 11 0 176 - -1 186
Heating Source GSHP 62 30 9 70 - 0 109
Heating Source Gas CHP 140 62 41 190 - 0 293
Heating Source Gas (91%) + SHW 155 47 10 158 - 0 215
Heating Source Gas (91%) 155 8 10 158 - 0 176
Heating Source Gas (86%) 163 8 10 165 - 0 183
Floor U-value 0.1 158 11 0 161 - -1 171
Floor U-value 0.15 161 8 0 163 - -1 171
Floor U-value 0.2 163 6 0 166 - 0 172
Floor U-value 0.25 166 5 0 168 - 0 173
Window U-value 0.9 142 47 0 146 - 0 192
Window U-value 1.1 147 44 0 151 - 0 195
Window U-value 1.8 150 29 0 154 - 0 182
Window U-value 1.4 152 34 0 155 - 0 189
Lighting Efficacy 65 157 23 0 154 - 0 177
Lighting Efficacy 60 158 21 0 156 - 0 176
Lighting Efficacy 55 160 20 0 158 - 0 177

AECOM Ireland Existing Domestic Building Results – Draft 12/02/13 76 Capabilities on project: Building Engineering
Primary (EE2): Financial Costs (Low energy price, 7% discount rate, EUR/m²)
Package Value PE (KWh/m²)
Initial Investment
Cost
Annual Costs Cost of Emissions
Residual Value
Macro Cost Maintenance Energy
Wall U-Value 0.1 84 57 0 85 - -4 138
Wall U-Value 0.14 86 27 0 86 - -2 111
Wall U-Value 0.16 87 51 0 87 - -4 135
Wall U-Value 0.19 88 13 0 88 - -1 101
Wall U-Value 0.21 89 24 0 89 - -2 111
Wall U-Value 0.3 92 3 0 92 - 0 95
Wall U-Value 0.39 96 10 0 95 - -1 105
Roof U-value 0.15 93 15 0 93 - -1 107
Roof U-value 0.2 94 13 0 94 - -1 106
Roof U-value 0.25 94 11 0 94 - -1 104
Heating Source GSHP 27 30 9 31 - 0 70
Heating Source Gas CHP 82 62 41 115 - 0 217
Heating Source Gas (91%) + SHW 92 47 10 92 - 0 149
Heating Source Gas (91%) 92 8 10 92 - 0 110
Heating Source Gas (86%) 97 8 10 97 - 0 115
Floor U-value 0.1 87 11 0 87 - -1 97
Floor U-value 0.15 89 8 0 89 - -1 97
Floor U-value 0.2 92 6 0 92 - 0 97
Floor U-value 0.25 94 5 0 94 - 0 99
Window U-value 0.9 81 47 0 81 - 0 128
Window U-value 1.1 86 44 0 86 - 0 130
Window U-value 1.8 89 29 0 89 - 0 118
Window U-value 1.4 90 34 0 90 - 0 124
Lighting Efficacy 65 91 23 0 90 - 0 113
Lighting Efficacy 60 92 21 0 91 - 0 112
Lighting Efficacy 55 93 20 0 92 - 0 112
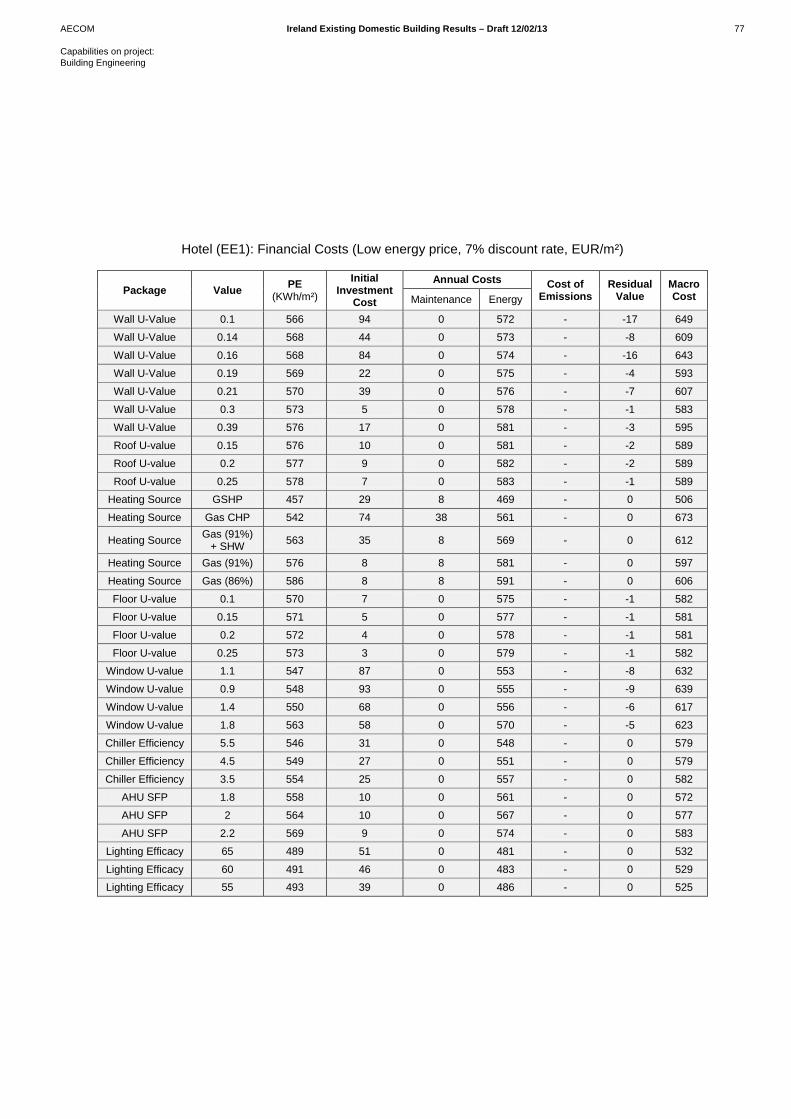
AECOM Ireland Existing Domestic Building Results – Draft 12/02/13 77 Capabilities on project: Building Engineering
Hotel (EE1): Financial Costs (Low energy price, 7% discount rate, EUR/m²)
Package Value PE (KWh/m²)
Initial Investment
Cost
Annual Costs Cost of Emissions
Residual Value
Macro Cost Maintenance Energy
Wall U-Value 0.1 566 94 0 572 - -17 649
Wall U-Value 0.14 568 44 0 573 - -8 609
Wall U-Value 0.16 568 84 0 574 - -16 643
Wall U-Value 0.19 569 22 0 575 - -4 593
Wall U-Value 0.21 570 39 0 576 - -7 607
Wall U-Value 0.3 573 5 0 578 - -1 583
Wall U-Value 0.39 576 17 0 581 - -3 595
Roof U-value 0.15 576 10 0 581 - -2 589
Roof U-value 0.2 577 9 0 582 - -2 589
Roof U-value 0.25 578 7 0 583 - -1 589
Heating Source GSHP 457 29 8 469 - 0 506
Heating Source Gas CHP 542 74 38 561 - 0 673
Heating Source Gas (91%) + SHW 563 35 8 569 - 0 612
Heating Source Gas (91%) 576 8 8 581 - 0 597
Heating Source Gas (86%) 586 8 8 591 - 0 606
Floor U-value 0.1 570 7 0 575 - -1 582
Floor U-value 0.15 571 5 0 577 - -1 581
Floor U-value 0.2 572 4 0 578 - -1 581
Floor U-value 0.25 573 3 0 579 - -1 582
Window U-value 1.1 547 87 0 553 - -8 632
Window U-value 0.9 548 93 0 555 - -9 639
Window U-value 1.4 550 68 0 556 - -6 617
Window U-value 1.8 563 58 0 570 - -5 623
Chiller Efficiency 5.5 546 31 0 548 - 0 579
Chiller Efficiency 4.5 549 27 0 551 - 0 579
Chiller Efficiency 3.5 554 25 0 557 - 0 582
AHU SFP 1.8 558 10 0 561 - 0 572
AHU SFP 2 564 10 0 567 - 0 577
AHU SFP 2.2 569 9 0 574 - 0 583
Lighting Efficacy 65 489 51 0 481 - 0 532
Lighting Efficacy 60 491 46 0 483 - 0 529
Lighting Efficacy 55 493 39 0 486 - 0 525

AECOM Ireland Existing Domestic Building Results – Draft 12/02/13 78 Capabilities on project: Building Engineering
Hotel (EE2): Financial Costs (Low energy price, 7% discount rate, EUR/m²)
Package Value PE (KWh/m²)
Initial Investment
Cost
Annual Costs Cost of Emissions
Residual Value
Macro Cost Maintenance Energy
Wall U-Value 0.1 442 94 0 441 - -17 517
Wall U-Value 0.14 444 44 0 442 - -8 478
Wall U-Value 0.16 445 84 0 443 - -16 511
Wall U-Value 0.19 446 22 0 444 - -4 462
Wall U-Value 0.21 446 39 0 444 - -7 476
Wall U-Value 0.3 450 5 0 447 - -1 452
Wall U-Value 0.39 453 17 0 450 - -3 464
Roof U-value 0.15 453 10 0 450 - -2 458
Roof U-value 0.2 454 9 0 451 - -2 459
Roof U-value 0.25 455 7 0 452 - -1 459
Heating Source GSHP 325 29 8 329 - 0 366
Heating Source Gas CHP 420 74 38 433 - 0 544
Heating Source Gas (91%) + SHW 446 35 8 444 - 0 488
Heating Source Gas (91%) 458 8 8 455 - 0 471
Heating Source Gas (86%) 469 8 8 465 - 0 481
Floor U-value 0.1 446 7 0 444 - -1 450
Floor U-value 0.15 448 5 0 445 - -1 450
Floor U-value 0.2 449 4 0 446 - -1 450
Floor U-value 0.25 450 3 0 448 - -1 450
Window U-value 0.9 431 93 0 429 - -9 513
Window U-value 1.1 434 87 0 431 - -8 510
Window U-value 1.4 439 68 0 436 - -6 497
Window U-value 1.8 445 58 0 443 - -5 496
Chiller Efficiency 5.5 437 31 0 432 - 0 463
Chiller Efficiency 4.5 439 27 0 435 - 0 462
Chiller Efficiency 3.5 442 25 0 438 - 0 464
AHU SFP 1.8 444 10 0 440 - 0 450
AHU SFP 2 450 10 0 446 - 0 456
AHU SFP 2.2 455 9 0 452 - 0 462
Lighting Efficacy 65 434 51 0 428 - 0 479
Lighting Efficacy 60 436 46 0 431 - 0 476
Lighting Efficacy 55 439 39 0 433 - 0 473

AECOM Ireland Existing Domestic Building Results – Draft 12/02/13 79 Capabilities on project: Building Engineering
Table H: Financial Costs High energy price 7% discount rate

AECOM Ireland Existing Domestic Building Results – Draft 12/02/13 80 Capabilities on project: Building Engineering
Retail (EE1): Financial Costs (High energy price, 7% discount rate, EUR/m²)
Package Value PE (KWh/m²)
Initial Investment
Cost
Annual Costs Cost of Emissions
Residual Value
Macro Cost Maintenance Energy
Wall U-Value 0.11 646 66 0 1061 - -12 1115
Wall U-Value 0.15 (b) 647 55 0 1062 - -10 1107
Wall U-Value 0.15 647 59 0 1062 - -11 1110
Wall U-Value 0.2 648 50 0 1064 - -9 1105
Wall U-Value 0.21 648 57 0 1064 - -11 1111
Wall U-Value 0.27 649 54 0 1066 - -10 1110
Wall U-Value 0.36 651 51 0 1069 - -9 1110
Wall U-Value 0.47 653 48 0 1072 - -9 1111
Roof U-value 0.14 648 0 0 1064 - 0 1064
Roof U-value 0.18 649 0 0 1066 - 0 1066
Roof U-value 0.29 654 0 0 1075 - 0 1075
Heating Source ASHP 558 41 10 907 - 0 959
Heating Source Gas CHP 620 132 78 1051 - 0 1260
Heating Source Gas (91%) 646 11 12 1061 - 0 1084
Heating Source Gas (91%) + SHW 646 104 12 1061 - 0 1176
Heating Source Gas (86%) 653 11 12 1074 - 0 1097
Floor U-value 0.25 652 12 0 1070 - -2 1080
Floor U-value 0.2 652 14 0 1070 - -3 1082
Floor U-value 0.15 653 18 0 1070 - -3 1085
Floor U-value 0.1 653 26 0 1071 - -5 1092
Window U-value 1.4 644 15 0 1058 - -1 1071
Window U-value 1.1 644 19 0 1058 - -2 1075
Window U-value 0.9 647 20 0 1063 - -2 1082
Window U-value 1.8 653 13 0 1072 - -1 1084
Chiller Efficiency 5.5 533 30 0 878 - 0 908
Chiller Efficiency 4.5 545 27 0 898 - 0 924
Chiller Efficiency 3.5 564 25 0 928 - 0 953
AHU SFP 1.8 641 19 0 1053 - 0 1071
AHU SFP 2 646 17 0 1062 - 0 1079
AHU SFP 2.2 652 16 0 1072 - 0 1088
Lighting Efficacy 65 490 6 0 810 - 0 816
Lighting Efficacy 60 498 5 0 823 - 0 829
Lighting Efficacy 55 508 5 0 839 - 0 844

AECOM Ireland Existing Domestic Building Results – Draft 12/02/13 81 Capabilities on project: Building Engineering
Retail (EE2): Financial Costs (High energy price, 7% discount rate, EUR/m²)
Package Value PE (KWh/m²)
Initial Investment
Cost
Annual Costs Cost of Emissions
Residual Value
Macro Cost Maintenance Energy
Wall U-Value 0.11 501 66 0 826 - -12 879
Wall U-Value 0.15 (b) 502 55 0 827 - -10 872
Wall U-Value 0.15 502 59 0 827 - -11 875
Wall U-Value 0.2 503 50 0 829 - -9 870
Wall U-Value 0.21 503 57 0 830 - -11 876
Wall U-Value 0.27 504 54 0 832 - -10 876
Wall U-Value 0.36 506 51 0 836 - -9 877
Wall U-Value 0.47 509 48 0 840 - -9 879
Roof U-value 0.14 503 0 0 829 - 0 829
Roof U-value 0.18 505 0 0 833 - 0 833
Roof U-value 0.29 511 0 0 843 - 0 843
Heating Source ASHP 406 41 10 659 - 0 710
Heating Source Gas CHP 473 132 78 816 - 0 1026
Heating Source Gas (91%) 502 11 12 828 - 0 850
Heating Source Gas (91%) + SHW 502 104 12 828 - 0 943
Heating Source Gas (86%) 510 11 12 842 - 0 864
Floor U-value 0.1 496 26 0 816 - -5 837
Floor U-value 0.15 497 18 0 818 - -3 833
Floor U-value 0.2 498 14 0 820 - -3 831
Floor U-value 0.25 502 12 0 828 - -2 837
Window U-value 1.1 502 19 0 829 - -2 846
Window U-value 1.4 502 15 0 829 - -1 843
Window U-value 0.9 504 20 0 831 - -2 850
Window U-value 1.8 508 13 0 838 - -1 850
Chiller Efficiency 5.5 461 30 0 762 - 0 792
Chiller Efficiency 4.5 470 27 0 777 - 0 804
Chiller Efficiency 3.5 485 25 0 801 - 0 826
AHU SFP 1.8 497 19 0 820 - 0 839
AHU SFP 2 503 17 0 830 - 0 847
AHU SFP 2.2 508 16 0 839 - 0 855
Lighting Efficacy 65 453 6 0 750 - 0 756
Lighting Efficacy 60 460 5 0 761 - 0 767
Lighting Efficacy 55 469 5 0 775 - 0 780

AECOM Ireland Existing Domestic Building Results – Draft 12/02/13 82 Capabilities on project: Building Engineering
Office (NV) (EE1): Financial Costs (High energy price, 7% discount rate, EUR/m²)
Package Value PE (KWh/m²)
Initial Investment
Cost
Annual Costs Cost of Emissions
Residual Value
Macro Cost Maintenance Energy
Wall U-Value 0.1 340 69 0 575 - -13 632
Wall U-Value 0.14 341 32 0 578 - -6 604
Wall U-Value 0.16 342 62 0 579 - -11 629
Wall U-Value 0.19 343 16 0 580 - -3 594
Wall U-Value 0.21 343 28 0 581 - -5 604
Wall U-Value 0.3 346 4 0 586 - -1 589
Wall U-Value 0.39 348 12 0 590 - -2 600
Roof U-value 0.15 334 17 0 566 - -3 580
Roof U-value 0.2 336 16 0 569 - -3 582
Roof U-value 0.25 338 13 0 573 - -2 583
Heating Source GSHP 160 26 5 259 - 0 290
Heating Source Gas CHP 284 101 32 551 - 0 684
Heating Source Gas (91%) + SHW 316 56 6 534 - 0 597
Heating Source Gas (91%) 316 9 6 534 - 0 550
Heating Source Gas (86%) 330 9 6 557 - 0 573
Floor U-value 0.1 337 13 0 571 - -2 582
Floor U-value 0.15 340 9 0 575 - -2 582
Floor U-value 0.2 342 7 0 579 - -1 585
Floor U-value 0.25 344 6 0 582 - -1 587
Window U-value 0.9 303 92 0 511 - -9 595
Window U-value 1.1 312 87 0 526 - -8 605
Window U-value 1.8 315 57 0 531 - -5 583
Window U-value 1.4 319 67 0 538 - -6 599
Lighting Efficacy 65 288 28 0 497 - 0 525
Lighting Efficacy 60 292 23 0 502 - 0 525
Lighting Efficacy 55 295 23 0 507 - 0 529

AECOM Ireland Existing Domestic Building Results – Draft 12/02/13 83 Capabilities on project: Building Engineering
Office (NV) (EE2): Financial Costs (High energy price, 7% discount rate, EUR/m²)
Package Value PE (KWh/m²)
Initial Investment
Cost
Annual Costs Cost of Emissions
Residual Value
Macro Cost Maintenance Energy
Wall U-Value 0.1 271 69 0 458 - -13 514
Wall U-Value 0.14 272 32 0 460 - -6 486
Wall U-Value 0.16 273 62 0 462 - -11 512
Wall U-Value 0.19 274 16 0 463 - -3 477
Wall U-Value 0.21 275 28 0 464 - -5 487
Wall U-Value 0.3 277 4 0 469 - -1 472
Wall U-Value 0.39 279 12 0 473 - -2 483
Roof U-value 0.15 277 17 0 469 - -3 483
Roof U-value 0.2 279 16 0 472 - -3 485
Roof U-value 0.25 281 13 0 475 - -2 486
Heating Source GSHP 136 26 5 221 - 0 252
Heating Source Gas CHP 242 101 32 470 - 0 603
Heating Source Gas (91%) + SHW 270 56 6 455 - 0 518
Heating Source Gas (91%) 270 9 6 455 - 0 471
Heating Source Gas (86%) 281 9 6 475 - 0 491
Floor U-value 0.1 267 13 0 451 - -2 461
Floor U-value 0.15 269 9 0 455 - -2 463
Floor U-value 0.2 271 7 0 458 - -1 464
Floor U-value 0.25 273 6 0 462 - -1 467
Window U-value 0.9 252 92 0 424 - -9 508
Window U-value 1.1 259 87 0 438 - -8 516
Window U-value 1.8 262 57 0 443 - -5 495
Window U-value 1.4 266 67 0 448 - -6 509
Lighting Efficacy 65 231 28 0 396 - 0 424
Lighting Efficacy 60 235 23 0 402 - 0 425
Lighting Efficacy 55 239 23 0 409 - 0 431

AECOM Ireland Existing Domestic Building Results – Draft 12/02/13 84 Capabilities on project: Building Engineering
Office (AC) (EE1): Financial Costs (High energy price, 7% discount rate, EUR/m²)
Package Value PE (KWh/m²)
Initial Investment
Cost
Annual Costs Cost of Emissions
Residual Value
Macro Cost Maintenance Energy
Wall U-Value 0.11 401 75 0 670 - -14 731
Wall U-Value 0.15 (b) 402 63 0 671 - -12 722
Wall U-Value 0.15 402 67 0 671 - -12 726
Wall U-Value 0.2 403 57 0 672 - -11 719
Wall U-Value 0.21 403 65 0 673 - -12 726
Wall U-Value 0.27 404 61 0 675 - -11 725
Wall U-Value 0.36 406 58 0 677 - -11 725
Wall U-Value 0.47 408 54 0 681 - -10 725
Roof U-value 0.14 404 0 0 674 - 0 674
Roof U-value 0.18 405 0 0 676 - 0 676
Roof U-value 0.29 409 0 0 683 - 0 683
Heating Source GSHP 263 26 5 427 - 0 458
Heating Source Gas CHP 362 101 32 659 - 0 793
Heating Source Gas (91%) 406 9 6 679 - 0 694
Heating Source Gas (91%) + SHW 406 56 6 679 - 0 741
Heating Source Gas (86%) 418 9 6 699 - 0 715
Floor U-value 0.1 395 13 0 659 - -2 669
Floor U-value 0.15 397 9 0 661 - -2 669
Floor U-value 0.2 398 7 0 664 - -1 670
Floor U-value 0.25 400 6 0 668 - -1 672
Window U-value 1.1 377 87 0 631 - -8 709
Window U-value 1.4 380 67 0 636 - -6 697
Window U-value 0.9 383 92 0 638 - -9 722
Window U-value 1.8 405 57 0 675 - -5 727
Chiller Efficiency 5.5 342 26 0 574 - 0 600
Chiller Efficiency 4.5 349 23 0 586 - 0 609
Chiller Efficiency 3.5 361 21 0 605 - 0 626
AHU SFP 1.8 391 12 0 653 - 0 665
AHU SFP 2 395 11 0 661 - 0 671
AHU SFP 2.2 400 10 0 669 - 0 679
Lighting Efficacy 65 366 28 0 614 - 0 642
Lighting Efficacy 60 371 23 0 623 - 0 646
Lighting Efficacy 55 378 23 0 633 - 0 655
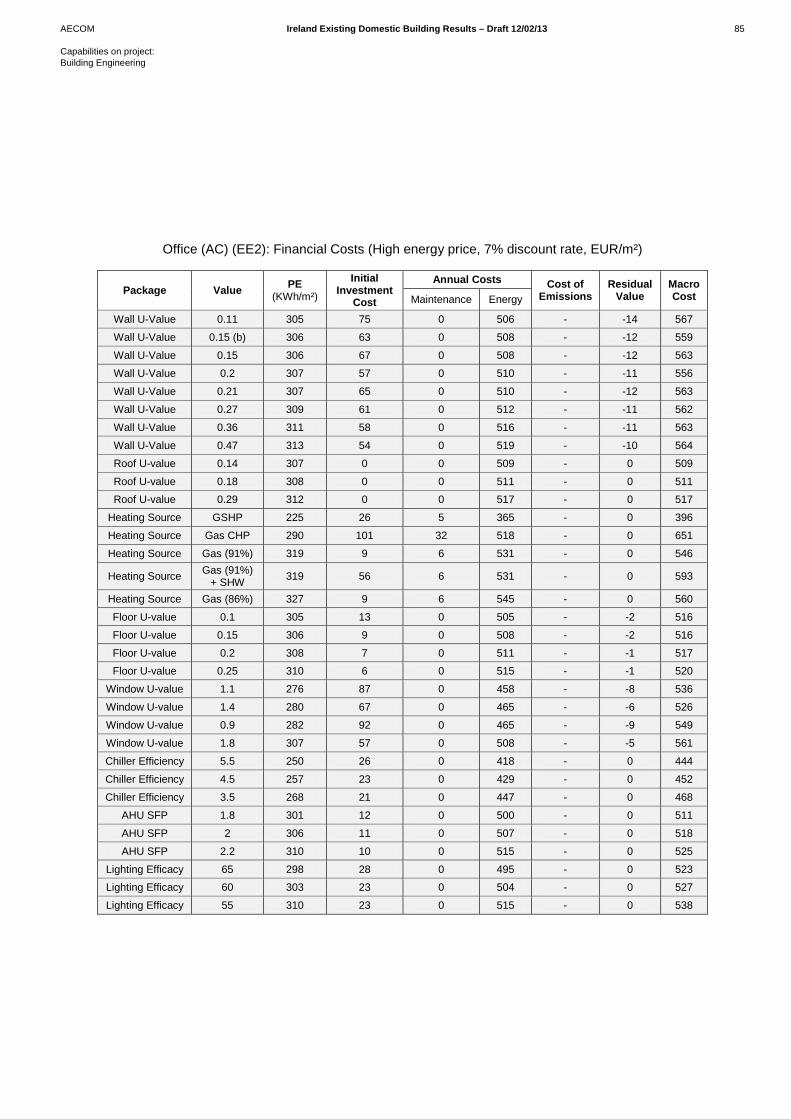
AECOM Ireland Existing Domestic Building Results – Draft 12/02/13 85 Capabilities on project: Building Engineering
Office (AC) (EE2): Financial Costs (High energy price, 7% discount rate, EUR/m²)
Package Value PE (KWh/m²)
Initial Investment
Cost
Annual Costs Cost of Emissions
Residual Value
Macro Cost Maintenance Energy
Wall U-Value 0.11 305 75 0 506 - -14 567
Wall U-Value 0.15 (b) 306 63 0 508 - -12 559
Wall U-Value 0.15 306 67 0 508 - -12 563
Wall U-Value 0.2 307 57 0 510 - -11 556
Wall U-Value 0.21 307 65 0 510 - -12 563
Wall U-Value 0.27 309 61 0 512 - -11 562
Wall U-Value 0.36 311 58 0 516 - -11 563
Wall U-Value 0.47 313 54 0 519 - -10 564
Roof U-value 0.14 307 0 0 509 - 0 509
Roof U-value 0.18 308 0 0 511 - 0 511
Roof U-value 0.29 312 0 0 517 - 0 517
Heating Source GSHP 225 26 5 365 - 0 396
Heating Source Gas CHP 290 101 32 518 - 0 651
Heating Source Gas (91%) 319 9 6 531 - 0 546
Heating Source Gas (91%) + SHW 319 56 6 531 - 0 593
Heating Source Gas (86%) 327 9 6 545 - 0 560
Floor U-value 0.1 305 13 0 505 - -2 516
Floor U-value 0.15 306 9 0 508 - -2 516
Floor U-value 0.2 308 7 0 511 - -1 517
Floor U-value 0.25 310 6 0 515 - -1 520
Window U-value 1.1 276 87 0 458 - -8 536
Window U-value 1.4 280 67 0 465 - -6 526
Window U-value 0.9 282 92 0 465 - -9 549
Window U-value 1.8 307 57 0 508 - -5 561
Chiller Efficiency 5.5 250 26 0 418 - 0 444
Chiller Efficiency 4.5 257 23 0 429 - 0 452
Chiller Efficiency 3.5 268 21 0 447 - 0 468
AHU SFP 1.8 301 12 0 500 - 0 511
AHU SFP 2 306 11 0 507 - 0 518
AHU SFP 2.2 310 10 0 515 - 0 525
Lighting Efficacy 65 298 28 0 495 - 0 523
Lighting Efficacy 60 303 23 0 504 - 0 527
Lighting Efficacy 55 310 23 0 515 - 0 538

AECOM Ireland Existing Domestic Building Results – Draft 12/02/13 86 Capabilities on project: Building Engineering
Primary (EE1): Financial Costs (High energy price, 7% discount rate, EUR/m²)
Package Value PE (KWh/m²)
Initial Investment
Cost
Annual Costs Cost of Emissions
Residual Value
Macro Cost Maintenance Energy
Wall U-Value 0.1 162 57 0 282 - -4 335
Wall U-Value 0.14 164 27 0 285 - -2 310
Wall U-Value 0.16 164 51 0 287 - -4 334
Wall U-Value 0.19 166 13 0 289 - -1 301
Wall U-Value 0.21 166 24 0 290 - -2 312
Wall U-Value 0.3 170 3 0 297 - 0 300
Wall U-Value 0.39 174 10 0 303 - -1 313
Roof U-value 0.15 172 15 0 301 - -1 314
Roof U-value 0.2 173 13 0 302 - -1 314
Roof U-value 0.25 173 11 0 303 - -1 313
Heating Source GSHP 62 30 9 107 - 0 146
Heating Source Gas CHP 140 62 41 340 - 0 442
Heating Source Gas (91%) + SHW 155 47 10 270 - 0 327
Heating Source Gas (91%) 155 8 10 270 - 0 288
Heating Source Gas (86%) 163 8 10 284 - 0 301
Floor U-value 0.1 158 11 0 276 - -1 286
Floor U-value 0.15 161 8 0 280 - -1 288
Floor U-value 0.2 163 6 0 285 - 0 290
Floor U-value 0.25 166 5 0 289 - 0 294
Window U-value 0.9 142 47 0 247 - 0 294
Window U-value 1.1 147 44 0 257 - 0 300
Window U-value 1.8 150 29 0 262 - 0 291
Window U-value 1.4 152 34 0 265 - 0 299
Lighting Efficacy 65 157 23 0 274 - 0 297
Lighting Efficacy 60 158 21 0 277 - 0 297
Lighting Efficacy 55 160 20 0 279 - 0 299

AECOM Ireland Existing Domestic Building Results – Draft 12/02/13 87 Capabilities on project: Building Engineering
Primary (EE2): Financial Costs (High energy price, 7% discount rate, EUR/m²)
Package Value PE (KWh/m²)
Initial Investment
Cost
Annual Costs Cost of Emissions
Residual Value
Macro Cost Maintenance Energy
Wall U-Value 0.1 84 57 0 147 - -4 201
Wall U-Value 0.14 86 27 0 150 - -2 175
Wall U-Value 0.16 87 51 0 152 - -4 199
Wall U-Value 0.19 88 13 0 154 - -1 166
Wall U-Value 0.21 89 24 0 155 - -2 177
Wall U-Value 0.3 92 3 0 161 - 0 164
Wall U-Value 0.39 96 10 0 167 - -1 177
Roof U-value 0.15 93 15 0 163 - -1 177
Roof U-value 0.2 94 13 0 164 - -1 176
Roof U-value 0.25 94 11 0 165 - -1 175
Heating Source GSHP 27 30 9 47 - 0 86
Heating Source Gas CHP 82 62 41 209 - 0 312
Heating Source Gas (91%) + SHW 92 47 10 161 - 0 218
Heating Source Gas (91%) 92 8 10 161 - 0 178
Heating Source Gas (86%) 97 8 10 170 - 0 188
Floor U-value 0.1 87 11 0 152 - -1 162
Floor U-value 0.15 89 8 0 156 - -1 164
Floor U-value 0.2 92 6 0 161 - 0 166
Floor U-value 0.25 94 5 0 165 - 0 169
Window U-value 0.9 81 47 0 141 - 0 188
Window U-value 1.1 86 44 0 150 - 0 194
Window U-value 1.8 89 29 0 155 - 0 184
Window U-value 1.4 90 34 0 158 - 0 191
Lighting Efficacy 65 91 23 0 159 - 0 182
Lighting Efficacy 60 92 21 0 161 - 0 181
Lighting Efficacy 55 93 20 0 163 - 0 182

AECOM Ireland Existing Domestic Building Results – Draft 12/02/13 88 Capabilities on project: Building Engineering
Hotel (EE1): Financial Costs (High energy price, 7% discount rate, EUR/m²)
Package Value PE (KWh/m²)
Initial Investment
Cost
Annual Costs Cost of Emissions
Residual Value
Macro Cost Maintenance Energy
Wall U-Value 0.1 566 94 0 958 - -17 1035
Wall U-Value 0.14 568 44 0 961 - -8 997
Wall U-Value 0.16 568 84 0 962 - -16 1030
Wall U-Value 0.19 569 22 0 964 - -4 982
Wall U-Value 0.21 570 39 0 965 - -7 996
Wall U-Value 0.3 573 5 0 970 - -1 975
Wall U-Value 0.39 576 17 0 976 - -3 989
Roof U-value 0.15 576 10 0 975 - -2 983
Roof U-value 0.2 577 9 0 977 - -2 985
Roof U-value 0.25 578 7 0 979 - -1 986
Heating Source GSHP 457 29 8 767 - 0 804
Heating Source Gas CHP 542 74 38 966 - 0 1078
Heating Source Gas (91%) + SHW 563 35 8 953 - 0 996
Heating Source Gas (91%) 576 8 8 976 - 0 992
Heating Source Gas (86%) 586 8 8 994 - 0 1009
Floor U-value 0.1 570 7 0 965 - -1 971
Floor U-value 0.15 571 5 0 967 - -1 971
Floor U-value 0.2 572 4 0 969 - -1 972
Floor U-value 0.25 573 3 0 971 - -1 974
Window U-value 1.1 547 87 0 925 - -8 1004
Window U-value 0.9 548 93 0 925 - -9 1010
Window U-value 1.4 550 68 0 932 - -6 993
Window U-value 1.8 563 58 0 952 - -5 1004
Chiller Efficiency 5.5 546 31 0 927 - 0 958
Chiller Efficiency 4.5 549 27 0 932 - 0 959
Chiller Efficiency 3.5 554 25 0 940 - 0 965
AHU SFP 1.8 558 10 0 946 - 0 957
AHU SFP 2 564 10 0 956 - 0 965
AHU SFP 2.2 569 9 0 965 - 0 974
Lighting Efficacy 65 489 51 0 839 - 0 890
Lighting Efficacy 60 491 46 0 842 - 0 888
Lighting Efficacy 55 493 39 0 846 - 0 885

AECOM Ireland Existing Domestic Building Results – Draft 12/02/13 89 Capabilities on project: Building Engineering
Hotel (EE2): Financial Costs (High energy price, 7% discount rate, EUR/m²)
Package Value PE (KWh/m²)
Initial Investment
Cost
Annual Costs Cost of Emissions
Residual Value
Macro Cost Maintenance Energy
Wall U-Value 0.1 442 94 0 755 - -17 831
Wall U-Value 0.14 444 44 0 757 - -8 793
Wall U-Value 0.16 445 84 0 758 - -16 827
Wall U-Value 0.19 446 22 0 760 - -4 778
Wall U-Value 0.21 446 39 0 762 - -7 793
Wall U-Value 0.3 450 5 0 768 - -1 772
Wall U-Value 0.39 453 17 0 774 - -3 787
Roof U-value 0.15 453 10 0 773 - -2 781
Roof U-value 0.2 454 9 0 775 - -2 783
Roof U-value 0.25 455 7 0 778 - -1 784
Heating Source GSHP 325 29 8 549 - 0 585
Heating Source Gas CHP 420 74 38 771 - 0 883
Heating Source Gas (91%) + SHW 446 35 8 762 - 0 806
Heating Source Gas (91%) 458 8 8 782 - 0 798
Heating Source Gas (86%) 469 8 8 801 - 0 817
Floor U-value 0.1 446 7 0 762 - -1 768
Floor U-value 0.15 448 5 0 764 - -1 768
Floor U-value 0.2 449 4 0 766 - -1 769
Floor U-value 0.25 450 3 0 768 - -1 771
Window U-value 0.9 431 93 0 735 - -9 819
Window U-value 1.1 434 87 0 741 - -8 820
Window U-value 1.4 439 68 0 750 - -6 811
Window U-value 1.8 445 58 0 759 - -5 812
Chiller Efficiency 5.5 437 31 0 747 - 0 778
Chiller Efficiency 4.5 439 27 0 751 - 0 778
Chiller Efficiency 3.5 442 25 0 756 - 0 782
AHU SFP 1.8 444 10 0 759 - 0 769
AHU SFP 2 450 10 0 768 - 0 778
AHU SFP 2.2 455 9 0 778 - 0 787
Lighting Efficacy 65 434 51 0 745 - 0 796
Lighting Efficacy 60 436 46 0 748 - 0 794
Lighting Efficacy 55 439 39 0 752 - 0 791

AECOM Ireland Existing Domestic Building Results – Draft 12/02/13 90 Capabilities on project: Building Engineering
Table J: Financial Costs Central energy price 13% discount rate

AECOM Ireland Existing Domestic Building Results – Draft 12/02/13 91 Capabilities on project: Building Engineering
Retail (EE1): Financial Costs (Central energy price, 13% discount rate, EUR/m²)
Package Value PE (KWh/m²)
Initial Investment
Cost
Annual Costs Cost of Emissions
Residual Value
Macro Cost Maintenance Energy
Wall U-Value 0.11 646 66 0 541 - -4 603
Wall U-Value 0.15 (b) 647 55 0 542 - -4 594
Wall U-Value 0.15 647 59 0 542 - -4 597
Wall U-Value 0.2 648 50 0 543 - -3 590
Wall U-Value 0.21 648 57 0 543 - -4 596
Wall U-Value 0.27 649 54 0 544 - -4 594
Wall U-Value 0.36 651 51 0 545 - -3 592
Wall U-Value 0.47 653 48 0 546 - -3 591
Roof U-value 0.14 648 0 0 543 - 0 543
Roof U-value 0.18 649 0 0 544 - 0 544
Roof U-value 0.29 654 0 0 547 - 0 547
Heating Source ASHP 558 41 7 472 - 0 520
Heating Source Gas CHP 620 132 52 531 - 0 715
Heating Source Gas (91%) 646 11 8 541 - 0 560
Heating Source Gas (91%) + SHW 646 104 8 541 - 0 653
Heating Source Gas (86%) 653 11 8 547 - 0 566
Floor U-value 0.25 652 12 0 547 - -1 558
Floor U-value 0.2 652 14 0 547 - -1 560
Floor U-value 0.15 653 18 0 547 - -1 565
Floor U-value 0.1 653 26 0 548 - -2 572
Window U-value 1.4 644 15 0 539 - 0 553
Window U-value 1.1 644 19 0 539 - -1 558
Window U-value 0.9 647 20 0 542 - -1 562
Window U-value 1.8 653 13 0 547 - 0 559
Chiller Efficiency 5.5 533 30 0 445 - 0 476
Chiller Efficiency 4.5 545 27 0 456 - 0 482
Chiller Efficiency 3.5 564 25 0 472 - 0 496
AHU SFP 1.8 641 19 0 536 - 0 555
AHU SFP 2 646 17 0 541 - 0 558
AHU SFP 2.2 652 16 0 546 - 0 562
Lighting Efficacy 65 490 6 0 408 - 0 414
Lighting Efficacy 60 498 5 0 415 - 0 420
Lighting Efficacy 55 508 5 0 423 - 0 428

AECOM Ireland Existing Domestic Building Results – Draft 12/02/13 92 Capabilities on project: Building Engineering
Retail (EE2): Financial Costs (Central energy price, 13% discount rate, EUR/m²)
Package Value PE (KWh/m²)
Initial Investment
Cost
Annual Costs Cost of Emissions
Residual Value
Macro Cost Maintenance Energy
Wall U-Value 0.11 501 66 0 418 - -4 480
Wall U-Value 0.15 (b) 502 55 0 419 - -4 470
Wall U-Value 0.15 502 59 0 419 - -4 474
Wall U-Value 0.2 503 50 0 420 - -3 467
Wall U-Value 0.21 503 57 0 420 - -4 473
Wall U-Value 0.27 504 54 0 421 - -4 471
Wall U-Value 0.36 506 51 0 422 - -3 470
Wall U-Value 0.47 509 48 0 424 - -3 469
Roof U-value 0.14 503 0 0 420 - 0 420
Roof U-value 0.18 505 0 0 421 - 0 421
Roof U-value 0.29 511 0 0 426 - 0 426
Heating Source ASHP 406 41 7 343 - 0 391
Heating Source Gas CHP 473 132 52 407 - 0 591
Heating Source Gas (91%) 502 11 8 419 - 0 438
Heating Source Gas (91%) + SHW 502 104 8 419 - 0 530
Heating Source Gas (86%) 510 11 8 425 - 0 444
Floor U-value 0.1 496 26 0 415 - -2 439
Floor U-value 0.15 497 18 0 415 - -1 433
Floor U-value 0.2 498 14 0 416 - -1 430
Floor U-value 0.25 502 12 0 420 - -1 431
Window U-value 1.1 502 19 0 419 - -1 437
Window U-value 1.4 502 15 0 419 - 0 433
Window U-value 0.9 504 20 0 420 - -1 440
Window U-value 1.8 508 13 0 424 - 0 436
Chiller Efficiency 5.5 461 30 0 384 - 0 414
Chiller Efficiency 4.5 470 27 0 392 - 0 418
Chiller Efficiency 3.5 485 25 0 404 - 0 429
AHU SFP 1.8 497 19 0 414 - 0 433
AHU SFP 2 503 17 0 419 - 0 436
AHU SFP 2.2 508 16 0 424 - 0 440
Lighting Efficacy 65 453 6 0 377 - 0 383
Lighting Efficacy 60 460 5 0 383 - 0 389
Lighting Efficacy 55 469 5 0 390 - 0 395

AECOM Ireland Existing Domestic Building Results – Draft 12/02/13 93 Capabilities on project: Building Engineering
Office (NV) (EE1): Financial Costs (Central energy price, 13% discount rate, EUR/m²)
Package Value PE (KWh/m²)
Initial Investment
Cost
Annual Costs Cost of Emissions
Residual Value
Macro Cost Maintenance Energy
Wall U-Value 0.1 340 69 0 277 - -5 342
Wall U-Value 0.14 341 32 0 278 - -2 309
Wall U-Value 0.16 342 62 0 279 - -4 337
Wall U-Value 0.19 343 16 0 280 - -1 295
Wall U-Value 0.21 343 28 0 280 - -2 307
Wall U-Value 0.3 346 4 0 282 - 0 286
Wall U-Value 0.39 348 12 0 284 - -1 295
Roof U-value 0.15 334 17 0 273 - -1 289
Roof U-value 0.2 336 16 0 274 - -1 289
Roof U-value 0.25 338 13 0 276 - -1 288
Heating Source GSHP 160 26 3 135 - 0 164
Heating Source Gas CHP 284 101 22 255 - 0 377
Heating Source Gas (91%) + SHW 316 56 4 259 - 0 319
Heating Source Gas (91%) 316 9 4 259 - 0 272
Heating Source Gas (86%) 330 9 4 269 - 0 283
Floor U-value 0.1 337 13 0 275 - -1 287
Floor U-value 0.15 340 9 0 277 - -1 286
Floor U-value 0.2 342 7 0 279 - 0 286
Floor U-value 0.25 344 6 0 281 - 0 286
Window U-value 0.9 303 92 0 248 - -3 338
Window U-value 1.1 312 87 0 255 - -3 339
Window U-value 1.8 315 57 0 257 - -2 313
Window U-value 1.4 319 67 0 261 - -2 326
Lighting Efficacy 65 288 28 0 232 - 0 260
Lighting Efficacy 60 292 23 0 235 - 0 258
Lighting Efficacy 55 295 23 0 238 - 0 260

AECOM Ireland Existing Domestic Building Results – Draft 12/02/13 94 Capabilities on project: Building Engineering
Office (NV) (EE2): Financial Costs (Central energy price, 13% discount rate, EUR/m²)
Package Value PE (KWh/m²)
Initial Investment
Cost
Annual Costs Cost of Emissions
Residual Value
Macro Cost Maintenance Energy
Wall U-Value 0.1 271 69 0 222 - -5 286
Wall U-Value 0.14 272 32 0 223 - -2 253
Wall U-Value 0.16 273 62 0 223 - -4 281
Wall U-Value 0.19 274 16 0 224 - -1 239
Wall U-Value 0.21 275 28 0 225 - -2 251
Wall U-Value 0.3 277 4 0 227 - 0 230
Wall U-Value 0.39 279 12 0 228 - -1 240
Roof U-value 0.15 277 17 0 227 - -1 243
Roof U-value 0.2 279 16 0 228 - -1 243
Roof U-value 0.25 281 13 0 229 - -1 241
Heating Source GSHP 136 26 3 115 - 0 144
Heating Source Gas CHP 242 101 22 217 - 0 340
Heating Source Gas (91%) + SHW 270 56 4 221 - 0 281
Heating Source Gas (91%) 270 9 4 221 - 0 234
Heating Source Gas (86%) 281 9 4 229 - 0 243
Floor U-value 0.1 267 13 0 219 - -1 231
Floor U-value 0.15 269 9 0 220 - -1 229
Floor U-value 0.2 271 7 0 222 - 0 229
Floor U-value 0.25 273 6 0 223 - 0 229
Window U-value 0.9 252 92 0 206 - -3 296
Window U-value 1.1 259 87 0 213 - -3 296
Window U-value 1.8 262 57 0 215 - -2 270
Window U-value 1.4 266 67 0 217 - -2 282
Lighting Efficacy 65 231 28 0 187 - 0 215
Lighting Efficacy 60 235 23 0 190 - 0 213
Lighting Efficacy 55 239 23 0 193 - 0 216

AECOM Ireland Existing Domestic Building Results – Draft 12/02/13 95 Capabilities on project: Building Engineering
Office (AC) (EE1): Financial Costs (Central energy price, 13% discount rate, EUR/m²)
Package Value PE (KWh/m²)
Initial Investment
Cost
Annual Costs Cost of Emissions
Residual Value
Macro Cost Maintenance Energy
Wall U-Value 0.11 401 75 0 332 - -5 402
Wall U-Value 0.15 (b) 402 63 0 332 - -4 391
Wall U-Value 0.15 402 67 0 332 - -4 395
Wall U-Value 0.2 403 57 0 333 - -4 386
Wall U-Value 0.21 403 65 0 333 - -4 394
Wall U-Value 0.27 404 61 0 334 - -4 391
Wall U-Value 0.36 406 58 0 335 - -4 389
Wall U-Value 0.47 408 54 0 337 - -4 387
Roof U-value 0.14 404 0 0 334 - 0 334
Roof U-value 0.18 405 0 0 335 - 0 335
Roof U-value 0.29 409 0 0 337 - 0 337
Heating Source GSHP 263 26 3 222 - 0 252
Heating Source Gas CHP 362 101 22 318 - 0 440
Heating Source Gas (91%) 406 9 4 336 - 0 349
Heating Source Gas (91%) + SHW 406 56 4 336 - 0 396
Heating Source Gas (86%) 418 9 4 345 - 0 358
Floor U-value 0.1 395 13 0 327 - -1 339
Floor U-value 0.15 397 9 0 328 - -1 337
Floor U-value 0.2 398 7 0 329 - 0 336
Floor U-value 0.25 400 6 0 331 - 0 336
Window U-value 1.1 377 87 0 312 - -3 395
Window U-value 1.4 380 67 0 314 - -2 379
Window U-value 0.9 383 92 0 316 - -3 406
Window U-value 1.8 405 57 0 334 - -2 390
Chiller Efficiency 5.5 342 26 0 281 - 0 307
Chiller Efficiency 4.5 349 23 0 287 - 0 310
Chiller Efficiency 3.5 361 21 0 297 - 0 318
AHU SFP 1.8 391 12 0 322 - 0 334
AHU SFP 2 395 11 0 326 - 0 337
AHU SFP 2.2 400 10 0 330 - 0 340
Lighting Efficacy 65 366 28 0 301 - 0 329
Lighting Efficacy 60 371 23 0 306 - 0 328
Lighting Efficacy 55 378 23 0 311 - 0 334

AECOM Ireland Existing Domestic Building Results – Draft 12/02/13 96 Capabilities on project: Building Engineering
Office (AC) (EE2): Financial Costs (Central energy price, 13% discount rate, EUR/m²)
Package Value PE (KWh/m²)
Initial Investment
Cost
Annual Costs Cost of Emissions
Residual Value
Macro Cost Maintenance Energy
Wall U-Value 0.11 305 75 0 254 - -5 324
Wall U-Value 0.15 (b) 306 63 0 254 - -4 313
Wall U-Value 0.15 306 67 0 254 - -4 317
Wall U-Value 0.2 307 57 0 255 - -4 309
Wall U-Value 0.21 307 65 0 255 - -4 316
Wall U-Value 0.27 309 61 0 256 - -4 314
Wall U-Value 0.36 311 58 0 258 - -4 312
Wall U-Value 0.47 313 54 0 259 - -4 310
Roof U-value 0.14 307 0 0 255 - 0 255
Roof U-value 0.18 308 0 0 256 - 0 256
Roof U-value 0.29 312 0 0 259 - 0 259
Heating Source GSHP 225 26 3 190 - 0 219
Heating Source Gas CHP 290 101 22 253 - 0 375
Heating Source Gas (91%) 319 9 4 265 - 0 278
Heating Source Gas (91%) + SHW 319 56 4 265 - 0 325
Heating Source Gas (86%) 327 9 4 271 - 0 284
Floor U-value 0.1 305 13 0 253 - -1 265
Floor U-value 0.15 306 9 0 255 - -1 263
Floor U-value 0.2 308 7 0 256 - 0 263
Floor U-value 0.25 310 6 0 258 - 0 263
Window U-value 1.1 276 87 0 229 - -3 313
Window U-value 1.4 280 67 0 232 - -2 297
Window U-value 0.9 282 92 0 235 - -3 324
Window U-value 1.8 307 57 0 255 - -2 311
Chiller Efficiency 5.5 250 26 0 207 - 0 233
Chiller Efficiency 4.5 257 23 0 213 - 0 235
Chiller Efficiency 3.5 268 21 0 222 - 0 243
AHU SFP 1.8 301 12 0 249 - 0 261
AHU SFP 2 306 11 0 254 - 0 264
AHU SFP 2.2 310 10 0 258 - 0 268
Lighting Efficacy 65 298 28 0 247 - 0 275
Lighting Efficacy 60 303 23 0 252 - 0 274
Lighting Efficacy 55 310 23 0 258 - 0 280

AECOM Ireland Existing Domestic Building Results – Draft 12/02/13 97 Capabilities on project: Building Engineering
Primary (EE1): Financial Costs (Central energy price, 13% discount rate, EUR/m²)
Package Value PE (KWh/m²)
Initial Investment
Cost
Annual Costs Cost of Emissions
Residual Value
Macro Cost Maintenance Energy
Wall U-Value 0.1 162 57 0 134 - -1 190
Wall U-Value 0.14 164 27 0 135 - 0 162
Wall U-Value 0.16 164 51 0 136 - -1 187
Wall U-Value 0.19 166 13 0 137 - 0 150
Wall U-Value 0.21 166 24 0 138 - 0 161
Wall U-Value 0.3 170 3 0 141 - 0 144
Wall U-Value 0.39 174 10 0 143 - 0 154
Roof U-value 0.15 172 15 0 142 - 0 157
Roof U-value 0.2 173 13 0 143 - 0 156
Roof U-value 0.25 173 11 0 143 - 0 154
Heating Source GSHP 62 30 6 55 - 0 90
Heating Source Gas CHP 140 62 25 157 - 0 244
Heating Source Gas (91%) + SHW 155 47 6 128 - 0 181
Heating Source Gas (91%) 155 8 6 128 - 0 142
Heating Source Gas (86%) 163 8 6 135 - 0 148
Floor U-value 0.1 158 11 0 131 - 0 142
Floor U-value 0.15 161 8 0 133 - 0 141
Floor U-value 0.2 163 6 0 135 - 0 141
Floor U-value 0.25 166 5 0 137 - 0 142
Window U-value 0.9 142 47 0 118 - 0 165
Window U-value 1.1 147 44 0 123 - 0 166
Window U-value 1.8 150 29 0 125 - 0 154
Window U-value 1.4 152 34 0 126 - 0 160
Lighting Efficacy 65 157 23 0 127 - 0 150
Lighting Efficacy 60 158 21 0 128 - 0 149
Lighting Efficacy 55 160 20 0 130 - 0 149

AECOM Ireland Existing Domestic Building Results – Draft 12/02/13 98 Capabilities on project: Building Engineering
Primary (EE2): Financial Costs (Central energy price, 13% discount rate, EUR/m²)
Package Value PE (KWh/m²)
Initial Investment
Cost
Annual Costs Cost of Emissions
Residual Value
Macro Cost Maintenance Energy
Wall U-Value 0.1 84 57 0 69 - -1 126
Wall U-Value 0.14 86 27 0 71 - 0 97
Wall U-Value 0.16 87 51 0 71 - -1 122
Wall U-Value 0.19 88 13 0 72 - 0 85
Wall U-Value 0.21 89 24 0 73 - 0 96
Wall U-Value 0.3 92 3 0 76 - 0 79
Wall U-Value 0.39 96 10 0 78 - 0 88
Roof U-value 0.15 93 15 0 76 - 0 91
Roof U-value 0.2 94 13 0 77 - 0 90
Roof U-value 0.25 94 11 0 77 - 0 88
Heating Source GSHP 27 30 6 24 - 0 60
Heating Source Gas CHP 82 62 25 95 - 0 182
Heating Source Gas (91%) + SHW 92 47 6 75 - 0 128
Heating Source Gas (91%) 92 8 6 75 - 0 89
Heating Source Gas (86%) 97 8 6 80 - 0 93
Floor U-value 0.1 87 11 0 71 - 0 82
Floor U-value 0.15 89 8 0 73 - 0 81
Floor U-value 0.2 92 6 0 75 - 0 81
Floor U-value 0.25 94 5 0 77 - 0 82
Window U-value 0.9 81 47 0 67 - 0 113
Window U-value 1.1 86 44 0 71 - 0 114
Window U-value 1.8 89 29 0 73 - 0 102
Window U-value 1.4 90 34 0 74 - 0 108
Lighting Efficacy 65 91 23 0 74 - 0 97
Lighting Efficacy 60 92 21 0 75 - 0 96
Lighting Efficacy 55 93 20 0 76 - 0 96

AECOM Ireland Existing Domestic Building Results – Draft 12/02/13 99 Capabilities on project: Building Engineering
Hotel (EE1): Financial Costs (Central energy price, 13% discount rate, EUR/m²)
Package Value PE (KWh/m²)
Initial Investment
Cost
Annual Costs Cost of Emissions
Residual Value
Macro Cost Maintenance Energy
Wall U-Value 0.1 566 94 0 462 - -6 550
Wall U-Value 0.14 568 44 0 463 - -3 505
Wall U-Value 0.16 568 84 0 464 - -6 543
Wall U-Value 0.19 569 22 0 465 - -1 485
Wall U-Value 0.21 570 39 0 465 - -3 502
Wall U-Value 0.3 573 5 0 468 - 0 473
Wall U-Value 0.39 576 17 0 470 - -1 486
Roof U-value 0.15 576 10 0 470 - -1 479
Roof U-value 0.2 577 9 0 471 - -1 479
Roof U-value 0.25 578 7 0 472 - 0 479
Heating Source GSHP 457 29 5 376 - 0 410
Heating Source Gas CHP 542 74 25 458 - 0 557
Heating Source Gas (91%) + SHW 563 35 5 460 - 0 501
Heating Source Gas (91%) 576 8 5 470 - 0 483
Heating Source Gas (86%) 586 8 5 478 - 0 491
Floor U-value 0.1 570 7 0 465 - 0 472
Floor U-value 0.15 571 5 0 466 - 0 471
Floor U-value 0.2 572 4 0 467 - 0 471
Floor U-value 0.25 573 3 0 468 - 0 471
Window U-value 1.1 547 87 0 446 - -3 531
Window U-value 0.9 548 93 0 448 - -3 538
Window U-value 1.4 550 68 0 449 - -2 515
Window U-value 1.8 563 58 0 460 - -2 516
Chiller Efficiency 5.5 546 31 0 444 - 0 475
Chiller Efficiency 4.5 549 27 0 447 - 0 474
Chiller Efficiency 3.5 554 25 0 451 - 0 476
AHU SFP 1.8 558 10 0 454 - 0 465
AHU SFP 2 564 10 0 459 - 0 469
AHU SFP 2.2 569 9 0 464 - 0 473
Lighting Efficacy 65 489 51 0 394 - 0 445
Lighting Efficacy 60 491 46 0 396 - 0 441
Lighting Efficacy 55 493 39 0 398 - 0 437

AECOM Ireland Existing Domestic Building Results – Draft 12/02/13 100 Capabilities on project: Building Engineering
Hotel (EE2): Financial Costs (Central energy price, 13% discount rate, EUR/m²)
Package Value PE (KWh/m²)
Initial Investment
Cost
Annual Costs Cost of Emissions
Residual Value
Macro Cost Maintenance Energy
Wall U-Value 0.1 442 94 0 359 - -6 447
Wall U-Value 0.14 444 44 0 360 - -3 401
Wall U-Value 0.16 445 84 0 360 - -6 439
Wall U-Value 0.19 446 22 0 361 - -1 382
Wall U-Value 0.21 446 39 0 362 - -3 398
Wall U-Value 0.3 450 5 0 364 - 0 369
Wall U-Value 0.39 453 17 0 367 - -1 383
Roof U-value 0.15 453 10 0 367 - -1 376
Roof U-value 0.2 454 9 0 368 - -1 376
Roof U-value 0.25 455 7 0 369 - 0 376
Heating Source GSHP 325 29 5 266 - 0 300
Heating Source Gas CHP 420 74 25 357 - 0 456
Heating Source Gas (91%) + SHW 446 35 5 362 - 0 403
Heating Source Gas (91%) 458 8 5 371 - 0 384
Heating Source Gas (86%) 469 8 5 380 - 0 393
Floor U-value 0.1 446 7 0 362 - 0 369
Floor U-value 0.15 448 5 0 363 - 0 368
Floor U-value 0.2 449 4 0 364 - 0 368
Floor U-value 0.25 450 3 0 365 - 0 368
Window U-value 0.9 431 93 0 349 - -3 439
Window U-value 1.1 434 87 0 351 - -3 436
Window U-value 1.4 439 68 0 355 - -2 421
Window U-value 1.8 445 58 0 361 - -2 417
Chiller Efficiency 5.5 437 31 0 353 - 0 384
Chiller Efficiency 4.5 439 27 0 355 - 0 382
Chiller Efficiency 3.5 442 25 0 358 - 0 383
AHU SFP 1.8 444 10 0 359 - 0 369
AHU SFP 2 450 10 0 364 - 0 373
AHU SFP 2.2 455 9 0 369 - 0 378
Lighting Efficacy 65 434 51 0 351 - 0 402
Lighting Efficacy 60 436 46 0 352 - 0 398
Lighting Efficacy 55 439 39 0 354 - 0 393

EE1 Retail_v1.xlsm
1100
1110
1120
1130
1140
1150
1160
1170
1180
1190
1200
644 646 648 650 652 654 656
Mac
roec
onom
ic C
ost
(EUR
/m²)
Primary Energy (kWh/m²)
Wall U-value - Macroeconomic Costs (Central energy price, 4% discount rate, EUR/m²)
1100
1110
1120
1130
1140
1150
1160
1170
1180
1190
1200
646 648 650 652 654 656 658
Mac
roec
onom
ic C
ost
(EUR
/m²)
Primary Energy (kWh/m²)
Roof U-value - Macroeconomic Costs (Central energy price, 4% discount rate, EUR/m²)
1000
1050
1100
1150
1200
1250
1300
1350
1400
540 560 580 600 620 640 660
Mac
roec
onom
ic C
ost
(EUR
/m²)
Primary Energy (kWh/m²)
Heating Source - Macroeconomic Costs (Central energy price, 4% discount rate, EUR/m²)
1100
1110
1120
1130
1140
1150
1160
1170
1180
1190
1200
651 652 653 654 655 656 657 658
Mac
roec
onom
ic C
ost
(EUR
/m²)
Primary Energy (kWh/m²)
Floor U-value - Macroeconomic Costs (Central energy price, 4% discount rate, EUR/m²)
1100
1110
1120
1130
1140
1150
1160
1170
1180
1190
1200
642 644 646 648 650 652 654
Mac
roec
onom
ic C
ost
(EUR
/m²)
Primary Energy (kWh/m²)
Window U-value - Macroeconomic Costs (Central energy price, 4% discount rate, EUR/m²)
900
920
940
960
980
1000
1020
1040
1060
1080
1100
0 100 200 300 400 500 600 700
Mac
roec
onom
ic C
ost
(EUR
/m²)
Primary Energy (kWh/m²)
Chiller Efficiency - Macroeconomic Costs (Central energy price, 4% discount rate, EUR/m²)
1100
1110
1120
1130
1140
1150
1160
1170
1180
1190
1200
635 640 645 650 655 660 665 670 675 680
Mac
roec
onom
ic C
ost
(EUR
/m²)
Primary Energy (kWh/m²)
AHU SFP - Macroeconomic Costs (Central energy price, 4% discount rate, EUR/m²)
800
810
820
830
840
850
860
870
880
890
900
485 490 495 500 505 510
Mac
roec
onom
ic C
ost
(EUR
/m²)
Primary Energy (kWh/m²)
Lighting (lm/W) - Macroeconomic Costs (Central energy price, 4% discount rate, EUR/m²)

EE2 Retail_v1.xlsm
900
910
920
930
940
950
960
970
980
990
1000
500 502 504 506 508 510 512 514
Mac
roec
onom
ic C
ost
(EUR
/m²)
Primary Energy (kWh/m²)
Wall U-value - Macroeconomic Costs (Central energy price, 4% discount rate, EUR/m²)
800
810
820
830
840
850
860
870
880
890
900
502 504 506 508 510 512 514 516
Mac
roec
onom
ic C
ost
(EUR
/m²)
Primary Energy (kWh/m²)
Roof U-value - Macroeconomic Costs (Central energy price, 4% discount rate, EUR/m²)
700
750
800
850
900
950
1000
1050
1100
0 100 200 300 400 500 600
Mac
roec
onom
ic C
ost
(EUR
/m²)
Primary Energy (kWh/m²)
Heating Source - Macroeconomic Costs (Central energy price, 4% discount rate, EUR/m²)
800
810
820
830
840
850
860
870
880
890
900
495 500 505 510 515
Mac
roec
onom
ic C
ost
(EUR
/m²)
Primary Energy (kWh/m²)
Floor U-value - Macroeconomic Costs (Central energy price, 4% discount rate, EUR/m²)
800
810
820
830
840
850
860
870
880
890
900
501 502 503 504 505 506 507 508 509
Mac
roec
onom
ic C
ost
(EUR
/m²)
Primary Energy (kWh/m²)
Window U-value - Macroeconomic Costs (Central energy price, 4% discount rate, EUR/m²)
800
810
820
830
840
850
860
870
880
890
900
0 100 200 300 400 500 600
Mac
roec
onom
ic C
ost
(EUR
/m²)
Primary Energy (kWh/m²)
Chiller Efficiency - Macroeconomic Costs (Central energy price, 4% discount rate, EUR/m²)
800
810
820
830
840
850
860
870
880
890
900
495 500 505 510 515 520 525 530 535
Mac
roec
onom
ic C
ost
(EUR
/m²)
Primary Energy (kWh/m²)
AHU SFP - Macroeconomic Costs (Central energy price, 4% discount rate, EUR/m²)
700
720
740
760
780
800
820
840
860
880
900
452 454 456 458 460 462 464 466 468 470
Mac
roec
onom
ic C
ost
(EUR
/m²)
Primary Energy (kWh/m²)
Lighting (lm/W) - Macroeconomic Costs (Central energy price, 4% discount rate, EUR/m²)

EE1 Office-NV_v1.xlsm
600
610
620
630
640
650
660
670
680
690
700
338 340 342 344 346 348 350 352 354 356
Mac
roec
onom
ic C
ost
(EUR
/m²)
Primary Energy (kWh/m²)
Wall U-value - Macroeconomic Costs (Central energy price, 4% discount rate, EUR/m²)
600
610
620
630
640
650
660
670
680
690
700
333 334 335 336 337 338 339 340 341 342 343
Mac
roec
onom
ic C
ost
(EUR
/m²)
Primary Energy (kWh/m²)
Roof U-value - Macroeconomic Costs (Central energy price, 4% discount rate, EUR/m²)
300
350
400
450
500
550
600
650
700
750
800
0 50 100 150 200 250 300 350
Mac
roec
onom
ic C
ost
(EUR
/m²)
Primary Energy (kWh/m²)
Heating Source - Macroeconomic Costs (Central energy price, 4% discount rate, EUR/m²)
600
610
620
630
640
650
660
670
680
690
700
335 340 345 350 355 360 365
Mac
roec
onom
ic C
ost
(EUR
/m²)
Primary Energy (kWh/m²)
Floor U-value - Macroeconomic Costs (Central energy price, 4% discount rate, EUR/m²)
600
610
620
630
640
650
660
670
680
690
700
300 305 310 315 320 325
Mac
roec
onom
ic C
ost
(EUR
/m²)
Primary Energy (kWh/m²)
Window U-value - Macroeconomic Costs (Central energy price, 4% discount rate, EUR/m²)
500
510
520
530
540
550
560
570
580
590
600
288 289 290 291 292 293 294 295 296
Mac
roec
onom
ic C
ost
(EUR
/m²)
Primary Energy (kWh/m²)
Lighting (lm/W) - Macroeconomic Costs (Central energy price, 4% discount rate, EUR/m²)

EE2 Office-NV_v1.xlsm
400
420
440
460
480
500
520
540
560
580
600
270 272 274 276 278 280 282 284 286
Mac
roec
onom
ic C
ost
(EUR
/m²)
Primary Energy (kWh/m²)
Wall U-value - Macroeconomic Costs (Central energy price, 4% discount rate, EUR/m²)
500
510
520
530
540
550
560
570
580
590
600
276 277 278 279 280 281 282 283 284 285
Mac
roec
onom
ic C
ost
(EUR
/m²)
Primary Energy (kWh/m²)
Roof U-value - Macroeconomic Costs (Central energy price, 4% discount rate, EUR/m²)
200
250
300
350
400
450
500
550
600
650
700
0 50 100 150 200 250 300
Mac
roec
onom
ic C
ost
(EUR
/m²)
Primary Energy (kWh/m²)
Heating Source - Macroeconomic Costs (Central energy price, 4% discount rate, EUR/m²)
400
410
420
430
440
450
460
470
480
490
500
265 270 275 280 285 290
Mac
roec
onom
ic C
ost
(EUR
/m²)
Primary Energy (kWh/m²)
Floor U-value - Macroeconomic Costs (Central energy price, 4% discount rate, EUR/m²)
500
510
520
530
540
550
560
570
580
590
600
250 255 260 265 270 275
Mac
roec
onom
ic C
ost
(EUR
/m²)
Primary Energy (kWh/m²)
Window U-value - Macroeconomic Costs (Central energy price, 4% discount rate, EUR/m²)
400
410
420
430
440
450
460
470
480
490
500
230 231 232 233 234 235 236 237 238 239 240
Mac
roec
onom
ic C
ost
(EUR
/m²)
Primary Energy (kWh/m²)
Lighting (lm/W) - Macroeconomic Costs (Central energy price, 4% discount rate, EUR/m²)

EE1 Office-AC_v1.xlsm
700
710
720
730
740
750
760
770
780
790
800
400 402 404 406 408 410 412
Mac
roec
onom
ic C
ost
(EUR
/m²)
Primary Energy (kWh/m²)
Wall U-value - Macroeconomic Costs (Central energy price, 4% discount rate, EUR/m²)
700
710
720
730
740
750
760
770
780
790
800
403 404 405 406 407 408 409 410 411
Mac
roec
onom
ic C
ost
(EUR
/m²)
Primary Energy (kWh/m²)
Roof U-value - Macroeconomic Costs (Central energy price, 4% discount rate, EUR/m²)
400
450
500
550
600
650
700
750
800
850
900
0 50 100 150 200 250 300 350 400 450
Mac
roec
onom
ic C
ost
(EUR
/m²)
Primary Energy (kWh/m²)
Heating Source - Macroeconomic Costs (Central energy price, 4% discount rate, EUR/m²)
600
620
640
660
680
700
720
740
760
780
800
390 395 400 405 410 415
Mac
roec
onom
ic C
ost
(EUR
/m²)
Primary Energy (kWh/m²)
Floor U-value - Macroeconomic Costs (Central energy price, 4% discount rate, EUR/m²)
700
710
720
730
740
750
760
770
780
790
800
375 380 385 390 395 400 405 410
Mac
roec
onom
ic C
ost
(EUR
/m²)
Primary Energy (kWh/m²)
Window U-value - Macroeconomic Costs (Central energy price, 4% discount rate, EUR/m²)
600
610
620
630
640
650
660
670
680
690
700
0 50 100 150 200 250 300 350 400 450
Mac
roec
onom
ic C
ost
(EUR
/m²)
Primary Energy (kWh/m²)
Chiller Efficiency - Macroeconomic Costs (Central energy price, 4% discount rate, EUR/m²)
600
620
640
660
680
700
720
740
760
780
800
385 390 395 400 405 410 415 420 425
Mac
roec
onom
ic C
ost
(EUR
/m²)
Primary Energy (kWh/m²)
AHU SFP - Macroeconomic Costs (Central energy price, 4% discount rate, EUR/m²)
600
610
620
630
640
650
660
670
680
690
700
364 366 368 370 372 374 376 378 380
Mac
roec
onom
ic C
ost
(EUR
/m²)
Primary Energy (kWh/m²)
Lighting (lm/W) - Macroeconomic Costs (Central energy price, 4% discount rate, EUR/m²)

EE2 Office-AC_v1.xlsm
500
510
520
530
540
550
560
570
580
590
600
304 306 308 310 312 314 316 318
Mac
roec
onom
ic C
ost
(EUR
/m²)
Primary Energy (kWh/m²)
Wall U-value - Macroeconomic Costs (Central energy price, 4% discount rate, EUR/m²)
500
510
520
530
540
550
560
570
580
590
600
306 307 308 309 310 311 312 313 314 315
Mac
roec
onom
ic C
ost
(EUR
/m²)
Primary Energy (kWh/m²)
Roof U-value - Macroeconomic Costs (Central energy price, 4% discount rate, EUR/m²)
400
450
500
550
600
650
700
0 50 100 150 200 250 300 350
Mac
roec
onom
ic C
ost
(EUR
/m²)
Primary Energy (kWh/m²)
Heating Source - Macroeconomic Costs (Central energy price, 4% discount rate, EUR/m²)
500
510
520
530
540
550
560
570
580
590
600
300 305 310 315 320 325 330
Mac
roec
onom
ic C
ost
(EUR
/m²)
Primary Energy (kWh/m²)
Floor U-value - Macroeconomic Costs (Central energy price, 4% discount rate, EUR/m²)
500
510
520
530
540
550
560
570
580
590
600
270 275 280 285 290 295 300 305 310 315
Mac
roec
onom
ic C
ost
(EUR
/m²)
Primary Energy (kWh/m²)
Window U-value - Macroeconomic Costs (Central energy price, 4% discount rate, EUR/m²)
400
410
420
430
440
450
460
470
480
490
500
0 50 100 150 200 250 300 350
Mac
roec
onom
ic C
ost
(EUR
/m²)
Primary Energy (kWh/m²)
Chiller Efficiency - Macroeconomic Costs (Central energy price, 4% discount rate, EUR/m²)
500
510
520
530
540
550
560
570
580
590
600
295 300 305 310 315 320 325 330 335
Mac
roec
onom
ic C
ost
(EUR
/m²)
Primary Energy (kWh/m²)
AHU SFP - Macroeconomic Costs (Central energy price, 4% discount rate, EUR/m²)
500
510
520
530
540
550
560
570
580
590
600
296 298 300 302 304 306 308 310 312
Mac
roec
onom
ic C
ost
(EUR
/m²)
Primary Energy (kWh/m²)
Lighting (lm/W) - Macroeconomic Costs (Central energy price, 4% discount rate, EUR/m²)

EE1 Primary_v1.xlsm
300
310
320
330
340
350
360
370
380
390
400
160 165 170 175 180 185
Mac
roec
onom
ic C
ost
(EUR
/m²)
Primary Energy (kWh/m²)
Wall U-value - Macroeconomic Costs (Central energy price, 4% discount rate, EUR/m²)
300
310
320
330
340
350
360
370
380
390
400
172 173 173 174 174 175 175
Mac
roec
onom
ic C
ost
(EUR
/m²)
Primary Energy (kWh/m²)
Roof U-value - Macroeconomic Costs (Central energy price, 4% discount rate, EUR/m²)
100
150
200
250
300
350
400
450
500
0 20 40 60 80 100 120 140 160 180
Mac
roec
onom
ic C
ost
(EUR
/m²)
Primary Energy (kWh/m²)
Heating Source - Macroeconomic Costs (Central energy price, 4% discount rate, EUR/m²)
200
220
240
260
280
300
320
340
360
380
400
155 160 165 170 175 180 185 190
Mac
roec
onom
ic C
ost
(EUR
/m²)
Primary Energy (kWh/m²)
Floor U-value - Macroeconomic Costs (Central energy price, 4% discount rate, EUR/m²)
300
310
320
330
340
350
360
370
380
390
400
140 142 144 146 148 150 152 154 156 158
Mac
roec
onom
ic C
ost
(EUR
/m²)
Primary Energy (kWh/m²)
Window U-value - Macroeconomic Costs (Central energy price, 4% discount rate, EUR/m²)
300
310
320
330
340
350
360
370
380
390
400
157 157 158 158 159 159 160 160
Mac
roec
onom
ic C
ost
(EUR
/m²)
Primary Energy (kWh/m²)
Lighting (lm/W) - Macroeconomic Costs (Central energy price, 4% discount rate, EUR/m²)

EE2 Primary_v1.xlsm
100
120
140
160
180
200
220
240
260
280
300
0 20 40 60 80 100 120
Mac
roec
onom
ic C
ost
(EUR
/m²)
Primary Energy (kWh/m²)
Wall U-value - Macroeconomic Costs (Central energy price, 4% discount rate, EUR/m²)
100
110
120
130
140
150
160
170
180
190
200
93 94 94 95 95 96
Mac
roec
onom
ic C
ost
(EUR
/m²)
Primary Energy (kWh/m²)
Roof U-value - Macroeconomic Costs (Central energy price, 4% discount rate, EUR/m²)
0
50
100
150
200
250
300
350
400
0 20 40 60 80 100 120
Mac
roec
onom
ic C
ost
(EUR
/m²)
Primary Energy (kWh/m²)
Heating Source - Macroeconomic Costs (Central energy price, 4% discount rate, EUR/m²)
100
110
120
130
140
150
160
170
180
190
200
0 20 40 60 80 100 120
Mac
roec
onom
ic C
ost
(EUR
/m²)
Primary Energy (kWh/m²)
Floor U-value - Macroeconomic Costs (Central energy price, 4% discount rate, EUR/m²)
100
110
120
130
140
150
160
170
180
190
200
80 82 84 86 88 90 92 94 96
Mac
roec
onom
ic C
ost
(EUR
/m²)
Primary Energy (kWh/m²)
Window U-value - Macroeconomic Costs (Central energy price, 4% discount rate, EUR/m²)
100
110
120
130
140
150
160
170
180
190
200
91 91 92 92 93 93 94
Mac
roec
onom
ic C
ost
(EUR
/m²)
Primary Energy (kWh/m²)
Lighting (lm/W) - Macroeconomic Costs (Central energy price, 4% discount rate, EUR/m²)
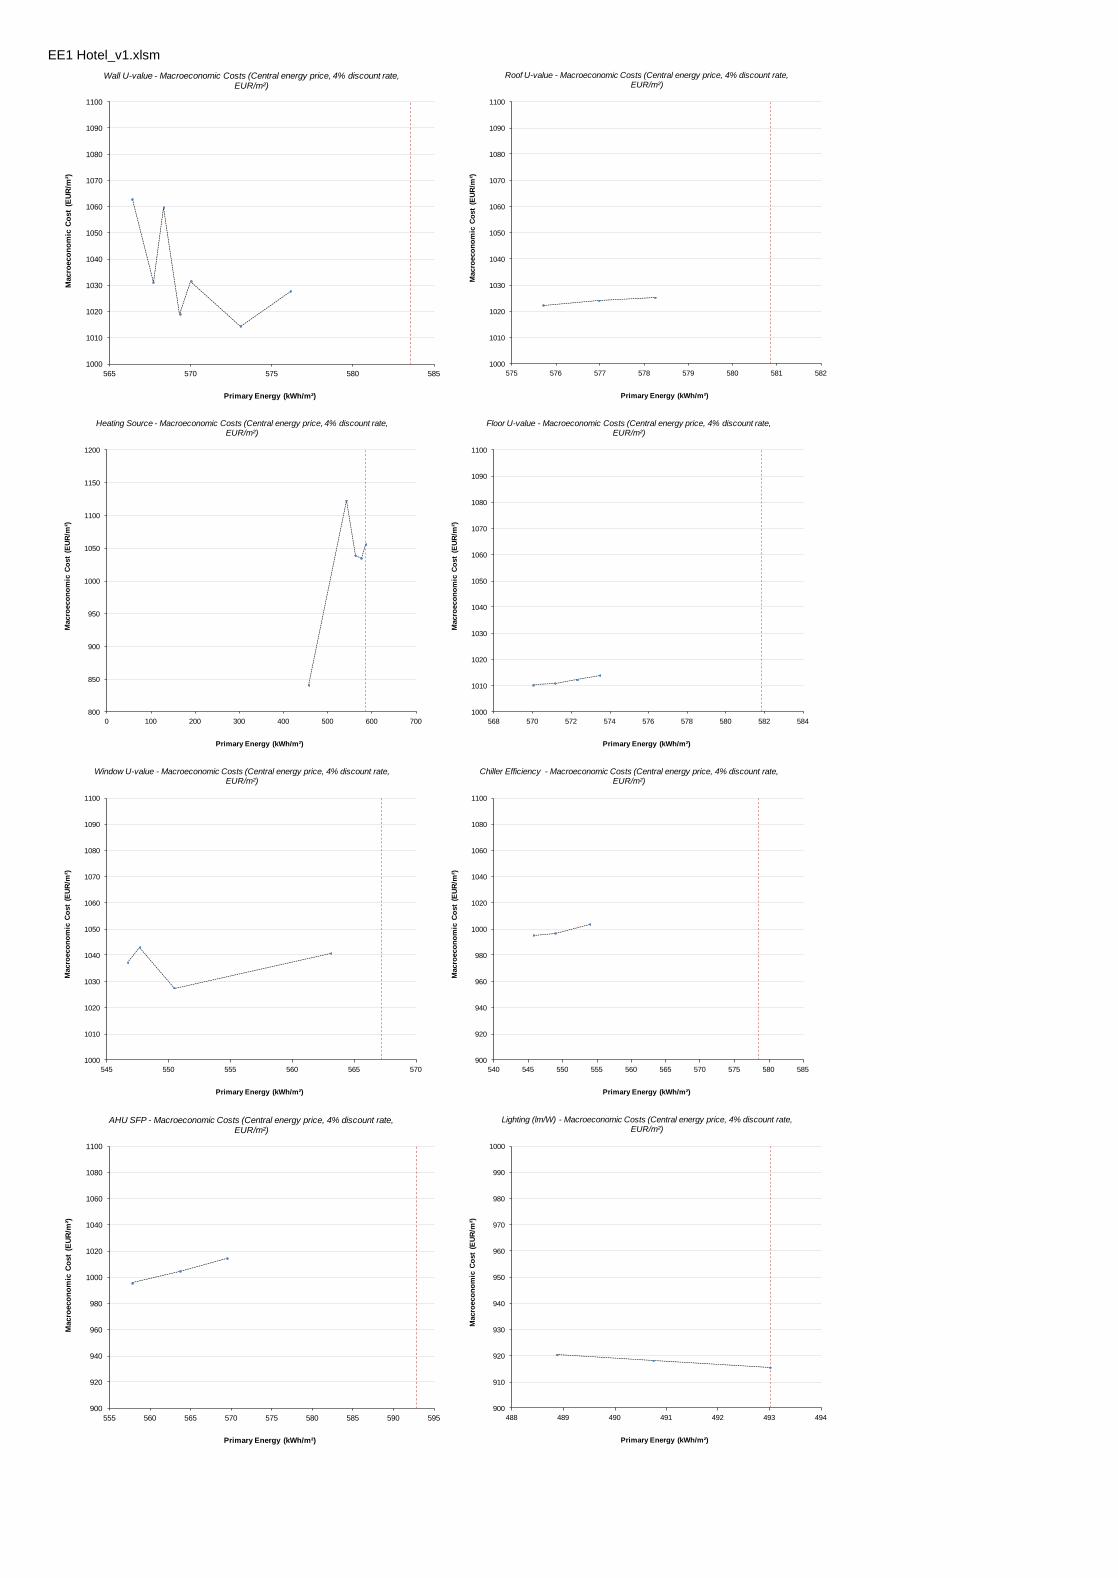
EE1 Hotel_v1.xlsm
1000
1010
1020
1030
1040
1050
1060
1070
1080
1090
1100
565 570 575 580 585
Mac
roec
onom
ic C
ost
(EUR
/m²)
Primary Energy (kWh/m²)
Wall U-value - Macroeconomic Costs (Central energy price, 4% discount rate, EUR/m²)
1000
1010
1020
1030
1040
1050
1060
1070
1080
1090
1100
575 576 577 578 579 580 581 582
Mac
roec
onom
ic C
ost
(EUR
/m²)
Primary Energy (kWh/m²)
Roof U-value - Macroeconomic Costs (Central energy price, 4% discount rate, EUR/m²)
800
850
900
950
1000
1050
1100
1150
1200
0 100 200 300 400 500 600 700
Mac
roec
onom
ic C
ost
(EUR
/m²)
Primary Energy (kWh/m²)
Heating Source - Macroeconomic Costs (Central energy price, 4% discount rate, EUR/m²)
1000
1010
1020
1030
1040
1050
1060
1070
1080
1090
1100
568 570 572 574 576 578 580 582 584
Mac
roec
onom
ic C
ost
(EUR
/m²)
Primary Energy (kWh/m²)
Floor U-value - Macroeconomic Costs (Central energy price, 4% discount rate, EUR/m²)
1000
1010
1020
1030
1040
1050
1060
1070
1080
1090
1100
545 550 555 560 565 570
Mac
roec
onom
ic C
ost
(EUR
/m²)
Primary Energy (kWh/m²)
Window U-value - Macroeconomic Costs (Central energy price, 4% discount rate, EUR/m²)
900
920
940
960
980
1000
1020
1040
1060
1080
1100
540 545 550 555 560 565 570 575 580 585
Mac
roec
onom
ic C
ost
(EUR
/m²)
Primary Energy (kWh/m²)
Chiller Efficiency - Macroeconomic Costs (Central energy price, 4% discount rate, EUR/m²)
900
920
940
960
980
1000
1020
1040
1060
1080
1100
555 560 565 570 575 580 585 590 595
Mac
roec
onom
ic C
ost
(EUR
/m²)
Primary Energy (kWh/m²)
AHU SFP - Macroeconomic Costs (Central energy price, 4% discount rate, EUR/m²)
900
910
920
930
940
950
960
970
980
990
1000
488 489 490 491 492 493 494
Mac
roec
onom
ic C
ost
(EUR
/m²)
Primary Energy (kWh/m²)
Lighting (lm/W) - Macroeconomic Costs (Central energy price, 4% discount rate, EUR/m²)

EE2 Hotel_v1.xlsm
800
810
820
830
840
850
860
870
880
890
900
440 445 450 455 460 465
Mac
roec
onom
ic C
ost
(EUR
/m²)
Primary Energy (kWh/m²)
Wall U-value - Macroeconomic Costs (Central energy price, 4% discount rate, EUR/m²)
800
810
820
830
840
850
860
870
880
890
900
452 453 454 455 456 457 458 459
Mac
roec
onom
ic C
ost
(EUR
/m²)
Primary Energy (kWh/m²)
Roof U-value - Macroeconomic Costs (Central energy price, 4% discount rate, EUR/m²)
600
650
700
750
800
850
900
950
1000
0 100 200 300 400 500
Mac
roec
onom
ic C
ost
(EUR
/m²)
Primary Energy (kWh/m²)
Heating Source - Macroeconomic Costs (Central energy price, 4% discount rate, EUR/m²)
700
720
740
760
780
800
820
840
860
880
900
444 446 448 450 452 454 456 458 460
Mac
roec
onom
ic C
ost
(EUR
/m²)
Primary Energy (kWh/m²)
Floor U-value - Macroeconomic Costs (Central energy price, 4% discount rate, EUR/m²)
800
810
820
830
840
850
860
870
880
890
900
425 430 435 440 445 450 455
Mac
roec
onom
ic C
ost
(EUR
/m²)
Primary Energy (kWh/m²)
Window U-value - Macroeconomic Costs (Central energy price, 4% discount rate, EUR/m²)
800
810
820
830
840
850
860
870
880
890
900
435 440 445 450 455 460 465
Mac
roec
onom
ic C
ost
(EUR
/m²)
Primary Energy (kWh/m²)
Chiller Efficiency - Macroeconomic Costs (Central energy price, 4% discount rate, EUR/m²)
700
720
740
760
780
800
820
840
860
880
900
440 445 450 455 460 465 470 475 480 485
Mac
roec
onom
ic C
ost
(EUR
/m²)
Primary Energy (kWh/m²)
AHU SFP - Macroeconomic Costs (Central energy price, 4% discount rate, EUR/m²)
800
810
820
830
840
850
860
870
880
890
900
434 435 436 437 438 439
Mac
roec
onom
ic C
ost
(EUR
/m²)
Primary Energy (kWh/m²)
Lighting (lm/W) - Macroeconomic Costs (Central energy price, 4% discount rate, EUR/m²)