Embed Size (px)
Citation preview
Building Engineering
Department of the Environment, Community and Local Government
04/02/15
Cost Optimal Calculations and Gap Analysis for recast EPBD for Buildings: Additional Calculations
Prepared by: ............................................................. Checked by: ........................................................................ Mary Livingstone, Chris Pountney and David Ross David Ross Senior Consultant, Principal Consultant, Regional Director Regional Director Approved by: ............................................................. Lionel Delorme Associate Director Cost Optimal Calculations and Gap Analysis for recast EPBD for Buildings: Additional Calculations
Rev No Comments Checked by Approved by
Date
1 Final Report
MidCity Place, 71 High Holborn, London WC1V 6QS Telephone: 0207 645 2000 Website: http://www.aecom.com Job No: 60339074 Date Created 19/02/15 This document has been prepared by AECOM Limited for the sole use of our client (the “Client”) and in accordance with generally accepted consultancy principles, the budget for fees and the terms of reference agreed between AECOM Limited and the Client. Any information provided by third parties and referred to herein has not been checked or verified by AECOM Limited, unless otherwise expressly stated in the document. No third party may rely upon this document without the prior and express written agreement of AECOM Limited.
1. Introduction ....................................................................................................................................................................... 1
2. Reference Buildings.......................................................................................................................................................... 3
3. Measures and Packages ................................................................................................................................................. 10
4. Calculation of Primary Energy Demand for the Measures .......................................................................................... 18
5. Global Cost Calculation .................................................................................................................................................. 27
6. Cost Optimal Level for Reference Buildings ................................................................................................................ 71
7. Comparison of Current Regulations and Cost Optimal Level ..................................................................................... 85
Appendix 1: Current Regulations ................................................................................................................................................ 91
Table of Contents
AECOM Cost Optimal Calculations and Gap Analysis for recast EPBD for Buildings: Additional Calculations 1
Capabilities on project:
Building Engineering
This report details work undertaken for the Department of the Environment, Community and Local Government. It
describes cost-optimal calculations and gap analysis for buildings in accordance with Article 5 of Directive
2010/31/EU of the European Parliament and of the Council of 19 May 2010 on the energy performance of buildings
(recast) (hereinafter referred to as the recast EPBD). In doing this work, we have paid regard to Commission
Delegated Regulation (EU) No 244/2012 of 16 January 2012 supplementing Directive 2010/31/EU of the European
Parliament and of the Council on the energy performance of buildings by establishing a comparative methodology
framework for calculating cost-optimal levels of minimum energy performance requirements for buildings and
building elements (hereinafter referred to as the Cost-Optimal Regulation) and the associated Guidelines
accompanying Commission Delegated Regulation (EU) No 244/2012 of 16 January 2012 supplementing Directive
2010/31/EU of the European Parliament and of the Council on the energy performance of buildings by establishing a
comparative methodology framework for calculating cost-optimal levels of minimum energy performance
requirements for buildings and building elements.
Previously, AECOM produced for the Department of the Environment, Community and Local Government and the
Sustainable Energy Authority of Ireland two reports which were the basis of the Irish Government’s submission to
the European Commission to fulfil the requirements of Article 5. These reports are published as follows:
Ireland Cost Optimal Report: Residential
http://www.buildup.eu/sites/default/files/content/Ireland%20Cost%20Optimal%20Report-
Section%201%20Residential_0.pdf
Ireland Cost Optimal Report: Non-Residential
http://www.buildup.eu/sites/default/files/content/Ireland%20Cost%20Optimal%20Report-
Section%202%20Non%20Residential.pdf
This report presents additional work to address the following activities:
a) Additional analysis for new complete apartment block buildings in accordance with Annex 1, point 1(1) of
the Delegated regulation (EU) No 244/2012
b) Additional analysis for existing complete apartment block buildings, focussing on cost-optimum at an
elemental level in accordance with Annex 1, point 1(1) of the Delegated regulation (EU) No 244/2012
c) Additional analysis for existing complete apartment block buildings, focussing on cost-optimum for packages
of whole building renovation measures in accordance with Annex 1, point 1(1) of the Delegated regulation
(EU) No 244/2012
d) Additional analysis for existing non-residential buildings1, focussing on cost-optimum for packages of whole
building renovation measures in accordance with Article 4(1), of the Directive 2010/31/EU together with
Article 7, first paragraph;
The additional residential building analysis (a-c) builds on the previous work which independently evaluated mid and
top floor flats (mid-floor only for (c)). This new analysis considers apartment buildings as a whole. The additional
non-residential analysis (d) builds on the previous work which determined the cost-optimum levels for individual
building measures and now identifies cost optimum packages of measures.
We have based the format of this report upon the reporting template provided in Annex 3 of the Cost-Optimal
Regulation. We have adapted the template where we have found it easier to present the data, although not losing
1Analysis for existing residential buildings in accordance (Article 4(1), of the Directive 2010/31/EU together with Article 7, first paragraph was
submitted in original report submitted
1. Introduction

AECOM Cost Optimal Calculations and Gap Analysis for recast EPBD for Buildings: Additional Calculations 2
Capabilities on project:
Building Engineering
any of the desired content. Where appropriate, we have made reference to the two previous reports rather than
unnecessarily duplicating information here.
AECOM Cost Optimal Calculations and Gap Analysis for recast EPBD for Buildings: Additional Calculations 3
Capabilities on project:
Building Engineering
2.1 New Apartment Buildings
According to Annex 1 of Cost Optimal Regulation, member states should establish reference buildings for the
following residential building categories: single-family buildings and apartment blocks or multifamily buildings. For
each building category, at least one reference building shall be established for new buildings.
The initial Residential Report presented the results for five building types and a rationale for their choice:
1. Bungalow
2. Detached house
3. Semi-detached house
4. Mid-floor flat
5. Top-floor flat.
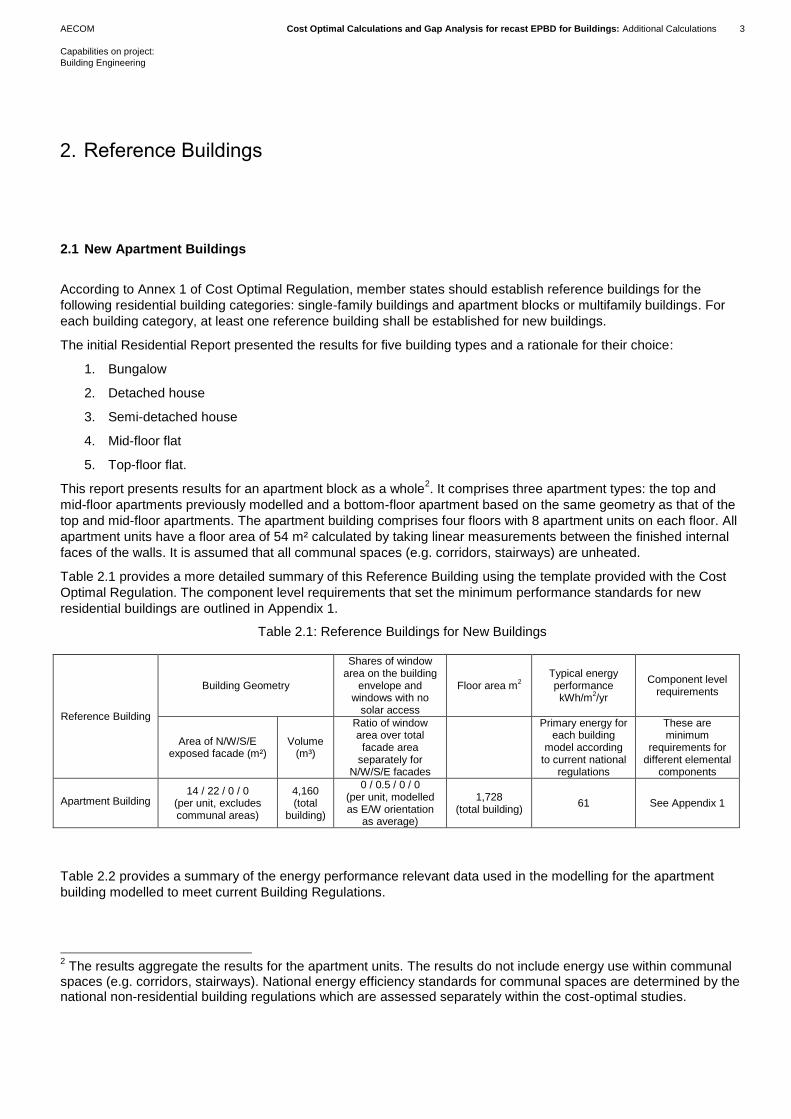
This report presents results for an apartment block as a whole2. It comprises three apartment types: the top and
mid-floor apartments previously modelled and a bottom-floor apartment based on the same geometry as that of the
top and mid-floor apartments. The apartment building comprises four floors with 8 apartment units on each floor. All
apartment units have a floor area of 54 m² calculated by taking linear measurements between the finished internal
faces of the walls. It is assumed that all communal spaces (e.g. corridors, stairways) are unheated.
Table 2.1 provides a more detailed summary of this Reference Building using the template provided with the Cost
Optimal Regulation. The component level requirements that set the minimum performance standards for new
residential buildings are outlined in Appendix 1.
Table 2.1: Reference Buildings for New Buildings
Reference Building
Building Geometry
Shares of window area on the building
envelope and windows with no
solar access
Floor area m2
Typical energy performance kWh/m
2/yr
Component level requirements
Area of N/W/S/E exposed facade (m²)
Volume (m³)
Ratio of window area over total facade area
separately for N/W/S/E facades
Primary energy for each building
model according to current national
regulations
These are minimum
requirements for different elemental
components
Apartment Building 14 / 22 / 0 / 0
(per unit, excludes communal areas)
4,160 (total
building)
0 / 0.5 / 0 / 0 (per unit, modelled as E/W orientation
as average)
1,728 (total building)
61 See Appendix 1
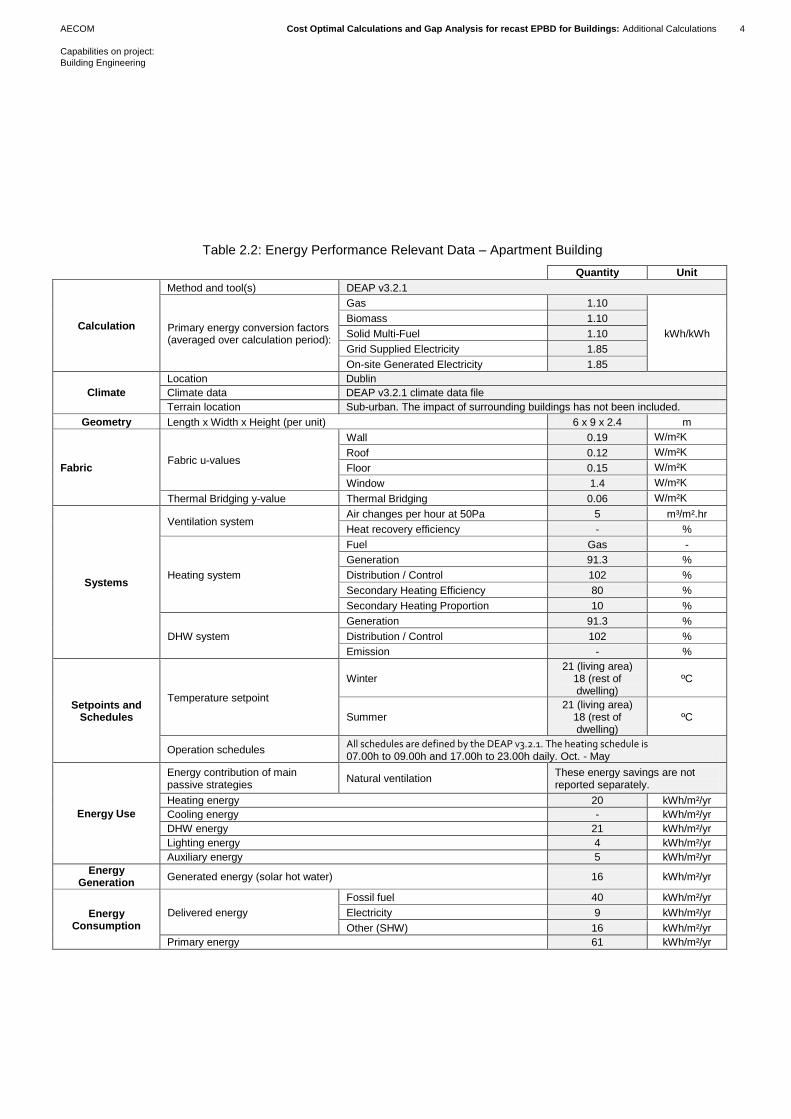
Table 2.2 provides a summary of the energy performance relevant data used in the modelling for the apartment
building modelled to meet current Building Regulations.
2 The results aggregate the results for the apartment units. The results do not include energy use within communal
spaces (e.g. corridors, stairways). National energy efficiency standards for communal spaces are determined by the national non-residential building regulations which are assessed separately within the cost-optimal studies.
2. Reference Buildings
AECOM Cost Optimal Calculations and Gap Analysis for recast EPBD for Buildings: Additional Calculations 4
Capabilities on project:
Building Engineering
Table 2.2: Energy Performance Relevant Data – Apartment Building
Quantity Unit
Calculation
Method and tool(s) DEAP v3.2.1
Primary energy conversion factors (averaged over calculation period):
Gas 1.10
kWh/kWh
Biomass 1.10
Solid Multi-Fuel 1.10
Grid Supplied Electricity 1.85
On-site Generated Electricity 1.85
Climate
Location Dublin
Climate data DEAP v3.2.1 climate data file
Terrain location Sub-urban. The impact of surrounding buildings has not been included.
Geometry Length x Width x Height (per unit) 6 x 9 x 2.4 m
Fabric Fabric u-values
Wall 0.19 W/m²K
Roof 0.12 W/m²K
Floor 0.15 W/m²K
Window 1.4 W/m²K
Thermal Bridging y-value Thermal Bridging 0.06 W/m²K
Systems
Ventilation system Air changes per hour at 50Pa 5 m³/m².hr
Heat recovery efficiency - %
Heating system
Fuel Gas -
Generation 91.3 %
Distribution / Control 102 %
Secondary Heating Efficiency 80 %
Secondary Heating Proportion 10 %
DHW system
Generation 91.3 %
Distribution / Control 102 %
Emission - %
Setpoints and Schedules
Temperature setpoint
Winter 21 (living area)
18 (rest of dwelling)
ºC
Summer 21 (living area)
18 (rest of dwelling)
ºC
Operation schedules All schedules are defined by the DEAP v3.2.1. The heating schedule is 07.00h to 09.00h and 17.00h to 23.00h daily. Oct. - May
Energy Use
Energy contribution of main passive strategies
Natural ventilation These energy savings are not reported separately.
Heating energy 20 kWh/m²/yr
Cooling energy - kWh/m²/yr
DHW energy 21 kWh/m²/yr
Lighting energy 4 kWh/m²/yr
Auxiliary energy 5 kWh/m²/yr
Energy Generation
Generated energy (solar hot water) 16 kWh/m²/yr
Energy Consumption
Delivered energy
Fossil fuel 40 kWh/m²/yr
Electricity 9 kWh/m²/yr
Other (SHW) 16 kWh/m²/yr
Primary energy 61 kWh/m²/yr
AECOM Cost Optimal Calculations and Gap Analysis for recast EPBD for Buildings: Additional Calculations 5
Capabilities on project:
Building Engineering
2.2 Existing Apartment Buildings (for both elemental and whole building renovation analysis)
Consistent with the previous work described in the Residential Report, we have considered two variations for
existing buildings: (i) pre-1978 uninsulated cavity wall constructed buildings and (ii) uninsulated hollow block
constructed buildings. These represent two common existing building construction types within Ireland which would
be expected to have significantly different baseline energy performances, significant potential for energy efficiency
upgrades, and different options available for wall retrofit.
The same building models have been used for new and existing build (i.e. same size and geometry). The rationale
for these models was provided in the previous Residential Report.
The baseline energy performance for the existing buildings has been modelled based upon Ireland’s energy
performance certificate database, upon the Irish data gathered as part of the Intelligent Energy Europe TABULA
project (http://www.energyaction.ie/projects/tabula.php), and upon the government’s forthcoming National Code of
Practice on Retrofitting (http://www.nsainep.ie/Home/Index?CommitteeFilter=NSAI/TC+40).
The TABULA project ran from 2009-2012 and identified common residential building typologies for participating
member states. The energy performance certificate database contains the data used to produce energy
performance certificates for existing buildings required under Article 7 of the original Energy Performance of
Buildings Directive. There are currently c.340,000 records, with large datasets for each of the building types we are
considering for this study (https://ndber.seai.ie/pass/ber/search.aspx).
TABULA provided some approximate baseline building specifications (fabric u-values) and aided the identification of
typical refurbishment options which were to be modelled for existing dwellings. The EPC database also allowed us
to identify approximate baseline building specifications (fabric u-values, service efficiencies, fuel types). They were
used to develop a full set of specifications which could be modelled as the baseline for the different reference
buildings.
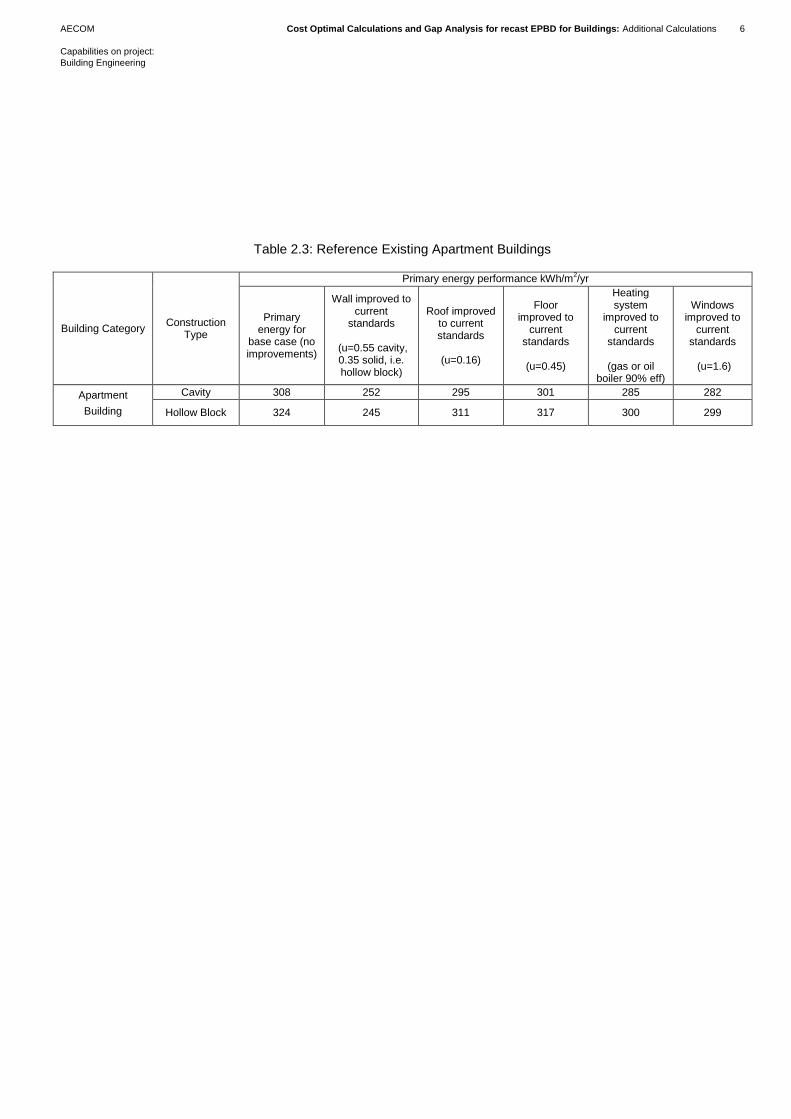
Table 2.3 provides a summary of the two reference apartment buildings using the template provided in the Cost
Optimal Regulation. It includes the primary energy associated with the base case reference buildings, and with
building specifications that comply with current national regulations which apply to existing buildings when the
relevant improvement measures are made (based on requirements under Building Regulations Part L Technical
Guidance Document 2011). We have omitted information on the building technologies and base case performance
specifications in this table as these are provided in more detail in Tables 2.4a-b.
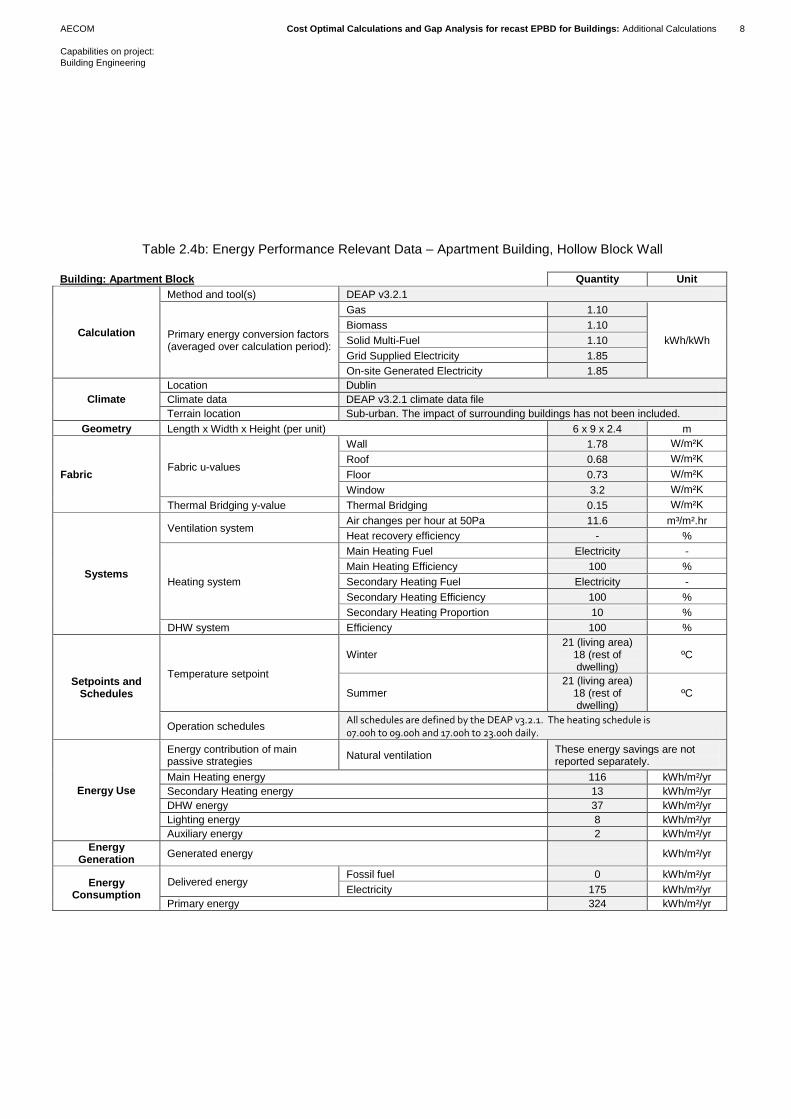
Tables 2.4a-b provide a summary of the energy performance data based on the base case reference buildings
without improvements made. We have omitted information on the buildings themselves which were provided in
Table 2.2.
Note that these two reference apartment buildings have been used for both the elemental and whole building
renovation analysis.
AECOM Cost Optimal Calculations and Gap Analysis for recast EPBD for Buildings: Additional Calculations 6
Capabilities on project:
Building Engineering
Table 2.3: Reference Existing Apartment Buildings
Building Category Construction
Type
Primary energy performance kWh/m2/yr
Primary energy for
base case (no improvements)
Wall improved to current
standards
(u=0.55 cavity, 0.35 solid, i.e. hollow block)
Roof improved to current standards
(u=0.16)
Floor improved to
current standards
(u=0.45)
Heating system
improved to current
standards
(gas or oil boiler 90% eff)
Windows improved to
current standards
(u=1.6)
Apartment
Building
Cavity 308 252 295 301 285 282
Hollow Block 324 245 311 317 300 299

AECOM Cost Optimal Calculations and Gap Analysis for recast EPBD for Buildings: Additional Calculations 7
Capabilities on project:
Building Engineering
Table 2.4a: Energy Performance Relevant Data – Apartment Building, Cavity Wall
Building: Apartment Block Quantity Unit
Calculation
Method and tool(s) DEAP v3.2.1
Primary energy conversion factors (averaged over calculation period):
Gas 1.10
kWh/kWh
Biomass 1.10
Solid Multi-Fuel 1.10
Grid Supplied Electricity 1.85
On-site Generated Electricity 1.85
Climate
Location Dublin
Climate data DEAP v3.2.1 climate data file
Terrain location Sub-urban. The impact of surrounding buildings has not been included.
Geometry Length x Width x Height (per unit) 6 x 9 x 2.4 m
Fabric Fabric u-values
Wall 1.78 W/m²K
Roof 0.68 W/m²K
Floor 0.73 W/m²K
Window 3.2 W/m²K
Thermal Bridging y-value Thermal Bridging 0.15 W/m²K
Systems
Ventilation system Air changes per hour at 50Pa 11.6 m³/m².hr
Heat recovery efficiency - %
Heating system
Main Heating Fuel Electricity -
Main Heating Efficiency 100 %
Secondary Heating Fuel Electricity -
Secondary Heating Efficiency 100 %
Secondary Heating Proportion 10 %
DHW system Efficiency 100 %
Setpoints and Schedules
Temperature setpoint
Winter 21 (living area)
18 (rest of dwelling)
ºC
Summer 21 (living area)
18 (rest of dwelling)
ºC
Operation schedules All schedules are defined by the DEAP v3.2.1. The heating schedule is 07.00h to 09.00h and 17.00h to 23.00h daily.
Energy Use
Energy contribution of main passive strategies
Natural ventilation These energy savings are not reported separately.
Main Heating energy 108 kWh/m²/yr
Secondary Heating energy 12 kWh/m²/yr
DHW energy 37 kWh/m²/yr
Lighting energy 8 kWh/m²/yr
Auxiliary energy 2 kWh/m²/yr
Energy Generation
Generated energy kWh/m²/yr
Energy Consumption
Delivered energy Fossil fuel 0 kWh/m²/yr
Electricity 166 kWh/m²/yr
Primary energy 308 kWh/m²/yr
AECOM Cost Optimal Calculations and Gap Analysis for recast EPBD for Buildings: Additional Calculations 8
Capabilities on project:
Building Engineering
Table 2.4b: Energy Performance Relevant Data – Apartment Building, Hollow Block Wall Building: Apartment Block Quantity Unit
Calculation
Method and tool(s) DEAP v3.2.1
Primary energy conversion factors (averaged over calculation period):
Gas 1.10
kWh/kWh
Biomass 1.10
Solid Multi-Fuel 1.10
Grid Supplied Electricity 1.85
On-site Generated Electricity 1.85
Climate
Location Dublin
Climate data DEAP v3.2.1 climate data file
Terrain location Sub-urban. The impact of surrounding buildings has not been included.
Geometry Length x Width x Height (per unit) 6 x 9 x 2.4 m
Fabric Fabric u-values
Wall 1.78 W/m²K
Roof 0.68 W/m²K
Floor 0.73 W/m²K
Window 3.2 W/m²K
Thermal Bridging y-value Thermal Bridging 0.15 W/m²K
Systems
Ventilation system Air changes per hour at 50Pa 11.6 m³/m².hr
Heat recovery efficiency - %
Heating system
Main Heating Fuel Electricity -
Main Heating Efficiency 100 %
Secondary Heating Fuel Electricity -
Secondary Heating Efficiency 100 %
Secondary Heating Proportion 10 %
DHW system Efficiency 100 %
Setpoints and Schedules
Temperature setpoint
Winter 21 (living area)
18 (rest of dwelling)
ºC
Summer 21 (living area)
18 (rest of dwelling)
ºC
Operation schedules All schedules are defined by the DEAP v3.2.1. The heating schedule is 07.00h to 09.00h and 17.00h to 23.00h daily.
Energy Use
Energy contribution of main passive strategies
Natural ventilation These energy savings are not reported separately.
Main Heating energy 116 kWh/m²/yr
Secondary Heating energy 13 kWh/m²/yr
DHW energy 37 kWh/m²/yr
Lighting energy 8 kWh/m²/yr
Auxiliary energy 2 kWh/m²/yr
Energy Generation
Generated energy kWh/m²/yr
Energy Consumption
Delivered energy Fossil fuel 0 kWh/m²/yr
Electricity 175 kWh/m²/yr
Primary energy 324 kWh/m²/yr
AECOM Cost Optimal Calculations and Gap Analysis for recast EPBD for Buildings: Additional Calculations 9
Capabilities on project:
Building Engineering
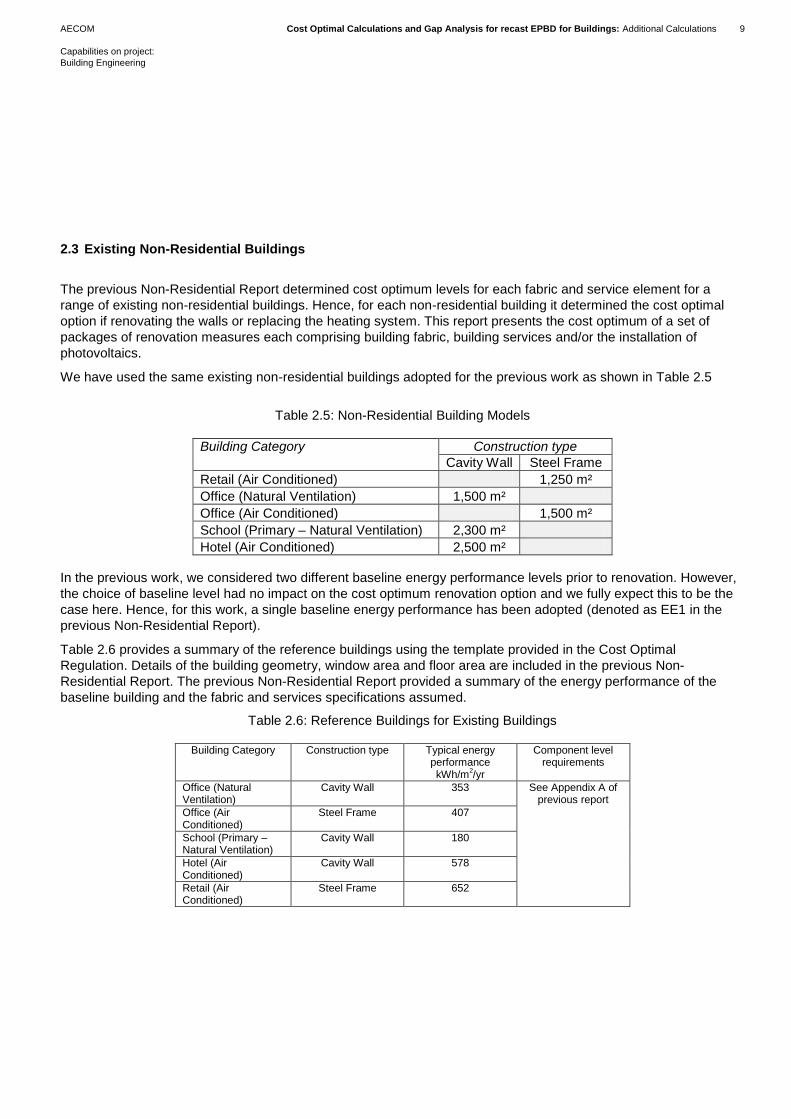
2.3 Existing Non-Residential Buildings
The previous Non-Residential Report determined cost optimum levels for each fabric and service element for a
range of existing non-residential buildings. Hence, for each non-residential building it determined the cost optimal
option if renovating the walls or replacing the heating system. This report presents the cost optimum of a set of
packages of renovation measures each comprising building fabric, building services and/or the installation of
photovoltaics.
We have used the same existing non-residential buildings adopted for the previous work as shown in Table 2.5
Table 2.5: Non-Residential Building Models
Building Category Construction type
Cavity Wall Steel Frame
Retail (Air Conditioned) 1,250 m²
Office (Natural Ventilation) 1,500 m²
Office (Air Conditioned) 1,500 m²
School (Primary – Natural Ventilation) 2,300 m²
Hotel (Air Conditioned) 2,500 m²
In the previous work, we considered two different baseline energy performance levels prior to renovation. However,
the choice of baseline level had no impact on the cost optimum renovation option and we fully expect this to be the
case here. Hence, for this work, a single baseline energy performance has been adopted (denoted as EE1 in the
previous Non-Residential Report).
Table 2.6 provides a summary of the reference buildings using the template provided in the Cost Optimal
Regulation. Details of the building geometry, window area and floor area are included in the previous Non-
Residential Report. The previous Non-Residential Report provided a summary of the energy performance of the
baseline building and the fabric and services specifications assumed.
Table 2.6: Reference Buildings for Existing Buildings
Building Category Construction type Typical energy performance kWh/m
2/yr
Component level requirements
Office (Natural Ventilation)
Cavity Wall 353 See Appendix A of previous report
Office (Air Conditioned)
Steel Frame 407
School (Primary – Natural Ventilation)
Cavity Wall 180
Hotel (Air Conditioned)
Cavity Wall 578
Retail (Air Conditioned)
Steel Frame 652
AECOM Cost Optimal Calculations and Gap Analysis for recast EPBD for Buildings: Additional Calculations 10
Capabilities on project:
Building Engineering
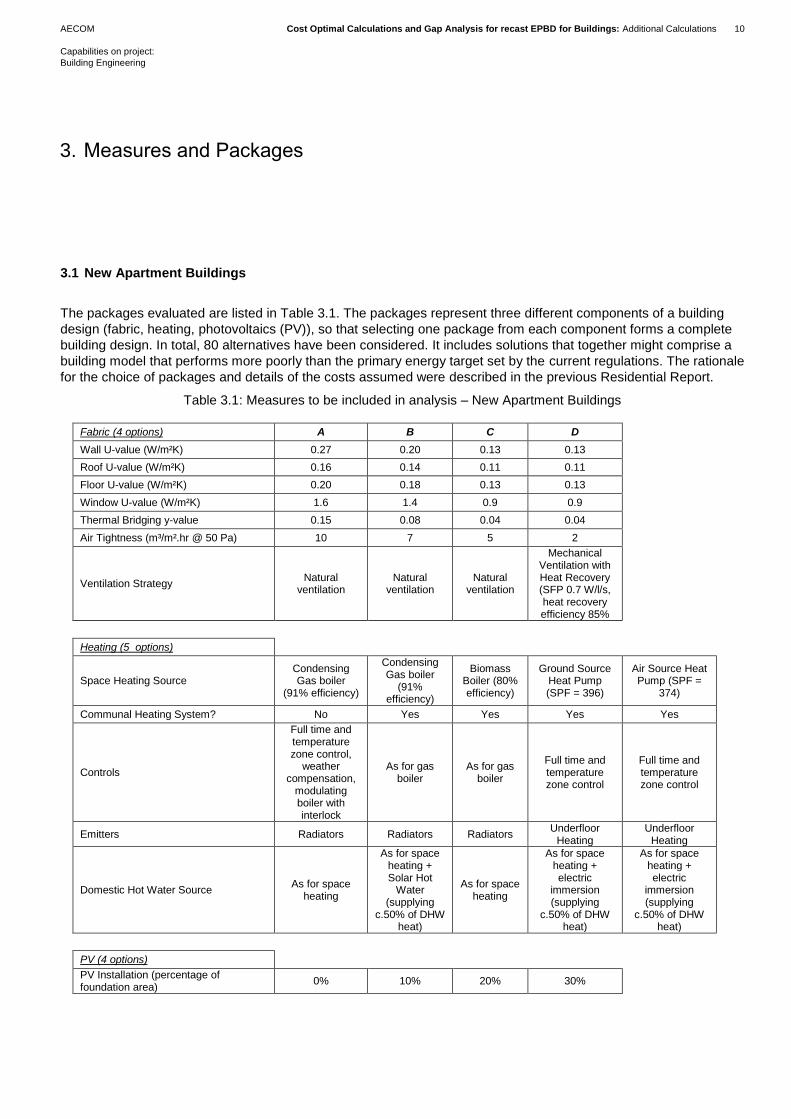
3.1 New Apartment Buildings
The packages evaluated are listed in Table 3.1. The packages represent three different components of a building
design (fabric, heating, photovoltaics (PV)), so that selecting one package from each component forms a complete
building design. In total, 80 alternatives have been considered. It includes solutions that together might comprise a
building model that performs more poorly than the primary energy target set by the current regulations. The rationale
for the choice of packages and details of the costs assumed were described in the previous Residential Report.
Table 3.1: Measures to be included in analysis – New Apartment Buildings
Fabric (4 options) A B C D
Wall U-value (W/m²K) 0.27 0.20 0.13 0.13
Roof U-value (W/m²K) 0.16 0.14 0.11 0.11
Floor U-value (W/m²K) 0.20 0.18 0.13 0.13
Window U-value (W/m²K) 1.6 1.4 0.9 0.9
Thermal Bridging y-value 0.15 0.08 0.04 0.04
Air Tightness (m³/m².hr @ 50 Pa) 10 7 5 2
Ventilation Strategy Natural
ventilation Natural
ventilation Natural
ventilation
Mechanical Ventilation with Heat Recovery (SFP 0.7 W/l/s, heat recovery efficiency 85%
Heating (5 options)
Space Heating Source Condensing Gas boiler
(91% efficiency)
Condensing Gas boiler
(91% efficiency)
Biomass Boiler (80% efficiency)
Ground Source Heat Pump (SPF = 396)
Air Source Heat Pump (SPF =
374)
Communal Heating System? No Yes Yes Yes Yes
Controls
Full time and temperature zone control,
weather compensation,
modulating boiler with interlock
As for gas boiler
As for gas boiler
Full time and temperature zone control
Full time and temperature zone control
Emitters Radiators Radiators Radiators Underfloor
Heating Underfloor
Heating
Domestic Hot Water Source As for space
heating
As for space heating + Solar Hot
Water (supplying
c.50% of DHW heat)
As for space heating
As for space heating + electric
immersion (supplying
c.50% of DHW heat)
As for space heating + electric
immersion (supplying
c.50% of DHW heat)
PV (4 options)
PV Installation (percentage of foundation area)
0% 10% 20% 30%
3. Measures and Packages
AECOM Cost Optimal Calculations and Gap Analysis for recast EPBD for Buildings: Additional Calculations 11
Capabilities on project:
Building Engineering
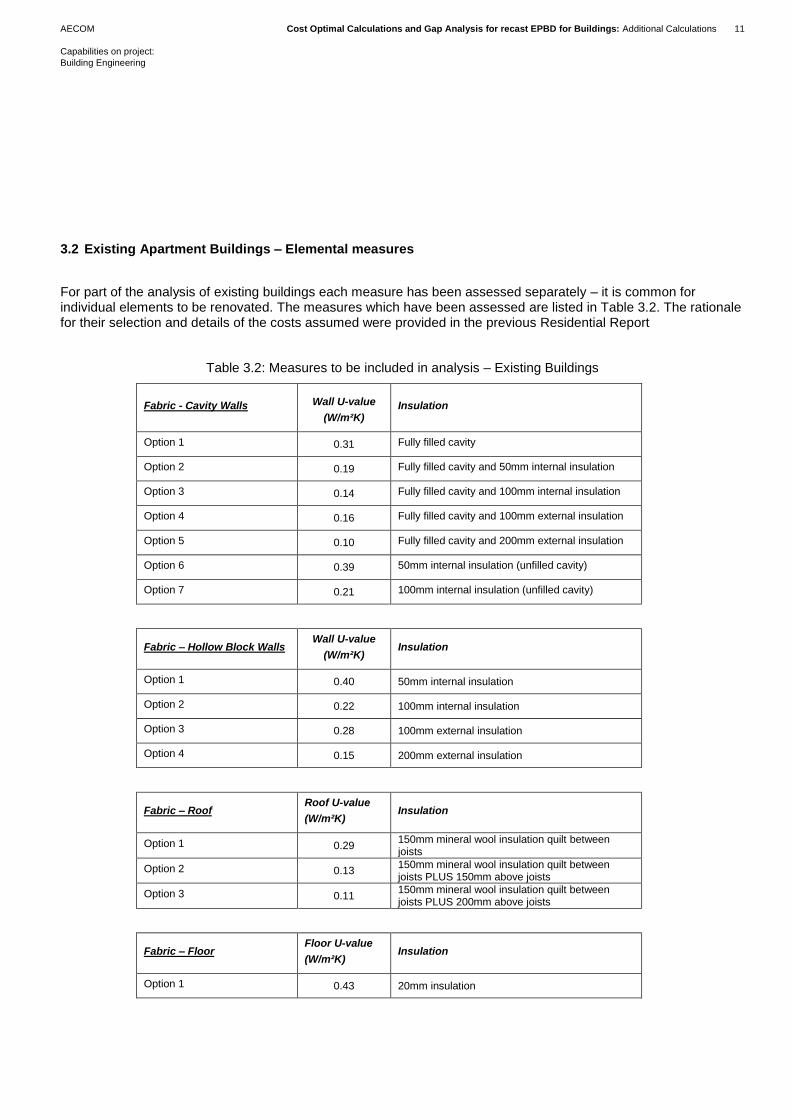
3.2 Existing Apartment Buildings – Elemental measures
For part of the analysis of existing buildings each measure has been assessed separately – it is common for individual elements to be renovated. The measures which have been assessed are listed in Table 3.2. The rationale for their selection and details of the costs assumed were provided in the previous Residential Report
Table 3.2: Measures to be included in analysis – Existing Buildings
Fabric - Cavity Walls Wall U-value
(W/m²K) Insulation
Option 1 0.31 Fully filled cavity
Option 2 0.19 Fully filled cavity and 50mm internal insulation
Option 3 0.14 Fully filled cavity and 100mm internal insulation
Option 4 0.16 Fully filled cavity and 100mm external insulation
Option 5 0.10 Fully filled cavity and 200mm external insulation
Option 6 0.39 50mm internal insulation (unfilled cavity)
Option 7 0.21 100mm internal insulation (unfilled cavity)
Fabric – Hollow Block Walls Wall U-value
(W/m²K) Insulation
Option 1 0.40 50mm internal insulation
Option 2 0.22 100mm internal insulation
Option 3 0.28 100mm external insulation
Option 4 0.15 200mm external insulation
Fabric – Roof Roof U-value
(W/m²K) Insulation
Option 1 0.29 150mm mineral wool insulation quilt between joists
Option 2 0.13 150mm mineral wool insulation quilt between joists PLUS 150mm above joists
Option 3 0.11 150mm mineral wool insulation quilt between joists PLUS 200mm above joists
Fabric – Floor Floor U-value
(W/m²K) Insulation
Option 1 0.43 20mm insulation
AECOM Cost Optimal Calculations and Gap Analysis for recast EPBD for Buildings: Additional Calculations 12
Capabilities on project:
Building Engineering
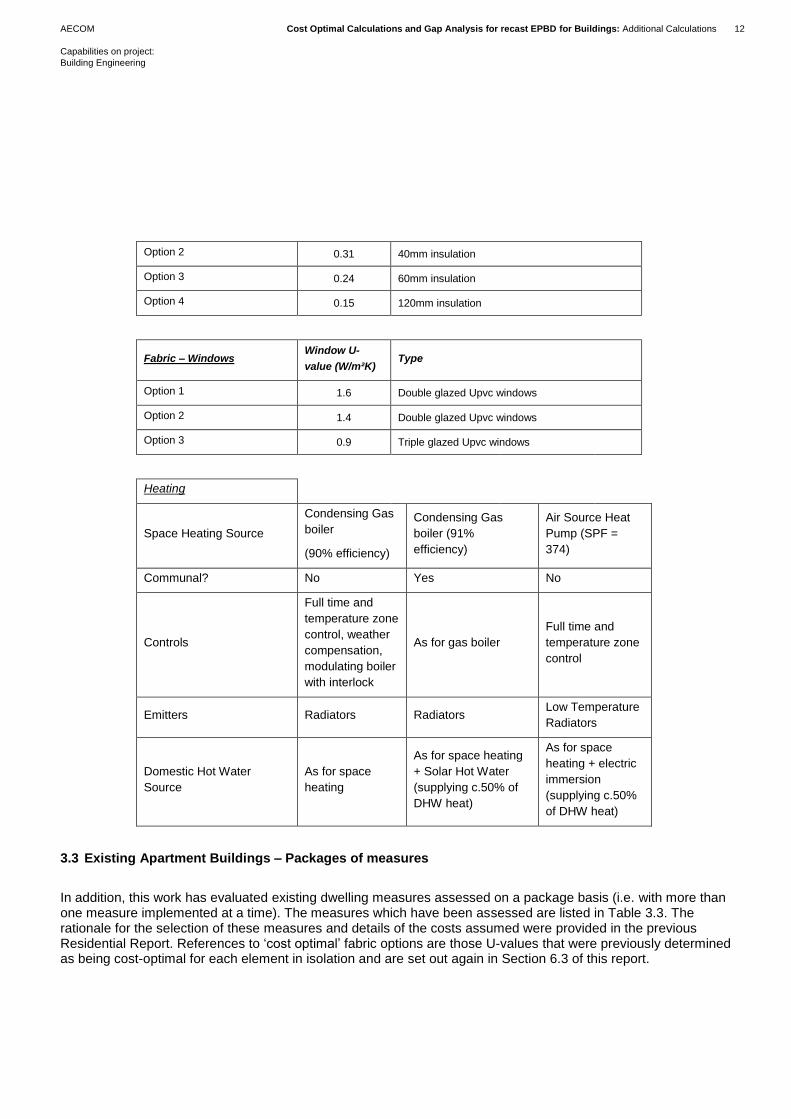
Option 2 0.31 40mm insulation
Option 3 0.24 60mm insulation
Option 4 0.15 120mm insulation
Fabric – Windows Window U-
value (W/m²K) Type
Option 1 1.6 Double glazed Upvc windows
Option 2 1.4 Double glazed Upvc windows
Option 3 0.9 Triple glazed Upvc windows
Heating
Space Heating Source
Condensing Gas
boiler
(90% efficiency)
Condensing Gas
boiler (91%
efficiency)
Air Source Heat
Pump (SPF =
374)
Communal? No Yes No
Controls
Full time and
temperature zone
control, weather
compensation,
modulating boiler
with interlock
As for gas boiler
Full time and
temperature zone
control
Emitters Radiators Radiators Low Temperature
Radiators
Domestic Hot Water
Source
As for space
heating
As for space heating
+ Solar Hot Water
(supplying c.50% of
DHW heat)
As for space
heating + electric
immersion
(supplying c.50%
of DHW heat)
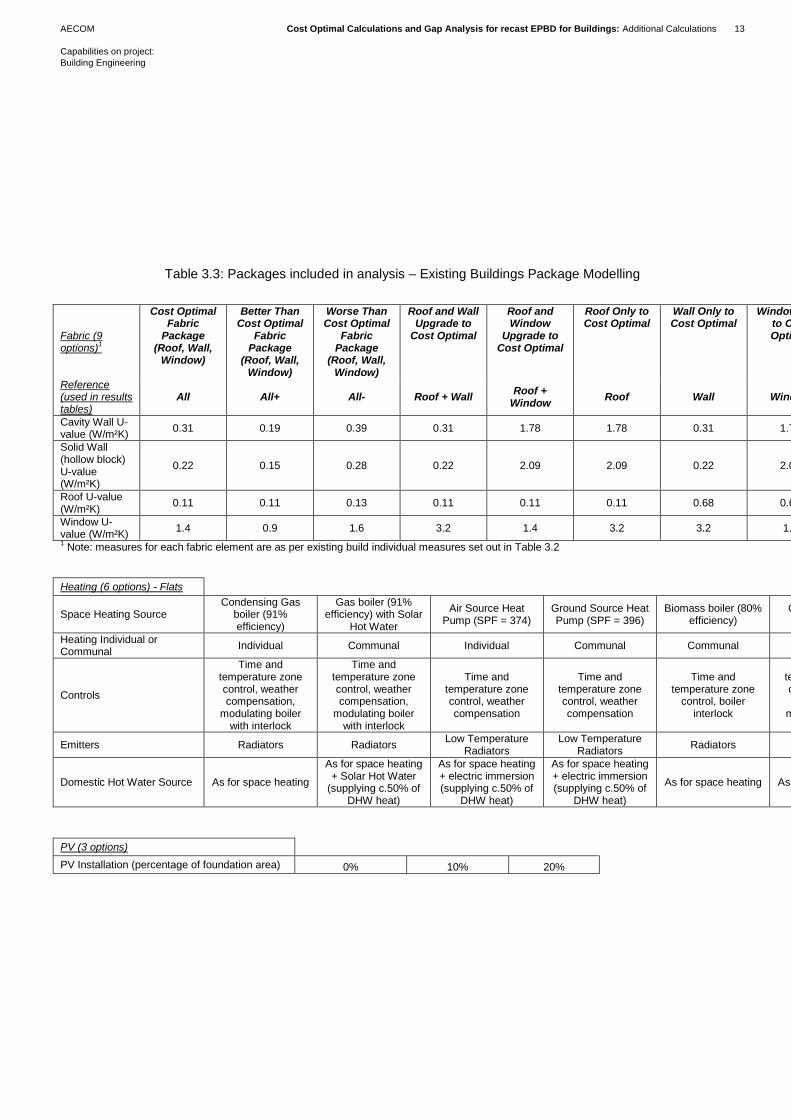
3.3 Existing Apartment Buildings – Packages of measures
In addition, this work has evaluated existing dwelling measures assessed on a package basis (i.e. with more than one measure implemented at a time). The measures which have been assessed are listed in Table 3.3. The rationale for the selection of these measures and details of the costs assumed were provided in the previous Residential Report. References to ‘cost optimal’ fabric options are those U-values that were previously determined as being cost-optimal for each element in isolation and are set out again in Section 6.3 of this report.
AECOM Cost Optimal Calculations and Gap Analysis for recast EPBD for Buildings: Additional Calculations 13
Capabilities on project:
Building Engineering
Table 3.3: Packages included in analysis – Existing Buildings Package Modelling
Fabric (9 options)
1
Cost Optimal Fabric
Package (Roof, Wall,
Window)
Better Than Cost Optimal
Fabric Package
(Roof, Wall, Window)
Worse Than Cost Optimal
Fabric Package
(Roof, Wall, Window)
Roof and Wall Upgrade to
Cost Optimal
Roof and Window
Upgrade to Cost Optimal
Roof Only to Cost Optimal
Wall Only to Cost Optimal
Window Only to Cost Optimal
Window and Wall to Cost
Optimal
Reference (used in results tables)
All All+ All- Roof + Wall Roof +
Window Roof Wall Window
Window + Wall
Cavity Wall U-value (W/m²K)
0.31 0.19 0.39 0.31 1.78 1.78 0.31 1.78 0.31
Solid Wall (hollow block) U-value (W/m²K)
0.22 0.15 0.28 0.22 2.09 2.09 0.22 2.09 0.22
Roof U-value (W/m²K)
0.11 0.11 0.13 0.11 0.11 0.11 0.68 0.68 0.68
Window U-value (W/m²K)
1.4 0.9 1.6 3.2 1.4 3.2 3.2 1.4 1.4
1 Note: measures for each fabric element are as per existing build individual measures set out in Table 3.2
Heating (6 options) - Flats
Space Heating Source Condensing Gas
boiler (91% efficiency)
Gas boiler (91% efficiency) with Solar
Hot Water
Air Source Heat Pump (SPF = 374)
Ground Source Heat Pump (SPF = 396)
Biomass boiler (80% efficiency)
Gas boiler (91% efficiency)
Heating Individual or Communal
Individual Communal Individual Communal Communal Communal
Controls
Time and temperature zone control, weather compensation,
modulating boiler with interlock
Time and temperature zone control, weather compensation,
modulating boiler with interlock
Time and temperature zone control, weather compensation
Time and temperature zone control, weather compensation
Time and temperature zone
control, boiler interlock
Time and temperature zone control, weather compensation,
modulating boiler with interlock
Emitters Radiators Radiators Low Temperature
Radiators Low Temperature
Radiators Radiators Radiators
Domestic Hot Water Source As for space heating
As for space heating + Solar Hot Water
(supplying c.50% of DHW heat)
As for space heating + electric immersion (supplying c.50% of
DHW heat)
As for space heating + electric immersion (supplying c.50% of
DHW heat)
As for space heating As for space heating
PV (3 options)
PV Installation (percentage of foundation area) 0% 10% 20%

AECOM Cost Optimal Calculations and Gap Analysis for recast EPBD for Buildings: Additional Calculations 14
Capabilities on project:
Building Engineering
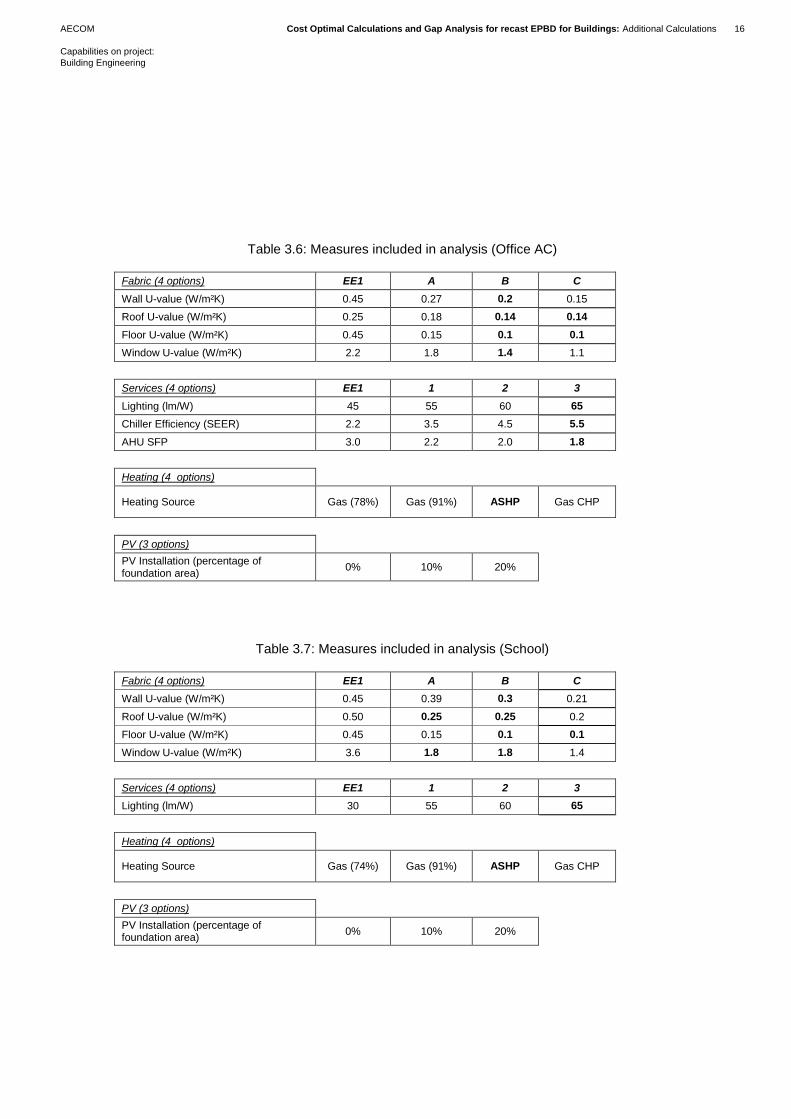
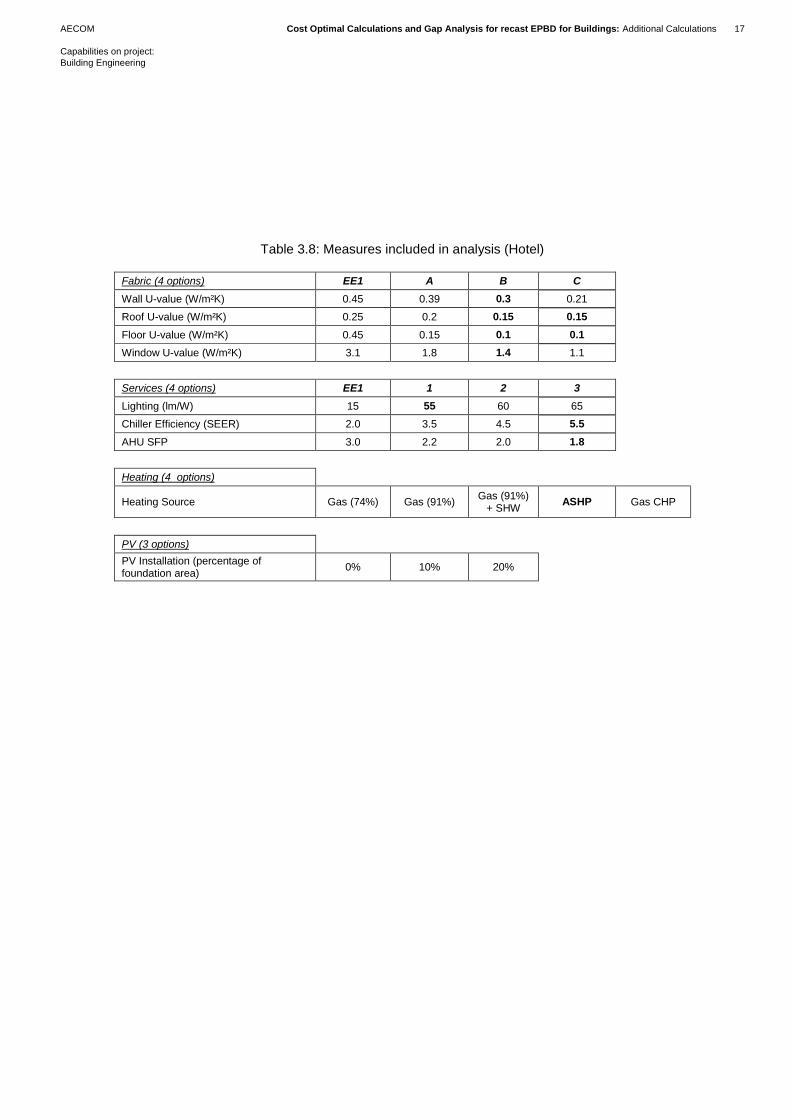
3.4 Existing Non-Residential Buildings – Packages of measures
This work has evaluated existing non-residential building measures assessed on a package basis (i.e. with more than one measure implemented at a time). This has allowed us to test different combinations of building fabric, building services and renewables.
Tables 3.4 to 3.8 provide the specifications for each package for each of the five building types respectively. Each
package comprises a combination of ‘fabric’, ‘services’, ‘heating’ and ‘PV’ options. For most building types, 192
different packages were evaluated (4 ‘fabric’ options, 4 ‘services’ options, 4 ‘heating’ options and 3 ‘PV’ options). An
additional heating option has been included for the hotel (gas heating & solar hot water) which was not included for
the other buildings as the previous work showed no substantive benefit. As a result, 240 different packages were
evaluated for the hotel.
The choice of packages includes options for no change to the current baseline building (denoted as ‘EE1’ – see
Section 2.3). This means that it is possible to test, for example, fabric upgrades without changes to the HVAC
systems. The baseline fabric and services specification is slightly different for each building type (the rationale for
this is presented in the previous Non-Residential Report).
The packages are arranged around the elemental cost-optimal point for each individual building fabric and services
measure identified previously in the Non-Residential Report. The cost optimal values are highlighted in bold. Where
reasonable to do so, packages have been defined to include the cost optimal levels, as well as specifications both
poorer and better than these levels.

AECOM Cost Optimal Calculations and Gap Analysis for recast EPBD for Buildings: Additional Calculations 15
Capabilities on project:
Building Engineering
Table 3.4: Measures included in analysis (Retail)
Fabric (4 options) EE1 A B C
Wall U-value (W/m²K) 0.45 0.27 0.2 0.15
Roof U-value (W/m²K) 0.25 0.18 0.14 0.14
Floor U-value (W/m²K) 0.45 0.25 0.25 0.2
Window U-value (W/m²K) 2.8 1.8 1.4 1.1
Services (4 options) EE1 1 2 3
Lighting (lm/W) 25 55 60 65
Chiller Efficiency (SEER) 2.0 3.5 4.5 5.5
AHU SFP 2.2 2.2 2.0 1.8
Heating (4 options)
Heating Source Gas (74%) Gas (91%) ASHP Gas CHP
PV (3 options)
PV Installation (percentage of foundation area)
0% 10% 20%
Table 3.5: Measures included in analysis (Office NV)
Fabric (4 options) EE1 A B C
Wall U-value (W/m²K) 0.55 0.39 0.3 0.21
Roof U-value (W/m²K) 0.61 0.2 0.15 0.15
Floor U-value (W/m²K) 0.45 0.15 0.1 0.1
Window U-value (W/m²K) 3.6 1.8 1.8 1.4
Services (4 options) EE1 1 2 3
Lighting (lm/W) 25 55 60 65
Heating (4 options)
Heating Source Gas (74%) Gas (91%) ASHP Gas CHP
PV (3 options)
PV Installation (percentage of foundation area)
0% 10% 20%
AECOM Cost Optimal Calculations and Gap Analysis for recast EPBD for Buildings: Additional Calculations 16
Capabilities on project:
Building Engineering
Table 3.6: Measures included in analysis (Office AC)
Fabric (4 options) EE1 A B C
Wall U-value (W/m²K) 0.45 0.27 0.2 0.15
Roof U-value (W/m²K) 0.25 0.18 0.14 0.14
Floor U-value (W/m²K) 0.45 0.15 0.1 0.1
Window U-value (W/m²K) 2.2 1.8 1.4 1.1
Services (4 options) EE1 1 2 3
Lighting (lm/W) 45 55 60 65
Chiller Efficiency (SEER) 2.2 3.5 4.5 5.5
AHU SFP 3.0 2.2 2.0 1.8
Heating (4 options)
Heating Source Gas (78%) Gas (91%) ASHP Gas CHP
PV (3 options)
PV Installation (percentage of foundation area)
0% 10% 20%
Table 3.7: Measures included in analysis (School)
Fabric (4 options) EE1 A B C
Wall U-value (W/m²K) 0.45 0.39 0.3 0.21
Roof U-value (W/m²K) 0.50 0.25 0.25 0.2
Floor U-value (W/m²K) 0.45 0.15 0.1 0.1
Window U-value (W/m²K) 3.6 1.8 1.8 1.4
Services (4 options) EE1 1 2 3
Lighting (lm/W) 30 55 60 65
Heating (4 options)
Heating Source Gas (74%) Gas (91%) ASHP Gas CHP
PV (3 options)
PV Installation (percentage of foundation area)
0% 10% 20%
AECOM Cost Optimal Calculations and Gap Analysis for recast EPBD for Buildings: Additional Calculations 17
Capabilities on project:
Building Engineering
Table 3.8: Measures included in analysis (Hotel)
Fabric (4 options) EE1 A B C
Wall U-value (W/m²K) 0.45 0.39 0.3 0.21
Roof U-value (W/m²K) 0.25 0.2 0.15 0.15
Floor U-value (W/m²K) 0.45 0.15 0.1 0.1
Window U-value (W/m²K) 3.1 1.8 1.4 1.1
Services (4 options) EE1 1 2 3
Lighting (lm/W) 15 55 60 65
Chiller Efficiency (SEER) 2.0 3.5 4.5 5.5
AHU SFP 3.0 2.2 2.0 1.8
Heating (4 options)
Heating Source Gas (74%) Gas (91%) Gas (91%)
+ SHW ASHP Gas CHP
PV (3 options)
PV Installation (percentage of foundation area)
0% 10% 20%
AECOM Cost Optimal Calculations and Gap Analysis for recast EPBD for Buildings: Additional Calculations 18
Capabilities on project:
Building Engineering
4.1 New Apartment Buildings
4.1.1 Introduction
The previous Residential Report outlines the procedure for determining the primary energy for each package of
measures. In summary, the energy performance of the different packages was modelled in the DEAP calculation
spreadsheet. The energy end uses (e.g. space heating, water heating, lighting, pumps and fans) were recorded
directly from the DEAP output files. The end use energies were then summed for each energy carrier to find the
delivered energy requirement. Any on-site generated energy was also determined at this stage. The primary energy
factors were then applied to the delivered energy and on-site generated energy. The latter was subtracted from the
former to give the net primary energy.
4.1.2 Energy demand calculation
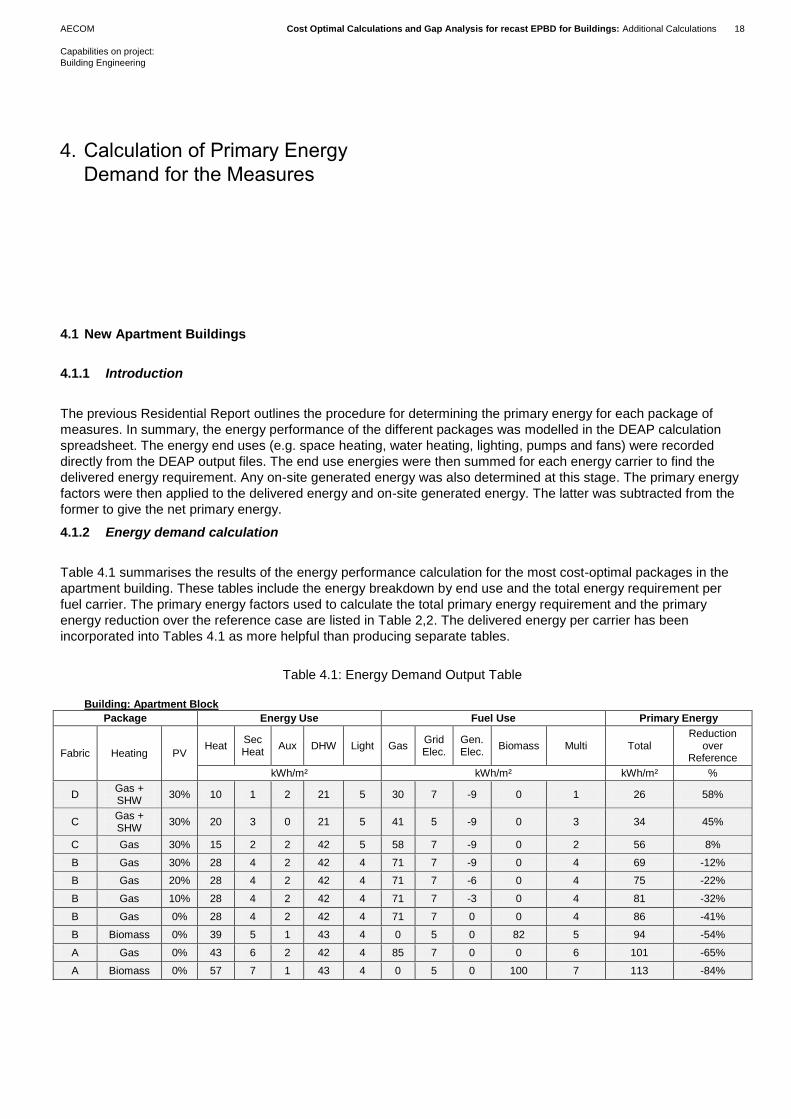
Table 4.1 summarises the results of the energy performance calculation for the most cost-optimal packages in the
apartment building. These tables include the energy breakdown by end use and the total energy requirement per
fuel carrier. The primary energy factors used to calculate the total primary energy requirement and the primary
energy reduction over the reference case are listed in Table 2,2. The delivered energy per carrier has been
incorporated into Tables 4.1 as more helpful than producing separate tables.
Table 4.1: Energy Demand Output Table
Building: Apartment Block
Package Energy Use Fuel Use Primary Energy
Fabric Heating PV Heat
Sec Heat
Aux DHW Light Gas Grid Elec.
Gen. Elec.
Biomass Multi Total Reduction
over Reference
kWh/m² kWh/m² kWh/m² %
D Gas + SHW
30% 10 1 2 21 5 30 7 -9 0 1 26 58%
C Gas + SHW
30% 20 3 0 21 5 41 5 -9 0 3 34 45%
C Gas 30% 15 2 2 42 5 58 7 -9 0 2 56 8%
B Gas 30% 28 4 2 42 4 71 7 -9 0 4 69 -12%
B Gas 20% 28 4 2 42 4 71 7 -6 0 4 75 -22%
B Gas 10% 28 4 2 42 4 71 7 -3 0 4 81 -32%
B Gas 0% 28 4 2 42 4 71 7 0 0 4 86 -41%
B Biomass 0% 39 5 1 43 4 0 5 0 82 5 94 -54%
A Gas 0% 43 6 2 42 4 85 7 0 0 6 101 -65%
A Biomass 0% 57 7 1 43 4 0 5 0 100 7 113 -84%
4. Calculation of Primary Energy
Demand for the Measures
AECOM Cost Optimal Calculations and Gap Analysis for recast EPBD for Buildings: Additional Calculations 19
Capabilities on project:
Building Engineering
4.2 Existing Apartment Buildings – Elemental measures
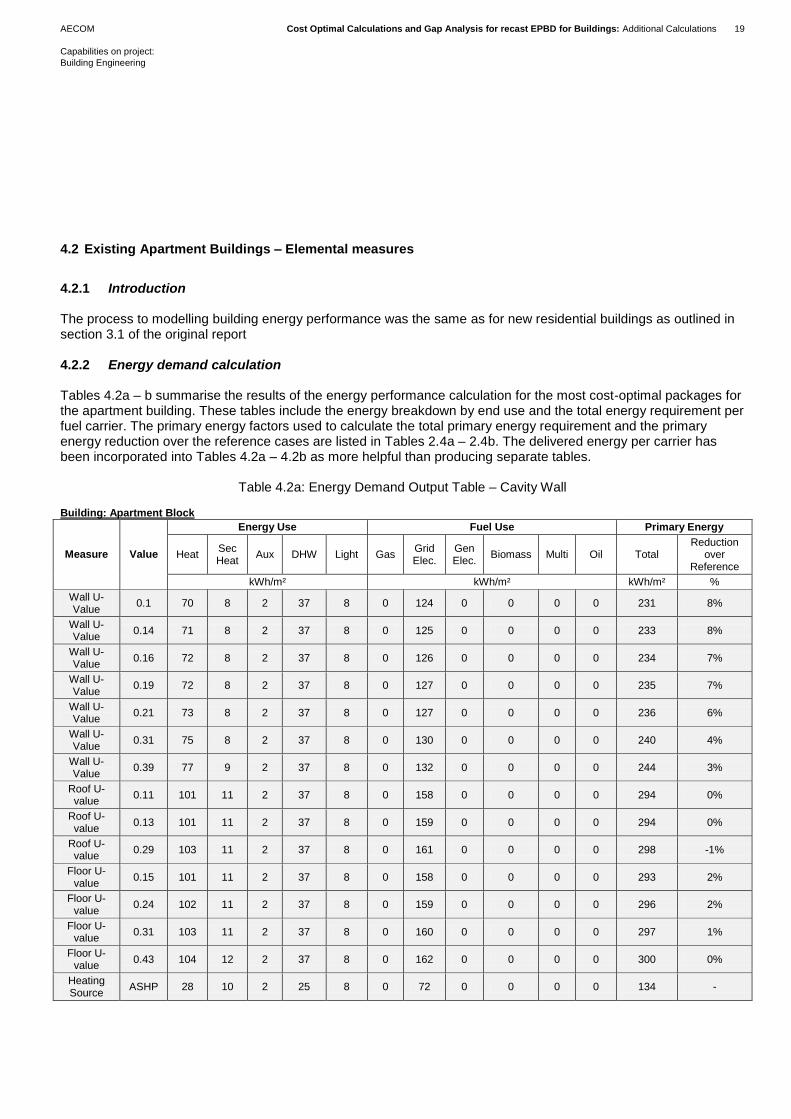
4.2.1 Introduction The process to modelling building energy performance was the same as for new residential buildings as outlined in section 3.1 of the original report 4.2.2 Energy demand calculation Tables 4.2a – b summarise the results of the energy performance calculation for the most cost-optimal packages for the apartment building. These tables include the energy breakdown by end use and the total energy requirement per fuel carrier. The primary energy factors used to calculate the total primary energy requirement and the primary energy reduction over the reference cases are listed in Tables 2.4a – 2.4b. The delivered energy per carrier has been incorporated into Tables 4.2a – 4.2b as more helpful than producing separate tables.
Table 4.2a: Energy Demand Output Table – Cavity Wall
Building: Apartment Block
Measure Value
Energy Use Fuel Use Primary Energy
Heat Sec Heat
Aux DHW Light Gas Grid Elec.
Gen Elec.
Biomass Multi Oil Total Reduction
over Reference
kWh/m² kWh/m² kWh/m² %
Wall U-Value
0.1 70 8 2 37 8 0 124 0 0 0 0 231 8%
Wall U-Value
0.14 71 8 2 37 8 0 125 0 0 0 0 233 8%
Wall U-Value
0.16 72 8 2 37 8 0 126 0 0 0 0 234 7%
Wall U-Value
0.19 72 8 2 37 8 0 127 0 0 0 0 235 7%
Wall U-Value
0.21 73 8 2 37 8 0 127 0 0 0 0 236 6%
Wall U-Value
0.31 75 8 2 37 8 0 130 0 0 0 0 240 4%
Wall U-Value
0.39 77 9 2 37 8 0 132 0 0 0 0 244 3%
Roof U-value
0.11 101 11 2 37 8 0 158 0 0 0 0 294 0%
Roof U-value
0.13 101 11 2 37 8 0 159 0 0 0 0 294 0%
Roof U-value
0.29 103 11 2 37 8 0 161 0 0 0 0 298 -1%
Floor U-value
0.15 101 11 2 37 8 0 158 0 0 0 0 293 2%
Floor U-value
0.24 102 11 2 37 8 0 159 0 0 0 0 296 2%
Floor U-value
0.31 103 11 2 37 8 0 160 0 0 0 0 297 1%
Floor U-value
0.43 104 12 2 37 8 0 162 0 0 0 0 300 0%
Heating Source
ASHP 28 10 2 25 8 0 72 0 0 0 0 134 -
AECOM Cost Optimal Calculations and Gap Analysis for recast EPBD for Buildings: Additional Calculations 20
Capabilities on project:
Building Engineering
Heating Source
Gas + SHW
106 10 1 20 8 126 19 0 0 0 0 174 -
Heating Source
Gas 97 10 2 43 8 139 20 0 0 0 0 190 -
Window U-value
0.9 90 10 2 37 8 0 147 0 0 0 0 272 4%
Window U-value
1.4 93 10 2 37 8 0 150 0 0 0 0 278 1%
Window U-value
1.6 95 11 2 37 8 0 152 0 0 0 0 282 0%
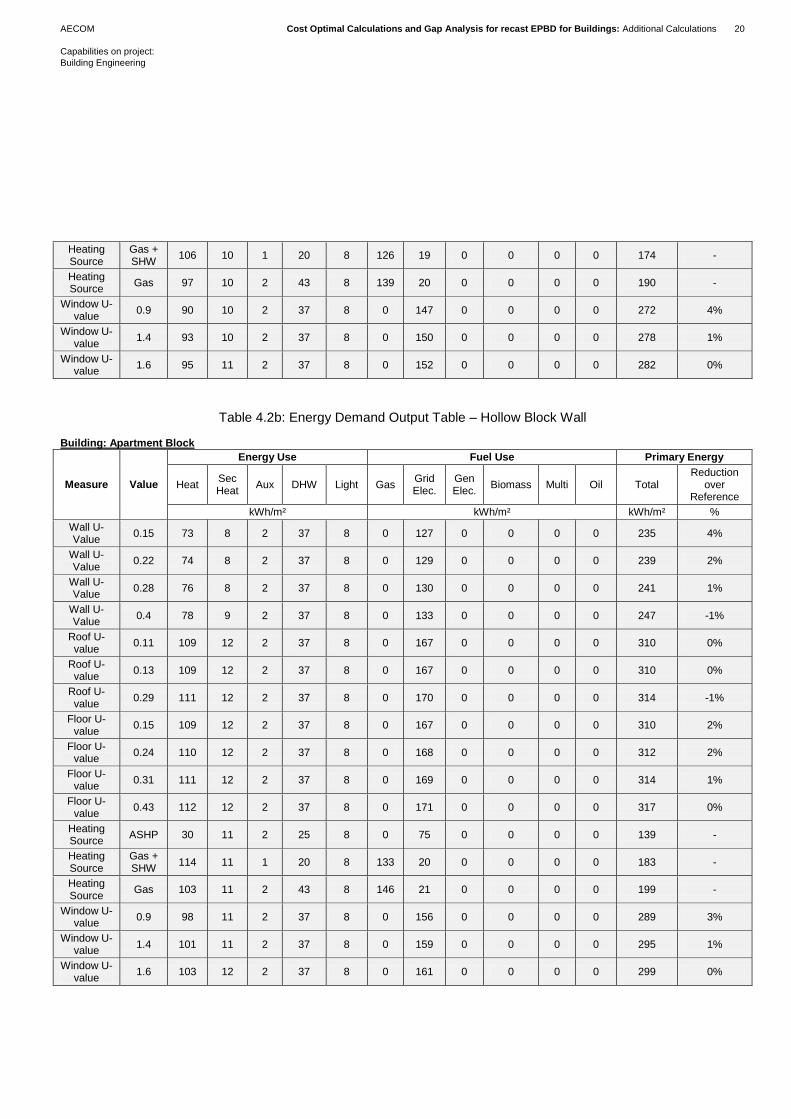
Table 4.2b: Energy Demand Output Table – Hollow Block Wall
Building: Apartment Block
Measure Value
Energy Use Fuel Use Primary Energy
Heat Sec Heat
Aux DHW Light Gas Grid Elec.
Gen Elec.
Biomass Multi Oil Total Reduction
over Reference
kWh/m² kWh/m² kWh/m² %
Wall U-Value
0.15 73 8 2 37 8 0 127 0 0 0 0 235 4%
Wall U-Value
0.22 74 8 2 37 8 0 129 0 0 0 0 239 2%
Wall U-Value
0.28 76 8 2 37 8 0 130 0 0 0 0 241 1%
Wall U-Value
0.4 78 9 2 37 8 0 133 0 0 0 0 247 -1%
Roof U-value
0.11 109 12 2 37 8 0 167 0 0 0 0 310 0%
Roof U-value
0.13 109 12 2 37 8 0 167 0 0 0 0 310 0%
Roof U-value
0.29 111 12 2 37 8 0 170 0 0 0 0 314 -1%
Floor U-value
0.15 109 12 2 37 8 0 167 0 0 0 0 310 2%
Floor U-value
0.24 110 12 2 37 8 0 168 0 0 0 0 312 2%
Floor U-value
0.31 111 12 2 37 8 0 169 0 0 0 0 314 1%
Floor U-value
0.43 112 12 2 37 8 0 171 0 0 0 0 317 0%
Heating Source
ASHP 30 11 2 25 8 0 75 0 0 0 0 139 -
Heating Source
Gas + SHW
114 11 1 20 8 133 20 0 0 0 0 183 -
Heating Source
Gas 103 11 2 43 8 146 21 0 0 0 0 199 -
Window U-value
0.9 98 11 2 37 8 0 156 0 0 0 0 289 3%
Window U-value
1.4 101 11 2 37 8 0 159 0 0 0 0 295 1%
Window U-value
1.6 103 12 2 37 8 0 161 0 0 0 0 299 0%
AECOM Cost Optimal Calculations and Gap Analysis for recast EPBD for Buildings: Additional Calculations 21
Capabilities on project:
Building Engineering
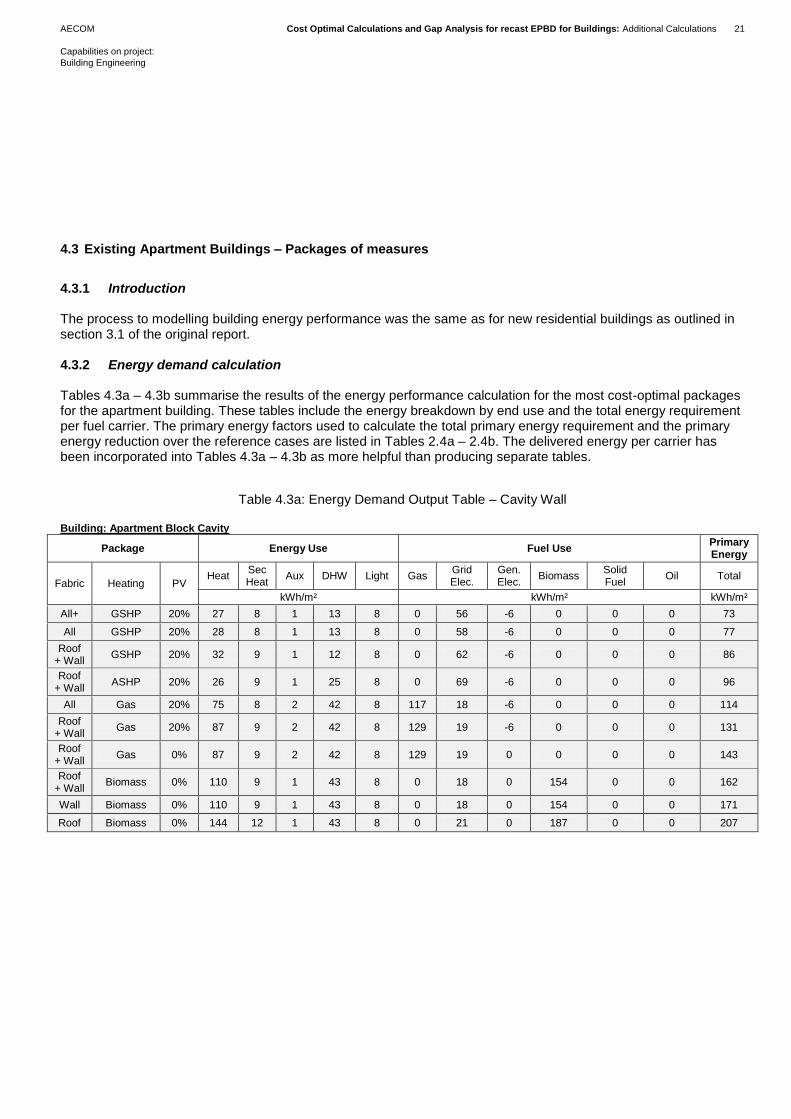
4.3 Existing Apartment Buildings – Packages of measures
4.3.1 Introduction The process to modelling building energy performance was the same as for new residential buildings as outlined in section 3.1 of the original report. 4.3.2 Energy demand calculation Tables 4.3a – 4.3b summarise the results of the energy performance calculation for the most cost-optimal packages for the apartment building. These tables include the energy breakdown by end use and the total energy requirement per fuel carrier. The primary energy factors used to calculate the total primary energy requirement and the primary energy reduction over the reference cases are listed in Tables 2.4a – 2.4b. The delivered energy per carrier has been incorporated into Tables 4.3a – 4.3b as more helpful than producing separate tables.
Table 4.3a: Energy Demand Output Table – Cavity Wall
Building: Apartment Block Cavity
Package Energy Use Fuel Use Primary Energy
Fabric Heating PV Heat
Sec Heat
Aux DHW Light Gas Grid Elec.
Gen. Elec.
Biomass Solid Fuel
Oil Total
kWh/m² kWh/m² kWh/m²
All+ GSHP 20% 27 8 1 13 8 0 56 -6 0 0 0 73
All GSHP 20% 28 8 1 13 8 0 58 -6 0 0 0 77
Roof + Wall
GSHP 20% 32 9 1 12 8 0 62 -6 0 0 0 86
Roof + Wall
ASHP 20% 26 9 1 25 8 0 69 -6 0 0 0 96
All Gas 20% 75 8 2 42 8 117 18 -6 0 0 0 114
Roof + Wall
Gas 20% 87 9 2 42 8 129 19 -6 0 0 0 131
Roof + Wall
Gas 0% 87 9 2 42 8 129 19 0 0 0 0 143
Roof + Wall
Biomass 0% 110 9 1 43 8 0 18 0 154 0 0 162
Wall Biomass 0% 110 9 1 43 8 0 18 0 154 0 0 171
Roof Biomass 0% 144 12 1 43 8 0 21 0 187 0 0 207
AECOM Cost Optimal Calculations and Gap Analysis for recast EPBD for Buildings: Additional Calculations 22
Capabilities on project:
Building Engineering
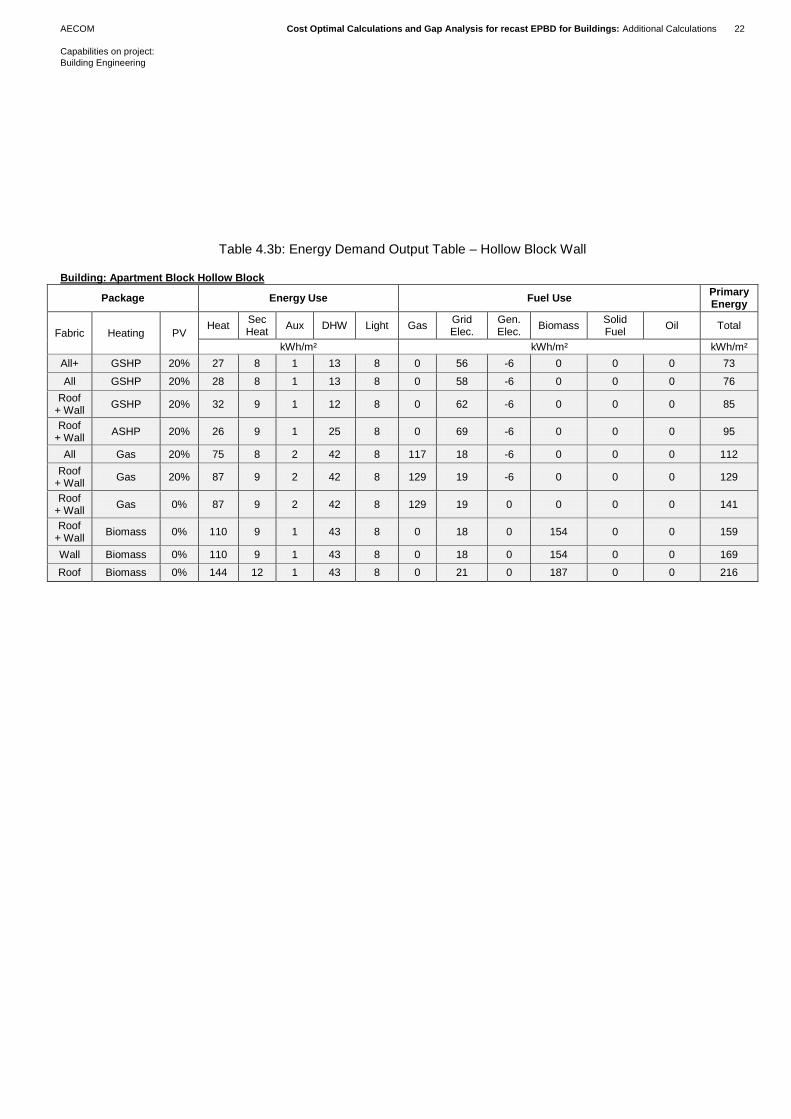
Table 4.3b: Energy Demand Output Table – Hollow Block Wall
Building: Apartment Block Hollow Block
Package Energy Use Fuel Use Primary Energy
Fabric Heating PV Heat
Sec Heat
Aux DHW Light Gas Grid Elec.
Gen. Elec.
Biomass Solid Fuel
Oil Total
kWh/m² kWh/m² kWh/m²
All+ GSHP 20% 27 8 1 13 8 0 56 -6 0 0 0 73
All GSHP 20% 28 8 1 13 8 0 58 -6 0 0 0 76
Roof + Wall
GSHP 20% 32 9 1 12 8 0 62 -6 0 0 0 85
Roof + Wall
ASHP 20% 26 9 1 25 8 0 69 -6 0 0 0 95
All Gas 20% 75 8 2 42 8 117 18 -6 0 0 0 112
Roof + Wall
Gas 20% 87 9 2 42 8 129 19 -6 0 0 0 129
Roof + Wall
Gas 0% 87 9 2 42 8 129 19 0 0 0 0 141
Roof + Wall
Biomass 0% 110 9 1 43 8 0 18 0 154 0 0 159
Wall Biomass 0% 110 9 1 43 8 0 18 0 154 0 0 169
Roof Biomass 0% 144 12 1 43 8 0 21 0 187 0 0 216
AECOM Cost Optimal Calculations and Gap Analysis for recast EPBD for Buildings: Additional Calculations 23
Capabilities on project:
Building Engineering
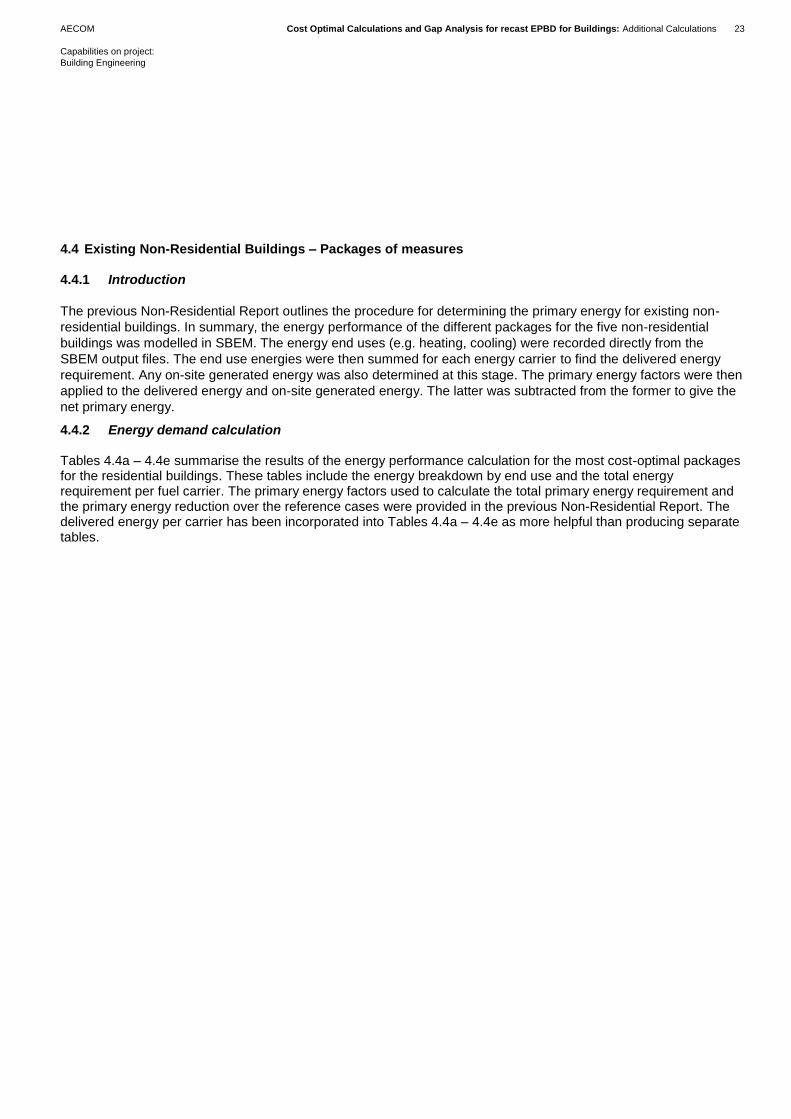
4.4 Existing Non-Residential Buildings – Packages of measures
4.4.1 Introduction
The previous Non-Residential Report outlines the procedure for determining the primary energy for existing non-
residential buildings. In summary, the energy performance of the different packages for the five non-residential
buildings was modelled in SBEM. The energy end uses (e.g. heating, cooling) were recorded directly from the
SBEM output files. The end use energies were then summed for each energy carrier to find the delivered energy
requirement. Any on-site generated energy was also determined at this stage. The primary energy factors were then
applied to the delivered energy and on-site generated energy. The latter was subtracted from the former to give the
net primary energy.
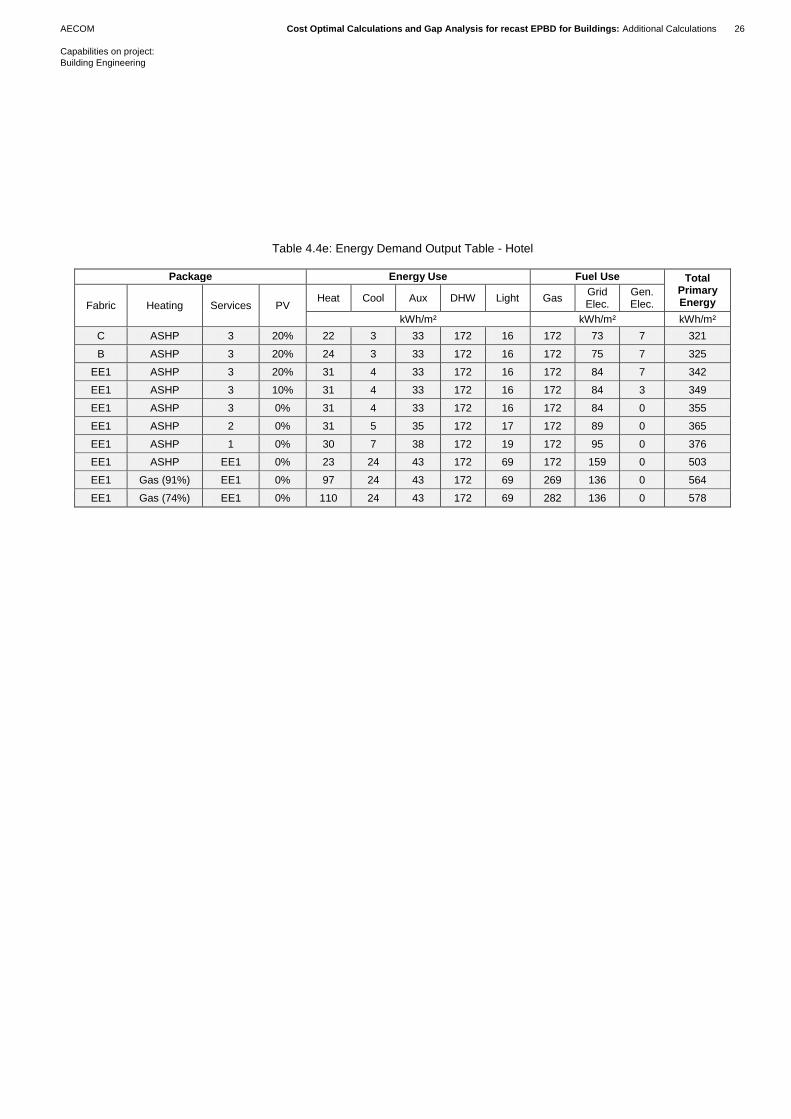
4.4.2 Energy demand calculation Tables 4.4a – 4.4e summarise the results of the energy performance calculation for the most cost-optimal packages for the residential buildings. These tables include the energy breakdown by end use and the total energy requirement per fuel carrier. The primary energy factors used to calculate the total primary energy requirement and the primary energy reduction over the reference cases were provided in the previous Non-Residential Report. The delivered energy per carrier has been incorporated into Tables 4.4a – 4.4e as more helpful than producing separate tables.
AECOM Cost Optimal Calculations and Gap Analysis for recast EPBD for Buildings: Additional Calculations 24
Capabilities on project:
Building Engineering
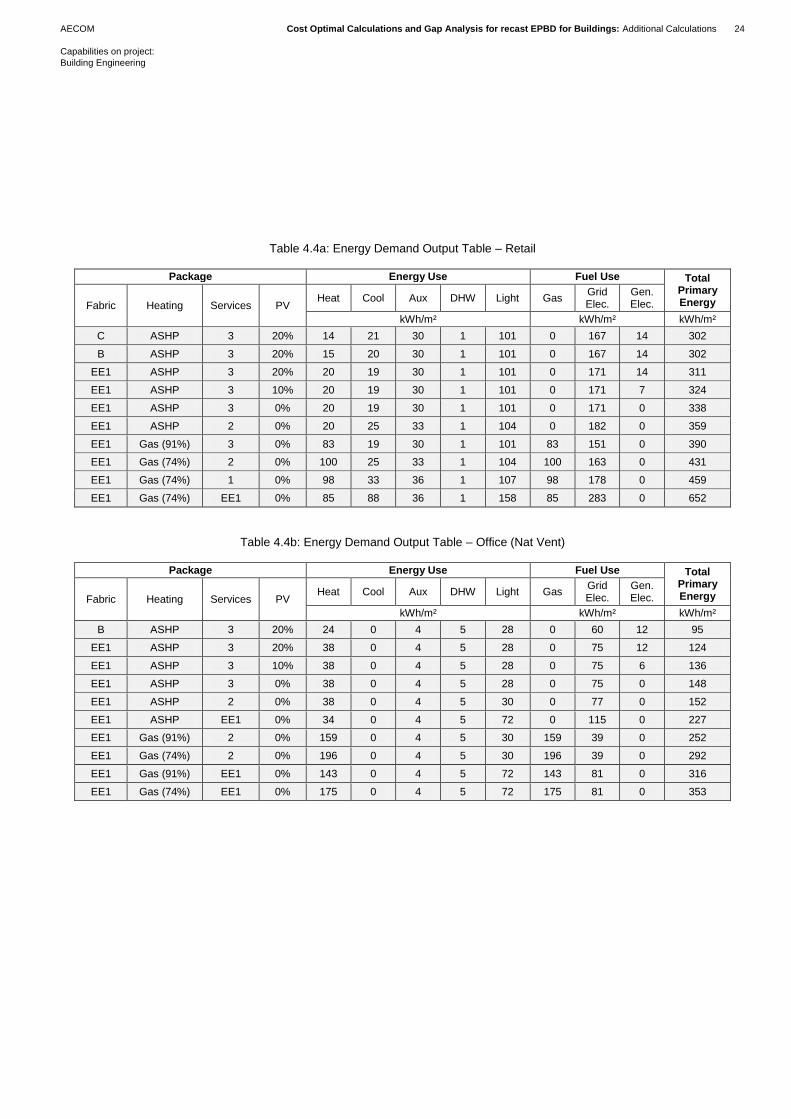
Table 4.4a: Energy Demand Output Table – Retail
Package Energy Use Fuel Use Total Primary Energy Fabric Heating Services PV
Heat Cool Aux DHW Light Gas Grid Elec.
Gen. Elec.
kWh/m² kWh/m² kWh/m²
C ASHP 3 20% 14 21 30 1 101 0 167 14 302
B ASHP 3 20% 15 20 30 1 101 0 167 14 302
EE1 ASHP 3 20% 20 19 30 1 101 0 171 14 311
EE1 ASHP 3 10% 20 19 30 1 101 0 171 7 324
EE1 ASHP 3 0% 20 19 30 1 101 0 171 0 338
EE1 ASHP 2 0% 20 25 33 1 104 0 182 0 359
EE1 Gas (91%) 3 0% 83 19 30 1 101 83 151 0 390
EE1 Gas (74%) 2 0% 100 25 33 1 104 100 163 0 431
EE1 Gas (74%) 1 0% 98 33 36 1 107 98 178 0 459
EE1 Gas (74%) EE1 0% 85 88 36 1 158 85 283 0 652
Table 4.4b: Energy Demand Output Table – Office (Nat Vent)
Package Energy Use Fuel Use Total Primary Energy Fabric Heating Services PV
Heat Cool Aux DHW Light Gas Grid Elec.
Gen. Elec.
kWh/m² kWh/m² kWh/m²
B ASHP 3 20% 24 0 4 5 28 0 60 12 95
EE1 ASHP 3 20% 38 0 4 5 28 0 75 12 124
EE1 ASHP 3 10% 38 0 4 5 28 0 75 6 136
EE1 ASHP 3 0% 38 0 4 5 28 0 75 0 148
EE1 ASHP 2 0% 38 0 4 5 30 0 77 0 152
EE1 ASHP EE1 0% 34 0 4 5 72 0 115 0 227
EE1 Gas (91%) 2 0% 159 0 4 5 30 159 39 0 252
EE1 Gas (74%) 2 0% 196 0 4 5 30 196 39 0 292
EE1 Gas (91%) EE1 0% 143 0 4 5 72 143 81 0 316
EE1 Gas (74%) EE1 0% 175 0 4 5 72 175 81 0 353
AECOM Cost Optimal Calculations and Gap Analysis for recast EPBD for Buildings: Additional Calculations 25
Capabilities on project:
Building Engineering
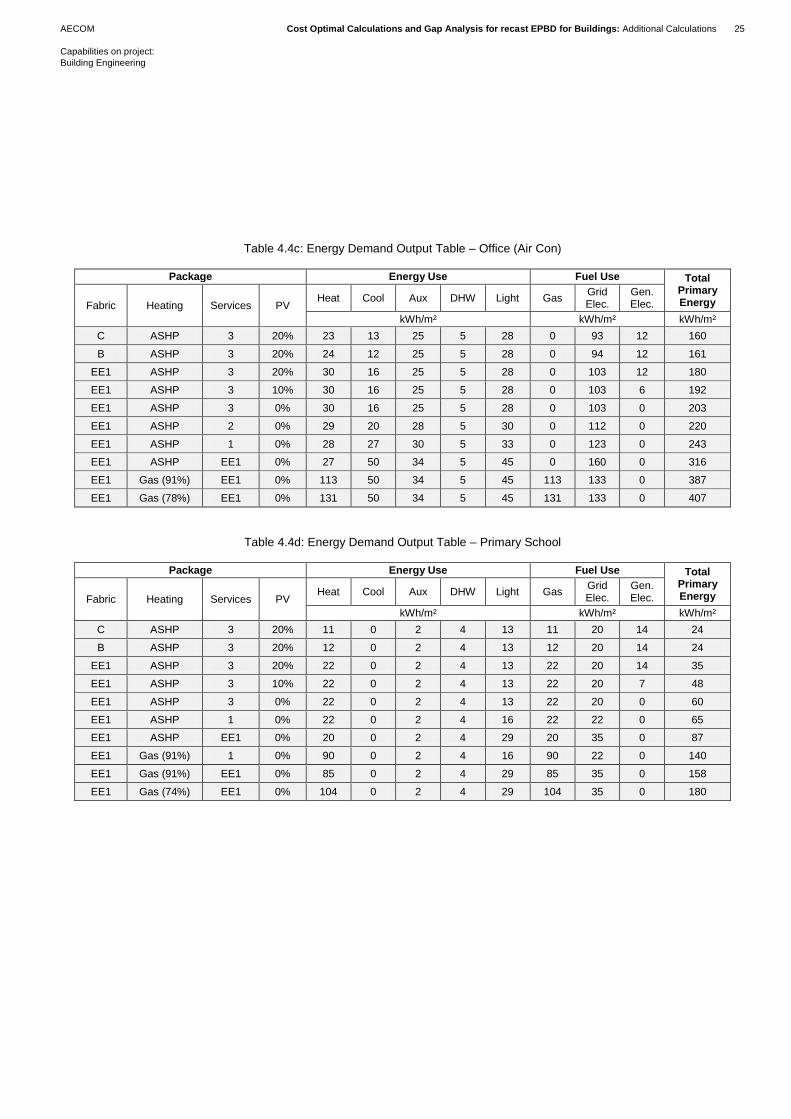
Table 4.4c: Energy Demand Output Table – Office (Air Con)
Package Energy Use Fuel Use Total Primary Energy Fabric Heating Services PV
Heat Cool Aux DHW Light Gas Grid Elec.
Gen. Elec.
kWh/m² kWh/m² kWh/m²
C ASHP 3 20% 23 13 25 5 28 0 93 12 160
B ASHP 3 20% 24 12 25 5 28 0 94 12 161
EE1 ASHP 3 20% 30 16 25 5 28 0 103 12 180
EE1 ASHP 3 10% 30 16 25 5 28 0 103 6 192
EE1 ASHP 3 0% 30 16 25 5 28 0 103 0 203
EE1 ASHP 2 0% 29 20 28 5 30 0 112 0 220
EE1 ASHP 1 0% 28 27 30 5 33 0 123 0 243
EE1 ASHP EE1 0% 27 50 34 5 45 0 160 0 316
EE1 Gas (91%) EE1 0% 113 50 34 5 45 113 133 0 387
EE1 Gas (78%) EE1 0% 131 50 34 5 45 131 133 0 407
Table 4.4d: Energy Demand Output Table – Primary School
Package Energy Use Fuel Use Total Primary Energy Fabric Heating Services PV
Heat Cool Aux DHW Light Gas Grid Elec.
Gen. Elec.
kWh/m² kWh/m² kWh/m²
C ASHP 3 20% 11 0 2 4 13 11 20 14 24
B ASHP 3 20% 12 0 2 4 13 12 20 14 24
EE1 ASHP 3 20% 22 0 2 4 13 22 20 14 35
EE1 ASHP 3 10% 22 0 2 4 13 22 20 7 48
EE1 ASHP 3 0% 22 0 2 4 13 22 20 0 60
EE1 ASHP 1 0% 22 0 2 4 16 22 22 0 65
EE1 ASHP EE1 0% 20 0 2 4 29 20 35 0 87
EE1 Gas (91%) 1 0% 90 0 2 4 16 90 22 0 140
EE1 Gas (91%) EE1 0% 85 0 2 4 29 85 35 0 158
EE1 Gas (74%) EE1 0% 104 0 2 4 29 104 35 0 180
AECOM Cost Optimal Calculations and Gap Analysis for recast EPBD for Buildings: Additional Calculations 26
Capabilities on project:
Building Engineering
Table 4.4e: Energy Demand Output Table - Hotel
Package Energy Use Fuel Use Total Primary Energy Fabric Heating Services PV
Heat Cool Aux DHW Light Gas Grid Elec.
Gen. Elec.
kWh/m² kWh/m² kWh/m²
C ASHP 3 20% 22 3 33 172 16 172 73 7 321
B ASHP 3 20% 24 3 33 172 16 172 75 7 325
EE1 ASHP 3 20% 31 4 33 172 16 172 84 7 342
EE1 ASHP 3 10% 31 4 33 172 16 172 84 3 349
EE1 ASHP 3 0% 31 4 33 172 16 172 84 0 355
EE1 ASHP 2 0% 31 5 35 172 17 172 89 0 365
EE1 ASHP 1 0% 30 7 38 172 19 172 95 0 376
EE1 ASHP EE1 0% 23 24 43 172 69 172 159 0 503
EE1 Gas (91%) EE1 0% 97 24 43 172 69 269 136 0 564
EE1 Gas (74%) EE1 0% 110 24 43 172 69 282 136 0 578
AECOM Cost Optimal Calculations and Gap Analysis for recast EPBD for Buildings: Additional Calculations 27
Capabilities on project:
Building Engineering
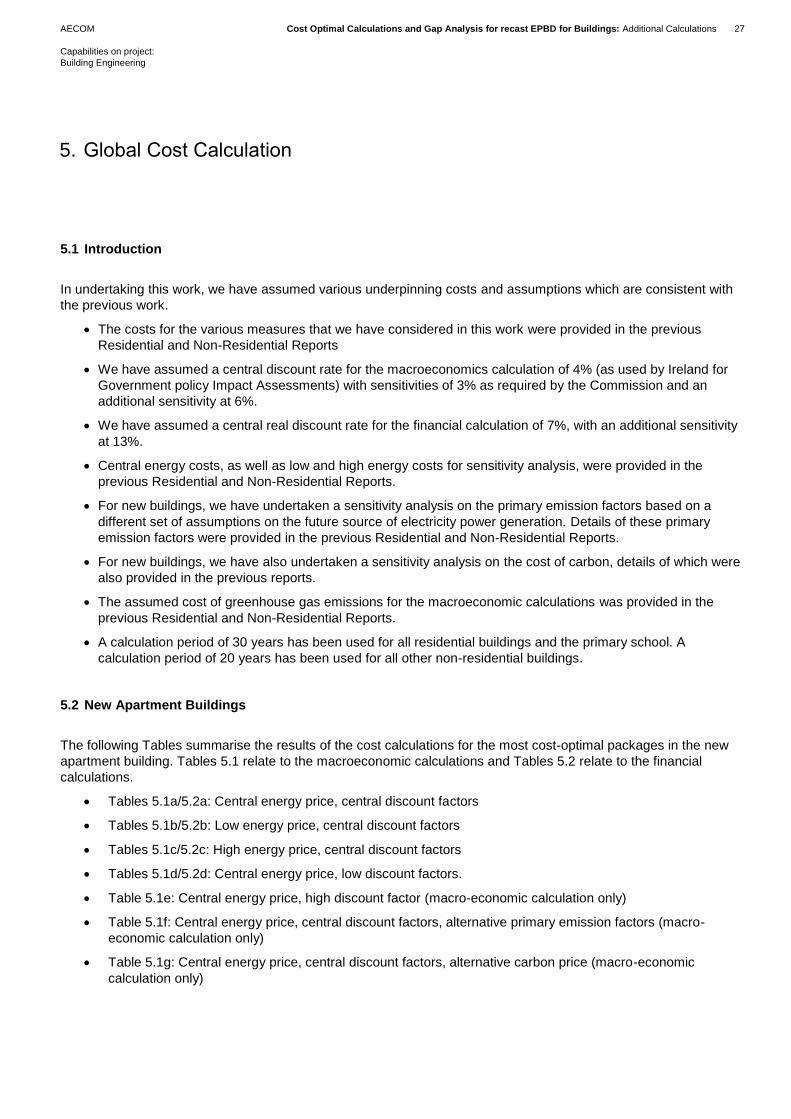
5.1 Introduction
In undertaking this work, we have assumed various underpinning costs and assumptions which are consistent with
the previous work.
The costs for the various measures that we have considered in this work were provided in the previous
Residential and Non-Residential Reports
We have assumed a central discount rate for the macroeconomics calculation of 4% (as used by Ireland for
Government policy Impact Assessments) with sensitivities of 3% as required by the Commission and an
additional sensitivity at 6%.
We have assumed a central real discount rate for the financial calculation of 7%, with an additional sensitivity
at 13%.
Central energy costs, as well as low and high energy costs for sensitivity analysis, were provided in the
previous Residential and Non-Residential Reports.
For new buildings, we have undertaken a sensitivity analysis on the primary emission factors based on a
different set of assumptions on the future source of electricity power generation. Details of these primary
emission factors were provided in the previous Residential and Non-Residential Reports.
For new buildings, we have also undertaken a sensitivity analysis on the cost of carbon, details of which were
also provided in the previous reports.
The assumed cost of greenhouse gas emissions for the macroeconomic calculations was provided in the
previous Residential and Non-Residential Reports.
A calculation period of 30 years has been used for all residential buildings and the primary school. A
calculation period of 20 years has been used for all other non-residential buildings.
5.2 New Apartment Buildings
The following Tables summarise the results of the cost calculations for the most cost-optimal packages in the new
apartment building. Tables 5.1 relate to the macroeconomic calculations and Tables 5.2 relate to the financial
calculations.
Tables 5.1a/5.2a: Central energy price, central discount factors
Tables 5.1b/5.2b: Low energy price, central discount factors
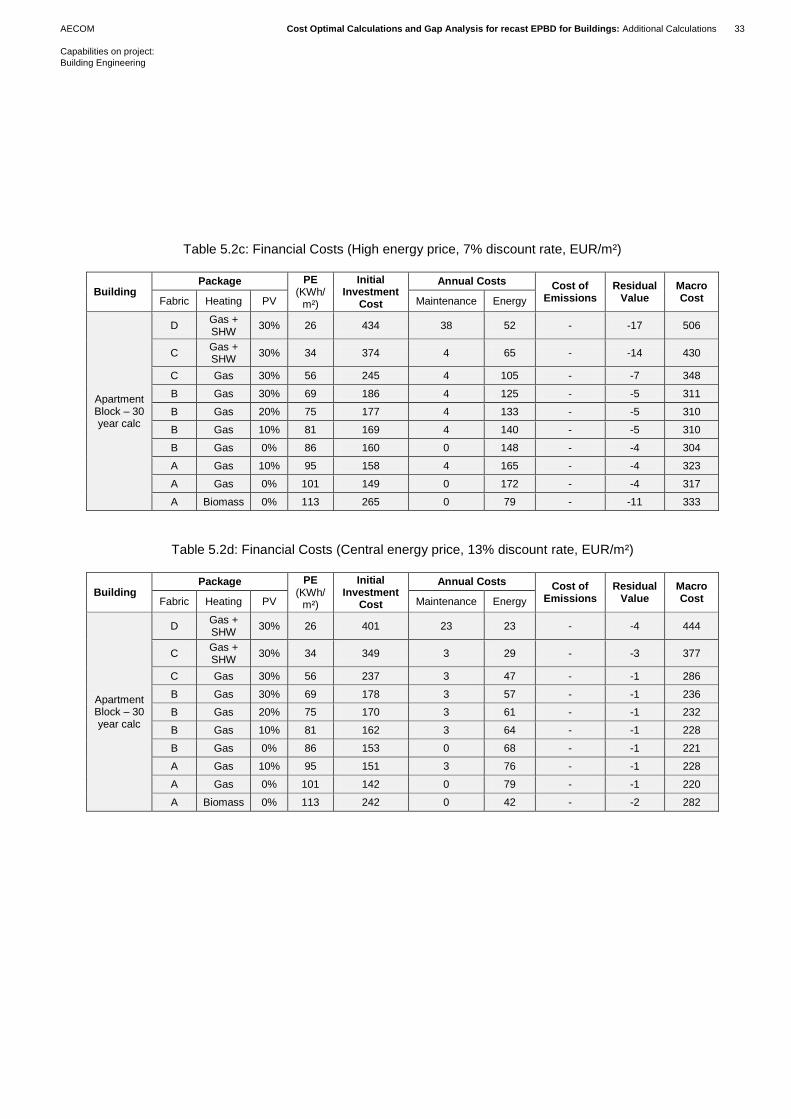
Tables 5.1c/5.2c: High energy price, central discount factors
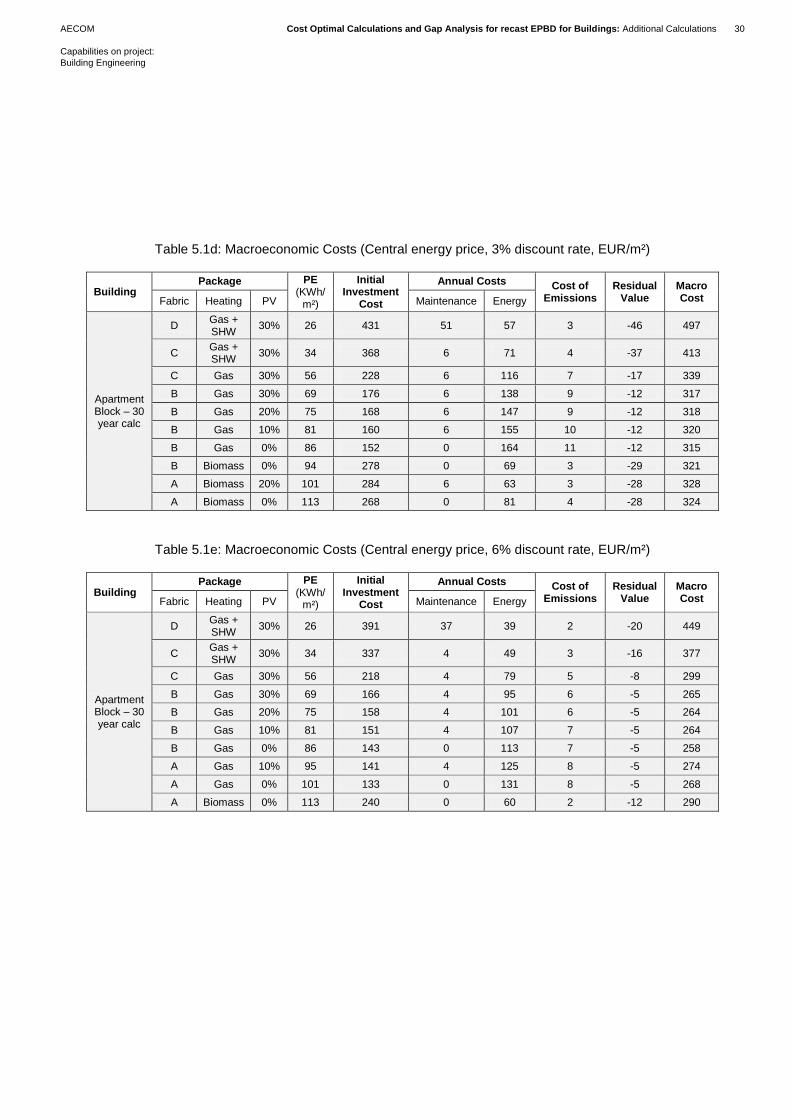
Tables 5.1d/5.2d: Central energy price, low discount factors.
Table 5.1e: Central energy price, high discount factor (macro-economic calculation only)
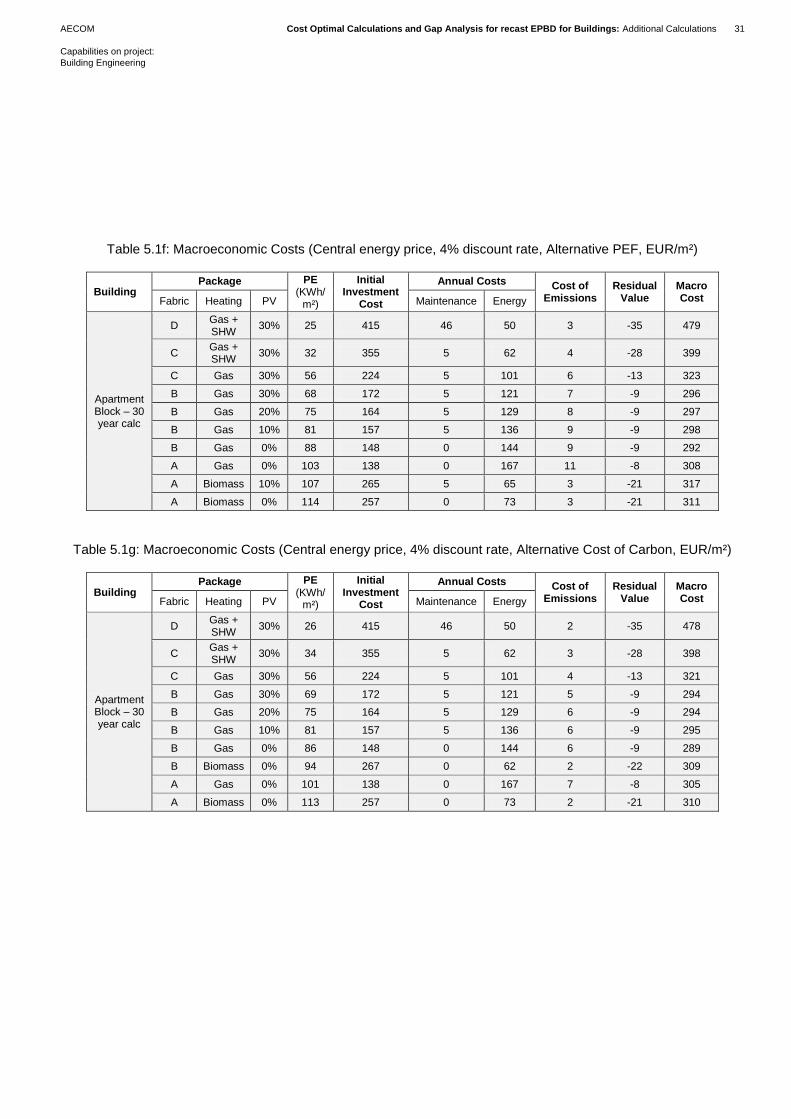
Table 5.1f: Central energy price, central discount factors, alternative primary emission factors (macro-
economic calculation only)
Table 5.1g: Central energy price, central discount factors, alternative carbon price (macro-economic
calculation only)
5. Global Cost Calculation
AECOM Cost Optimal Calculations and Gap Analysis for recast EPBD for Buildings: Additional Calculations 28
Capabilities on project:
Building Engineering
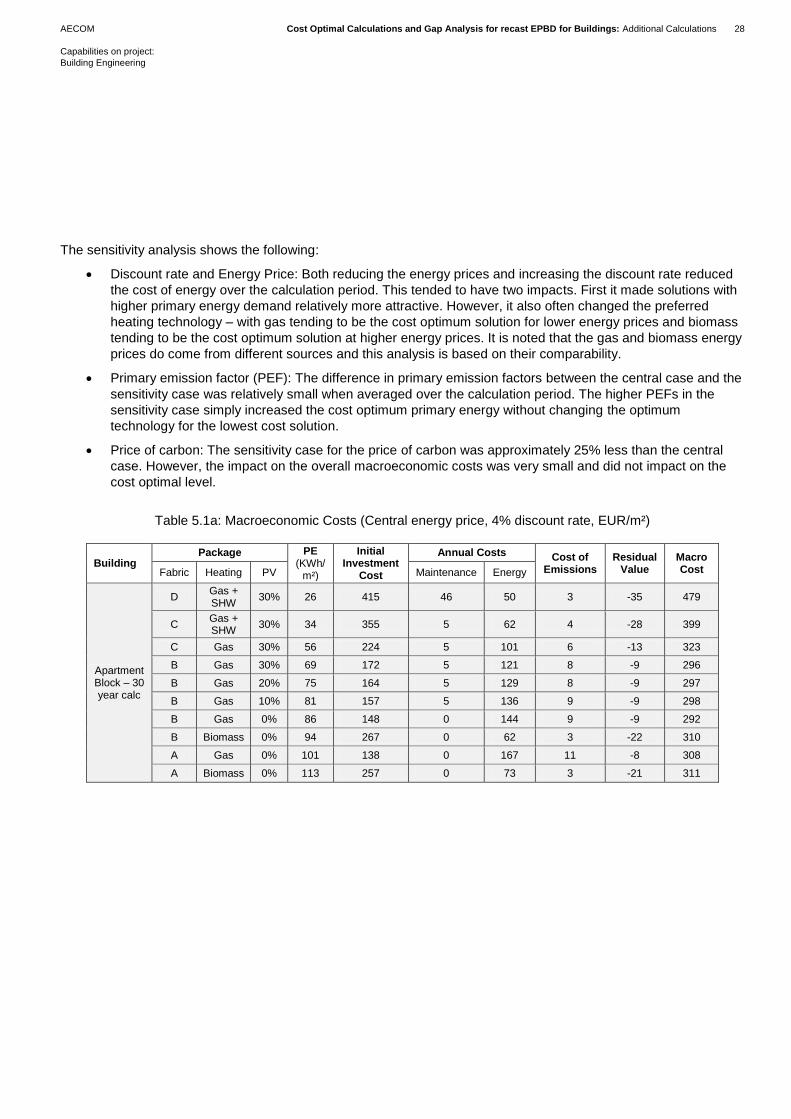
The sensitivity analysis shows the following:
Discount rate and Energy Price: Both reducing the energy prices and increasing the discount rate reduced
the cost of energy over the calculation period. This tended to have two impacts. First it made solutions with
higher primary energy demand relatively more attractive. However, it also often changed the preferred
heating technology – with gas tending to be the cost optimum solution for lower energy prices and biomass
tending to be the cost optimum solution at higher energy prices. It is noted that the gas and biomass energy
prices do come from different sources and this analysis is based on their comparability.
Primary emission factor (PEF): The difference in primary emission factors between the central case and the
sensitivity case was relatively small when averaged over the calculation period. The higher PEFs in the
sensitivity case simply increased the cost optimum primary energy without changing the optimum
technology for the lowest cost solution.
Price of carbon: The sensitivity case for the price of carbon was approximately 25% less than the central
case. However, the impact on the overall macroeconomic costs was very small and did not impact on the
cost optimal level.
Table 5.1a: Macroeconomic Costs (Central energy price, 4% discount rate, EUR/m²)
Building Package PE
(KWh/m²)
Initial Investment
Cost
Annual Costs Cost of Emissions
Residual Value
Macro Cost Fabric Heating PV Maintenance Energy
Apartment Block – 30 year calc
D Gas + SHW
30% 26 415 46 50 3 -35 479
C Gas + SHW
30% 34 355 5 62 4 -28 399
C Gas 30% 56 224 5 101 6 -13 323
B Gas 30% 69 172 5 121 8 -9 296
B Gas 20% 75 164 5 129 8 -9 297
B Gas 10% 81 157 5 136 9 -9 298
B Gas 0% 86 148 0 144 9 -9 292
B Biomass 0% 94 267 0 62 3 -22 310
A Gas 0% 101 138 0 167 11 -8 308
A Biomass 0% 113 257 0 73 3 -21 311
AECOM Cost Optimal Calculations and Gap Analysis for recast EPBD for Buildings: Additional Calculations 29
Capabilities on project:
Building Engineering
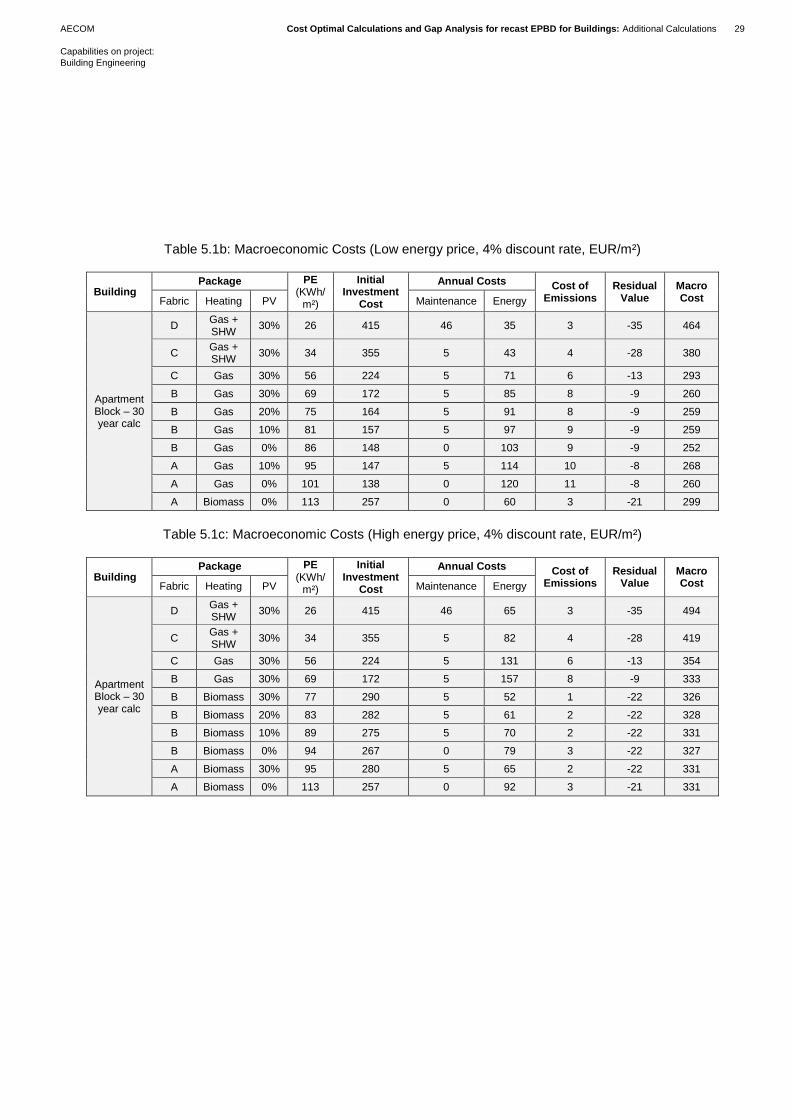
Table 5.1b: Macroeconomic Costs (Low energy price, 4% discount rate, EUR/m²)
Building Package PE
(KWh/m²)
Initial Investment
Cost
Annual Costs Cost of Emissions
Residual Value
Macro Cost Fabric Heating PV Maintenance Energy
Apartment Block – 30 year calc
D Gas + SHW
30% 26 415 46 35 3 -35 464
C Gas + SHW
30% 34 355 5 43 4 -28 380
C Gas 30% 56 224 5 71 6 -13 293
B Gas 30% 69 172 5 85 8 -9 260
B Gas 20% 75 164 5 91 8 -9 259
B Gas 10% 81 157 5 97 9 -9 259
B Gas 0% 86 148 0 103 9 -9 252
A Gas 10% 95 147 5 114 10 -8 268
A Gas 0% 101 138 0 120 11 -8 260
A Biomass 0% 113 257 0 60 3 -21 299
Table 5.1c: Macroeconomic Costs (High energy price, 4% discount rate, EUR/m²)
Building Package PE
(KWh/m²)
Initial Investment
Cost
Annual Costs Cost of Emissions
Residual Value
Macro Cost Fabric Heating PV Maintenance Energy
Apartment Block – 30 year calc
D Gas + SHW
30% 26 415 46 65 3 -35 494
C Gas + SHW
30% 34 355 5 82 4 -28 419
C Gas 30% 56 224 5 131 6 -13 354
B Gas 30% 69 172 5 157 8 -9 333
B Biomass 30% 77 290 5 52 1 -22 326
B Biomass 20% 83 282 5 61 2 -22 328
B Biomass 10% 89 275 5 70 2 -22 331
B Biomass 0% 94 267 0 79 3 -22 327
A Biomass 30% 95 280 5 65 2 -22 331
A Biomass 0% 113 257 0 92 3 -21 331
AECOM Cost Optimal Calculations and Gap Analysis for recast EPBD for Buildings: Additional Calculations 30
Capabilities on project:
Building Engineering
Table 5.1d: Macroeconomic Costs (Central energy price, 3% discount rate, EUR/m²)
Building Package PE
(KWh/m²)
Initial Investment
Cost
Annual Costs Cost of Emissions
Residual Value
Macro Cost Fabric Heating PV Maintenance Energy
Apartment Block – 30 year calc
D Gas + SHW
30% 26 431 51 57 3 -46 497
C Gas + SHW
30% 34 368 6 71 4 -37 413
C Gas 30% 56 228 6 116 7 -17 339
B Gas 30% 69 176 6 138 9 -12 317
B Gas 20% 75 168 6 147 9 -12 318
B Gas 10% 81 160 6 155 10 -12 320
B Gas 0% 86 152 0 164 11 -12 315
B Biomass 0% 94 278 0 69 3 -29 321
A Biomass 20% 101 284 6 63 3 -28 328
A Biomass 0% 113 268 0 81 4 -28 324
Table 5.1e: Macroeconomic Costs (Central energy price, 6% discount rate, EUR/m²)
Building Package PE
(KWh/m²)
Initial Investment
Cost
Annual Costs Cost of Emissions
Residual Value
Macro Cost Fabric Heating PV Maintenance Energy
Apartment Block – 30 year calc
D Gas + SHW
30% 26 391 37 39 2 -20 449
C Gas + SHW
30% 34 337 4 49 3 -16 377
C Gas 30% 56 218 4 79 5 -8 299
B Gas 30% 69 166 4 95 6 -5 265
B Gas 20% 75 158 4 101 6 -5 264
B Gas 10% 81 151 4 107 7 -5 264
B Gas 0% 86 143 0 113 7 -5 258
A Gas 10% 95 141 4 125 8 -5 274
A Gas 0% 101 133 0 131 8 -5 268
A Biomass 0% 113 240 0 60 2 -12 290
AECOM Cost Optimal Calculations and Gap Analysis for recast EPBD for Buildings: Additional Calculations 31
Capabilities on project:
Building Engineering
Table 5.1f: Macroeconomic Costs (Central energy price, 4% discount rate, Alternative PEF, EUR/m²)
Building Package PE
(KWh/m²)
Initial Investment
Cost
Annual Costs Cost of Emissions
Residual Value
Macro Cost Fabric Heating PV Maintenance Energy
Apartment Block – 30 year calc
D Gas + SHW
30% 25 415 46 50 3 -35 479
C Gas + SHW
30% 32 355 5 62 4 -28 399
C Gas 30% 56 224 5 101 6 -13 323
B Gas 30% 68 172 5 121 7 -9 296
B Gas 20% 75 164 5 129 8 -9 297
B Gas 10% 81 157 5 136 9 -9 298
B Gas 0% 88 148 0 144 9 -9 292
A Gas 0% 103 138 0 167 11 -8 308
A Biomass 10% 107 265 5 65 3 -21 317
A Biomass 0% 114 257 0 73 3 -21 311
Table 5.1g: Macroeconomic Costs (Central energy price, 4% discount rate, Alternative Cost of Carbon, EUR/m²)
Building Package PE
(KWh/m²)
Initial Investment
Cost
Annual Costs Cost of Emissions
Residual Value
Macro Cost Fabric Heating PV Maintenance Energy
Apartment Block – 30 year calc
D Gas + SHW
30% 26 415 46 50 2 -35 478
C Gas + SHW
30% 34 355 5 62 3 -28 398
C Gas 30% 56 224 5 101 4 -13 321
B Gas 30% 69 172 5 121 5 -9 294
B Gas 20% 75 164 5 129 6 -9 294
B Gas 10% 81 157 5 136 6 -9 295
B Gas 0% 86 148 0 144 6 -9 289
B Biomass 0% 94 267 0 62 2 -22 309
A Gas 0% 101 138 0 167 7 -8 305
A Biomass 0% 113 257 0 73 2 -21 310

AECOM Cost Optimal Calculations and Gap Analysis for recast EPBD for Buildings: Additional Calculations 32
Capabilities on project:
Building Engineering
Table 5.2a: Financial Costs (Central energy price, 7% discount rate, EUR/m²)
Building Package PE
(KWh/m²)
Initial Investment
Cost
Annual Costs Cost of Emissions
Residual Value
Macro Cost Fabric Heating PV Maintenance Energy
Apartment Block – 30 year calc
D Gas + SHW
30% 26 434 38 40 - -17 494
C Gas + SHW
30% 34 374 4 50 - -14 414
C Gas 30% 56 245 4 81 - -7 323
B Gas 30% 69 186 4 96 - -5 282
B Gas 20% 75 177 4 103 - -5 280
B Gas 10% 81 169 4 109 - -5 278
B Gas 0% 86 160 0 115 - -4 271
A Gas 10% 95 158 4 128 - -4 286
A Gas 0% 101 149 0 134 - -4 279
A Biomass 0% 113 265 0 63 - -11 317
Table 5.2b: Financial Costs (Low energy price, 7% discount rate, EUR/m²)
Building Package PE
(KWh/m²)
Initial Investment
Cost
Annual Costs Cost of Emissions
Residual Value
Macro Cost Fabric Heating PV Maintenance Energy
Apartment Block – 30 year calc
D Gas + SHW
30% 26 434 38 28 - -17 482
C Gas + SHW
30% 34 374 4 34 - -14 399
C Gas 30% 56 245 4 56 - -7 299
B Gas 30% 69 186 4 68 - -5 254
B Gas 20% 75 177 4 73 - -5 250
B Gas 10% 81 169 4 78 - -5 247
B Gas 0% 86 160 0 83 - -4 239
A Gas 10% 95 158 4 91 - -4 249
A Gas 0% 101 149 0 96 - -4 241
A Biomass 0% 113 265 0 53 - -11 307
AECOM Cost Optimal Calculations and Gap Analysis for recast EPBD for Buildings: Additional Calculations 33
Capabilities on project:
Building Engineering
Table 5.2c: Financial Costs (High energy price, 7% discount rate, EUR/m²)
Building Package PE
(KWh/m²)
Initial Investment
Cost
Annual Costs Cost of Emissions
Residual Value
Macro Cost Fabric Heating PV Maintenance Energy
Apartment Block – 30 year calc
D Gas + SHW
30% 26 434 38 52 - -17 506
C Gas + SHW
30% 34 374 4 65 - -14 430
C Gas 30% 56 245 4 105 - -7 348
B Gas 30% 69 186 4 125 - -5 311
B Gas 20% 75 177 4 133 - -5 310
B Gas 10% 81 169 4 140 - -5 310
B Gas 0% 86 160 0 148 - -4 304
A Gas 10% 95 158 4 165 - -4 323
A Gas 0% 101 149 0 172 - -4 317
A Biomass 0% 113 265 0 79 - -11 333
Table 5.2d: Financial Costs (Central energy price, 13% discount rate, EUR/m²)
Building Package PE
(KWh/m²)
Initial Investment
Cost
Annual Costs Cost of Emissions
Residual Value
Macro Cost Fabric Heating PV Maintenance Energy
Apartment Block – 30 year calc
D Gas + SHW
30% 26 401 23 23 - -4 444
C Gas + SHW
30% 34 349 3 29 - -3 377
C Gas 30% 56 237 3 47 - -1 286
B Gas 30% 69 178 3 57 - -1 236
B Gas 20% 75 170 3 61 - -1 232
B Gas 10% 81 162 3 64 - -1 228
B Gas 0% 86 153 0 68 - -1 221
A Gas 10% 95 151 3 76 - -1 228
A Gas 0% 101 142 0 79 - -1 220
A Biomass 0% 113 242 0 42 - -2 282
AECOM Cost Optimal Calculations and Gap Analysis for recast EPBD for Buildings: Additional Calculations 34
Capabilities on project:
Building Engineering
5.3 Existing Apartment Buildings – Elemental measures
The following Tables summarise the results of the cost calculations for the most cost-optimal elemental measures in
the existing apartment building. Tables 5.3 relate to the macroeconomic calculations and Tables 5.4 relate to the
financial calculations.
Table 5.3a/5.4a: Central energy price, central discount factor
Tables 5.3b/5.4b: Low energy price, central discount factor
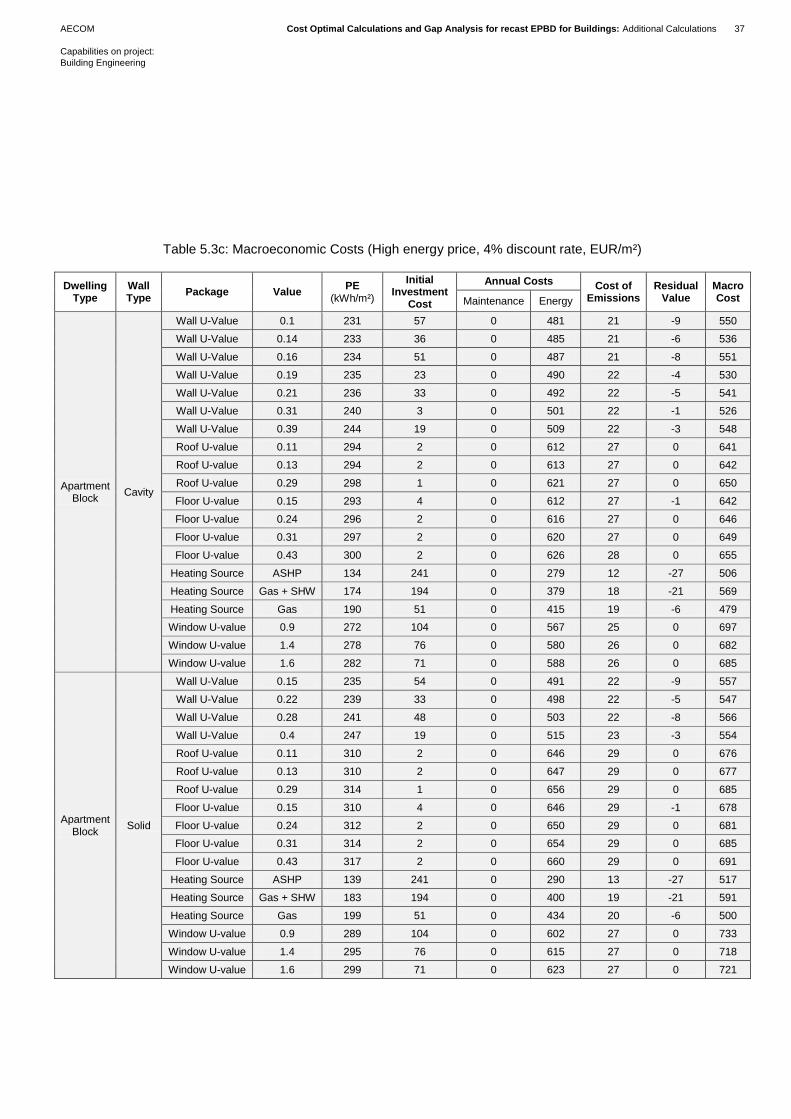
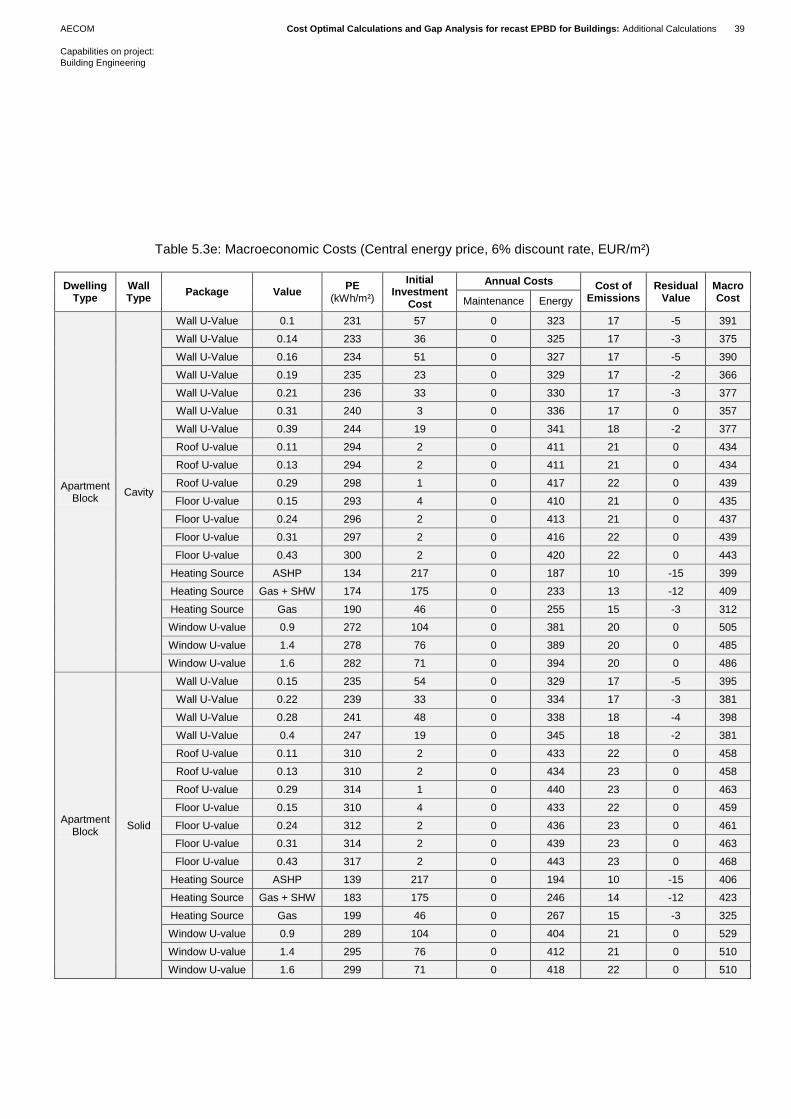
Tables 5.3c/5.4c: High energy price, central discount factor
Tables 5.3d: Central energy price, low discount factor (macro-economic calculation only)
Table 5.3e/5.4d: Central energy price, high discount factor
Applying sensitivities to the energy price and discount factor make a significant difference to the absolute costs.
However, such sensitivities have less impact on the relative cost between alternative options for a given elemental
measure and there are no substantial changes to the cost-optimum solutions.

AECOM Cost Optimal Calculations and Gap Analysis for recast EPBD for Buildings: Additional Calculations 35
Capabilities on project:
Building Engineering
Table 5.3a: Macroeconomic Costs (Central energy price, 4% discount rate, EUR/m²)
Dwelling Type
Wall Type
Package Value PE
(kWh/m²)
Initial Investment
Cost
Annual Costs Cost of Emissions
Residual Value
Macro Cost Maintenance Energy
Apartment Block
Cavity
Wall U-Value 0.1 231 57 0 401 21 -9 469
Wall U-Value 0.14 233 36 0 404 21 -6 456
Wall U-Value 0.16 234 51 0 406 21 -8 470
Wall U-Value 0.19 235 23 0 408 22 -4 449
Wall U-Value 0.21 236 33 0 410 22 -5 459
Wall U-Value 0.31 240 3 0 418 22 -1 443
Wall U-Value 0.39 244 19 0 424 22 -3 463
Roof U-value 0.11 294 2 0 510 27 0 539
Roof U-value 0.13 294 2 0 511 27 0 539
Roof U-value 0.29 298 1 0 518 27 0 546
Floor U-value 0.15 293 4 0 510 27 -1 540
Floor U-value 0.24 296 2 0 514 27 0 543
Floor U-value 0.31 297 2 0 517 27 0 546
Floor U-value 0.43 300 2 0 522 28 0 551
Heating Source ASHP 134 241 0 233 12 -27 460
Heating Source Gas + SHW 174 194 0 296 18 -21 487
Heating Source Gas 190 51 0 324 19 -6 388
Window U-value 0.9 272 104 0 473 25 0 602
Window U-value 1.4 278 76 0 483 26 0 585
Window U-value 1.6 282 71 0 490 26 0 587
Apartment Block
Solid
Wall U-Value 0.15 235 54 0 409 22 -9 476
Wall U-Value 0.22 239 33 0 415 22 -5 464
Wall U-Value 0.28 241 48 0 419 22 -8 482
Wall U-Value 0.4 247 19 0 429 23 -3 468
Roof U-value 0.11 310 2 0 538 29 0 569
Roof U-value 0.13 310 2 0 539 29 0 569
Roof U-value 0.29 314 1 0 546 29 0 576
Floor U-value 0.15 310 4 0 538 29 -1 570
Floor U-value 0.24 312 2 0 542 29 0 573
Floor U-value 0.31 314 2 0 545 29 0 576
Floor U-value 0.43 317 2 0 550 29 0 581
Heating Source ASHP 139 241 0 241 13 -27 469
Heating Source Gas + SHW 183 194 0 312 19 -21 504
Heating Source Gas 199 51 0 339 20 -6 404
Window U-value 0.9 289 104 0 502 27 0 633
Window U-value 1.4 295 76 0 512 27 0 615
Window U-value 1.6 299 71 0 519 27 0 617

AECOM Cost Optimal Calculations and Gap Analysis for recast EPBD for Buildings: Additional Calculations 36
Capabilities on project:
Building Engineering
Table 5.3b: Macroeconomic Costs (Low energy price, 4% discount rate, EUR/m²)
Dwelling Type
Wall Type
Package Value PE
(kWh/m²)
Initial Investment
Cost
Annual Costs Cost of Emissions
Residual Value
Macro Cost Maintenance Energy
Apartment Block
Cavity
Wall U-Value 0.1 231 57 0 321 21 -9 389
Wall U-Value 0.14 233 36 0 323 21 -6 375
Wall U-Value 0.16 234 51 0 325 21 -8 389
Wall U-Value 0.19 235 23 0 326 22 -4 367
Wall U-Value 0.21 236 33 0 328 22 -5 377
Wall U-Value 0.31 240 3 0 334 22 -1 359
Wall U-Value 0.39 244 19 0 339 22 -3 378
Roof U-value 0.11 294 2 0 408 27 0 437
Roof U-value 0.13 294 2 0 409 27 0 437
Roof U-value 0.29 298 1 0 414 27 0 442
Floor U-value 0.15 293 4 0 408 27 -1 438
Floor U-value 0.24 296 2 0 411 27 0 440
Floor U-value 0.31 297 2 0 413 27 0 442
Floor U-value 0.43 300 2 0 417 28 0 447
Heating Source ASHP 134 241 0 186 12 -27 413
Heating Source Gas + SHW 174 194 0 214 18 -21 404
Heating Source Gas 190 51 0 233 19 -6 298
Window U-value 0.9 272 104 0 378 25 0 507
Window U-value 1.4 278 76 0 387 26 0 488
Window U-value 1.6 282 71 0 392 26 0 489
Apartment Block
Solid
Wall U-Value 0.15 235 54 0 327 22 -9 394
Wall U-Value 0.22 239 33 0 332 22 -5 381
Wall U-Value 0.28 241 48 0 336 22 -8 398
Wall U-Value 0.4 247 19 0 343 23 -3 382
Roof U-value 0.11 310 2 0 431 29 0 461
Roof U-value 0.13 310 2 0 431 29 0 462
Roof U-value 0.29 314 1 0 437 29 0 467
Floor U-value 0.15 310 4 0 430 29 -1 462
Floor U-value 0.24 312 2 0 434 29 0 464
Floor U-value 0.31 314 2 0 436 29 0 467
Floor U-value 0.43 317 2 0 440 29 0 471
Heating Source ASHP 139 241 0 193 13 -27 421
Heating Source Gas + SHW 183 194 0 225 19 -21 416
Heating Source Gas 199 51 0 244 20 -6 309
Window U-value 0.9 289 104 0 402 27 0 532
Window U-value 1.4 295 76 0 410 27 0 513
Window U-value 1.6 299 71 0 415 27 0 513
AECOM Cost Optimal Calculations and Gap Analysis for recast EPBD for Buildings: Additional Calculations 37
Capabilities on project:
Building Engineering
Table 5.3c: Macroeconomic Costs (High energy price, 4% discount rate, EUR/m²)
Dwelling Type
Wall Type
Package Value PE
(kWh/m²)
Initial Investment
Cost
Annual Costs Cost of Emissions
Residual Value
Macro Cost Maintenance Energy
Apartment Block
Cavity
Wall U-Value 0.1 231 57 0 481 21 -9 550
Wall U-Value 0.14 233 36 0 485 21 -6 536
Wall U-Value 0.16 234 51 0 487 21 -8 551
Wall U-Value 0.19 235 23 0 490 22 -4 530
Wall U-Value 0.21 236 33 0 492 22 -5 541
Wall U-Value 0.31 240 3 0 501 22 -1 526
Wall U-Value 0.39 244 19 0 509 22 -3 548
Roof U-value 0.11 294 2 0 612 27 0 641
Roof U-value 0.13 294 2 0 613 27 0 642
Roof U-value 0.29 298 1 0 621 27 0 650
Floor U-value 0.15 293 4 0 612 27 -1 642
Floor U-value 0.24 296 2 0 616 27 0 646
Floor U-value 0.31 297 2 0 620 27 0 649
Floor U-value 0.43 300 2 0 626 28 0 655
Heating Source ASHP 134 241 0 279 12 -27 506
Heating Source Gas + SHW 174 194 0 379 18 -21 569
Heating Source Gas 190 51 0 415 19 -6 479
Window U-value 0.9 272 104 0 567 25 0 697
Window U-value 1.4 278 76 0 580 26 0 682
Window U-value 1.6 282 71 0 588 26 0 685
Apartment Block
Solid
Wall U-Value 0.15 235 54 0 491 22 -9 557
Wall U-Value 0.22 239 33 0 498 22 -5 547
Wall U-Value 0.28 241 48 0 503 22 -8 566
Wall U-Value 0.4 247 19 0 515 23 -3 554
Roof U-value 0.11 310 2 0 646 29 0 676
Roof U-value 0.13 310 2 0 647 29 0 677
Roof U-value 0.29 314 1 0 656 29 0 685
Floor U-value 0.15 310 4 0 646 29 -1 678
Floor U-value 0.24 312 2 0 650 29 0 681
Floor U-value 0.31 314 2 0 654 29 0 685
Floor U-value 0.43 317 2 0 660 29 0 691
Heating Source ASHP 139 241 0 290 13 -27 517
Heating Source Gas + SHW 183 194 0 400 19 -21 591
Heating Source Gas 199 51 0 434 20 -6 500
Window U-value 0.9 289 104 0 602 27 0 733
Window U-value 1.4 295 76 0 615 27 0 718
Window U-value 1.6 299 71 0 623 27 0 721

AECOM Cost Optimal Calculations and Gap Analysis for recast EPBD for Buildings: Additional Calculations 38
Capabilities on project:
Building Engineering
Table 5.3d: Macroeconomic Costs (Central energy price, 3% discount rate, EUR/m²)
Dwelling Type
Wall Type
Package Value PE
(kWh/m²)
Initial Investment
Cost
Annual Costs Cost of Emissions
Residual Value
Macro Cost Maintenance Energy
Apartment Block
Cavity
Wall U-Value 0.1 231 57 0 452 24 -12 520
Wall U-Value 0.14 233 36 0 455 24 -8 508
Wall U-Value 0.16 234 51 0 457 25 -11 522
Wall U-Value 0.19 235 23 0 460 25 -5 502
Wall U-Value 0.21 236 33 0 462 25 -7 512
Wall U-Value 0.31 240 3 0 471 25 -1 499
Wall U-Value 0.39 244 19 0 478 26 -4 519
Roof U-value 0.11 294 2 0 575 31 0 607
Roof U-value 0.13 294 2 0 576 31 0 608
Roof U-value 0.29 298 1 0 584 31 0 616
Floor U-value 0.15 293 4 0 574 31 -1 608
Floor U-value 0.24 296 2 0 579 31 -1 612
Floor U-value 0.31 297 2 0 582 31 0 615
Floor U-value 0.43 300 2 0 588 32 0 621
Heating Source ASHP 134 257 0 262 14 -35 499
Heating Source Gas + SHW 174 207 0 338 20 -28 537
Heating Source Gas 190 54 0 370 22 -7 439
Window U-value 0.9 272 104 0 533 29 0 666
Window U-value 1.4 278 76 0 545 29 0 650
Window U-value 1.6 282 71 0 552 30 0 653
Apartment Block
Solid
Wall U-Value 0.15 235 54 0 461 25 -11 528
Wall U-Value 0.22 239 33 0 467 25 -7 518
Wall U-Value 0.28 241 48 0 473 25 -10 536
Wall U-Value 0.4 247 19 0 484 26 -4 525
Roof U-value 0.11 310 2 0 607 33 0 641
Roof U-value 0.13 310 2 0 608 33 0 642
Roof U-value 0.29 314 1 0 616 33 0 649
Floor U-value 0.15 310 4 0 606 33 -1 642
Floor U-value 0.24 312 2 0 611 33 -1 646
Floor U-value 0.31 314 2 0 614 33 0 649
Floor U-value 0.43 317 2 0 620 33 0 655
Heating Source ASHP 139 257 0 272 15 -35 509
Heating Source Gas + SHW 183 207 0 356 22 -28 557
Heating Source Gas 199 54 0 387 23 -7 457
Window U-value 0.9 289 104 0 566 30 0 700
Window U-value 1.4 295 76 0 577 31 0 684
Window U-value 1.6 299 71 0 585 31 0 687
AECOM Cost Optimal Calculations and Gap Analysis for recast EPBD for Buildings: Additional Calculations 39
Capabilities on project:
Building Engineering
Table 5.3e: Macroeconomic Costs (Central energy price, 6% discount rate, EUR/m²)
Dwelling Type
Wall Type
Package Value PE
(kWh/m²)
Initial Investment
Cost
Annual Costs Cost of Emissions
Residual Value
Macro Cost Maintenance Energy
Apartment Block
Cavity
Wall U-Value 0.1 231 57 0 323 17 -5 391
Wall U-Value 0.14 233 36 0 325 17 -3 375
Wall U-Value 0.16 234 51 0 327 17 -5 390
Wall U-Value 0.19 235 23 0 329 17 -2 366
Wall U-Value 0.21 236 33 0 330 17 -3 377
Wall U-Value 0.31 240 3 0 336 17 0 357
Wall U-Value 0.39 244 19 0 341 18 -2 377
Roof U-value 0.11 294 2 0 411 21 0 434
Roof U-value 0.13 294 2 0 411 21 0 434
Roof U-value 0.29 298 1 0 417 22 0 439
Floor U-value 0.15 293 4 0 410 21 0 435
Floor U-value 0.24 296 2 0 413 21 0 437
Floor U-value 0.31 297 2 0 416 22 0 439
Floor U-value 0.43 300 2 0 420 22 0 443
Heating Source ASHP 134 217 0 187 10 -15 399
Heating Source Gas + SHW 174 175 0 233 13 -12 409
Heating Source Gas 190 46 0 255 15 -3 312
Window U-value 0.9 272 104 0 381 20 0 505
Window U-value 1.4 278 76 0 389 20 0 485
Window U-value 1.6 282 71 0 394 20 0 486
Apartment Block
Solid
Wall U-Value 0.15 235 54 0 329 17 -5 395
Wall U-Value 0.22 239 33 0 334 17 -3 381
Wall U-Value 0.28 241 48 0 338 18 -4 398
Wall U-Value 0.4 247 19 0 345 18 -2 381
Roof U-value 0.11 310 2 0 433 22 0 458
Roof U-value 0.13 310 2 0 434 23 0 458
Roof U-value 0.29 314 1 0 440 23 0 463
Floor U-value 0.15 310 4 0 433 22 0 459
Floor U-value 0.24 312 2 0 436 23 0 461
Floor U-value 0.31 314 2 0 439 23 0 463
Floor U-value 0.43 317 2 0 443 23 0 468
Heating Source ASHP 139 217 0 194 10 -15 406
Heating Source Gas + SHW 183 175 0 246 14 -12 423
Heating Source Gas 199 46 0 267 15 -3 325
Window U-value 0.9 289 104 0 404 21 0 529
Window U-value 1.4 295 76 0 412 21 0 510
Window U-value 1.6 299 71 0 418 22 0 510

AECOM Cost Optimal Calculations and Gap Analysis for recast EPBD for Buildings: Additional Calculations 40
Capabilities on project:
Building Engineering
Table 5.4a: Financial Costs (Central energy price, 7% discount rate, EUR/m²)
Dwelling Type
Wall Type
Package Value PE
(kWh/m²)
Initial Investment
Cost
Annual Costs Cost of Emissions
Residual Value
Macro Cost Maintenance Energy
Apartment Block
Cavity
Wall U-Value 0.1 231 64 0 332 - -5 392
Wall U-Value 0.14 233 41 0 335 - -3 373
Wall U-Value 0.16 234 58 0 336 - -4 390
Wall U-Value 0.19 235 26 0 338 - -2 362
Wall U-Value 0.21 236 37 0 339 - -3 374
Wall U-Value 0.31 240 4 0 346 - 0 349
Wall U-Value 0.39 244 22 0 351 - -2 372
Roof U-value 0.11 294 2 0 422 - 0 425
Roof U-value 0.13 294 2 0 423 - 0 425
Roof U-value 0.29 298 1 0 429 - 0 430
Floor U-value 0.15 293 5 0 422 - 0 426
Floor U-value 0.24 296 3 0 425 - 0 428
Floor U-value 0.31 297 2 0 428 - 0 430
Floor U-value 0.43 300 2 0 432 - 0 434
Heating Source ASHP 134 237 0 193 - -13 416
Heating Source Gas + SHW 174 190 0 238 - -11 417
Heating Source Gas 190 50 0 260 - -3 307
Window U-value 0.9 272 118 0 392 - 0 510
Window U-value 1.4 278 86 0 400 - 0 487
Window U-value 1.6 282 80 0 406 - 0 486
Apartment Block
Solid
Wall U-Value 0.15 235 61 0 339 - -4 395
Wall U-Value 0.22 239 37 0 343 - -3 378
Wall U-Value 0.28 241 54 0 347 - -4 398
Wall U-Value 0.4 247 22 0 355 - -2 376
Roof U-value 0.11 310 2 0 446 - 0 448
Roof U-value 0.13 310 2 0 447 - 0 449
Roof U-value 0.29 314 1 0 452 - 0 453
Floor U-value 0.15 310 5 0 446 - 0 450
Floor U-value 0.24 312 3 0 449 - 0 452
Floor U-value 0.31 314 2 0 451 - 0 453
Floor U-value 0.43 317 2 0 456 - 0 458
Heating Source ASHP 139 237 0 200 - -13 423
Heating Source Gas + SHW 183 190 0 250 - -11 430
Heating Source Gas 199 50 0 272 - -3 319
Window U-value 0.9 289 118 0 416 - 0 534
Window U-value 1.4 295 86 0 424 - 0 511
Window U-value 1.6 299 80 0 430 - 0 510

AECOM Cost Optimal Calculations and Gap Analysis for recast EPBD for Buildings: Additional Calculations 41
Capabilities on project:
Building Engineering
Table 5.4b: Financial Costs (Low energy price, 7% discount rate, EUR/m²)
Dwelling Type
Wall Type
Package Value PE
(kWh/m²)
Initial Investment
Cost
Annual Costs Cost of Emissions
Residual Value
Macro Cost Maintenance Energy
Apartment Block
Cavity
Wall U-Value 0.1 231 64 0 266 - -5 325
Wall U-Value 0.14 233 41 0 268 - -3 306
Wall U-Value 0.16 234 58 0 269 - -4 322
Wall U-Value 0.19 235 26 0 270 - -2 294
Wall U-Value 0.21 236 37 0 271 - -3 306
Wall U-Value 0.31 240 4 0 277 - 0 280
Wall U-Value 0.39 244 22 0 281 - -2 301
Roof U-value 0.11 294 2 0 338 - 0 340
Roof U-value 0.13 294 2 0 339 - 0 340
Roof U-value 0.29 298 1 0 343 - 0 344
Floor U-value 0.15 293 5 0 338 - 0 342
Floor U-value 0.24 296 3 0 340 - 0 343
Floor U-value 0.31 297 2 0 342 - 0 344
Floor U-value 0.43 300 2 0 346 - 0 348
Heating Source ASHP 134 237 0 154 - -13 378
Heating Source Gas + SHW 174 190 0 171 - -11 351
Heating Source Gas 190 50 0 187 - -3 234
Window U-value 0.9 272 118 0 313 - 0 432
Window U-value 1.4 278 86 0 320 - 0 407
Window U-value 1.6 282 80 0 325 - 0 405
Apartment Block
Solid
Wall U-Value 0.15 235 61 0 271 - -4 328
Wall U-Value 0.22 239 37 0 275 - -3 309
Wall U-Value 0.28 241 54 0 278 - -4 328
Wall U-Value 0.4 247 22 0 284 - -2 305
Roof U-value 0.11 310 2 0 357 - 0 359
Roof U-value 0.13 310 2 0 357 - 0 359
Roof U-value 0.29 314 1 0 362 - 0 363
Floor U-value 0.15 310 5 0 357 - 0 361
Floor U-value 0.24 312 3 0 359 - 0 362
Floor U-value 0.31 314 2 0 361 - 0 363
Floor U-value 0.43 317 2 0 365 - 0 366
Heating Source ASHP 139 237 0 160 - -13 383
Heating Source Gas + SHW 183 190 0 180 - -11 360
Heating Source Gas 199 50 0 196 - -3 243
Window U-value 0.9 289 118 0 333 - 0 451
Window U-value 1.4 295 86 0 339 - 0 426
Window U-value 1.6 299 80 0 344 - 0 424
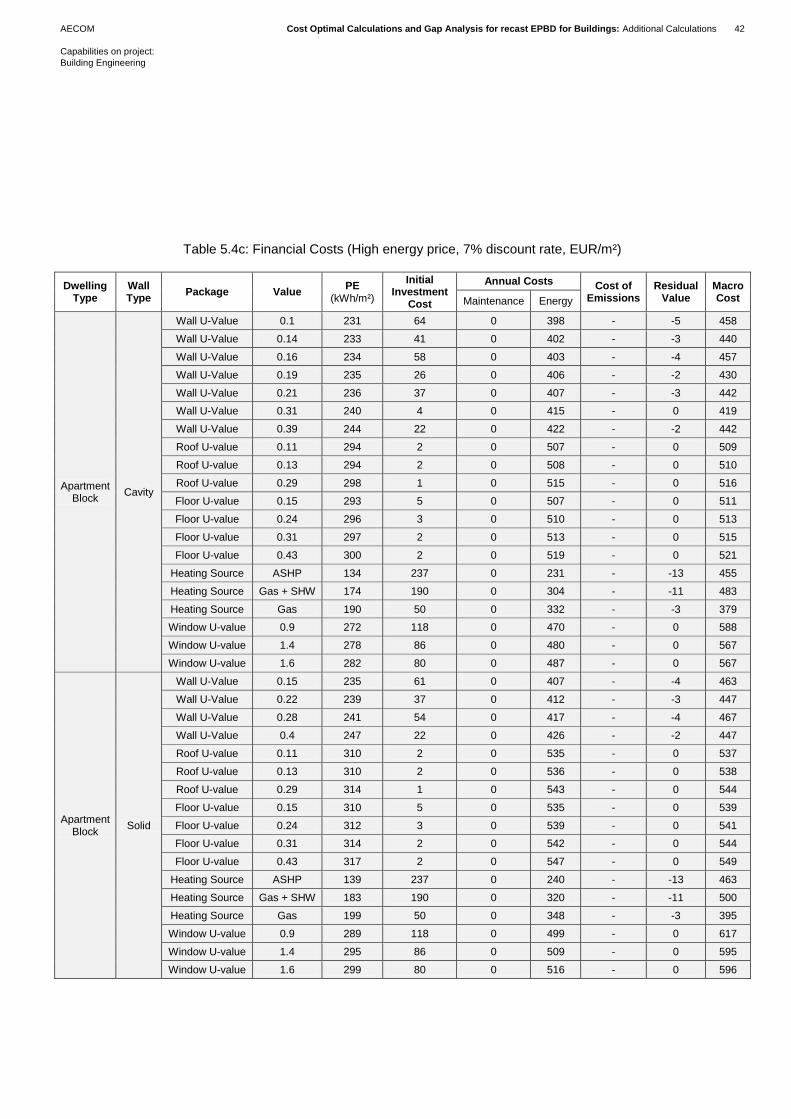
AECOM Cost Optimal Calculations and Gap Analysis for recast EPBD for Buildings: Additional Calculations 42
Capabilities on project:
Building Engineering
Table 5.4c: Financial Costs (High energy price, 7% discount rate, EUR/m²)
Dwelling Type
Wall Type
Package Value PE
(kWh/m²)
Initial Investment
Cost
Annual Costs Cost of Emissions
Residual Value
Macro Cost Maintenance Energy
Apartment Block
Cavity
Wall U-Value 0.1 231 64 0 398 - -5 458
Wall U-Value 0.14 233 41 0 402 - -3 440
Wall U-Value 0.16 234 58 0 403 - -4 457
Wall U-Value 0.19 235 26 0 406 - -2 430
Wall U-Value 0.21 236 37 0 407 - -3 442
Wall U-Value 0.31 240 4 0 415 - 0 419
Wall U-Value 0.39 244 22 0 422 - -2 442
Roof U-value 0.11 294 2 0 507 - 0 509
Roof U-value 0.13 294 2 0 508 - 0 510
Roof U-value 0.29 298 1 0 515 - 0 516
Floor U-value 0.15 293 5 0 507 - 0 511
Floor U-value 0.24 296 3 0 510 - 0 513
Floor U-value 0.31 297 2 0 513 - 0 515
Floor U-value 0.43 300 2 0 519 - 0 521
Heating Source ASHP 134 237 0 231 - -13 455
Heating Source Gas + SHW 174 190 0 304 - -11 483
Heating Source Gas 190 50 0 332 - -3 379
Window U-value 0.9 272 118 0 470 - 0 588
Window U-value 1.4 278 86 0 480 - 0 567
Window U-value 1.6 282 80 0 487 - 0 567
Apartment Block
Solid
Wall U-Value 0.15 235 61 0 407 - -4 463
Wall U-Value 0.22 239 37 0 412 - -3 447
Wall U-Value 0.28 241 54 0 417 - -4 467
Wall U-Value 0.4 247 22 0 426 - -2 447
Roof U-value 0.11 310 2 0 535 - 0 537
Roof U-value 0.13 310 2 0 536 - 0 538
Roof U-value 0.29 314 1 0 543 - 0 544
Floor U-value 0.15 310 5 0 535 - 0 539
Floor U-value 0.24 312 3 0 539 - 0 541
Floor U-value 0.31 314 2 0 542 - 0 544
Floor U-value 0.43 317 2 0 547 - 0 549
Heating Source ASHP 139 237 0 240 - -13 463
Heating Source Gas + SHW 183 190 0 320 - -11 500
Heating Source Gas 199 50 0 348 - -3 395
Window U-value 0.9 289 118 0 499 - 0 617
Window U-value 1.4 295 86 0 509 - 0 595
Window U-value 1.6 299 80 0 516 - 0 596

AECOM Cost Optimal Calculations and Gap Analysis for recast EPBD for Buildings: Additional Calculations 43
Capabilities on project:
Building Engineering
Table 5.4d: Financial Costs (Central energy price, 10% discount rate, EUR/m²)
Dwelling Type
Wall Type
Package Value PE
(kWh/m²)
Initial Investment
Cost
Annual Costs Cost of Emissions
Residual Value
Macro Cost Maintenance Energy
Apartment Block
Cavity
Wall U-Value 0.1 231 64 0 207 - -1 271
Wall U-Value 0.14 233 41 0 209 - -1 249
Wall U-Value 0.16 234 58 0 210 - -1 267
Wall U-Value 0.19 235 26 0 211 - 0 236
Wall U-Value 0.21 236 37 0 212 - -1 248
Wall U-Value 0.31 240 4 0 216 - 0 220
Wall U-Value 0.39 244 22 0 219 - 0 241
Roof U-value 0.11 294 2 0 264 - 0 266
Roof U-value 0.13 294 2 0 264 - 0 266
Roof U-value 0.29 298 1 0 268 - 0 269
Floor U-value 0.15 293 5 0 264 - 0 268
Floor U-value 0.24 296 3 0 266 - 0 268
Floor U-value 0.31 297 2 0 267 - 0 269
Floor U-value 0.43 300 2 0 270 - 0 272
Heating Source ASHP 134 204 0 120 - -3 322
Heating Source Gas + SHW 174 164 0 141 - -2 303
Heating Source Gas 190 43 0 154 - -1 197
Window U-value 0.9 272 118 0 244 - 0 363
Window U-value 1.4 278 86 0 250 - 0 336
Window U-value 1.6 282 80 0 253 - 0 334
Apartment Block
Solid
Wall U-Value 0.15 235 61 0 212 - -1 271
Wall U-Value 0.22 239 37 0 214 - -1 251
Wall U-Value 0.28 241 54 0 217 - -1 270
Wall U-Value 0.4 247 22 0 222 - 0 244
Roof U-value 0.11 310 2 0 278 - 0 281
Roof U-value 0.13 310 2 0 279 - 0 281
Roof U-value 0.29 314 1 0 283 - 0 283
Floor U-value 0.15 310 5 0 278 - 0 283
Floor U-value 0.24 312 3 0 280 - 0 283
Floor U-value 0.31 314 2 0 282 - 0 284
Floor U-value 0.43 317 2 0 285 - 0 287
Heating Source ASHP 139 204 0 125 - -3 326
Heating Source Gas + SHW 183 164 0 149 - -2 311
Heating Source Gas 199 43 0 161 - -1 204
Window U-value 0.9 289 118 0 260 - 0 378
Window U-value 1.4 295 86 0 265 - 0 351
Window U-value 1.6 299 80 0 268 - 0 349
AECOM Cost Optimal Calculations and Gap Analysis for recast EPBD for Buildings: Additional Calculations 44
Capabilities on project:
Building Engineering
5.4 Existing Apartment Buildings – Packages of measures
The following Tables summarise the results of the cost calculations for the most cost-optimal packages in the
existing apartment building. Tables 5.3 relate to the macroeconomic calculations and Tables 5.4 relate to the
financial calculations.
Table 5.5a/5.6a: Central energy price, central discount factor
Tables 5.5b/5.6b: Low energy price, central discount factor
Tables 5.5c/5.6c: High energy price, central discount factor
Tables 5.5d: Central energy price, low discount factor (macro-economic calculation only)
Table 5.3e/5.6d: Central energy price, high discount factor
The sensitivity analysis shows the following:
In all cases the cost optimal package has roof and wall improvements. This was consistent within the
sensitivity analyses as well.
The cost optimal packages included an individual gas boiler. In the sensitivity analysis, the cost optimal
package sometimes included a biomass boiler instead of a gas boiler.
The cost optimal package had no PV included in both the central case and sensitivity analyses. However,
particularly with the higher energy price sensitivity, the relative cost to add PV was small. Section 6
presents analysis on the impact of uncertainties of the cost data adopted for this study. In doing this
additional analysis, cost optimal solutions including PV of up to 20% of the foundation area were identified.

AECOM Cost Optimal Calculations and Gap Analysis for recast EPBD for Buildings: Additional Calculations 45
Capabilities on project:
Building Engineering
Table 5.5a: Macroeconomic Costs (Central energy price, 4% discount rate, EUR/m²)
Building Package PE
(KWh/m²)
Initial Investment
Cost
Annual Costs Cost of Emissions
Residual Value
Macro Cost Fabric Heating PV Maintenance Energy
Apartment Block
Cavity Wall – 30 year
calc
All+ GSHP 20% 73 435 5 133 7 -36 544
All GSHP 20% 77 388 5 139 7 -33 506
Roof + Wall
GSHP 20% 86
311 5 154 8 -33 446
Roof + Wall
ASHP 20% 96
262 5 172 9 -28 421
All Gas 20% 114 148 5 199 12 -7 358
Roof + Wall
Gas 20% 131
72 5 229 13 -7 313
Roof + Wall
Gas 0% 143
56 0 244 15 -6 308
Roof + Wall
Biomass 0% 162
210 0 120 4 -23 310
Wall Biomass 0% 171 208 0 126 5 -23 315
Roof Biomass 0% 207 206 0 151 5 -23 340
Apartment Block Hollow
Block Wall – 30 year
calc
All+ GSHP 20% 73 466 5 132 7 -41 569
All GSHP 20% 76 417 5 136 7 -38 528
Roof + Wall
GSHP 20% 85
341 5 152 8 -38 469
Roof + Wall
ASHP 20% 95
292 5 170 9 -32 443
All Gas 20% 112 177 5 195 11 -11 378
Roof + Wall
Gas 20% 129
101 5 225 13 -11 334
Roof + Wall
Gas 0% 141
86 0 240 14 -11 329
Roof + Wall
Biomass 0% 159
239 0 118 4 -28 333
Wall Biomass 0% 169 237 0 124 5 -28 338
Roof Biomass 0% 216 206 0 157 6 -23 347
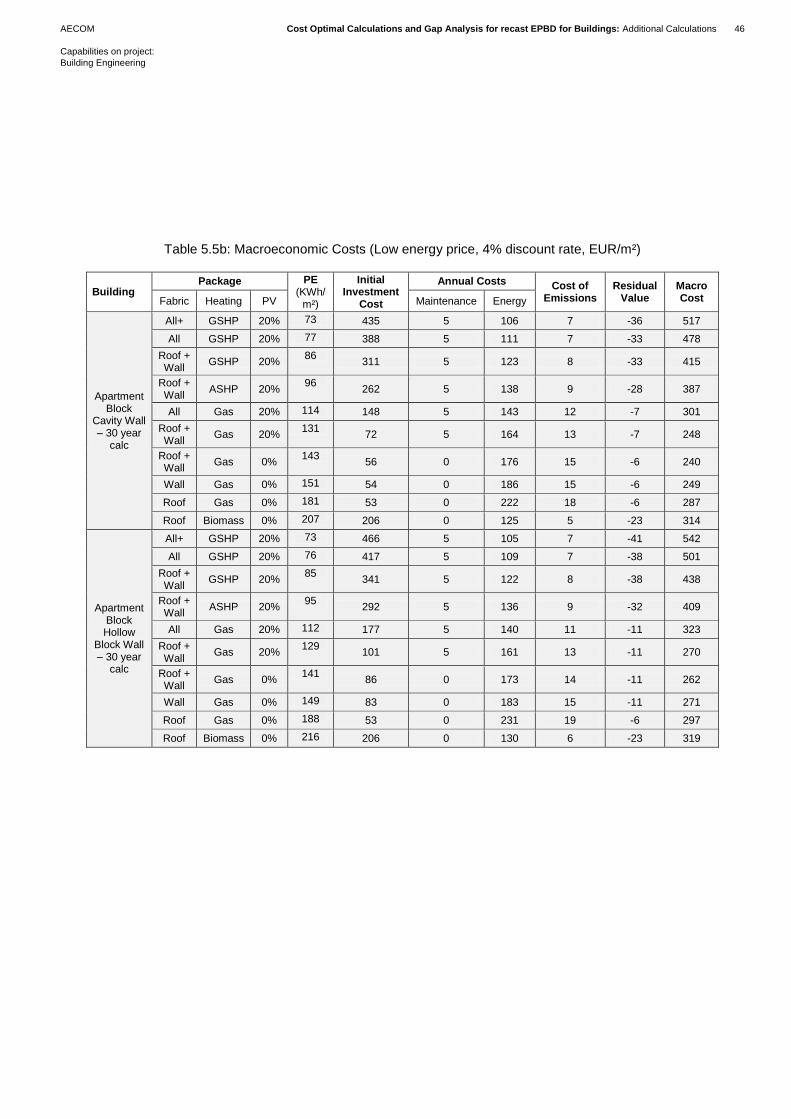
AECOM Cost Optimal Calculations and Gap Analysis for recast EPBD for Buildings: Additional Calculations 46
Capabilities on project:
Building Engineering
Table 5.5b: Macroeconomic Costs (Low energy price, 4% discount rate, EUR/m²)
Building Package PE
(KWh/m²)
Initial Investment
Cost
Annual Costs Cost of Emissions
Residual Value
Macro Cost Fabric Heating PV Maintenance Energy
Apartment Block
Cavity Wall – 30 year
calc
All+ GSHP 20% 73 435 5 106 7 -36 517
All GSHP 20% 77 388 5 111 7 -33 478
Roof + Wall
GSHP 20% 86
311 5 123 8 -33 415
Roof + Wall
ASHP 20% 96
262 5 138 9 -28 387
All Gas 20% 114 148 5 143 12 -7 301
Roof + Wall
Gas 20% 131
72 5 164 13 -7 248
Roof + Wall
Gas 0% 143
56 0 176 15 -6 240
Wall Gas 0% 151 54 0 186 15 -6 249
Roof Gas 0% 181 53 0 222 18 -6 287
Roof Biomass 0% 207 206 0 125 5 -23 314
Apartment Block Hollow
Block Wall – 30 year
calc
All+ GSHP 20% 73 466 5 105 7 -41 542
All GSHP 20% 76 417 5 109 7 -38 501
Roof + Wall
GSHP 20% 85
341 5 122 8 -38 438
Roof + Wall
ASHP 20% 95
292 5 136 9 -32 409
All Gas 20% 112 177 5 140 11 -11 323
Roof + Wall
Gas 20% 129
101 5 161 13 -11 270
Roof + Wall
Gas 0% 141
86 0 173 14 -11 262
Wall Gas 0% 149 83 0 183 15 -11 271
Roof Gas 0% 188 53 0 231 19 -6 297
Roof Biomass 0% 216 206 0 130 6 -23 319
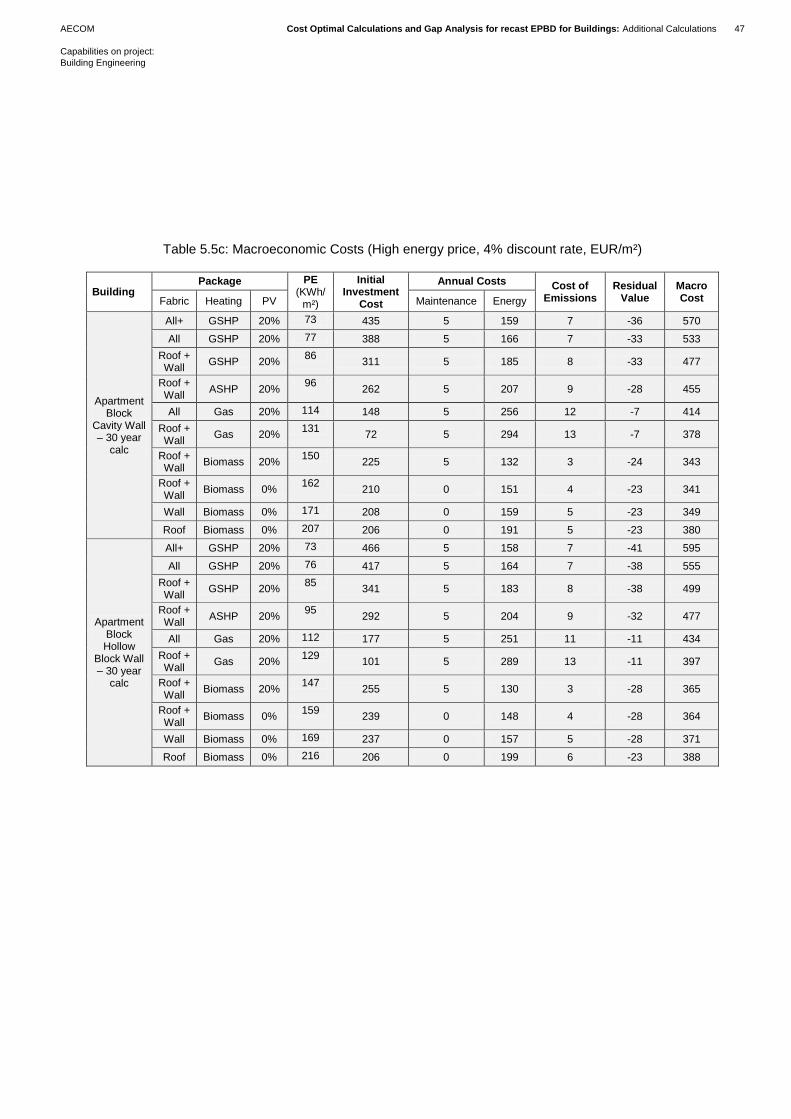
AECOM Cost Optimal Calculations and Gap Analysis for recast EPBD for Buildings: Additional Calculations 47
Capabilities on project:
Building Engineering
Table 5.5c: Macroeconomic Costs (High energy price, 4% discount rate, EUR/m²)
Building Package PE
(KWh/m²)
Initial Investment
Cost
Annual Costs Cost of Emissions
Residual Value
Macro Cost Fabric Heating PV Maintenance Energy
Apartment Block
Cavity Wall – 30 year
calc
All+ GSHP 20% 73 435 5 159 7 -36 570
All GSHP 20% 77 388 5 166 7 -33 533
Roof + Wall
GSHP 20% 86
311 5 185 8 -33 477
Roof + Wall
ASHP 20% 96
262 5 207 9 -28 455
All Gas 20% 114 148 5 256 12 -7 414
Roof + Wall
Gas 20% 131
72 5 294 13 -7 378
Roof + Wall
Biomass 20% 150
225 5 132 3 -24 343
Roof + Wall
Biomass 0% 162
210 0 151 4 -23 341
Wall Biomass 0% 171 208 0 159 5 -23 349
Roof Biomass 0% 207 206 0 191 5 -23 380
Apartment Block Hollow
Block Wall – 30 year
calc
All+ GSHP 20% 73 466 5 158 7 -41 595
All GSHP 20% 76 417 5 164 7 -38 555
Roof + Wall
GSHP 20% 85
341 5 183 8 -38 499
Roof + Wall
ASHP 20% 95
292 5 204 9 -32 477
All Gas 20% 112 177 5 251 11 -11 434
Roof + Wall
Gas 20% 129
101 5 289 13 -11 397
Roof + Wall
Biomass 20% 147
255 5 130 3 -28 365
Roof + Wall
Biomass 0% 159
239 0 148 4 -28 364
Wall Biomass 0% 169 237 0 157 5 -28 371
Roof Biomass 0% 216 206 0 199 6 -23 388
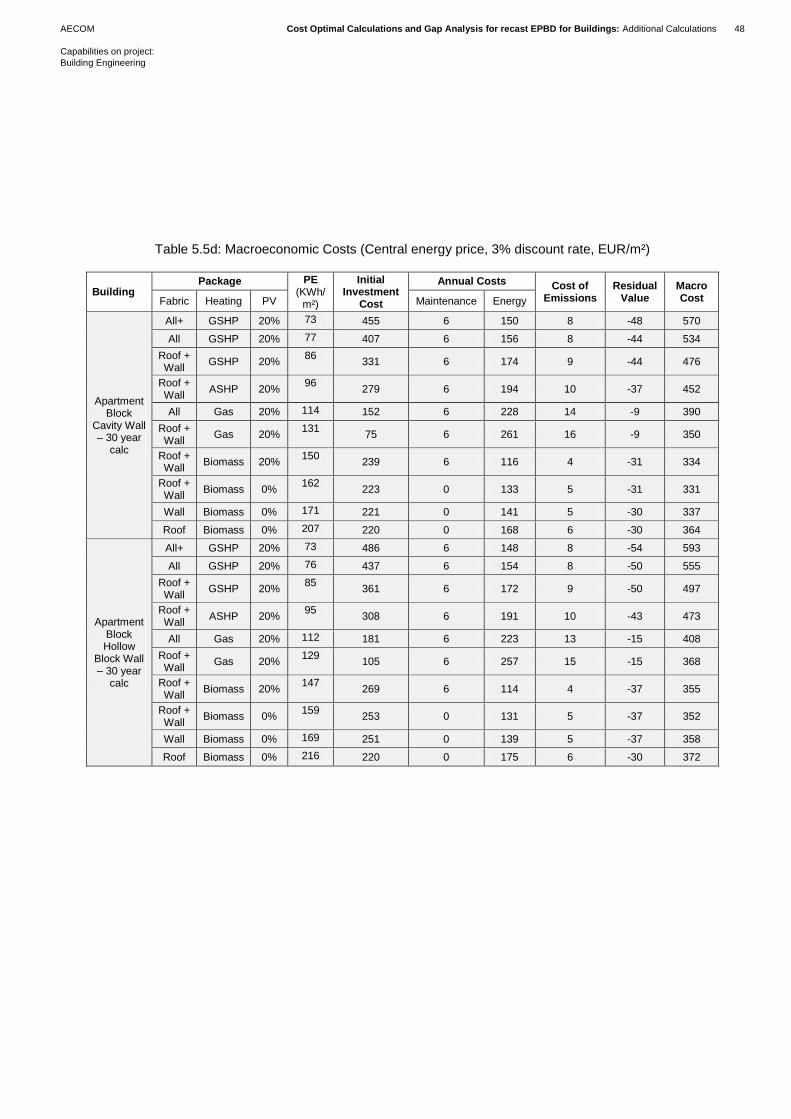
AECOM Cost Optimal Calculations and Gap Analysis for recast EPBD for Buildings: Additional Calculations 48
Capabilities on project:
Building Engineering
Table 5.5d: Macroeconomic Costs (Central energy price, 3% discount rate, EUR/m²)
Building Package PE
(KWh/m²)
Initial Investment
Cost
Annual Costs Cost of Emissions
Residual Value
Macro Cost Fabric Heating PV Maintenance Energy
Apartment Block
Cavity Wall – 30 year
calc
All+ GSHP 20% 73 455 6 150 8 -48 570
All GSHP 20% 77 407 6 156 8 -44 534
Roof + Wall
GSHP 20% 86
331 6 174 9 -44 476
Roof + Wall
ASHP 20% 96
279 6 194 10 -37 452
All Gas 20% 114 152 6 228 14 -9 390
Roof + Wall
Gas 20% 131
75 6 261 16 -9 350
Roof + Wall
Biomass 20% 150
239 6 116 4 -31 334
Roof + Wall
Biomass 0% 162
223 0 133 5 -31 331
Wall Biomass 0% 171 221 0 141 5 -30 337
Roof Biomass 0% 207 220 0 168 6 -30 364
Apartment Block Hollow
Block Wall – 30 year
calc
All+ GSHP 20% 73 486 6 148 8 -54 593
All GSHP 20% 76 437 6 154 8 -50 555
Roof + Wall
GSHP 20% 85
361 6 172 9 -50 497
Roof + Wall
ASHP 20% 95
308 6 191 10 -43 473
All Gas 20% 112 181 6 223 13 -15 408
Roof + Wall
Gas 20% 129
105 6 257 15 -15 368
Roof + Wall
Biomass 20% 147
269 6 114 4 -37 355
Roof + Wall
Biomass 0% 159
253 0 131 5 -37 352
Wall Biomass 0% 169 251 0 139 5 -37 358
Roof Biomass 0% 216 220 0 175 6 -30 372

AECOM Cost Optimal Calculations and Gap Analysis for recast EPBD for Buildings: Additional Calculations 49
Capabilities on project:
Building Engineering
Table 5.5e: Macroeconomic Costs (Central energy price, 6% discount rate, EUR/m²)
Building Package PE
(KWh/m²)
Initial Investment
Cost
Annual Costs Cost of Emissions
Residual Value
Macro Cost Fabric Heating PV Maintenance Energy
Apartment Block
Cavity Wall – 30 year
calc
All+ GSHP 20% 73 406 4 107 5 -21 502
All GSHP 20% 77 358 4 112 6 -19 461
Roof + Wall
GSHP 20% 86
282 4 124 6 -19 398
Roof + Wall
ASHP 20% 96
238 4 139 7 -16 372
All Gas 20% 114 142 4 157 9 -4 309
Roof + Wall
Gas 20% 131
66 4 180 10 -4 257
Roof + Wall
Gas 0% 143
51 0 192 11 -4 251
Roof + Wall
Biomass 0% 162
189 0 98 3 -13 278
Wall Biomass 0% 171 187 0 104 4 -13 281
Roof Biomass 0% 207 186 0 124 4 -13 301
Apartment Block Hollow
Block Wall – 30 year
calc
All+ GSHP 20% 73 437 4 106 5 -24 529
All GSHP 20% 76 388 4 110 5 -22 486
Roof + Wall
GSHP 20% 85
312 4 123 6 -22 423
Roof + Wall
ASHP 20% 95
267 4 137 7 -19 397
All Gas 20% 112 172 4 154 9 -7 332
Roof + Wall
Gas 20% 129
96 4 177 10 -7 281
Roof + Wall
Gas 0% 141
81 0 189 11 -6 274
Roof + Wall
Biomass 0% 159
219 0 97 3 -16 303
Wall Biomass 0% 169 217 0 102 3 -16 307
Roof Biomass 0% 216 186 0 129 4 -13 307

AECOM Cost Optimal Calculations and Gap Analysis for recast EPBD for Buildings: Additional Calculations 50
Capabilities on project:
Building Engineering
Table 5.6a: Financial Costs (Central energy price, 7% discount rate, EUR/m²)
Building Package PE
(KWh/m²)
Initial Investment
Cost
Annual Costs Cost of Emissions
Residual Value
Financ. Cost Fabric Heating PV Maintenance Energy
Apartment Block
Cavity Wall – 30 year
calc
All+ GSHP 20% 73 448 4 110 - -18 545
All GSHP 20% 77 394 4 115 - -16 497
Roof + Wall
GSHP 20% 86
308 4 128 - -16 424
Roof + Wall
ASHP 20% 96
260 4 143 - -14 393
All Gas 20% 114 159 4 160 - -3 320
Roof + Wall
Gas 20% 131
73 4 183 - -3 257
Roof + Wall
Gas 0% 143
56 0 196 - -3 248
Wall Gas 0% 151 53 0 207 - -3 257
Roof Gas 0% 181 52 0 247 - -3 296
Roof Biomass 0% 207 203 0 129 - -11 320
Apartment Block Hollow
Block Wall – 30 year
calc
All+ GSHP 20% 73 484 4 109 - -20 577
All GSHP 20% 76 428 4 113 - -19 527
Roof + Wall
GSHP 20% 85
342 4 126 - -19 453
Roof + Wall
ASHP 20% 95
293 4 141 - -16 422
All Gas 20% 112 193 4 156 - -6 348
Roof + Wall
Gas 20% 129
106 4 180 - -6 285
Roof + Wall
Gas 0% 141
89 0 193 - -6 276
Wall Gas 0% 149 87 0 204 - -5 285
Roof Gas 0% 188 52 0 257 - -3 307
Roof Biomass 0% 216 203 0 134 - -11 326
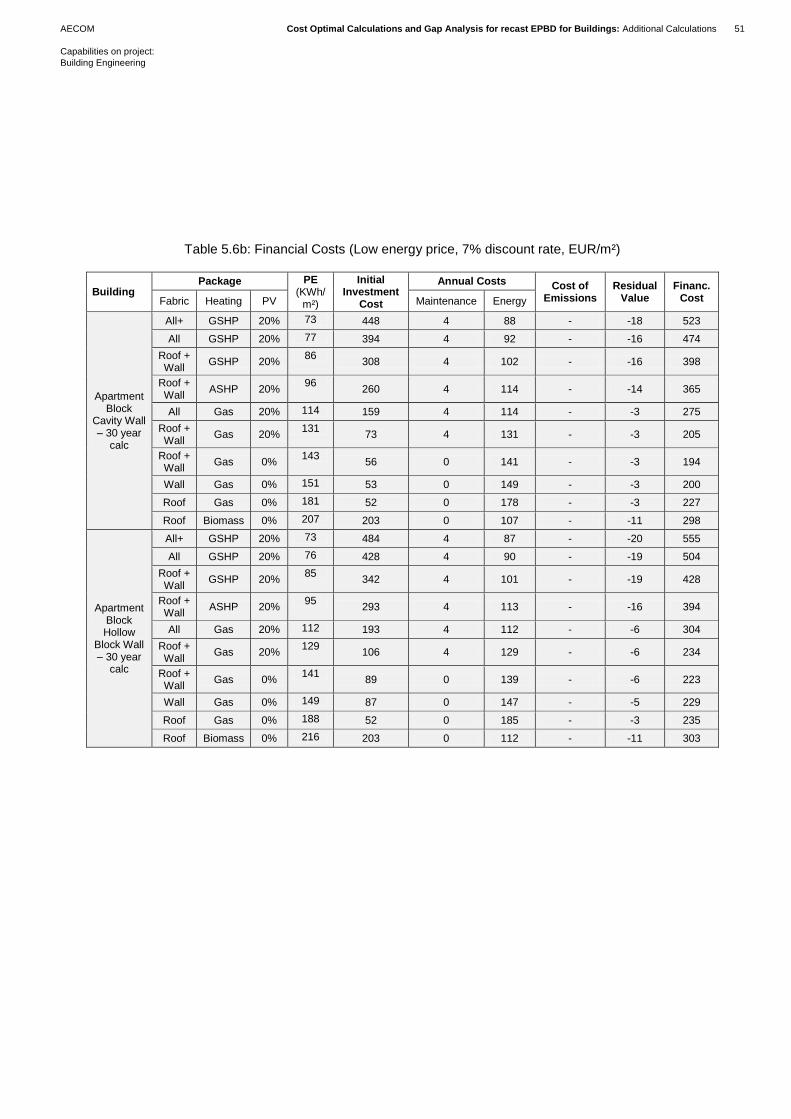
AECOM Cost Optimal Calculations and Gap Analysis for recast EPBD for Buildings: Additional Calculations 51
Capabilities on project:
Building Engineering
Table 5.6b: Financial Costs (Low energy price, 7% discount rate, EUR/m²)
Building Package PE
(KWh/m²)
Initial Investment
Cost
Annual Costs Cost of Emissions
Residual Value
Financ. Cost Fabric Heating PV Maintenance Energy
Apartment Block
Cavity Wall – 30 year
calc
All+ GSHP 20% 73 448 4 88 - -18 523
All GSHP 20% 77 394 4 92 - -16 474
Roof + Wall
GSHP 20% 86
308 4 102 - -16 398
Roof + Wall
ASHP 20% 96
260 4 114 - -14 365
All Gas 20% 114 159 4 114 - -3 275
Roof + Wall
Gas 20% 131
73 4 131 - -3 205
Roof + Wall
Gas 0% 143
56 0 141 - -3 194
Wall Gas 0% 151 53 0 149 - -3 200
Roof Gas 0% 181 52 0 178 - -3 227
Roof Biomass 0% 207 203 0 107 - -11 298
Apartment Block Hollow
Block Wall – 30 year
calc
All+ GSHP 20% 73 484 4 87 - -20 555
All GSHP 20% 76 428 4 90 - -19 504
Roof + Wall
GSHP 20% 85
342 4 101 - -19 428
Roof + Wall
ASHP 20% 95
293 4 113 - -16 394
All Gas 20% 112 193 4 112 - -6 304
Roof + Wall
Gas 20% 129
106 4 129 - -6 234
Roof + Wall
Gas 0% 141
89 0 139 - -6 223
Wall Gas 0% 149 87 0 147 - -5 229
Roof Gas 0% 188 52 0 185 - -3 235
Roof Biomass 0% 216 203 0 112 - -11 303
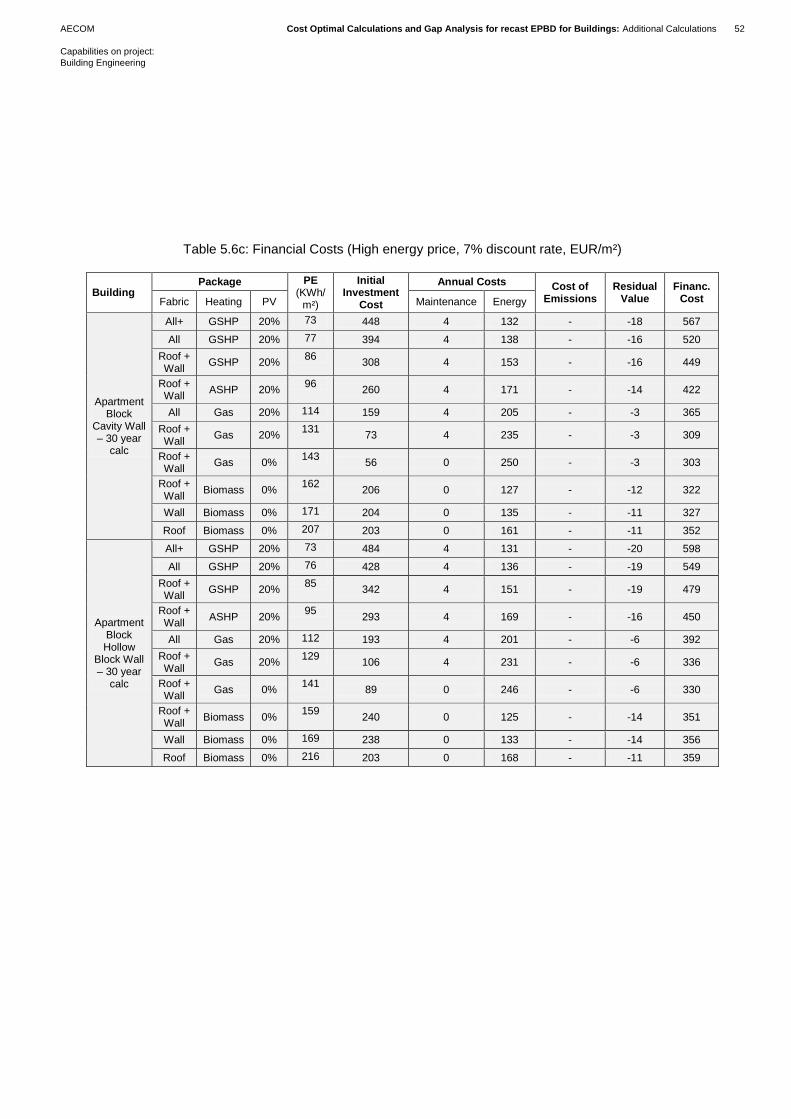
AECOM Cost Optimal Calculations and Gap Analysis for recast EPBD for Buildings: Additional Calculations 52
Capabilities on project:
Building Engineering
Table 5.6c: Financial Costs (High energy price, 7% discount rate, EUR/m²)
Building Package PE
(KWh/m²)
Initial Investment
Cost
Annual Costs Cost of Emissions
Residual Value
Financ. Cost Fabric Heating PV Maintenance Energy
Apartment Block
Cavity Wall – 30 year
calc
All+ GSHP 20% 73 448 4 132 - -18 567
All GSHP 20% 77 394 4 138 - -16 520
Roof + Wall
GSHP 20% 86
308 4 153 - -16 449
Roof + Wall
ASHP 20% 96
260 4 171 - -14 422
All Gas 20% 114 159 4 205 - -3 365
Roof + Wall
Gas 20% 131
73 4 235 - -3 309
Roof + Wall
Gas 0% 143
56 0 250 - -3 303
Roof + Wall
Biomass 0% 162
206 0 127 - -12 322
Wall Biomass 0% 171 204 0 135 - -11 327
Roof Biomass 0% 207 203 0 161 - -11 352
Apartment Block Hollow
Block Wall – 30 year
calc
All+ GSHP 20% 73 484 4 131 - -20 598
All GSHP 20% 76 428 4 136 - -19 549
Roof + Wall
GSHP 20% 85
342 4 151 - -19 479
Roof + Wall
ASHP 20% 95
293 4 169 - -16 450
All Gas 20% 112 193 4 201 - -6 392
Roof + Wall
Gas 20% 129
106 4 231 - -6 336
Roof + Wall
Gas 0% 141
89 0 246 - -6 330
Roof + Wall
Biomass 0% 159
240 0 125 - -14 351
Wall Biomass 0% 169 238 0 133 - -14 356
Roof Biomass 0% 216 203 0 168 - -11 359
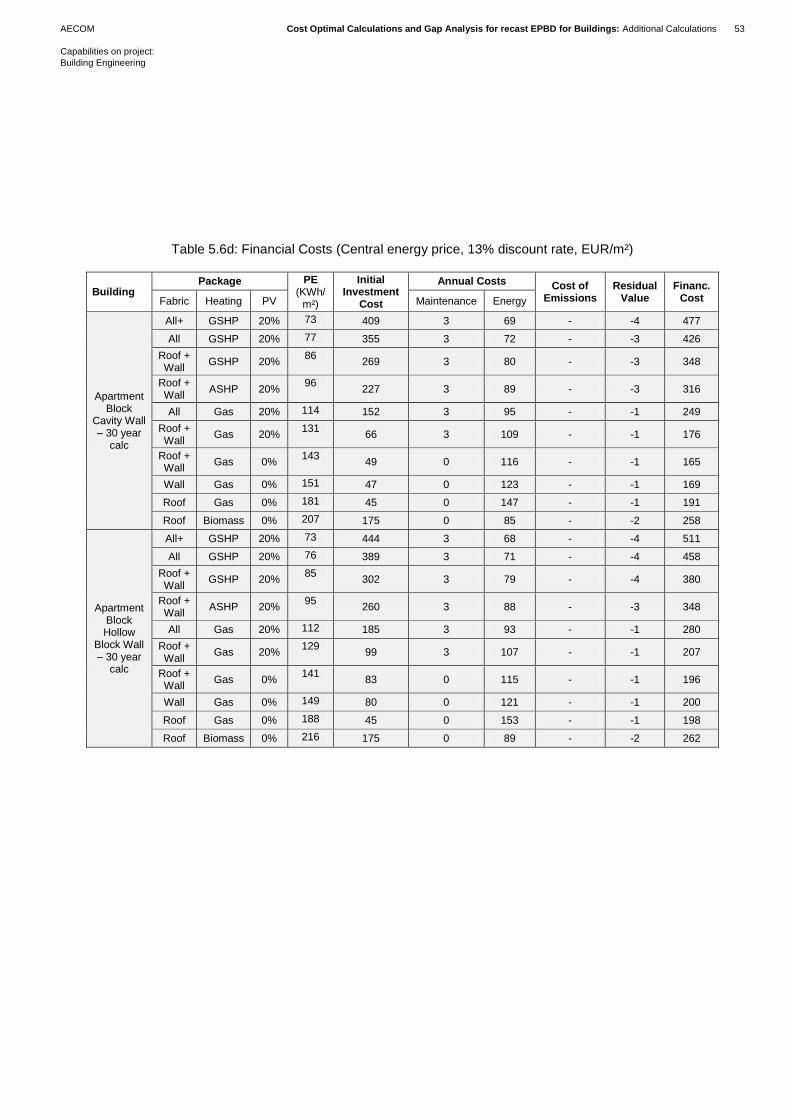
AECOM Cost Optimal Calculations and Gap Analysis for recast EPBD for Buildings: Additional Calculations 53
Capabilities on project:
Building Engineering
Table 5.6d: Financial Costs (Central energy price, 13% discount rate, EUR/m²)
Building Package PE
(KWh/m²)
Initial Investment
Cost
Annual Costs Cost of Emissions
Residual Value
Financ. Cost Fabric Heating PV Maintenance Energy
Apartment Block
Cavity Wall – 30 year
calc
All+ GSHP 20% 73 409 3 69 - -4 477
All GSHP 20% 77 355 3 72 - -3 426
Roof + Wall
GSHP 20% 86
269 3 80 - -3 348
Roof + Wall
ASHP 20% 96
227 3 89 - -3 316
All Gas 20% 114 152 3 95 - -1 249
Roof + Wall
Gas 20% 131
66 3 109 - -1 176
Roof + Wall
Gas 0% 143
49 0 116 - -1 165
Wall Gas 0% 151 47 0 123 - -1 169
Roof Gas 0% 181 45 0 147 - -1 191
Roof Biomass 0% 207 175 0 85 - -2 258
Apartment Block Hollow
Block Wall – 30 year
calc
All+ GSHP 20% 73 444 3 68 - -4 511
All GSHP 20% 76 389 3 71 - -4 458
Roof + Wall
GSHP 20% 85
302 3 79 - -4 380
Roof + Wall
ASHP 20% 95
260 3 88 - -3 348
All Gas 20% 112 185 3 93 - -1 280
Roof + Wall
Gas 20% 129
99 3 107 - -1 207
Roof + Wall
Gas 0% 141
83 0 115 - -1 196
Wall Gas 0% 149 80 0 121 - -1 200
Roof Gas 0% 188 45 0 153 - -1 198
Roof Biomass 0% 216 175 0 89 - -2 262
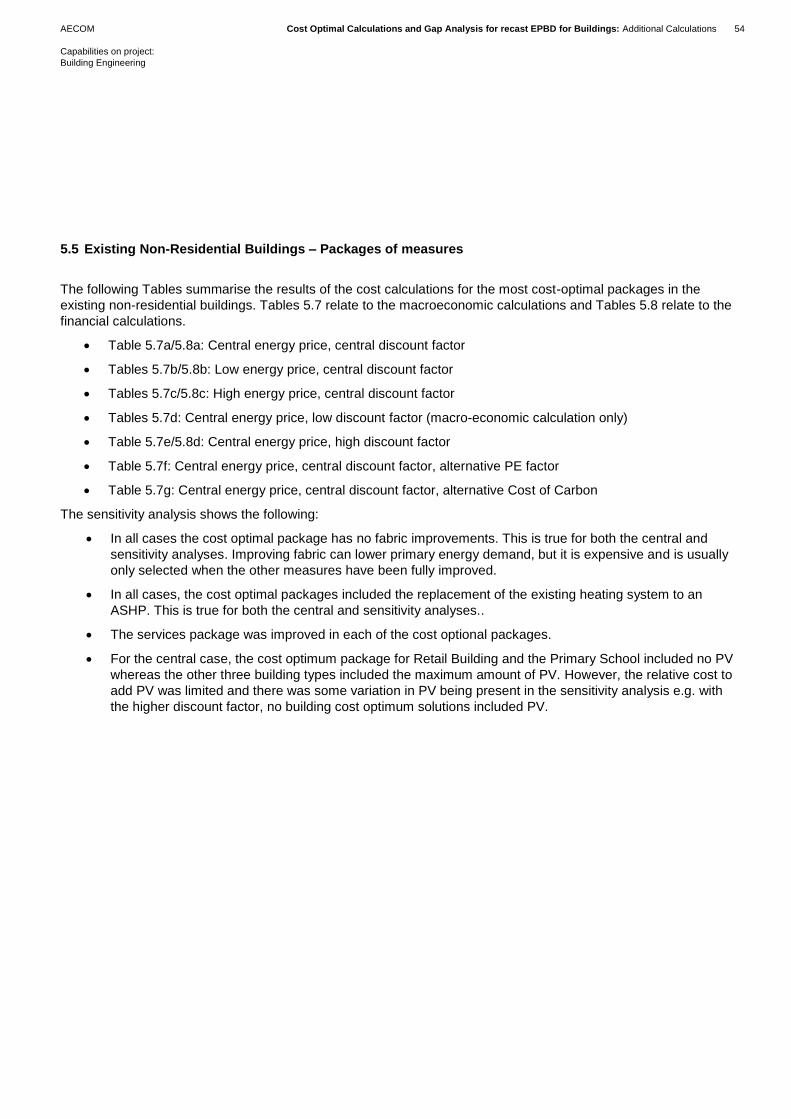
AECOM Cost Optimal Calculations and Gap Analysis for recast EPBD for Buildings: Additional Calculations 54
Capabilities on project:
Building Engineering
5.5 Existing Non-Residential Buildings – Packages of measures
The following Tables summarise the results of the cost calculations for the most cost-optimal packages in the
existing non-residential buildings. Tables 5.7 relate to the macroeconomic calculations and Tables 5.8 relate to the
financial calculations.
Table 5.7a/5.8a: Central energy price, central discount factor
Tables 5.7b/5.8b: Low energy price, central discount factor
Tables 5.7c/5.8c: High energy price, central discount factor
Tables 5.7d: Central energy price, low discount factor (macro-economic calculation only)
Table 5.7e/5.8d: Central energy price, high discount factor
Table 5.7f: Central energy price, central discount factor, alternative PE factor
Table 5.7g: Central energy price, central discount factor, alternative Cost of Carbon
The sensitivity analysis shows the following:
In all cases the cost optimal package has no fabric improvements. This is true for both the central and
sensitivity analyses. Improving fabric can lower primary energy demand, but it is expensive and is usually
only selected when the other measures have been fully improved.
In all cases, the cost optimal packages included the replacement of the existing heating system to an
ASHP. This is true for both the central and sensitivity analyses..
The services package was improved in each of the cost optional packages.
For the central case, the cost optimum package for Retail Building and the Primary School included no PV
whereas the other three building types included the maximum amount of PV. However, the relative cost to
add PV was limited and there was some variation in PV being present in the sensitivity analysis e.g. with
the higher discount factor, no building cost optimum solutions included PV.

AECOM Cost Optimal Calculations and Gap Analysis for recast EPBD for Buildings: Additional Calculations 55
Capabilities on project:
Building Engineering
Table 5.7a: Macroeconomic Costs (Central energy price, 4% discount rate, EUR/m²)
Building Package PE
(KWh/m²)
Initial Investment
Cost
Annual Costs Cost of Emissions
Residual Value
Macro Cost Fabric Heating Services PV Maintenance Energy
Retail – 20 year
calc
C ASHP 3 20% 302 240 16 504 26 -31 755
B ASHP 3 20% 302 225 16 505 26 -27 745
EE1 ASHP 3 20% 311 148 16 519 27 -5 704
EE1 ASHP 3 10% 324 122 15 535 28 -2 698
EE1 ASHP 3 0% 338* 96 13 552 29 0 691
EE1 ASHP 2 0% 359 90 13 587 31 0 722
EE1 Gas (91%) 3 0% 390 66 13 643 35 0 757
EE1 Gas (74%) 2 0% 431 49 13 711 39 0 813
EE1 Gas (74%) 1 0% 459 46 13 756 42 0 857
EE1 Gas (74%) EE1 0% 652 0 13 1072 58 0 1143
Office (NV) – 20 year
calc
B ASHP 3 20% 95 171 8 165 8 -22 331
EE1 ASHP 3 20% 124* 80 8 212 11 -2 309
EE1 ASHP 3 10% 136 67 8 227 12 -1 312
EE1 ASHP 3 0% 148 54 7 241 13 0 315
EE1 ASHP 2 0% 152 49 7 248 13 0 317
EE1 ASHP EE1 0% 227 26 7 371 20 0 423
EE1 Gas (91%) 2 0% 252 32 6 422 25 0 486
EE1 Gas (74%) 2 0% 292 23 6 491 29 0 549
EE1 Gas (91%) EE1 0% 316 9 6 527 30 0 573
EE1 Gas (74%) EE1 0% 353 0 6 588 34 0 629
Office (AC) – 20 year
calc
C ASHP 3 20% 160 258 8 271 14 -41 510
B ASHP 3 20% 161 229 8 273 14 -35 489
EE1 ASHP 3 20% 180* 92 8 304 16 -2 417
EE1 ASHP 3 10% 192 79 8 318 17 -1 420
EE1 ASHP 3 0% 203 66 7 332 18 0 423
EE1 ASHP 2 0% 220 60 7 360 19 0 445
EE1 ASHP 1 0% 243 59 7 397 21 0 484
EE1 ASHP EE1 0% 316 26 7 517 27 0 577
EE1 Gas (91%) EE1 0% 387 9 6 640 36 0 691
EE1 Gas (78%) EE1 0% 407 0 6 675 38 0 719
School (Primary)
– 30 year calc
C ASHP 3 20% 24 188 14 71 2 -22 254
B ASHP 3 20% 24 160 14 72 2 -18 231
EE1 ASHP 3 20% 35 107 14 91 4 -14 201
EE1 ASHP 3 10% 48 92 13 97 5 -11 196
EE1 ASHP 3 0% 60* 77 12 104 6 -8 190
EE1 ASHP 1 0% 65 72 12 111 6 -8 194
EE1 ASHP EE1 0% 87 43 12 151 8 -5 210
EE1 Gas (91%) 1 0% 140 40 12 240 14 -4 302
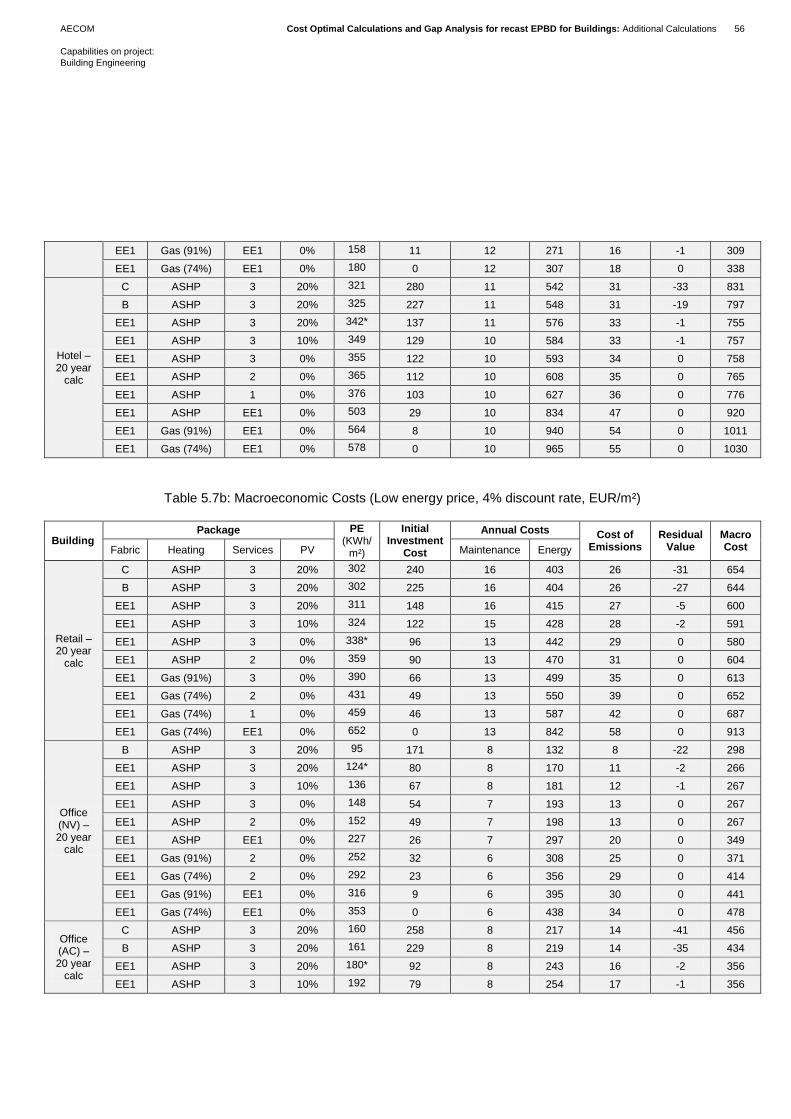
AECOM Cost Optimal Calculations and Gap Analysis for recast EPBD for Buildings: Additional Calculations 56
Capabilities on project:
Building Engineering
EE1 Gas (91%) EE1 0% 158 11 12 271 16 -1 309
EE1 Gas (74%) EE1 0% 180 0 12 307 18 0 338
Hotel – 20 year
calc
C ASHP 3 20% 321 280 11 542 31 -33 831
B ASHP 3 20% 325 227 11 548 31 -19 797
EE1 ASHP 3 20% 342* 137 11 576 33 -1 755
EE1 ASHP 3 10% 349 129 10 584 33 -1 757
EE1 ASHP 3 0% 355 122 10 593 34 0 758
EE1 ASHP 2 0% 365 112 10 608 35 0 765
EE1 ASHP 1 0% 376 103 10 627 36 0 776
EE1 ASHP EE1 0% 503 29 10 834 47 0 920
EE1 Gas (91%) EE1 0% 564 8 10 940 54 0 1011
EE1 Gas (74%) EE1 0% 578 0 10 965 55 0 1030
Table 5.7b: Macroeconomic Costs (Low energy price, 4% discount rate, EUR/m²)
Building Package PE
(KWh/m²)
Initial Investment
Cost
Annual Costs Cost of Emissions
Residual Value
Macro Cost Fabric Heating Services PV Maintenance Energy
Retail – 20 year
calc
C ASHP 3 20% 302 240 16 403 26 -31 654
B ASHP 3 20% 302 225 16 404 26 -27 644
EE1 ASHP 3 20% 311 148 16 415 27 -5 600
EE1 ASHP 3 10% 324 122 15 428 28 -2 591
EE1 ASHP 3 0% 338* 96 13 442 29 0 580
EE1 ASHP 2 0% 359 90 13 470 31 0 604
EE1 Gas (91%) 3 0% 390 66 13 499 35 0 613
EE1 Gas (74%) 2 0% 431 49 13 550 39 0 652
EE1 Gas (74%) 1 0% 459 46 13 587 42 0 687
EE1 Gas (74%) EE1 0% 652 0 13 842 58 0 913
Office (NV) – 20 year
calc
B ASHP 3 20% 95 171 8 132 8 -22 298
EE1 ASHP 3 20% 124* 80 8 170 11 -2 266
EE1 ASHP 3 10% 136 67 8 181 12 -1 267
EE1 ASHP 3 0% 148 54 7 193 13 0 267
EE1 ASHP 2 0% 152 49 7 198 13 0 267
EE1 ASHP EE1 0% 227 26 7 297 20 0 349
EE1 Gas (91%) 2 0% 252 32 6 308 25 0 371
EE1 Gas (74%) 2 0% 292 23 6 356 29 0 414
EE1 Gas (91%) EE1 0% 316 9 6 395 30 0 441
EE1 Gas (74%) EE1 0% 353 0 6 438 34 0 478
Office (AC) – 20 year
calc
C ASHP 3 20% 160 258 8 217 14 -41 456
B ASHP 3 20% 161 229 8 219 14 -35 434
EE1 ASHP 3 20% 180* 92 8 243 16 -2 356
EE1 ASHP 3 10% 192 79 8 254 17 -1 356
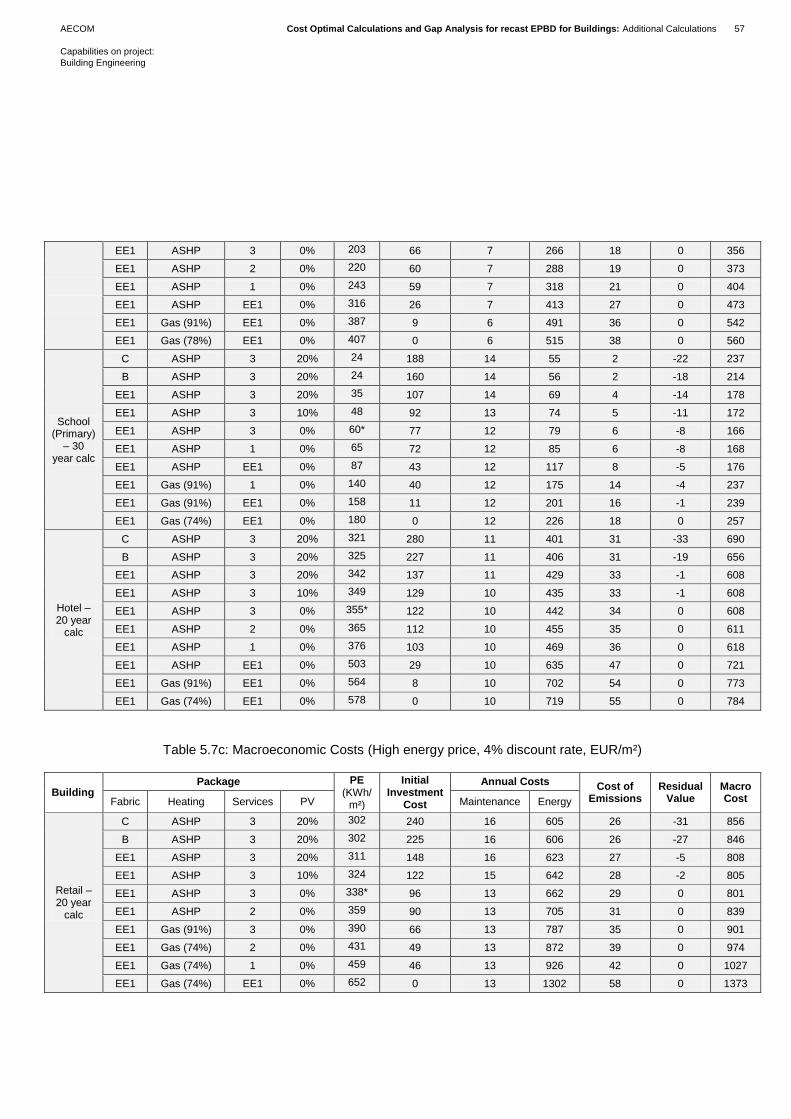
AECOM Cost Optimal Calculations and Gap Analysis for recast EPBD for Buildings: Additional Calculations 57
Capabilities on project:
Building Engineering
EE1 ASHP 3 0% 203 66 7 266 18 0 356
EE1 ASHP 2 0% 220 60 7 288 19 0 373
EE1 ASHP 1 0% 243 59 7 318 21 0 404
EE1 ASHP EE1 0% 316 26 7 413 27 0 473
EE1 Gas (91%) EE1 0% 387 9 6 491 36 0 542
EE1 Gas (78%) EE1 0% 407 0 6 515 38 0 560
School (Primary)
– 30 year calc
C ASHP 3 20% 24 188 14 55 2 -22 237
B ASHP 3 20% 24 160 14 56 2 -18 214
EE1 ASHP 3 20% 35 107 14 69 4 -14 178
EE1 ASHP 3 10% 48 92 13 74 5 -11 172
EE1 ASHP 3 0% 60* 77 12 79 6 -8 166
EE1 ASHP 1 0% 65 72 12 85 6 -8 168
EE1 ASHP EE1 0% 87 43 12 117 8 -5 176
EE1 Gas (91%) 1 0% 140 40 12 175 14 -4 237
EE1 Gas (91%) EE1 0% 158 11 12 201 16 -1 239
EE1 Gas (74%) EE1 0% 180 0 12 226 18 0 257
Hotel – 20 year
calc
C ASHP 3 20% 321 280 11 401 31 -33 690
B ASHP 3 20% 325 227 11 406 31 -19 656
EE1 ASHP 3 20% 342 137 11 429 33 -1 608
EE1 ASHP 3 10% 349 129 10 435 33 -1 608
EE1 ASHP 3 0% 355* 122 10 442 34 0 608
EE1 ASHP 2 0% 365 112 10 455 35 0 611
EE1 ASHP 1 0% 376 103 10 469 36 0 618
EE1 ASHP EE1 0% 503 29 10 635 47 0 721
EE1 Gas (91%) EE1 0% 564 8 10 702 54 0 773
EE1 Gas (74%) EE1 0% 578 0 10 719 55 0 784
Table 5.7c: Macroeconomic Costs (High energy price, 4% discount rate, EUR/m²)
Building Package PE
(KWh/m²)
Initial Investment
Cost
Annual Costs Cost of Emissions
Residual Value
Macro Cost Fabric Heating Services PV Maintenance Energy
Retail – 20 year
calc
C ASHP 3 20% 302 240 16 605 26 -31 856
B ASHP 3 20% 302 225 16 606 26 -27 846
EE1 ASHP 3 20% 311 148 16 623 27 -5 808
EE1 ASHP 3 10% 324 122 15 642 28 -2 805
EE1 ASHP 3 0% 338* 96 13 662 29 0 801
EE1 ASHP 2 0% 359 90 13 705 31 0 839
EE1 Gas (91%) 3 0% 390 66 13 787 35 0 901
EE1 Gas (74%) 2 0% 431 49 13 872 39 0 974
EE1 Gas (74%) 1 0% 459 46 13 926 42 0 1027
EE1 Gas (74%) EE1 0% 652 0 13 1302 58 0 1373
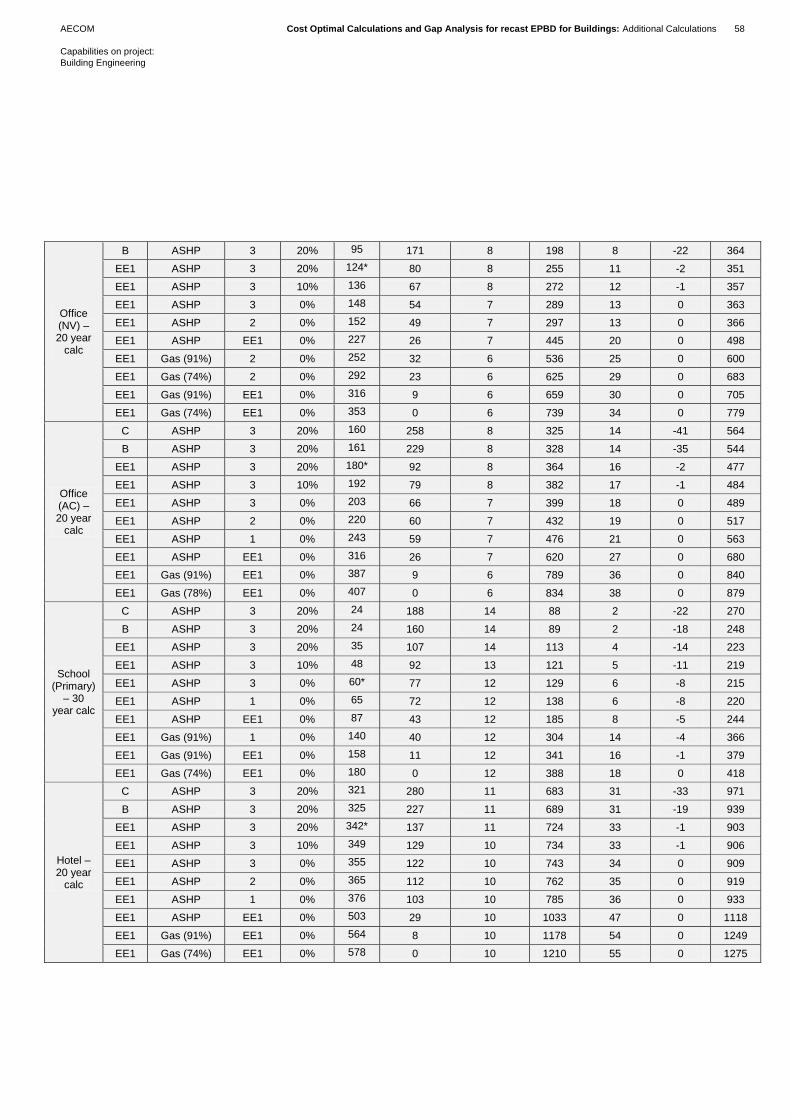
AECOM Cost Optimal Calculations and Gap Analysis for recast EPBD for Buildings: Additional Calculations 58
Capabilities on project:
Building Engineering
Office (NV) – 20 year
calc
B ASHP 3 20% 95 171 8 198 8 -22 364
EE1 ASHP 3 20% 124* 80 8 255 11 -2 351
EE1 ASHP 3 10% 136 67 8 272 12 -1 357
EE1 ASHP 3 0% 148 54 7 289 13 0 363
EE1 ASHP 2 0% 152 49 7 297 13 0 366
EE1 ASHP EE1 0% 227 26 7 445 20 0 498
EE1 Gas (91%) 2 0% 252 32 6 536 25 0 600
EE1 Gas (74%) 2 0% 292 23 6 625 29 0 683
EE1 Gas (91%) EE1 0% 316 9 6 659 30 0 705
EE1 Gas (74%) EE1 0% 353 0 6 739 34 0 779
Office (AC) – 20 year
calc
C ASHP 3 20% 160 258 8 325 14 -41 564
B ASHP 3 20% 161 229 8 328 14 -35 544
EE1 ASHP 3 20% 180* 92 8 364 16 -2 477
EE1 ASHP 3 10% 192 79 8 382 17 -1 484
EE1 ASHP 3 0% 203 66 7 399 18 0 489
EE1 ASHP 2 0% 220 60 7 432 19 0 517
EE1 ASHP 1 0% 243 59 7 476 21 0 563
EE1 ASHP EE1 0% 316 26 7 620 27 0 680
EE1 Gas (91%) EE1 0% 387 9 6 789 36 0 840
EE1 Gas (78%) EE1 0% 407 0 6 834 38 0 879
School (Primary)
– 30 year calc
C ASHP 3 20% 24 188 14 88 2 -22 270
B ASHP 3 20% 24 160 14 89 2 -18 248
EE1 ASHP 3 20% 35 107 14 113 4 -14 223
EE1 ASHP 3 10% 48 92 13 121 5 -11 219
EE1 ASHP 3 0% 60* 77 12 129 6 -8 215
EE1 ASHP 1 0% 65 72 12 138 6 -8 220
EE1 ASHP EE1 0% 87 43 12 185 8 -5 244
EE1 Gas (91%) 1 0% 140 40 12 304 14 -4 366
EE1 Gas (91%) EE1 0% 158 11 12 341 16 -1 379
EE1 Gas (74%) EE1 0% 180 0 12 388 18 0 418
Hotel – 20 year
calc
C ASHP 3 20% 321 280 11 683 31 -33 971
B ASHP 3 20% 325 227 11 689 31 -19 939
EE1 ASHP 3 20% 342* 137 11 724 33 -1 903
EE1 ASHP 3 10% 349 129 10 734 33 -1 906
EE1 ASHP 3 0% 355 122 10 743 34 0 909
EE1 ASHP 2 0% 365 112 10 762 35 0 919
EE1 ASHP 1 0% 376 103 10 785 36 0 933
EE1 ASHP EE1 0% 503 29 10 1033 47 0 1118
EE1 Gas (91%) EE1 0% 564 8 10 1178 54 0 1249
EE1 Gas (74%) EE1 0% 578 0 10 1210 55 0 1275
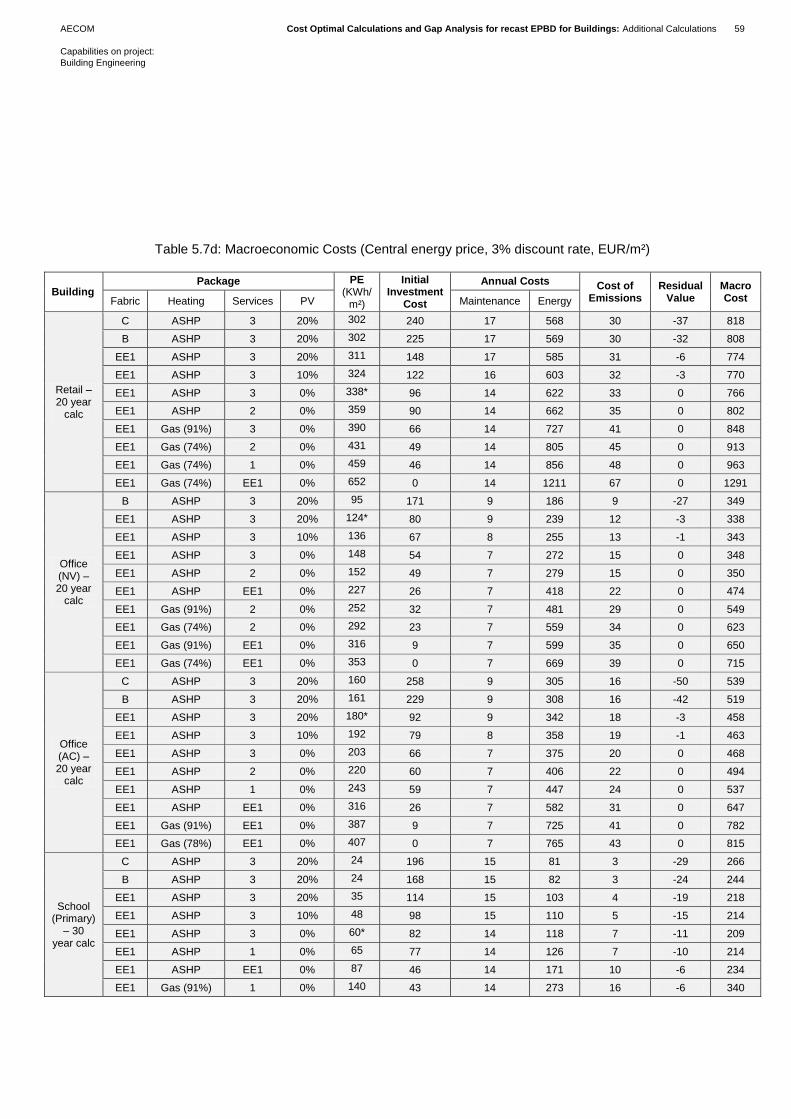
AECOM Cost Optimal Calculations and Gap Analysis for recast EPBD for Buildings: Additional Calculations 59
Capabilities on project:
Building Engineering
Table 5.7d: Macroeconomic Costs (Central energy price, 3% discount rate, EUR/m²)
Building Package PE
(KWh/m²)
Initial Investment
Cost
Annual Costs Cost of Emissions
Residual Value
Macro Cost Fabric Heating Services PV Maintenance Energy
Retail – 20 year
calc
C ASHP 3 20% 302 240 17 568 30 -37 818
B ASHP 3 20% 302 225 17 569 30 -32 808
EE1 ASHP 3 20% 311 148 17 585 31 -6 774
EE1 ASHP 3 10% 324 122 16 603 32 -3 770
EE1 ASHP 3 0% 338* 96 14 622 33 0 766
EE1 ASHP 2 0% 359 90 14 662 35 0 802
EE1 Gas (91%) 3 0% 390 66 14 727 41 0 848
EE1 Gas (74%) 2 0% 431 49 14 805 45 0 913
EE1 Gas (74%) 1 0% 459 46 14 856 48 0 963
EE1 Gas (74%) EE1 0% 652 0 14 1211 67 0 1291
Office (NV) – 20 year
calc
B ASHP 3 20% 95 171 9 186 9 -27 349
EE1 ASHP 3 20% 124* 80 9 239 12 -3 338
EE1 ASHP 3 10% 136 67 8 255 13 -1 343
EE1 ASHP 3 0% 148 54 7 272 15 0 348
EE1 ASHP 2 0% 152 49 7 279 15 0 350
EE1 ASHP EE1 0% 227 26 7 418 22 0 474
EE1 Gas (91%) 2 0% 252 32 7 481 29 0 549
EE1 Gas (74%) 2 0% 292 23 7 559 34 0 623
EE1 Gas (91%) EE1 0% 316 9 7 599 35 0 650
EE1 Gas (74%) EE1 0% 353 0 7 669 39 0 715
Office (AC) – 20 year
calc
C ASHP 3 20% 160 258 9 305 16 -50 539
B ASHP 3 20% 161 229 9 308 16 -42 519
EE1 ASHP 3 20% 180* 92 9 342 18 -3 458
EE1 ASHP 3 10% 192 79 8 358 19 -1 463
EE1 ASHP 3 0% 203 66 7 375 20 0 468
EE1 ASHP 2 0% 220 60 7 406 22 0 494
EE1 ASHP 1 0% 243 59 7 447 24 0 537
EE1 ASHP EE1 0% 316 26 7 582 31 0 647
EE1 Gas (91%) EE1 0% 387 9 7 725 41 0 782
EE1 Gas (78%) EE1 0% 407 0 7 765 43 0 815
School (Primary)
– 30 year calc
C ASHP 3 20% 24 196 15 81 3 -29 266
B ASHP 3 20% 24 168 15 82 3 -24 244
EE1 ASHP 3 20% 35 114 15 103 4 -19 218
EE1 ASHP 3 10% 48 98 15 110 5 -15 214
EE1 ASHP 3 0% 60* 82 14 118 7 -11 209
EE1 ASHP 1 0% 65 77 14 126 7 -10 214
EE1 ASHP EE1 0% 87 46 14 171 10 -6 234
EE1 Gas (91%) 1 0% 140 43 14 273 16 -6 340
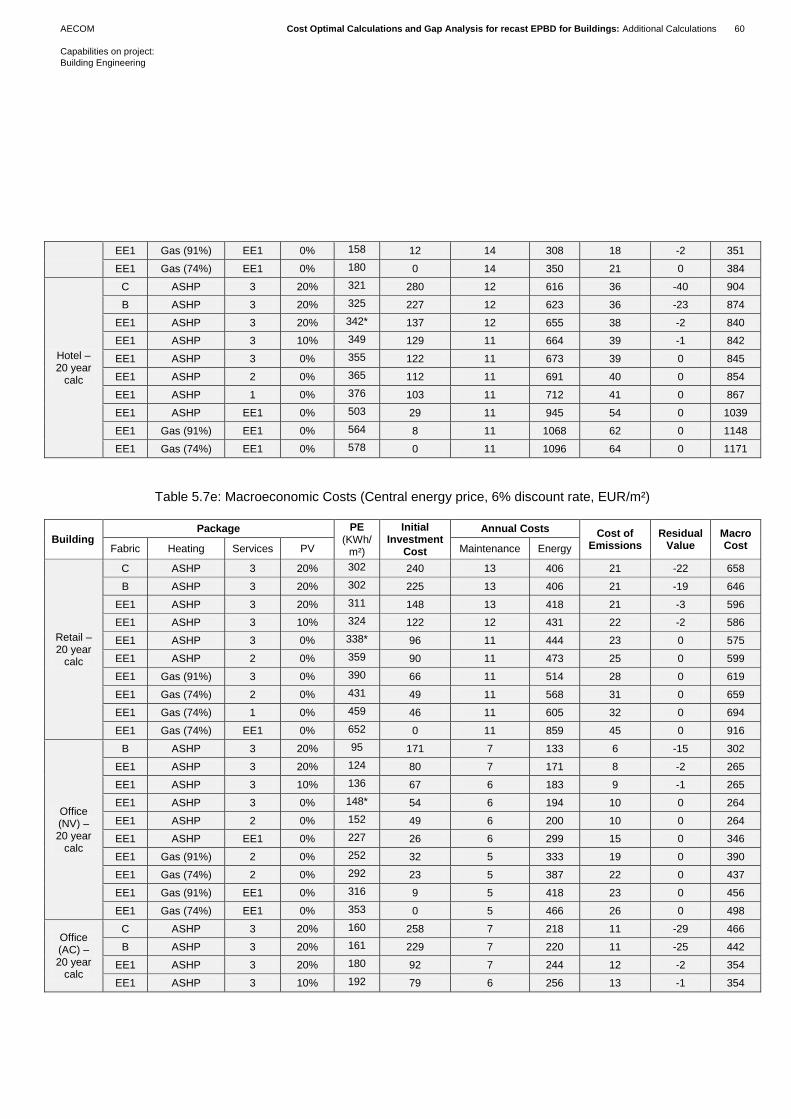
AECOM Cost Optimal Calculations and Gap Analysis for recast EPBD for Buildings: Additional Calculations 60
Capabilities on project:
Building Engineering
EE1 Gas (91%) EE1 0% 158 12 14 308 18 -2 351
EE1 Gas (74%) EE1 0% 180 0 14 350 21 0 384
Hotel – 20 year
calc
C ASHP 3 20% 321 280 12 616 36 -40 904
B ASHP 3 20% 325 227 12 623 36 -23 874
EE1 ASHP 3 20% 342* 137 12 655 38 -2 840
EE1 ASHP 3 10% 349 129 11 664 39 -1 842
EE1 ASHP 3 0% 355 122 11 673 39 0 845
EE1 ASHP 2 0% 365 112 11 691 40 0 854
EE1 ASHP 1 0% 376 103 11 712 41 0 867
EE1 ASHP EE1 0% 503 29 11 945 54 0 1039
EE1 Gas (91%) EE1 0% 564 8 11 1068 62 0 1148
EE1 Gas (74%) EE1 0% 578 0 11 1096 64 0 1171
Table 5.7e: Macroeconomic Costs (Central energy price, 6% discount rate, EUR/m²)
Building Package PE
(KWh/m²)
Initial Investment
Cost
Annual Costs Cost of Emissions
Residual Value
Macro Cost Fabric Heating Services PV Maintenance Energy
Retail – 20 year
calc
C ASHP 3 20% 302 240 13 406 21 -22 658
B ASHP 3 20% 302 225 13 406 21 -19 646
EE1 ASHP 3 20% 311 148 13 418 21 -3 596
EE1 ASHP 3 10% 324 122 12 431 22 -2 586
EE1 ASHP 3 0% 338* 96 11 444 23 0 575
EE1 ASHP 2 0% 359 90 11 473 25 0 599
EE1 Gas (91%) 3 0% 390 66 11 514 28 0 619
EE1 Gas (74%) 2 0% 431 49 11 568 31 0 659
EE1 Gas (74%) 1 0% 459 46 11 605 32 0 694
EE1 Gas (74%) EE1 0% 652 0 11 859 45 0 916
Office (NV) – 20 year
calc
B ASHP 3 20% 95 171 7 133 6 -15 302
EE1 ASHP 3 20% 124 80 7 171 8 -2 265
EE1 ASHP 3 10% 136 67 6 183 9 -1 265
EE1 ASHP 3 0% 148* 54 6 194 10 0 264
EE1 ASHP 2 0% 152 49 6 200 10 0 264
EE1 ASHP EE1 0% 227 26 6 299 15 0 346
EE1 Gas (91%) 2 0% 252 32 5 333 19 0 390
EE1 Gas (74%) 2 0% 292 23 5 387 22 0 437
EE1 Gas (91%) EE1 0% 316 9 5 418 23 0 456
EE1 Gas (74%) EE1 0% 353 0 5 466 26 0 498
Office (AC) – 20 year
calc
C ASHP 3 20% 160 258 7 218 11 -29 466
B ASHP 3 20% 161 229 7 220 11 -25 442
EE1 ASHP 3 20% 180 92 7 244 12 -2 354
EE1 ASHP 3 10% 192 79 6 256 13 -1 354

AECOM Cost Optimal Calculations and Gap Analysis for recast EPBD for Buildings: Additional Calculations 61
Capabilities on project:
Building Engineering
EE1 ASHP 3 0% 203* 66 6 268 14 0 353
EE1 ASHP 2 0% 220 60 6 290 15 0 370
EE1 ASHP 1 0% 243 59 6 320 17 0 401
EE1 ASHP EE1 0% 316 26 6 416 22 0 469
EE1 Gas (91%) EE1 0% 387 9 5 510 28 0 553
EE1 Gas (78%) EE1 0% 407 0 5 538 29 0 573
School (Primary)
– 30 year calc
C ASHP 3 20% 24 178 11 57 2 -12 235
B ASHP 3 20% 24 150 11 58 2 -10 210
EE1 ASHP 3 20% 35 96 11 72 3 -8 174
EE1 ASHP 3 10% 48 82 11 78 4 -6 168
EE1 ASHP 3 0% 60* 69 10 83 5 -5 161
EE1 ASHP 1 0% 65 65 10 89 5 -5 164
EE1 ASHP EE1 0% 87 39 10 121 6 -3 173
EE1 Gas (91%) 1 0% 140 36 10 189 11 -3 243
EE1 Gas (91%) EE1 0% 158 10 10 215 12 -1 246
EE1 Gas (74%) EE1 0% 180 0 10 243 14 0 267
Hotel – 20 year
calc
C ASHP 3 20% 321 280 9 429 24 -23 719
B ASHP 3 20% 325 227 9 434 24 -13 680
EE1 ASHP 3 20% 342 137 9 457 25 -1 627
EE1 ASHP 3 10% 349 129 9 463 26 0 627
EE1 ASHP 3 0% 355* 122 8 470 26 0 626
EE1 ASHP 2 0% 365 112 8 483 27 0 629
EE1 ASHP 1 0% 376 103 8 498 28 0 636
EE1 ASHP EE1 0% 503 29 8 664 36 0 738
EE1 Gas (91%) EE1 0% 564 8 8 745 41 0 803
EE1 Gas (74%) EE1 0% 578 0 8 765 43 0 816
Table 5.7f: Macroeconomic Costs (Central energy price, 4% discount rate, Alternative PEF, EUR/m²)
Building Package PE
(KWh/m²)
Initial Investment
Cost
Annual Costs Cost of Emissions
Residual Value
Macro Cost Fabric Heating Services PV Maintenance Energy
Retail – 20 year
calc
C ASHP 3 20% 329 240 16 504 30 -31 759
B ASHP 3 20% 330 225 16 505 31 -27 749
EE1 ASHP 3 20% 339 148 16 519 31 -5 709
EE1 ASHP 3 10% 354 122 15 535 33 -2 702
EE1 ASHP 3 0% 368* 96 13 552 34 0 695
EE1 ASHP 2 0% 392 90 13 587 36 0 727
EE1 Gas (91%) 3 0% 417 66 13 643 40 0 761
EE1 Gas (74%) 2 0% 460 49 13 711 44 0 817
EE1 Gas (74%) 1 0% 491 46 13 756 47 0 862
EE1 Gas (74%) EE1 0% 703 0 13 1072 66 0 1151

AECOM Cost Optimal Calculations and Gap Analysis for recast EPBD for Buildings: Additional Calculations 62
Capabilities on project:
Building Engineering
Office (NV) – 20 year
calc
B ASHP 3 20% 104 171 8 165 10 -22 332
EE1 ASHP 3 20% 135* 80 8 212 13 -2 311
EE1 ASHP 2 20% 140 75 8 219 13 -2 312
EE1 ASHP 3 0% 161 54 7 241 15 0 317
EE1 ASHP 2 0% 165 49 7 248 15 0 319
EE1 ASHP 1 0% 171 49 7 255 16 0 327
EE1 ASHP EE1 0% 248 26 7 371 23 0 427
EE1 Gas (74%) 2 0% 299 23 6 491 30 0 550
EE1 Gas (91%) EE1 0% 331 9 6 527 32 0 575
EE1 Gas (74%) EE1 0% 367 0 6 588 36 0 631
Office (AC) – 20 year
calc
C ASHP 3 20% 175 258 8 271 16 -41 512
B ASHP 3 20% 176 229 8 273 16 -35 492
EE1 ASHP 3 20% 196* 92 8 304 18 -2 419
EE1 ASHP 3 10% 209 79 8 318 19 -1 423
EE1 ASHP 3 0% 222 66 7 332 21 0 426
EE1 ASHP 2 0% 240 60 7 360 22 0 448
EE1 ASHP 1 0% 265 59 7 397 25 0 487
EE1 ASHP EE1 0% 345 26 7 517 32 0 581
EE1 Gas (91%) EE1 0% 411 9 6 640 39 0 695
EE1 Gas (78%) EE1 0% 431 0 6 675 42 0 723
School (Primary)
– 30 year calc
C ASHP 3 20% 25 188 14 71 2 -22 254
B ASHP 3 20% 26 160 14 72 3 -18 231
EE1 ASHP 3 20% 37 107 14 91 4 -14 201
EE1 ASHP 3 10% 51 92 13 97 5 -11 196
EE1 ASHP 2 0% 68* 73 12 107 7 -8 192
EE1 ASHP 1 0% 70 72 12 111 7 -8 195
EE1 ASHP EE1 0% 96 43 12 151 9 -5 211
B Gas (91%) EE1 0% 123 65 12 197 12 -5 281
EE1 Gas (91%) EE1 0% 167 11 12 271 17 -1 310
EE1 Gas (74%) EE1 0% 189 0 12 307 19 0 339
Hotel – 20 year
calc
C ASHP 3 20% 333 280 11 542 33 -33 833
B ASHP 3 20% 337 227 11 548 33 -19 799
EE1 ASHP 3 20% 356* 137 11 576 35 -1 757
EE1 ASHP 3 10% 363 129 10 584 36 -1 759
EE1 ASHP 3 0% 370 122 10 593 36 0 761
EE1 ASHP 2 0% 381 112 10 608 37 0 767
EE1 ASHP 1 0% 393 103 10 627 39 0 778
EE1 ASHP EE1 0% 531 29 10 834 51 0 924
EE1 Gas (91%) EE1 0% 588 8 10 940 58 0 1015
EE1 Gas (74%) EE1 0% 603 0 10 965 59 0 1034

AECOM Cost Optimal Calculations and Gap Analysis for recast EPBD for Buildings: Additional Calculations 63
Capabilities on project:
Building Engineering
Table 5.7g: Macroeconomic Costs (Central energy price, 4% discount rate, Alternative Cost of Carbon, EUR/m²)
Building Package PE
(KWh/m²)
Initial Investment
Cost
Annual Costs Cost of Emissions
Residual Value
Macro Cost Fabric Heating Services PV Maintenance Energy
Retail – 20 year
calc
C ASHP 3 20% 302 240 16 504 17 -31 746
B ASHP 3 20% 302 225 16 505 17 -27 736
EE1 ASHP 3 20% 311 148 16 519 18 -5 695
EE1 ASHP 3 10% 324 122 15 535 19 -2 688
EE1 ASHP 3 0% 338* 96 13 552 19 0 681
EE1 ASHP 2 0% 359 90 13 587 21 0 711
EE1 Gas (91%) 3 0% 390 66 13 643 24 0 746
EE1 Gas (74%) 2 0% 431 49 13 711 26 0 800
EE1 Gas (74%) 1 0% 459 46 13 756 28 0 843
EE1 Gas (74%) EE1 0% 652 0 13 1072 39 0 1124
Office (NV) – 20 year
calc
B ASHP 3 20% 95 171 8 165 5 -22 328
EE1 ASHP 3 20% 124* 80 8 212 7 -2 305
EE1 ASHP 3 10% 136 67 8 227 8 -1 308
EE1 ASHP 3 0% 148 54 7 241 8 0 310
EE1 ASHP 2 0% 152 49 7 248 9 0 312
EE1 ASHP EE1 0% 227 26 7 371 13 0 417
EE1 Gas (91%) 2 0% 252 32 6 422 17 0 478
EE1 Gas (74%) 2 0% 292 23 6 491 20 0 540
EE1 Gas (91%) EE1 0% 316 9 6 527 20 0 563
EE1 Gas (74%) EE1 0% 353 0 6 588 23 0 618
Office (AC) – 20 year
calc
C ASHP 3 20% 160 258 8 271 9 -41 505
B ASHP 3 20% 161 229 8 273 9 -35 484
EE1 ASHP 3 20% 180* 92 8 304 10 -2 411
EE1 ASHP 3 10% 192 79 8 318 11 -1 414
EE1 ASHP 3 0% 203 66 7 332 12 0 417
EE1 ASHP 2 0% 220 60 7 360 13 0 439
EE1 ASHP 1 0% 243 59 7 397 14 0 476
EE1 ASHP EE1 0% 316 26 7 517 18 0 567
EE1 Gas (91%) EE1 0% 387 9 6 640 24 0 680
EE1 Gas (78%) EE1 0% 407 0 6 675 25 0 707
School (Primary)
– 30 year calc
C ASHP 3 20% 24 188 14 71 2 -22 253
B ASHP 3 20% 24 160 14 72 2 -18 230
EE1 ASHP 3 20% 35 107 14 91 2 -14 200
EE1 ASHP 3 10% 48 92 13 97 3 -11 194
EE1 ASHP 3 0% 60* 77 12 104 4 -8 189
EE1 ASHP 1 0% 65 72 12 111 4 -8 192
EE1 ASHP EE1 0% 87 43 12 151 6 -5 207
EE1 Gas (91%) 1 0% 140 40 12 240 10 -4 297
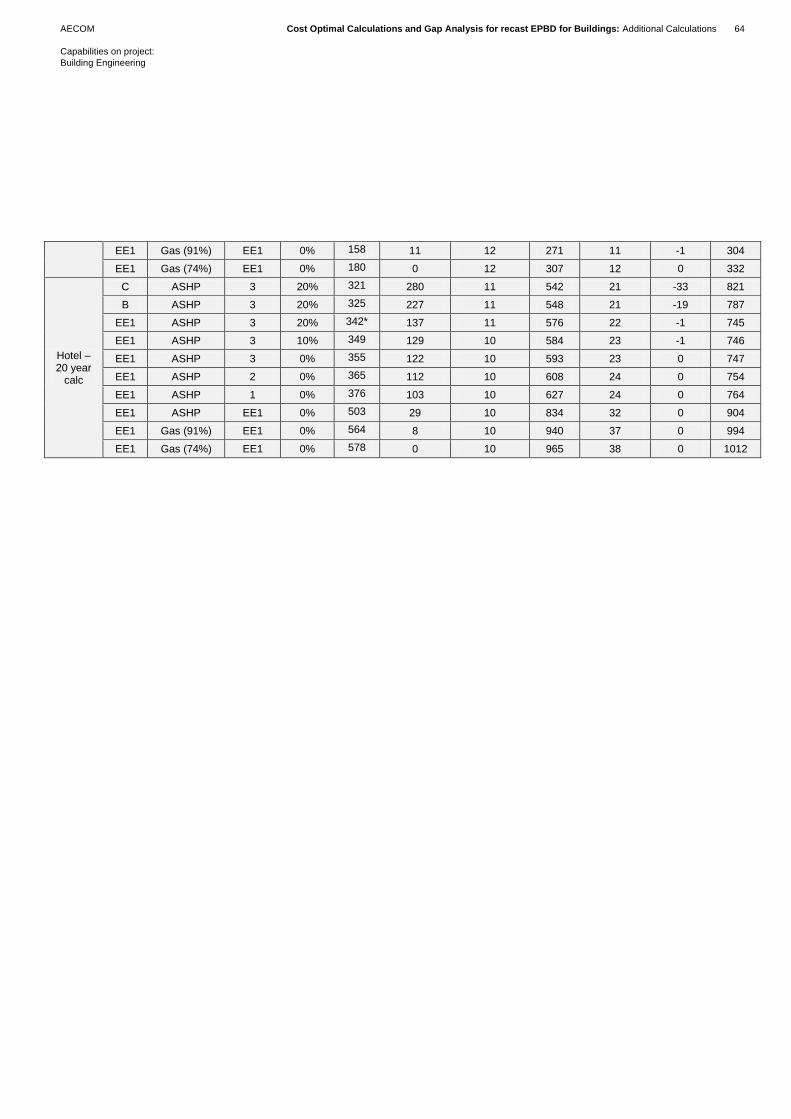
AECOM Cost Optimal Calculations and Gap Analysis for recast EPBD for Buildings: Additional Calculations 64
Capabilities on project:
Building Engineering
EE1 Gas (91%) EE1 0% 158 11 12 271 11 -1 304
EE1 Gas (74%) EE1 0% 180 0 12 307 12 0 332
Hotel – 20 year
calc
C ASHP 3 20% 321 280 11 542 21 -33 821
B ASHP 3 20% 325 227 11 548 21 -19 787
EE1 ASHP 3 20% 342* 137 11 576 22 -1 745
EE1 ASHP 3 10% 349 129 10 584 23 -1 746
EE1 ASHP 3 0% 355 122 10 593 23 0 747
EE1 ASHP 2 0% 365 112 10 608 24 0 754
EE1 ASHP 1 0% 376 103 10 627 24 0 764
EE1 ASHP EE1 0% 503 29 10 834 32 0 904
EE1 Gas (91%) EE1 0% 564 8 10 940 37 0 994
EE1 Gas (74%) EE1 0% 578 0 10 965 38 0 1012

AECOM Cost Optimal Calculations and Gap Analysis for recast EPBD for Buildings: Additional Calculations 65
Capabilities on project:
Building Engineering
Table 5.8a: Financial Costs (Central energy price, 7% discount rate, EUR/m²)
Building Package PE
(KWh/m²)
Initial Investment
Cost
Annual Costs Cost of Emissions
Residual Value
Macro Cost Fabric Heating Services PV Maintenance Energy
Retail – 20 year
calc
C ASHP 3 20% 302 273 12 418 - -21 682
B ASHP 3 20% 302 255 12 418 - -18 668
EE1 ASHP 3 20% 311 168 12 430 - -3 606
EE1 ASHP 3 10% 324 138 12 443 - -2 592
EE1 ASHP 3 0% 338* 109 10 457 - 0 577
EE1 ASHP 2 0% 359 103 10 486 - 0 599
EE1 Gas (91%) 3 0% 390 75 10 527 - 0 612
EE1 Gas (74%) 2 0% 431 56 10 583 - 0 649
EE1 Gas (74%) 1 0% 459 52 10 620 - 0 683
EE1 Gas (74%) EE1 0% 652 0 10 882 - 0 893
Office (NV) – 20 year
calc
B ASHP 3 20% 95 194 6 137 - -15 323
EE1 ASHP 3 20% 124 91 6 176 - -2 272
EE1 ASHP 3 10% 136 76 6 188 - -1 269
EE1 ASHP 3 0% 148 62 5 200 - 0 267
EE1 ASHP 2 0% 152* 56 5 205 - 0 266
EE1 ASHP EE1 0% 227 30 5 307 - 0 342
EE1 Gas (91%) 2 0% 252 36 5 340 - 0 381
EE1 Gas (74%) 2 0% 292 26 5 394 - 0 425
EE1 Gas (91%) EE1 0% 316 11 5 428 - 0 443
EE1 Gas (74%) EE1 0% 353 0 5 476 - 0 481
Office (AC) – 20 year
calc
C ASHP 3 20% 160 293 6 224 - -27 497
B ASHP 3 20% 161 260 6 226 - -23 469
EE1 ASHP 3 20% 180 104 6 252 - -2 360
EE1 ASHP 3 10% 192 89 6 263 - -1 358
EE1 ASHP 3 0% 203* 75 5 275 - 0 355
EE1 ASHP 2 0% 220 68 5 298 - 0 371
EE1 ASHP 1 0% 243 67 5 329 - 0 401
EE1 ASHP EE1 0% 316 30 5 428 - 0 463
EE1 Gas (91%) EE1 0% 387 11 5 523 - 0 539
EE1 Gas (78%) EE1 0% 407 0 5 551 - 0 556
School (Primary)
– 30 year calc
C ASHP 3 20% 24 197 10 58 - -11 255
B ASHP 3 20% 24 166 10 59 - -9 226
EE1 ASHP 3 20% 35 104 10 74 - -7 181
EE1 ASHP 3 10% 48 90 10 79 - -6 173
EE1 ASHP 3 0% 60* 75 9 85 - -4 165
EE1 ASHP 1 0% 65 71 9 91 - -4 166
EE1 ASHP EE1 0% 87 42 9 124 - -2 173
EE1 Gas (91%) 1 0% 140 39 9 193 - -2 239
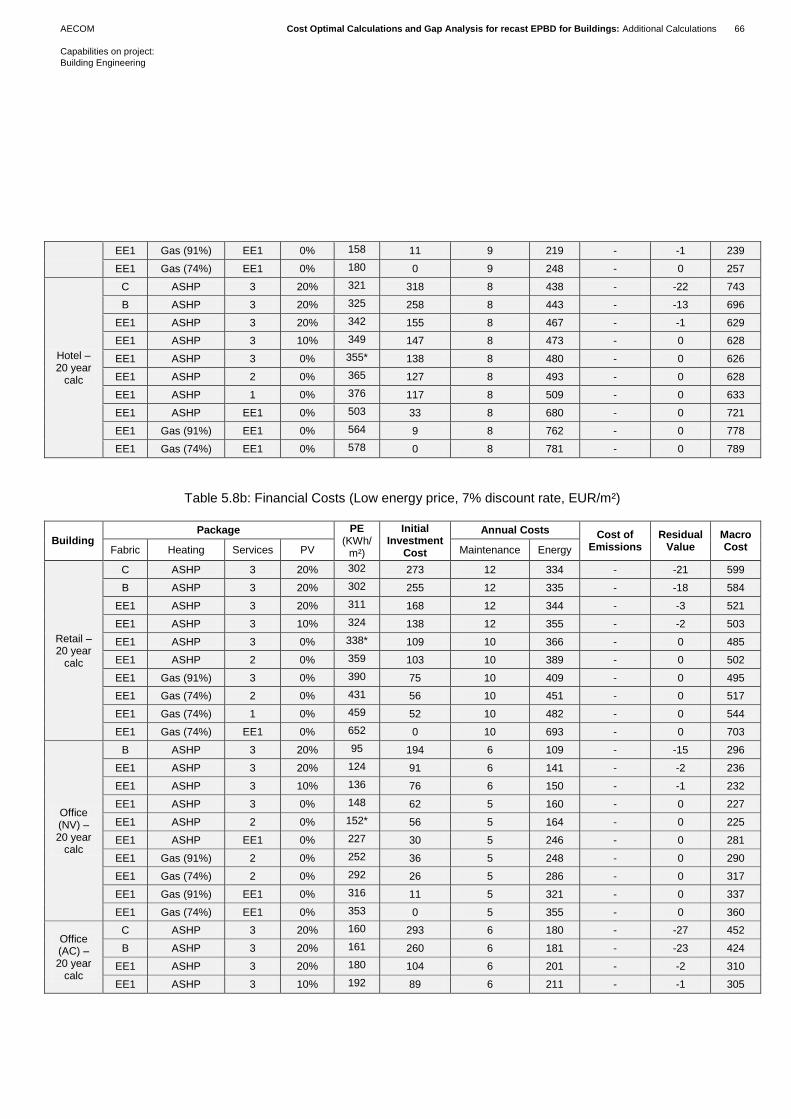
AECOM Cost Optimal Calculations and Gap Analysis for recast EPBD for Buildings: Additional Calculations 66
Capabilities on project:
Building Engineering
EE1 Gas (91%) EE1 0% 158 11 9 219 - -1 239
EE1 Gas (74%) EE1 0% 180 0 9 248 - 0 257
Hotel – 20 year
calc
C ASHP 3 20% 321 318 8 438 - -22 743
B ASHP 3 20% 325 258 8 443 - -13 696
EE1 ASHP 3 20% 342 155 8 467 - -1 629
EE1 ASHP 3 10% 349 147 8 473 - 0 628
EE1 ASHP 3 0% 355* 138 8 480 - 0 626
EE1 ASHP 2 0% 365 127 8 493 - 0 628
EE1 ASHP 1 0% 376 117 8 509 - 0 633
EE1 ASHP EE1 0% 503 33 8 680 - 0 721
EE1 Gas (91%) EE1 0% 564 9 8 762 - 0 778
EE1 Gas (74%) EE1 0% 578 0 8 781 - 0 789
Table 5.8b: Financial Costs (Low energy price, 7% discount rate, EUR/m²)
Building Package PE
(KWh/m²)
Initial Investment
Cost
Annual Costs Cost of Emissions
Residual Value
Macro Cost Fabric Heating Services PV Maintenance Energy
Retail – 20 year
calc
C ASHP 3 20% 302 273 12 334 - -21 599
B ASHP 3 20% 302 255 12 335 - -18 584
EE1 ASHP 3 20% 311 168 12 344 - -3 521
EE1 ASHP 3 10% 324 138 12 355 - -2 503
EE1 ASHP 3 0% 338* 109 10 366 - 0 485
EE1 ASHP 2 0% 359 103 10 389 - 0 502
EE1 Gas (91%) 3 0% 390 75 10 409 - 0 495
EE1 Gas (74%) 2 0% 431 56 10 451 - 0 517
EE1 Gas (74%) 1 0% 459 52 10 482 - 0 544
EE1 Gas (74%) EE1 0% 652 0 10 693 - 0 703
Office (NV) – 20 year
calc
B ASHP 3 20% 95 194 6 109 - -15 296
EE1 ASHP 3 20% 124 91 6 141 - -2 236
EE1 ASHP 3 10% 136 76 6 150 - -1 232
EE1 ASHP 3 0% 148 62 5 160 - 0 227
EE1 ASHP 2 0% 152* 56 5 164 - 0 225
EE1 ASHP EE1 0% 227 30 5 246 - 0 281
EE1 Gas (91%) 2 0% 252 36 5 248 - 0 290
EE1 Gas (74%) 2 0% 292 26 5 286 - 0 317
EE1 Gas (91%) EE1 0% 316 11 5 321 - 0 337
EE1 Gas (74%) EE1 0% 353 0 5 355 - 0 360
Office (AC) – 20 year
calc
C ASHP 3 20% 160 293 6 180 - -27 452
B ASHP 3 20% 161 260 6 181 - -23 424
EE1 ASHP 3 20% 180 104 6 201 - -2 310
EE1 ASHP 3 10% 192 89 6 211 - -1 305
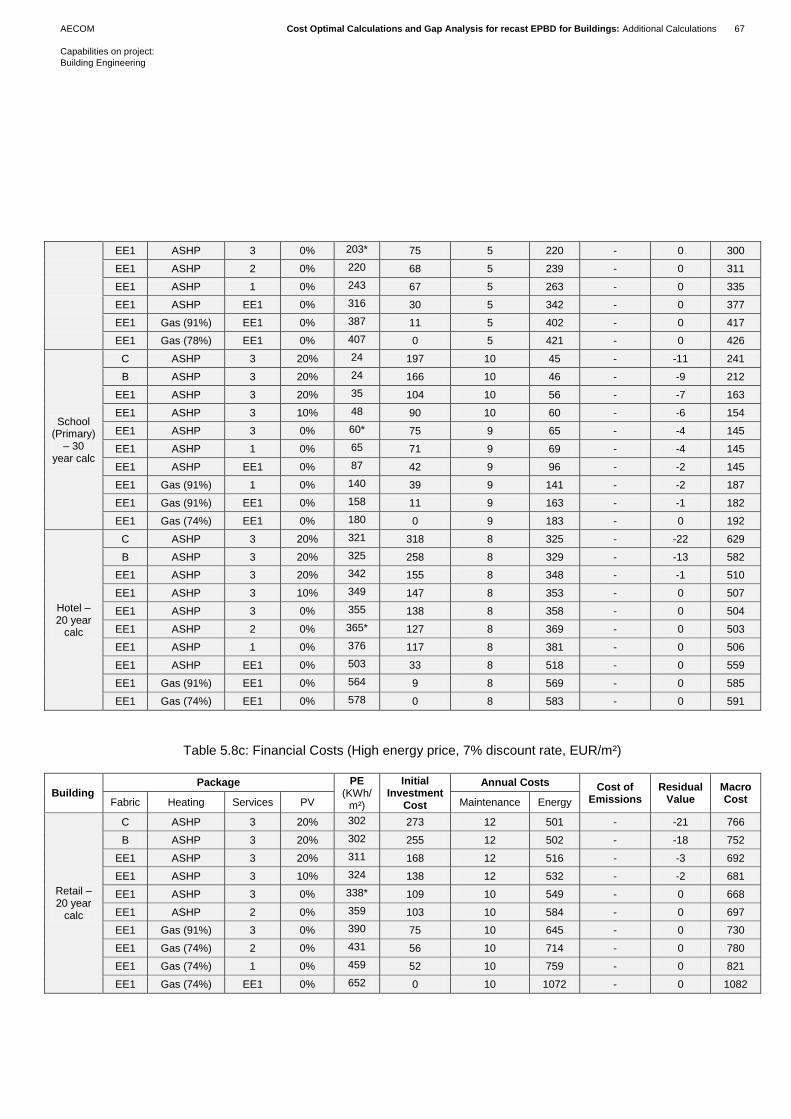
AECOM Cost Optimal Calculations and Gap Analysis for recast EPBD for Buildings: Additional Calculations 67
Capabilities on project:
Building Engineering
EE1 ASHP 3 0% 203* 75 5 220 - 0 300
EE1 ASHP 2 0% 220 68 5 239 - 0 311
EE1 ASHP 1 0% 243 67 5 263 - 0 335
EE1 ASHP EE1 0% 316 30 5 342 - 0 377
EE1 Gas (91%) EE1 0% 387 11 5 402 - 0 417
EE1 Gas (78%) EE1 0% 407 0 5 421 - 0 426
School (Primary)
– 30 year calc
C ASHP 3 20% 24 197 10 45 - -11 241
B ASHP 3 20% 24 166 10 46 - -9 212
EE1 ASHP 3 20% 35 104 10 56 - -7 163
EE1 ASHP 3 10% 48 90 10 60 - -6 154
EE1 ASHP 3 0% 60* 75 9 65 - -4 145
EE1 ASHP 1 0% 65 71 9 69 - -4 145
EE1 ASHP EE1 0% 87 42 9 96 - -2 145
EE1 Gas (91%) 1 0% 140 39 9 141 - -2 187
EE1 Gas (91%) EE1 0% 158 11 9 163 - -1 182
EE1 Gas (74%) EE1 0% 180 0 9 183 - 0 192
Hotel – 20 year
calc
C ASHP 3 20% 321 318 8 325 - -22 629
B ASHP 3 20% 325 258 8 329 - -13 582
EE1 ASHP 3 20% 342 155 8 348 - -1 510
EE1 ASHP 3 10% 349 147 8 353 - 0 507
EE1 ASHP 3 0% 355 138 8 358 - 0 504
EE1 ASHP 2 0% 365* 127 8 369 - 0 503
EE1 ASHP 1 0% 376 117 8 381 - 0 506
EE1 ASHP EE1 0% 503 33 8 518 - 0 559
EE1 Gas (91%) EE1 0% 564 9 8 569 - 0 585
EE1 Gas (74%) EE1 0% 578 0 8 583 - 0 591
Table 5.8c: Financial Costs (High energy price, 7% discount rate, EUR/m²)
Building Package PE
(KWh/m²)
Initial Investment
Cost
Annual Costs Cost of Emissions
Residual Value
Macro Cost Fabric Heating Services PV Maintenance Energy
Retail – 20 year
calc
C ASHP 3 20% 302 273 12 501 - -21 766
B ASHP 3 20% 302 255 12 502 - -18 752
EE1 ASHP 3 20% 311 168 12 516 - -3 692
EE1 ASHP 3 10% 324 138 12 532 - -2 681
EE1 ASHP 3 0% 338* 109 10 549 - 0 668
EE1 ASHP 2 0% 359 103 10 584 - 0 697
EE1 Gas (91%) 3 0% 390 75 10 645 - 0 730
EE1 Gas (74%) 2 0% 431 56 10 714 - 0 780
EE1 Gas (74%) 1 0% 459 52 10 759 - 0 821
EE1 Gas (74%) EE1 0% 652 0 10 1072 - 0 1082
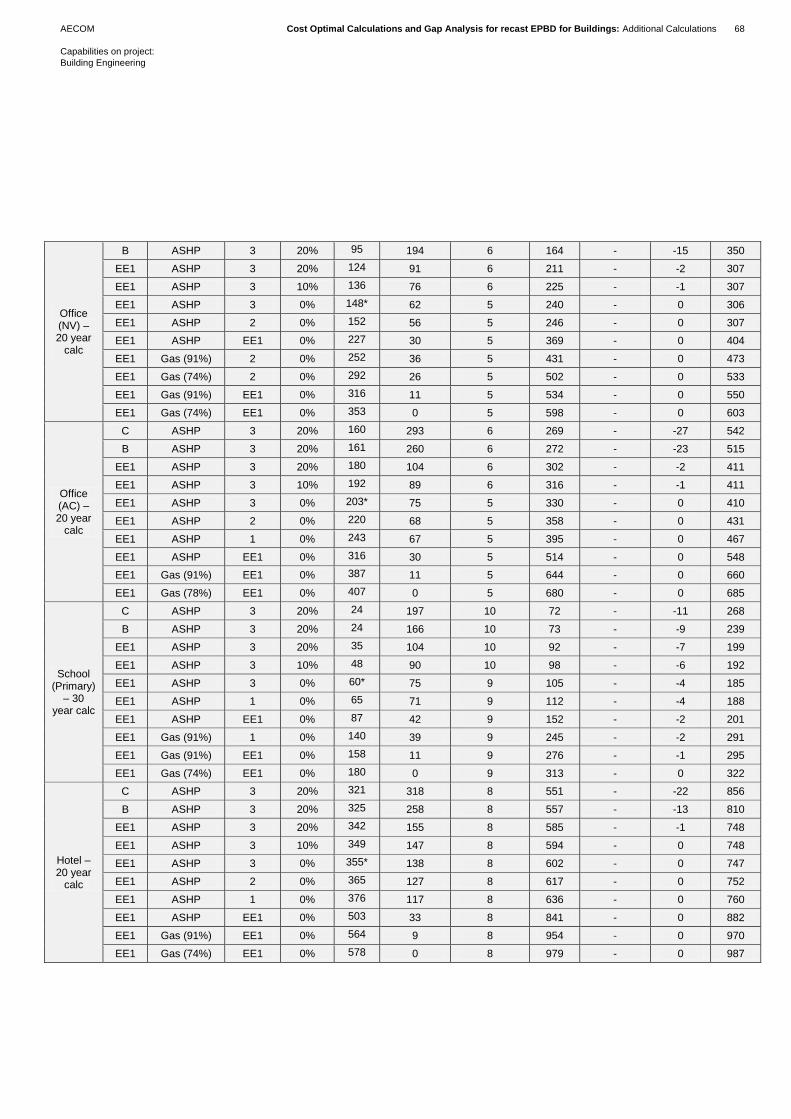
AECOM Cost Optimal Calculations and Gap Analysis for recast EPBD for Buildings: Additional Calculations 68
Capabilities on project:
Building Engineering
Office (NV) – 20 year
calc
B ASHP 3 20% 95 194 6 164 - -15 350
EE1 ASHP 3 20% 124 91 6 211 - -2 307
EE1 ASHP 3 10% 136 76 6 225 - -1 307
EE1 ASHP 3 0% 148* 62 5 240 - 0 306
EE1 ASHP 2 0% 152 56 5 246 - 0 307
EE1 ASHP EE1 0% 227 30 5 369 - 0 404
EE1 Gas (91%) 2 0% 252 36 5 431 - 0 473
EE1 Gas (74%) 2 0% 292 26 5 502 - 0 533
EE1 Gas (91%) EE1 0% 316 11 5 534 - 0 550
EE1 Gas (74%) EE1 0% 353 0 5 598 - 0 603
Office (AC) – 20 year
calc
C ASHP 3 20% 160 293 6 269 - -27 542
B ASHP 3 20% 161 260 6 272 - -23 515
EE1 ASHP 3 20% 180 104 6 302 - -2 411
EE1 ASHP 3 10% 192 89 6 316 - -1 411
EE1 ASHP 3 0% 203* 75 5 330 - 0 410
EE1 ASHP 2 0% 220 68 5 358 - 0 431
EE1 ASHP 1 0% 243 67 5 395 - 0 467
EE1 ASHP EE1 0% 316 30 5 514 - 0 548
EE1 Gas (91%) EE1 0% 387 11 5 644 - 0 660
EE1 Gas (78%) EE1 0% 407 0 5 680 - 0 685
School (Primary)
– 30 year calc
C ASHP 3 20% 24 197 10 72 - -11 268
B ASHP 3 20% 24 166 10 73 - -9 239
EE1 ASHP 3 20% 35 104 10 92 - -7 199
EE1 ASHP 3 10% 48 90 10 98 - -6 192
EE1 ASHP 3 0% 60* 75 9 105 - -4 185
EE1 ASHP 1 0% 65 71 9 112 - -4 188
EE1 ASHP EE1 0% 87 42 9 152 - -2 201
EE1 Gas (91%) 1 0% 140 39 9 245 - -2 291
EE1 Gas (91%) EE1 0% 158 11 9 276 - -1 295
EE1 Gas (74%) EE1 0% 180 0 9 313 - 0 322
Hotel – 20 year
calc
C ASHP 3 20% 321 318 8 551 - -22 856
B ASHP 3 20% 325 258 8 557 - -13 810
EE1 ASHP 3 20% 342 155 8 585 - -1 748
EE1 ASHP 3 10% 349 147 8 594 - 0 748
EE1 ASHP 3 0% 355* 138 8 602 - 0 747
EE1 ASHP 2 0% 365 127 8 617 - 0 752
EE1 ASHP 1 0% 376 117 8 636 - 0 760
EE1 ASHP EE1 0% 503 33 8 841 - 0 882
EE1 Gas (91%) EE1 0% 564 9 8 954 - 0 970
EE1 Gas (74%) EE1 0% 578 0 8 979 - 0 987
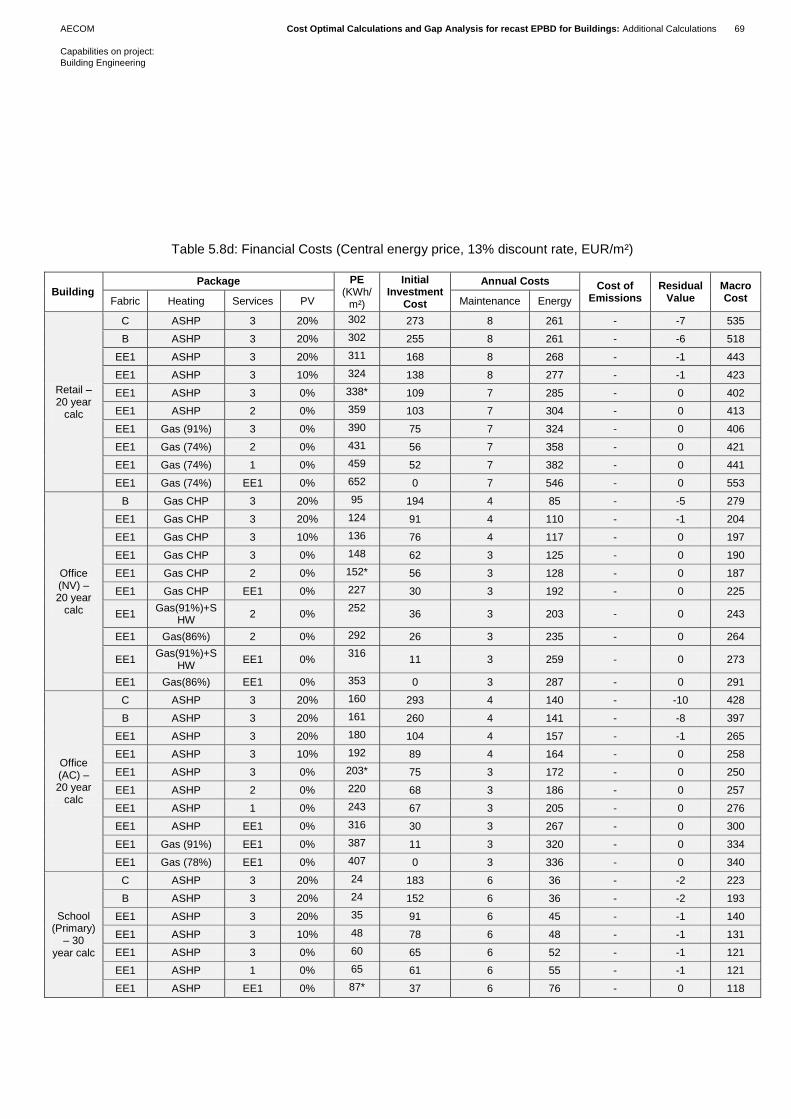
AECOM Cost Optimal Calculations and Gap Analysis for recast EPBD for Buildings: Additional Calculations 69
Capabilities on project:
Building Engineering
Table 5.8d: Financial Costs (Central energy price, 13% discount rate, EUR/m²)
Building Package PE
(KWh/m²)
Initial Investment
Cost
Annual Costs Cost of Emissions
Residual Value
Macro Cost Fabric Heating Services PV Maintenance Energy
Retail – 20 year
calc
C ASHP 3 20% 302 273 8 261 - -7 535
B ASHP 3 20% 302 255 8 261 - -6 518
EE1 ASHP 3 20% 311 168 8 268 - -1 443
EE1 ASHP 3 10% 324 138 8 277 - -1 423
EE1 ASHP 3 0% 338* 109 7 285 - 0 402
EE1 ASHP 2 0% 359 103 7 304 - 0 413
EE1 Gas (91%) 3 0% 390 75 7 324 - 0 406
EE1 Gas (74%) 2 0% 431 56 7 358 - 0 421
EE1 Gas (74%) 1 0% 459 52 7 382 - 0 441
EE1 Gas (74%) EE1 0% 652 0 7 546 - 0 553
Office (NV) – 20 year
calc
B Gas CHP 3 20% 95 194 4 85 - -5 279
EE1 Gas CHP 3 20% 124 91 4 110 - -1 204
EE1 Gas CHP 3 10% 136 76 4 117 - 0 197
EE1 Gas CHP 3 0% 148 62 3 125 - 0 190
EE1 Gas CHP 2 0% 152* 56 3 128 - 0 187
EE1 Gas CHP EE1 0% 227 30 3 192 - 0 225
EE1 Gas(91%)+S
HW 2 0%
252 36 3 203 - 0 243
EE1 Gas(86%) 2 0% 292 26 3 235 - 0 264
EE1 Gas(91%)+S
HW EE1 0%
316 11 3 259 - 0 273
EE1 Gas(86%) EE1 0% 353 0 3 287 - 0 291
Office (AC) – 20 year
calc
C ASHP 3 20% 160 293 4 140 - -10 428
B ASHP 3 20% 161 260 4 141 - -8 397
EE1 ASHP 3 20% 180 104 4 157 - -1 265
EE1 ASHP 3 10% 192 89 4 164 - 0 258
EE1 ASHP 3 0% 203* 75 3 172 - 0 250
EE1 ASHP 2 0% 220 68 3 186 - 0 257
EE1 ASHP 1 0% 243 67 3 205 - 0 276
EE1 ASHP EE1 0% 316 30 3 267 - 0 300
EE1 Gas (91%) EE1 0% 387 11 3 320 - 0 334
EE1 Gas (78%) EE1 0% 407 0 3 336 - 0 340
School (Primary)
– 30 year calc
C ASHP 3 20% 24 183 6 36 - -2 223
B ASHP 3 20% 24 152 6 36 - -2 193
EE1 ASHP 3 20% 35 91 6 45 - -1 140
EE1 ASHP 3 10% 48 78 6 48 - -1 131
EE1 ASHP 3 0% 60 65 6 52 - -1 121
EE1 ASHP 1 0% 65 61 6 55 - -1 121
EE1 ASHP EE1 0% 87* 37 6 76 - 0 118
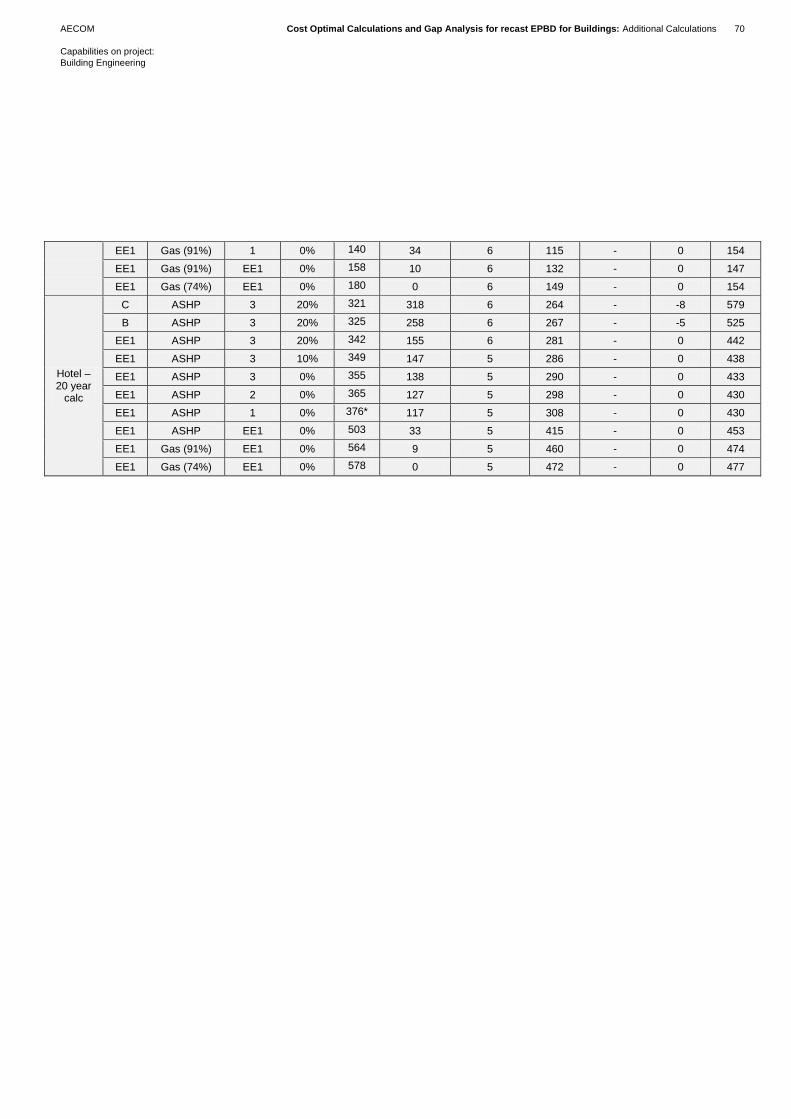
AECOM Cost Optimal Calculations and Gap Analysis for recast EPBD for Buildings: Additional Calculations 70
Capabilities on project:
Building Engineering
EE1 Gas (91%) 1 0% 140 34 6 115 - 0 154
EE1 Gas (91%) EE1 0% 158 10 6 132 - 0 147
EE1 Gas (74%) EE1 0% 180 0 6 149 - 0 154
Hotel – 20 year
calc
C ASHP 3 20% 321 318 6 264 - -8 579
B ASHP 3 20% 325 258 6 267 - -5 525
EE1 ASHP 3 20% 342 155 6 281 - 0 442
EE1 ASHP 3 10% 349 147 5 286 - 0 438
EE1 ASHP 3 0% 355 138 5 290 - 0 433
EE1 ASHP 2 0% 365 127 5 298 - 0 430
EE1 ASHP 1 0% 376* 117 5 308 - 0 430
EE1 ASHP EE1 0% 503 33 5 415 - 0 453
EE1 Gas (91%) EE1 0% 564 9 5 460 - 0 474
EE1 Gas (74%) EE1 0% 578 0 5 472 - 0 477
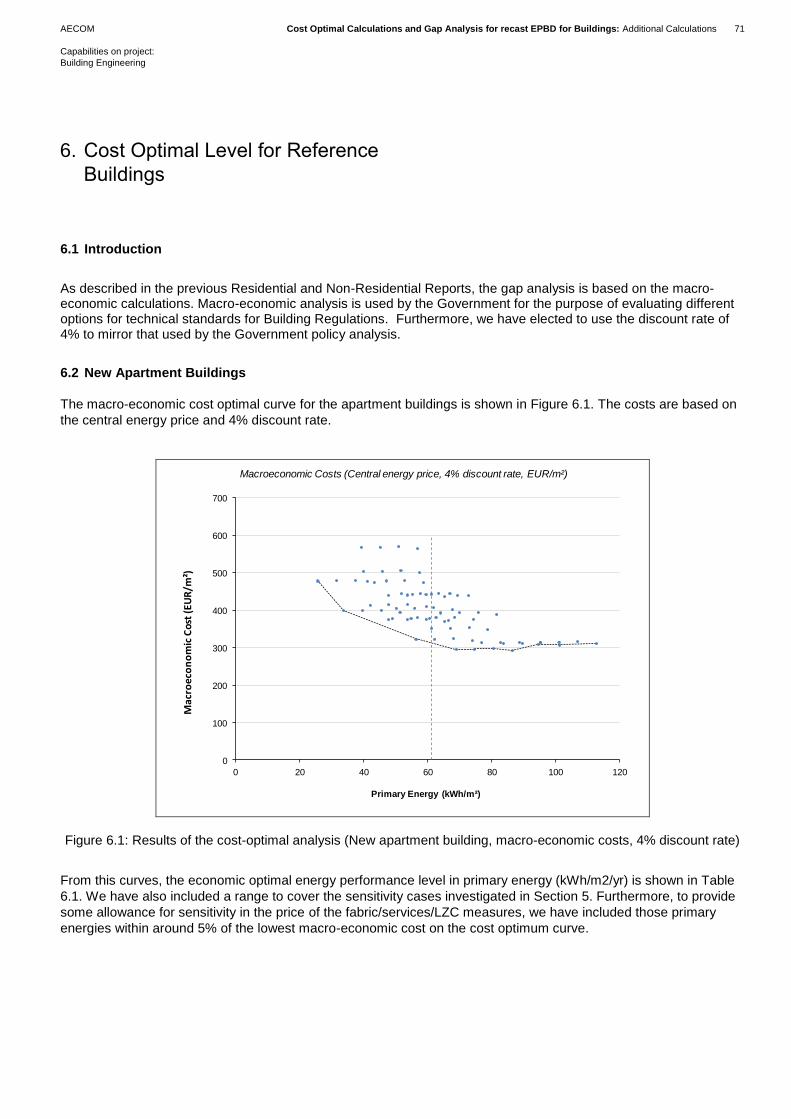
AECOM Cost Optimal Calculations and Gap Analysis for recast EPBD for Buildings: Additional Calculations 71
Capabilities on project:
Building Engineering
6.1 Introduction
As described in the previous Residential and Non-Residential Reports, the gap analysis is based on the macro-economic calculations. Macro-economic analysis is used by the Government for the purpose of evaluating different options for technical standards for Building Regulations. Furthermore, we have elected to use the discount rate of 4% to mirror that used by the Government policy analysis.
6.2 New Apartment Buildings
The macro-economic cost optimal curve for the apartment buildings is shown in Figure 6.1. The costs are based on
the central energy price and 4% discount rate.
Figure 6.1: Results of the cost-optimal analysis (New apartment building, macro-economic costs, 4% discount rate)
From this curves, the economic optimal energy performance level in primary energy (kWh/m2/yr) is shown in Table
6.1. We have also included a range to cover the sensitivity cases investigated in Section 5. Furthermore, to provide
some allowance for sensitivity in the price of the fabric/services/LZC measures, we have included those primary
energies within around 5% of the lowest macro-economic cost on the cost optimum curve.
0
100
200
300
400
500
600
700
0 20 40 60 80 100 120
Mac
roec
on
om
ic C
ost
(EU
R/m
²)
Primary Energy (kWh/m²)
Macroeconomic Costs (Central energy price, 4% discount rate, EUR/m²)
6. Cost Optimal Level for Reference
Buildings
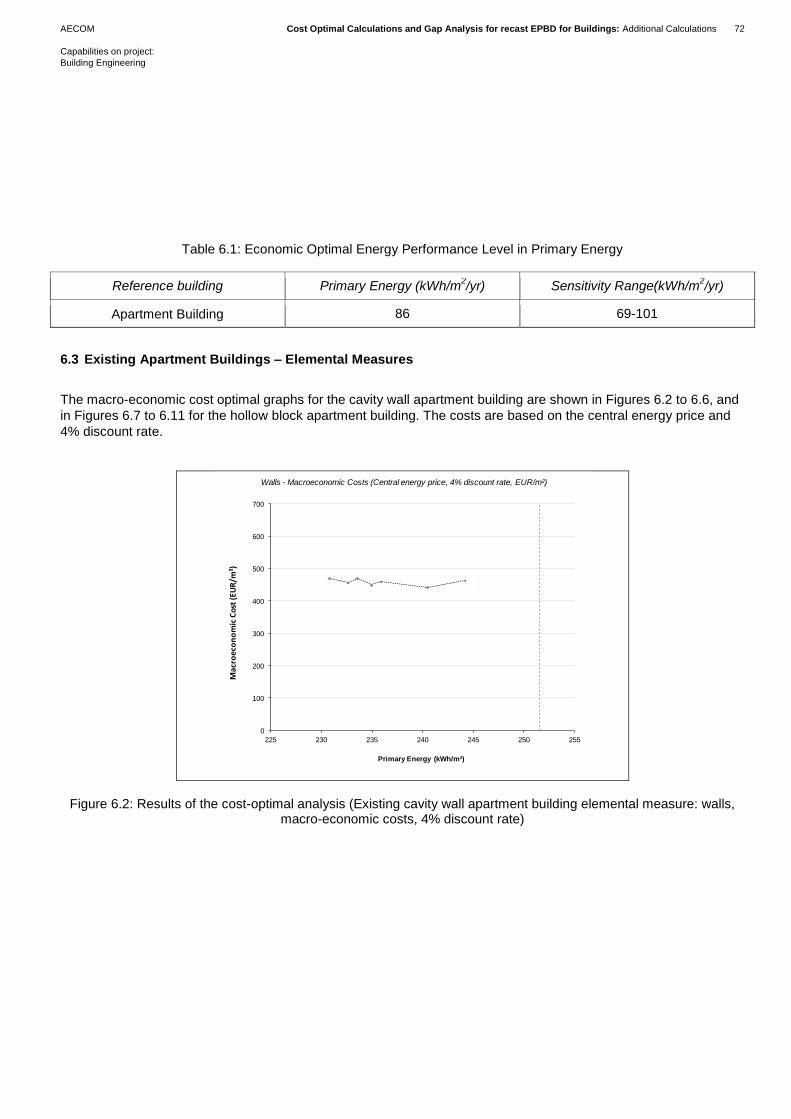
AECOM Cost Optimal Calculations and Gap Analysis for recast EPBD for Buildings: Additional Calculations 72
Capabilities on project:
Building Engineering
Table 6.1: Economic Optimal Energy Performance Level in Primary Energy
Reference building Primary Energy (kWh/m2/yr) Sensitivity Range(kWh/m
2/yr)
Apartment Building 86 69-101
6.3 Existing Apartment Buildings – Elemental Measures
The macro-economic cost optimal graphs for the cavity wall apartment building are shown in Figures 6.2 to 6.6, and
in Figures 6.7 to 6.11 for the hollow block apartment building. The costs are based on the central energy price and
4% discount rate.
Figure 6.2: Results of the cost-optimal analysis (Existing cavity wall apartment building elemental measure: walls,
macro-economic costs, 4% discount rate)
0
100
200
300
400
500
600
700
225 230 235 240 245 250 255
Mac
roec
on
om
ic C
ost
(EU
R/m
²)
Primary Energy (kWh/m²)
Walls - Macroeconomic Costs (Central energy price, 4% discount rate, EUR/m²)
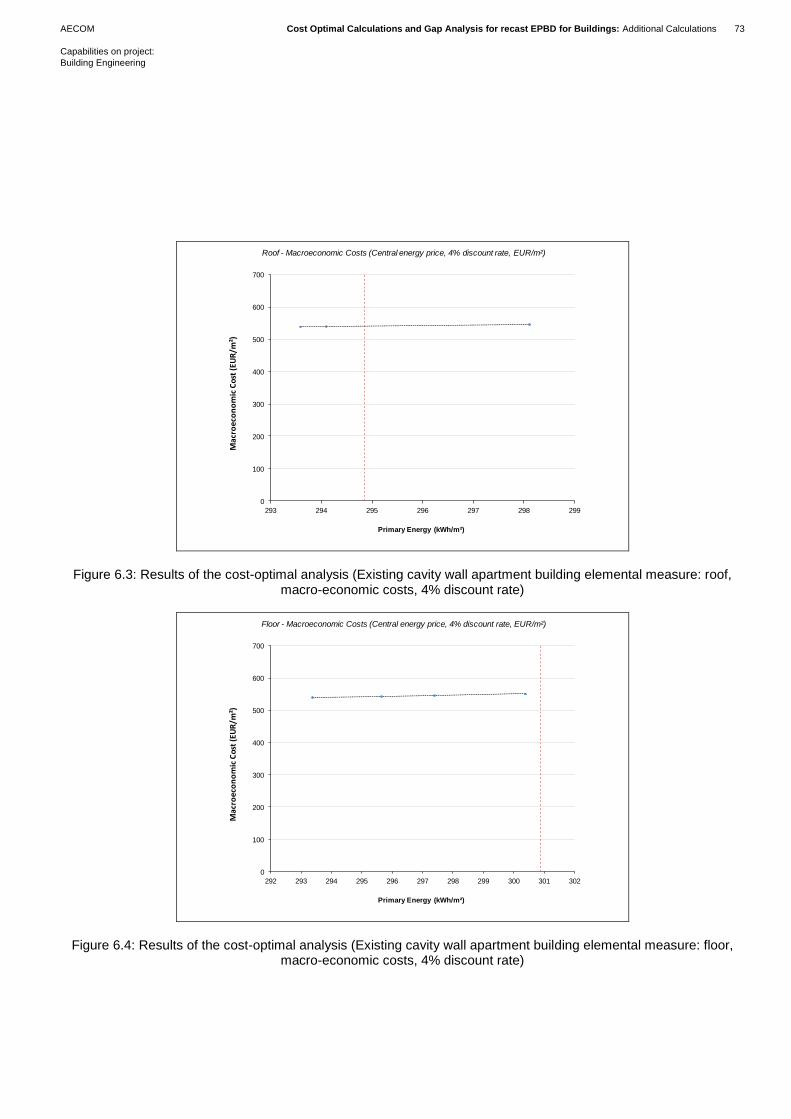
AECOM Cost Optimal Calculations and Gap Analysis for recast EPBD for Buildings: Additional Calculations 73
Capabilities on project:
Building Engineering
Figure 6.3: Results of the cost-optimal analysis (Existing cavity wall apartment building elemental measure: roof,
macro-economic costs, 4% discount rate)
Figure 6.4: Results of the cost-optimal analysis (Existing cavity wall apartment building elemental measure: floor,
macro-economic costs, 4% discount rate)
0
100
200
300
400
500
600
700
293 294 295 296 297 298 299
Mac
roec
on
om
ic C
ost
(EU
R/m
²)
Primary Energy (kWh/m²)
Roof - Macroeconomic Costs (Central energy price, 4% discount rate, EUR/m²)
0
100
200
300
400
500
600
700
292 293 294 295 296 297 298 299 300 301 302
Mac
roec
on
om
ic C
ost
(EU
R/m
²)
Primary Energy (kWh/m²)
Floor - Macroeconomic Costs (Central energy price, 4% discount rate, EUR/m²)
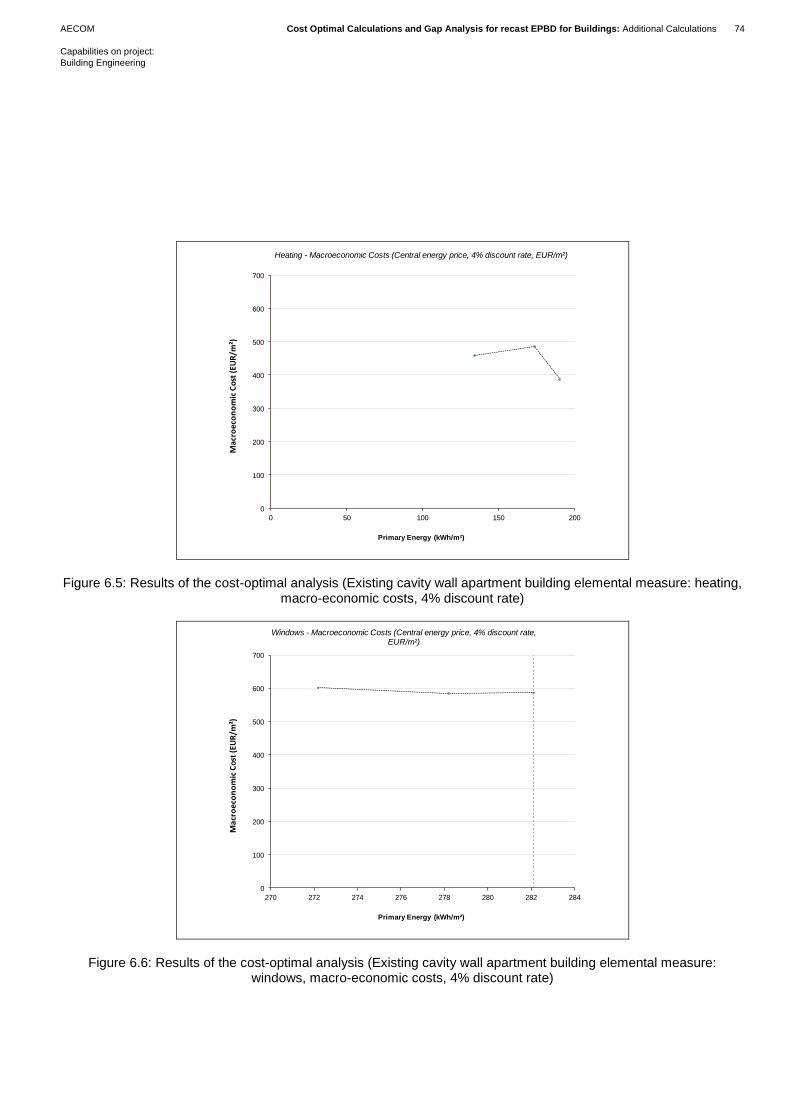
AECOM Cost Optimal Calculations and Gap Analysis for recast EPBD for Buildings: Additional Calculations 74
Capabilities on project:
Building Engineering
Figure 6.5: Results of the cost-optimal analysis (Existing cavity wall apartment building elemental measure: heating,
macro-economic costs, 4% discount rate)
Figure 6.6: Results of the cost-optimal analysis (Existing cavity wall apartment building elemental measure:
windows, macro-economic costs, 4% discount rate)
0
100
200
300
400
500
600
700
0 50 100 150 200
Mac
roec
on
om
ic C
ost
(EU
R/m
²)
Primary Energy (kWh/m²)
Heating - Macroeconomic Costs (Central energy price, 4% discount rate, EUR/m²)
0
100
200
300
400
500
600
700
270 272 274 276 278 280 282 284
Mac
roec
on
om
ic C
ost
(EU
R/m
²)
Primary Energy (kWh/m²)
Windows - Macroeconomic Costs (Central energy price, 4% discount rate, EUR/m²)
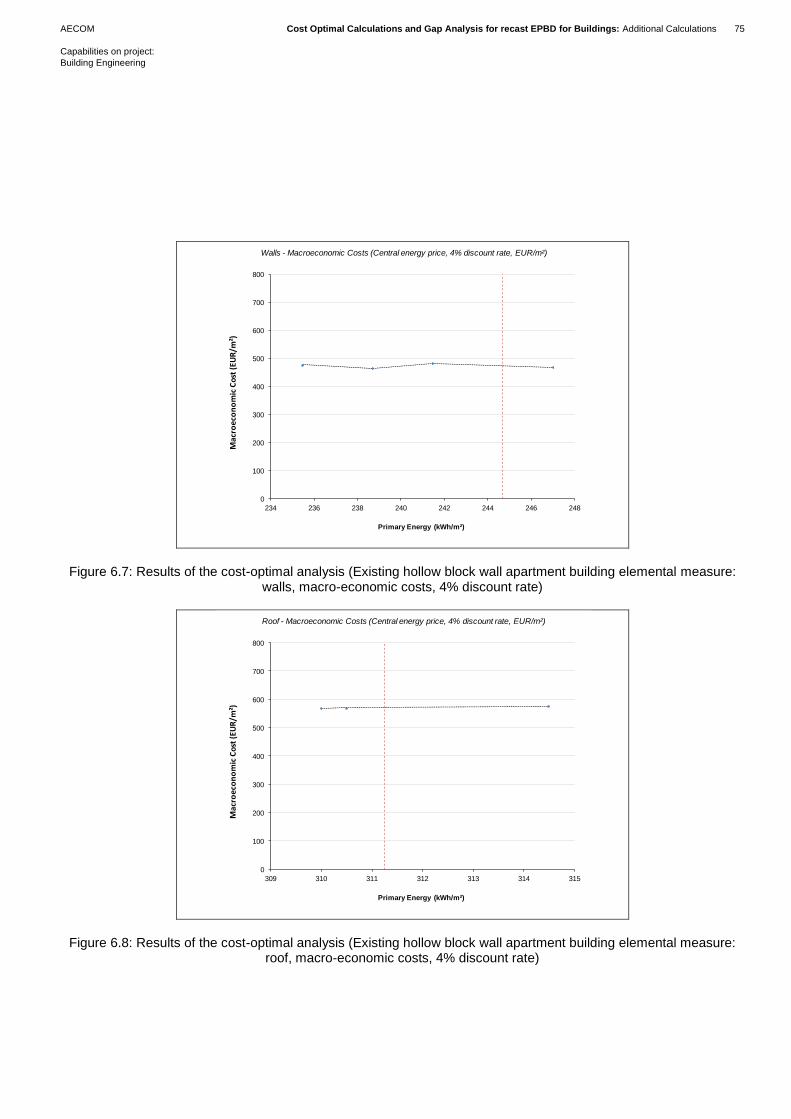
AECOM Cost Optimal Calculations and Gap Analysis for recast EPBD for Buildings: Additional Calculations 75
Capabilities on project:
Building Engineering
Figure 6.7: Results of the cost-optimal analysis (Existing hollow block wall apartment building elemental measure:
walls, macro-economic costs, 4% discount rate)
Figure 6.8: Results of the cost-optimal analysis (Existing hollow block wall apartment building elemental measure:
roof, macro-economic costs, 4% discount rate)
0
100
200
300
400
500
600
700
800
234 236 238 240 242 244 246 248
Mac
roec
on
om
ic C
ost
(EU
R/m
²)
Primary Energy (kWh/m²)
Walls - Macroeconomic Costs (Central energy price, 4% discount rate, EUR/m²)
0
100
200
300
400
500
600
700
800
309 310 311 312 313 314 315
Mac
roec
on
om
ic C
ost
(EU
R/m
²)
Primary Energy (kWh/m²)
Roof - Macroeconomic Costs (Central energy price, 4% discount rate, EUR/m²)
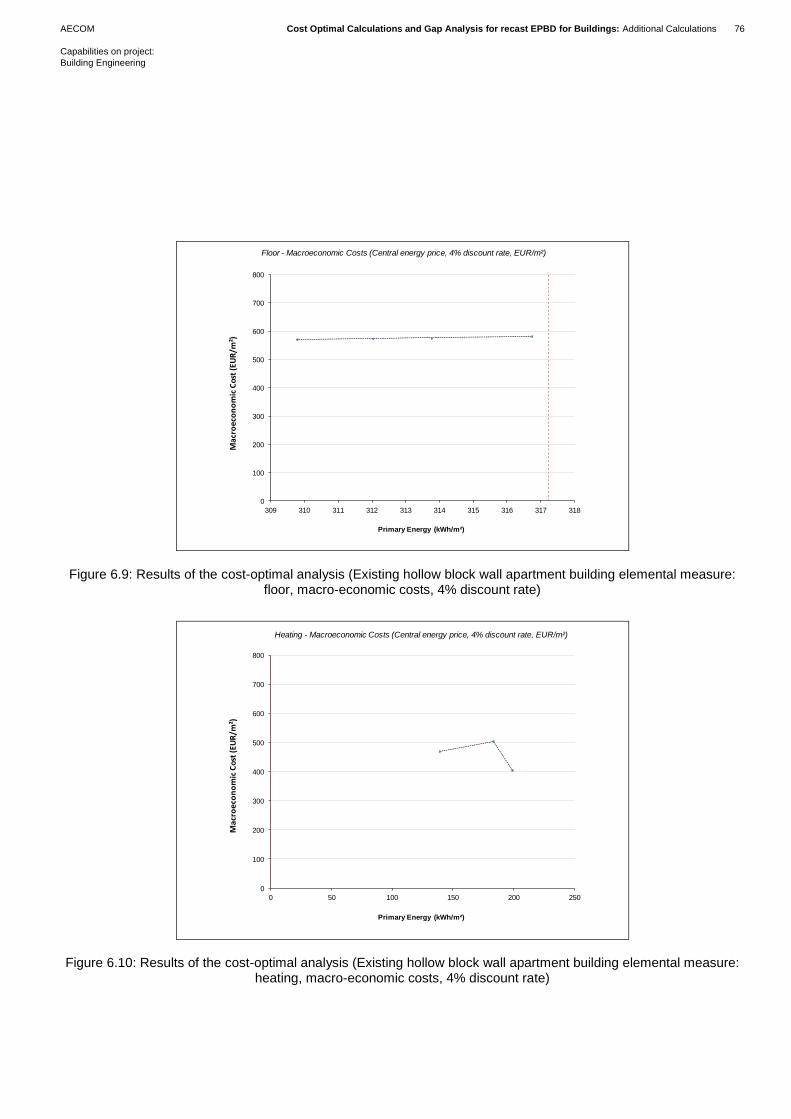
AECOM Cost Optimal Calculations and Gap Analysis for recast EPBD for Buildings: Additional Calculations 76
Capabilities on project:
Building Engineering
Figure 6.9: Results of the cost-optimal analysis (Existing hollow block wall apartment building elemental measure:
floor, macro-economic costs, 4% discount rate)
Figure 6.10: Results of the cost-optimal analysis (Existing hollow block wall apartment building elemental measure:
heating, macro-economic costs, 4% discount rate)
0
100
200
300
400
500
600
700
800
309 310 311 312 313 314 315 316 317 318
Mac
roec
on
om
ic C
ost
(EU
R/m
²)
Primary Energy (kWh/m²)
Floor - Macroeconomic Costs (Central energy price, 4% discount rate, EUR/m²)
0
100
200
300
400
500
600
700
800
0 50 100 150 200 250
Mac
roec
on
om
ic C
ost
(EU
R/m
²)
Primary Energy (kWh/m²)
Heating - Macroeconomic Costs (Central energy price, 4% discount rate, EUR/m²)
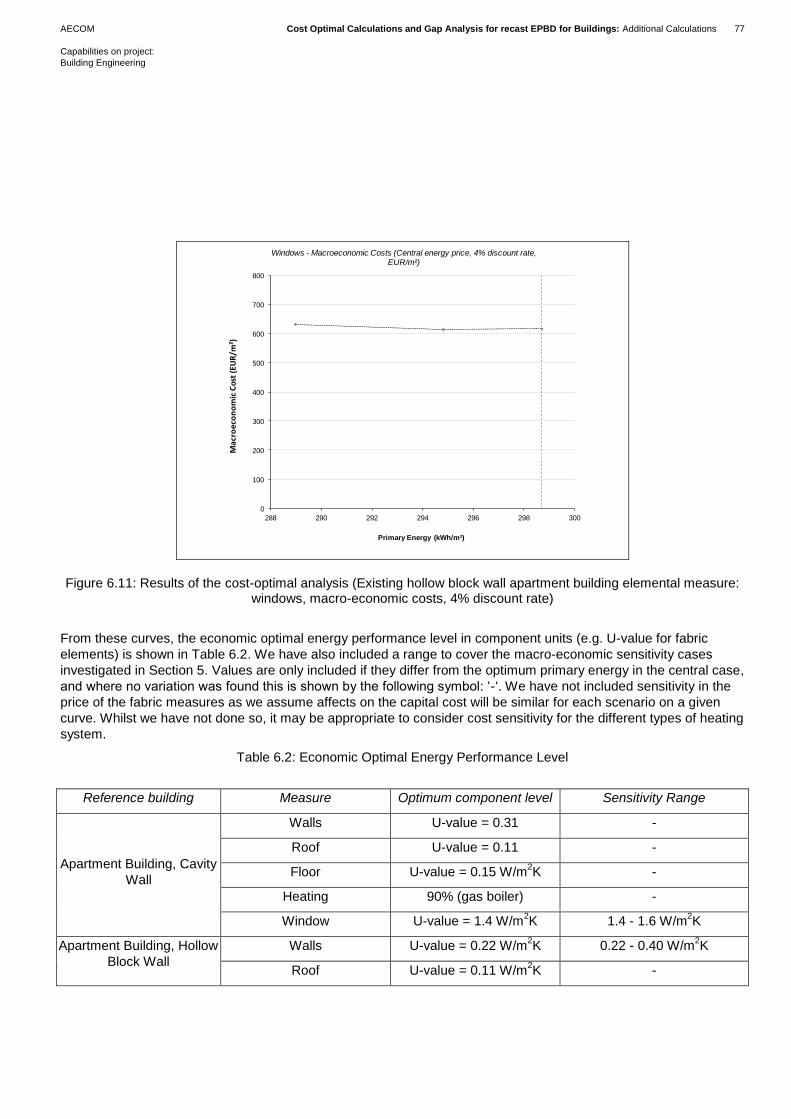
AECOM Cost Optimal Calculations and Gap Analysis for recast EPBD for Buildings: Additional Calculations 77
Capabilities on project:
Building Engineering
Figure 6.11: Results of the cost-optimal analysis (Existing hollow block wall apartment building elemental measure:
windows, macro-economic costs, 4% discount rate)
From these curves, the economic optimal energy performance level in component units (e.g. U-value for fabric
elements) is shown in Table 6.2. We have also included a range to cover the macro-economic sensitivity cases
investigated in Section 5. Values are only included if they differ from the optimum primary energy in the central case,
and where no variation was found this is shown by the following symbol: ‘-‘. We have not included sensitivity in the
price of the fabric measures as we assume affects on the capital cost will be similar for each scenario on a given
curve. Whilst we have not done so, it may be appropriate to consider cost sensitivity for the different types of heating
system.
Table 6.2: Economic Optimal Energy Performance Level
Reference building Measure Optimum component level Sensitivity Range
Apartment Building, Cavity
Wall
Walls U-value = 0.31 -
Roof U-value = 0.11 -
Floor U-value = 0.15 W/m2K -
Heating 90% (gas boiler) -
Window U-value = 1.4 W/m2K 1.4 - 1.6 W/m
2K
Apartment Building, Hollow
Block Wall
Walls U-value = 0.22 W/m2K 0.22 - 0.40 W/m
2K
Roof U-value = 0.11 W/m2K -
0
100
200
300
400
500
600
700
800
288 290 292 294 296 298 300
Mac
roec
on
om
ic C
ost
(EU
R/m
²)
Primary Energy (kWh/m²)
Windows - Macroeconomic Costs (Central energy price, 4% discount rate, EUR/m²)
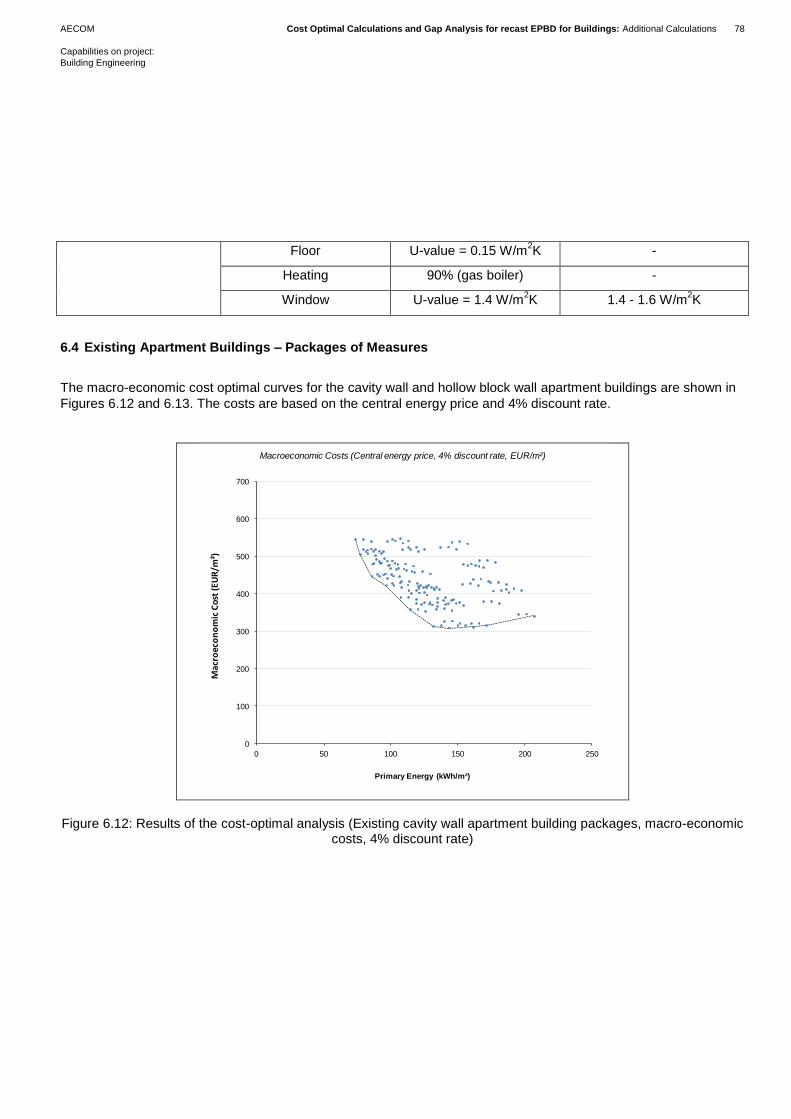
AECOM Cost Optimal Calculations and Gap Analysis for recast EPBD for Buildings: Additional Calculations 78
Capabilities on project:
Building Engineering
Floor U-value = 0.15 W/m2K -
Heating 90% (gas boiler) -
Window U-value = 1.4 W/m2K 1.4 - 1.6 W/m
2K
6.4 Existing Apartment Buildings – Packages of Measures
The macro-economic cost optimal curves for the cavity wall and hollow block wall apartment buildings are shown in
Figures 6.12 and 6.13. The costs are based on the central energy price and 4% discount rate.
Figure 6.12: Results of the cost-optimal analysis (Existing cavity wall apartment building packages, macro-economic
costs, 4% discount rate)
0
100
200
300
400
500
600
700
0 50 100 150 200 250
Mac
roec
on
om
ic C
ost
(EU
R/m
²)
Primary Energy (kWh/m²)
Macroeconomic Costs (Central energy price, 4% discount rate, EUR/m²)
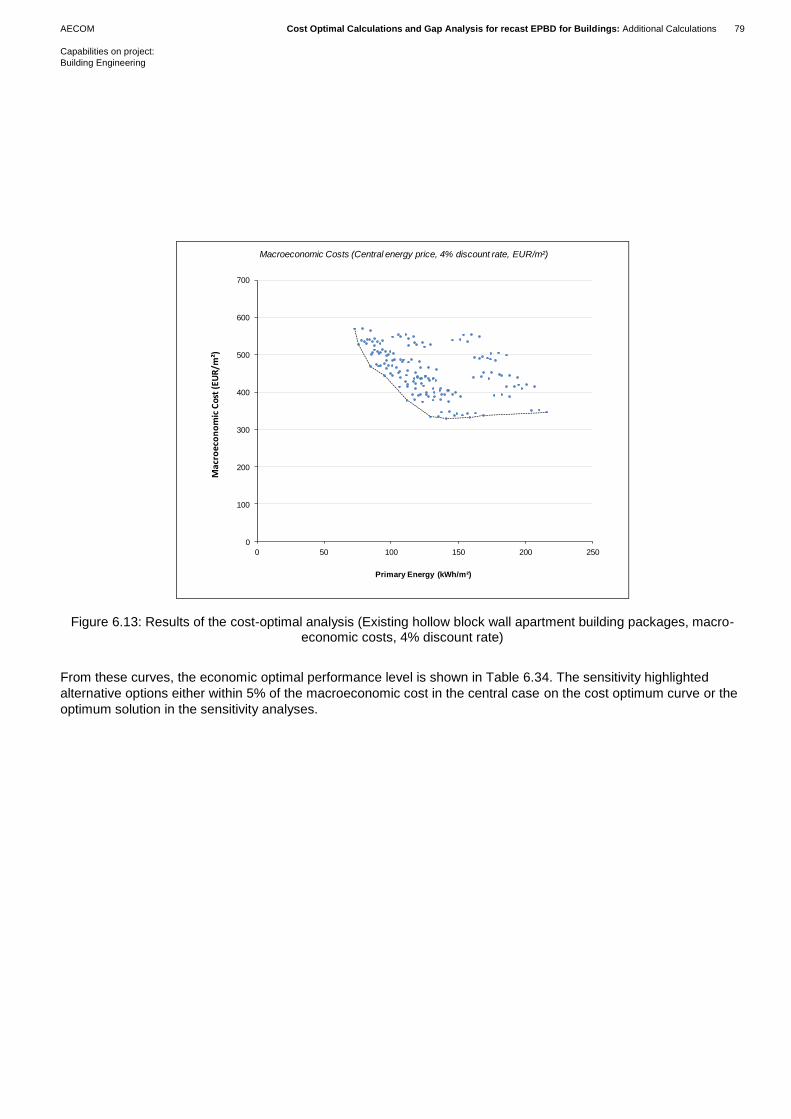
AECOM Cost Optimal Calculations and Gap Analysis for recast EPBD for Buildings: Additional Calculations 79
Capabilities on project:
Building Engineering
Figure 6.13: Results of the cost-optimal analysis (Existing hollow block wall apartment building packages, macro-
economic costs, 4% discount rate)
From these curves, the economic optimal performance level is shown in Table 6.34. The sensitivity highlighted
alternative options either within 5% of the macroeconomic cost in the central case on the cost optimum curve or the
optimum solution in the sensitivity analyses.
0
100
200
300
400
500
600
700
0 50 100 150 200 250
Mac
roec
on
om
ic C
ost
(EU
R/m
²)
Primary Energy (kWh/m²)
Macroeconomic Costs (Central energy price, 4% discount rate, EUR/m²)
AECOM Cost Optimal Calculations and Gap Analysis for recast EPBD for Buildings: Additional Calculations 80
Capabilities on project:
Building Engineering
Table 6.3: Economic Optimal Energy Performance Level Packages
Reference building Optimal Sensitivity Range
Apartment Building, Cavity Wall Roof and wall improvements to cost
optimum, gas boiler
Wall improvement to cost optimum, gas boiler
Wall improvement to cost optimum,
biomass boiler, 0/10/20% PV
Roof and wall improvements to cost optimum, gas boiler, 10/20% PV
Roof and wall improvements to cost
optimum, biomass boiler, 0/10/20% PV
Apartment Building, Hollow Block Wall
Roof and wall improvements to cost optimum, gas boiler
Wall improvement to cost optimum, gas boiler
Wall improvement to cost optimum,
biomass boiler, 0/10/20% PV
Roof and wall improvements to cost optimum, gas boiler, 10/20% PV
Roof and wall improvements to cost
optimum, biomass boiler, 0/10/20% PV
6.5 Existing Non-Domestic Buildings – Packages of Measures
The macro-economic cost optimal curves for the five buildings are shown in Figures 6.14 – 6.18. The costs are
based on the central energy price and 4% discount rate.
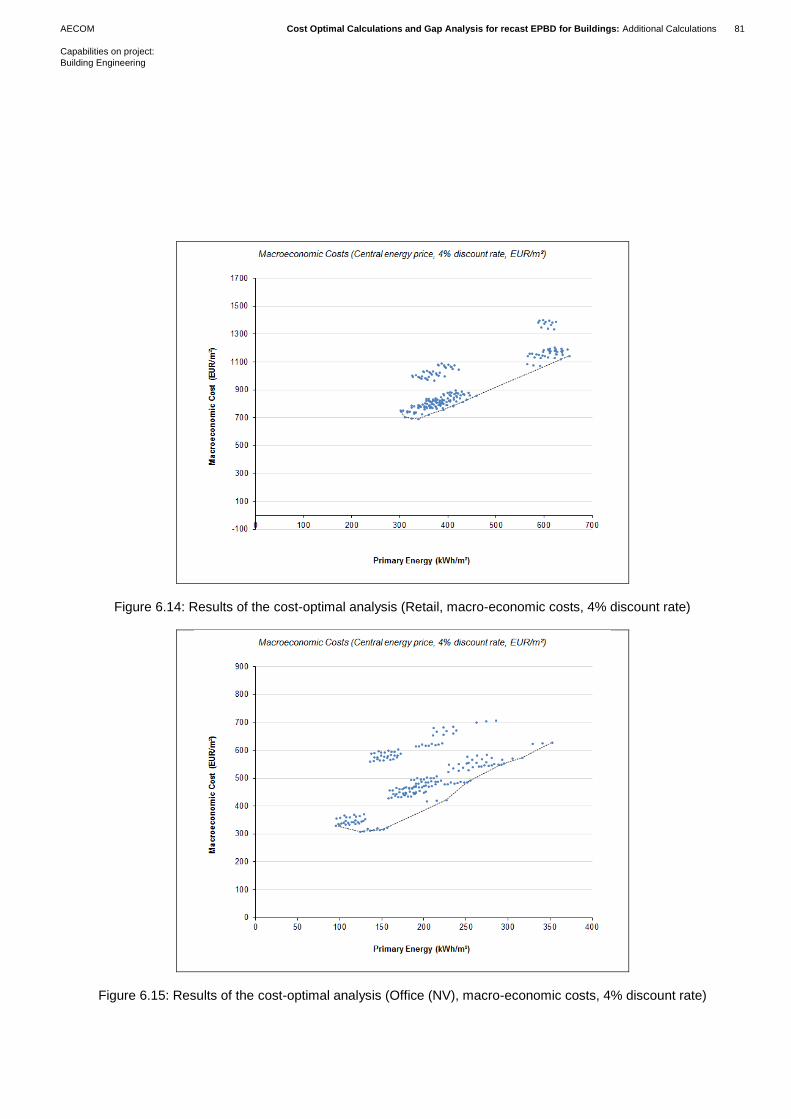
AECOM Cost Optimal Calculations and Gap Analysis for recast EPBD for Buildings: Additional Calculations 81
Capabilities on project:
Building Engineering
Figure 6.14: Results of the cost-optimal analysis (Retail, macro-economic costs, 4% discount rate)
Figure 6.15: Results of the cost-optimal analysis (Office (NV), macro-economic costs, 4% discount rate)
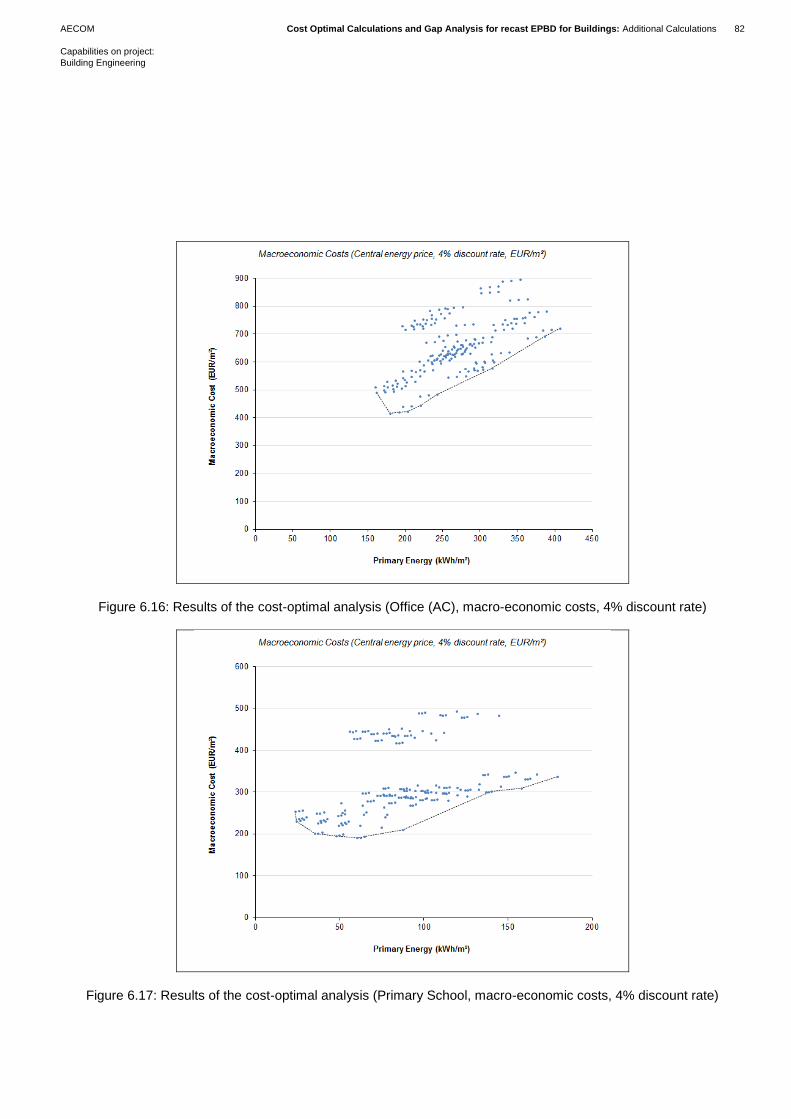
AECOM Cost Optimal Calculations and Gap Analysis for recast EPBD for Buildings: Additional Calculations 82
Capabilities on project:
Building Engineering
Figure 6.16: Results of the cost-optimal analysis (Office (AC), macro-economic costs, 4% discount rate)
Figure 6.17: Results of the cost-optimal analysis (Primary School, macro-economic costs, 4% discount rate)
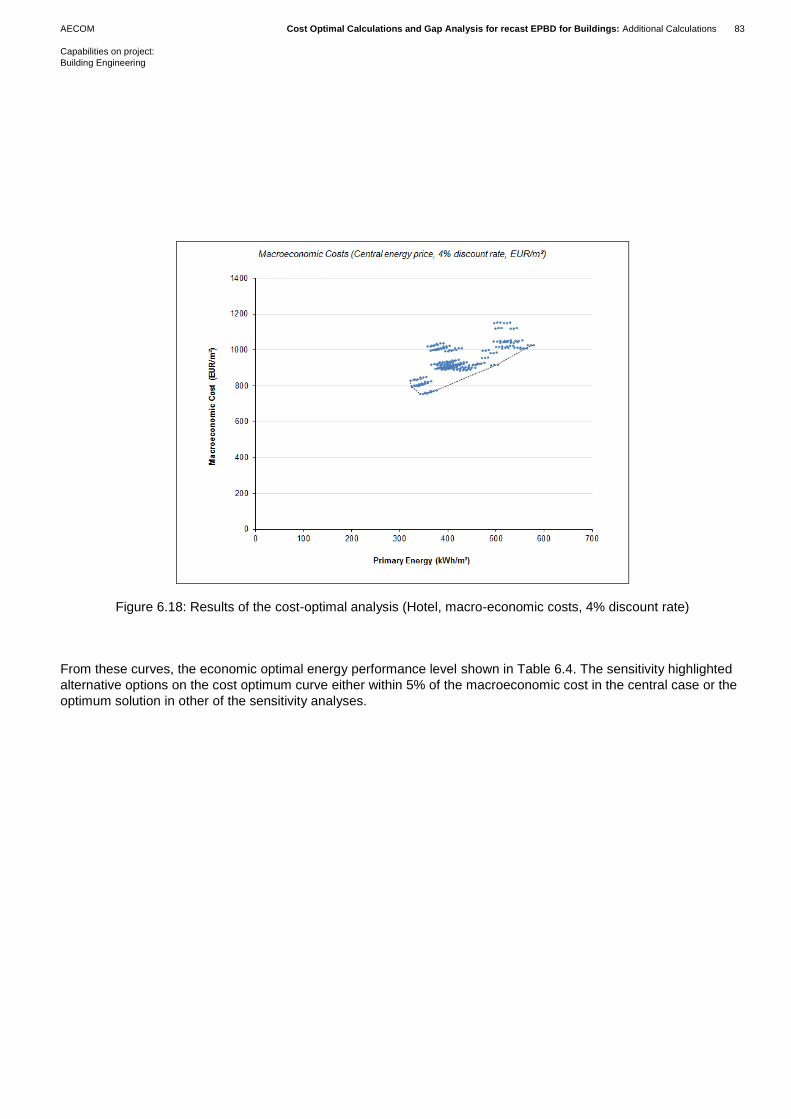
AECOM Cost Optimal Calculations and Gap Analysis for recast EPBD for Buildings: Additional Calculations 83
Capabilities on project:
Building Engineering
Figure 6.18: Results of the cost-optimal analysis (Hotel, macro-economic costs, 4% discount rate)
From these curves, the economic optimal energy performance level shown in Table 6.4. The sensitivity highlighted
alternative options on the cost optimum curve either within 5% of the macroeconomic cost in the central case or the
optimum solution in other of the sensitivity analyses.

AECOM Cost Optimal Calculations and Gap Analysis for recast EPBD for Buildings: Additional Calculations 84
Capabilities on project:
Building Engineering
Table 6.4: Economic Optimal Energy Performance Level Packages
Reference building Optimal Sensitivity Range
Retail ASHP, Services Package 3, None.
Office (NV) ASHP, Services Package 3, 20% PV ASHP, Services Package 3
Office (AC) ASHP, Services Package 3, 20% PV ASHP, Services Package 3
Primary School ASHP, Services Package 3 ASHP, Services Package 2
Hotel ASHP, Services Package 3, 20% PV ASHP, Services Package 3
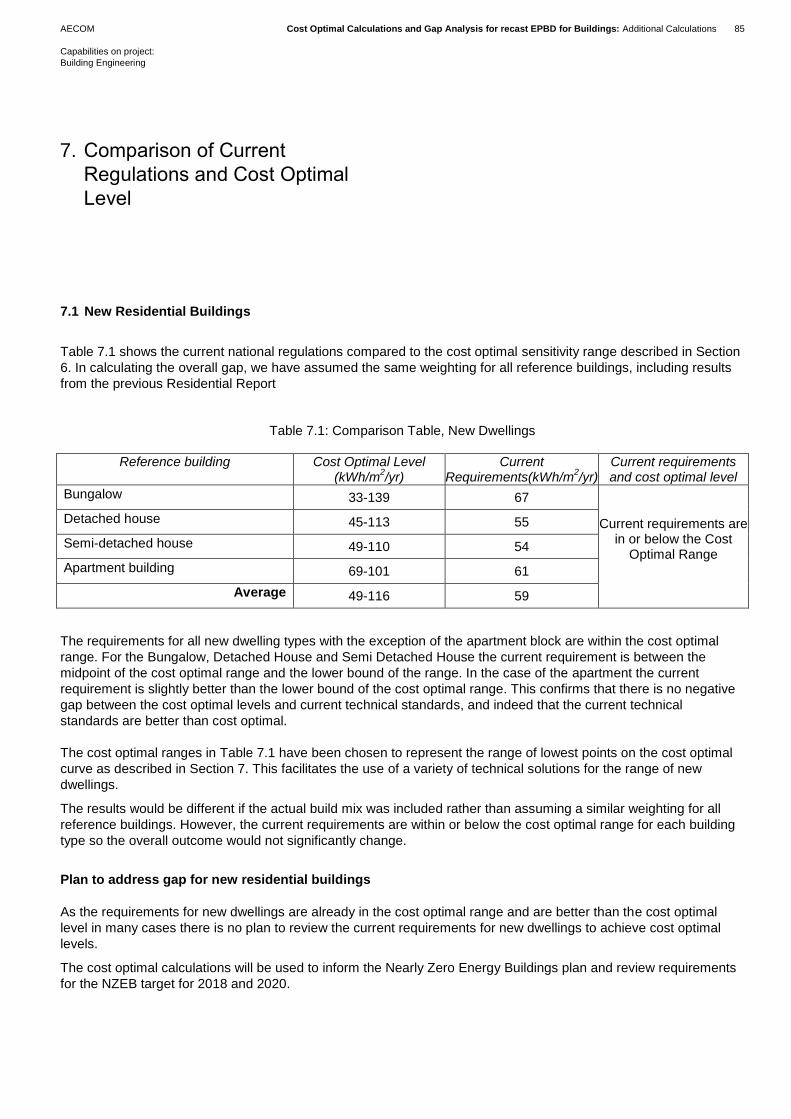
AECOM Cost Optimal Calculations and Gap Analysis for recast EPBD for Buildings: Additional Calculations 85
Capabilities on project:
Building Engineering
7.1 New Residential Buildings
Table 7.1 shows the current national regulations compared to the cost optimal sensitivity range described in Section
6. In calculating the overall gap, we have assumed the same weighting for all reference buildings, including results
from the previous Residential Report
Table 7.1: Comparison Table, New Dwellings
Reference building Cost Optimal Level (kWh/m
2/yr)
Current Requirements(kWh/m
2/yr)
Current requirements and cost optimal level
Bungalow 33-139 67
Current requirements are in or below the Cost
Optimal Range
Detached house 45-113 55
Semi-detached house 49-110 54
Apartment building 69-101 61
Average 49-116 59
The requirements for all new dwelling types with the exception of the apartment block are within the cost optimal
range. For the Bungalow, Detached House and Semi Detached House the current requirement is between the
midpoint of the cost optimal range and the lower bound of the range. In the case of the apartment the current
requirement is slightly better than the lower bound of the cost optimal range. This confirms that there is no negative
gap between the cost optimal levels and current technical standards, and indeed that the current technical
standards are better than cost optimal.
The cost optimal ranges in Table 7.1 have been chosen to represent the range of lowest points on the cost optimal
curve as described in Section 7. This facilitates the use of a variety of technical solutions for the range of new
dwellings.
The results would be different if the actual build mix was included rather than assuming a similar weighting for all
reference buildings. However, the current requirements are within or below the cost optimal range for each building
type so the overall outcome would not significantly change.
Plan to address gap for new residential buildings
As the requirements for new dwellings are already in the cost optimal range and are better than the cost optimal
level in many cases there is no plan to review the current requirements for new dwellings to achieve cost optimal
levels.
The cost optimal calculations will be used to inform the Nearly Zero Energy Buildings plan and review requirements
for the NZEB target for 2018 and 2020.
7. Comparison of Current
Regulations and Cost Optimal
Level
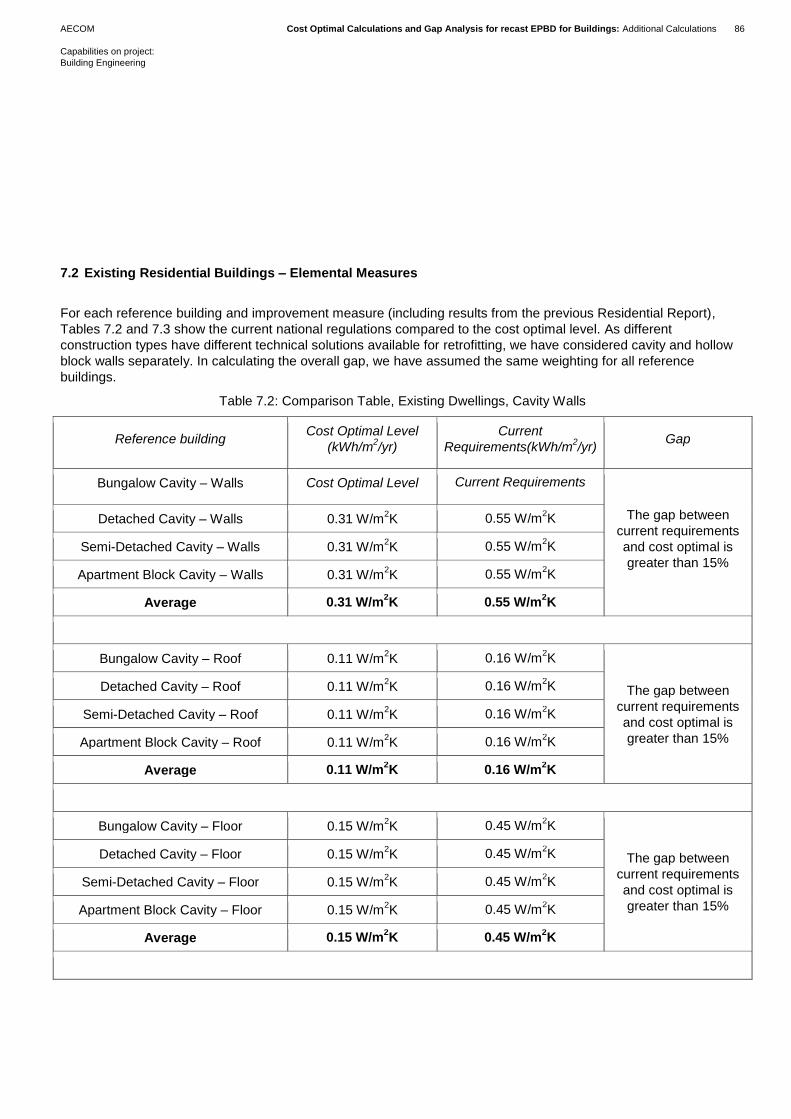
AECOM Cost Optimal Calculations and Gap Analysis for recast EPBD for Buildings: Additional Calculations 86
Capabilities on project:
Building Engineering
7.2 Existing Residential Buildings – Elemental Measures
For each reference building and improvement measure (including results from the previous Residential Report),
Tables 7.2 and 7.3 show the current national regulations compared to the cost optimal level. As different
construction types have different technical solutions available for retrofitting, we have considered cavity and hollow
block walls separately. In calculating the overall gap, we have assumed the same weighting for all reference
buildings.
Table 7.2: Comparison Table, Existing Dwellings, Cavity Walls
Reference building Cost Optimal Level
(kWh/m2/yr)
Current
Requirements(kWh/m2/yr)
Gap
Bungalow Cavity – Walls Cost Optimal Level Current Requirements
The gap between
current requirements
and cost optimal is
greater than 15%
Detached Cavity – Walls 0.31 W/m2K 0.55 W/m
2K
Semi-Detached Cavity – Walls 0.31 W/m2K 0.55 W/m
2K
Apartment Block Cavity – Walls 0.31 W/m2K 0.55 W/m
2K
Average 0.31 W/m2K 0.55 W/m
2K
Bungalow Cavity – Roof 0.11 W/m2K 0.16 W/m
2K
The gap between
current requirements
and cost optimal is
greater than 15%
Detached Cavity – Roof 0.11 W/m2K 0.16 W/m
2K
Semi-Detached Cavity – Roof 0.11 W/m2K 0.16 W/m
2K
Apartment Block Cavity – Roof 0.11 W/m2K 0.16 W/m
2K
Average 0.11 W/m2K 0.16 W/m
2K
Bungalow Cavity – Floor 0.15 W/m2K 0.45 W/m
2K
The gap between
current requirements
and cost optimal is
greater than 15%
Detached Cavity – Floor 0.15 W/m2K 0.45 W/m
2K
Semi-Detached Cavity – Floor 0.15 W/m2K 0.45 W/m
2K
Apartment Block Cavity – Floor 0.15 W/m2K 0.45 W/m
2K
Average 0.15 W/m2K 0.45 W/m
2K
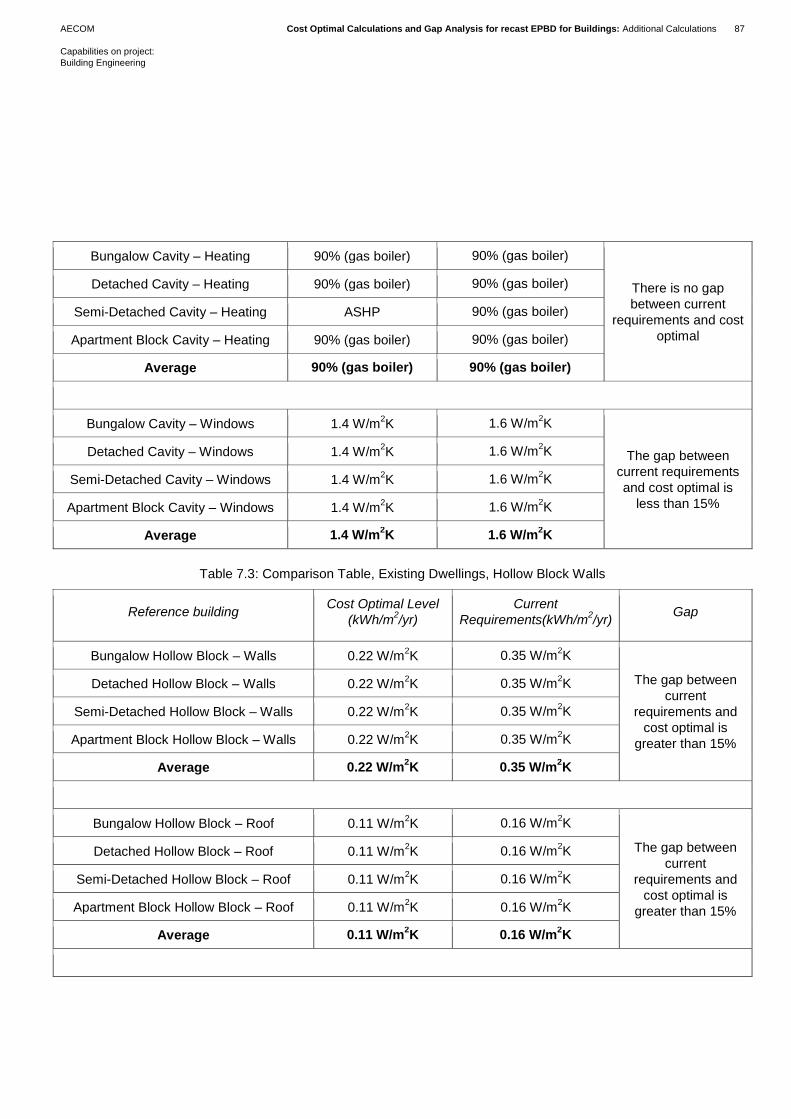
AECOM Cost Optimal Calculations and Gap Analysis for recast EPBD for Buildings: Additional Calculations 87
Capabilities on project:
Building Engineering
Bungalow Cavity – Heating 90% (gas boiler) 90% (gas boiler)
There is no gap
between current
requirements and cost
optimal
Detached Cavity – Heating 90% (gas boiler) 90% (gas boiler)
Semi-Detached Cavity – Heating ASHP 90% (gas boiler)
Apartment Block Cavity – Heating 90% (gas boiler) 90% (gas boiler)
Average 90% (gas boiler) 90% (gas boiler)
Bungalow Cavity – Windows 1.4 W/m2K 1.6 W/m
2K
The gap between
current requirements
and cost optimal is
less than 15%
Detached Cavity – Windows 1.4 W/m2K 1.6 W/m
2K
Semi-Detached Cavity – Windows 1.4 W/m2K 1.6 W/m
2K
Apartment Block Cavity – Windows 1.4 W/m2K 1.6 W/m
2K
Average 1.4 W/m2K 1.6 W/m
2K
Table 7.3: Comparison Table, Existing Dwellings, Hollow Block Walls
Reference building Cost Optimal Level
(kWh/m2/yr)
Current
Requirements(kWh/m2/yr)
Gap
Bungalow Hollow Block – Walls 0.22 W/m2K 0.35 W/m
2K
The gap between
current
requirements and
cost optimal is
greater than 15%
Detached Hollow Block – Walls 0.22 W/m2K 0.35 W/m
2K
Semi-Detached Hollow Block – Walls 0.22 W/m2K 0.35 W/m
2K
Apartment Block Hollow Block – Walls 0.22 W/m2K 0.35 W/m
2K
Average 0.22 W/m2K 0.35 W/m
2K
Bungalow Hollow Block – Roof 0.11 W/m2K 0.16 W/m
2K
The gap between
current
requirements and
cost optimal is
greater than 15%
Detached Hollow Block – Roof 0.11 W/m2K 0.16 W/m
2K
Semi-Detached Hollow Block – Roof 0.11 W/m2K 0.16 W/m
2K
Apartment Block Hollow Block – Roof 0.11 W/m2K 0.16 W/m
2K
Average 0.11 W/m2K 0.16 W/m
2K
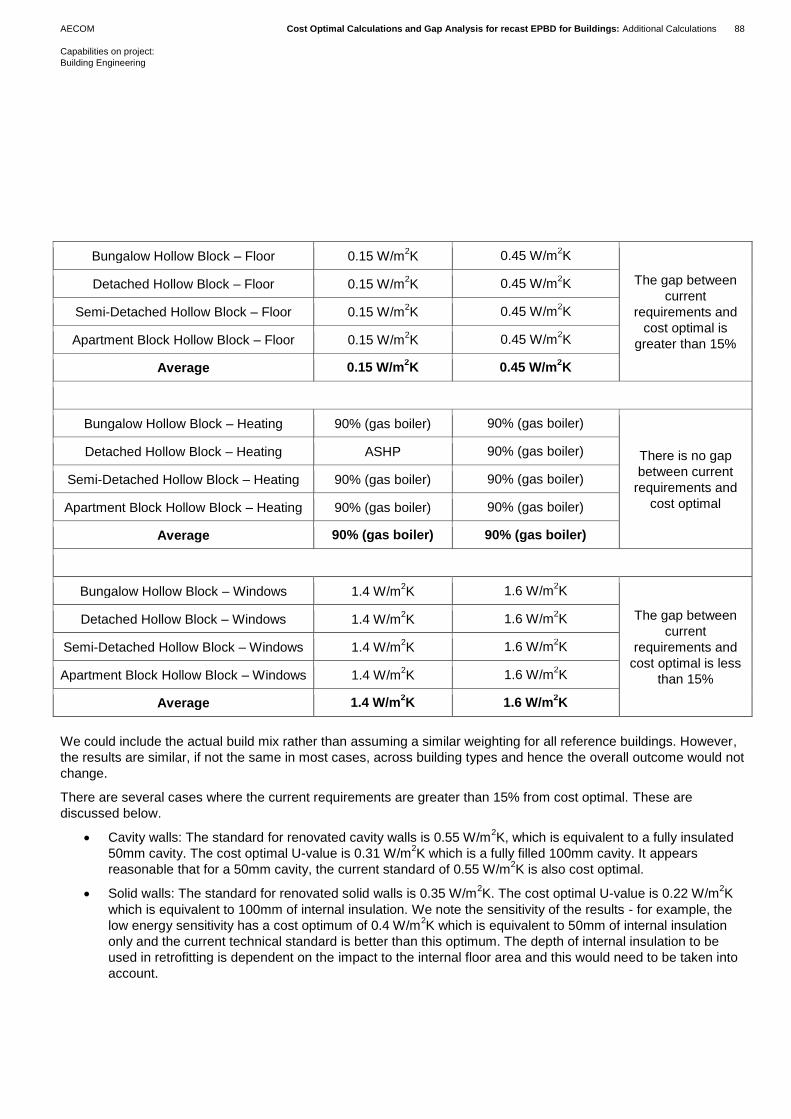
AECOM Cost Optimal Calculations and Gap Analysis for recast EPBD for Buildings: Additional Calculations 88
Capabilities on project:
Building Engineering
Bungalow Hollow Block – Floor 0.15 W/m2K 0.45 W/m
2K
The gap between
current
requirements and
cost optimal is
greater than 15%
Detached Hollow Block – Floor 0.15 W/m2K 0.45 W/m
2K
Semi-Detached Hollow Block – Floor 0.15 W/m2K 0.45 W/m
2K
Apartment Block Hollow Block – Floor 0.15 W/m2K 0.45 W/m
2K
Average 0.15 W/m2K 0.45 W/m
2K
Bungalow Hollow Block – Heating 90% (gas boiler) 90% (gas boiler)
There is no gap
between current
requirements and
cost optimal
Detached Hollow Block – Heating ASHP 90% (gas boiler)
Semi-Detached Hollow Block – Heating 90% (gas boiler) 90% (gas boiler)
Apartment Block Hollow Block – Heating 90% (gas boiler) 90% (gas boiler)
Average 90% (gas boiler) 90% (gas boiler)
Bungalow Hollow Block – Windows 1.4 W/m2K 1.6 W/m
2K
The gap between
current
requirements and
cost optimal is less
than 15%
Detached Hollow Block – Windows 1.4 W/m2K 1.6 W/m
2K
Semi-Detached Hollow Block – Windows 1.4 W/m2K 1.6 W/m
2K
Apartment Block Hollow Block – Windows 1.4 W/m2K 1.6 W/m
2K
Average 1.4 W/m2K 1.6 W/m
2K
We could include the actual build mix rather than assuming a similar weighting for all reference buildings. However,
the results are similar, if not the same in most cases, across building types and hence the overall outcome would not
change.
There are several cases where the current requirements are greater than 15% from cost optimal. These are
discussed below.
Cavity walls: The standard for renovated cavity walls is 0.55 W/m2K, which is equivalent to a fully insulated
50mm cavity. The cost optimal U-value is 0.31 W/m2K which is a fully filled 100mm cavity. It appears
reasonable that for a 50mm cavity, the current standard of 0.55 W/m2K is also cost optimal.
Solid walls: The standard for renovated solid walls is 0.35 W/m2K. The cost optimal U-value is 0.22 W/m
2K
which is equivalent to 100mm of internal insulation. We note the sensitivity of the results - for example, the
low energy sensitivity has a cost optimum of 0.4 W/m2K which is equivalent to 50mm of internal insulation
only and the current technical standard is better than this optimum. The depth of internal insulation to be
used in retrofitting is dependent on the impact to the internal floor area and this would need to be taken into
account.
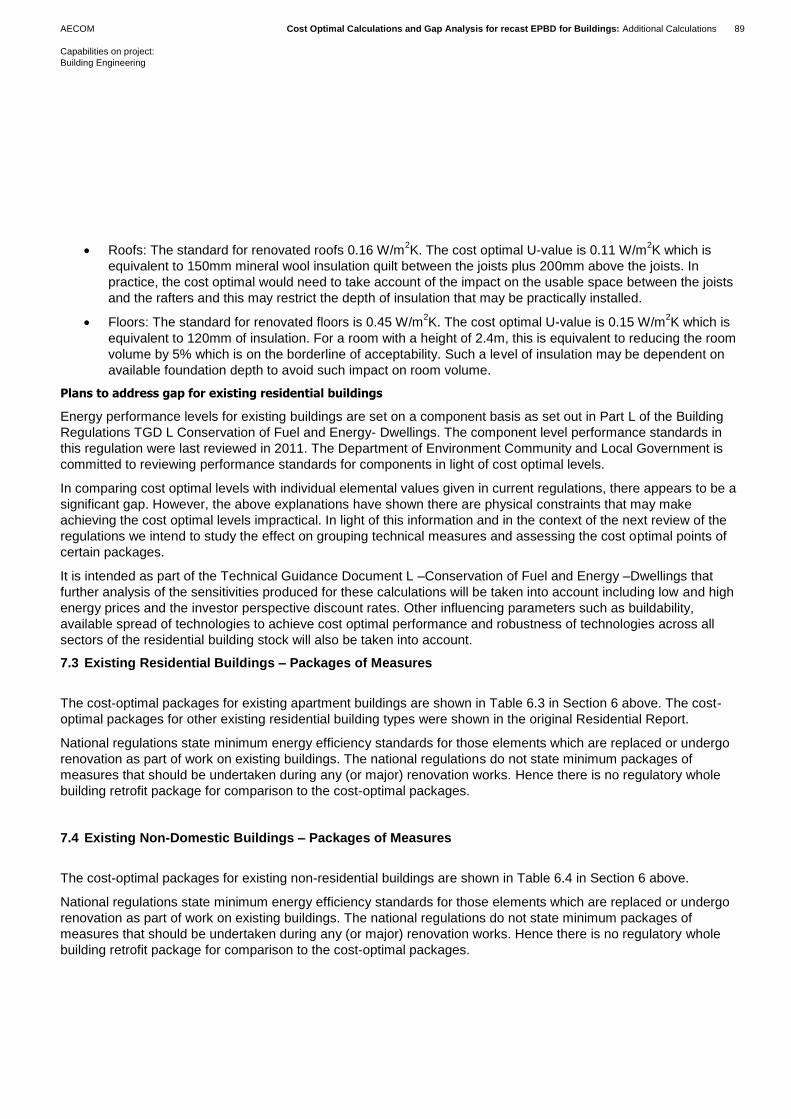
AECOM Cost Optimal Calculations and Gap Analysis for recast EPBD for Buildings: Additional Calculations 89
Capabilities on project:
Building Engineering
Roofs: The standard for renovated roofs 0.16 W/m2K. The cost optimal U-value is 0.11 W/m
2K which is
equivalent to 150mm mineral wool insulation quilt between the joists plus 200mm above the joists. In
practice, the cost optimal would need to take account of the impact on the usable space between the joists
and the rafters and this may restrict the depth of insulation that may be practically installed.
Floors: The standard for renovated floors is 0.45 W/m2K. The cost optimal U-value is 0.15 W/m
2K which is
equivalent to 120mm of insulation. For a room with a height of 2.4m, this is equivalent to reducing the room
volume by 5% which is on the borderline of acceptability. Such a level of insulation may be dependent on
available foundation depth to avoid such impact on room volume.
Plans to address gap for existing residential buildings
Energy performance levels for existing buildings are set on a component basis as set out in Part L of the Building
Regulations TGD L Conservation of Fuel and Energy- Dwellings. The component level performance standards in
this regulation were last reviewed in 2011. The Department of Environment Community and Local Government is
committed to reviewing performance standards for components in light of cost optimal levels.
In comparing cost optimal levels with individual elemental values given in current regulations, there appears to be a
significant gap. However, the above explanations have shown there are physical constraints that may make
achieving the cost optimal levels impractical. In light of this information and in the context of the next review of the
regulations we intend to study the effect on grouping technical measures and assessing the cost optimal points of
certain packages.
It is intended as part of the Technical Guidance Document L –Conservation of Fuel and Energy –Dwellings that
further analysis of the sensitivities produced for these calculations will be taken into account including low and high
energy prices and the investor perspective discount rates. Other influencing parameters such as buildability,
available spread of technologies to achieve cost optimal performance and robustness of technologies across all
sectors of the residential building stock will also be taken into account.
7.3 Existing Residential Buildings – Packages of Measures
The cost-optimal packages for existing apartment buildings are shown in Table 6.3 in Section 6 above. The cost-
optimal packages for other existing residential building types were shown in the original Residential Report.
National regulations state minimum energy efficiency standards for those elements which are replaced or undergo
renovation as part of work on existing buildings. The national regulations do not state minimum packages of
measures that should be undertaken during any (or major) renovation works. Hence there is no regulatory whole
building retrofit package for comparison to the cost-optimal packages.
7.4 Existing Non-Domestic Buildings – Packages of Measures
The cost-optimal packages for existing non-residential buildings are shown in Table 6.4 in Section 6 above.
National regulations state minimum energy efficiency standards for those elements which are replaced or undergo
renovation as part of work on existing buildings. The national regulations do not state minimum packages of
measures that should be undertaken during any (or major) renovation works. Hence there is no regulatory whole
building retrofit package for comparison to the cost-optimal packages.

AECOM Cost Optimal Calculations and Gap Analysis for recast EPBD for Buildings: Additional Calculations 90
Capabilities on project:
Building Engineering
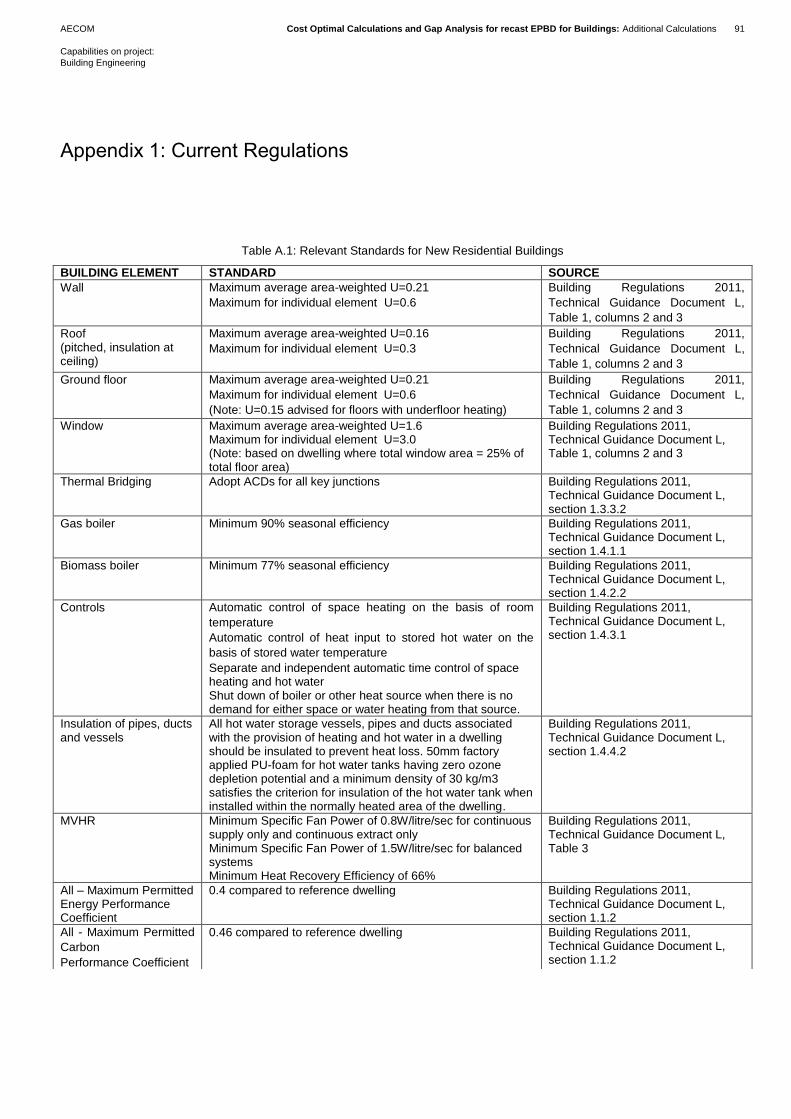
AECOM Cost Optimal Calculations and Gap Analysis for recast EPBD for Buildings: Additional Calculations 91
Capabilities on project:
Building Engineering
Table A.1: Relevant Standards for New Residential Buildings
Appendix 1: Current Regulations
BUILDING ELEMENT STANDARD SOURCE
Wall Maximum average area-weighted U=0.21
Maximum for individual element U=0.6
Building Regulations 2011,
Technical Guidance Document L,
Table 1, columns 2 and 3
Roof (pitched, insulation at ceiling)
Maximum average area-weighted U=0.16
Maximum for individual element U=0.3
Building Regulations 2011,
Technical Guidance Document L,
Table 1, columns 2 and 3
Ground floor Maximum average area-weighted U=0.21
Maximum for individual element U=0.6
(Note: U=0.15 advised for floors with underfloor heating)
Building Regulations 2011,
Technical Guidance Document L,
Table 1, columns 2 and 3
Window Maximum average area-weighted U=1.6 Maximum for individual element U=3.0 (Note: based on dwelling where total window area = 25% of total floor area)
Building Regulations 2011, Technical Guidance Document L, Table 1, columns 2 and 3
Thermal Bridging Adopt ACDs for all key junctions Building Regulations 2011, Technical Guidance Document L, section 1.3.3.2
Gas boiler Minimum 90% seasonal efficiency Building Regulations 2011, Technical Guidance Document L, section 1.4.1.1
Biomass boiler Minimum 77% seasonal efficiency Building Regulations 2011, Technical Guidance Document L, section 1.4.2.2
Controls Automatic control of space heating on the basis of room
temperature
Automatic control of heat input to stored hot water on the
basis of stored water temperature
Separate and independent automatic time control of space heating and hot water Shut down of boiler or other heat source when there is no demand for either space or water heating from that source.
Building Regulations 2011, Technical Guidance Document L, section 1.4.3.1
Insulation of pipes, ducts and vessels
All hot water storage vessels, pipes and ducts associated with the provision of heating and hot water in a dwelling should be insulated to prevent heat loss. 50mm factory applied PU-foam for hot water tanks having zero ozone depletion potential and a minimum density of 30 kg/m3 satisfies the criterion for insulation of the hot water tank when installed within the normally heated area of the dwelling.
Building Regulations 2011, Technical Guidance Document L, section 1.4.4.2
MVHR Minimum Specific Fan Power of 0.8W/litre/sec for continuous supply only and continuous extract only Minimum Specific Fan Power of 1.5W/litre/sec for balanced systems Minimum Heat Recovery Efficiency of 66%
Building Regulations 2011, Technical Guidance Document L, Table 3
All – Maximum Permitted Energy Performance Coefficient
0.4 compared to reference dwelling Building Regulations 2011, Technical Guidance Document L, section 1.1.2
All - Maximum Permitted
Carbon
Performance Coefficient
0.46 compared to reference dwelling
Building Regulations 2011, Technical Guidance Document L, section 1.1.2
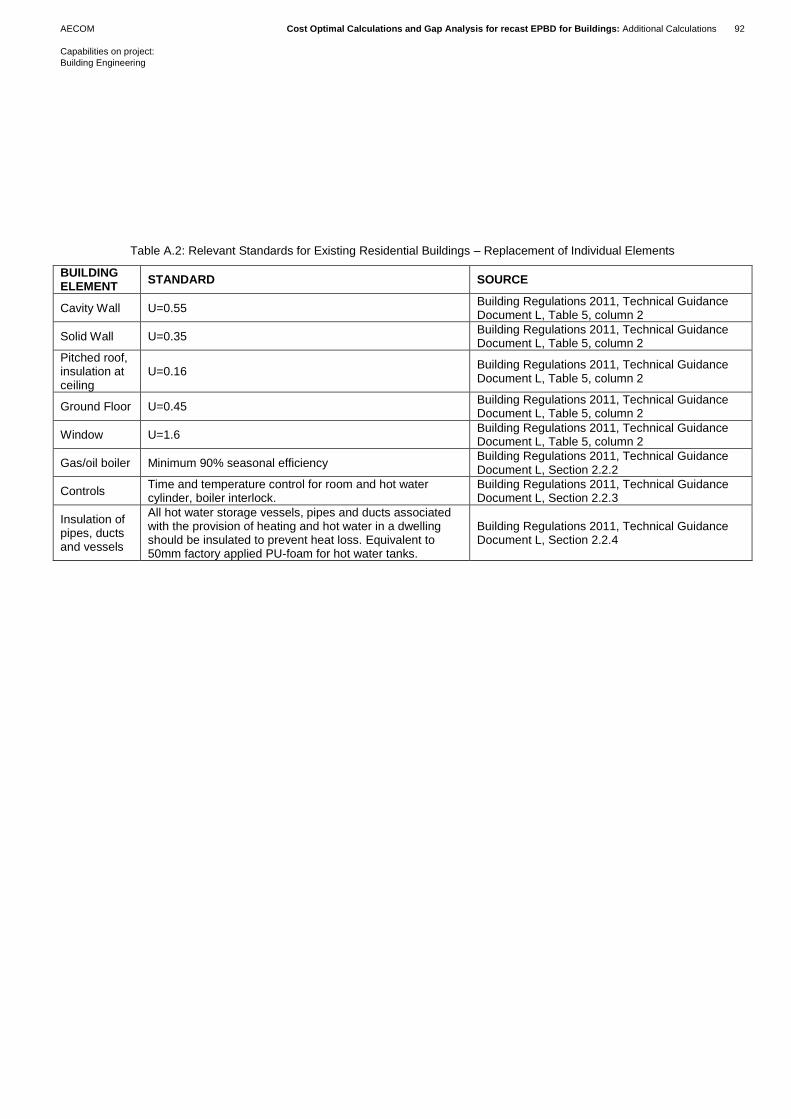
AECOM Cost Optimal Calculations and Gap Analysis for recast EPBD for Buildings: Additional Calculations 92
Capabilities on project:
Building Engineering
Table A.2: Relevant Standards for Existing Residential Buildings – Replacement of Individual Elements
BUILDING ELEMENT
STANDARD SOURCE
Cavity Wall U=0.55 Building Regulations 2011, Technical Guidance Document L, Table 5, column 2
Solid Wall U=0.35 Building Regulations 2011, Technical Guidance Document L, Table 5, column 2
Pitched roof, insulation at ceiling
U=0.16 Building Regulations 2011, Technical Guidance Document L, Table 5, column 2
Ground Floor U=0.45 Building Regulations 2011, Technical Guidance Document L, Table 5, column 2
Window U=1.6 Building Regulations 2011, Technical Guidance Document L, Table 5, column 2
Gas/oil boiler Minimum 90% seasonal efficiency Building Regulations 2011, Technical Guidance Document L, Section 2.2.2
Controls Time and temperature control for room and hot water cylinder, boiler interlock.
Building Regulations 2011, Technical Guidance Document L, Section 2.2.3
Insulation of pipes, ducts and vessels
All hot water storage vessels, pipes and ducts associated with the provision of heating and hot water in a dwelling should be insulated to prevent heat loss. Equivalent to 50mm factory applied PU-foam for hot water tanks.
Building Regulations 2011, Technical Guidance Document L, Section 2.2.4


![OPTIMAL ESTIMATION OF ELECTRODE GAP &&e …/67531/metadc702405/...The electrode gap dynamics are described by the following equation: G=iel ‘hj~g–V. [1] This equation states that,](https://img.pdfslide.us/doc/110x75/5eb71c3bf74e8137007e1177/optimal-estimation-of-electrode-gap-e-67531metadc702405-the-electrode.jpg)


![arXiv:1209.3593v2 [cond-mat.mtrl-sci] 27 Dec 2012While ab initio calculations fail to predict the collapse of the gap, they do successfully describe the size of the band gap at ambient](https://img.pdfslide.us/doc/110x75/5fac374559f4195272008c9a/arxiv12093593v2-cond-matmtrl-sci-27-dec-2012-while-ab-initio-calculations-fail.jpg)


