Embed Size (px)
Citation preview
Cost effectiveness of home and community-based care by James C. Vertrees, Kenneth G. Manton,
and Gerald S. Adler
Medicaid section 2176 waivers allow States to provide home and community-based care to Medicaid eligibles who, but for these services, would enter Medicaid-funded nursing homes. One of the conditions required by Congress for granting these waivers is that this substitution results in no additional Medicaid spending (budget neutrality). The results of case studies of two of these waiver
programs, one in California and one in Georgia, are presented in this article. The case studies contain a description of the operation of these programs in some detail. Next, the data and techniques needed to assess the ability of these programs to achieve budget neutrality are presented, and the performance of these programs along this dimension is evaluated.
Introduction Section 2176 of the Omnibus Budget Reconciliation
Act of 1981 authorized the Secretary of Health and Human Services to grant waivers to States permitting Medicaid reimbursement for certain home and community-based health and social services provided to Medicaid eligibles who, but for these services, would receive Medicaid-funded nursing home care. In applying for these waivers, the States must show that the cost of the waiver services will be offset by a reduction in nursing home costs resulting from the substitution of these services for nursing home care. This cost offset is called "budget neutrality." Thus, by reducing the use of institutional care, these waivers are seen by Congress as a potential strategy for controlling the cost of long-term care (LTC) for this population.
Presented in this article is an evaluation of the ability of two specific waiver programs for the aged and disabled—the Multipurpose Senior Services Program (MSSP) in California and the Alternative Health Services (AHS) program in Georgia—to meet the condition identified above, i.e., the congressional requirement that the programs be budget neutral. Because there is a great deal of diversity in the waiver programs for the aged and disabled across the country, the results of the evaluation of these programs may not apply to waiver programs in other States.
The original research that forms the core of this analysis is focused on four central questions: • Targeting efficiency—What percent of waiver
program enrollees would have gone to the nursing home in the absence of the waiver?
• Service efficacy—Did the services provided under the waiver deflect or defer these people from the nursing home?
The research reported in this article was supported by a subcontract to Duke University under Contract No. HCFA 500-84-0056. Supplementary analyses were supported by NIA grant AG01159. Reprint requests: Kenneth G. Manton, Duke University, Center for Demographic Studies, 2117 Campus Drive, Durham, North Carolina 27706.
• Cost effectiveness—What is the net cost of the waiver services?
• Client characteristics—What type of person should a waiver program attempt to enroll? In the sections that follow, we present our
assessment of these questions for the California MSSP and the Georgia AHS program. First the programs are described, followed by descriptions of their targeting process and of the services they offer. Next, the costs of these programs are reviewed; then the methods and data used to answer the four questions posed previously are described. Finally, the results of the analyses for both programs are presented along with our conclusions.
Description of the waiver programs California
The California MSSP received its section 2176 waiver on July 1, 1983. However, this program began operation as a demonstration funded by the Health Care Financing Administration (HCFA), and it has been serving clients since April 1980. The purpose of the demonstration was to understand the effect of the program on client outcomes and costs. In their evaluation of the California MSSP, researchers at the University of California, Berkeley, found that, although this substitution of home and community-based care for nursing home care was possible, the magnitude of this substitution effect was not large enough to make the program budget neutral (Miller et al., 1984).
The lessons learned from the evaluation of the waiver were incorporated into the design of the waiver program. Specifically, as compared with the demonstration, the waiver program uses more stringent criteria for enrollment. The enrollment criteria were tightened in order to improve client targeting by requiring that a potential client must be nursing home certified. Improved targeting was the main change to the program suggested by the internal evaluation referenced earlier. Other than this change, the waiver and demonstration programs are similar.
Health Care Financing Review/Summer 1989/volume 10, Number 4 65
Georgia
The Georgia AHS program began as a HCFA-funded section 1115 demonstration project in July 1976. The program was developed as an alternative to institutionalization for an aged, chronically ill population who, without the services provided in the demonstration, would be placed in nursing homes. The objectives of the demonstration were to provide the care necessary to maintain these individuals in the community on as independent a level as possible and to accomplish this in a cost-effective manner (Georgia Department of Medical Assistance, 1982).
In October 1981, the State of Georgia submitted an application to convert the AHS program to a section 2176 waiver program and to expand the program to statewide operation. Georgia identified three major differences between the AHS demonstration and the AHS waiver program: • Emphasis on targeting services to nursing home
applicants, such as by having AHS staff identify potential clients by reviewing applications for Medicaid preadmission certification of nursing home medical necessity, to improve targeting effectiveness.
• Reduced screening costs achieved by streamlining the process, shortening the forms, and using caseworkers in lieu of medical social workers on the assessment teams.
• Excluding home delivered meals from the package of home delivered services to reduce waiver service costs (and obtaining them from other funding sources such as title III and title XX).
Enrollment and screening Although someone may be certifiable for care in a
skilled nursing facility (SNF) or intermediate care facility (ICF), this certification alone does not mean that the person will actually enter an SNF or ICF. Certification is related to individuals' ability to maintain themselves in the community. Thus, certification generally relies on potential clients' inability to perform the kinds of activities needed for daily living (bath, toileting, eating, etc.) as well as those needed to function in society (use the telephone, manage money, shop). However, research has shown that persons who are unable to perform these kinds of activities may still maintain themselves in the community, often with the assistance of family or friends (Liu and Manton, 1988). Because people's responses to queries regarding impairment vary, threshold criteria are set low enough to protect those who cannot maintain themselves in the community. This protects the State from charges that someone was injured because of the State's failure to pay for nursing home services. However, the low threshold also implies that being nursing home certifiable is not necessarily a good predictor of the probability of future nursing home use.
California Under the terms of MSSP's waiver, potential clients
must meet three criteria in order to be eligible for the program: They must be 65 years of age or over, eligible for Medi-Cal, and certifiable for care in an SNF or an ICF.
Clients are obtained from several sources. The program has an outreach program for hospitals and LTC institutions. Clients may be referred by an institution or by their physician, or they or their families may apply directly. Potential clients are screened as a part of the case-management process. Applicants who are not nursing home certifiable and those whose ongoing treatment cost would exceed the cost of institutional care are excluded from the program. At this time, the care plan is also developed. A care plan requires the concurrence of the client's physician. It covers a complete range of medical and social services.
Georgia
The AHS waiver program, as it operated during the evaluation period, was targeted toward two groups at risk of needing institutional care: the elderly 65 years of age or over and the physically disabled under 65 years of age. All applicants to AHS are screened by a Medicaid assessment team to see if they meet the requirements for entry into the program. Referrals to the program are most often from home health agencies (e.g., when a client is about to use up his or her Medicare or Medicaid benefit) followed by hospitals, physicians, and social service agencies.
Waiver services There are two key conditions that must be met if a
waiver program is to be budget neutral. The first is client targeting, that is, identifying people who are likely to enter a nursing home in the near future. The second is that the services provided to clients bound for nursing homes must actually delay (or avoid) entry to nursing homes. As the results to be presented reveal, the second condition appears to be difficult to meet. In their attempts to provide the kinds of services needed to change the course for nursing home bound clients, California and Georgia chose different strategies: California provided a rich mix of services and Georgia provided a restructured service package. These strategies are described in detail later.
California
MSSP as an intervention consists of case management and purchased waivered services, as required by the client's condition. Case management involves the coordination and supervision of the services (medical and nonmedical) provided to a client. A case manager should be aware of the services
66 Health Care Financing Review/Summer 1989/voiume 10, Number 4

available in a particular community and know how to gain access to these services. For MSSP, the case-management team is able to purchase services if these services cannot be obtained through other funding sources (e.g., title XX). Under limited circumstances, the team can use general revenue funds to purchase special services on a one-time basis.
The 2176 waiver for MSSP allows the State agency to purchase certain services in addition to those normally covered by title XIX (Medi-Cal). These services are: • Case management—Providing counseling and
planning, and arranging for services. This is the only service provided directly by the MSSP sites.
• Adult social day care—Providing daytime social, recreational, and nutritional services.
• Housing assistance—Providing minor home repairs or modifications as needed to accommodate physical limitations of clients.
• In-home supportive services—Providing or supplementing basic household and personal care services.
• Respite care—Providing occasional client supervision in order to provide some relief to caregivers.
• Transportation—Providing transportation to places where services are delivered.
• Meal services—Providing meals in home or congregate settings.
• Protective services—Providing protection to those who are abused or exploited.
• Special communication—Providing interpreters, translators, and special electronic communication devices. It does not include normal telephone service.
Georgia
Case management and assessments are administrative functions of the AHS program, and these functions are provided by its assessment teams. Three types of service packages are available in the AHS program: adult day rehabilitation (ADR), home delivered services (HDS), and alternative living services (ALS). Generally, waiver clients receive services from one of these packages. • Adult day rehabilitation—Provision of health and
health-related support services in a central facility on a daytime, outpatient basis to chronically ill or impaired individuals. Services targeted to persons who cannot live independently but who do not require 24-hour care.
• Home delivered services—Provision of home health services and personal care services on an intermittent basis to chronically ill or impaired persons in their homes. HDS services include skilled nursing services, physical and occupational therapies, home health aide services, personal care services, and medically related transportation.
• Alternative living services—Provision of 24-hour supervision, medically oriented personal care, and
health-related support services in a residential setting other than the client's own home. The two basic means of providing clients with ALS services are through family personal care homes and group personal care homes.
Service costs The costs of the packages of services described
above are described in this section. These costs, of course, must be (and are) less per person per month than nursing home costs. However, this does not guarantee that the programs will be budget neutral.
California
In this section the costs of the MSSP program are reviewed. For MSSP, it is possible to separate service costs for waiver and nonwaiver services and to isolate program overhead costs. The average cost per person for the MSSP for the study period, California fiscal year (FY) 1984 (July 1, 1983-June 30, 1984), is presented in Table 1. It is important to note that these costs are for the first program year. Certain fixed costs are incurred by the MSSP sites irrespective of the level of program enrollment. This period was selected for the comparative analysis because it is the time for which data for a comparison group (necessary for analyses reported later) was available. Because enrollments at the sites increased during the first and second years of program operation, fixed costs from later years should be lower on a per recipient basis (Cole, 1987).
These figures are monthly averages for the 2,107 recipients (13,570 client months) in FY 1984. The most expensive waivered service is case management— a service received by all waiver program enrollees. Case management is followed in cost by in-home support services and transportation. Overhead charges are almost one-half the average cost per person per month. The level of overhead cost is partly a function
Table 1 Average cost per person per month,
by type of waivered service and overhead: California, fiscal year 1984
Type of waiver service and overhead Cost
Total $350.43 Service 177.43
Case management 117.00 Adult day care Housing assistance In-home support Respite care Transportation Meal services
2.26 3.02
35.16 0.47
12.65 1.37
Protective services 3.90 Special communication
Overhead 1.60
173.00 Site State
143.00 30.00
SOURCE: State of California, Department of Public Welfare: Data from the California Medi-Cal program.
Health Care Financing Review/Summer 1989/volume 10, Number 4 67
of the fact that these data reflect the first year of the program.
As noted earlier, these figures are important because they can be used to define the number of people that the program must divert from nursing homes in order to meet its budget neutrality objective. Cost figures for FY 1984 are reported in order to remain consistent with the person level analysis of service use. (Using more recent data would not significantly change the budget neutral target percent and would not affect the conclusions reported later.) It is important to note that this definition of budget neutrality is limited to Medicaid spending. Including other categories of Federal assistance would make budget neutrality a much more difficult objective to meet. Specifically, Supplemental Security Income, State supplemental payment, and title XX payments cease when someone enters a nursing home whereas, in the program, they may continue. These payments averaged $352 per month for MSSP enrollees in FY 1984.
Georgia
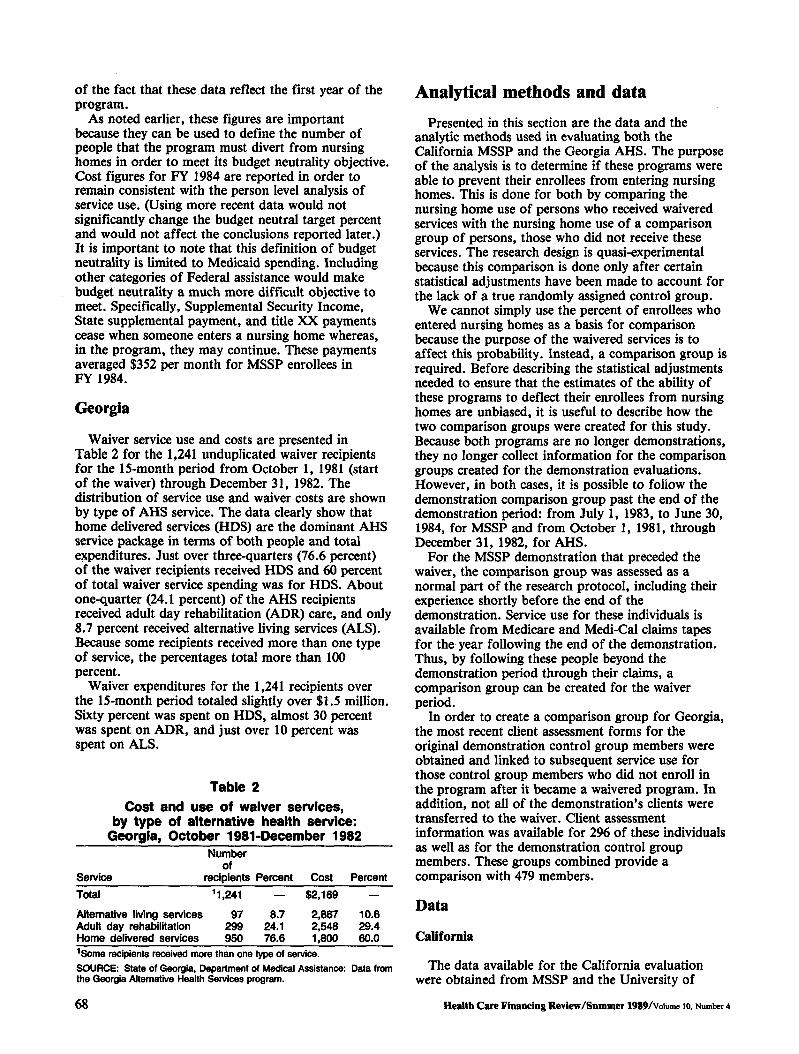
Waiver service use and costs are presented in Table 2 for the 1,241 unduplicated waiver recipients for the 15-month period from October 1, 1981 (start of the waiver) through December 31, 1982. The distribution of service use and waiver costs are shown by type of AHS service. The data clearly show that home delivered services (HDS) are the dominant AHS service package in terms of both people and total expenditures. Just over three-quarters (76.6 percent) of the waiver recipients received HDS and 60 percent of total waiver service spending was for HDS. About one-quarter (24.1 percent) of the AHS recipients received adult day rehabilitation (ADR) care, and only 8.7 percent received alternative living services (ALS). Because some recipients received more than one type of service, the percentages total more than 100 percent.
Waiver expenditures for the 1,241 recipients over the 15-month period totaled slightly over $1.5 million. Sixty percent was spent on HDS, almost 30 percent was spent on ADR, and just over 10 percent was spent on ALS.
Table 2 Cost and use of waiver services,
by type of alternative health service: Georgia, October 1981-December 1982
Number of
Service recipients Percent Cost Percent Total 11,241 — $2,169 —
Alternative living services 97Adult day rehabilitation 299
8.7 24.1
2,867 2,548
10.6 29.4
Home delivered services 950 76.6 1,800 60.0
1Some recipients received more than one type of service. SOURCE: State of Georgia, Department of Medical Assistance: Data from the Georgia Alternative Health Services program.
Analytical methods and data Presented in this section are the data and the
analytic methods used in evaluating both the California MSSP and the Georgia AHS. The purpose of the analysis is to determine if these programs were able to prevent their enrollees from entering nursing homes. This is done for both by comparing the nursing home use of persons who received waivered services with the nursing home use of a comparison group of persons, those who did not receive these services. The research design is quasi-experimental because this comparison is done only after certain statistical adjustments have been made to account for the lack of a true randomly assigned control group.
We cannot simply use the percent of enrollees who entered nursing homes as a basis for comparison because the purpose of the waivered services is to affect this probability. Instead, a comparison group is required. Before describing the statistical adjustments needed to ensure that the estimates of the ability of these programs to deflect their enrollees from nursing homes are unbiased, it is useful to describe how the two comparison groups were created for this study. Because both programs are no longer demonstrations, they no longer collect information for the comparison groups created for the demonstration evaluations. However, in both cases, it is possible to foiiow the demonstration comparison group past the end of the demonstration period: from July 1, 1983, to June 30, 1984, for MSSP and from October 1, 1981, through December 31, 1982, for AHS.
For the MSSP demonstration that preceded the waiver, the comparison group was assessed as a normal part of the research protocol, including their experience shortly before the end of the demonstration. Service use for these individuals is available from Medicare and Medi-Cal claims tapes for the year following the end of the demonstration. Thus, by following these people beyond the demonstration period through their claims, a comparison group can be created for the waiver period.
In order to create a comparison group for Georgia, the most recent client assessment forms for the original demonstration control group members were obtained and linked to subsequent service use for those control group members who did not enroll in the program after it became a waivered program. In addition, not all of the demonstration's clients were transferred to the waiver. Client assessment information was available for 2% of these individuals as well as for the demonstration control group members. These groups combined provide a comparison with 479 members.
Data
California
The data available for the California evaluation were obtained from MSSP and the University of
68 Health Care Financing Review/Summer 1989/voiume IO, Number 4

California, Berkeley. The same kinds of data were collected for the comparison and client groups. The data sources are the following: • The assessment instrument—This is the tool used by
the program to determine if someone is at risk for nursing home use and to define the services needed. This is the source for demographic, health, functional status, mental acuity, and living arrangement information. For clients, this information is collected at enrollment. For the comparison group, this information was collected during the 6 months prior to the program's transition from a demonstration to a waiver.
• The timeline file—This file documents the timing and duration of the treatment events for both clients and controls. Nursing home admission and discharge data were obtained from Medi-Cal bill files, the date of death data from county health departments, the hospital admission and discharge dates from the Medicare fiscal intermediary in California, and the "lost to followup" date from the site.
Georgia
Two data sources were used for the AHS evaluation. • The assessment instrument—Hard copies of the
AHS assessment instrument form were obtained from program offices throughout the State, keypunched, and verified for 990 of the 1,770 enrollees during the first 15 months of the waiver. Forms for the remaining enrollees were lost, misfiled, or otherwise unavailable for this research. The assessment instrument was filled out for each client by a nurse or social worker and signed by a physician.
• Paid claims—The second data source was the Medicaid claims tapes from Georgia. These data contain dates for death and for various kinds of service use. This data source was used to construct the timeline for each person in the intervention and comparison groups.
Overview of the analytic strategy
The purpose of this analysis is to estimate the net cost to Medicaid of the waiver programs in California and Georgia. The programs provide home and community-based services to their enrollees and incur costs in so doing. The waiver program's major premise is that the cost of these home and community-based services will be offset by reductions in the use of other Medicaid services, nursing home care in particular. More specifically, waiver services could be substitutes for nursing home services, they could be substitutes for hospital services, or they could delay entry to nursing homes. Alternatively, the case manager could, in effect, substitute waivered services or nursing home days for hospital days. Because home and community-based services are less
expensive than institutional services, these substitutions would offset some or all of the costs of the program.
In order to know if such substitution has occurred, one needs to know what services clients would have used had they not been enrolled in the program. This objective can be achieved by comparing service use for clients with service use for individuals who are otherwise identical to the clients except that they did not receive program services. A control group drawn at random from the same population as the waiver clients would meet this ideal design, as would matched pairs of specially selected individuals, but this kind of control group was not available for this analysis. Instead, the comparison group from the earlier demonstration period, followed forward for 1 year, was available, but this group cannot be assumed to match the client group in terms of the factors that influence nursing home use. In order to make a valid comparison, these characteristics will be controlled statistically by a technique known as grade of membership (GOM).
Second, the time that people spend in the various states must also be systematically accounted for. The time that an individual is observed before he or she makes a given transition (goes to a nursing home, goes home from a nursing home, goes to a hospital, dies, etc.) will be systematically different for clients and the comparison group. For example, if the number of nursing home admissions were simply counted for clients and comparison group members, and given that the comparison group is observed for a full year while clients are enrolled during the course of the year, one would tend to observe more nursing home admissions for the comparison group simply because they were observed for a longer time, on average. Likewise, when people die, they cannot enter nursing homes, so then a comparison of the experiences of clients and comparison group members needs to be adjusted for differences in death rates. Finally, because one intended effect of these waiver programs' services is to delay nursing home use, the service use comparison must include the concept of delay. That is, if the program begins in July, then a nursing home admission in August must be counted differently than a nursing home admission the following May. Accounting for exposure time and the duration of a person's stay in various settings (including at home) is critical if valid service use comparisons are to be made. The failure to adjust for the differences involving time and duration would be the second threat to the validity of a simple comparison, a threat that is addressed by the life table method.
Grade of membership
The GOM model is a pattern recognition technique. As such, it provides a way to summarize the multiple variables and their interactions that describe the observations, e.g., different types of elderly people. To understand GOM, it is first necessary to gain an
Health Care Financing Review/Summer 1989/volume 10, Number 4 69
intuitive grasp of its logical structure—the kind of groups it creates and the way that people are assigned to each group (Woodbury and Manton, 1982).
The logical structure of GOM involves a type of classification that is based on the concept of "fuzzy boundary groups." This is different from the kind of groups more commonly used that are called "fixed boundary" groups. For example, ordinary groups require that someone either has blue or brown eyes, straight or curly hair, etc. These fixed boundaries define conventional groups. For example, a conventional group in this example would be all people with straight hair and brown eyes. The problem with this concept becomes clear when the first individual with wavy hair and hazel eyes appears.
In contrast, GOM creates "pure types" that are more like archetypes or extreme values where, instead of being exclusively in one group (and not in any other), an individual is characterized as more like one pure type and less like others. In other words, in the GOM analysis, people are described by the sum of their partial membership in several groups, where the groups themselves define the extremes naturally occurring in the population. In terms of the wavy hair, hazel eyes example, these characteristics are blends of straight and nappy hair and green and brown eyes. The GOM pure types (described later for these populations) are the results of the more general pattern recognition properties of the GOM model. Thus, the pure types themselves need to be described in a more heuristic fashion.
A fuzzy partition (a GOM pure type) is characterized by a set of multivariate profiles of the variables entered into the analyses and a set of GOM scores for each individual that relate each individual to one or more of these profiles. Specifically, the GOM scores indicate the degree to which an individual has the characteristics of a given pure type. Thus, no individual is necessarily classified in one and only one group or another (as in more conventional approaches), but rather the scores for an individual contain the portion of the risk of nursing home use associated with each pure type.
The GOM model was specifically developed for multivariate analyses of medical diagnosis and symptom patterns. In particular, it was designed to cope with the fact that any naturally occurring population will exhibit considerable variation within general disease categories such as lung cancer. This heterogeneity is the result of differences in such factors as disease progression or severity and the interaction of a person's characteristics with the disease mechanism. Such problems clearly emerge for chronic physiological disease processes and in elderly patient populations. The GOM model has proved successful in describing the more complex clinical characteristics of both acute and long-term care clinical populations.
The GOM model can be formally defined in terms of four basic quantities. The first is the data. The data for a person, say /, can be coded into a set of J binary variables. If a given variable has multiple
70
response levels, it will have to be coded in / binary variables where there is one binary (0 or 1) variable for each response level. Let us designate these binary variables as X^. The second quantity we need to define is K, which is the number of risk of nursing home admission dimensions or types that are necessary to capture all of the nonrandom variations in the /observed variables (i.e., all of the nonrandom variation in the data). The third and fourth quantities are the coefficients generated by the analysis to predict the Xijh The first coefficients are the X^/s. These represent the probability that a person of Arth type has the /th response to they'th variable. These coefficients are like factor loadings (i.e., the correlation between the observed variables and the analytically derived factors) except, of course, that they are generated for discrete response data. The second type of coefficient are the gik's, i.e., the degree to which the /th person is represented by the kth type. The gik's are linear weights that sum to 1.0 for a person and may vary between 0 and 1.0. With these quantities, we can write the GOM model as
k
where Xyt is the probability predicted by the model that the /th person has the /th response to the y'th variable (i.e., PROB X0, = 1.0). We can see that discrete partitioning is a special case of GOM, where the gjk's must be either zero or 1.0 for a given person.
The estimation of the gik's and X^/s is done by maximum likelihood procedures. That is, iterative procedures are used to select the values of gjk and X̂ y that maximize the likelihood function or
L = n n n (Egik x*y7) xui. (2) i j l k
The likelihood function also offers a way of testing if an adequate number of fuzzy partitions has been selected in order to explain all of the nonrandom information in the data. The change in the value of the logarithm of L when a fuzzy partition is added (i.e., K is increased to K+ 1) is approximately x2
distributed with degrees of freedom calculated using the number of gik's and \kJ/s that have to be estimated for the (K+ l)th partition. In addition, it can also be shown that the X^/s are consistently estimated and that the moments of the distribution of the gjk's can be consistently estimated up to a large number determined by the data (Vertrees and Manton, 1987; Manton et al., 1987; Chiang, 1968).
The first problem to be faced in this analysis, then, is that the comparison group and the waiver group differ along the multiple dimensions of health status, functional ability, demographics, and living arrangements, each of which may be measured by several variables. GOM will be used to create pure type groups from data reflecting each of these dimensions and simultaneously to assign GOM scores to each person for each of the resultant groups (pure types).
This technique controls for differences between the clients and controls along all of these dimensions. Specifically, assume that one pure type is very
Health Care Financing Review/Summer 1989/Volume 10, Number 4
impaired and likely to require nursing home services. Some persons in each of the population groups (clients and controls) will be represented in this category, but, because the control group is healthier as a group than the intervention (waiver) group, fewer of the comparison group will be classified as very like this type. Nonetheless, if some people in both the intervention and control groups belong to this very frail type, at least in part, then the probability of and the time until nursing home entry can be estimated for both.
Because these transition probabilities can be estimated for each pure type and because any individual is defined in terms of similarity to each of the pure types, the likely effect of the waivered services on any individual with any combination of health or functional status problems can be estimated. In a similar vein, if an individual has particular characteristics at one time, such as at assessment, then these characteristics will identify a specific pattern of gik scores for that individual at that time. At each new assessment, the individual will be different, even if only because he or she is older. These differences will result in a new set of grade of membership scores at each new assessment.
Each pure type will have its own probability of nursing home use. In order to achieve the maximum potential savings, one should target toward the pure type with the highest probability of nursing home use. The targeting effectiveness of a given program is obtained from the blend of its clients among the pure types.
Life table technique
One of the key issues for this analysis is the relationship between functional assessments (which occur once for clients and may occur several times at regular intervals for controls) and service use. One approach that might be taken is to use the assessment variables in a Cox regression model to predict the risk of nursing home use over a 12-month followup period. In the Cox regression framework, one would divide the data into two observations, i.e., one where the covariates measured at time one are used to predict the risk of a single type of service episode between time one and time two and a second where covariates measured at time two are used over the subsequent 12-month period.
An obvious problem with this strategy is that it does not deal with the fact that multiple episodes and types of service use can occur between assessments. That is, an individual may start at home, go to a hospital, go home, then later go to a nursing home. Using GOM, these multiple episodes can be analyzed. To do this, we define two types of variables. The first are process covariates, i.e., the variables measured at the time of the assessment that describe the health and functional status of the person. The second are transition variables—variables that describe the multiple-service episodes: home, hospital, home, and SNF in the example cited earlier.
To use the life table model, it is necessary to create a life table type variable for each episode for each person in the study. For the life table variable for home episodes, it is necessary to know why the observation was terminated—hospital or nursing home entry, death, end of study, or reassessment. Suppose a person entered a hospital after living for 3 months at home. In this event, the person would receive a code ("1") indicating a hospital admission in month three, removing this person from the community life table. At this time, the person enters the hospital life table and the clock runs until it is stopped by one of the reasons previously mentioned—in this example, discharge to home. Thus, for the three types of service episodes already defined, we construct three variables (7=3) such that the number of response levels for each variable is equal to the number of time intervals (e.g., months) times the number of possible exit states. In our example, the 12 monthly time intervals times the 6 possible exit states define 72 possible response levels for each of the service types. The time interval can be changed as necessary, e.g., duration in the hospital is measured in days. Once the transition information for all of the individuals in the study is coded in this way, we can use GOM to estimate the probabilities for each of these transitions. These coded variables are entered into the GOM model as external (nongrouping) variables. As a second step, the GOM program estimates the probability of a given transition at a given time. These probability estimates are used to calculate the cause elimination life tables (Tolley et al., 1988).
Thus, the GOM model produces estimates of the probability of a particular transition at a specific time estimated separately for client and comparison group members. These probabilities were estimated for transitions from community, nursing home, and hospital to nursing home, hospital, death, community, any new assessment, and end of study or lost to followup. For MSSP only, an additional exit state was defined. Nursing home stays longer than 4 months were defined as permanent nursing home stays causing the observation to be terminated. This reflected the original research and data collection design for the demonstration evaluation and was based on the observation that as one's stay in a nursing home increases, the probability of leaving declines.
The X̂ y estimates described above are confounded by the fact that, for some observations, death (or another of the absorbing states) intervened before this transition would otherwise have occurred. Because this confounding may be different for clients and comparison groups, it is a source of bias in the raw estimates. This phenomenon is called "right censoring."
The purpose of a cause-elimination life table is to statistically eliminate the effect of censoring from estimates of transition times and rates for states of particular interest—in this case, hospital, nursing home, and permanent nursing home. In other words, the cause-elimination life table adjusts estimates of the probability that someone with, for example, pure type
Health Care Financing Review/Summer 1989/voiume to, Number 4 71
1 characteristics will enter a nursing home and of the time from assessment to entry, for the confounding effects of an observation ending in an assessment, study end, or the person being lost to followup. Adjustment for these effects is referred to as "cause elimination." In essence, the calculation works by reintroducing a person who, for example, died to the life table and, thereby, exposing this person to the statistical risks that he or she would have faced had death not occurred at that time. This removes death as a cause of decrement and allows comparisons to be made between two populations with different death rates. Beyond adjusting for the effects of these causes, an estimate may be made either with or without death as a competing risk. Because service use is of principal concern for this study and because differential death rates between waiver clients and comparison group members distort the estimates, the life table results reported below include this adjustment.
Grade of membership analysis
California The variables used in the analysis, in concert, define
the pure types. Descriptions of these are found in the "Variable" column of Table 3 for MSSP. The labels are self-explanatory. The "Population" column represents the proportion of the population with a "yes" answer for that variable.
Some variables, instrumental activities of daily living (IADL's), are common in this population so that types may be distinguished by the absence of a prevalent characteristic. Note that, although a person who is 100 percent like type 1 will have all of the problems that characterize this type, few people are 100 percent like any type. Most individuals are blends of two types or more and, thus, have some of the characteristics of one type and some characteristics of another. The types are the extremes of the combinations of variables needed to define the underlying groups in the population.
Based on the information presented in Table 3, the five types in the MSSP treatment and control groups may be characterized as: • Type 1. These are very old, very impaired people.
Their medical problems are consistent with this characterization, consisting of stroke, epilepsy, and paralysis. They have most of the activity of daily living (ADL) problems and all of the IADL problems. They are more often black, tend to have lower levels of education, are more often forced to move, and are confused as measured by the Portable Mental Status Questionnaire. They are not alone, otherwise they likely could not reside in the community.
• Type 2. These are healthier, younger females who live alone. Like type 3, these people are more often members of the comparison group and are rarely enrolled in the waiver program. This is an indication of the success of the efforts at targeting
72
made by the waiver program. In addition, this type illustrates that GOM pure types are extreme in the population. For this population, one extreme is being fairly healthy.
• Type 3. These are older widows. They are not as impaired (in ADL and IADL terms) as other types, but they live alone. They are inclined to heart problems. Mobility is a problem, and limitations in performing IADL's are prevalent. Because these people do not have the informal support present in type 1, they probably could not be as impaired as type 1 people are and still remain in the community. Types 1 and 2 are more often enrolled in the waiver and/or are participants in the demonstration as clients. However, some controls are at least partly members of these types. It is this partial membership that allows comparisons of service use between the waiver clients and the comparison group.
• Type 4. These are the first and only type that are more likely to be male than female. These people suffer from cancer, report health status as poor, and may be very old. They are more often Hispanic. They have difficulty in travelling and with other IADL's but not with ADL problems.
• Type 5. These are the acutely ill group. Consistent with this is the finding that they are more often bedfast. Their activities are otherwise curtailed, they report that they feel bad, and they often have four dangerous diagnoses or more. Among their medical problems are cancer, heart disease, kidney problems, and mental illness. This type is typically younger, female, and not married. These five types describe the population enrolled in
the waiver and in the demonstration client and comparison groups. In order to test the ability of these groups to control for differences in the multiple factors that influence service use, a separate GOM analysis was done that included nursing home entry and hospital service use as grouping variables. The difference in the overall explanatory power of the two sets of GOM groups was evaluated and found not to be significant. In other words, actual service use did not contribute significantly to the model, suggesting that the information used to create these types was adequate to control for systematic differences between those who received MSSP's services and those who did not.
Georgia The Georgia GOM's analysis indicates that the
program enrolls a much sicker and frailer population than MSSP does. Three of the pure types look like probable nursing home candidates. Because the number of pure types needed to describe a population is determined by the analysis, the fact that both populations can be described using five types is coincidental. The number assigned to a type carries no
NOTE: To conserve space, the tables on which the discussion in this section is based are available from the authors.
Health Care Financing Review/Summer 1989/volume 10. Number 4
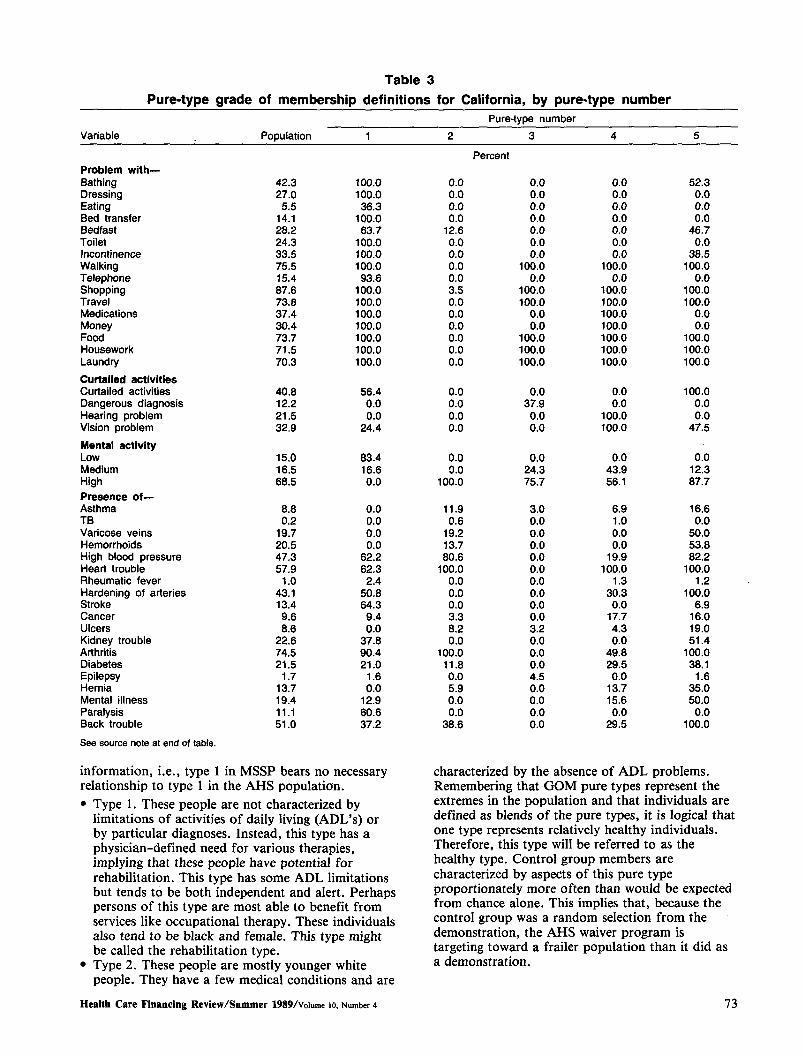
Table 3 Pure-type grade of membership definitions for California, by pure-type number
Pure-type number Variable Population
Percent Problem with— Bathing Dressing Eating Bed transfer
42.3 27.0 5.5
14.1
100.0 100.0 36.3
100.0
0.0 0.0 0.0 0.0
0.0 0.0 0.0 0.0
0.0 0.0 0.0 0.0
52.3 0.0 0.0 0.0
Bedfast 28.2 63.7 12.6 0.0 0.0 46.7 Toilet 24.3 100.0 0.0 0.0 0.0 0.0 Incontinence 33.5 100.0 0.0 0.0 0.0 38.5 Walking Telephone Shopping Travel
75.5 15.4 87.6 73.8
100.0 93.6
100.0 100.0
0.0 0.0 3.5 0.0
100.0 0.0
100.0 100.0
100.0 0.0
100.0 100.0
100.0 0.0
100.0 100.0
Medications 37.4 100.0 0.0 0.0 100.0 0.0 Money Food
30.4 73.7
100.0 100.0
0.0 0.0
0.0 100.0
100.0 100.0
0.0 100.0
Housework 71.5 100.0 0.0 100.0 100.0 100.0 Laundry 70.3 100.0 0.0 100.0 100.0 100.0 Curtailed activities Curtailed activities 40.8 56.4 0.0 0.0 0.0 100.0 Dangerous diagnosis Hearing problem Vision problem
12.2 21.5 32.9
0.0 0.0
24.4
0.0 0.0 0.0
37.9 0.0 0.0
0.0 100.0 100.0
0.0 0.0
47.5 Mental activity Low 15.0 83.4 0.0 0.0 0.0 0.0 Medium 16.5 16.6 0.0 24.3 43.9 12.3 High 68.5 0.0 100.0 75.7 56.1 87.7 Presence of— Asthma 8.8 0.0 11.9 3.0 6.9 16.6 TB 0.2 0.0 0.6 0.0 1.0 0.0 Varicose veins 19.7 0.0 19.2 0.0 0.0 50.0 Hemorrhoids 20.5 0.0 13.7 0.0 0.0 53.8 High blood pressure Heart trouble
47.3 57.9
62.2 62.3
80.6 100.0
0.0 0.0
19.9 100.0
82.2 100.0
Rheumatic fever 1.0 2.4 0.0 0.0 1.3 1.2 Hardening of arteries Stroke
43.1 13.4
50.8 64.3
0.0 0.0
0.0 0.0
30.3 0.0
100.0 6.9
Cancer 9.6 9.4 3.3 0.0 17.7 16.0 Ulcers 8.6 0.0 8.2 3.2 4.3 19.0 Kidney trouble Arthritis
22.6 74.5
37.8 90.4
0.0 100.0
0.0 0.0
0.0 49.8
51.4 100.0
Diabetes 21.5 21.0 11.8 0.0 29.5 38.1 Epilepsy Hernia
1.7 13.7
1.6 0.0
0.0 5.9
4.5 0.0
0.0 13.7
1.6 35.0
Mental illness 19.4 12.9 0.0 0.0 15.6 50.0 Paralysis Back trouble
11.1 51.0
60.6 37.2
0.0 38.6
0.0 0.0
0.0 29.5
0.0 100.0
See source note at end of table.
information, i.e., type 1 in MSSP bears no necessary relationship to type 1 in the AHS population. • Type 1. These people are not characterized by
limitations of activities of daily living (ADL's) or by particular diagnoses. Instead, this type has a physician-defined need for various therapies, implying that these people have potential for rehabilitation. This type has some ADL limitations but tends to be both independent and alert. Perhaps persons of this type are most able to benefit from services like occupational therapy. These individuals also tend to be black and female. This type might be called the rehabilitation type.
• Type 2. These people are mostly younger white people. They have a few medical conditions and are
characterized by the absence of ADL problems. Remembering that GOM pure types represent the extremes in the population and that individuals are defined as blends of the pure types, it is logical that one type represents relatively healthy individuals. Therefore, this type will be referred to as the healthy type. Control group members are characterized by aspects of this pure type proportionately more often than would be expected from chance alone. This implies that, because the control group was a random selection from the demonstration, the AHS waiver program is targeting toward a frailer population than it did as a demonstration.
Health Care Financing Review/Summer 1989/Voiume 10, Number 4 73
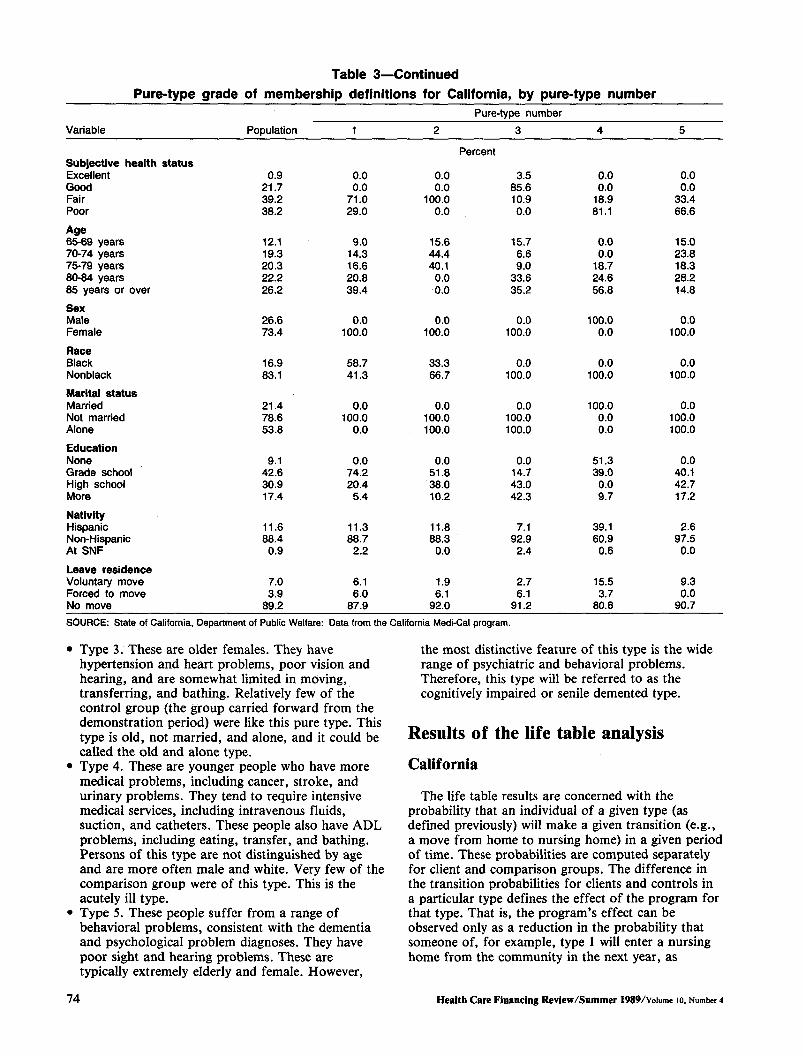
Table 3—Continued Pure-type grade of membership definitions for California, by pure-type number
Pure-type number Variable Population
Percent Subjective health status Excellent 0.9 0.0 0.0 3.5 0.0 0.0 Good 21.7 0.0 0.0 85.6 0.0 0.0 Fair 39.2 71.0 100.0 10.9 18.9 33.4 Poor 38.2 29.0 0.0 0.0 81.1 66.6
Age 65-69 years 70-74 years 75-79 years 80-84 years 85 years or over
12.1 19.3 20.3 22.2 26.2
9.0 14.3 16.6 20.8 39.4
15.6 44.4 40.1
0.0 0.0
15.7 6.6 9.0
33.6 35.2
0.0 0.0
18.7 24.6 56.8
15.0 23.8 18.3 28.2 14.8
Sex Male 26.6 0.0 0.0 0.0 100.0 0.0 Female 73.4 100.0 100.0 100.0 0.0 100.0
Race Black 16.9 58.7 33.3 0.0 0.0 0.0 Nonblack 83.1 41.3 66.7 100.0 100.0 100.0
Marital status Married 21.4 0.0 0.0 0.0 100.0 0.0 Not married 78.6 100.0 100.0 100.0 0.0 100.0 Alone 53.8 0.0 100.0 100.0 0.0 100.0
Education None 9.1 0.0 0.0 0.0 51.3 0.0 Grade school 42.6 74.2 51.8 14.7 39.0 40.1 High school More
30.9 17.4
20.4 5.4
38.0 10.2
43.0 42.3
0.0 9.7
42.7 17.2
Nativity Hispanic Non-Hispanic At SNF
11.6 88.4 0.9
11.3 88.7 2.2
11.8 88.3 0.0
7.1 92.9
2.4
39.1 60.9
0.6
2.6 97.5
0.0
Leave residence Voluntary move 7.0 6.1 1.9 2.7 15.5 9.3 Forced to move 3.9 6.0 6.1 6.1 3.7 0.0 No move 89.2 87.9 92.0 91.2 80.8 90.7 SOURCE: State of California, Department of Public Welfare: Data from the California Medi-Cal program.
Type 3. These are older females. They have hypertension and heart problems, poor vision and hearing, and are somewhat limited in moving, transferring, and bathing. Relatively few of the control group (the group carried forward from the demonstration period) were like this pure type. This type is old, not married, and alone, and it could be called the old and alone type. Type 4. These are younger people who have more medical problems, including cancer, stroke, and urinary problems. They tend to require intensive medical services, including intravenous fluids, suction, and catheters. These people also have ADL problems, including eating, transfer, and bathing. Persons of this type are not distinguished by age and are more often male and white. Very few of the comparison group were of this type. This is the acutely ill type. Type 5. These people suffer from a range of behavioral problems, consistent with the dementia and psychological problem diagnoses. They have poor sight and hearing problems. These are typically extremely elderly and female. However,
the most distinctive feature of this type is the wide range of psychiatric and behavioral problems. Therefore, this type will be referred to as the cognitively impaired or senile demented type.
Results of the life table analysis California
The life table results are concerned with the probability that an individual of a given type (as defined previously) will make a given transition (e.g., a move from home to nursing home) in a given period of time. These probabilities are computed separately for client and comparison groups. The difference in the transition probabilities for clients and controls in a particular type defines the effect of the program for that type. That is, the program's effect can be observed only as a reduction in the probability that someone of, for example, type 1 will enter a nursing home from the community in the next year, as
74 Health Care Financing Review/Summer 1989/voiume 10, Number 4

compared with a very similar person (also type 1) who did not receive the waivered services.
The life tables cover 1 year and give the probability that someone in, say, the community will move to a hospital, a nursing home, or a permanent nursing home during the year. A separate estimate for each of these transitions for each of the pure types (adjusted for censoring by mortality, for reassessment, or for study end) is prepared for clients and controls in each pure type. The estimates for each pure type are then blended using the individual weights (i.e., the gik) to reflect the actual mixture of clients enrolled on the program—thereby providing a separate estimate for the program.
The single most striking finding of the MSSP analysis is the program's effect on hospital admissions. For the blended results, comparison group (blended to match the pure type structure of the program) members had a 60-percent probability of entering the hospital. The MSSP waiver clients were much less likely to enter a hospital, 43 percent. Thus, the program was able to reduce this probability by 17 percent, an important reduction particularly given the high cost of a hospital day. The reduction in admissions is offset, to some degree, by a higher average length of stay for the clients—one-half day per admission. This comparison is adjusted to remove the effects of those who die, who go to nursing homes, or who go to permanent nursing homes. Thus, the magnitude of the effect actually observed in a real-world program, but confounded with these censoring biases, might be lower. The observed effect in the raw data for hospital admissions for MSSP, for example, was 2 percent, with 31 percent of the control group (the blended pure types who did not receive the services) going to the hospital. Without cause elimination, this is an unfair comparison because, as can be seen from the cause-eliminated results, different proportions of clients and controls die, go to nursing homes, etc., during the study period. The point here is that, if going to the hospital were unaffected by other outcomes, then MSSP would reduce hospital admissions from 60 percent to 43 percent.
Not surprisingly, the acutely ill group, type 5, was the most likely to enter the hospital from the community, i.e., an 83-percent probability for both the comparison and client groups. The program's services have little effect in reducing hospital admissions for these medically acute people. Instead, the program seems to reduce hospital admissions for the two older types: types 1 and 4. This unexpected result might reflect some heretofore unrecognized ability of case managers to control hospital admissions for the frail elderly. Perhaps physicians serving the comparison group were forced to use hospital admission as a substitute for LTC services.
People also enter the hospital from a short stay in the nursing home. For people who enter nursing homes, this is about as likely as entering from the community (except that the time spent in nursing homes is less than the time spent in the community
before entering the hospital)—58 percent for the comparison group. The program was able to reduce this probability for its clients to 51 percent, a reduction of 7 percentage points. In addition, clients spent less time in the nursing home before going to the hospital than persons in the comparison group, 39 versus 49 days on the average. Again, the largest effects are for the very old and frail—types 1 and 2— but this result holds for all of the types.
The potential savings from the reduction in hospital admissions are offset to a slight degree by the fact that clients who enter the hospital do so sooner, in 3 months as compared with 6 for the comparison group, and by the longer stays of clients—a median of 5.1 days for comparisons as opposed to 5.6 days for controls. These results probably reflect the greater severity (on the average) of clients admitted to a hospital.
The program is intended to substitute waivered home and community services for nursing home admissions. However, the blended results indicate that people very similar to the waiver program's clients are unlikely to enter a nursing home from the community. Only 1.7 percent of the comparison group entered a nursing home for a short stay and only 0.8 percent entered for a long stay. The clients fared better with probabilities of 1.1 percent and 0.3 percent, respectively. These probabilities are for nursing home entry from the community. Nursing home entry from the hospital (for those who go to the hospital) is far more likely. The probabilities for comparisons are 39.6 percent and 11.0 percent for short stays, and long stays, respectively. For clients, these probabilities are similar, 39.0 percent and 8.5 percent, respectively.
Thus, although the program appears to have an effect in reducing nursing home admissions for both short stays and long stays, this effect is relatively small. In other words, the MSSP services are able to change the course of events in terms of entering a nursing home for only about 1 percent of the program's enrollees. This is because, not only does the program need to enroll people who are likely to enter a nursing home (a difficult targeting task), but, in addition, for those who would have entered a nursing home, the program must change this outcome. In other words, if 10 of 100 enrollees entered a nursing home and if the program services changed this outcome for 1 in 10 of these people, then the overall effectiveness of the program would be 1 percent.
Georgia
The results of the life table analysis for Georgia's AHS are presented in Table 4. These life tables are somewhat simpler than those prepared for MSSP in that they do not include hospital and permanent nursing home use as transitions. In addition, the fact that few of the comparison group fell into type 3 (the old and alone) and type 4 (the acutely ill) means that life table results (i.e., an estimate of the probability
Health Care Financing Review/Summer 1989/Volume 10, Number 4 75
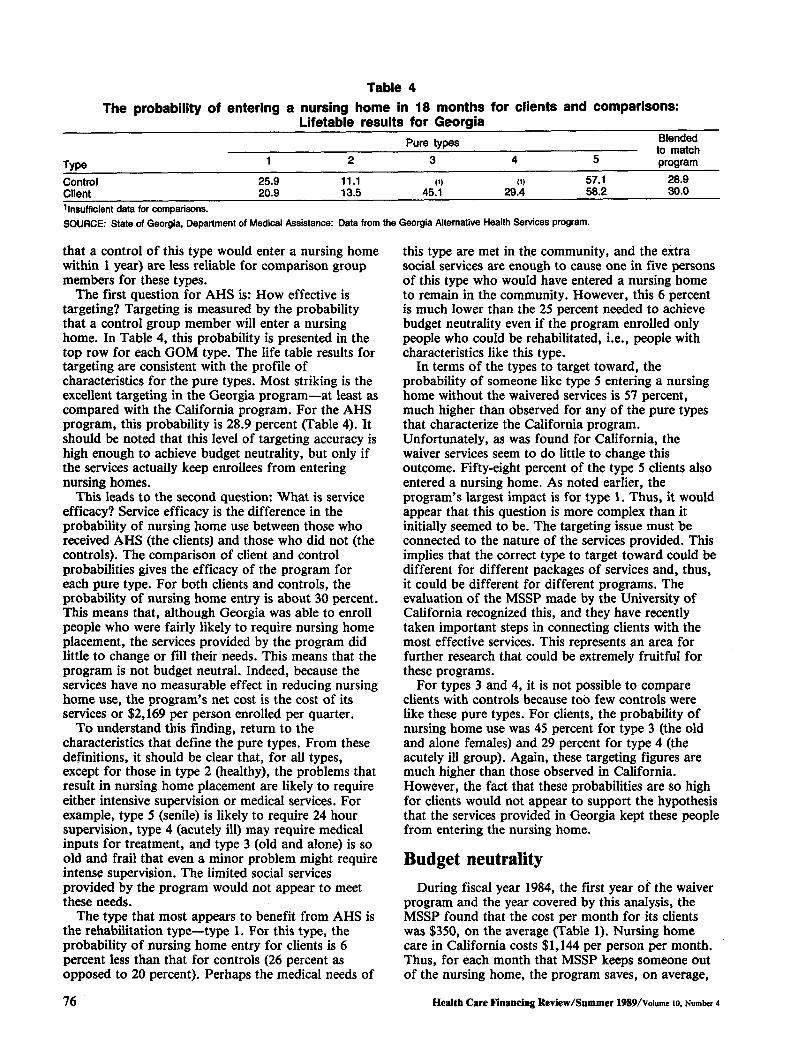
Table 4 The probability of entering a nursing home in 18 months for clients and comparisons:
Lifetable results for Georgia Pure types to match
Type program
Control 25.9 11.1 57.1 28.9 Client 20.9 13.5 45.1 29.4 58.2 30.0
Blended
insufficient data for comparisons. SOURCE: State of Georgia, Department of Medical Assistance: Data from the Georgia Alternative Health Services program.
that a control of this type would enter a nursing home within 1 year) are less reliable for comparison group members for these types.
The first question for AHS is: How effective is targeting? Targeting is measured by the probability that a control group member will enter a nursing home. In Table 4, this probability is presented in the top row for each GOM type. The life table results for targeting are consistent with the profile of characteristics for the pure types. Most striking is the excellent targeting in the Georgia program—at least as compared with the California program. For the AHS program, this probability is 28.9 percent (Table 4). It should be noted that this level of targeting accuracy is high enough to achieve budget neutrality, but only if the services actually keep enrollees from entering nursing homes.
This leads to the second question: What is service efficacy? Service efficacy is the difference in the probability of nursing home use between those who received AHS (the clients) and those who did not (the controls). The comparison of client and control probabilities gives the efficacy of the program for each pure type. For both clients and controls, the probability of nursing home entry is about 30 percent. This means that, although Georgia was able to enroll people who were fairly likely to require nursing home placement, the services provided by the program did little to change or fill their needs. This means that the program is not budget neutral. Indeed, because the services have no measurable effect in reducing nursing home use, the program's net cost is the cost of its services or $2,169 per person enrolled per quarter.
To understand this finding, return to the characteristics that define the pure types. From these definitions, it should be clear that, for all types, except for those in type 2 (healthy), the problems that result in nursing home placement are likely to require either intensive supervision or medical services. For example, type 5 (senile) is likely to require 24 hour supervision, type 4 (acutely ill) may require medical inputs for treatment, and type 3 (old and alone) is so old and frail that even a minor problem might require intense supervision. The limited social services provided by the program would not appear to meet these needs.
The type that most appears to benefit from AHS is the rehabilitation type—type 1. For this type, the probability of nursing home entry for clients is 6 percent less than that for controls (26 percent as opposed to 20 percent). Perhaps the medical needs of
this type are met in the community, and the extra social services are enough to cause one in five persons of this type who would have entered a nursing home to remain in the community. However, this 6 percent is much lower than the 25 percent needed to achieve budget neutrality even if the program enrolled only people who could be rehabilitated, i.e., people with characteristics like this type.
In terms of the types to target toward, the probability of someone like type 5 entering a nursing home without the waivered services is 57 percent, much higher than observed for any of the pure types that characterize the California program. Unfortunately, as was found for California, the waiver services seem to do little to change this outcome. Fifty-eight percent of the type 5 clients also entered a nursing home. As noted earlier, the program's largest impact is for type 1. Thus, it would appear that this question is more complex than it initially seemed to be. The targeting issue must be connected to the nature of the services provided. This implies that the correct type to target toward could be different for different packages of services and, thus, it could be different for different programs. The evaluation of the MSSP made by the University of California recognized this, and they have recently taken important steps in connecting clients with the most effective services. This represents an area for further research that could be extremely fruitful for these programs.
For types 3 and 4, it is not possible to compare clients with controls because too few controls were like these pure types. For clients, the probability of nursing home use was 45 percent for type 3 (the old and alone females) and 29 percent for type 4 (the acutely ill group). Again, these targeting figures are much higher than those observed in California. However, the fact that these probabilities are so high for clients would not appear to support the hypothesis that the services provided in Georgia kept these people from entering the nursing home.
Budget neutrality During fiscal year 1984, the first year of the waiver
program and the year covered by this analysis, the MSSP found that the cost per month for its clients was $350, on the average (Table 1). Nursing home care in California costs $1,144 per person per month. Thus, for each month that MSSP keeps someone out of the nursing home, the program saves, on average,
76 Health Care Financing Review/Summer 1989/voiume 10, Number 4

$794—$1,144 - $350. This is the logic that suggested that MSSP could actually save Medi-Cal dollars by substituting waiver services for nursing home services.
However, MSSP can choose to enroll or not to enroll someone. Any given enrollee is either a potential nursing home patient or someone who would have remained in the community even without the waivered services. For the potential nursing home candidate, the program can affect this outcome by delaying entry or the person will enter the nursing home in any event. The savings from those correctly targeted and whose nursing home entry is delayed must offset the cost of those who would not have entered a nursing home in any event and those who entered despite the provision of services.
The per month savings from those who are delayed is $794 per month. The cost of the other clients (the cost that must be offset by this savings) is $350 per month. This means that every person prevented from entering a nursing home offsets the cost of 2.3 people whose outcomes were not changed by the program. Thus, to achieve budget neutrality for Medi-Cal, MSSP must target and change the outcome for one of 3.3 people enrolled—a 30-percent accuracy level. Because MSSP changes the outcome for about 1 percent of its enrollees (over 2 years), it did not achieve budget neutrality.
If non-Medi-Cal costs are considered, then two categories of expenditure should be added to the equation. First, Supplemental Security Income and State supplement payment cease upon entry into a nursing home. These payments averaged $170 for MSSP enrollees in fiscal year 1984. In addition, title XX payments (mainly in home services) are not made to persons in nursing homes. This expenditure averaged $182 per month during this time for MSSP enrollees. Including these expenditures which are no longer paid for nursing home residents reduces the net cost for nursing home care to $650 per person per month, about double the program's average monthly cost.
To this point, savings from hospital care eliminated have not been included in the calculations. MSSP reduces hospital admissions. The expected cost of hospital care for a control group (the comparison group blended to match the distribution of MSSP enrollees across the five pure types) is $1,706 per person per year.
MSSP reduces hospital admissions, and this increased the average length of stay. If a diagnosis-related group payment system is assumed (meaning that increases in length of stay do not increase cost), then the expected cost of hospital care per enrollee per year for MSSP is $1,222. This $40.33 per month difference is not enough to make the program budget neutral, but this effect of MSSP is larger (in dollar terms) than its effect on nursing home use. The savings in terms of expected cost per enrollee per year from hospital costs avoided are almost enough to pay for one month of program services.
The Georgia program clearly targets toward persons who are very likely to enter nursing homes. Targeting
accuracy in Georgia is higher than that in California by a factor of about 10. This might reflect both differences in the populations in the two States and differences in the availability of nonwaivered services. However, like California, the services provided under the Georgia waiver do not seem to materially affect the probability of entering nursing homes. This is an unexpected finding for both programs. This would seem to reinforce the argument that, in an environment where nursing home beds are in short supply, social services are unlikely to be effective in preventing nursing home entry. This analysis does indicate that persons who enter nursing homes have medical and/or behavioral problems that are much too serious to be handled by occasional homemaker visits or by adult day care.
Indeed, large numbers of people with these kinds of problems were observed in the Georgia program. Because Georgia was much more successful in targeting people who were likely to enter a nursing home than California was, better targeting could not be a solution to the problem. The answer must reside in the kinds of services provided, and this is an area where more research is clearly needed. For Georgia, as for California, the failure of the waivered services to prevent nursing home entry means that the program is not budget neutral. Indeed, because the services in Georgia appear, on average, to have no effect in reducing the probability of nursing home entry, the net cost of the Georgia program is the total cost of the waiver services.
Conclusion There are several important points that need to be
drawn from this analysis. First, it is apparent that these two programs are not budget neutral. Although one cannot generalize from this finding to all waiver programs, it is of interest that these findings are similar to those of prior researchers in evaluating these two programs and that these results are consistent with the overall conclusions of the larger waiver program evaluation of which this is a part and of the cross-cutting evaluation of similar demonstration programs done by Berkeley Planning Associates.
Berkeley Planning Associates found that, in order to achieve budget neutrality, it is necessary to target a narrow range of inexpensive services to people for short periods of time. Of these two programs, Georgia comes much closer than California to the targeting objective. Because better targeting was a recommendation of both sets of program evaluators, the failure to target accurately in MSSP was puzzling.
A possible explanation for the difference in targeting accuracy between these two programs was discovered as a part of another project. This project was an evaluation of the ability of community health centers to serve an older population done for the Health Resources and Services Administration of the Public Health Service. One of the community health centers visited as a part of this project was a site for
Health Care Financing Review/Summer 1989/voiume 10, Number 4 77
MSSP. In addition to MSSP, this center participates in a State-funded project called "Linkages." Linkages is intended to keep frail elderly persons from nursing homes by providing home and community-based services. In contrast, MSSP was understood by the staff to be a way to provide services rather than to prevent institutionalization. This information makes it easier to understand the apparent inability of MSSP to target accurately.
A second unexpected finding for both programs is the apparent lack of service efficacy, i.e., the apparent inability of these programs to actually change the course of events for nursing home bound people. One might speculate that this finding is the result, at least in part, of the effects of the restrictions imposed on nursing home construction in both States. Restricting nursing home beds means that the available supply must be rationed in some way. Price is not an option because the Medicaid programs are able to control the price that they are willing to pay. In consequence, physicians may be rationing access to these beds by recommending nursing home care only for those persons whose medical needs make this course imperative. Thus, if one of the effects of a restricted supply is to ration beds to those with the greatest medical need, then the ability of a program that supplies social services to fill these needs and to divert clients from nursing homes would be limited. This situation is very different from that in the early 1970's when these programs were first conceived. At that time, nursing home beds were not in short supply and nursing homes, in part, filled social needs. Thus, one might argue that these waiver programs are a 1980's answer to a 1970's problem.
Finally, the results reported here are concerned with a very specific issue—budget neutrality. Budget neutrality is a criterion that is not usually applied to health programs. No one requires that Medicaidhospital payments or expenditures for physician services be budget neutral. In other words, these programs actually should ultimately be judged
against broader social criteria in order to determine if the good that is done by them outweighs their cost by more than the good that could be obtained by spending the same amount of money in alternative ways.
References Chiang, C. L.: Introduction to Stochastic Processes in Biostatistics. New York. John Wiley and Sons, 1968. Cole, C : MSSP Program Coordinator. Personal communication. California. Jan. 30, 1987. Georgia Department of Medical Assistance: Alternative Health Services Demonstration, Final Report, Jan. 1982. Liu, K., and Manton, K. G.: The effect of transitions between community and nursing homes on Medicaid eligibility. The Gerontologist 29:59-68, 1989. Manton, K. G., Stallard, E., Woodbury, M. A., and Yashin, A. I.: Grade of Membership techniques for studying complex event history processes with unobserved covariates. In Clogg, C , ed., Sociological Methodology, 1987. San Francisco. Jossey-Bass, 1987. Miller, L., et al.: The Comparative Evaluation of the Multipurpose Senior Services Project—1981-1982. Final Report, Aug. 1984. Tolley, H. D., Vertrees, J. C , and Manton, K. G.: Estimating life tables for pure types of a fuzzy partition. In Manton, K. G., Singer, B., and Suzman, R., eds. Forecasting the Health of the Old. New York. Oxford University Press, 1989. Vertrees, J. C , and Manton, K. G.: The Multipurpose Senior Services Program: An Empirical Evaluation. Working paper, Medicaid Program Evaluation Series, Health Care Financing Administration, Office of Research and Demonstrations, Office of Research, 1987. Woodbury, M. A., and Manton, K. G.: A new procedure for analysis of medical classification. Methods of Information in Medicine 21:210-220, 1982.
78 Health Care Financing Review/Summer 1989/voiume 10, Number 4