Embed Size (px)
Citation preview

Final Report
Defining Post Acute Care Episodes Around a Hospitalization
James Vertrees, PhD
Richard Averill, M.S.
Jon Eisenhandler, PhD
Anthony Quain, M.A.
James Switalski, B.S.
3M Health Information Systems, Inc.
The research described in this report was funded by the Center for Medicare & Medicaid Services under contract HHSM 500-2009-00080C. The opinions expressed in this report are
solely those of the authors and do not represent opinions of the Center for Medicare & Medicaid Services.
Published 2011 by 3M Health Information Systems, Inc.
575 West Murray Boulevard, Salt Lake City, Utah 84123 100 Barnes Road; Wallingford, CT 06492
12215 Plum Orchard Drive; Silver Spring, MD 20904

Table of Contents
Executive Summary................................................................................................... iii
Chapter One: Introduction .......................................................................................... 1
Chapter Two: Patient Centered Episodes (PCEs) ...................................................... 4
Chapter Three: Data ................................................................................................. 11
Chapter Four: Evaluating Patient Centered Episode (PCEs) ................................... 15
Chapter Five: Patient Centered Episodes (PCEs) as a Communications Tool ........ 23
Chapter Six: Conclusions ......................................................................................... 25
Appendix A: MS-DRG Included in Analysis .......................................................... 27
Appendix B: Related Readmissions ......................................................................... 32
Appendix C: Complete Sets of R2 Statistics ............................................................ 34
iii
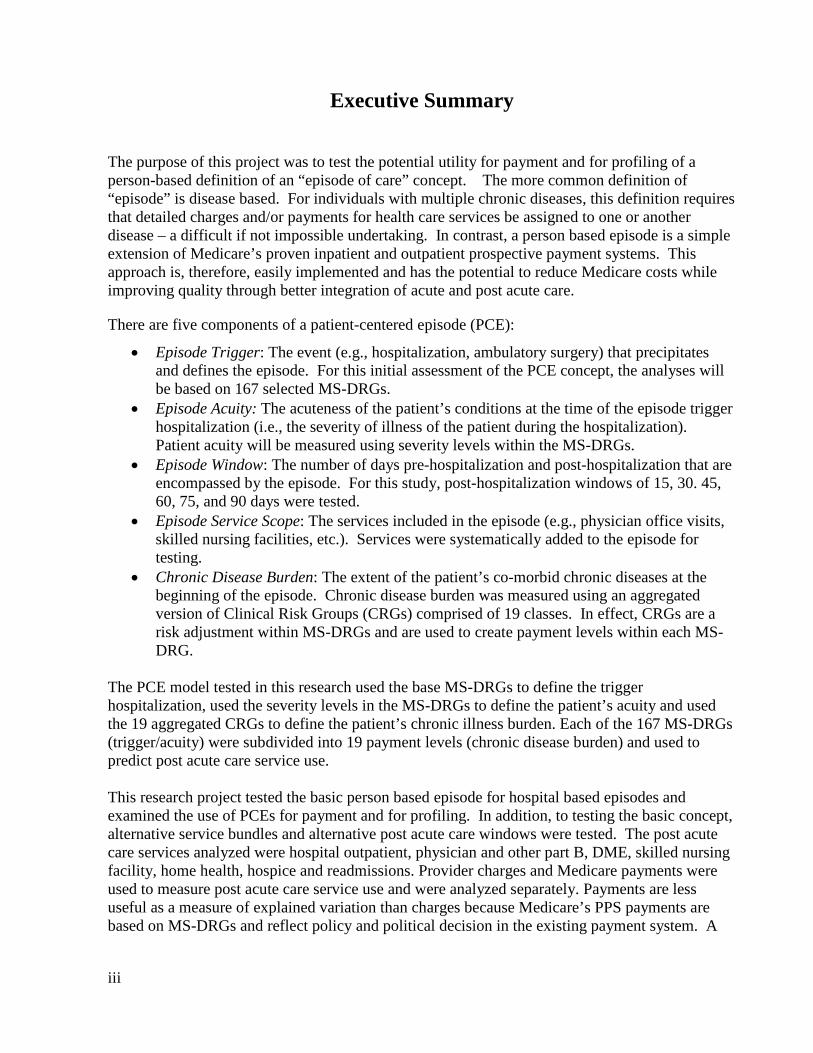
Executive Summary The purpose of this project was to test the potential utility for payment and for profiling of a person-based definition of an “episode of care” concept. The more common definition of “episode” is disease based. For individuals with multiple chronic diseases, this definition requires that detailed charges and/or payments for health care services be assigned to one or another disease – a difficult if not impossible undertaking. In contrast, a person based episode is a simple extension of Medicare’s proven inpatient and outpatient prospective payment systems. This approach is, therefore, easily implemented and has the potential to reduce Medicare costs while improving quality through better integration of acute and post acute care.
There are five components of a patient-centered episode (PCE):
• Episode Trigger: The event (e.g., hospitalization, ambulatory surgery) that precipitates and defines the episode. For this initial assessment of the PCE concept, the analyses will be based on 167 selected MS-DRGs.
• Episode Acuity: The acuteness of the patient’s conditions at the time of the episode trigger hospitalization (i.e., the severity of illness of the patient during the hospitalization). Patient acuity will be measured using severity levels within the MS-DRGs.
• Episode Window: The number of days pre-hospitalization and post-hospitalization that are encompassed by the episode. For this study, post-hospitalization windows of 15, 30. 45, 60, 75, and 90 days were tested.
• Episode Service Scope: The services included in the episode (e.g., physician office visits, skilled nursing facilities, etc.). Services were systematically added to the episode for testing.
• Chronic Disease Burden: The extent of the patient’s co-morbid chronic diseases at the beginning of the episode. Chronic disease burden was measured using an aggregated version of Clinical Risk Groups (CRGs) comprised of 19 classes. In effect, CRGs are a risk adjustment within MS-DRGs and are used to create payment levels within each MS-DRG.
The PCE model tested in this research used the base MS-DRGs to define the trigger hospitalization, used the severity levels in the MS-DRGs to define the patient’s acuity and used the 19 aggregated CRGs to define the patient’s chronic illness burden. Each of the 167 MS-DRGs (trigger/acuity) were subdivided into 19 payment levels (chronic disease burden) and used to predict post acute care service use. This research project tested the basic person based episode for hospital based episodes and examined the use of PCEs for payment and for profiling. In addition, to testing the basic concept, alternative service bundles and alternative post acute care windows were tested. The post acute care services analyzed were hospital outpatient, physician and other part B, DME, skilled nursing facility, home health, hospice and readmissions. Provider charges and Medicare payments were used to measure post acute care service use and were analyzed separately. Payments are less useful as a measure of explained variation than charges because Medicare’s PPS payments are based on MS-DRGs and reflect policy and political decision in the existing payment system. A
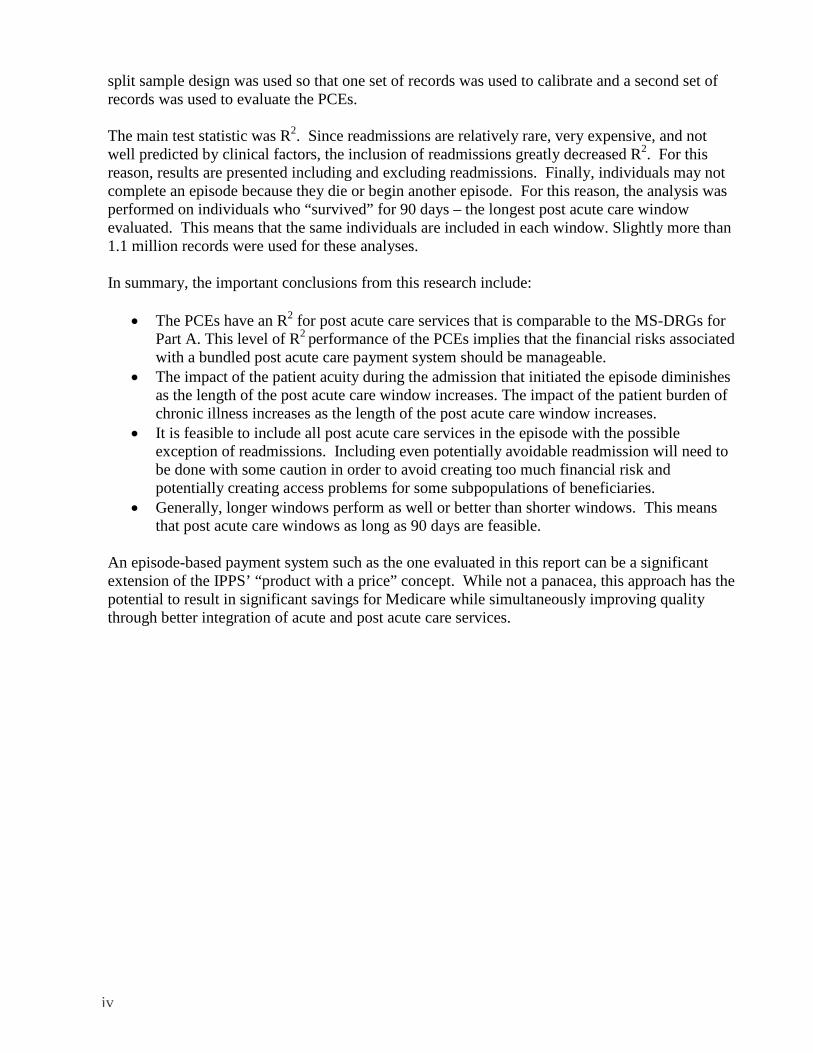
split sample design was used so that one set of records was used to calibrate and a second set of records was used to evaluate the PCEs. The main test statistic was R2. Since readmissions are relatively rare, very expensive, and not well predicted by clinical factors, the inclusion of readmissions greatly decreased R2. For this reason, results are presented including and excluding readmissions. Finally, individuals may not complete an episode because they die or begin another episode. For this reason, the analysis was performed on individuals who “survived” for 90 days – the longest post acute care window evaluated. This means that the same individuals are included in each window. Slightly more than 1.1 million records were used for these analyses. In summary, the important conclusions from this research include:
• The PCEs have an R2 for post acute care services that is comparable to the MS-DRGs for Part A. This level of R2 performance of the PCEs implies that the financial risks associated with a bundled post acute care payment system should be manageable.
• The impact of the patient acuity during the admission that initiated the episode diminishes as the length of the post acute care window increases. The impact of the patient burden of chronic illness increases as the length of the post acute care window increases.
• It is feasible to include all post acute care services in the episode with the possible exception of readmissions. Including even potentially avoidable readmission will need to be done with some caution in order to avoid creating too much financial risk and potentially creating access problems for some subpopulations of beneficiaries.
• Generally, longer windows perform as well or better than shorter windows. This means that post acute care windows as long as 90 days are feasible.
An episode-based payment system such as the one evaluated in this report can be a significant extension of the IPPS’ “product with a price” concept. While not a panacea, this approach has the potential to result in significant savings for Medicare while simultaneously improving quality through better integration of acute and post acute care services.
iv

1
Chapter One Introduction
Definition and Purpose: The successful implementation of the Medicare diagnosis related group (DRG) based inpatient prospective payment system (IPPS) in 1983 demonstrated that bundling all inpatient services into a single per case payment amount creates an effective incentive for hospitals to utilize resources efficiently. The all inclusive per case DRG payment bundle shifted the financial risk for use of bed days and diagnostic and therapeutic services during the hospital stay from Medicare to the hospital, thereby creating a strong financial incentive for efficiency. The incentive structure within IPPS could be readily extended to include broader bundles of service that encompass pre and post hospital care. This larger bundle is one possible definition of an episode of treatment. “Episode of treatment” has often been defined as the treatment of a disease or condition from beginning to end (Hornbrook, 1985). Unfortunately, this definition becomes a person-year measure (a variation on capitation in the context of payment) when chronic diseases are used as the basis of episodes. Therefore, if persons with multiple chronic conditions are to be included, a smaller and more tractable definition of an episode may well prove more useful in the context of health care reform including physician profiling and payment. The logical candidate for this is an episode which is focused on the individual (i.e., person based rather than disease based), initiated by the occurrence of a significant health care event such as a hospitalization or a significant ambulatory event and which includes services within a predefined window of time after the event (say 30 days). Note that there is no attempt to assign a service to a particular disease. This is a person based episode which is initiated by a trigger event. Developing a useful measure of this concept, evaluating the potential utility of this measurement tool and illustrating its use for profiling and for payment are the central concerns of this report. Incentives and Shifting Risk: Expanding the scope of a payment bundle shifts financial risk from payer to provider. The financial risk shifted includes all services included in the bundle but not those services which are beyond. For example, under cost based reimbursement or fee-for-service the payer bears virtually all the financial risk. Per diem and per case payment shift some of the financial risk to providers but that risk is limited to the services rendered during a single encounter (i.e., admission or a visit). A person based episode payment bundle expands the provider financial risk to include the inpatient, outpatient and physician services provided in the treatment of a health care problem over a specified window of time. The provider financial risk under per diem, per case and episode payment is essentially performance risk in that the provider is financially responsible for the efficiency with which services within the bundle are delivered but not for the number of bundles that occur (e.g., in IPPS hospitals are financially responsible for the services used during a hospitalization but not for the number of hospitalizations that occur). Capitation expands provider risk to include not only performance risk but also to the significant insurance risk associated with variation in the onset and prevalence of disease.

2
Clearly, paying by episodes could greatly increase the financial incentive to improve coordination of care thereby improving both efficiency and quality. This has been recognized by the Medicare Payment Advisory Commission (MedPAC). MedPAC noted that a bundled payment that includes all services rendered during an episode of care would create the incentive for providers to deliver “the right mix of services at the right time” (MedPAC, June 2008). Further, the Medicare Improvements for Patients and Providers Act of 2008 requires the Center for Medicare and Medicaid Services (CMS) to establish a physician feedback program in which physicians would receive confidential information on their resource use based on episodes of care (profiling). While there are many different ways to identify episodes of care, Section 3003 of the Patient Protection and Affordable Care Act (2010) supported the concept of person based episodes by requiring that “The Secretary shall develop an episode grouper that combines separate but clinically related items and services into an episode of care for an individual, as appropriate.” For FY2014 CMS has proposed adding to the Hospital IQR Program an episode based measure of Medicare spending per beneficiary.
“We are proposing an episode that runs from three days prior to an inpatient PPS hospital admission (the index admission) through 90 days post hospital discharge. We are proposing to include the time period 90 days post hospital discharge in order to emphasize the importance of care transitions and care coordination in improving patient care.” Federal Register, May 5, 2011
Focusing on episodes around a hospitalization (as a trigger event) provides the financial incentive to improve the coordination, quality, and efficiency of care during the period of time around a major health care event when effective care coordination is especially critical. Principles and Content: As noted above, the purpose of this document is to describe and to evaluate a person based approach to payment and profiling by episodes around a hospitalization. However, before turning to these topics, it will be useful to briefly review salient lessons learned from a previous and very successful payment reform - IPPS. In a payment context, the purpose of bundling payments into episodes and of profiling providers is to give hospitals and physicians a financial incentive to provide higher quality care more efficiently. Since this is the same underlying objective as the bundling of hospital services into DRG payments, the lessons learned from the implementation of Medicare’s IPPS should be directly applicable to the development of an episode-based payment and profiling system. Therefore, in designing an episode based payment system it is useful to review the following three essential features of IPPS that were the basis of its success.
1. Payment was based on a Categorical Clinical Model Since the DRGs were developed as groups of clinically similar patients, a language was created that linked the clinical and financial aspects of care. The simple categorical nature of DRGs created a powerful communications tool that was essential to achieving the behavior changes that resulted in the savings achieved by IPPS. 2. Separate Methodology for Computation of Payment Weights
3
The categorical nature of DRGs permitted the separation of the computation of the relative payment weights and the definition of the DRG categories. The independence of the clinical model and payment weights allowed the DRGs to remain a stable clinical language while the payment weights changed to reflect changing treatment processes.
3. Outlier Payment Specific to the Patient’s Condition If a patient’s resource use exceeded a DRG-specific outlier amount, the hospital was provided additional payment. Outliers are in essence an insurance mechanism that protects hospitals from excessive losses on any one patient.
The development of a categorical clinical model for episodes is the subject of Chapter 2. Empirically derived payment weights are used in the Chapter 4 to evaluate the performance of the categorical clinical model for payment and for profiling of episodes. Statistics such as R2 are used to determine how well the model performs using Medicare data. Chapter 5 discusses PCEs as a communications tool and Chapter 6 presents conclusions from the analysis. Although IPPS applied only to inpatient services, the core lessons from IPPS directly apply to any system for payment or profiling including episodes of care around a hospitalization. In the same way that the stable clinical definition of acuity (severity of illness) represented by the DRGs was at the core of the success of IPPS, the clinical definition of the patient’s acuity along with the patient’s chronic disease burden will be central to the success of a payment and profiling system based on episodes. The method for defining chronic disease burden should be a categorical clinical model that allows outlier thresholds for each chronic disease category to be established and allows episode payment weights to be independently established for each episode (acute and chronic disease burden) category. In addition to payment applications, the above lessons from IPPS are clearly relevant for creating actionable comparisons of physician performance based on episodes around a hospitalization. These lessons from IPPS served as a guide for the construction of the episode payment and profiling model described in the following chapters.
4
Chapter Two Patient Centered Episodes (PCEs)
Basic philosophy: As noted in the previous Chapter, the conventional approach to defining episodes is to focus on events related to the disease rather than focusing on the patient. Focusing on events related to a particular disease requires isolating the pre-hospitalization and post-hospitalization services that were associated with the reason for hospitalization (e.g., all service related to the treatment of diabetes). While the identification of services related to the reason for hospitalization during the pre-hospitalization and post-hospitalization period for a relatively healthy individual can be done with a reasonable degree of accuracy (e.g., a pregnancy episode encompassing delivery along with pre- and post-partum care, or a cholecystectomy in an otherwise healthy individual), such episodes of care constitute a small proportion of health care expenditures, especially for Medicare beneficiaries. Because the high utilizing population is characterized by multiple co-morbid conditions, it can be extremely difficult to accurately attribute the pre-hospitalization and post-hospitalization services to the specific disease that was the reason for hospitalization. For example, for a patient who has congestive heart failure, diabetes, and renal failure, and is hospitalized for uncontrolled diabetes, there is considerable uncertainty in identifying precisely which services are related to the diabetes care rather than the care of the heart failure or renal failure (e.g., a post-hospitalization emergency room visit for syncope could be related to the heart failure rather than diabetes). Further, since co-morbid diseases interact and do not behave independently of each other, any attempt to isolate only those services that relate to the illness that was the reason for hospitalization will not be accurate for patients with multiple co-morbid conditions (Hughes, 2004). As a result, the definition of an episode needs to be patient-centered rather than disease-centered. In other words, while a specific illness may have initiated (triggered) an episode, the focus of the episode needs to be on the total services provided to a patient and not limited to the services associated with the specific reason for the hospitalization. Because a patient-centered episode encompasses all services rendered to a patient during the episode, an episode classification system must include not only a recognition of the acute problem(s) that precipitated the patient’s hospitalization but also the patient’s overall burden of chronic illnesses. The resultant patient-centered episode classification system can then be used for a variety of purposes including physician profiling, local area profiling and payment. The purpose of this study is to evaluate just such a patient-centered episode classification system. Creating a Patient-Centered Episode There are five components of a patient-centered episode:
• Episode Trigger: The event (e.g., hospitalization, ambulatory surgery) that precipitates the episode. This could be an inpatient admission (as defined by selected MS-DRGs) or a significant outpatient procedure (as defined by selected APCs). A hospitalization for coronary bypass surgery is an example of such an event. For this initial assessment of the PCE concept, the analyses will be based on selected MS-DRGs. A complete list of these MS-DRGs is found in Appendix A.

5
• Episode Acuity: The acuteness of the patient’s conditions at the time of the episode trigger hospitalization (i.e., the severity of illness of the patient during the hospitalization). Patient acuity will be measured using severity levels within the MS-DRGs.
• Episode Window: The number of days pre-hospitalization and post-hospitalization that are encompassed by the episode. For this study, post-hospitalization windows of 15, 30. 45, 60, 75, and 90 day will be tested.
• Episode Service Scope: The services included in the episode (e.g., physician office visits, skilled nursing facilities, etc.). Services will be added to the post acute care episode sequentially for testing.
• Chronic Disease Burden: The extent of the patient’s co-morbid chronic diseases at the beginning of the episode. This will be measured using a collapsed version of Clinical Risk Groups (CRGs).
Parameters: A patient-centered episode based on a categorical clinical model provides great flexibility allowing:
• Inclusion of all or all selected services delivered within the episode window. • Use of relative weights computed independently from the process of defining the
episode. • Use of various episode windows - pre-determined number of days after the episode
trigger event. As noted above, this project evaluates the use of 15, 30, 45, 60, 75 and 90 day windows.
• Use of various statistical and/ or fixed value stop-loss outlier policies. • Use of rules to start and to stop the episodes. The model described in this report
allows an individual to have one and only one episode at a time, and this means that rules for starting and stopping episodes are needed. Since this project uses only episode based on the discharge from inpatient hospital care in specific MS-DRGs as a trigger events, the episodes analyzed for this project are stopped by death and by the episode window extending beyond the end of the analysis end date.
The expected value of the services used during an episode depends, in part, on the acuity of the patient at the time of the episode trigger hospitalization. For example, the use of services during a cardiac bypass surgery episode will be dramatically different for a critically ill patient admitted for emergency cardiac bypass surgery as opposed to a stable patient admitted for elective cardiac bypass surgery. In addition, the expected utilization of services during an episode will also depend on the chronic illness burden of the patient at the beginning of the episode. For example, the use of services during an episode for a patient with multiple chronic diseases can be much different than a patient who is otherwise healthy or has only a single chronic disease. The relative impact on episode cost of the acuity of the patient at the time of the episode trigger hospitalization and the chronic illness burden of the patient will vary depending on the length of the episode window and comprehensiveness of the episode scope of services. The expected use of services for an episode for a patient with no co-morbid diseases for a short episode window and a limited service scope will be determined primarily by the patient’s acuity at the time of the episode trigger hospitalization. In contrast, the cost of the post acute services in an episode for a patient with extensive co-morbid diseases for a long episode window and comprehensive service
6
scope will be determined primarily by the patient’s chronic illness burden at the time of the initiation of the episode. Thus, for high utilizers, i.e., patients with a significant burden of chronic disease, both the patient’s acuity at the time of the episode trigger hospitalization and the chronic disease burden of the patient at the beginning of the episode window must be simultaneously taken into account in order to understand and predict the expected utilization of services and costs incurred during the post acute episode. The following sections discuss these components in more detail. Defining “Significant Health Care Event”: In a patient-centered episode model, beneficiaries may be assigned to an episode whenever a significant health care event occurs. A significant acute health care event has the following attributes:
• Continued care is required following the significant acute health care event that initiated the episode
• The care necessary to resolve the immediate reason for the health care event or to stabilize the individual may reasonably be assumed to be time limited
• Significant resources are required during the episode • Beneficiaries assigned to the episode have (or, based on clinical judgment, could have) a
statistically predictable pattern of resource use • The provider responsible for care delivery during the episode trigger event is (or could be)
clearly defined • Effective coordinated care during the episode can improve patient outcomes
Based on these attributes, most hospitalizations would be a significant health care event while an outpatient visit for an upper respiratory infection would not be. During any period of time (e.g., a year) a beneficiary may not have any significant health care events (e.g., the beneficiary’s only health care encounter was for an upper respiratory infection) and therefore, would not have any episodes assigned. Conversely, a beneficiary many have multiple episodes assigned. In a patient-centered episode model, a beneficiary will only be assigned to one and only one episode at any point in time. The specification of the episode trigger needs to specify both the underlying reason for the event (e.g., cardiac bypass surgery) and the acuity (severity of illness) of the patient. For hospitalizations severity can be captured by severity adjusted patient classification systems such as Medicare Severity DRGs (MS-DRGs) or All-Patient Refined DRGs (APR-DRGs) (Averill, 2002, Sedman, 2004) that can specify the underlying reason for the hospitalization (i.e., the base DRG) as well as the severity of illness of the patient during the hospitalization. Medicare Severity DRGs (MS-DRGs) will be used for trigger events based on a hospital admission. Ambulatory Payment Categories (APCs) could also be used to define selected outpatient events as trigger events, but this will not be explored in this project. Operationally, this means that each unique combination of the underlying reason for the hospitalization (i.e., the base MS DRG) and the severity of illness level represent a distinct episode trigger hospitalization. Thus, an admission for emergency cardiac bypass surgery for a critically ill (i.e., high severity) patient and an admission for scheduled cardiac bypass surgery for a stable (i.e., low severity) patient are distinct episode trigger hospitalizations. For example, when

7
MS-DRGs are used to identify the episode trigger, then all hospitalized patients assigned to MS-DRG 235 (coronary bypass without cardiac catheterization with no major complications or co-morbidities) would constitute a distinct episode from patients assigned to MS-DRGs 236 (coronary bypass without cardiac catheterization with major complications or co-morbidities). MS-DRGs were constructed as an exhaustive and mutually exclusive categorization of all possible reasons for a hospitalization. In order to serve as the unit of payment for an episode payment system, the measure of chronic disease burden should similarly be expressed as a mutually exclusive categorization of the chronic disease burden of those patients with significant burden of chronic disease. Given such a categorization of chronic disease burden, each unique chronic disease burden category would have a prospective episode price established for each unique type of episode (i.e., MS-DRG). Defining Patient Chronic Disease Burden at Episode Initiation An example of a patient classification system for defining a patient’s chronic disease burden that meets all of the criteria that were essential to the success of IPPS is Clinical Risk Groups (CRGs) (Hughes, 2004). CRGs are a categorical clinical model that uses historical claims data to assign patients to a single mutually exclusive category that predicts the level of expected future resource use. Like DRGs, each CRG is composed of a base CRG that describes the patient’s most significant chronic conditions and a severity of illness level (e.g., a patient with diabetes and congestive heart failure at severity level 3). In CRG version 1.6 there were 272 base CRGs which were subdivided into up to six severity of illness levels for a total of 1,080 CRGs. This also included three predefined CRG hierarchical consolidations of 1,080 CRGs into 416, 151 and 38 CRG aggregations. The aggregated CRGs sacrifice some clinical precision but with only a slight loss of predictive performance (Hughes, 2004). The aggregated CRGs are useful in situations where the data volume is limited. CRG development was funded by Department of Commerce, National Institutes of Standards and Technology (NIST) under Advanced Technology Program. The purpose was to improve the competitive position of the US through the development of a tool that could facilitate managed care. NIST believed that the then currently available risk adjustment methods were relatively ineffective. The first generation methods used age and sex adjustments. The second generation was regression models. CRGs are a 3rd generation risk adjustment system based on diagnostic and treatment history, which use an individual’s medical history and timing in sophisticated ways including onset, duration, sequencing and resolution. CRGs can provide a measure of the chronic disease burden of a patient at the beginning of an episode. CRGs and DRGs can be combined to more precisely characterize an episode of care. MS-DRGs can be used to define the severity of the patient’s conditions during the episode trigger hospitalization, and CRGs can be used as the basic unit of payment in order to take the chronic disease burden of the patient into account. The objectives in developing CRGs were to:
• Develop a clinically meaningful means of measuring the health status of a population for the purpose of predicting future health care expenditures

8
• Develop a management tool for Managed Care Organizations that can also be used for risk adjusting capitated payments
• Develop a language that links the clinical and financial aspects of care In addition, CRGs contain two to six explicit severity levels within a given category This distinguishes differences in disease burden due to severity of illness, ( e.g., not all asthmatics are grouped in the same category). The CRG logic follows the logical progression of a disease. The CRG assignment process is as follows: Phase 1: Categorize diagnoses and procedures • All diagnoses are assigned to an MDC (Major Diagnostic Category) • Within each MDCs diagnoses are assigned to one of 557 EDCs (Episode Diagnostic Categories) • All procedures are assigned to one of 640 EPCs (Episode Procedure Category) • Each EDC is categorized as dominant chronic, moderate chronic, minor chronic, chronic
manifestation, significant acute or minor acute • Only one diagnosis from an inpatient admission is needed to establish an EDC • Two diagnoses from different days are needed to establish an EDC for outpatient visits except
for diagnoses for selected conditions and diagnosis codes which are in fact procedures (e.g., history of a heart transplant)
• For inpatient services diagnoses from physician and other professional claims are not used (i.e., only the hospital claim is used).
• Diagnoses from “other” providers (e.g., ambulances, freestanding laboratory, etc.) are not used. • Some diagnosis codes create multiple EDCs. (e.g., the diabetic neuropathy code creates both the
chronic disease EDC for diabetes and the chronic manifestation EDC for diabetic neuropathy EDC).
• Conditionality rules are also applied and affect diagnosis or severity assignment: – Persistence and recurrence rules (e.g., hypertension must persist over a period of time to be
considered an establish diagnosis) – Demographic (e.g., congestive heart failure among children vs. adults)
• The temporal relationship between EDCs and EPCs is used to establish final EDCs • EDCs can cause other EDCs to be “ignored”
• Acquired hemiplegia removes stroke from contributing to the severity of illness rating • EPCs can cause EDC and EPCs to be “ignored”
• Angioplasty removes Angina from the severity logic • Kidney transplant causes renal dialysis to be removed from the severity logic
Phase 2: Identify chronic illnesses and specify their severity of illness • Each MDC with a chronic EDC will be assigned a PCD (Primary Chronic Disease) • Only one PCD can be assigned per MDC. If there is more than one EDC within an MDC, the
PCDs will be selected in hierarchical order within the MDC (e.g., dominant chronic EDCs selected before moderate chronic EDCs)
• Some chronic EDCs cannot become PCDs if a certain other EDC is present (e.g., skin ulcers cannot be a PCD if diabetes is present)

9
• After a PCD is selected it is assigned a severity of illness level • The severity level assignment for each PCD is establish by the presence of related conditions
(e.g., skin ulcers in a diabetic) Phase 3: Assign the CRG • Assignment to one of 272 base CRGs based on the combination of PCDs that are present • The highest volume diseases or combinations of diseases are assigned a unique base CRG, for
example: –Diabetes –Diabetes with CHF –Diabetes with CHF and COPD
• All CRGs are assigned to one of nine hierarchical health statuses • The nine health statuses range from catastrophic to healthy • Assignment is done from most serious (catastrophic) to least serious (healthy) • Each base CRG is subdivided into discrete severity subclasses based on the severity levels of the
PCDs • Combinations of base CRGs and severity levels result in a total of 1,080 unique clinical groups
Phase 4: Assign Adjacent CRGs (ACRGs)
• The 1,080 CRGs are consolidated into three tiers of aggregation • Each successive tier of aggregation has fewer base CRGs . Specifically, the number of categories
in successive aggregated levels in the current version of CRGs are 416, 151 and 38. As described below, this number has been further reduced to 19 for this project.
• Severity levels are maintained within each tier. • Users can create own ACRGs tiers • Demographic factors such as age, sex, and disability status can be added to further adjust the
CRG payment weights or risk scores. Using CRGs for Defining Episodes: Although the application of CRGs for paying for episodes is very similar to the application of DRGs for paying for inpatient care, there are some important differences. DRGs are assigned based on all the diagnoses and procedures that were present at any time during the hospital stay. Thus, DRGs explain concurrent hospital resource use based on the care and disease progression of the patient while they were hospitalized. In an episode system, CRGs predict episode resource use at the beginning of the episode based on the patient’s prior diagnostic and service profile. Since CRGs predict subsequent resource use, they function like a risk adjustment system for capitated payment, which was the original intent. The combination of MS-DRGs (reason for admission and acuity during the admission) and CRGs (chronic illness burden at time of discharge) define each unique episode. Thus, CRGs are one of the components necessary for defining patients with similar post acute care resource needs for the purpose of constructing clinically meaningful episodes of care with similar resource use patterns. Like DRGs, CRGs are a “product with a price” model that separates the underlying clinical categorization from the establishment of the associated payment. In an episode payment system, DRGs are used to identify the subset of patients belonging to a particular episode and CRGs are
10
used to differentiate patients within the episode based on their expected costs. Thus, by providing a measure of the chronic disease burden of a patient at the beginning of an episode, CRGs can be used to modify the payment for the post acute phase. By using DRGs to define the episode trigger, the acuteness of the patient’s conditions during the hospitalization is taken into account and by using CRGs as the unit of payment the patient’s chronic disease burden at the beginning of the episode is taken into account. Essentially, every combination of trigger event, window and service scope defines a unique type of episode that will have a specific expected cost and payment. In a categorical episode based system, this diversity is manageable. The projected episode cost/payment amount is simply the historical average resource use of patients in each episode category. The combination of the base MS-DRG (reason for hospitalization), MS-DRG severity level (acuity) and ACRG (chronic illness burden) form each unique type of episode and are referred to as Patient Centered Episodes (PCEs).

11
Chapter Three Data
This Chapter describes the data used for the analyses reported in subsequent chapters. The initial file contained information for 1,340,820 Medicare beneficiaries who were continuously enrolled in Medicare from 4/1/2006 though 6/30/2009 or the date of their death if they died subsequent to 7/1/2007 with no evidence of another primary payer during that time. Included beneficiaries had three years plus nine months of exposure; including one year prior and 180 days following any hospitalization used as a trigger event. The purpose of this study was to determine if the method outlined in Chapter 2 could be used to create reasonable episode definitions. Thus, a representative sample was not needed. The trigger event was limited to hospitalizations for 191 selected MS-DRGs V-27. The initial file only included beneficiaries who had a hospitalization between 7/1/2007 and 12/31/2008 that was paid under one of these DRGs. These MS-DRGs were selected based on volume and the expectation that there would be a reasonably consistent pattern of post acute care resource use. These DRGs are identified in Appendix A. Finally, to control the size of the analysis file, the data were limited to nine somewhat diverse (but not random) states. These states – with counts of Medicare beneficiaries in the analysis file are: • California - 373,169 • Florida – 351,228 • Virginia - 139,228 • New Jersey – 137,834 • Washington - 91,772 • Minnesota – 71,160 • Kansas – 68,732 • Louisiana – 57,356 • Colorado – 50,341
The data include bills for various types of services. These services and the number of bills for each are: • Inpatient - 4,174,245 • Outpatient - 24,399,272 • SNF - 991,803 • Home health - 1,556,201 • Hospice - 526,376 • DME - 23,913,432 • Part B - 346,061,471
The analysis began with 4,174,245 inpatient hospital claims. Not all of these claims would trigger episodes in the analysis as summarized in Table 3.1. First, some inpatient claims were hospital transfers; the transfer claims were joined together to arrive at inpatient continuous events.

12
Second, some inpatient continuous events were classified as readmissions of other inpatient stays (i.e., were within the episode window of another inpatient claim); Third, more than half of these inpatient trigger events were outside the analysis period, i.e. i.e. they did not become trigger events for the purposes of this analysis because they did not have sufficient prior history for a CRG to be assigned or did not have sufficient subsequent history for episode window analysis. Fourth, if the patient died during the hospitalization (rather than during the episode window), they were excluded as trigger events. And fifth, inpatient trigger events that were assigned a MS-DRG that was not among the 191 selected DRGs were excluded from the analysis. After making these five adjustments, the number of inpatient trigger events included as episode trigger events was reduced to 1,143,240:
Categories Hospitalizations Inpatient claims 4,174,245 Transfers 263,359 Readmissions 623,397 Outside analysis period 1,823,981 Hospital deaths 48,660 Excluded DRGs 271,608 Inpatient episodes in analysis database 1,143,240
Table 3.1: From Inpatient Claims to Inpatient Episodes
These inpatient episodes were each analyzed to determine which claims were allocated to each episode, the CRG risk level of the individual at the beginning of the episode, and the episode costs. This also resulted in the removal of some cases. First, some episodes were not able to have a CRG assigned (for data quality reasons). Second, if the trigger event charges or payments were less than $200, these cases were dropped from the analysis as an admission costing less than $200 is not credible. Third, cases were dropped based on their MS-DRG if the MS-DRG had low volume (less than 500 cases). In a few instances, low volume MS-DRGs were combined with clinically similar MS-DRGs to obtain a volume of at least 500 cases. Fourth, some MS-DRGs were excluded because later clinical review questioned their appropriateness for inclusion in this project. This analysis was done independently using payments and once using charges (See Tables 3.2).
Categories Hospitalizations Inpatient episodes 1,143,240 No CRG assignment 50 Low hospital charges (< $200) 4,184 Low volume/excluded MS-DRG 9582 Usable episodes for charges 1,129,424
Inpatient episodes 1,143,240
No CRG assignment 50 Low hospital payment (< $200) 4,261 Low volume/excluded MS-DRG 9,582 Usable episodes for payments 1,129,347
Table 3.2: Charges and Payment Data Edits

13
The following steps were then used to build the analysis file:
• Readmissions can have a substantial impact on post acute costs. In order to avoid having the post acute care cost dominated by a completely unrelated readmission (a subsequent admission for injuries incurred in a traffic accident), a definition of a plausibly related readmission was developed. Any readmission with an MS-DRG in the same major diagnostic category (MDC) as the MS-DRG of the admission that initiated the episode was considered plausibly related to the admission that initiated the episode and was included in the post acute care cost. The one exception to this rule was a list of 49 MS-DRGs that were always considered plausibly related to any admission that initiated episode (see Appendix B). This list was developed by the project clinical team and contains MS-DRGs that are infections and complications of care that could plausibly be related to the care in the admission that initiated the episode. If an unrelated readmission occurred during an episode, the original episode was truncated and a new episode was initiated.
• Only those episodes where an individual beneficiary completed the entire episode were included in the analysis (beneficiary did not die during the episode and did not have an unrelated readmission occur during the episode). Although a method could be easily developed for converting truncated episodes to full episode charges or payments, an adequate number of complete records was available so there was no need to include truncated records for which total charges or payments had to be imputed. The number of hospital episodes excluded from the analysis due to an incomplete episode varied depending on the length of the episode window.
• A split sample design was used so that one set of records was used to calibrate and a second different set of records was used to evaluate the PCEs. This was done by assigning beneficiaries within each MS-DRG a random number. The fifty percent of beneficiaries with the lowest numbers were assigned to the calibration group and the remainder were assigned to the evaluation group.
The analysis is based on the ability of the PCEs to predict the Part B services provided in the hospital and all subsequent post acute services during the episode window i.e., services provided after the individual is discharged from the acute care hospital. The data available to this project included two different methods of defining resources: providers’ charges and Medicare payments. The charges submitted by the provider on the claim were used for the charge variable. The payment variable was computed as shown in Table 3.3 Each of these potential measures of resource use has advantages and disadvantages. Charges likely reflect with more accuracy the relative costliness of individual services. Medicare payments reflect the cost of the service to the program as well as reflecting the outcome of political processes. Since neither is clearly “correct” for all circumstances, the following analyses were done once using charges as the dependent variable and then using Medicare payments as the dependent variable. Other than the dependent variable, the pairs of analyses are identical.

14
The charges submitted by the provider on the claim were used for the charge variable. The payment variable was computed as follows:
Provider Description Hospital Amount paid with disproportionate share, indirect
medical education, new technology add-on amount, and capital removed plus beneficiary coinsurance payment plus beneficiary deductible payment
Outpatient Amount paid plus beneficiary coinsurance payment plus beneficiary deductible payment
SNF Amount paid plus beneficiary coinsurance payment plus beneficiary deductible payment
Other part B Allowed charge DME Allowed charge Home health Amount paid Hospice Amount paid
Table 3.3: Determination of the payment variable The CRG is assigned using the diagnoses and procedures present during the hospitalization plus any diagnosis and procedures that occurred one year prior to the date of hospital discharge. The resources that are included in the post acute care episode are those resources that were delivered during the episode window starting on the day following discharge.

15
Chapter Four Evaluating Patient Centered Episode (PCEs)
This Chapter presents the key evaluation statistics for the PCEs. These include R2 and coefficients of variation. In addition, by the way that PCEs are constructed there are two parameters that will be controlled by the user. These are the length of the post acute care window and the services included in the bundle. To assist the user in understanding the effects of varying these parameters, the statistics will be re-computed as the window length and included services parameters are varied. In evaluating a new grouping concept such as PCEs it is critical to have a reference point to understand whether a particular result meets or exceeds expectations. MS-DRGs are widely known and accepted. Thus, it is logical to assume that if the PCE grouper performs at least as well as the MS-DRGs in terms of these statistics, its performance is acceptable. For this reason the MS-DRGs will be used as the reference value. Methods There are three key methods for the evaluation of the performance of a classification system such as PCEs. These are reduction in variance as measured by the R2 statistic and coefficient of variation. This section describes these important statistics in more detail. R2: R2 measures the ability of the classification to provide an estimate of expected charges or payments. In the context of a payment system this is important in controlling the risk that is shifted from payer to provider. In a context where the classification system is used to create norms which are used to assess provider performance, this is important in creating norms which are accepted and actionable. R2 calculations are based on the difference between actual and expected values for each episode. As discussed in Chapter 3 a split sample design was used so that one subset of records was used to calibrate and a different subset of records was used to evaluate the PCE classification system. The expected value for each PCE in the evaluation subset is calculated as the average PCE charge/payment in the calibration subset times a budget neutrality factor. For each type of episode, the budget neutrality factor is the ratio of the total charge/payment in evaluation subset divided by the total charge/payment in the calibration subset. Coefficient of Variation(CV): The coefficient of variation is the standard deviation divided by the absolute value of the mean. This measures the homogeneity of the categories. Though somewhat arbitrary, CV values less than one are generally considered acceptable. Higher values mean that there is considerable variation within the category. The weighted (by episode volume) CV is a convenient summary statistic similar to the case mix index for DRGs. Creating the PCEs: As noted in Chapter 2 the CRGs are aggregated into ACRGs with highest level of aggregation reducing the number of CRGs down to 38 unique CRGs. Since the aggregated CRGs are used to create categories within MS-DRGs, the number of categories can become large. Therefore, for the purpose of PCEs, the number of unique CRGs was further reduced. At the highest level of aggregation, the nine CRG statuses are subdivided into up to 6 severity levels depending on the status (e.g., health has only one level but patients with multiple significant chronic disease have 6 levels). Because all the patients required hospitalization
16
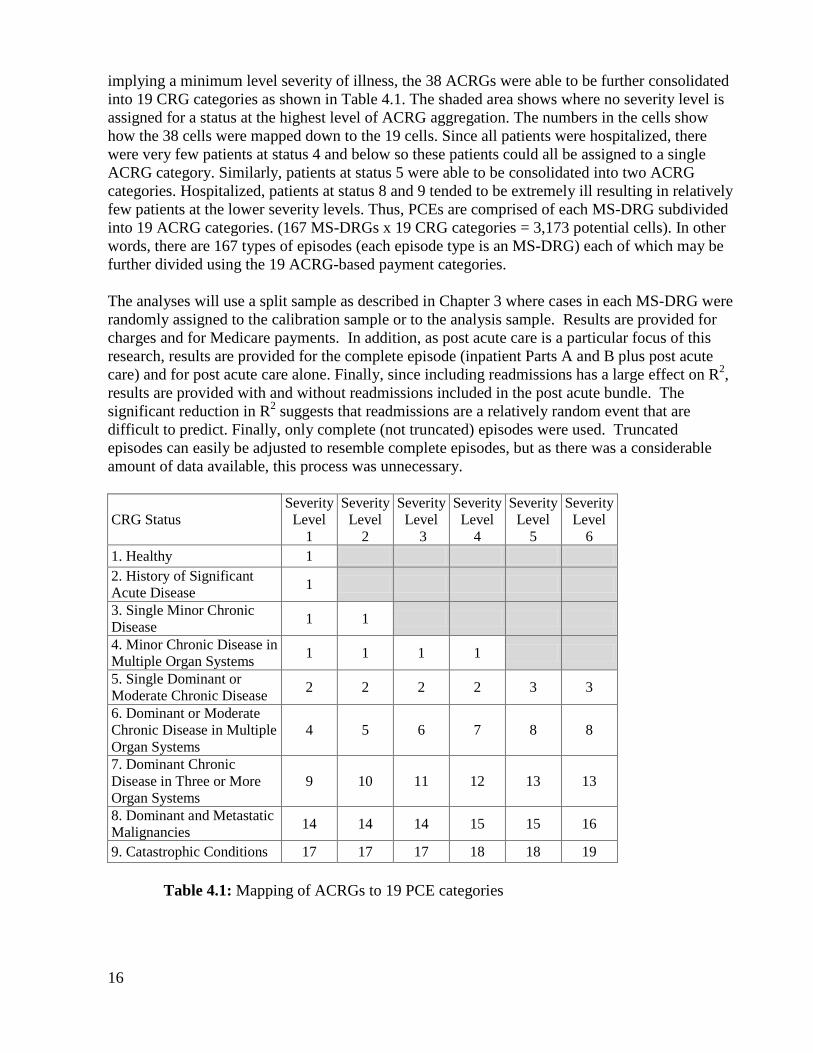
implying a minimum level severity of illness, the 38 ACRGs were able to be further consolidated into 19 CRG categories as shown in Table 4.1. The shaded area shows where no severity level is assigned for a status at the highest level of ACRG aggregation. The numbers in the cells show how the 38 cells were mapped down to the 19 cells. Since all patients were hospitalized, there were very few patients at status 4 and below so these patients could all be assigned to a single ACRG category. Similarly, patients at status 5 were able to be consolidated into two ACRG categories. Hospitalized, patients at status 8 and 9 tended to be extremely ill resulting in relatively few patients at the lower severity levels. Thus, PCEs are comprised of each MS-DRG subdivided into 19 ACRG categories. (167 MS-DRGs x 19 CRG categories = 3,173 potential cells). In other words, there are 167 types of episodes (each episode type is an MS-DRG) each of which may be further divided using the 19 ACRG-based payment categories. The analyses will use a split sample as described in Chapter 3 where cases in each MS-DRG were randomly assigned to the calibration sample or to the analysis sample. Results are provided for charges and for Medicare payments. In addition, as post acute care is a particular focus of this research, results are provided for the complete episode (inpatient Parts A and B plus post acute care) and for post acute care alone. Finally, since including readmissions has a large effect on R2, results are provided with and without readmissions included in the post acute bundle. The significant reduction in R2 suggests that readmissions are a relatively random event that are difficult to predict. Finally, only complete (not truncated) episodes were used. Truncated episodes can easily be adjusted to resemble complete episodes, but as there was a considerable amount of data available, this process was unnecessary. CRG Status
Severity Level
1
Severity Level
2
Severity Level
3
Severity Level
4
Severity Level
5
Severity Level
6 1. Healthy 1 Blank Blank Blank Blank blank 2. History of Significant Acute Disease 1 Blank Blank Blank Blank Blank
3. Single Minor Chronic Disease 1 1 Blank Blank Blank Blank
4. Minor Chronic Disease in Multiple Organ Systems 1 1 1 1 Blank Blank
5. Single Dominant or Moderate Chronic Disease 2 2 2 2 3 3
6. Dominant or Moderate Chronic Disease in Multiple Organ Systems
4 5 6 7 8 8
7. Dominant Chronic Disease in Three or More Organ Systems
9 10 11 12 13 13
8. Dominant and Metastatic Malignancies 14 14 14 15 15 16
9. Catastrophic Conditions 17 17 17 18 18 19 Table 4.1: Mapping of ACRGs to 19 PCE categories

17
Results: Introduction: The number of potential parameters involved in assessing this episode concept is large, and the number of permutations is larger. For this reason, the first step in this analysis is to limit the range of alternatives that will be considered. Second, since the real focus of this report is episodes that include post acute care services following an inpatient hospital trigger event, the length of the post acute care window will be explored in terms of changes in R2. Next, the effect of larger bundles of post acute care services on R2 will be explored by systematically adding services to the inpatient trigger event. Selected R2 statistics are noted in the text. All of the R2 statistics are found in Appendix C. However, an initial question is the order in which post acute care service should be included in the episode – especially the post acute window. Some services are common and inexpensive and some services which are less common and more expensive. As an initial hypothesis, it seems reasonable to expect that including a post acute care service will be easier if the service is both common and relatively inexpensive relative to the initial hospitalization that initiated the episode. In contrast, services that are less common and relatively more expensive may be expected to be more difficult to predict. Services that are difficult to predict (i.e., services not related to the patient’s acuity or to the patient’s disease burden) will increase financial risk and decrease the explained variation (R2) in bundled payments to providers. Given this, if we can develop an ordering of post acute care services, we can avoid providing results for all of the possible combinations of post acute services. R2 will then be re-computed as services are added to various windows. The final set of analyses involves the coefficient of variation (CV). A convenient summary measure, the weighted CV (where the weight is the percent of episodes in the PCE in question) was also computed and is discussed at the end of this Chapter. Reducing the Number of Alternatives: The key concerns of this report are the effects of various window lengths and the effects of including or excluding various services. However, there are alternative ways to explore these issues. The purpose of this section is to reduce the number of alternatives by removing alternatives that do not materially alter the conclusions. Considering individuals who are included in a window first, it is possible to include individuals who completed the longest window (did not die during the window and did not have the episode truncated because of an unrelated readmission) – ninety days. Alternatively, the analyses could be based on all individuals who completed the window in question but not necessarily the next longer window. The first alternative (full 90) results in the same individuals being included in each window; the second alternative (Full Window) results in a decreasing number of individuals as the window become longer because more individuals fail to complete the window as the window becomes longer. The second issue is removing observations (by trimming) that are unusual and that might represent errors in data or have a disproportionate impact on the results. The trimming method used is the same as the method used for establishing Medicare’s IPPS payment weights. Any case that falls outside plus or minus three standard deviations of the log of charges/payments is removed (trimmed). The alternative is not to trim at all. Table 4.2 illustrates the effect on R2 of the alternative ways of determining the subset of patients included in the window (full window vs. full90). The top half of the table is based on Medicare

18
charges. The bottom half is based on Medicare payments as defined in Chapter 2. The left half of the table includes payments/charges for the trigger event plus post acute care; the right half is post acute care only. The post acute care bundle includes all services including hospital outpatient part B, all other part B (physician office and ancillaries), DME, home health, skilled nursing facility and hospice. As the inclusion/exclusion of readmissions can have a large effect on the results, results are provided with and without readmissions included. The full90 inclusion shows a consistently slightly higher on R2 than the full window inclusion. Since full 90 and full window data shows consistent R2 results all subsequent analysis will be on the full 90 data.
Window
Trigger Hosp & Post
w/o Readmission
Charges Full
Window
Trigger Hosp & Post
w/o Readmission
Charges Full 90
Trigger Hosp & Post With
Readmission Charges
Full Window
Trigger Hosp & Post With
Readmission Charges
Full 90
Post Only w/o
Readmission Charges
Full Window
Post Only w/o
Readmission Charges
Full 90
Post Only With
Readmission Charges
Full Window
Post Only With
Readmission Charges
Full 90
15 days 36.5 40.7 30.7 35.5 18.5 17.8 4.5 4.5 30 days 37.3 40.5 28.4 32.4 23.9 23.3 6.8 6.5 45 days 38.7 40.9 28.4 31.1 27.3 26.5 8.9 8.7 60 days 38.9 40.4 27.8 27.7 30.2 29.1 10.4 8.7 75 days 39.8 40.2 26.0 28.3 31.3 31.0 10.1 11.5 90 days 39.4 40.5 26.0 27.5 30.7 32.3 11.5 12.3
Window
Trigger Hosp & Post
w/o Readmission
Payments Full
Window
Trigger Hosp & Post
w/o Readmission
Payments Full 90
Trigger Hosp & Post With
Readmission Payments
Full Window
Trigger Hosp & Post With
Readmission Payments
Full 90
Post Only w/o
Readmission Payments
Full Window
Post Only w/o
Readmission Payments
Full 90
Post Only With
Readmission Payments
Full Window
Post Only With
Readmission Payments
Full 90
15 days 48.7 55.5 41.8 48.8 21.8 23.3 10.1 11.6 30 days 46.9 50.7 37.5 42.0 22.7 23.4 12.9 14.0 45 days 43.9 46.0 34.4 36.2 22.6 22.8 14.2 14.0 60 days 40.8 42.5 31.0 33.7 22.3 22.3 14.2 15.1 75 days 39.0 40.4 29.5 30.7 22.3 22.3 14.7 14.9 90 days 38.4 38.3 29.8 29.6 22.3 21.9 15.7 15.4
Table 4.2: PCE R2 for Full Window and Full 90 (Untrimmed, evaluation database) Table 4.3 illustrates the effect of the trimming on R2. The top half of the table is based on Medicare charges. The bottom half is based on payments. The left half of the table includes payments/charges for the trigger event plus post acute care; the right half is post acute care only. As in Table 4.2 the post acute care bundle includes all service including hospital outpatient part B, all other part B (physician office and ancillaries), DME, home health, skilled nursing facility and hospice. As the inclusion/exclusion of readmissions can have a large effect on the results, results are provided with and without readmissions included. Trimming the data results in a consistent increase in R2. The magnitude of the increase is most pronounced for the post acute care only bundle with readmissions included. This illustrates the dramatic impact that readmissions have on post acute care costs. Indeed, a disproportionate number of patients who are trimmed are patients who experience a readmission during the post acute care period. Although trimming the data

19
results in a consistent increase in R2, the trimmed and untrimmed data shows consistent pattern of R2 results. All subsequent analysis will be on untrimmed data.
Window
Trigger Hosp & Post
w/o Readmission
Charges Trimmed
Trigger Hosp & Post w/o
Readmission Charges
Untrimmed
Trigger Hosp & Post With
Readmission Charges Trimmed
Trigger Hosp & Post With
Readmission Charges
Untrimmed
Post Only w/o
Readmission Charges Trimmed
Post Only w/o
Readmission Charges
Untrimmed
Post Only With
Readmission Charges Trimmed
Post Only With
Readmission Charges
Untrimmed 15 days 44.2 40.7 41.6 35.5 19.2 17.8 8.0 4.5 30 days 43.6 40.5 39.8 32.4 25.2 23.3 12.3 6.5 45 days 43.0 40.9 37.8 31.1 28.3 26.5 13.9 8.7 60 days 43.2 40.4 36.4 27.7 31.1 29.1 15.7 8.7 75 days 43.0 40.2 35.6 28.3 32.8 31.0 17.7 11.5 90 days 43.2 40.5 35.1 27.5 34.7 32.3 19.1 12.3
Window
Trigger Hosp & Post
w/o Readmission
Payments Trimmed
Trigger Hosp & Post w/o
Readmission Payments Untrimmed
Trigger Hosp & Post With
Readmission Payments Trimmed
Trigger Hosp & Post With
Readmission Payments Untrimmed
Post Only w/o
Readmission Payments Trimmed
Post Only w/o
Readmission Payments Untrimmed
Post Only With
Readmission Payments Trimmed
Post Only With
Readmission Payments Untrimmed
15 days 66.2 55.5 63..2 48.8 25.9 23.3 19.5 11.6 30 days 56.4 50.7 51.8 42.0 25.3 23.4 20.1 14.0 45 days 50.2 46.0 45.1 36.2 24.9 22.8 20.1 14.0 60 days 46.7 42.5 41.2 33.7 24.9 22.3 20.3 15.1 75 days 43.8 40.4 38.3 30.7 24.4 22.3 20.1 14.9 90 days 41.7 38.3 36.0 29.6 24.3 21.9 20.2 15.4 Table 4.3: PCE R2 for trimmed and untrimmed data by episode window (Full90, evaluation database) The Effect on R2 of Different Length Windows: The important issue is the effect on explained variation as the post acute window is changed in fifteen day increments from 15 to 90 days The dependent variables are charges and then Medicare payments. Only full90 episodes are included so that each window contains the same individuals. The data were not trimmed. The results for charges indicate that including readmissions greatly reduces R2, especially for longer windows (which provide more time for readmissions to occur). For example, at 90 days R2 drops by almost a third - from 40.5 percent to 27.5 percent when readmissions are included. The results excluding readmissions are essentially flat as the episode window increases at a little over 40 percent implying that charges and window length are correlated. With readmissions included the R2 shows a steady decline as the episode window increases, dropping from 35.5 percent at 15 days to 27.5 percent at 90 days. The results for Medicare payments show a different pattern, steadily dropping as the length of the window increases. However, it is important to note that R2 starts at 55.5 percent without readmissions, falling to 38.3 percent at ninety days. R2 starts high because Medicare inpatient payments are based on MS-DRGs and inpatient payments will dominate a short window. The influence of the acute care MS-DRGs declines as the window increases in length. At 75 days the results for payments are about the same as for charges, and are only slightly lower at 90 days.
20
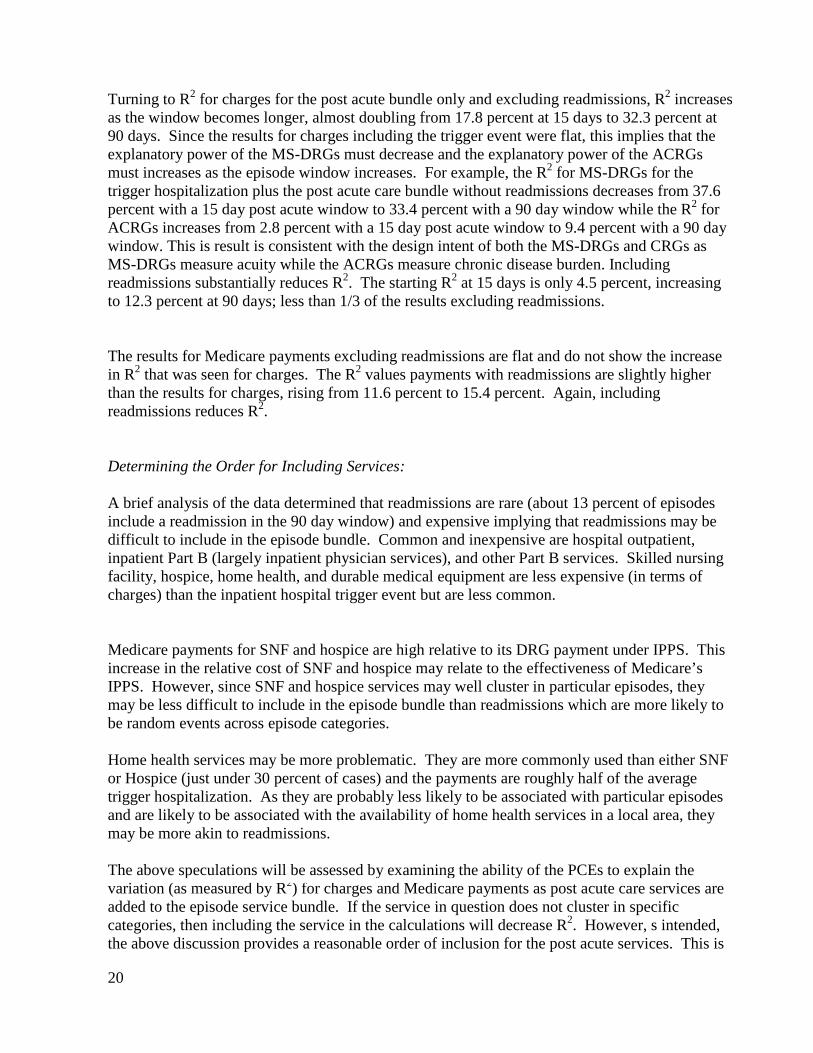
Turning to R2 for charges for the post acute bundle only and excluding readmissions, R2 increases as the window becomes longer, almost doubling from 17.8 percent at 15 days to 32.3 percent at 90 days. Since the results for charges including the trigger event were flat, this implies that the explanatory power of the MS-DRGs must decrease and the explanatory power of the ACRGs must increases as the episode window increases. For example, the R2 for MS-DRGs for the trigger hospitalization plus the post acute care bundle without readmissions decreases from 37.6 percent with a 15 day post acute window to 33.4 percent with a 90 day window while the R2 for ACRGs increases from 2.8 percent with a 15 day post acute window to 9.4 percent with a 90 day window. This is result is consistent with the design intent of both the MS-DRGs and CRGs as MS-DRGs measure acuity while the ACRGs measure chronic disease burden. Including readmissions substantially reduces R2. The starting R2 at 15 days is only 4.5 percent, increasing to 12.3 percent at 90 days; less than 1/3 of the results excluding readmissions. The results for Medicare payments excluding readmissions are flat and do not show the increase in R2 that was seen for charges. The R2 values payments with readmissions are slightly higher than the results for charges, rising from 11.6 percent to 15.4 percent. Again, including readmissions reduces R2. Determining the Order for Including Services: A brief analysis of the data determined that readmissions are rare (about 13 percent of episodes include a readmission in the 90 day window) and expensive implying that readmissions may be difficult to include in the episode bundle. Common and inexpensive are hospital outpatient, inpatient Part B (largely inpatient physician services), and other Part B services. Skilled nursing facility, hospice, home health, and durable medical equipment are less expensive (in terms of charges) than the inpatient hospital trigger event but are less common. Medicare payments for SNF and hospice are high relative to its DRG payment under IPPS. This increase in the relative cost of SNF and hospice may relate to the effectiveness of Medicare’s IPPS. However, since SNF and hospice services may well cluster in particular episodes, they may be less difficult to include in the episode bundle than readmissions which are more likely to be random events across episode categories. Home health services may be more problematic. They are more commonly used than either SNF or Hospice (just under 30 percent of cases) and the payments are roughly half of the average trigger hospitalization. As they are probably less likely to be associated with particular episodes and are likely to be associated with the availability of home health services in a local area, they may be more akin to readmissions. The above speculations will be assessed by examining the ability of the PCEs to explain the variation (as measured by R2) for charges and Medicare payments as post acute care services are added to the episode service bundle. If the service in question does not cluster in specific categories, then including the service in the calculations will decrease R2. However, s intended, the above discussion provides a reasonable order of inclusion for the post acute services. This is

21
inpatient Part A, inpatient Part B, other part B, hospital based Outpatient Part B. Durable Medical Equipment (DME), Home Health (HH), Skilled Nursing Facility (SNF), and Hospice. The last addition to the post acute care bundle will be readmissions. The Effect on R2 of Adding Services: A second important issue is the effect on explained variations of various services as they are added to the bundle in the order specified above. The addition of the inpatient physician Part B charges (mainly physician) to the inpatient Part A charges increases the R2 from about 39 percent to about 41 percent. The R2 remains at about 41 percent as additional services are added; declining only slightly for longer windows as skilled nursing facility (SNF) and then hospice services are added. Adding readmissions greatly decreases R2, especially for longer windows. Indeed, when readmissions are included in the window, R2 is falls below the starting value. For the trigger hospitalization plus the full post acute bundle excluding readmissions, the R2 is between 40 percent and 41 percent depending on the episode window. As a reference, the R2 for MS-DRGs for inpatient Part A only is 36.3 percent. Thus, the PCEs with the trigger hospitalization plus the full post acute bundle excluding readmissions have a higher R2 than MS-DRGs for Part A. While not surprising, the point is that since this level of performance has been acceptable for MS-DRGs since 1983, a higher level of performance for PCEs should also be acceptable. Turning to Medicare payments, the initial R2 for inpatient Part A for Medicare payments is much higher than the R2 for charges (at about 67 percent for payments to about 39 percent for charges). This is because MS-DRGs are being used in a somewhat circular way to explain DRG payments under the MS-DRG based PPS. The R2 value is not 1.0 because Medicare’s DRG payments include outlier payments and are adjusted for local area wages, medical education, and disproportionate share and changes in reimbursement rates because the data were drawn from several years. The R2 for payment represents a somewhat circular result since the MS-DRGs are included in the PCEs and are also used to determine Medicare payments. In any event, given hospital familiarity with MS-DRGs, it may be more practical to have separate payment weights for inpatient care and post acute care and then add these two payment amounts together to determine the total payment for the episode. Unlike the results for charges the impact of adding services to the bundle for longer windows has a larger effect in reducing R2. However, this analysis begins at a much higher R2 level. Indeed, a 15 day window has an R2 value greater than 55 percent if all services except readmissions are included. This value would be still higher if an outlier payment policy based on PCEs and similar to that used by Medicare were included in the analysis. Considering charges for only post acute care, longer windows have better R2 values, though the 60 and 75 day windows are close to the 90 day window. The highest R2 values are at 90 days; the lowest at 15 days. R2 stays fairly constant through the addition of home health and falls slightly as SNF and hospice are added. The inclusion of readmissions results in a dramatic decline to 12.3 percent for a 90 day window and to 4.5 percent for a 15 day window. The pattern for payments is quite different. Up to the inclusion of home health longer windows have higher R2 values and the R2 values fall. SNF and Hospice increase R2 values for shorter windows and stop the decline in longer windows. The R2 value for all of the windows when

22
home health and hospice are included is about 22 percent. Including readmissions causes a substantial drop in R2. Comparing the R2 for charges for all post acute care services (with and without readmissions) for the PCEs, the MS-DRGs only and the ACRGs only, the PCEs work best and longer windows have higher R2. For example, without readmissions, R2 for PCEs goes from 17.8 percent at 15 days to 32.3 percent at 90 days. The performance with readmissions is much lower reaching an R2 of only 12.3 percent. MS-DRGs are relatively flat as the window increases reaching 10.8 percent without readmissions. ACRGs alone, as expected, perform better as disease burden becomes more important – always improving as the window becomes longer. The situation for payments is similar in that the PCEs perform best, though the R2 is not as high as for charges and declines slightly from 23.3 percent to 21.9 percent for PCEs without readmissions. The R2 for MS-DRGs without readmissions steadily declines from 19.7 percent to 15.2 percent as the window length increases. The R2 for ACRGs without readmissions increases steadily from 3.5 percent to 8.5 percent. We consider next the R2 results for PCEs, ACRGs, and MS-DRGs as services are added to the 90 day window alternative. For charges, PCEs and ACRGs are close and move together, declining slightly (from 37.8 to 32.3 and 32.7 to 26.2 percent as SNF and hospice are added. The R2 then declines significantly as readmissions are included (to 12.3 and 9.4 percent). MS-DRGs actually increase slightly (from about 8.7 to 10.7 percent as SNF and hospice are added. While higher, MS-DRGs are still considerably below the PCE values. For Medicare payments the PCEs and ACRGs start high (32.3 percent and 27.5 percent) and decline more rapidly than for charges as services are added. MS-DRGs start lower and move up a bit, becoming higher than ACRGs as SNF and Hospice are added. As noted earlier, the complete R2 results are contained in Appendix C. Coefficient of Variation As noted earlier, the coefficient of variation (CV) is the standard deviation divided by the absolute value of the mean. CV values based on trimmed and untrimmed data were computed. As expected, CVs based on trimmed data are lower than those based on untrimmed data, though the difference is not large and the patterns are similar. CVs for charges are larger than those for payments. Weighted CVs for the complete episode (hospital plus post acute care) are considerably less than 1.0. Indeed, CVs for charges are close to 0.7 for all windows. Payment CVs are less than 0.6, increasing as the window becomes longer, reflecting the reduced effect of the MS-DRG-based payments.
The CVs for post acute care only are much higher; always exceeding 1.0. CVs for both charges and payments decline as the window becomes longer. This is not unexpected as extending the window tends to reduce short-term variation in resource consumption. The patterns of care during a hospitalization are relatively consistent compare to the post acute care setting in which there is little systematic coordination of care. It appears that even though the post acute CVs are relatively high, indicating a high degree of variability in the data, the extent to which that variability is explained (reduced) by the PCEs is relatively high as shown in the previous R2 results.
23
Chapter Five Patient Centered Episodes (PCEs) as a Communications Tool
The ultimate objective of any payment reform is to motivate behavioral change that leads to lower costs, better care coordination and better quality. Providers will be better able to achieve these objectives if the payment methodologies are expressed in a clinically meaningful manner that communicates actionable information in a form and at a level of detail sufficient to achieve sustainable behavior changes. This is the core lesson from the DRG based IPPS. The DRGs were much more than just a pricing mechanism. DRGs defined groups of clinically similar patients, creating a transparent and clinically precise language that was comprehensive (all clinical areas were covered) with a uniform and consistent structure that linked the clinical and financial aspects of care. The importance of the communication value of DRGs cannot be overemphasized. The language of DRGs provided hospital administrators and physicians a meaningful basis for evaluating both the processes of care and the associated financial impact. The simple categorical nature of DRGs was critical to the creation of a powerful, transparent, and clinically precise communications tool. CMS has emphasized the importance of the communications aspect of DRGs to the success of IPPS:
“The success of any payment system that is predicated on providing incentives for cost control is almost totally dependent on the effectiveness with which the incentives are communicated…. Central to the success of the Medicare inpatient hospital prospective payment system is that DRGs have remained a clinical description of why the patient required hospitalization.”
Federal Register, May 4, 2001
As noted in the 1982 HHS Report to Congress establishing the Medicare IPPS, the objective of IPPS was “to set a reasonable price for a known product.” (Schweiker, 1982) The categorical nature of DRGs permitted a separation of the computation of the relative payment weights (prices) and the definition of the DRG categories (products). Such a separation is an inherent by-product of the categorical nature of DRGs and cannot be readily implemented in non-categorical systems, such as those based on linear or logistic regression. As noted by CMS the separation of the methodologies for developing the clinical model and the payment weights was a critical factor in the success and widespread adoption of the DRG system:
“The separation of the clinical and payment weight methodologies allows stable clinical methodology to be maintained while the payment weights evolve in response to changing practice patterns.”
Federal Register, May 4, 2001
24
Thus, the DRG clinical model has remained relatively stable creating a consistent and powerful communications tool. However, the payment weights have fluctuated to reflect changing practice patterns and new technology. The post acute care payment system evaluated in this report adheres to the fundamental design principals of the DRG based IPPS. It is a product with a price system that that sets prices for clinically coherent bundles of post acute care services. The post acute care prices are established relative to each MS-DRG. The use of the CRGs as the basic unit of post acute care payment within each MS-DRG provides the basis a transparent, and clinically precise communications tool that will provide a meaningful basis for evaluating the processes of care and the associated financial impact of post acute care practice patterns. Tables 5.1 and 5.2 illustrate for MS-DRGs 292 (CHF) and 405 (Joint Replacement), respectively, the linking of the clinical and financial data. These tables are for charges, full90, a 90 day window and include all post acute care services. A dash dictates that there were less than ten patients in a cell. For CHF post acute care charges are greater than the Part A inpatient hospitals charges but for joint replacements are only about a quarter of the Part A inpatient hospitals charges. CHF patients are concentrated in the higher CRG statuses and severity levels while joint replacement patients are concentrated in the lower statuses and severity levels. Readmission charges are higher for CHF patients indicating a higher readmission rate than joint replacement patients. SNF charges are a bigger proportion of post acute care charges for joint replacement patients than for CHF patients. As these tables illustrate, the categorical nature of the CRGs allows information to be displayed in readily understandable and clinically meaningful manner. Table 5.3 contains post acute care payment weights for these two MS-DRGs. The payment weights are computed by dividing the average post acute care charges in each CRG status/severity level cell by the average post acute care charges in the MS-DRG. Cells with less than 10 patients were assigned the weight of the adjacent cell. Payment for the MS-DRG is the MS-DRG payment weight times the Part A base rate with any applicable adjustments applied (e.g.. IME). Similarly, the post acute care payment would be the post acute care payment weight times the post acute care base rate with any applicable adjustments applied. Note that the payment weights are relative to the MS-DRG and cannot be compared across MS-DRGs. A post acute payment weight of 2.0 for an MS-DRG means that on average the patient is expected to use twice as many post acute care resources as the average patient in that MS-DRG. The computation of the post acute care payment weights is independent of the clinical definition of the units of payment (i.e., the CRGs). Post acute care payment weights for different episode windows or with different services included can easily be computed with the clinical definition of the CRGs remaining unchanged. Such flexibility is not possible with regression based models in which every change in service scope or episode window require a new regression based clinical model.

25
Chapter Six Conclusions
Several important conclusions can be drawn from this research: First, and most important, an episode-based payment system based on the model described in Chapter 2 can be a significant extension of the PPS’ “product with a price” concept. While not a panacea, this approach has the potential to result in significant savings for Medicare while simultaneously improving quality through better integration of acute and post acute care services. As noted by MedPAC:
“The Commission finds that bundling Medicare payment to cover all services associated with an episode of care has the potential to improve incentives for providers to deliver the right mix of services at the right time.”
MedPAC, 2008 Bundling inpatient and post acute care into a single unit of payment would also be financially beneficial for any provider who can improve the present day almost completely disorganized “system” of post acute care. Given current information technology, significant improvements in the delivery of post acute care should be readily achievable. Second, the PCEs with the trigger hospitalization plus the full post acute bundle excluding readmissions have a higher R2 than MS-DRGs for Part A. Since this level of performance has been acceptable for MS-DRGs since 1983, the level of R2 performance of the PCEs indicate that the financial risks associated with a bundled post acute care payment system should be manageable. Third, the impact on post acute care charges/payments of the patient acuity during the admission that initiated the episode diminishes as the length of the post acute care window increases. The impact on post acute care charges/payments of the patient burden of chronic illness increases as the length of the post acute care window increases. Fourth, it is feasible to include all post acute care services with the possible exception of readmissions. Including even potentially avoidable readmission will need to be done with some caution in order to avoid creating too much financial risk and potentially creating access problems for some subpopulations of beneficiaries. Any bundled post acute care payment system will need to have an outlier policy. The high cost of readmissions creates a direct relationship between the occurrence of a readmission and the categorization of a patient as an outlier. A policy to balance readmissions and outlier payments will need to be developed. Perhaps the implicit financial penalty for readmissions should be discounted, or perhaps rewards and penalties for readmissions should be based on rates of avoidable readmissions based on a comparison of hospitals to their peers.

26
Fifth, the statistical performance of PCEs improved as the length of the window increased. This means that post acute care windows as long as 90 days are feasible. A longer window will require providers to take a more comprehensive approach to the coordination of care during the post acute period. Sixth, the PCE performance was achieved using MS-DRGs and CRGs as currently constituted with no modification. MS-DRGs were developed for inpatient care and CRGs were developed to predict year long episodes of care across the full spectrum of care and not just the post acute period. Clearly, both systems could be optimized for the post acute care period. For example, the craniotomy MS-DRGs include craniotomies for strokes and malignancies. While that may be reasonable for inpatient care, these two types of patients have very different post acute courses of treatment. The PCEs used a uniform consolidation CRGs across all MS-DRGs. The level of CRG aggregation and well as the length of the window could be varied depending on the reason for hospitalization (MS-DRG). For example, as was demonstrated in the previous chapter, CHF patients are concentrated in the higher CRG statuses and severity levels while hip replacement patients are concentrated in the lower statuses and severity levels. The post acute care CRG payment categories could be re-aggregated to allow more CRG detail to be used for the higher severity patients with CHF and the lower severity patients with hip replacements. Finally, as happened with DRGs, it is reasonable to expect that the system will be improved over time as data quality improves and as provider behavior becomes more rational in response to the new financial incentives. It is important to remember that, as CMS noted, this is much more likely to happen if the payment tool is also an effective communication device that links the clinical and economic aspects of care.
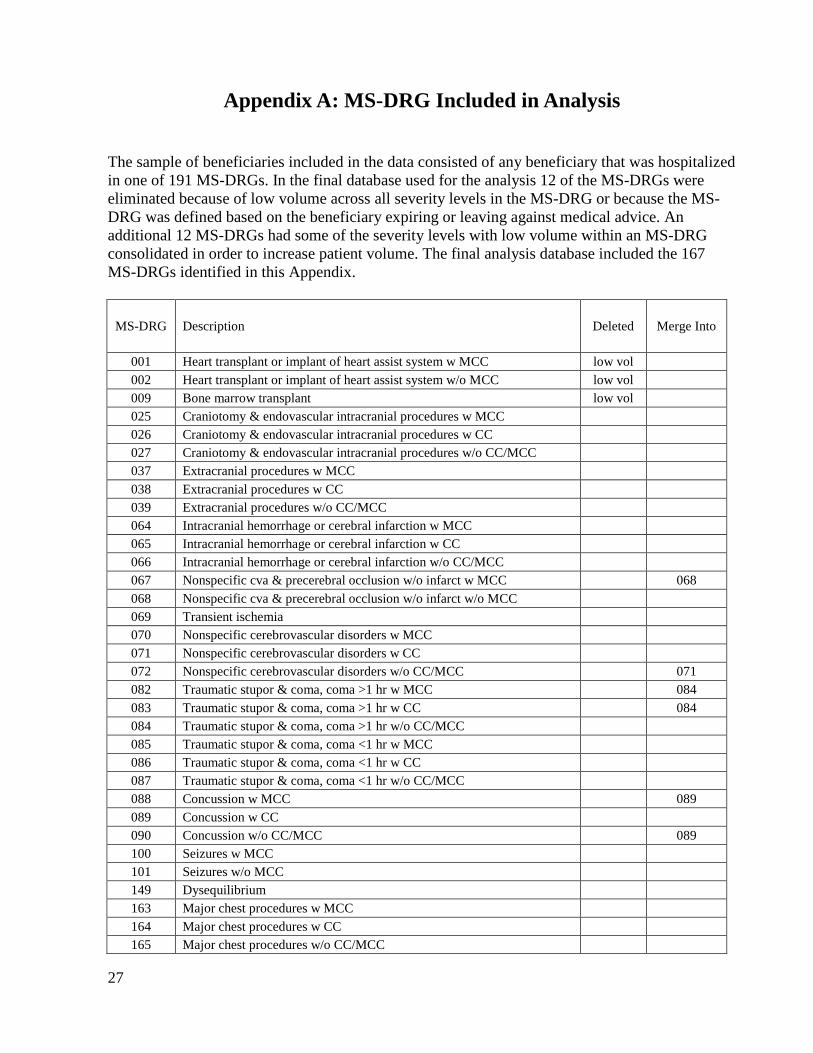
27
Appendix A: MS-DRG Included in Analysis The sample of beneficiaries included in the data consisted of any beneficiary that was hospitalized in one of 191 MS-DRGs. In the final database used for the analysis 12 of the MS-DRGs were eliminated because of low volume across all severity levels in the MS-DRG or because the MS-DRG was defined based on the beneficiary expiring or leaving against medical advice. An additional 12 MS-DRGs had some of the severity levels with low volume within an MS-DRG consolidated in order to increase patient volume. The final analysis database included the 167 MS-DRGs identified in this Appendix.
MS-DRG Description Deleted Merge Into
001 Heart transplant or implant of heart assist system w MCC low vol 002 Heart transplant or implant of heart assist system w/o MCC low vol 009 Bone marrow transplant low vol 025 Craniotomy & endovascular intracranial procedures w MCC 026 Craniotomy & endovascular intracranial procedures w CC 027 Craniotomy & endovascular intracranial procedures w/o CC/MCC 037 Extracranial procedures w MCC 038 Extracranial procedures w CC 039 Extracranial procedures w/o CC/MCC 064 Intracranial hemorrhage or cerebral infarction w MCC 065 Intracranial hemorrhage or cerebral infarction w CC 066 Intracranial hemorrhage or cerebral infarction w/o CC/MCC 067 Nonspecific cva & precerebral occlusion w/o infarct w MCC 068 068 Nonspecific cva & precerebral occlusion w/o infarct w/o MCC 069 Transient ischemia 070 Nonspecific cerebrovascular disorders w MCC 071 Nonspecific cerebrovascular disorders w CC 072 Nonspecific cerebrovascular disorders w/o CC/MCC 071 082 Traumatic stupor & coma, coma >1 hr w MCC 084 083 Traumatic stupor & coma, coma >1 hr w CC 084 084 Traumatic stupor & coma, coma >1 hr w/o CC/MCC 085 Traumatic stupor & coma, coma <1 hr w MCC 086 Traumatic stupor & coma, coma <1 hr w CC 087 Traumatic stupor & coma, coma <1 hr w/o CC/MCC 088 Concussion w MCC 089 089 Concussion w CC 090 Concussion w/o CC/MCC 089 100 Seizures w MCC 101 Seizures w/o MCC 149 Dysequilibrium 163 Major chest procedures w MCC 164 Major chest procedures w CC 165 Major chest procedures w/o CC/MCC

28
MS-DRG Description Deleted Merge Into 175 Pulmonary embolism w MCC 176 Pulmonary embolism w/o MCC 177 Respiratory infections & inflammations w MCC 178 Respiratory infections & inflammations w CC 179 Respiratory infections & inflammations w/o CC/MCC 189 Pulmonary edema & respiratory failure 190 Chronic obstructive pulmonary disease w MCC 191 Chronic obstructive pulmonary disease w CC 192 Chronic obstructive pulmonary disease w/o CC/MCC 193 Simple pneumonia & pleurisy w MCC 194 Simple pneumonia & pleurisy w CC 195 Simple pneumonia & pleurisy w/o CC/MCC 202 Bronchitis & asthma w CC/MCC 203 Bronchitis & asthma w/o CC/MCC 207 Respiratory system diagnosis w ventilator support 96+ hours 208 Respiratory system diagnosis w ventilator support <96 hours 216 Cardiac valve & oth maj cardiothoracic proc w card cath w MCC 217 Cardiac valve & oth maj cardiothoracic proc w card cath w CC 218 Cardiac valve & oth maj cardiothoracic proc w card cath w/o CC/MCC 219
219 Cardiac valve & oth maj cardiothoracic proc w/o card cath w MCC 220 Cardiac valve & oth maj cardiothoracic proc w/o card cath w CC 221 Cardiac valve & oth maj cardiothoracic proc w/o card cath w/o CC/MCC 224 Cardiac defib implant w cardiac cath w/o AMI/HF/shock w MCC 225 225 Cardiac defib implant w cardiac cath w/o AMI/HF/shock w/o MCC 226 Cardiac defibrillator implant w/o cardiac cath w MCC 227 Cardiac defibrillator implant w/o cardiac cath w/o MCC 233 Coronary bypass w cardiac cath w MCC 234 Coronary bypass w cardiac cath w/o MCC 235 Coronary bypass w/o cardiac cath w MCC 236 Coronary bypass w/o cardiac cath w/o MCC 237 Major cardiovasc procedures w MCC or thoracic aortic aneurysm repair 238 Major cardiovasc procedures w/o MCC 242 Permanent cardiac pacemaker implant w MCC 243 Permanent cardiac pacemaker implant w CC 244 Permanent cardiac pacemaker implant w/o CC/MCC 246 Perc cardiovasc proc w drug-eluting stent w MCC or 4+ vessels/stents 247 Perc cardiovasc proc w drug-eluting stent w/o MCC 248 Perc cardiovasc proc w non-drug-eluting stent w MCC or 4+ ves/stents 249 Perc cardiovasc proc w non-drug-eluting stent w/o MCC 250 Perc cardiovasc proc w/o coronary artery stent w MCC 251 Perc cardiovasc proc w/o coronary artery stent w/o MCC 252 Other vascular procedures w MCC

29
MS-DRG Description Deleted Merge Into 253 Other vascular procedures w CC 254 Other vascular procedures w/o CC/MCC 280 Acute myocardial infarction, discharged alive w MCC 281 Acute myocardial infarction, discharged alive w CC 282 Acute myocardial infarction, discharged alive w/o CC/MCC 283 Acute myocardial infarction, expired w MCC expired 284 Acute myocardial infarction, expired w CC expired 285 Acute myocardial infarction, expired w/o CC/MCC expired 286 Circulatory disorders except AMI, w card cath w MCC 287 Circulatory disorders except AMI, w card cath w/o MCC 291 Heart failure & shock w MCC 292 Heart failure & shock w CC 293 Heart failure & shock w/o CC/MCC 294 Deep vein thrombophlebitis w CC/MCC low vol 295 Deep vein thrombophlebitis w/o CC/MCC low vol 299 Peripheral vascular disorders w MCC 300 Peripheral vascular disorders w CC 301 Peripheral vascular disorders w/o CC/MCC 302 Atherosclerosis w MCC 303 Atherosclerosis w/o MCC 304 Hypertension w MCC 305 305 Hypertension w/o MCC 308 Cardiac arrhythmia & conduction disorders w MCC 309 Cardiac arrhythmia & conduction disorders w CC 310 Cardiac arrhythmia & conduction disorders w/o CC/MCC 311 Angina pectoris 312 Syncope & collapse 313 Chest pain 329 Major small & large bowel procedures w MCC 330 Major small & large bowel procedures w CC 331 Major small & large bowel procedures w/o CC/MCC 335 Peritoneal adhesiolysis w MCC 336 Peritoneal adhesiolysis w CC 337 Peritoneal adhesiolysis w/o CC/MCC 377 G.I. hemorrhage w MCC 378 G.I. hemorrhage w CC 379 G.I. hemorrhage w/o CC/MCC 388 G.I. obstruction w MCC 389 G.I. obstruction w CC 390 G.I. obstruction w/o CC/MCC 391 Esophagitis, gastroent & misc digest disorders w MCC 392 Esophagitis, gastroent & misc digest disorders w/o MCC 411 Cholecystectomy w c.d.e. w MCC low vol 412 Cholecystectomy w c.d.e. w CC low vol 413 Cholecystectomy w c.d.e. w/o CC/MCC low vol 414 Cholecystectomy except by laparoscope w/o c.d.e. w MCC 415 Cholecystectomy except by laparoscope w/o c.d.e. w CC

30
MS-DRG Description Deleted Merge Into 416 Cholecystectomy except by laparoscope w/o c.d.e. w/o CC/MCC 417 Laparoscopic cholecystectomy w/o c.d.e. w MCC 418 Laparoscopic cholecystectomy w/o c.d.e. w CC 419 Laparoscopic cholecystectomy w/o c.d.e. w/o CC/MCC 444 Disorders of the biliary tract w MCC 445 Disorders of the biliary tract w CC 446 Disorders of the biliary tract w/o CC/MCC 459 Spinal fusion except cervical w MCC 460 460 Spinal fusion except cervical w/o MCC 466 Revision of hip or knee replacement w MCC 467 Revision of hip or knee replacement w CC 468 Revision of hip or knee replacement w/o CC/MCC 469 Major joint replacement or reattachment of lower extremity w MCC 470 Major joint replacement or reattachment of lower extremity w/o MCC 471 Cervical spinal fusion w MCC 472 472 Cervical spinal fusion w CC 473 Cervical spinal fusion w/o CC/MCC 480 Hip & femur procedures except major joint w MCC 481 Hip & femur procedures except major joint w CC 482 Hip & femur procedures except major joint w/o CC/MCC 490 Back & neck proc exc spinal fusion w CC/MCC or disc
device/neurostim 491 Back & neck proc exc spinal fusion w/o CC/MCC 492 Lower extrem & humer proc except hip,foot,femur w MCC 493 Lower extrem & humer proc except hip,foot,femur w CC 494 Lower extrem & humer proc except hip,foot,femur w/o CC/MCC 535 Fractures of hip & pelvis w MCC 536 Fractures of hip & pelvis w/o MCC 551 Medical back problems w MCC 552 Medical back problems w/o MCC 562 Fx, sprn, strn & disl except femur, hip, pelvis & thigh w MCC 563 Fx, sprn, strn & disl except femur, hip, pelvis & thigh w/o MCC 602 Cellulitis w MCC 603 Cellulitis w/o MCC 637 Diabetes w MCC 638 Diabetes w CC 639 Diabetes w/o CC/MCC 668 Transurethral procedures w MCC 669 Transurethral procedures w CC 670 Transurethral procedures w/o CC/MCC 673 Other kidney & urinary tract procedures w MCC 674 Other kidney & urinary tract procedures w CC 675 Other kidney & urinary tract procedures w/o CC/MCC 682 Renal failure w MCC 683 Renal failure w CC 684 Renal failure w/o CC/MCC 689 Kidney & urinary tract infections w MCC

31
MS-DRG Description Deleted Merge Into 690 Kidney & urinary tract infections w/o MCC 713 Transurethral prostatectomy w CC/MCC 714 Transurethral prostatectomy w/o CC/MCC 742 Uterine & adnexa proc for non-malignancy w CC/MCC 743 Uterine & adnexa proc for non-malignancy w/o CC/MCC 811 Red blood cell disorders w MCC 812 Red blood cell disorders w/o MCC 853 Infectious & parasitic diseases w O.R. procedure w MCC 854 Infectious & parasitic diseases w O.R. procedure w CC 855 Infectious & parasitic diseases w O.R. procedure w/o CC/MCC 854 862 Postoperative & post-traumatic infections w MCC 863 Postoperative & post-traumatic infections w/o MCC 870 Septicemia or severe sepsis w MV 96+ hours 871 Septicemia or severe sepsis w/o MV 96+ hours w MCC 872 Septicemia or severe sepsis w/o MV 96+ hours w/o MCC 885 Psychoses 894 Alcohol/drug abuse or dependence, left ama AMA 895 Alcohol/drug abuse or dependence w rehabilitation therapy 896 Alcohol/drug abuse or dependence w/o rehabilitation therapy w MCC 897 Alcohol/drug abuse or dependence w/o rehabilitation therapy w/o MCC 919 Complications of treatment w MCC 920 Complications of treatment w CC 921 Complications of treatment w/o CC/MCC

32
Appendix B: Related Readmissions Any readmission with an MS-DRG in the same major diagnostic category (MDC) as the MS-DRG of the admission that initiated the episode was considered plausibly related to the admission that initiated the episode and was included in the post acute care cost. The one exception to this rule was a list of 49 MS-DRGs listed in this Appendix that were always considered plausibly related to any admission that initiated episode. The MS-DRGs in this Appendix are infections or complications of care that could plausibly be related to the care in the admission that initiated the episode.
MS-DRG Description 075 Viral meningitis w CC/MCC 076 Viral meningitis w/o CC/MCC 094 Bacterial & tuberculous infections of nervous system w MCC 095 Bacterial & tuberculous infections of nervous system w CC 096 Bacterial & tuberculous infections of nervous system w/o CC/MCC 097 Non-bacterial infect of nervous sys exc viral meningitis w MCC 098 Non-bacterial infect of nervous sys exc viral meningitis w CC 099 Non-bacterial infect of nervous sys exc viral meningitis w/o CC/MCC 121 Acute major eye infections w CC/MCC 122 Acute major eye infections w/o CC/MCC 152 Otitis media & URI w MCC 153 Otitis media & URI w/o MCC 177 Respiratory infections & inflammations w MCC 178 Respiratory infections & inflammations w CC 179 Respiratory infections & inflammations w/o CC/MCC 193 Simple pneumonia & pleurisy w MCC 194 Simple pneumonia & pleurisy w CC 195 Simple pneumonia & pleurisy w/o CC/MCC 535 Fractures of hip & pelvis w MCC 536 Fractures of hip & pelvis w/o MCC 559 Aftercare, musculoskeletal system & connective tissue w MCC 560 Aftercare, musculoskeletal system & connective tissue w CC 561 Aftercare, musculoskeletal system & connective tissue w/o CC/MCC 602 Cellulitis w MCC 603 Cellulitis w/o MCC 853 Infectious & parasitic diseases w O.R. procedure w MCC 854 Infectious & parasitic diseases w O.R. procedure w CC 855 Infectious & parasitic diseases w O.R. procedure w/o CC/MCC 856 Postoperative or post-traumatic infections w O.R. proc w MCC 857 Postoperative or post-traumatic infections w O.R. proc w CC 858 Postoperative or post-traumatic infections w O.R. proc w/o CC/MCC 862 Postoperative & post-traumatic infections w MCC 863 Postoperative & post-traumatic infections w/o MCC 864 Fever 865 Viral illness w MCC 866 Viral illness w/o MCC
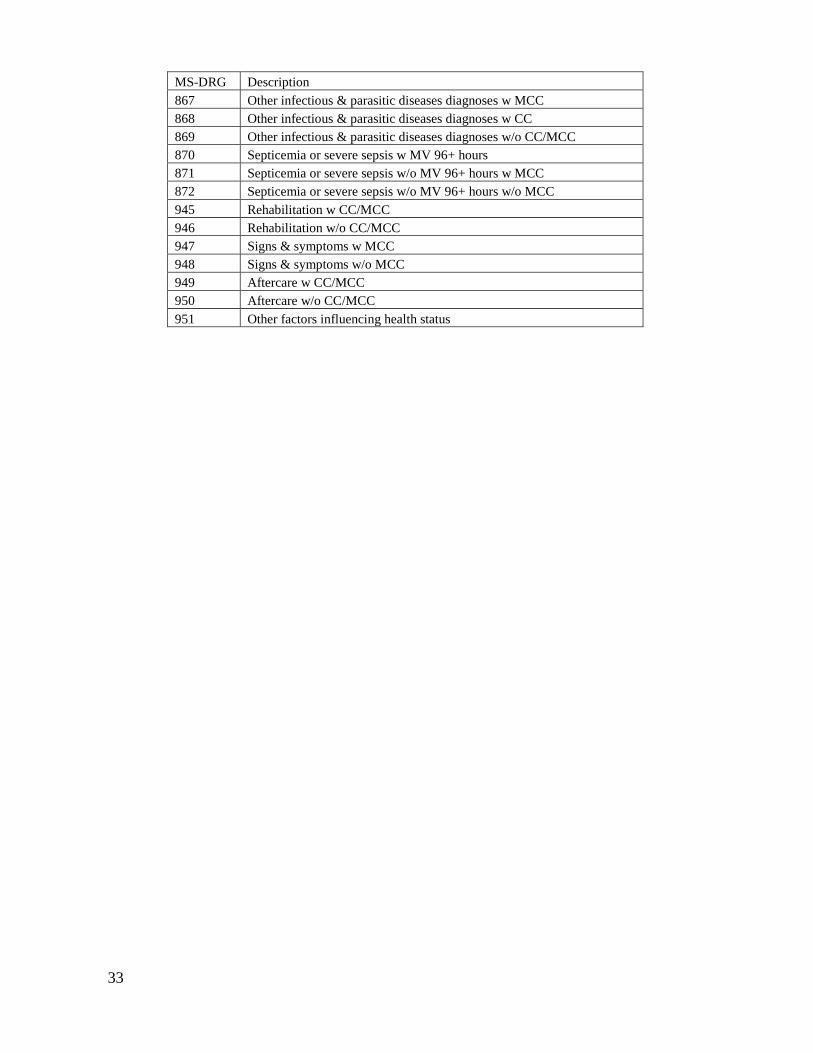
33
MS-DRG Description 867 Other infectious & parasitic diseases diagnoses w MCC 868 Other infectious & parasitic diseases diagnoses w CC 869 Other infectious & parasitic diseases diagnoses w/o CC/MCC 870 Septicemia or severe sepsis w MV 96+ hours 871 Septicemia or severe sepsis w/o MV 96+ hours w MCC 872 Septicemia or severe sepsis w/o MV 96+ hours w/o MCC 945 Rehabilitation w CC/MCC 946 Rehabilitation w/o CC/MCC 947 Signs & symptoms w MCC 948 Signs & symptoms w/o MCC 949 Aftercare w CC/MCC 950 Aftercare w/o CC/MCC 951 Other factors influencing health status
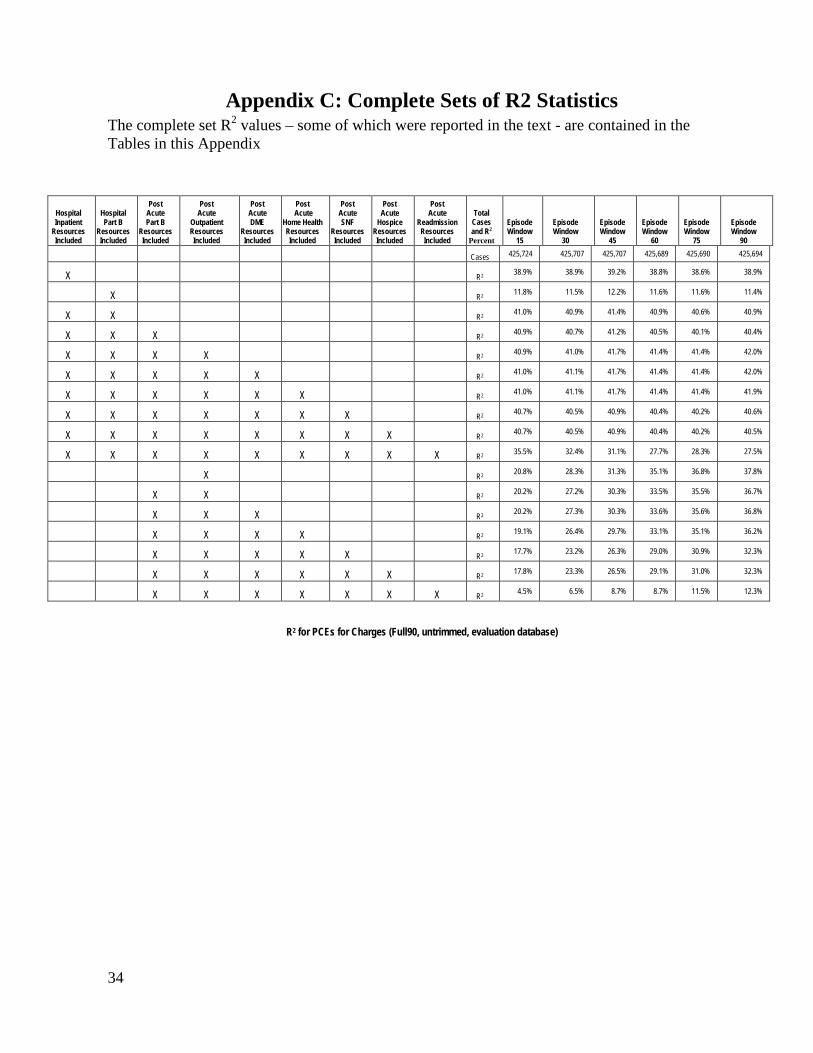
34
Appendix C: Complete Sets of R2 StatisticsThe complete set R2 values – some of which were reported in the text - are contai
ned in the
Tables in this Appendix
Hospital Inpatient
Resources Included
Hospital Part B
Resources Included
Post Acute Part B
Resources Included
Post Acute
Outpatient Resources Included
Post Acute DME
Resources Included
Post Acute
Home Health Resources Included
Post Acute SNF
Resources Included
Post Acute
Hospice Resources Included
Post Acute
Readmission Resources Included
Total Cases and R2
Percent
Episode Window
15
Episode Window
30
Episode Window
45
Episode Window
60
Episode Window
75
Episode Window
90
Cases 425,724 425,707 425,707 425,689 425,690 425,694
X R2 38.9% 38.9% 39.2% 38.8% 38.6% 38.9%
X R2 11.8% 11.5% 12.2% 11.6% 11.6% 11.4%
X X R2 41.0% 40.9% 41.4% 40.9% 40.6% 40.9%
X X X R2 40.9% 40.7% 41.2% 40.5% 40.1% 40.4%
X X X X R2 40.9% 41.0% 41.7% 41.4% 41.4% 42.0%
X X X X X R2 41.0% 41.1% 41.7% 41.4% 41.4% 42.0%
X X X X X X R2 41.0% 41.1% 41.7% 41.4% 41.4% 41.9%
X X X X X X X R2 40.7% 40.5% 40.9% 40.4% 40.2% 40.6%
X X X X X X X X R2 40.7% 40.5% 40.9% 40.4% 40.2% 40.5%
X X X X X X X X X R2 35.5% 32.4% 31.1% 27.7% 28.3% 27.5%
X R2 20.8% 28.3% 31.3% 35.1% 36.8% 37.8%
X X R2 20.2% 27.2% 30.3% 33.5% 35.5% 36.7%
X X X R2 20.2% 27.3% 30.3% 33.6% 35.6% 36.8%
X X X X R2 19.1% 26.4% 29.7% 33.1% 35.1% 36.2%
X X X X X R2 17.7% 23.2% 26.3% 29.0% 30.9% 32.3%
X X X X X X R2 17.8% 23.3% 26.5% 29.1% 31.0% 32.3%
X X X X X X X R2 4.5% 6.5% 8.7% 8.7% 11.5% 12.3%
R2 for PCEs for Charges (Full90, untrimmed, evaluation database)

35
Hospital Inpatient
Resources Included
Hospital Part B
Resources Included
Post Acute Part B
Resources Included
Post Acute
Outpatient Resources Included
Post Acute DME
Resources Included
Post Acute
Home Health Resources Included
Post Acute SNF
Resources Included
Post Acute
Hospice Resources Included
Post Acute
Readmission Resources Included
Total Cases and R2
Percent
Episode Window
15
Episode Window
30
Episode Window
45
Episode Window
60
Episode Window
75
Episode Window
90
Cases 425,756 425,755 425,755 425,755 425,754 425,755
X R2 1.4% 1.4% 1.5% 1.5% 1.4% 1.5%
X R2 0.5% 0.5% 0.5% 0.5% 0.5% 0.5%
X X R2 1.6% 1.6% 1.7% 1.7% 1.6% 1.7%
X X X R2 1.8% 1.9% 2.1% 2.2% 2.3% 2.5%
X X X X R2 2.7% 3.8% 5.2% 6.5% 7.9% 9.5%
X X X X X R2 2.7% 3.9% 5.3% 6.6% 8.0% 9.6%
X X X X X X R2 2.7% 3.9% 5.3% 6.6% 8.0% 9.6%
X X X X X X X R2 2.8% 3.9% 5.3% 6.5% 7.9% 9.4%
X X X X X X X X R2 2.8% 3.9% 5.4% 6.6% 8.0% 9.4%
X X X X X X X X X R2 2.8% 3.9% 5.1% 5.8% 7.1% 8.1%
X R2 17.3% 24.1% 27.0% 30.1% 31.6% 32.7%
X X R2 16.5% 22.9% 25.8% 28.5% 30.3% 31.6%
X X X R2 16.6% 23.1% 26.0% 28.8% 30.4% 31.8%
X X X X R2 15.7% 22.3% 25.5% 28.4% 30.0% 31.3%
X X X X X R2 11.1% 16.0% 19.7% 22.4% 24.6% 26.2%
X X X X X X R2 11.1% 16.1% 19.8% 22.4% 24.6% 26.2%
X X X X X X X R2 2.5% 4.2% 5.8% 6.2% 8.5% 9.4%
R2 for ACRGs for Charges (Full90, untrimmed, evaluation database)

36
Hospital Inpatient
Resources Included
Hospital Part B
Resources Included
Post Acute Part B
Resources Included
Post Acute
Outpatient Resources Included
Post Acute DME
Resources Included
Post Acute
Home Health Resources Included
Post Acute SNF
Resources Included
Post Acute
Hospice Resources Included
Post Acute
Readmission Resources Included
Total Cases and R2
Percent
Episode Window
15
Episode Window
30
Episode Window
45
Episode Window
60
Episode Window
75
Episode Window
90
Cases 425,756 425,755 425,755 425,755 425,754 425,755
X R2 36.4% 36.5% 36.6% 36.2% 36.1% 36.3%
X R2 9.0% 9.0% 9.2% 9.0% 8.9% 8.8%
X X R2 38.4% 38.4% 38.8% 38.4% 38.0% 38.3%
X X X R2 38.2% 38.1% 38.3% 37.7% 37.3% 37.4%
X X X X R2 37.9% 37.5% 37.2% 36.2% 35.2% 34.7%
X X X X X R2 37.9% 37.5% 37.2% 36.2% 35.2% 34.7%
X X X X X X R2 38.0% 37.5% 37.2% 36.2% 35.1% 34.6%
X X X X X X X R2 37.6% 36.8% 36.3% 35.1% 34.0% 33.5%
X X X X X X X X R2 37.6% 36.8% 36.3% 35.1% 34.0% 33.4%
X X X X X X X X X R2 32.4% 28.9% 26.7% 23.1% 22.8% 21.5%
X R2 4.8% 6.4% 7.1% 7.8% 8.4% 8.6%
X X R2 5.0% 6.6% 7.3% 8.0% 8.7% 8.9%
X X X R2 5.0% 6.6% 7.4% 8.0% 8.8% 8.9%
X X X X R2 4.9% 6.6% 7.4% 8.0% 8.8% 9.0%
X X X X X R2 8.0% 9.6% 10.1% 10.3% 10.6% 10.6%
X X X X X X R2 8.1% 9.8% 10.3% 10.5% 10.8% 10.8%
X X X X X X X R2 1.9% 2.8% 3.5% 3.4% 4.6% 4.8%
R2 for MS-DRGs for Charges (Full90, untrimmed, evaluation database)

37
Hospital Inpatient
Resources Included
Hospital Part B
Resources Included
Post Acute Part B
Resources Included
Post Acute Outpatient Resources Included
Post Acute DME
Resources Included
Post Acute Home Health
Resources Included
Post Acute SNF
Resources Included
Post Acute
Hospice Resources Included
Post Acute
Readmission
Resources Included
Total Cases and R2
Percent
Episode Window
15
Episode Window
30
Episode Window
45
Episode Window
60
Episode Window
75
Episode Window
90
Cases 425,602 425,626 425,638 425,641 425,622 425,615
X R2 66.6% 68.4% 68.3% 66.8% 67.1% 66.5%
X R2 13.9% 14.0% 13.7% 14.0% 13.7% 13.8%
X X R2 60.8% 61.9% 61.9% 61.2% 61.1% 60.7%
X X X R2 59.5% 60.4% 59.2% 57.2% 55.9% 54.2%
X X X X R2 59.0% 59.6% 58.0% 56.0% 54.7% 53.2%
X X X X X R2 59.0% 59.5% 57.9% 55.8% 54.5% 52.9%
X X X X X X R2 58.3% 58.4% 56.7% 54.7% 53.1% 51.4%
X X X X X X X R2 55.5% 50.8% 46.0% 42.5% 40.3% 38.2%
X X X X X X X X R2 55.5% 50.7% 46.0% 42.5% 40.4% 38.3%
X X X X X X X X X R2 48.8% 42.0% 36.2% 33.7% 30.7% 29.6%
X R2 15.5% 20.8% 24.4% 28.0% 29.6% 32.3%
X X R2 12.6% 18.2% 20.6% 23.1% 24.5% 26.0%
X X X R2 12.5% 18.1% 20.6% 23.1% 24.5% 26.1%
X X X X R2 10.6% 15.0% 18.0% 20.6% 22.0% 23.5%
X X X X X R2 23.1% 23.1% 22.4% 21.8% 21.8% 21.3%
X X X X X X R2 23.3% 23.4% 22.8% 22.3% 22.3% 21.9%
X X X X X X X R2 11.6% 14.0% 14.0% 15.1% 14.9% 15.4%
R2 for PCEs for Payments (Full90, untrimmed, evaluation database)

38
Hospital Inpatient
Resources Included
Hospital Part B
Resources Included
Post Acute Part B
Resources Included
Post Acute
Outpatient Resources Included
Post Acute DME
Resources Included
Post Acute Home Health
Resources Included
Post Acute SNF
Resources Included
Post Acute
Hospice Resources Included
Post Acute
Readmission Resources Included
Total Cases and R2
Percent
Episode Window
15
Episode Window
30
Episode Window
45
Episode Window
60
Episode Window
75
Episode Window
90
Cases 425,728 425,724 425,727 425,726 425,726 425,727
X R2 0.8% 0.8% 0.8% 0.8% 0.8% 0.8%
X R2 1.3% 1.3% 1.3% 1.3% 1.3% 1.2%
X X R2 1.2% 1.2% 1.2% 1.2% 1.2% 1.1%
X X X R2 1.4% 1.8% 2.1% 2.4% 2.9% 3.1%
X X X X R2 2.3% 3.6% 4.8% 6.2% 7.9% 9.1%
X X X X X R2 2.3% 3.7% 5.0% 6.5% 8.2% 9.5%
X X X X X X R2 2.2% 3.5% 4.8% 6.2% 7.9% 9.2%
X X X X X X X R2 2.3% 3.4% 4.4% 5.2% 6.3% 6.9%
X X X X X X X X R2 2.3% 3.6% 4.6% 5.4% 6.5% 7.3%
X X X X X X X X X R2 2.3% 3.6% 4.4% 5.4% 6.3% 7.0%
X R2 12.4% 17.1% 20.3% 23.4% 25.2% 27.5%
X X R2 9.6% 14.5% 16.7% 19.0% 20.4% 21.7%
X X X R2 9.7% 14.7% 17.0% 19.3% 20.7% 22.1%
X X X X R2 4.5% 9.0% 12.4% 15.3% 17.1% 18.8%
X X X X X R2 3.3% 4.5% 5.4% 6.2% 7.2% 8.1%
X X X X X X R2 3.5% 4.8% 5.7% 6.6% 7.6% 8.5%
X X X X X X X R2 2.3% 3.7% 4.6% 5.7% 6.3% 7.2%
R2 for ACRGs for Payments (Full90, untrimmed, evaluation database)

39
Hospital Inpatient
Resources Included
Hospital Part B
Resources Included
Post Acute Part B
Resources Included
Post Acute
Outpatient Resources Included
Post Acute DME
Resources Included
Post Acute Home Health
Resources Included
Post Acute SNF
Resources Included
Post Acute
Hospice Resources Included
Post Acute
Readmission Resources Included
Total Cases and R2
Percent
Episode Window
15
Episode Window
30
Episode Window
45
Episode Window
60
Episode Window
75
Episode Window
90 Cases 425,728 425,724 425,727 425,726 425,726 425,727
X R2 65.6% 67.6% 67.5% 66.1% 66.2% 65.6%
X R2 11.3% 11.3% 11.1% 11.5% 11.3% 11.3%
X X R2 59.6% 60.7% 60.8% 60.1% 59.9% 59.5%
X X X R2 58.2% 59.0% 57.6% 55.5% 53.9% 51.9%
X X X X R2 57.4% 57.3% 55.0% 52.1% 49.7% 47.1%
X X X X X R2 57.3% 57.2% 54.7% 51.8% 49.3% 46.6%
X X X X X X R2 56.6% 56.0% 53.6% 50.7% 47.9% 45.2%
X X X X X X X R2 53.6% 48.0% 42.6% 38.6% 35.9% 33.3%
X X X X X X X X R2 53.5% 47.9% 42.6% 38.5% 35.8% 33.2%
X X X X X X X X X R2 46.7% 39.2% 32.9% 29.8% 26.3% 24.7%
X R2 3.7% 4.9% 5.8% 6.7% 7.2% 7.7%
X X R2 3.5% 4.9% 5.4% 6.1% 6.4% 6.6%
X X X R2 3.4% 4.8% 5.4% 6.1% 6.5% 6.7%
X X X X R2 5.8% 6.6% 6.8% 7.2% 7.2% 7.3%
X X X X X R2 19.5% 18.7% 17.5% 16.4% 15.8% 14.8%
X X X X X X R2 19.7% 18.9% 17.7% 16.7% 16.1% 15.2%
X X X X X X X R2 9.1% 10.4% 10.1% 10.4% 9.9% 9.8%
R2 for MS-DRGs for Payments (Full90, untrimmed, evaluation database)