Embed Size (px)
Citation preview

67
The restaurant industry market is one of the fast-est-growing markets in the world. This market is glob-ally projected to reach a compound annual growth rate (CAGR) of 4.5% by the year 2023 (MarketResearch 2019; Wttc 2019b). The current size of the international restaurant market is estimated at 3 trillion US Dollars (Statista 2019). The performance of the restaurant sector in Europe is forecasted to develop with annual CAGR of 3.8% and a gross sales value of 620.3 billion US dollars by the end of 2019 (MarketResearch 2019). According to the Association of Hotels, Restaurants and Cafes and similar establishments (HOTREC) in Europe, more than 1.5 million restaurants and coffee houses are located in Europe, of which nine out of ten are micro-enterprises employing less than ten em-ployees. Micro, small and medium-sized enterprises
(SMEs) in the hospitality industry alone represent 4.7% of the total employment in the European Union (Hotrec 2019). The restaurant industry in Slovenia is
Marko Kukanja, Tanja Planinc
Abstract
The main goal of this study is to investigate whether higher (cost-effective) operational efficiency in restau-rants can be achieved without lowering the perceived level of service quality. This study also investigates the importance of restaurants’ size on operational efficiency and on the perceived level of service quality. We present the methodological procedures used to investigate the relationships among restaurants’ operational efficiency, size, and service quality after presenting the conceptualization of the cost-effective service excel-lence (CESE) research construct. The restaurants’ efficiency was assessed using Data Envelopment Analyses and the DINESERV tool was implemented to analyse guests’ perceptions of service quality. Guests of low- and high-efficient restaurants perceive service quality based on the same quality dimensions. Based on the struc-tural equation modelling, it is evident that CESE can be achieved in the restaurant industry. The restaurant size has proven to influence restaurants’ operational efficiency and guests’ quality perceptions.
Key Words: operational efficiency, service quality, restaurants, SMEs.
JEL Classification: L15, L25, L83.
INTRODUCTION
Marko Kukanja, PhDAssistant professorFaculty of Tourism Studies – Turistica University of PrimorskaE-mail: [email protected]
Tanja Planinc, Teaching assistantFaculty of Tourism Studies – Turistica University of PrimorskaE-mail: [email protected]
South East European Journal of Economics and BusinessVolume 14 (2) 2019, 67-81
DOI: 10.2478/jeb-2019-0014
Copyright © 2019 by the School of Economics and Business Sarajevo
Cost-EffECtivE sErviCE ExCEllEnCE: Exploring thE rElationships among rEstaurants’
opErational EffiCiEnCy, sizE and sErviCE Quality

Cost-Effective Service Excellence: Exploring the Relationships Among Restaurants’ Operational Efficiency, Size and Service Quality
68 South East European Journal of Economics and Business, Volume 14 (2) 2019
an important economic sector. Together with tourism, the restaurant industry contributes almost 12% to the gross domestic product (GDP) and employs almost 13% of the working population in the country (Ajpes 2019; Wttc 2019a).
The global restaurant industry market is driven by quick changes in customers’ preferences and their on-going sense of exploration of new offers. Restaurant managers must be constantly innovating and offer-ing high-quality services to satisfy their guests’ quality expectations and gain a competitive advantage (Liu and Tse 2018). Moreover, guests are becoming more demanding in terms of healthy food (e.g., low-fat, gluten-free, organic and locally produced food, etc.) and try to get the best value for their money (Lai et al. 2018).
Restaurant managers must, therefore, constantly analyse guests’ quality expectations and perceptions in order to deliver the expected quality offerings. Guests will be satisfied if the level of services pro-vided will fulfil or exceed their quality expectations (Parasuraman, Zeithaml, and Berry 1988). Various tools for evaluating service quality have been developed in the scientific literature. Parasuraman, Zeithaml, and Berry introduced the very first conceptual model of service quality (also referred to as the gap model) in 1988 and developed the SERVQUAL instrument, a tool for measuring customers’ quality perceptions and expectations. Later, several modifications of the ge-neric SERVQUAL instrument were developed to bet-ter suit the specifics of the hospitality industry, such as DINESERV for restaurants (Stevens, Knutson, and Patton 1995), TANGSERV for measuring tangible quali-ty (Raajpoot 2002), LODGSERV for measuring quality in the lodging sector (Knutson et al. 1990), etc. Scholars have also proposed alternative models for restaurant quality measurement, such as a marketing-oriented (7P) quality model (Kukanja, Gomezelj Omerzel, and Kodrič 2017) and a quality model combining the im-portance-performance analysis (IPA) and the quality function deployment (QFD) method (Cheng, Tsai, and Lin 2015). According to Liu and Tse (2018), although alternative models have been proposed, DINESERV remains the most popular and frequently used diag-nostic tool for service quality evaluation in the res-taurant industry. Additionally, besides the possibility of using the presented (quantitative) measurement techniques, restaurant managers can also monitor the level of guests’ quality perceptions by using simple (qualitative) approaches, such as observations, direct communication with guests, by following guests’ re-views and comments, etc.
Delivering high-quality services is important, as that influences guests’ satisfaction and loyalty
(Kukanja, Gomezelj Omerzel, and Kodrič 2017) and has a significant, direct impact on restaurants’ operational profitability (Kim, Li, and Brymer 2016; Mun and Jang 2018). Therefore, aside from providing high-quality services, managers must also ensure that all business operations are performed cost-efficiently and that the expected level of profitability is achieved. As neither too-high nor too-low quality will bring the best eco-nomic results, managers must constantly optimize their production processes to deliver the expected level of quality at optimal (low) production costs. Wirtz and Zeithaml (2017) referred to this practice as cost-effective service excellence (CESE). According to those authors, CESE should be the strategic orientation of all service businesses that want to prosper in the highly competitive business environment.
Managers can not only monitor service qual-ity relatively easily in today’ business environment by combining different (qualitative and quantitative) techniques, but they can also audit their restaurants’ operational profitability (sales revenues) by using a point of sales system (POS). However, controlling a restaurant’s overall efficiency performance is much more complex. Managers have traditionally used sim-ple ratio analysis techniques for efficiency analysis. Although useful for specific intrafirm analysis, differ-ent ratio indicators (e.g., food cost percentage, inven-tory turnover, average revenue per seat, etc.) are lim-ited by the possibility of analysing several operational variables simultaneously. Holistic econometric tech-niques have been developed for this purpose. One of the most commonly used techniques for restaurant industry analyses is the Data Envelopment Analyses (DEA) (Fang and Hsu 2014). DEA proved to be a reli-able tool for efficiency and benchmarking analyses in the restaurant sector (Mhlanga 2018). DEA’s major dis-advantage is that it is not useful for simple daily analy-ses (Reynolds and Biel 2007). Therefore, if managers can relatively easily combine different techniques to monitor their restaurants’ quality and financial perfor-mance, operational efficiency analysis using DEA most often demands an academic evaluation.
Previous research has confirmed the positive sta-tistical correlation between service quality and op-erational profitability in several studies (Demydyuk et al. 2015; Kim, Li, and Brymer 2016; Mun and Jang 2018), as well as the positive statistical correlation between restaurants’ operational efficiency and op-erational profitability (Alberca and Parte 2018; Ben Aissa and Goaied 2016; Mun and Jang 2015). It is evi-dent that high-quality positively influences restau-rants’ operational profitability; higher operational ef-ficiency also leads to higher operational profitability. Although there is a lack of academic evaluation, we

Cost-Effective Service Excellence: Exploring the Relationships Among Restaurants’ Operational Efficiency, Size and Service Quality
69South East European Journal of Economics and Business, Volume 14 (2) 2019
might assume that, consequently, restaurants that of-fer higher quality also perform more efficiently. That is, in order to satisfy their guests’ high-quality expec-tations and gain profit, managers must organize their production process in both the most quality-oriented and the most efficient ways. It can thus be suggested that successful restaurant managers have adjusted their operational performance to satisfy their guests’ quality expectations in the most efficient way. Based on this assumption, we formulated our first research question (RQ1): Are more efficient restaurants also de-livering higher service quality?
We also tested if guests’ quality perceptions are influenced by the size of the SME restaurants (meas-ured as the number of chairs and square meters). No previous study has analysed the importance of res-taurant size for guests’ overall quality assessment, to our knowledge. The vast majority of restaurants are classified as SMEs (Ajpes 2019), and no official data-base exists regarding restaurants’ physical characteris-tics, so we wanted to investigate if a correlation exists between restaurant size and guests’ quality percep-tions. Accordingly, we formulated our second research question (RQ2): Does restaurant size have a statisti-cally significant influence on guests’ service-quality perceptions?
Answering RQ1 and RQ2 demands a mixed meth-odological approach (Arora 2012). After the literature review, we analysed restaurant firms’ financial reports (secondary data analysis) to access restaurants’ opera-tional efficiency using DEA. Next, we performed field research to gather data about guests’ service quality perceptions (DINESERV) and restaurant size (primary data collection). Finally, we performed exploratory factor analyses (EFA) and confirmatory factor analyses (CFA) for high- and low-efficient groups of restaurants. We used structural equation modelling (SEM) to inves-tigate the relationships between different groups of variables: guests’ quality perceptions, restaurant size, and operational efficiency.
1 LITERATURE REVIEW1.1 Service Quality MeasurementAccording to the service quality model developed by Parasuraman, Zeithaml, and Berry (1985, 1988), five gaps – knowledge, standards, delivery, communica-tion, and service – are essential for delivering service quality. Those authors (Parasuraman, Zeithaml, and Berry) also developed the SERVQUAL instrument that measures the fifth gap between guests’ quality ex-pectations and perceptions. A provider must meet or exceed their quests’ quality expectations (the positive
gap) to deliver quality services. Although service qual-ity is a highly subjective phenomenon, the SERVQUAL instrument comprises 31 quality items that capture the essential characteristics of service quality. These 31 quality items are logically merged into five quality di-mensions – Reliability, Assurance, Tangibles, Empathy, and Responsiveness. Tangibles measure the quality of the tangible, physical environment (also referred to as the servicescape), while the other four dimensions in-dicate different quality aspects of the service staff (the functional aspect of service quality).
SERVQUAL was developed as a generic instru-ment for different service industries. Therefore, sev-eral theoretical attempts have been made to adapt it to the specifics of the hospitality industry. For exam-ple, Stevens, Knutson, and Patton (1995) developed a modified version of the SERVQUAL instrument, named DINESERV, to measure service quality in restaurants; Raajpot (2002) introduced the TANGSERV scale for measuring tangible quality in the foodservice indus-try; Lin, Chan, and Tsai (2009) introduced SERVIMPERF, which combines the quality gap and the importance-performance analysis; and Eid and Abdelkaber (2017) developed MSQ, a modified SERVQUAL instrument for measuring Muslim service quality perceptions. Scholars have also proposed alternative quality mod-els. For example, Chin and Tsai (2013) developed a new quality model for luxurious restaurants in international hotel chains; Chen, Cheng, and Hsu (2015) introduced the GRSERV scale, a tool for measuring consumer per-ceptions of service quality in green restaurants; Saeida et al. (2015) proposed a fuzzy approach to service quality diagnosis; while Kukanja, Gomezelj Omerzel, and Kodrič (2017) developed a marketing-oriented model for restaurant quality evaluation.
According to Ali et al. (2017) and Lee and Cheng (2018), none of the proposed alternative models has yet been subjected to sufficient academic evalu-ation. Moreover, all new models are based on the concept of service quality gaps, as first suggested by Parasuraman, Zeithaml, and Berry (1988). Therefore, Liu and Tse (2018) have stated that the generic SERVQUAL instrument (with all its modifications) re-mains the predominant diagnostic tool for service quality evaluation in the hospitality sector.
1.2 The DINESERV tool
The DINESERV tool includes 29 quality items that are captured into five quality dimensions of the generic SERVQUAL instrument. Since its introduction in the mid-nineties, DINESERV has been used in several res-taurant industry studies.

Cost-Effective Service Excellence: Exploring the Relationships Among Restaurants’ Operational Efficiency, Size and Service Quality
70 South East European Journal of Economics and Business, Volume 14 (2) 2019
Knutson, Stevens, and Patton (1996) reported in one of their first empirical studies that Reliability was the most important restaurant quality dimension. Johns and Tyas (1996) later used a modified version of the DINESERV instrument to measure a contracted catering service’s quality performance. The authors did not confirm Knutson, Stevens, and Patton’s (1996) result, as other factors related to food and staff were found to be more important.
According to Sweeney, Armstrong, and Johnson (2016), interest in service quality management has increased in the last 20 years (since 2000). Several authors have analysed restaurant service quality us-ing DINESERV. Fu and Parks (2001) used DINESERV to investigate restaurant loyalty among elderly cus-tomers. The authors found that individual attention and friendly service were the most significant quality factors for this specific segment of guests. Similarly, Kim, McCahon, and Miller (2003) used DINESERV to validate service quality in Korean casual-dining res-taurants. The authors reported that Tangibles and Responsiveness significantly influenced Korean din-ers’ quality perceptions. Marković, Raspor, and Šegarić (2010) also used a modified version of DINESERV to analyse service quality in Croatian restaurants. The authors found that guests mainly assessed service quality based on the physical environment’s quality, the service outcome, and the process of service de-livery. Cao and Kim (2015) also reported differences in quality perceptions when they utilized a modified version of DINESERV to analyse service quality in dif-ferently structured fast-food restaurants belonging to the same fast-food chain. The authors found that guests’ perceptions of service quality varied signifi-cantly according to the implemented management form (franchising or licensing). Kuo, Chen, and Cheng’s (2018) study probably offers the most distinctive proof that differences also exist between the first-time buyers and customers revisiting the same restaurant units. Djekic et al. (2016) adopted a broader perspec-tive when they confirmed that guests’ perceptions of restaurant service quality also vary among different European cities.
Together, these studies indicate that service qual-ity cannot be generalised, as different guest segments may have completely different expectations from dif-ferent restaurant providers in different geographic areas, such as food safety (Grunert 2005), food qual-ity (Kim, Ng, and Kim 2009), cleanliness (Chin and Tsai 2013), organic food offering (Poulston and Yiu 2011), etc. The presented findings may help us to un-derstand the complexity of restaurant service quality management.
Although some authors (Clemes et al. 2018) have criticized DINESERV for its incapacity to fully embrace the service quality construct and even more ade-quately measure guests’ overall quality experiences, it has proven to be a reliable diagnostic tool, accord-ing to Lai et al. (2018), for assessing restaurant service quality. Its major strength lies in that it helps us to un-derstand which critical quality items have contributed to guests’ dining experiences (Kuo, Chen, and Cheng 2018).
Although different factors have proved to influ-ence guests’ quality perceptions, based on the litera-ture review, we could not determine neither the cor-relation between operational efficiency and quality assessment nor the importance of restaurant size for guests’ service quality assessment.
1.3 Efficiency Measurement Using DEA
The term efficiency is most often defined in economics as the maximum output that can be produced with a given set of inputs (Dano 2012). Restaurant firms have traditionally utilized a simple ratio analysis to measure operational efficiency. Ratios enable a quick indication of a firm’s performance efficiency. Although several ra-tios can be calculated, the most often used efficiency ratios for a restaurant’s operational efficiency evalua-tion are asset turnover ratio, day’s sales in inventory, inventory turnover ratio, and revenue (sales) per em-ployee (Hayes and Miller 2010). Despite its practicality, this approach is limited because it includes only two (static) operational variables.
Based on the pioneering work of Charnes and Cooper on modern econometric analyses and DEA, operational efficiency is broadly defined as “the effec-tive use of internal resources to achieve operational goals” (Planinc, Kukanja, and Planinc 2018, p. 33). DEA is a nonparametric method that simultaneously com-bines different operational variables for efficiency evaluation. Operational efficiency is evaluated based on the concept of the production possibility frontier. The production possibility frontier represents the maximum output attainable from each input level included in the research sample (Alberca and Parte 2018). DEA seeks optimization contingent on a unit’s performance in relation to the efficiency performance of all decision-making units (DMUs) included in the sample. The optimal DMUs lie on the production ef-ficiency frontier. DMUs that do not lie on the frontier can be considered technically inefficient (Reynolds 2003). The inefficient DMUs can produce the same level of output(s) with less input(s) and/or increase the

Cost-Effective Service Excellence: Exploring the Relationships Among Restaurants’ Operational Efficiency, Size and Service Quality
71South East European Journal of Economics and Business, Volume 14 (2) 2019
level of output(s) without requiring more input(s) to improve their operational efficiency.
According to Emrouznejad and Yang (2018), DEA was subjected to academic evaluation and proved to be a reliable econometric tool. DEA is very popu-lar in service industries studies, as it allows the enclo-sure of different operational variables into the model. Consequently, several authors have used DEA in res-taurant industry studies, such as Alberca and Parte (2018), Mhlanga (2018), Reynolds and Thompson (2007), Fang and Hsu (2014), and many others.
Although the selections of operational variables for performing DEA is preselected, Reynolds and Thompson (2007) recommended the following groups of variables for the restaurant industry evaluation: fi-nancial, physical, and combined, which include both financial and physical variables. Regarding outputs, authors (Reynolds and Thompson) recommended the following operational variables: operational profit, operational revenue, retention equity, and restaurant guests’ or employees’ satisfaction.
2 RESEARCH METHOD2.1 Research Process and Samples DescriptionThe first sample (A) comprised individually operated restaurant micro, small and medium-sized enterprises (SMEs) whose only source of operational revenues was the restaurant business. Restaurants were selected from the official business register (Ajpes 2019) using the simple random sampling technique in IBM SPSS Statistics – version 24.0. From a total of 3.717 restau-rant SMEs listed in the register, 371 restaurants (10%) located throughout the country were selected. The field research was performed by six trained interview-ers from April to December 2018. Before including the restaurants into the sample, researchers obtained permission from the managers. Managers approved interviews with guests and confirmed that restaurant SMEs had no other operational incomes besides the restaurant business. Managers were also asked to pro-vide information about their restaurant’s seating ca-pacity and actual size. The next restaurant on the list was included in the sample if a manager refused to participate in the study (53 managers refused to par-ticipate) or the restaurant did not match the research criteria (117 restaurant SMEs had different sources of operational income).
The second sample (B) comprised 1.113 guests (three guests each per restaurant unit). Guests who had dined at the restaurant were asked to kindly par-ticipate in the study. Most often the research took
place at the restaurant lobby or the entrance area. Our focus was solely on the service provided to the guests; therefore, we employed the Dineserv.per model, since it measures only the performance and not a gap be-tween expectations and perceptions.
Researchers helped guests to answer the ques-tionnaire by providing some additional explanations when needed. Some guests refused to participate in the study for a variety of reasons. In this case, the next customer was asked to fill in the questionnaire.
2.2 Operational Efficiency Analysis
Using DEAP software – version 3.2, Data Envelopment Analyses (DEA) were employed for efficiency analysis. Operational financial data, which were obtained from SMEs’ official financial reports (the latter are in public domain) were used as variables to perform DEA. As suggested by Barros and Santos (2006), and Planinc, Kukanja, and Planinc (2018), the following groups of variables were included in the model – costs of goods sold, material and services, labour costs, and write-downs (as inputs), and net sales revenues (as output). First, we ensured that all inputs were statisti-cally correlated (p<0.01) to the output (Reynolds and Thompson 2007). Next, as suggested by Alberca and Parte (2018) we employed the input-oriented DEA model. This model calculates the maximum propor-tional reduction in inputs while holding the level of output(s) constant. The proportional efficiency meas-ures were used to calculate the efficiency scores based on the basic Charnes, Cooper, and Rhodes DEA model (the CCR-DEA model). The efficiency score reflects a decision-making unit’s (DMU’s) proportional distance from the efficiency frontier. The CCR model also pre-sumes constant returns to scale, meaning, that an in-crease in inputs results in a proportional increase in output(s) (Alberca and Parte 2018).
Research results indicate an average efficiency score of 83%. This means that, on average, restaurants were 17% away from the efficiency production fron-tier. Results also reveal that 49 restaurants were fully (100%) efficient, 167 restaurants were below, and 155 restaurants were above the average (83%) efficiency score.
As already mentioned, managers provided the in-formation on their restaurants’ size – mean values for the low-efficient group were 218.35m2 and 114.13 seats, and 279.86m2 and 151.63 seats for the high-ef-ficient group.

Cost-Effective Service Excellence: Exploring the Relationships Among Restaurants’ Operational Efficiency, Size and Service Quality
72 South East European Journal of Economics and Business, Volume 14 (2) 2019
2.3 Analysis of Service QualityThe data were analysed with the statistical program SPSS 24.0 software. Descriptive statistical analysis was calculated to analyse guests’ demographic character-istics for both groups of restaurants – the low-efficient (DEA<83) and the high-efficient (DEA≥83) ones. The first (low-efficient) group was composed of 167 res-taurants and 501 guests, while the second (high-ef-ficient) group was composed of 204 restaurants and 612 guests.
Table 1 shows that, in both cases, the majority of respondents were male, aged between 36 and 45 years of age, who had obtained a college or university degree.
Next, quality perceptions for both groups of restau-rants were measured using DINESERV. Guests percep-tions were measured on a seven-point Likert-type or-dinal scale, ranging from seven (strongly agree) to one (strongly disagree). Arithmetic means for all quality items were calculated. Results reveal that quality was evaluated relatively highly for both groups of restau-rants. The mean value for the low-efficient restaurants was 5.65, and 5.83 for the high-efficient restaurants. Table 2 presents guests’ quality perceptions.
The study’s next section describes two exploratory factor analyses (EFA) that were performed to assess the factor structure of quality perceptions in both res-taurant groups.
EFA1 was performed for the low-efficient restau-rant group. We could not confirm a normal distribution of the data, so we used the Principal Axis Factoring method to test the suitability of the data for perform-ing EFA, the Kaiser-Meyer-Olkin (KMO=0.887) test for
Sampling Adequacy, and the Bartlett’s test of spheric-ity (c2=2804.537). The results of both tests indicated that all 29 variables were suitable for performing EFA. In the next phase, 17 variables with too-low commu-nalities (<0.50) were extracted from EFA, and 12 vari-ables were retained (see Table 3). After a few success-ful rotations of the model, we decided to retain factors with eigenvalue ≥ 1 and factors containing more than three items. The suitability of the data for enclosure in the rotated (final) model was also confirmed by the values of Bartlett’s test (c2=1879.761) and KMO mea-sure (0.889). We confirmed the internal consistency of the data with Cronbach’s α coefficient (α=0.77). Based on the results Table 3 presents, it is clearly evident that 12 quality items merged into three factors groups’ best explain guests’ quality perceptions.
Next, EFA was performed for the high-efficient res-taurant group (EFA 2). After testing the normality dis-tribution of data in SPSS, the same method was used as in EFA1. The values of KMO (0.813) and Bartlett’s test (c2=2784.135) confirmed that all 29 variables were suitable for EFA. Variables with too low communali-ties were removed from the model in the process of elimination. Using the same criteria as in EFA1, factors with eigenvalue ≥ 1 and factors containing more than three items were retained in the final model. The suit-ability of the data was verified by calculating the mea-sures of Bartlett’s test (c2=1774.271), KMO (0.829), and Cronbach’s α (0.78). Interestingly, the very same qual-ity items as in EFA1 best explain guests’ quality per-ceptions in high-efficient restaurants (EFA2). Table 3 presents the rotated factor solutions (EFA1 and EFA2).
Table 1: Demographic Data
Demographic dataPercentage
DEA<83 DEA≥83
GenderMale 50.9 52.9
Female 49.1 47.1
Level of education
Primary school 1.2 0.8
Secondary school 42.8 44.8
College and university 45.9 46.4
MSc or PhD 10.1 8.0
Age
16-25 19.8 22.9
26-35 18.3 20.5
36-45 27.6 24.2
46-55 21.4 19.9
56-65 9.3 12.1
66 and above 3.6 0.4
Source: own

Cost-Effective Service Excellence: Exploring the Relationships Among Restaurants’ Operational Efficiency, Size and Service Quality
73South East European Journal of Economics and Business, Volume 14 (2) 2019
Table 2: Guests’ Perceptions of Quality (DINESERV) – Below Average and Above Average Efficient Restaurants
Quality items DEA<83 DEA≥83
The restaurant… Mean St. Deviation Mean St. Deviation
1 – has visually attractive parking areas and building exteriors 6.30 1.02 6.41 1.078
2 – has visually attractive dining area 5.37 0.966 5.76 0.904
3 – has staff members who are clean, neat, and appropriately dressed
5.83 0.760 5.85 0.720
4 – has décor in keeping with its image and price range 5.78 0.783 5.81 0.788
5 – has a menu that is easily readable 5.94 0.695 6.02 0.693
6 – has a visually attractive menu that reflects the restaurant’s image
5.54 0.779 5.61 0.751
7 – has a dining area that is comfortable and easy to move around in
5.67 0.889 5.61 0.881
8 – has rest rooms are thoroughly clean 5.64 0.836 5.97 0.949
9 – has dining areas are thoroughly clean 5.49 0.768 5.82 0.788
10 – has comfortable seats it the dining room 5.72 0.992 5.78 0.979
11 – serves you in the time promised 5.51 0.722 5.62 0.854
12 – quickly corrects anything that is wrong 5.49 0.750 5.54 0.806
13 – is dependable and consistent 5.53 0.622 5.69 0.680
14 – provides an accurate guest check 6.03 0.427 6.11 0.556
15 – serves your food exactly as you ordered it 5.39 0.627 5.75 0.675
16 – during busy times has employees shift to help each other maintain speed and quality of service
5.68 1.123 5.83 1.007
17 – provides prompt and quick service 5.15 0.786 5.79 0.825
18 – gives extra effort to handle your special requests 5.37 0.891 5.37 0.829
19 – has employees that can answer your questions completely 5.63 0.859 5.89 0.837
20 – makes you feel comfortable and confident in your dealings with them
5.43 0.712 5.49 0.747
21 – has personnel who are able and willing to give you information about menu items, ingredients and methods of preparation
5.56 0.875 5.93 0.777
22 – makes you feel personally safe 5.61 0.801 6.03 0.756
23 – has personnel who seem well-trained, competent, and experienced
5.86 0.852 5.97 0.759
24 – seems to give employees support so they can do their jobs well
5.89 0.808 5.87 0.761
25 – has employees who are sensitive to your individual needs and wants, rather than always relying on policies and procedures
4.99 1.032 5.85 0.893
26 – makes you feel special 5.89 0.990 5.83 0.980
27 – anticipates your needs and wants 6.51 1.013 6.02 0.950
28 – has employees who are sympathetic and reassuring is some-thing is wrong
5.71 0.790 6.11 0.850
29 – seems to have the customers’ best interest at heart 5.31 0.744 5.64 0.840
Overall mean value(s) 5.65 5.83Source: own

Cost-Effective Service Excellence: Exploring the Relationships Among Restaurants’ Operational Efficiency, Size and Service Quality
74 South East European Journal of Economics and Business, Volume 14 (2) 2019
As the preceding table shows, the percentage of the total explained variances is 61.46% for EFA1 and
53.76% for EFA2. All three-factor groups slightly bet-ter explain guests’ quality perceptions in low-efficient restaurants.
2.4 Analysis of Correlations among Restaurant Size, Service-quality, and Operational Efficiency
We first performed a correlation analysis between the identified 12 quality items and the two physical varia-bles – PH1 (number of chairs) and PH2 (square meters) to answer RQ2. The results of Spearman’s correlation test (p) reveal that statistically significant correlations exist between all pairs of variables. Next, Pearson’s correlation coefficient (r) was calculated to test the statistical relationship between the physical variables and the operational efficiency scores. The results re-veal a lower level of statistical correlation for the low-efficient restaurant group (r=0.180; sig=0.004) and a higher level of statistical correlation for the high-effi-cient group (r=0.215; sig=0.003).
We first performed two confirmatory factor analy-ses (CFA) using the SPSS software 24.0 and its plug AMOS to test the influence of restaurant size on qual-ity factors formulated in the exploratory analyses (EFA1 and EFA2). CFA1 was performed on the low-efficient restaurant group (EFA1); CFA2 included the
Table 4: Validity, Reliability, and Internal Consistency Indicators
Constructs and variables
CFA1 DEA<83 CFA2 DEA≥83λ CR AVE α λ CR AVE α
Tangibles7 .716
.941 .696 .895
.703
.939 .698 .8988 .907 .8969 .937 .901
10 .755 .743Assurance11 .706
.902 .523 .842
.699
.897 .533 .84712 .788 .70413 .835 .80314 .643 .67415 .631 .635Empathy27 .844
.874 .576 .771.863
.886 .563 .73928 .636 .68529 .782 .799PhysicalPH1 .924
.918 .753 .618.854
.897 .783 .611PH2 .808 .798
Source: own
Table 3: Rotated Factor Solutions – EFA1 and EFA2
Quality items EFA1 (DEA<83) EFA2 (DEA≥83)
Tangibles
7 .715 .659
8 .805 .831
9 .949 .905
10 .779 .689
Total variance % 11.4 9.98
Assurance
11 .638 .654
12 .863 .799
13 .503 .420
14 .561 .569
15 .596 .531
Total variance % 27.8 23.3
Empathy
27 .791 .793
28 .839 .789
29 .632 .625
Total variance % 22.26 20.48
Source: own

Cost-Effective Service Excellence: Exploring the Relationships Among Restaurants’ Operational Efficiency, Size and Service Quality
75South East European Journal of Economics and Business, Volume 14 (2) 2019
Figure 1: SEM 1 – low-efficient restaurants
Source: own
Figure 2: SEM 2 – high-efficient restaurants
Source: own
high-efficient restaurant group (EFA2). Regarding the EFAs, the maximum likelihood method was used to perform the CFAs, as it assumes the multivariate nor-mality of observed variables. The KMO and Bartlett’s tests were applied to measure the sampling adequacy (Munro 2005). In the last phase, structural equation modelling (SEM) was used to analyse the simultane-ous interactions between the latent and the manifest groups of variables in both restaurant groups.
All factor loadings were statistically significant in CFA1 and CFA2, indicating that the latent variables (Tangibles, Assurance, Empathy, and Physical) were significantly represented by 12 quality and two physi-cal indicators. The next phase calculated the meas-ures of convergent validity (AVE) and composite reli-ability (CR) of the constructs. Internal consistency was
evaluated with Cronbach’s α coefficient. Satisfactory measures (λ) were achieved in all cases, indicating that the measurement scales are valid, reliable, and inter-nally consistent. Table 4 presents the indicators of va-lidity, reliability, and internal consistency for both fac-tor groups.
Model fit indices were calculated next. The abso-lute and incremental indices exceed the recommend-ed values, showing that both models (CFA1 and CFA2) satisfactorily fit the data (see Table 5).
Two structural models (SEM1 = low-efficient res-taurants) and (SEM2 = high-efficient restaurants) were created based on CFA1 and CFA2. Table 5 shows that both models comprise four constructs and 14 ob-served variables. Figures 1 and 2 present the structural models.
Table 5: Model Fit Indices
Indicators Recommended value
CFA1 (DEA<83) CFA2 (DEA≥83)
CMIN / 107.98 105.38
Degrees of Freedom / 89 112
RMSEA < .05 or .08 .059 .061
NFI > .90 .909 .912
CFI > .90 .997 .998
TLI or NNFI > .90 .963 .958
PNFI > .60 .655 .635
Source: own
Cost-Effective Service Excellence: Exploring the Relationships Among Restaurants’ Operational Efficiency, Size and Service Quality
76 South East European Journal of Economics and Business, Volume 14 (2) 2019
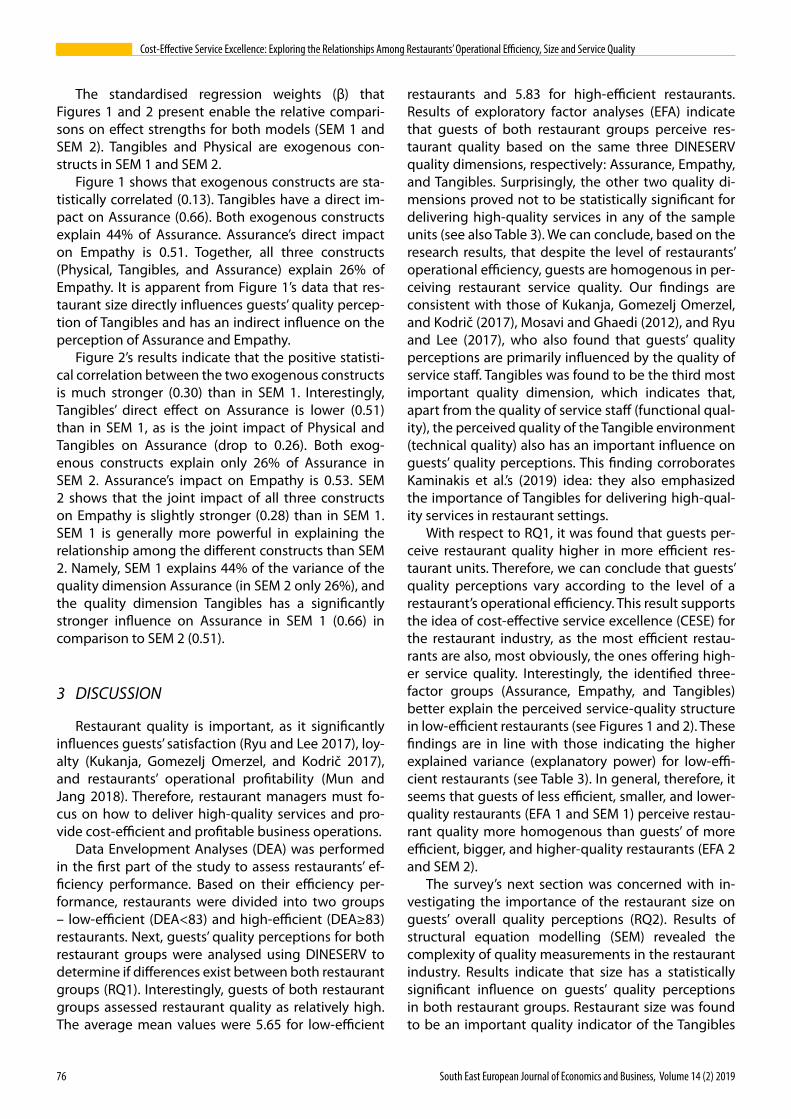
The standardised regression weights (β) that Figures 1 and 2 present enable the relative compari-sons on effect strengths for both models (SEM 1 and SEM 2). Tangibles and Physical are exogenous con-structs in SEM 1 and SEM 2.
Figure 1 shows that exogenous constructs are sta-tistically correlated (0.13). Tangibles have a direct im-pact on Assurance (0.66). Both exogenous constructs explain 44% of Assurance. Assurance’s direct impact on Empathy is 0.51. Together, all three constructs (Physical, Tangibles, and Assurance) explain 26% of Empathy. It is apparent from Figure 1’s data that res-taurant size directly influences guests’ quality percep-tion of Tangibles and has an indirect influence on the perception of Assurance and Empathy.
Figure 2’s results indicate that the positive statisti-cal correlation between the two exogenous constructs is much stronger (0.30) than in SEM 1. Interestingly, Tangibles’ direct effect on Assurance is lower (0.51) than in SEM 1, as is the joint impact of Physical and Tangibles on Assurance (drop to 0.26). Both exog-enous constructs explain only 26% of Assurance in SEM 2. Assurance’s impact on Empathy is 0.53. SEM 2 shows that the joint impact of all three constructs on Empathy is slightly stronger (0.28) than in SEM 1. SEM 1 is generally more powerful in explaining the relationship among the different constructs than SEM 2. Namely, SEM 1 explains 44% of the variance of the quality dimension Assurance (in SEM 2 only 26%), and the quality dimension Tangibles has a significantly stronger influence on Assurance in SEM 1 (0.66) in comparison to SEM 2 (0.51).
3 DISCUSSION
Restaurant quality is important, as it significantly influences guests’ satisfaction (Ryu and Lee 2017), loy-alty (Kukanja, Gomezelj Omerzel, and Kodrič 2017), and restaurants’ operational profitability (Mun and Jang 2018). Therefore, restaurant managers must fo-cus on how to deliver high-quality services and pro-vide cost-efficient and profitable business operations.
Data Envelopment Analyses (DEA) was performed in the first part of the study to assess restaurants’ ef-ficiency performance. Based on their efficiency per-formance, restaurants were divided into two groups – low-efficient (DEA<83) and high-efficient (DEA≥83) restaurants. Next, guests’ quality perceptions for both restaurant groups were analysed using DINESERV to determine if differences exist between both restaurant groups (RQ1). Interestingly, guests of both restaurant groups assessed restaurant quality as relatively high. The average mean values were 5.65 for low-efficient
restaurants and 5.83 for high-efficient restaurants. Results of exploratory factor analyses (EFA) indicate that guests of both restaurant groups perceive res-taurant quality based on the same three DINESERV quality dimensions, respectively: Assurance, Empathy, and Tangibles. Surprisingly, the other two quality di-mensions proved not to be statistically significant for delivering high-quality services in any of the sample units (see also Table 3). We can conclude, based on the research results, that despite the level of restaurants’ operational efficiency, guests are homogenous in per-ceiving restaurant service quality. Our findings are consistent with those of Kukanja, Gomezelj Omerzel, and Kodrič (2017), Mosavi and Ghaedi (2012), and Ryu and Lee (2017), who also found that guests’ quality perceptions are primarily influenced by the quality of service staff. Tangibles was found to be the third most important quality dimension, which indicates that, apart from the quality of service staff (functional qual-ity), the perceived quality of the Tangible environment (technical quality) also has an important influence on guests’ quality perceptions. This finding corroborates Kaminakis et al.’s (2019) idea: they also emphasized the importance of Tangibles for delivering high-qual-ity services in restaurant settings.
With respect to RQ1, it was found that guests per-ceive restaurant quality higher in more efficient res-taurant units. Therefore, we can conclude that guests’ quality perceptions vary according to the level of a restaurant’s operational efficiency. This result supports the idea of cost-effective service excellence (CESE) for the restaurant industry, as the most efficient restau-rants are also, most obviously, the ones offering high-er service quality. Interestingly, the identified three-factor groups (Assurance, Empathy, and Tangibles) better explain the perceived service-quality structure in low-efficient restaurants (see Figures 1 and 2). These findings are in line with those indicating the higher explained variance (explanatory power) for low-effi-cient restaurants (see Table 3). In general, therefore, it seems that guests of less efficient, smaller, and lower-quality restaurants (EFA 1 and SEM 1) perceive restau-rant quality more homogenous than guests’ of more efficient, bigger, and higher-quality restaurants (EFA 2 and SEM 2).
The survey’s next section was concerned with in-vestigating the importance of the restaurant size on guests’ overall quality perceptions (RQ2). Results of structural equation modelling (SEM) revealed the complexity of quality measurements in the restaurant industry. Results indicate that size has a statistically significant influence on guests’ quality perceptions in both restaurant groups. Restaurant size was found to be an important quality indicator of the Tangibles
Cost-Effective Service Excellence: Exploring the Relationships Among Restaurants’ Operational Efficiency, Size and Service Quality
77South East European Journal of Economics and Business, Volume 14 (2) 2019
quality dimension. As such, it has a direct influence on guests’ quality perceptions of Tangibles and indirect influence on their quality perceptions of Assurance and Empathy (see also Figures 1 and 2). Interestingly, Tangibles had a significantly stronger impact on over-all quality perceptions in low-efficient restaurants (0.66) in comparison to high-efficient restaurants (0.51). A possible explanation for this might be that managers of low-efficient restaurants manage poorly and/or employ unprofessional service staff. This con-sequently emphasizes the importance of the physi-cal environment; That is, compare the absence of the minimum requirements related to service staff pro-fessional competencies to the physical environment, which is subjected to minimum standards and mini-mum criteria on the national level (e.g., HACCP, res-taurants’ accessibility and safety layout, etc.). Another interesting finding is the influence of restaurant size on the Tangibles quality dimension. The latter is much higher (0.30) in high-efficient restaurants in com-parison to low-efficient restaurants (0.13). The high-efficient restaurants were found to be bigger in size than the low-efficient ones. Therefore, the relationship among size, service quality, and efficiency might also be related to better exploitation of physical resources (e.g., organisation of banquets, weddings, feasts, etc.) and the economies of scale in bigger and more effi-cient restaurant units.
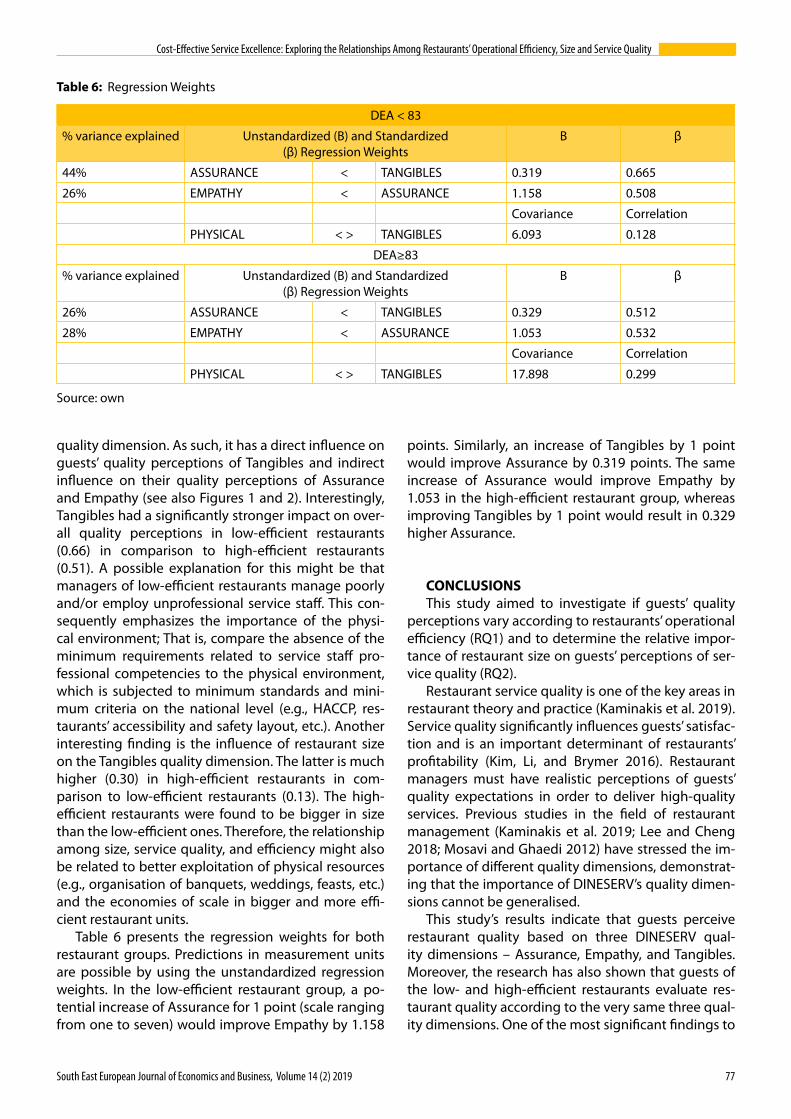
Table 6 presents the regression weights for both restaurant groups. Predictions in measurement units are possible by using the unstandardized regression weights. In the low-efficient restaurant group, a po-tential increase of Assurance for 1 point (scale ranging from one to seven) would improve Empathy by 1.158
points. Similarly, an increase of Tangibles by 1 point would improve Assurance by 0.319 points. The same increase of Assurance would improve Empathy by 1.053 in the high-efficient restaurant group, whereas improving Tangibles by 1 point would result in 0.329 higher Assurance.
CONCLUSIONSThis study aimed to investigate if guests’ quality
perceptions vary according to restaurants’ operational efficiency (RQ1) and to determine the relative impor-tance of restaurant size on guests’ perceptions of ser-vice quality (RQ2).
Restaurant service quality is one of the key areas in restaurant theory and practice (Kaminakis et al. 2019). Service quality significantly influences guests’ satisfac-tion and is an important determinant of restaurants’ profitability (Kim, Li, and Brymer 2016). Restaurant managers must have realistic perceptions of guests’ quality expectations in order to deliver high-quality services. Previous studies in the field of restaurant management (Kaminakis et al. 2019; Lee and Cheng 2018; Mosavi and Ghaedi 2012) have stressed the im-portance of different quality dimensions, demonstrat-ing that the importance of DINESERV’s quality dimen-sions cannot be generalised.
This study’s results indicate that guests perceive restaurant quality based on three DINESERV qual-ity dimensions – Assurance, Empathy, and Tangibles. Moreover, the research has also shown that guests of the low- and high-efficient restaurants evaluate res-taurant quality according to the very same three qual-ity dimensions. One of the most significant findings to
Table 6: Regression Weights
DEA < 83
% variance explained Unstandardized (B) and Standardized (β) Regression Weights
B β
44% ASSURANCE < TANGIBLES 0.319 0.665
26% EMPATHY < ASSURANCE 1.158 0.508
Covariance Correlation
PHYSICAL < > TANGIBLES 6.093 0.128
DEA≥83
% variance explained Unstandardized (B) and Standardized (β) Regression Weights
B β
26% ASSURANCE < TANGIBLES 0.329 0.512
28% EMPATHY < ASSURANCE 1.053 0.532
Covariance Correlation
PHYSICAL < > TANGIBLES 17.898 0.299
Source: own

Cost-Effective Service Excellence: Exploring the Relationships Among Restaurants’ Operational Efficiency, Size and Service Quality
78 South East European Journal of Economics and Business, Volume 14 (2) 2019
emerge from this study is that guests perceive restau-rant quality higher in the more efficient restaurants (RQ1). Our findings confirmed the theoretical assump-tions posed at the beginning of the study, suggesting that a correlation exists between guests’ quality per-ceptions and restaurants’ operational efficiency; that is, the most efficient restaurants were also the ones which, according to their guests’ quality perceptions, delivered higher-quality services. According to our knowledge, the empirical findings of this study are the very first to support the cost-effective service ex-cellence (CESE) idea (Wirtz and Zeithaml 2017) for the restaurant industry, as they clearly indicate that high-quality service can also be achieved through efficient (cost-effective) management of restaurant business operations.
This study’s second aim was to investigate the effect of restaurant size on guests’ quality percep-tions (RQ2). This study’s results show that restaurant size has a direct impact on guests’ perceptions of Tangibles, which consequently influence their per-ceptions of Assurance and Empathy. This impact is more powerful in smaller and less-efficient restau-rants (see Figure 1), where guests predominantly as-sess the quality of Assurance (service staff) based on the quality of the physical environment and Tangibles. This study’s empirical findings provide a new under-standing of the complexity of restaurant quality man-agement. Emphasizing or de-emphasizing one aspect of service quality (e.g., Tangibles) might influence guests’ perceptions of other quality dimensions, such as Empathy and Assurance. The relationship between the different quality dimensions is complex. This study makes a major contribution to research on restaurant quality and efficiency management by demonstrating that the key quality dimensions (Assurance, Empathy, and Tangibles) are the same in low- and high-efficient restaurants.
Accordingly, restaurant quality should not be sim-plified and/or reduced to the importance of just one (the most important) quality dimension (as in our case of Assurance). Restaurant quality management must be in line with restaurant micro, small and medium-sized enterprises’ (SMEs’) strategic planning (Seo and Sharma 2018), as it also embraces other management functions, such as human resources (HR) management (Durrani and Rajagopal 2016), marketing manage-ment (Kukanja, Gomezelj Omerzel, and Kodrič 2017), revenue management (Mun and Jang 2018), image and physical environment (Han and Hyun 2017), and efficiency management.
This study’s empirical findings also provide a new understanding of restaurant quality and efficiency management. Based on our knowledge, this is the
first time that restaurants’ operational efficiency has been analysed in relation to the DINESERV tool. The evidence from this study suggests that service quality can also be achieved through cost-effective manage-ment. The generalisability of these results is subject to certain limitations. Further studies should analyse res-taurants’ financial success to determine if and how res-taurants’ operational profit and/or loss influence effi-ciency and quality performance. A further study could assess the long-term effects of different segments of guests on restaurants’ operational efficiency and qual-ity performance. Kuo, Chen, and Cheng (2018) sug-gested that the evaluation of quality perceptions of first-time buyers and revisiting guests should also be investigated. Large, randomised and controlled trials in different geographical areas and different restau-rant facilities could provide more definitive evidence. Future research should also include different qualita-tive research techniques (e.g., interviews, observa-tions, etc.). We believe that interviews with restaurant managers of low- and high-efficient restaurants would also provide deeper insights into quality and efficien-cy management practices.
This study’s findings have important implications for future practice. This study’s results prove that CESE can also be achieved in the restaurant industry. A well-defined (smart) optimization process can lead to higher operational efficiency and higher service qual-ity. Managers should implement a holistic approach to restaurant quality and efficiency management. Different operational performance indicators should be constantly monitored, as they are, most obviously, interrelated for achieving CESE.
REFERENCES
Ajpes. 2019. ‘FI-PO-Financial Data’. 2019. http://www.ajpes.si/fipo/prikaz.asp?xid=22LH4qw3HhZXE2cUwJjA3IsfiLPq2U/51pvTrfxFcNYwoH8TGxge+h2cSmb20MVd7IBy.
Alberca, Pilar, and Laura Parte. 2018. ‘Operational Efficiency Evaluation of Restaurant Firms’. International Journal of Contemporary Hospitality Management 30 (3): 1959–77. https://doi.org/10.1108/IJCHM-09-2016-0547.
Ali, Faizan, Kashif Hussain, Rupam Konar, and Hyeon-Mo Jeon. 2017. ‘The Effect of Technical and Functional Quality on Guests’ Perceived Hotel Service Quality and Satisfaction: A SEM-PLS Analysis’. Journal of Quality Assurance in Hospitality & Tourism 18 (3): 354–78. https://doi.org/10.1080/1528008X.2016.1230037.
Arora, Raj. 2012. ‘A Mixed Method Approach to Understanding the Role of Emotions and Sensual Delight in Dining Experience’. Journal of Consumer Marketing 29 (5): 333–43. https://doi.org/10.1108/07363761211247451.

Cost-Effective Service Excellence: Exploring the Relationships Among Restaurants’ Operational Efficiency, Size and Service Quality
79South East European Journal of Economics and Business, Volume 14 (2) 2019
Barros, Carlos Alberto Pestana, and Carla Almeida Santos. 2006. ‘The Measurement of Efficiency in Portuguese Hotels Using Data Envelopment Analysis’. Journal of Hospitality & Tourism Research 30 (3): 378–400. https://doi.org/10.1177/1096348006286798.
Ben Aissa, Sami, and Mohamed Goaied. 2016. ‘Determinants of Tunisian Hotel Profitability: The Role of Managerial Efficiency’. Tourism Management 52 (February): 478–87. https://doi.org/10.1016/j.tourman.2015.07.015.
Cao, Yang, and Kyungmi Kim. 2015. ‘How Do Customers Perceive Service Quality in Differently Structured Fast Food Restaurants?’ Journal of Hospitality Marketing & Management 24 (1): 99–117. https://doi.org/10.1080/19368623.2014.903817.
Chen, Cheng-Ta, Ching-Chan Cheng, and Fu-Sung Hsu. 2015. ‘GRSERV Scale: An Effective Tool for Measuring Consumer Perceptions of Service Quality in Green Restaurants’. Total Quality Management & Business Excellence 26 (3–4): 355–67. https://doi.org/10.1080/14783363.2013.832478.
Cheng, Ching-Chan, Ming-Chun Tsai, and Shu-Ping Lin. 2015. ‘Developing Strategies for Improving the Service Quality of Casual-Dining Restaurants: New Insights from Integrating IPGA and QFD Analysis’. Total Quality Management & Business Excellence 26 (3–4): 415–29. htt-ps://doi.org/10.1080/14783363.2013.839166.
Chin, Jiung-Bin, and Chih-Hsin Tsai. 2013. ‘Developing a Service Quality Evaluation Model for Luxurious Restaurants in International Hotel Chains’. Total Quality Management & Business Excellence 24 (9–10): 1160–73. https://doi.org/10.1080/14783363.2012.661132.
Clemes, Michael Daniel, Zurinawati Mohi, Xuedong Li, and Baiding Hu. 2018. ‘Synthesizing Moderate Upscale Restaurant Patrons’ Dining Experiences’. Asia Pacific Journal of Marketing and Logistics 30 (3): 627–51. https://doi.org/10.1108/APJML-06-2017-0115.
Dano, Sven. 2012. Industrial Production Models: A Theoretical Study. Wien: Springer Science & Business Media.
Demydyuk, G., H. A. Shawky, JI Van der Rest, and J. A. A. Adriaanse. 2015. ‘Key Operating Indicators to Lever Financial Performance of Publicly Traded Restaurant Companies: A Market’s Perspective from 2007-2011’. International Journal of Revenue Management 8 (2): 165–192. https://doi.org/10.1504/IJRM.2015.070006.
Djekic, Ilija, Kevin Kane, Nikola Tomic, Eleni Kalogianni, Ada Rocha, Lamprini Zamioudi, and Rita Pacheco. 2016. ‘Cross-Cultural Consumer Perceptions of Service Quality in Restaurants’. Nutrition & Food Science 46 (6): 827–43. https://doi.org/10.1108/NFS-04-2016-0052.
Durrani, Amir S., and Lakshman Rajagopal. 2016. ‘Restaurant Human Resource Managers’ Attitudes to-wards Workplace Diversity, Perceptions and Definition of Ethical Hiring’. International Journal of Hospitality
Management 53 (February): 145–51. https://doi.org/10.1016/j.ijhm.2015.10.009.
Eid, Riyad, and Ali Ahmed Abdelkader. 2017. ‘Muslim Service Quality Dimensions in the Tourism and Hospitality Industry: Construct Development and Measurement Validation’. Int. J. Islamic Marketing and Branding 2 (3): 215–31. https://doi.org/10.1504/IJIMB.2017.087983.
Emrouznejad, Ali, and Guo-liang Yang. 2018. ‘A Survey and Analysis of the First 40 Years of Scholarly Literature in DEA: 1978–2016’. Socio-Economic Planning Sciences 61: 4–8. https://doi.org/10.1016/j.seps.2017.01.008.
Fang, Chin-Yi, and Fu-Sung Hsu. 2014. ‘An Efficiency-Based Metafrontier Approach To Menu Analysis’. Journal of Hospitality & Tourism Research 38 (2): 199–221. https://doi.org/10.1177/1096348012451461.
Fu, Yao-Yi, and Sara C. Parks. 2001. ‘The Relationship between Restaurant Service Quality and Consumer Loyalty among the Elderly’. Journal of Hospitality & Tourism Research 25 (3): 320–26. https://doi.org/10.1177/109634800102500306.
Grunert, Klaus G. 2005. ‘Food Quality and Safety: Consumer Perception and Demand’. European Review of Agricultural Economics 32 (3): 369–91. https://doi.org/10.1093/eurrag/jbi011.
Han, Heesup, and Sunghyup Sean Hyun. 2017. ‘Impact of Hotel-Restaurant Image and Quality of Physical-Environment, Service, and Food on Satisfaction and Intention’. International Journal of Hospitality Management 63 (May): 82–92. https://doi.org/10.1016/j.ijhm.2017.03.006.
Hayes, David K., and Allisha Miller. 2010. Revenue Management for the Hospitality Industry. Hoboken, N.J.: John Wiley & Sons, Incorporated.
Hotrec. 2019. ‘The Hospitality Industry’s Contributions to European Economy Society’. 2019. https://www.hotrec.eu/facts-figures/.
Johns, Nick, and Phil Tyas. 1996. ‘Use of Service Quality Gap Theory to Differentiate between Foodservice Outlets’. The Service Industries Journal 16 (3): 321–46. https://doi.org/10.1080/02642069600000031.
Kaminakis, Kostas, Kalipso Karantinou, Christos Koritos, and Spiros Gounaris. 2019. ‘Hospitality Servicescape Effects on Customer-Employee Interactions: A Multilevel Study’. Tourism Management 72 (June): 130–44. https://doi.org/10.1016/j.tourman.2018.11.013.
Kim, Hyun Jeong, Cynthia McCahon, and Judy Miller. 2003. ‘Assessing Service Quality in Korean Casual-Dining Restaurants Using DINESERV’. Journal of Foodservice Business Research 6 (1): 67–86. https://doi.org/10.1300/J369v06n01_05.
Kim, Woo Gon, Jun (Justin) Li, and Robert A. Brymer. 2016. ‘The Impact of Social Media Reviews on Restaurant Performance: The Moderating Role of Excellence Certificate’. International Journal of Hospitality

Cost-Effective Service Excellence: Exploring the Relationships Among Restaurants’ Operational Efficiency, Size and Service Quality
80 South East European Journal of Economics and Business, Volume 14 (2) 2019
Management 55: 41–51. https://doi.org/10.1016/j.ijhm.2016.03.001.
Kim, Woo Gon, Christy Yen Nee Ng, and Yen-soon Kim. 2009. ‘Influence of Institutional DINESERV on Customer Satisfaction, Return Intention, and Word-of-Mouth’. International Journal of Hospitality Management 28 (1): 10–17. https://doi.org/10.1016/j.ijhm.2008.03.005.
Knutson, Bonnie J., Pete Stevens, and Mark Patton. 1996. ‘Dineserv: Measuring Service Quality in Quick Service, Casual/Theme, and Fine Dining Restaurants’. Journal of Hospitality & Leisure Marketing 3 (2): 35–44. https://doi.org/10.1300/J150v03n02_04.
Knutson, Bonnie, Pete Stevens, Colleen Wullaert, Mark Patton, and Fumlto Yokoyama. 1990. ‘Lodgserv: A Service Quality Index for the Lodging Industry’. Journal of Hospitality & Tourism Research 14 (2): 277–84.
Kukanja, Marko, Doris Gomezelj Omerzel, and Borut Kodrič. 2017. ‘Ensuring Restaurant Quality and Guests’ Loyalty: An Integrative Model Based on Marketing (7P) Approach’. Total Quality Management & Business Excellence 28 (13–14): 1509–25. https://doi.org/10.1080/14783363.2016.1150172.
Kuo, Tsuang, Chih Ta Chen, and Wan Jung Cheng. 2018. ‘Service Quality Evaluation: Moderating Influences of First-Time and Revisiting Customers’. Total Quality Management & Business Excellence 29 (3–4): 429–40. htt-ps://doi.org/10.1080/14783363.2016.1209405.
Lai, Ivan K.W., Michael Hitchcock, Ting Yang, and Tun-Wei Lu. 2018. ‘Literature Review on Service Quality in Hospitality and Tourism (1984-2014): Future Directions and Trends’. International Journal of Contemporary Hospitality Management 30 (1): 114–59. https://doi.org/10.1108/IJCHM-08-2016-0408.
Lee, Wen-Hwa, and Ching-Chan Cheng. 2018. ‘Less Is More: A New Insight for Measuring Service Quality of Green Hotels’. International Journal of Hospitality Management 68 (January): 32–40. https://doi.org/10.1016/j.ijhm.2017.09.005.
Lin, Shu-Ping, Ya-Hui Chan, and Ming-Chun Tsai. 2009. ‘A Transformation Function Corresponding to IPA and Gap Analysis’. Total Quality Management & Business Excellence 20 (8): 829–46. https://doi.org/10.1080/14783360903128272.
Liu, Pei, and Eliza Ching-Yick Tse. 2018. ‘Exploring Factors on Customers’ Restaurant Choice: An Analysis of Restaurant Attributes’. British Food Journal 120 (10): 2289–2303. htt-ps://doi.org/10.1108/BFJ-10-2017-0561.
MarketResearch. 2019. ‘Restaurants Market Research Reports & Restaurants Industry Analysis’. 2019. htt-ps://www.marketresearch.com/Food-Beverage-c84/Food-Service-Hospitality-c169/Restaurants-c532/.
Marković, Suzana, Sanja Raspor, and Klaudio Šegarić. 2010. ‘Does Restaurant Performance Meet Customers’ Expectations? An Assessment of Restaurant Service
Quality Using a Modified DINESERV Approach’. Tourism and Hospitality Management 16 (2): 181–195.
Mhlanga, Oswald. 2018. ‘Factors Impacting Restaurant Efficiency: A Data Envelopment Analysis’. Tourism Review 73 (1): 82–93. https://doi.org/10.1108/TR-07-2017-0109.
Mosavi, Seyed Alireza, and Mahnoosh Ghaedi. 2012. ‘The Effects of Relationship Marketing on Relationship Quality in Luxury Restaurants’. African Journal of Business Management 6 (19): 6090–6102. https://doi.org/10.5897/AJBM11.2192.
Mun, Sung Gyun, and SooCheong (Shawn) Jang. 2015. ‘Working Capital, Cash Holding, and Profitability of Restaurant Firms’. International Journal of Hospitality Management 48: 1–11. https://doi.org/10.1016/j.ijhm.2015.04.003.
———. 2018. ‘Restaurant Operating Expenses and Their Effects on Profitability Enhancement’. International Journal of Hospitality Management 71 (April): 68–76. htt-ps://doi.org/10.1016/j.ijhm.2017.12.002.
Parasuraman, A., V. A Zeithaml, and L. L Berry. 1985. ‘A Conceptual Model of Service Quality and Its Implications for Future Research’. The Journal of Marketing 49 (4): 41–50.
———. 1988. ‘SERVQUAL: A Multuple-Item Scale for Measuring Consumer Perceptions of Service Quality’. Journal of Retailing 64: 1.
Planinc, Tanja, Marko Kukanja, and Saša Planinc. 2018. ‘Classification and Efficiency Analysis of Slovenian Restaurant SMEs’. Academica Turistica, June, 31–42. htt-ps://doi.org/10.26493/2335-4194.11.31-42.
Poulston, Jill, and Albert Yau Kwong Yiu. 2011. ‘Profit or Principles: Why Do Restaurants Serve Organic Food?’ International Journal of Hospitality Management 30 (1): 184–91. https://doi.org/10.1016/j.ijhm.2010.04.004.
Raajpoot, Nusser A. 2002. ‘TANGSERV: A Multiple Item Scale for Measuring Tangible Quality in Foodservice Industry’. Journal of Foodservice Business Research 5 (2): 109–127.
Reynolds, Dennis. 2003. ‘Hospitality-Productivity Assessment: Using Data-Envelopment Analysis’. Cornell Hotel and Restaurant Administration Quarterly 44 (2): 130–37. https://doi.org/10.1177/0010880403442012.
Reynolds, Dennis, and David Biel. 2007. ‘Incorporating Satisfaction Measures into a Restaurant Productivity Index’. International Journal of Hospitality Management 26 (2): 352–61. https://doi.org/10.1016/j.ijhm.2006.01.003.
Reynolds, Dennis, and Gary M. Thompson. 2007. ‘Multiunit Restaurant Productivity Assessment Using Three-Phase Data Envelopment Analysis’. International Journal of Hospitality Management 26 (1): 20–32. https://doi.org/10.1016/j.ijhm.2005.08.004.
Ryu, Kisang, and Jin-Soo Lee. 2017. ‘Examination of Restaurant Quality, Relationship Benefits, and Customer Reciprocity From the Perspective of Relationship Marketing

Cost-Effective Service Excellence: Exploring the Relationships Among Restaurants’ Operational Efficiency, Size and Service Quality
81South East European Journal of Economics and Business, Volume 14 (2) 2019
Investments’. Journal of Hospitality & Tourism Research 41 (1): 66–92. https://doi.org/10.1177/1096348013515919.
Saeida Ardakani, Saeid, Majid Nejatian, Mohammad Ali Farhangnejad, and Mehran Nejati. 2015. ‘A Fuzzy Approach to Service Quality Diagnosis’. Marketing Intelligence & Planning 33 (1): 103–19. https://doi.org/10.1108/MIP-02-2013-0035.
Seo, Kwanglim, and Amit Sharma. 2018. ‘CEO Overconfidence and the Effects of Equity-Based Compensation on Strategic Risk-Taking in the U.S. Restaurant Industry’. Journal of Hospitality & Tourism Research 42 (2): 224–59. https://doi.org/10.1177/1096348014561026.
Statista. 2019. ‘Statistics and Market Data on Restaurants’. 2019. https://www.statista.com/markets/420/topic/494/restaurants/.
Stevens, Pete, Bonnie Knutson, and Mark Patton. 1995. ‘Dineserv: A Tool for Measuring Service Quality
in Restaurants’. The Cornell Hotel and Restaurant Administration Quarterly 36 (2): 5–60. https://doi.org/10.1016/0010-8804(95)93844-K.
Sweeney, Jill, Robert W. Armstrong, and Lester W. Johnson. 2016. ‘The Effect of Cues on Service Quality Expectations and Service Selection in a Restaurant Setting: A Retrospective and Prospective Commentary’. Journal of Services Marketing 30 (2): 136–40. https://doi.org/10.1108/JSM-01-2016-0010.
Wirtz, Jochen, and Valarie Zeithaml. 2017. ‘Cost-Effective Service Excellence’. J. of the Acad. Mark. Sci., 1–22. https://doi.org/10.1007/s11747-017-0560-7).
Wttc. 2019a. ‘Travel&Tourism Economic Impact 2018 Slovenia’. London: Wttc.
———. 2019b. ‘Travel&Tourism Economic Impact 2018 World’. London: Wttc.