Embed Size (px)
Citation preview
2Q19
CORPORATE PRESENTATION
www.vesta.com.mx
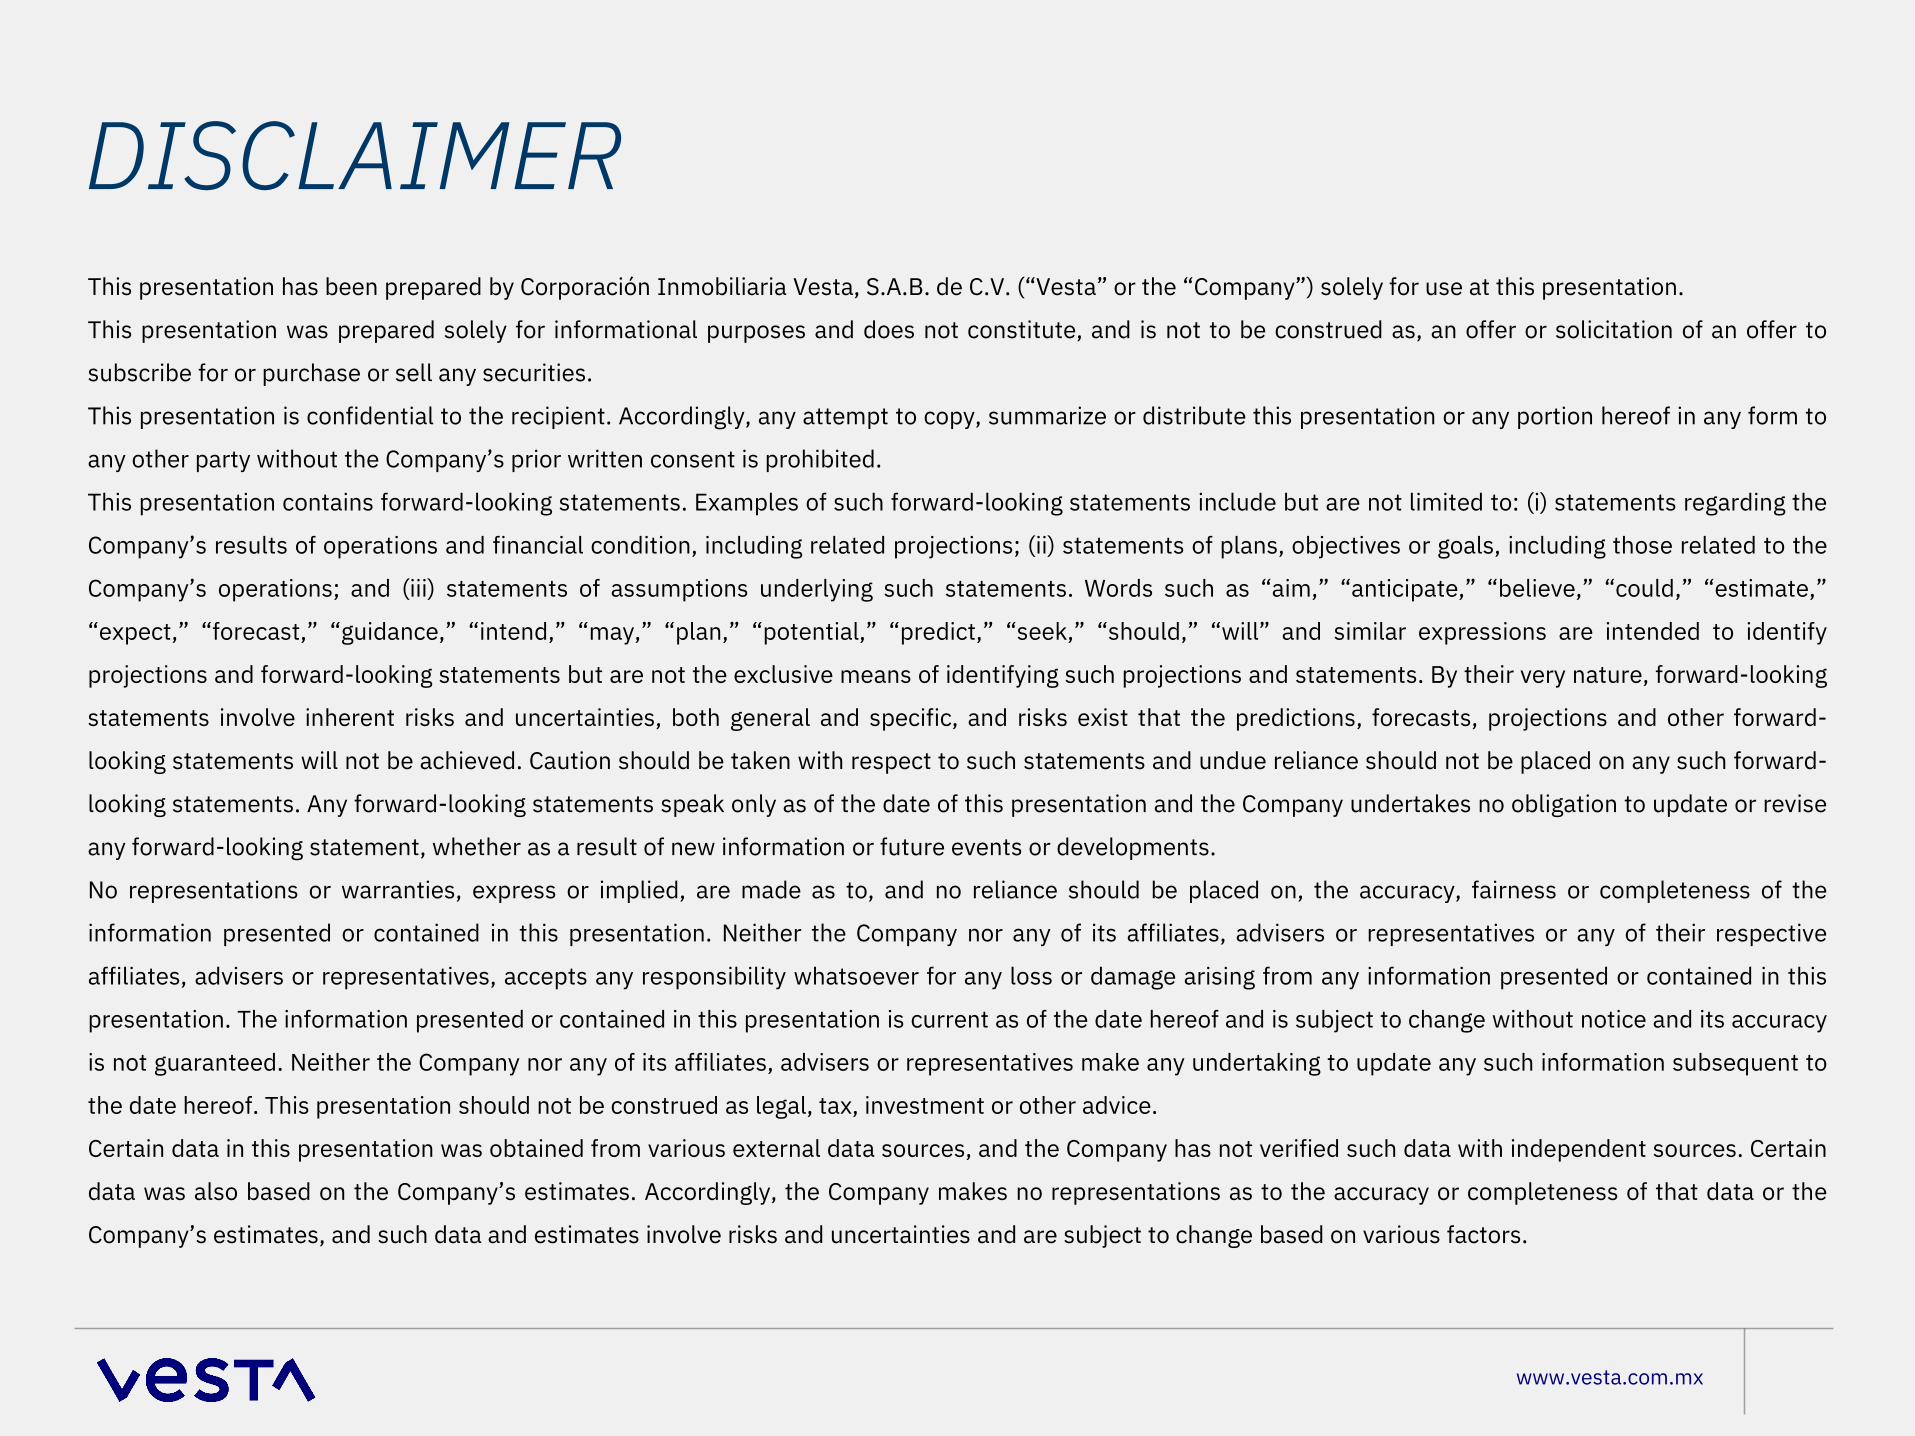
DISCLAIMERThis presentation has been prepared by Corporación Inmobiliaria Vesta, S.A.B. de C.V. (“Vesta” or the “Company”) solely for use at this presentation.
This presentation was prepared solely for informational purposes and does not constitute, and is not to be construed as, an offer or solicitation of an offer to
subscribe for or purchase or sell any securities.
This presentation is confidential to the recipient. Accordingly, any attempt to copy, summarize or distribute this presentation or any portion hereof in any form to
any other party without the Company’s prior written consent is prohibited.
This presentation contains forward-looking statements. Examples of such forward-looking statements include but are not limited to: (i) statements regarding the
Company’s results of operations and financial condition, including related projections; (ii) statements of plans, objectives or goals, including those related to the
Company’s operations; and (iii) statements of assumptions underlying such statements. Words such as “aim,” “anticipate,” “believe,” “could,” “estimate,”
“expect,” “forecast,” “guidance,” “intend,” “may,” “plan,” “potential,” “predict,” “seek,” “should,” “will” and similar expressions are intended to identify
projections and forward-looking statements but are not the exclusive means of identifying such projections and statements. By their very nature, forward-looking
statements involve inherent risks and uncertainties, both general and specific, and risks exist that the predictions, forecasts, projections and other forward-
looking statements will not be achieved. Caution should be taken with respect to such statements and undue reliance should not be placed on any such forward-
looking statements. Any forward-looking statements speak only as of the date of this presentation and the Company undertakes no obligation to update or revise
any forward-looking statement, whether as a result of new information or future events or developments.
No representations or warranties, express or implied, are made as to, and no reliance should be placed on, the accuracy, fairness or completeness of the
information presented or contained in this presentation. Neither the Company nor any of its affiliates, advisers or representatives or any of their respective
affiliates, advisers or representatives, accepts any responsibility whatsoever for any loss or damage arising from any information presented or contained in this
presentation. The information presented or contained in this presentation is current as of the date hereof and is subject to change without notice and its accuracy
is not guaranteed. Neither the Company nor any of its affiliates, advisers or representatives make any undertaking to update any such information subsequent to
the date hereof. This presentation should not be construed as legal, tax, investment or other advice.
Certain data in this presentation was obtained from various external data sources, and the Company has not verified such data with independent sources. Certain
data was also based on the Company’s estimates. Accordingly, the Company makes no representations as to the accuracy or completeness of that data or the
Company’s estimates, and such data and estimates involve risks and uncertainties and are subject to change based on various factors.
Vesta’s Snapshot
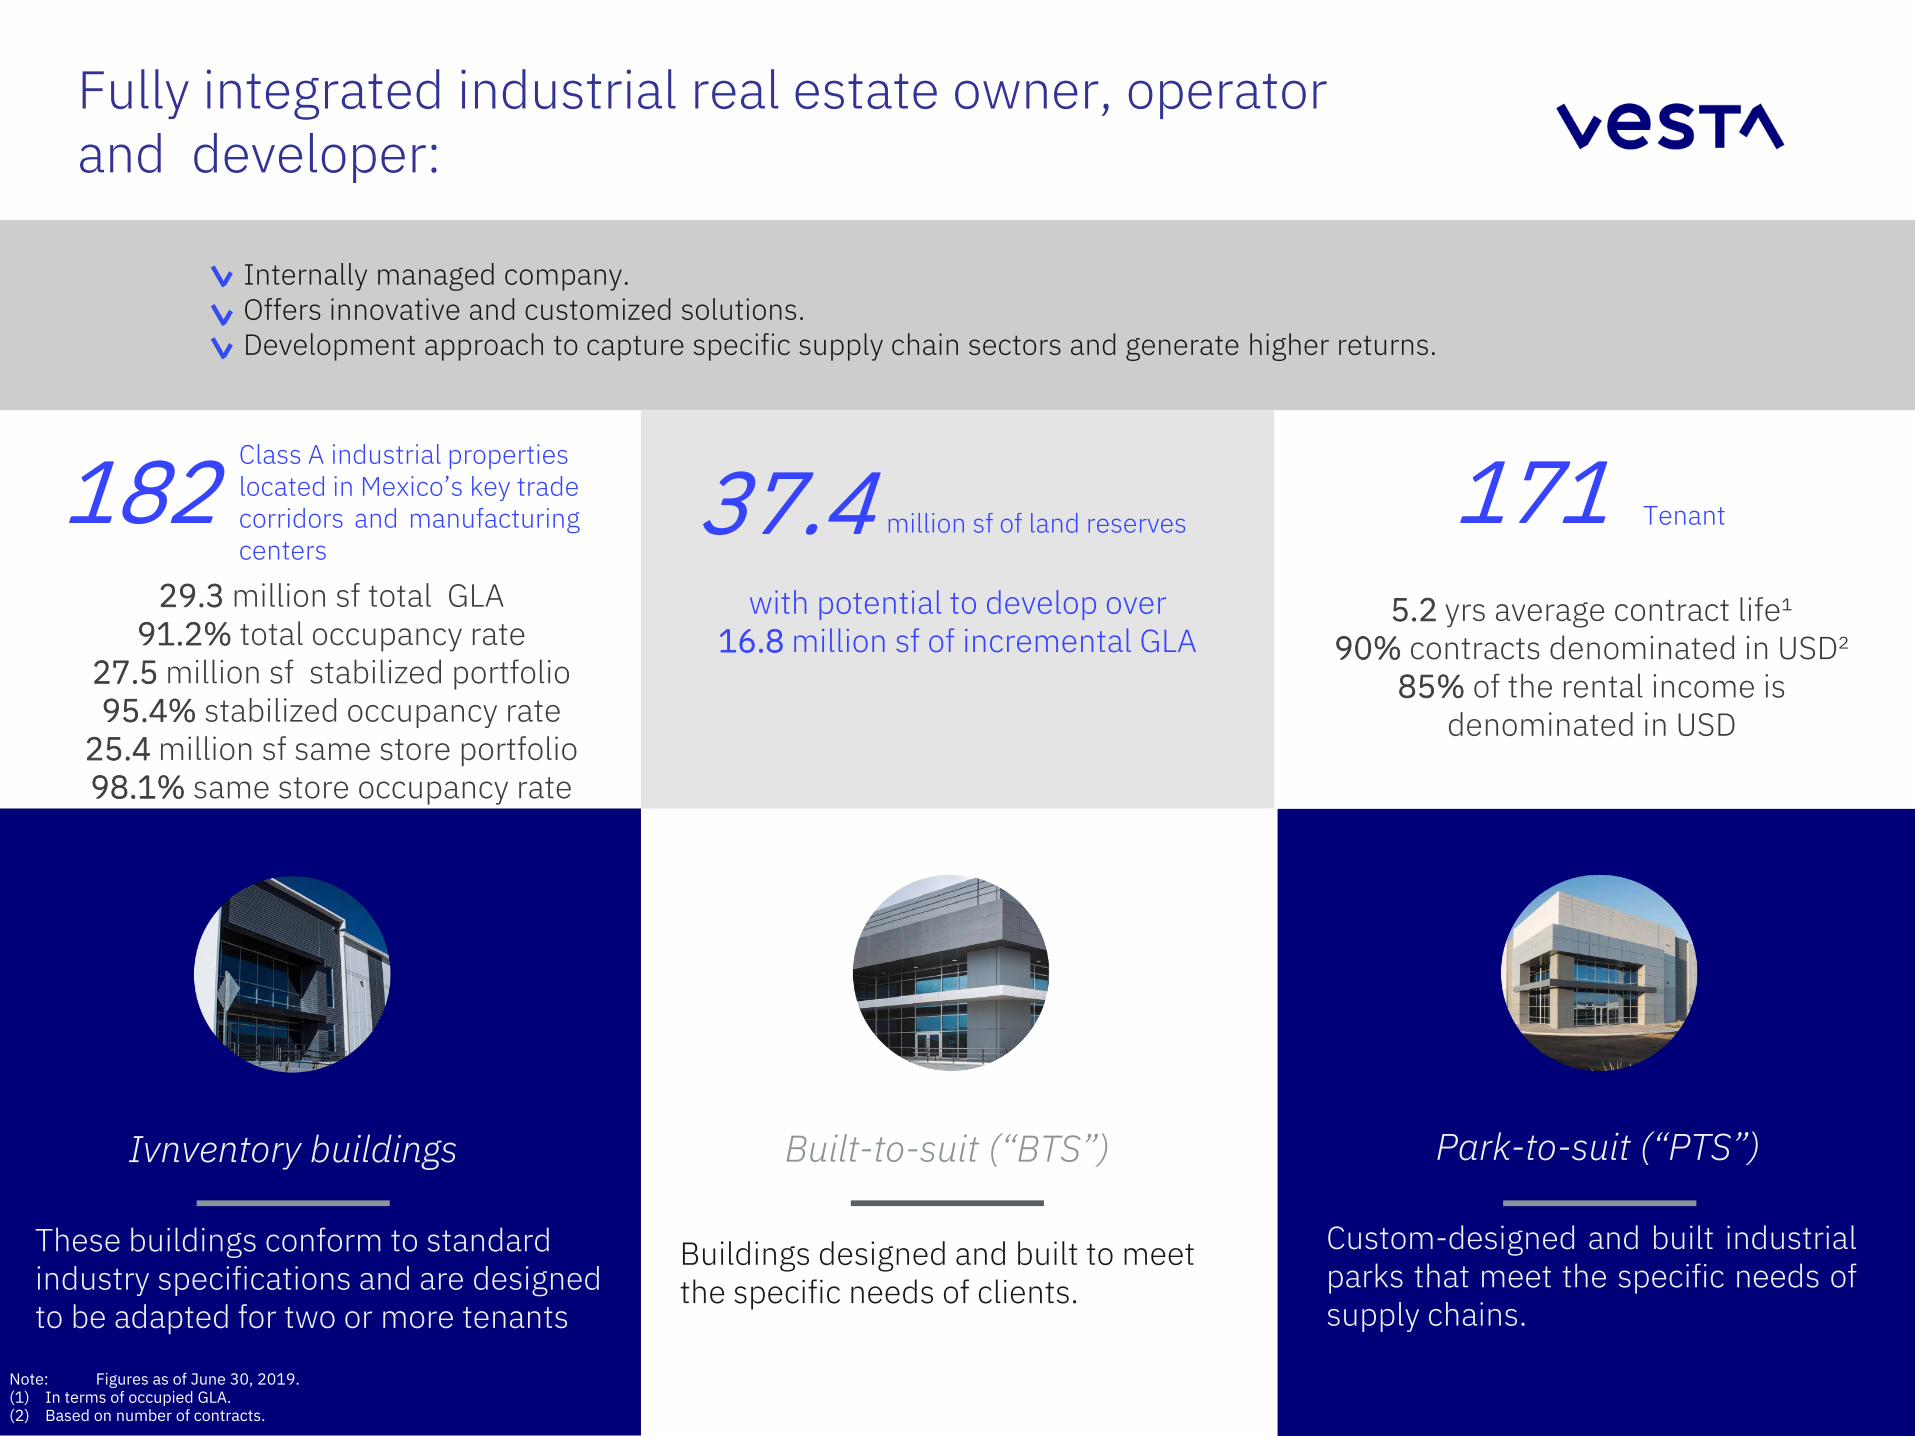
Fully integrated industrial real estate owner, operator and developer:
Internally managed company.Offers innovative and customized solutions.Development approach to capture specific supply chain sectors and generate higher returns.
182 Class A industrial propertieslocated in Mexico’s key tradecorridors and manufacturingcenters
29.3 million sf total GLA 91.2% total occupancy rate
27.5 million sf stabilized portfolio 95.4% stabilized occupancy rate
25.4 million sf same store portfolio 98.1% same store occupancy rate
37.4with potential to develop over
16.8 million sf of incremental GLA
171 Tenant
Ivnventory buildings Built-to-suit (“BTS”) Park-to-suit (“PTS”)
Buildings designed and built to meetthe specific needs of clients.
These buildings conform to standardindustry specifications and are designedto be adapted for two or more tenants
Custom-designed and built industrialparks that meet the specific needs ofsupply chains.
5.2 yrs average contract life¹90% contracts denominated in USD²
85% of the rental income is denominated in USD
million sf of land reserves
Note: Figures as of June 30, 2019.(1) In terms of occupied GLA.(2) Based on number of contracts.
www.vesta.com.mx
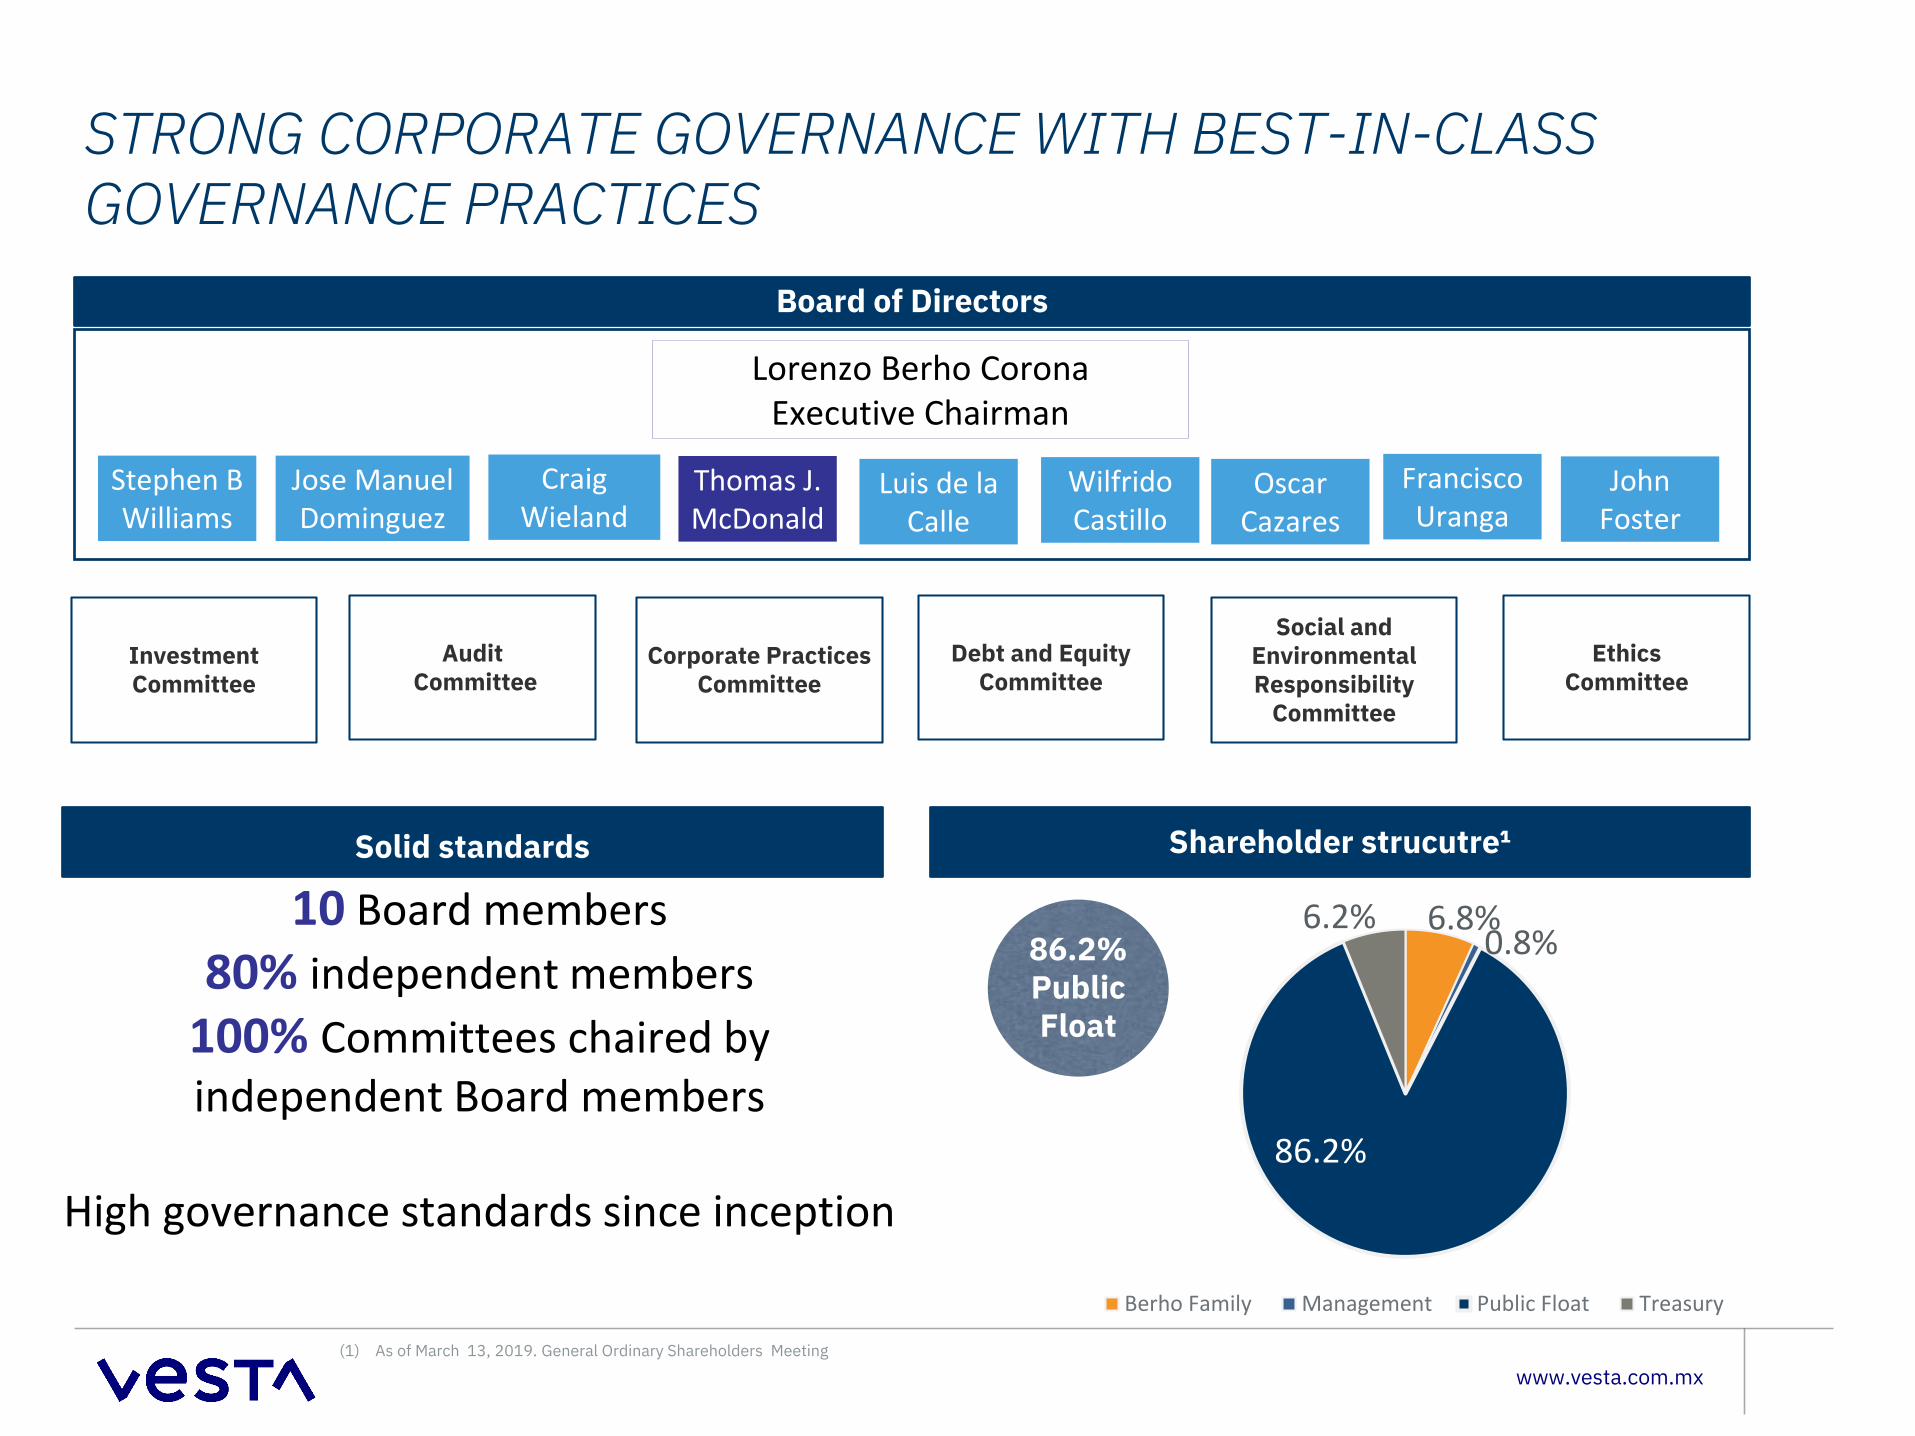
STRONG CORPORATE GOVERNANCE WITH BEST-IN-CLASS GOVERNANCE PRACTICES
Board of Directors
Stephen B Williams
Jose Manuel Dominguez
Craig Wieland
Thomas J. McDonald
WilfridoCastillo
Luis de laCalle
OscarCazares
FranciscoUranga
JohnFoster
Lorenzo Berho CoronaExecutive Chairman
Investment Committee
AuditCommittee
Corporate PracticesCommittee
Debt and EquityCommittee
Social and Environmental Responsibility
Committee
EthicsCommittee
Solid standards Shareholder strucutre¹
6.8%0.8%
86.2%
6.2%
Berho Family Management Public Float Treasury
86.2% Public Float
10 Board members80% independent members
100% Committees chaired by independent Board members
High governance standards since inception
(1) As of March 13, 2019. General Ordinary Shareholders Meeting
www.vesta.com.mx
Highlights
1
2
3
4
5
6
Record-high results
Resilient balance
Growth without dilution
Increasing dividends
Maximizing our stabilized portfolio
Attractive discount
Record-high Results
www.vesta.com.mx
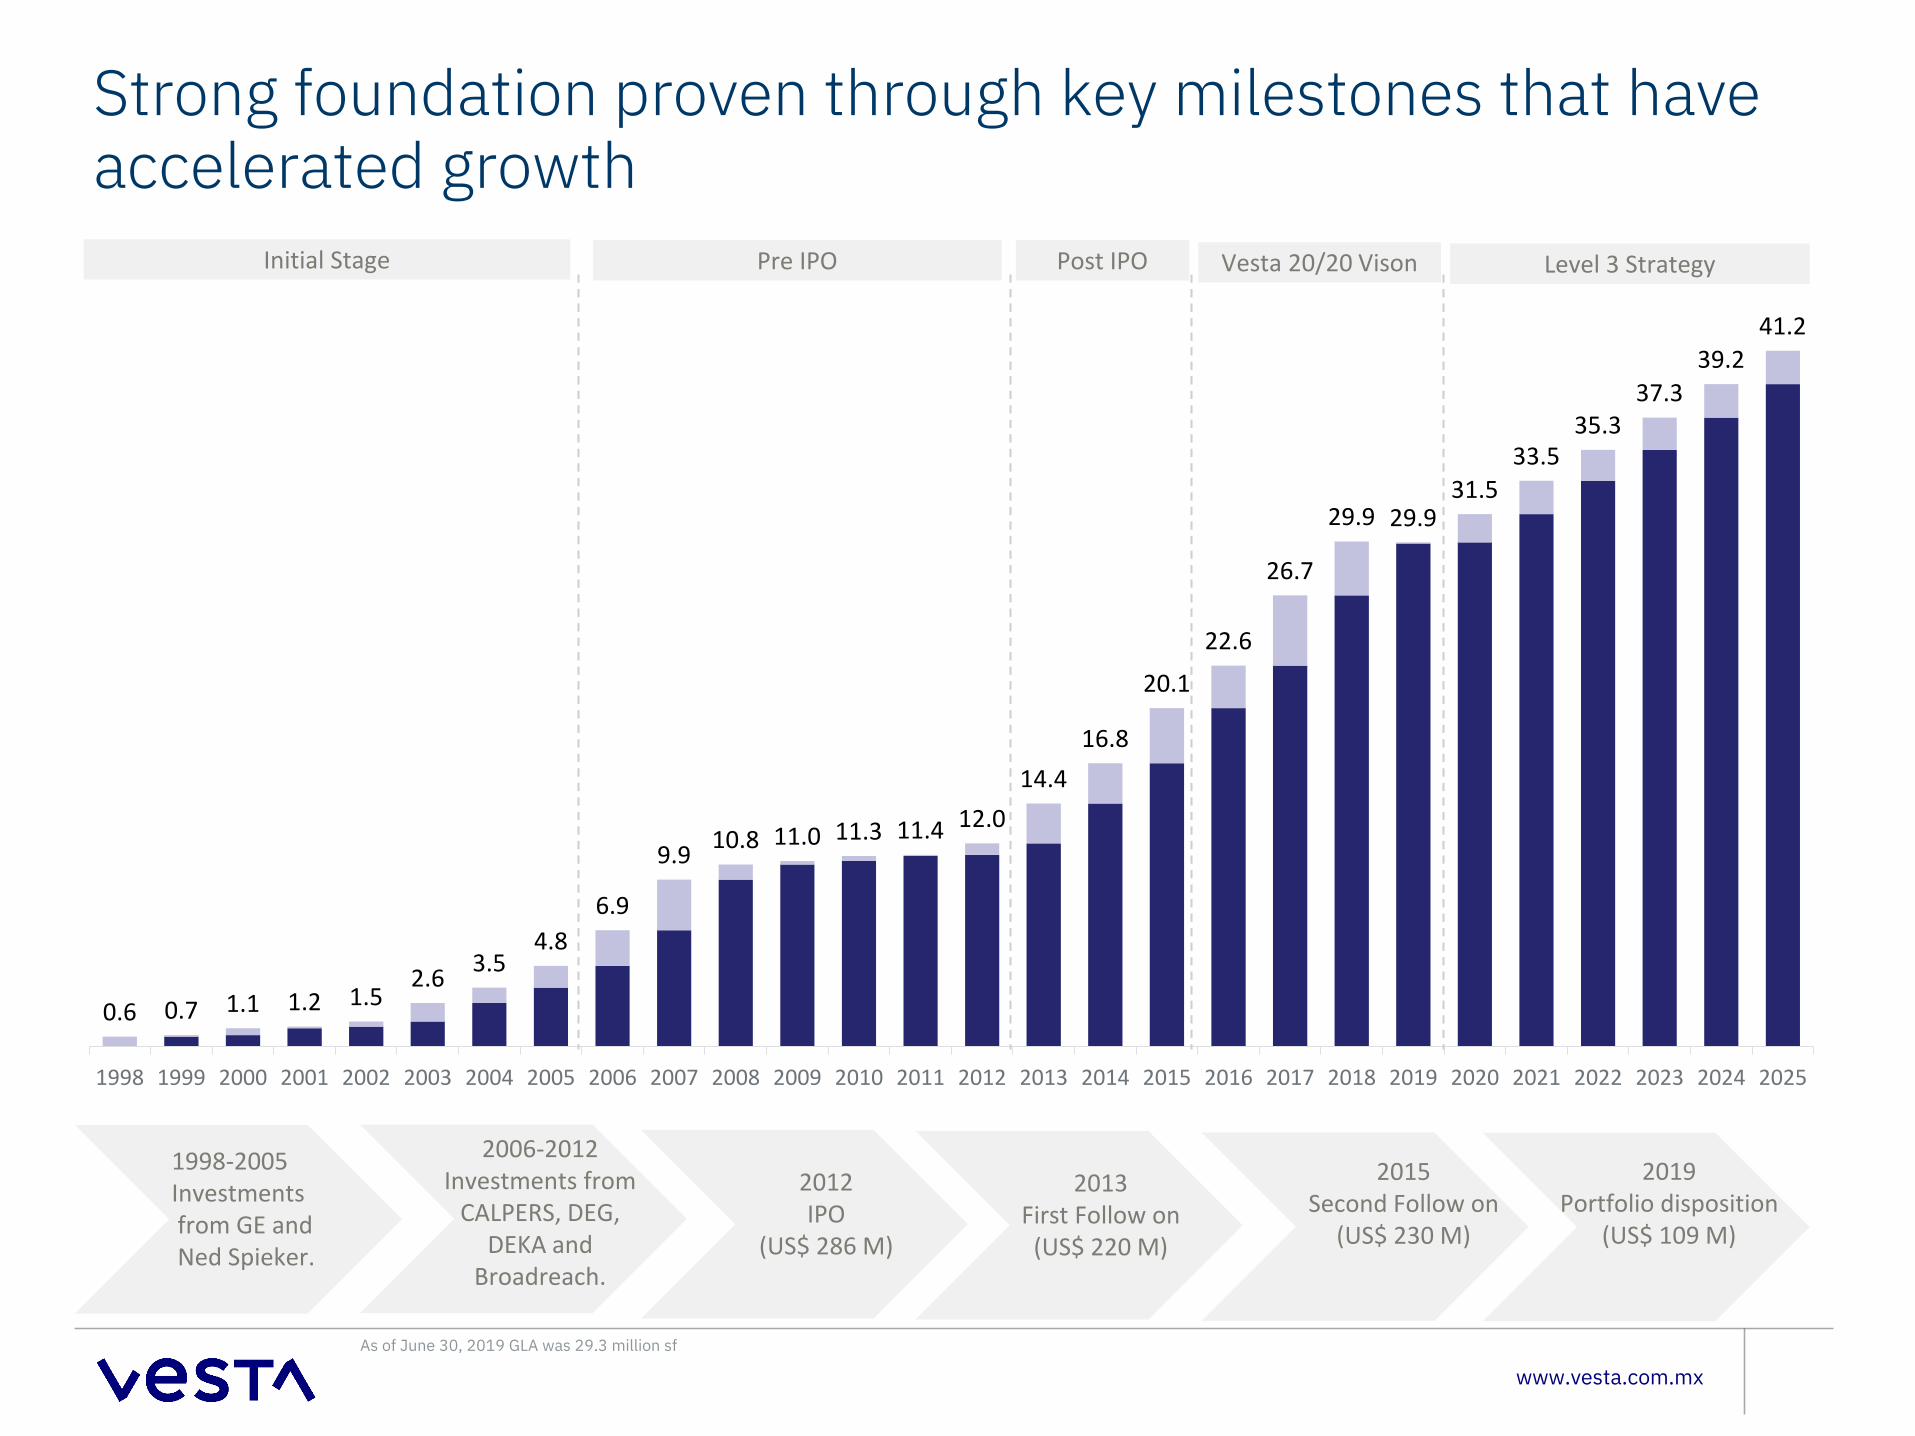
Strong foundation proven through key milestones that have accelerated growth
1998-2005Investmentsfrom GE andNed Spieker.
2006-2012Investments from
CALPERS, DEG, DEKA and
Broadreach.
2012IPO
(US$ 286 M)
2015Second Follow on
(US$ 230 M)
0.6 0.7 1.1 1.2 1.52.6 3.5
4.86.9
9.9 10.8 11.0 11.3 11.4 12.014.4
16.8
20.1
22.6
26.7
29.9 29.931.5
33.535.3
37.339.2
41.2
1998 1999 2000 2001 2002 2003 2004 2005 2006 2007 2008 2009 2010 2011 2012 2013 2014 2015 2016 2017 2018 2019 2020 2021 2022 2023 2024 2025
2019Portfolio disposition
(US$ 109 M)
Initial Stage Pre IPO Post IPO Vesta 20/20 Vison Level 3 Strategy
As of June 30, 2019 GLA was 29.3 million sf
2013First Follow on
(US$ 220 M)
www.vesta.com.mx
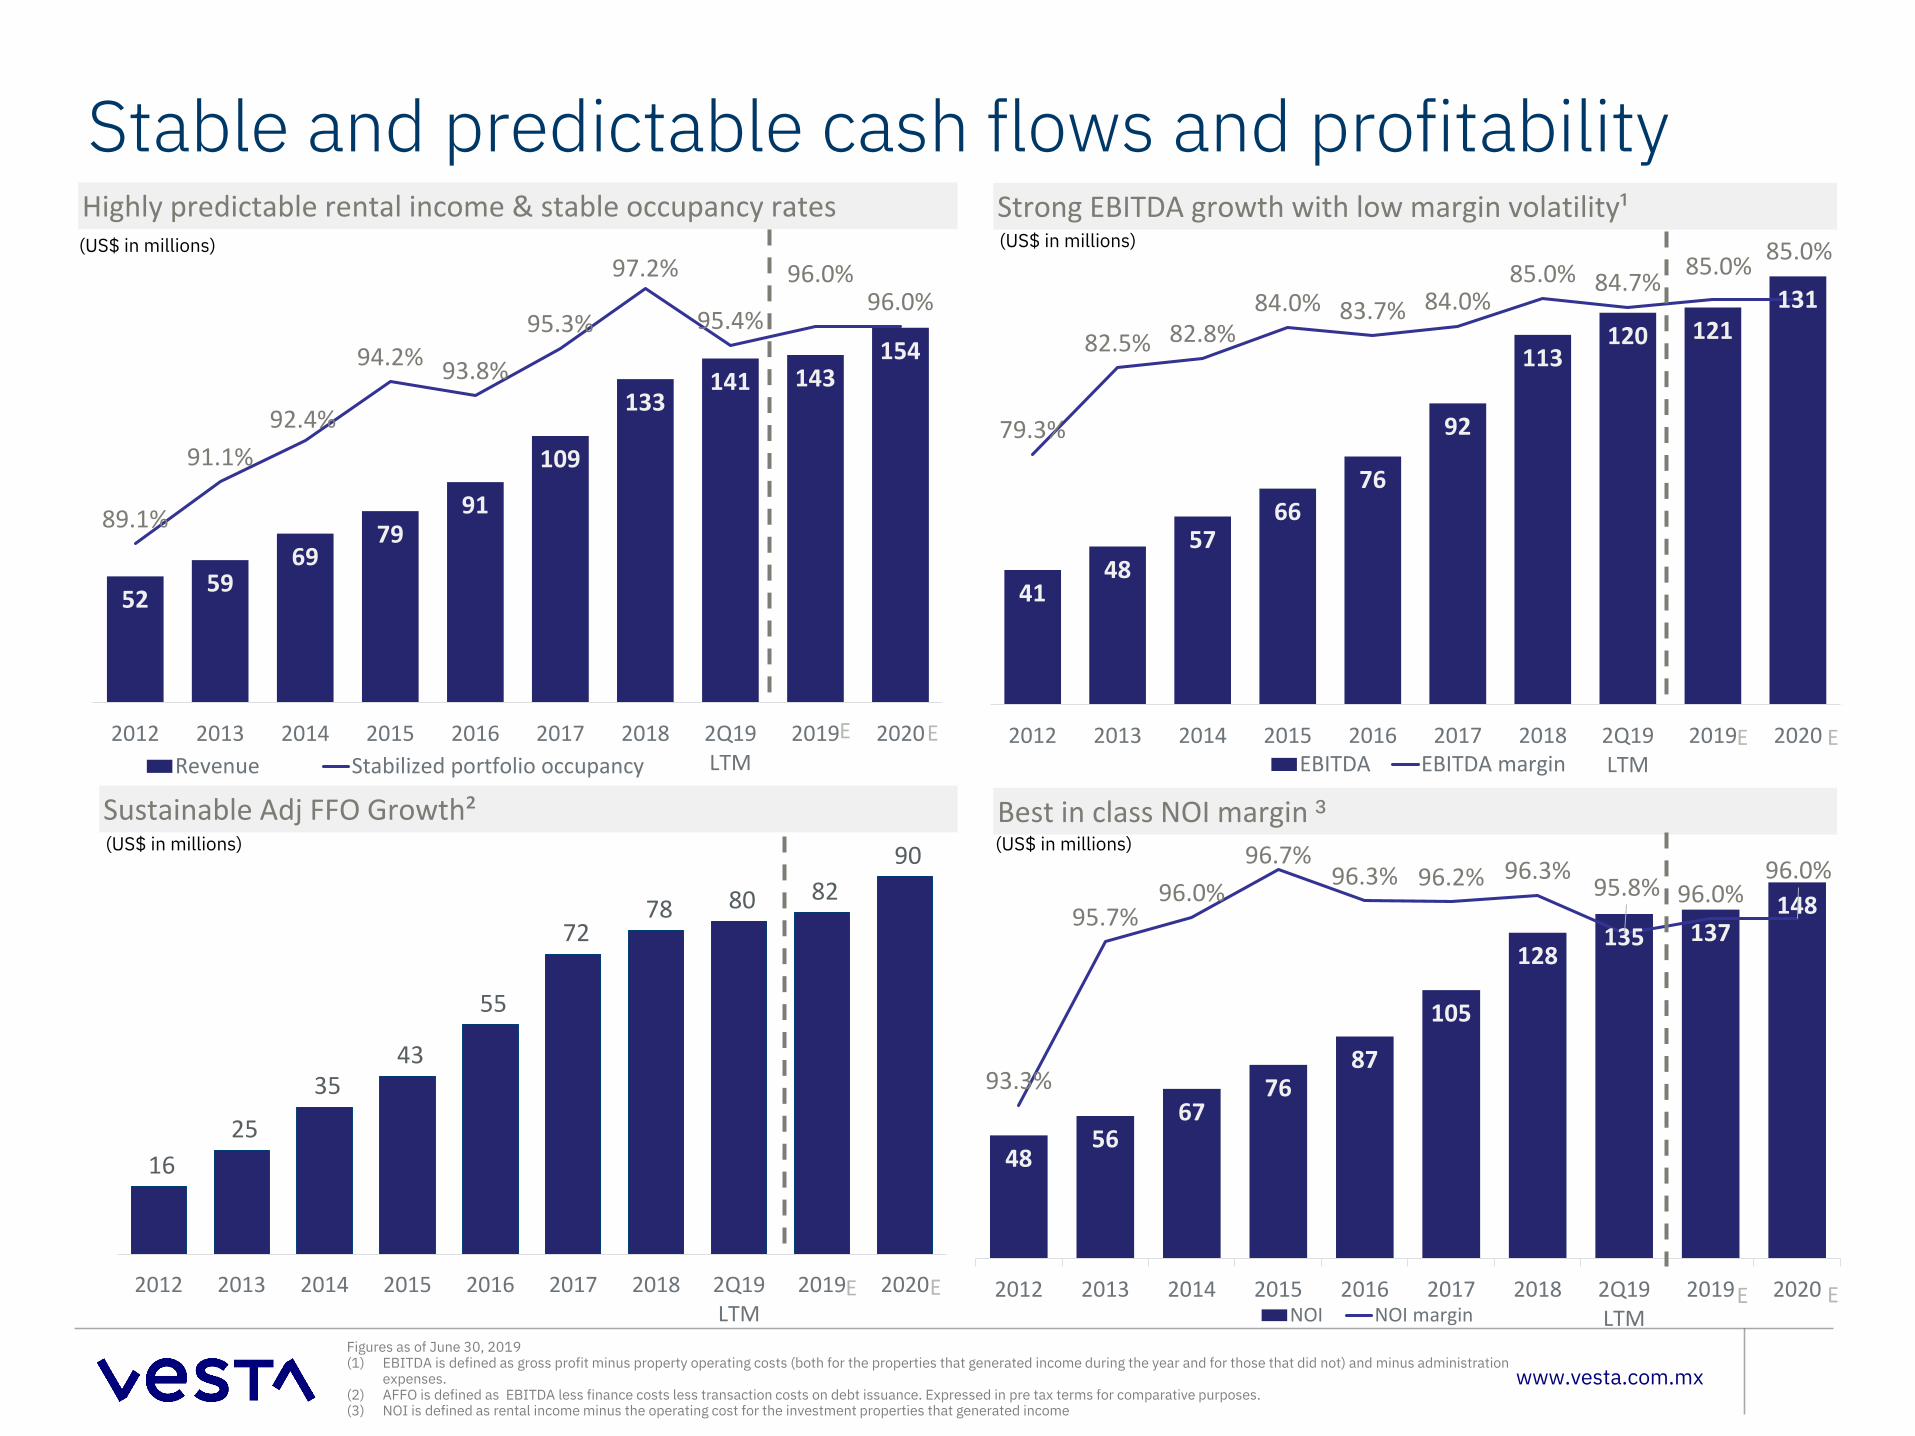
Stable and predictable cash flows and profitabilityHighly predictable rental income & stable occupancy rates Strong EBITDA growth with low margin volatility¹
Sustainable Adj FFO Growth² Best in class NOI margin ³
Figures as of June 30, 2019(1) EBITDA is defined as gross profit minus property operating costs (both for the properties that generated income during the year and for those that did not) and minus administration
expenses.(2) AFFO is defined as EBITDA less finance costs less transaction costs on debt issuance. Expressed in pre tax terms for comparative purposes.(3) NOI is defined as rental income minus the operating cost for the investment properties that generated income
52 5969
7991
109
133141 143
154
89.1%
91.1%92.4%
94.2% 93.8%
95.3%
97.2%
95.4%
96.0%96.0%
2012 2013 2014 2015 2016 2017 2018 2Q19LTM
2019 2020Revenue Stabilized portfolio occupancy
4148
5766
76
92
113120 121
131
79.3%
82.5% 82.8%84.0% 83.7% 84.0%
85.0% 84.7% 85.0% 85.0%
70. 0%
72. 0%
74. 0%
76. 0%
78. 0%
80. 0%
82. 0%
84. 0%
86. 0%
2012 2013 2014 2015 2016 2017 2018 2Q19LTM
2019 2020EBITDA EBITDA margin
4856
6776
87
105
128135 137
148
93.3%
95.7%96.0%
96.7%96.3% 96.2% 96.3%
95.8% 96.0%96.0%
91. 0%
92. 0%
93. 0%
94. 0%
95. 0%
96. 0%
97. 0%
2012 2013 2014 2015 2016 2017 2018 2Q19LTM
2019 2020NOI NOI margin
16 25
35 43
55
72 78 80 82
90
2012 2013 2014 2015 2016 2017 2018 2Q19LTM
2019 2020
E E E E
E E E E
(US$ in millions) (US$ in millions)
(US$ in millions)(US$ in millions)
Resilientbalance
www.vesta.com.mx
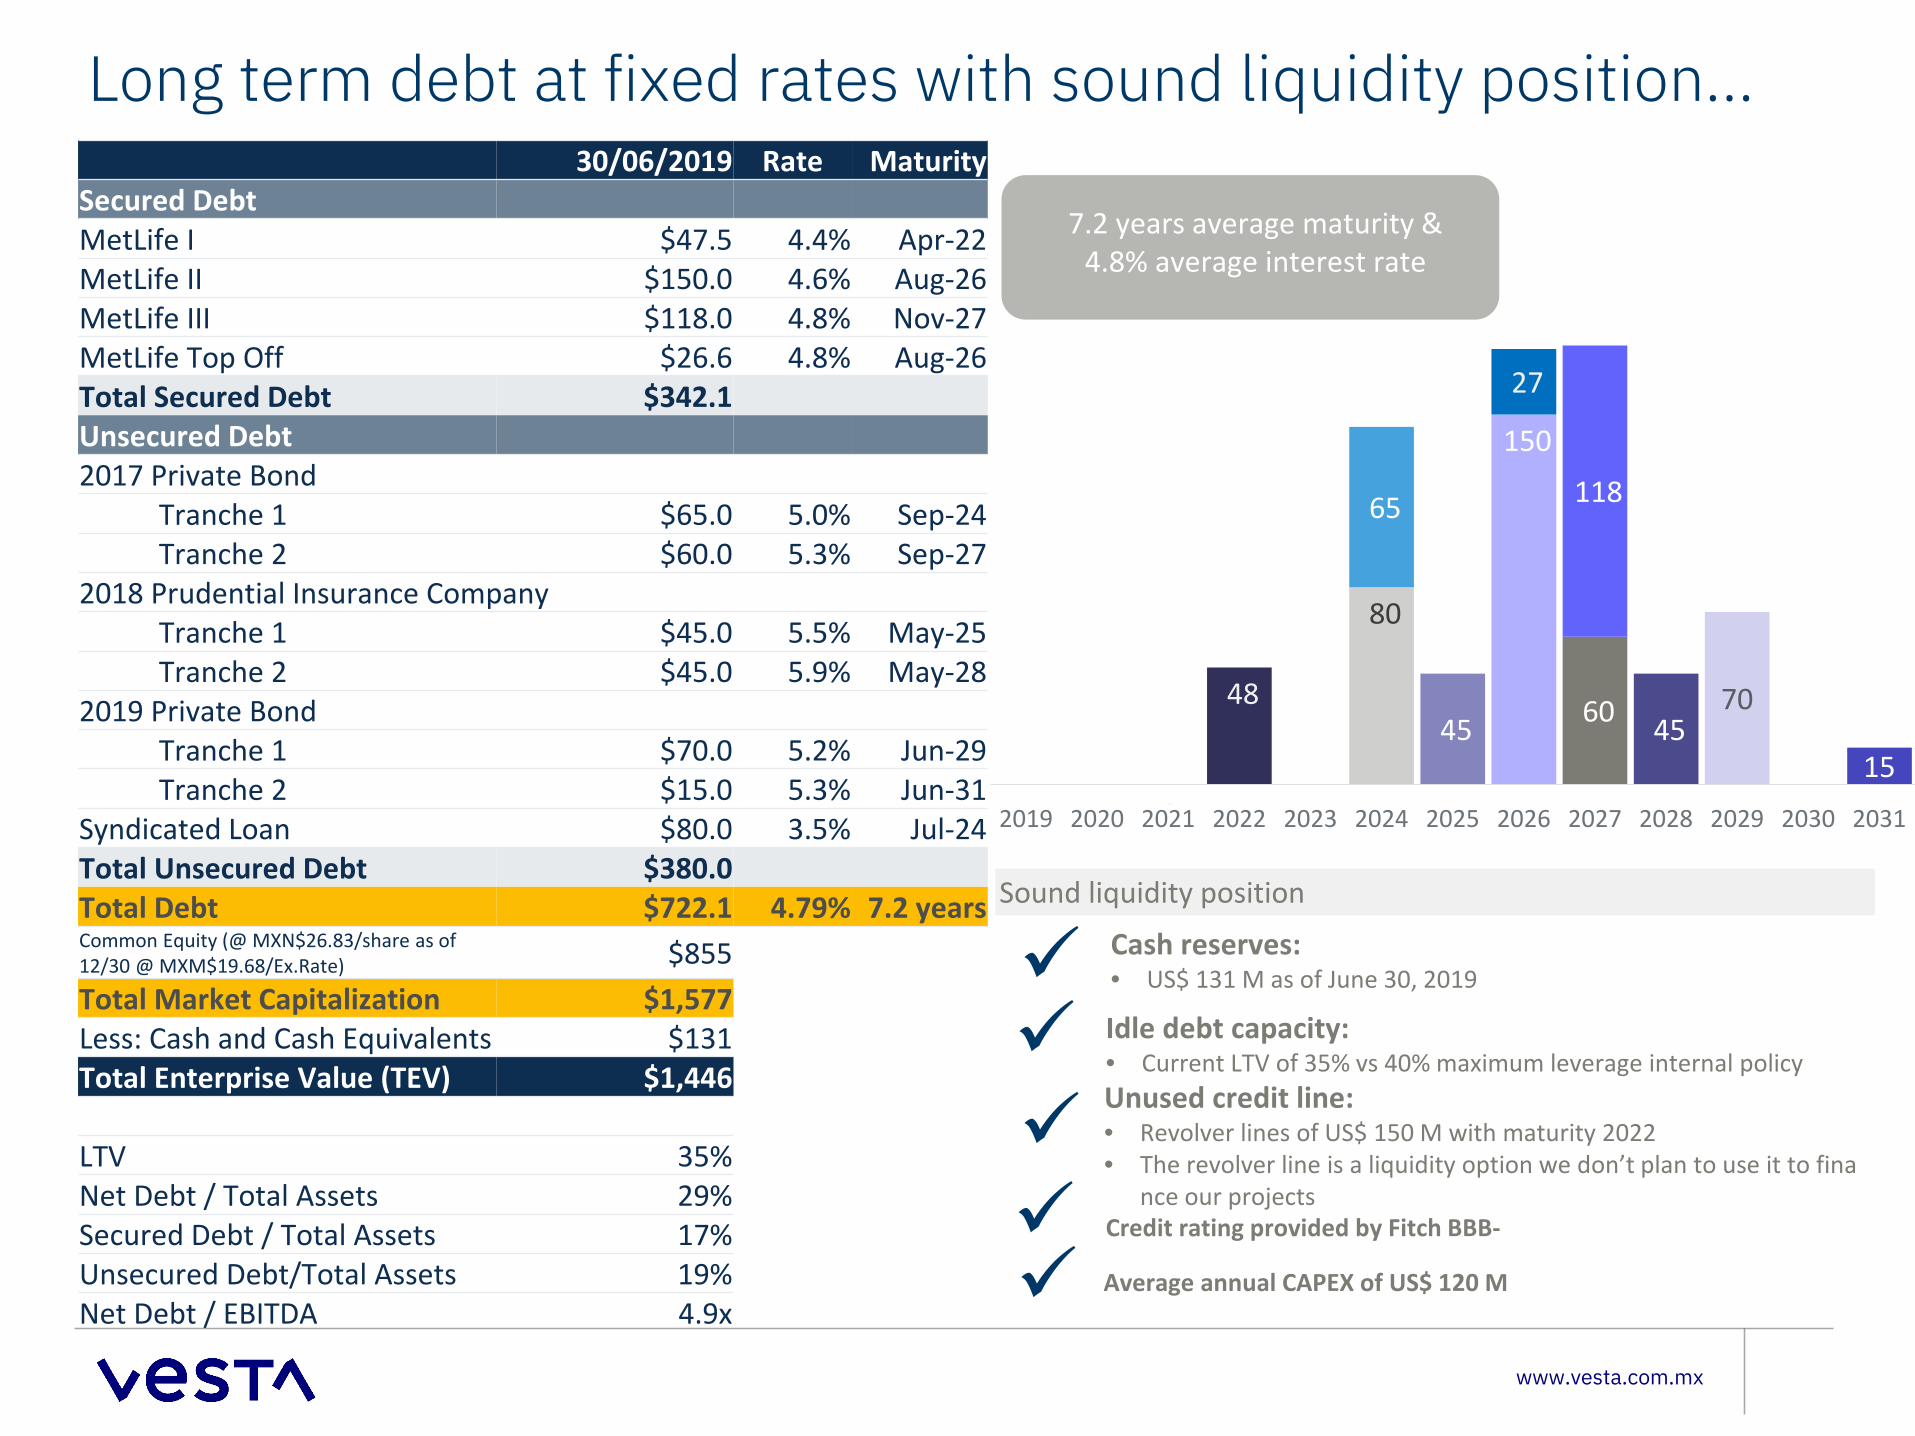
Long term debt at fixed rates with sound liquidity position…30/06/2019 Rate Maturity
Secured DebtMetLife I $47.5 4.4% Apr-22MetLife II $150.0 4.6% Aug-26MetLife III $118.0 4.8% Nov-27MetLife Top Off $26.6 4.8% Aug-26Total Secured Debt $342.1Unsecured Debt2017 Private Bond
Tranche 1 $65.0 5.0% Sep-24Tranche 2 $60.0 5.3% Sep-27
2018 Prudential Insurance Company Tranche 1 $45.0 5.5% May-25Tranche 2 $45.0 5.9% May-28
2019 Private BondTranche 1 $70.0 5.2% Jun-29Tranche 2 $15.0 5.3% Jun-31
Syndicated Loan $80.0 3.5% Jul-24Total Unsecured Debt $380.0Total Debt $722.1 4.79% 7.2 yearsCommon Equity (@ MXN$26.83/share as of 12/30 @ MXM$19.68/Ex.Rate) $855Total Market Capitalization $1,577Less: Cash and Cash Equivalents $131Total Enterprise Value (TEV) $1,446
LTV 35%Net Debt / Total Assets 29%Secured Debt / Total Assets 17%Unsecured Debt/Total Assets 19%Net Debt / EBITDA 4.9x
48
150
-
80
65
60
118
27
45 45 70
152019 2020 2021 2022 2023 2024 2025 2026 2027 2028 2029 2030 2031
7.2 years average maturity & 4.8% average interest rate
Sound liquidity position
Cash reserves: • US$ 131 M as of June 30, 2019
Idle debt capacity: • Current LTV of 35% vs 40% maximum leverage internal policy
Unused credit line: • Revolver lines of US$ 150 M with maturity 2022• The revolver line is a liquidity option we don’t plan to use it to fina
nce our projects Credit rating provided by Fitch BBB-
Average annual CAPEX of US$ 120 M
www.vesta.com.mx
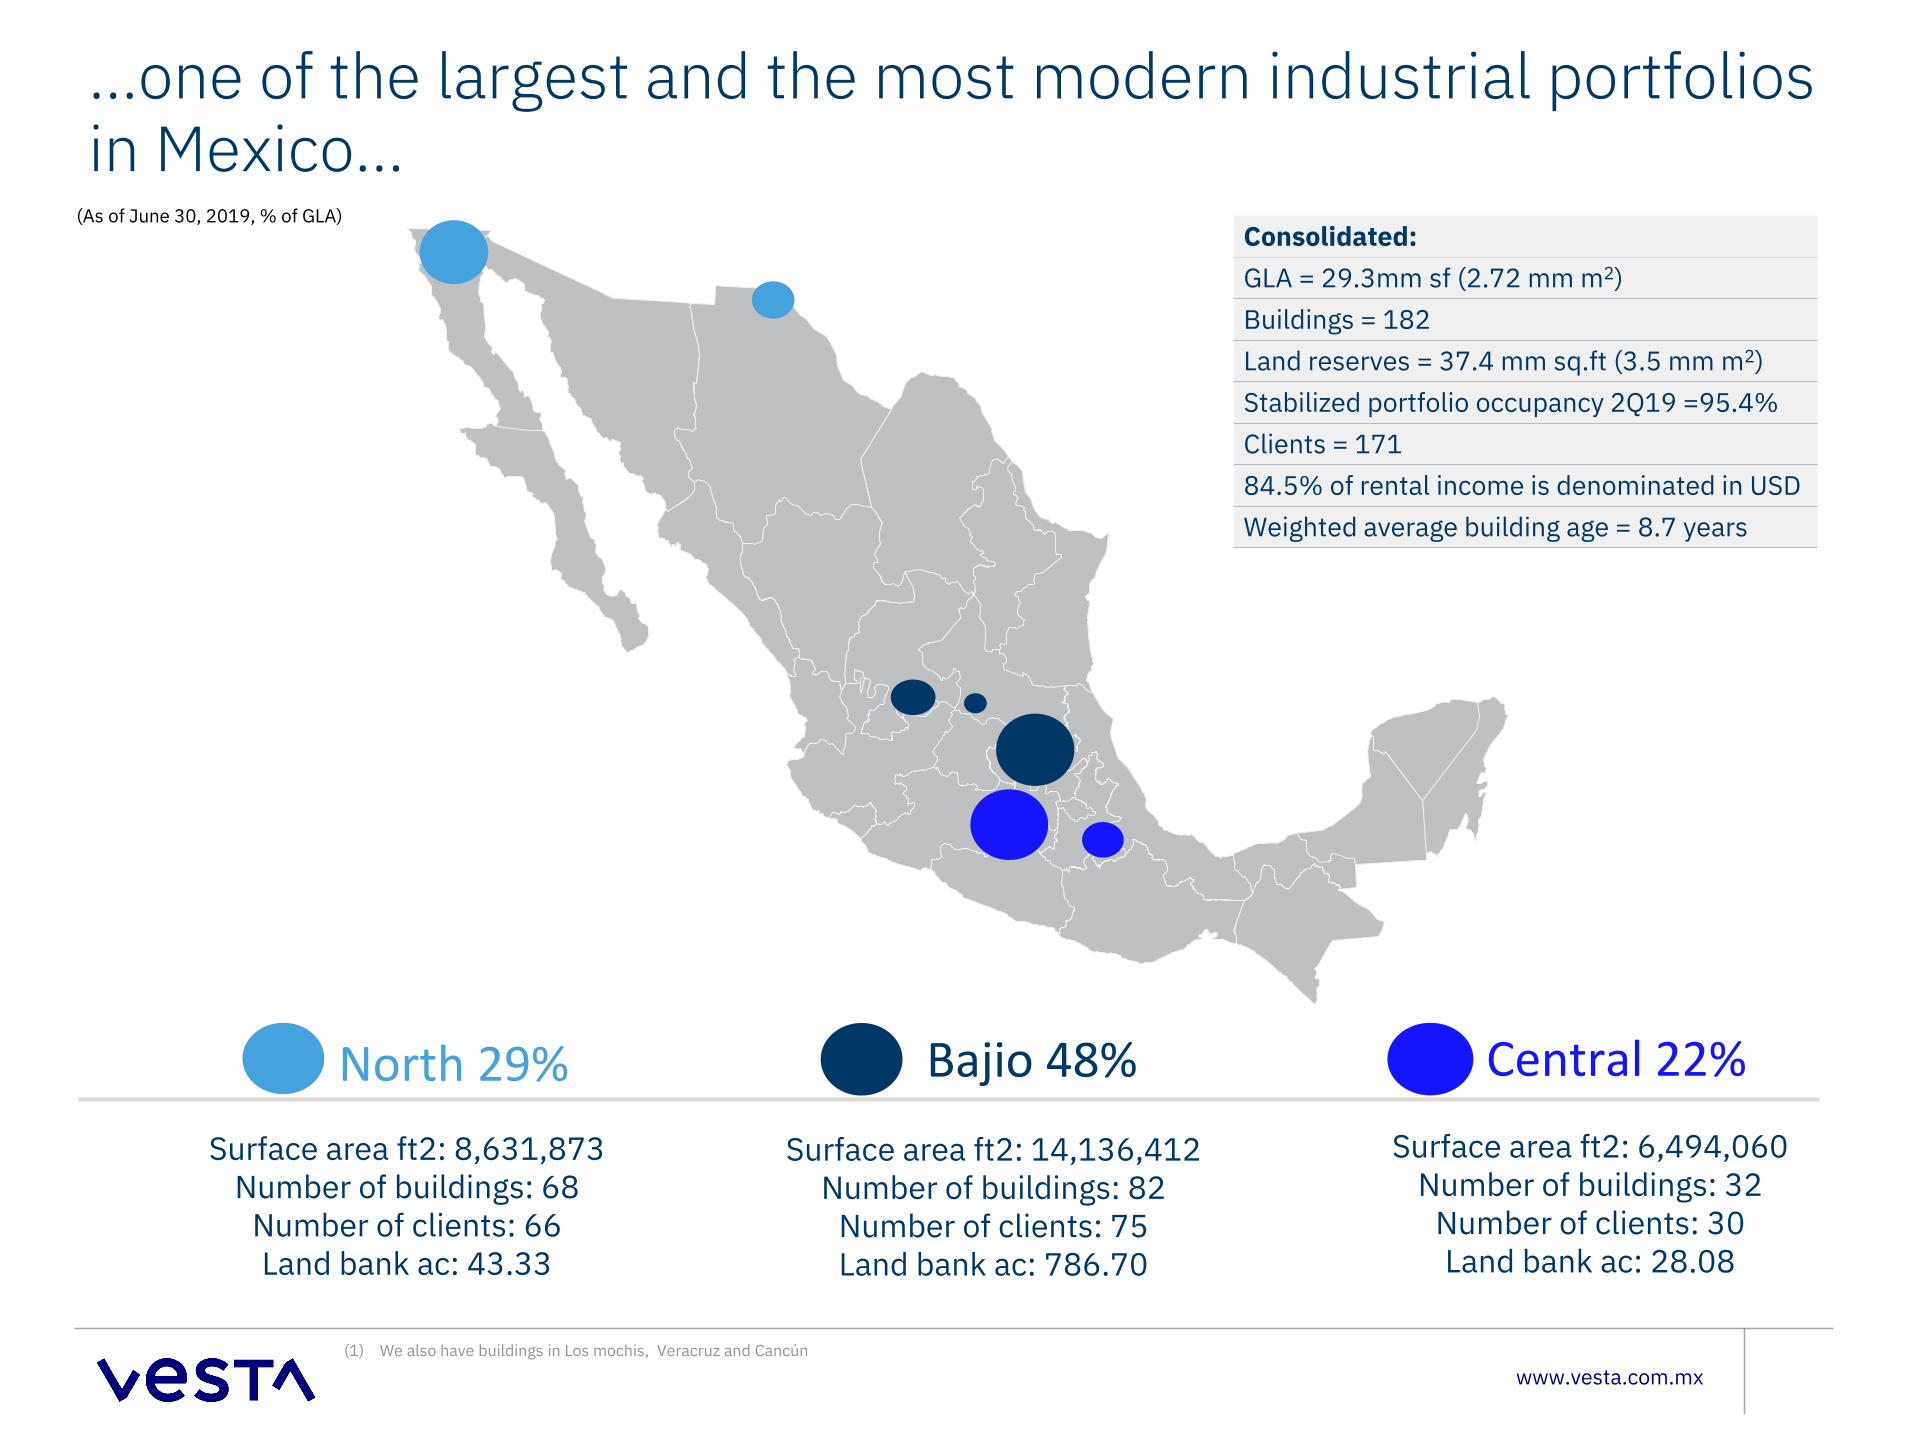
…one of the largest and the most modern industrial portfolios in Mexico…
Consolidated:GLA = 29.3mm sf (2.72 mm m2)Buildings = 182Land reserves = 37.4 mm sq.ft (3.5 mm m2)Stabilized portfolio occupancy 2Q19 =95.4%Clients = 17184.5% of rental income is denominated in USDWeighted average building age = 8.7 years
North 29% Surface area ft2: 8,631,873
Number of buildings: 68Number of clients: 66Land bank ac: 43.33
Bajio 48% Central 22% Surface area ft2: 6,494,060
Number of buildings: 32Number of clients: 30Land bank ac: 28.08
Surface area ft2: 14,136,412Number of buildings: 82
Number of clients: 75Land bank ac: 786.70
(As of June 30, 2019, % of GLA)
(1) We also have buildings in Los mochis, Veracruz and Cancún
www.vesta.com.mx
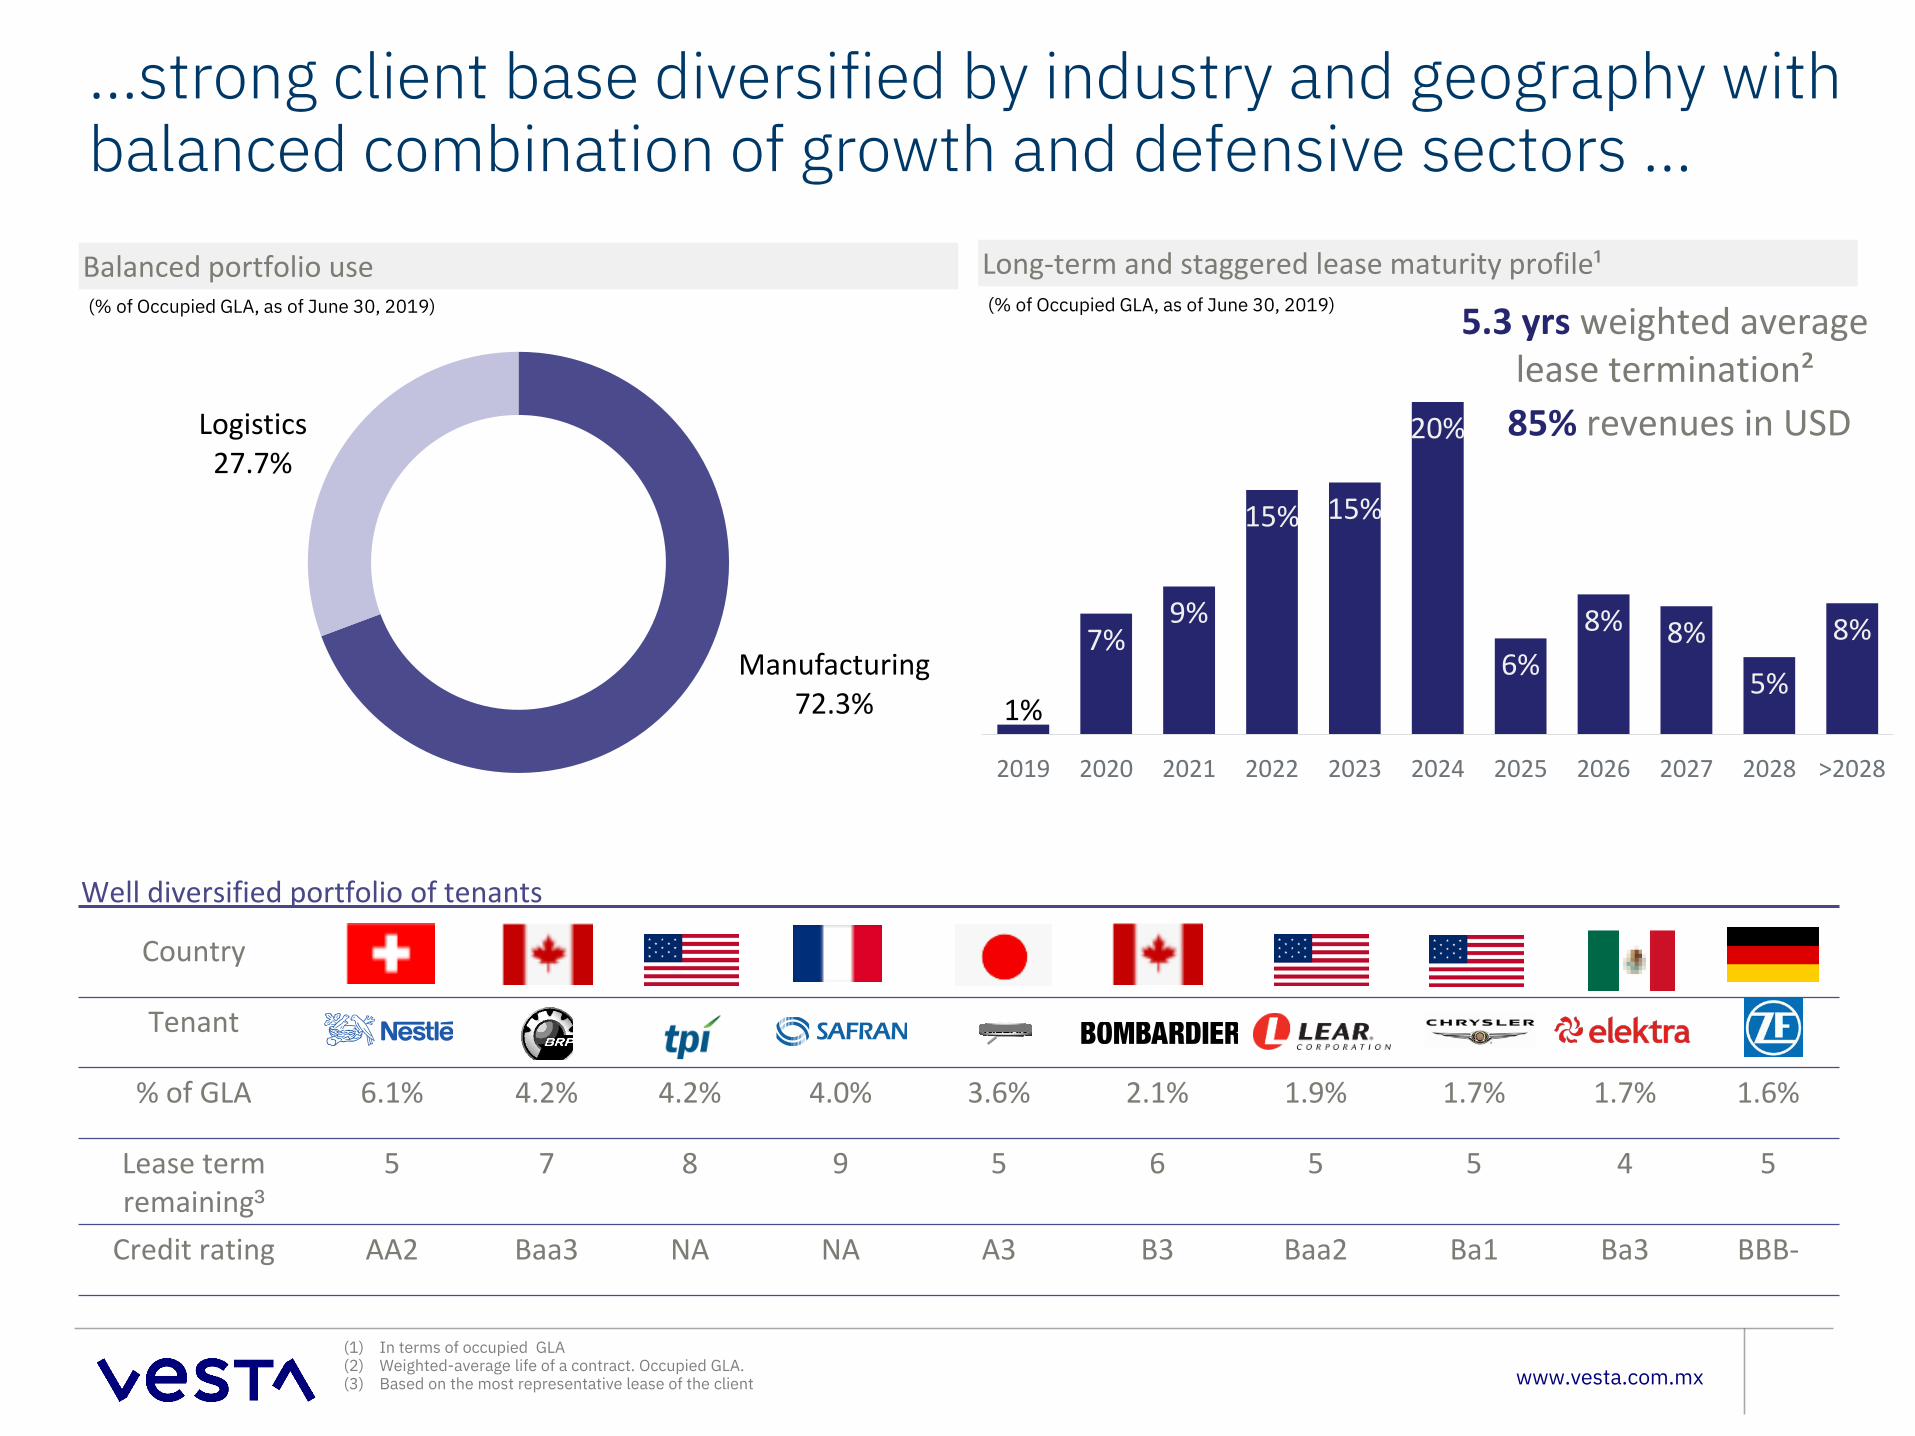
…strong client base diversified by industry and geography with balanced combination of growth and defensive sectors …Balanced portfolio use (% of Occupied GLA, as of June 30, 2019)
Long-term and staggered lease maturity profile¹(% of Occupied GLA, as of June 30, 2019)
Manufacturing72.3%
Logistics27.7%
1%
7%9%
15% 15%
20%
6%8% 8%
5%
8%
2019 2020 2021 2022 2023 2024 2025 2026 2027 2028 >2028
5.3 yrs weighted average lease termination²85% revenues in USD
Well diversified portfolio of tenants
Country
Tenant
% of GLA 6.1% 4.2% 4.2% 4.0% 3.6% 2.1% 1.9% 1.7% 1.7% 1.6%
Lease term remaining³
5 7 8 9 5 6 5 5 4 5
Credit rating AA2 Baa3 NA NA A3 B3 Baa2 Ba1 Ba3 BBB-
(1) In terms of occupied GLA(2) Weighted-average life of a contract. Occupied GLA.(3) Based on the most representative lease of the client

www.vesta.com.mx
…strong tenant credit profile…
Manufacturing72.3%
Logistics27.7%
Automotive30.7%
Aerospace8.7%
Other 16.9%Plastics 3.5%Paper 0.1%
Medical Devices 2.0%
Recreational Vehicles 5.8%
Energy 4.6%
Automotive
Aerospace
Logistics
* Calculated over total occupied GLA
www.vesta.com.mx
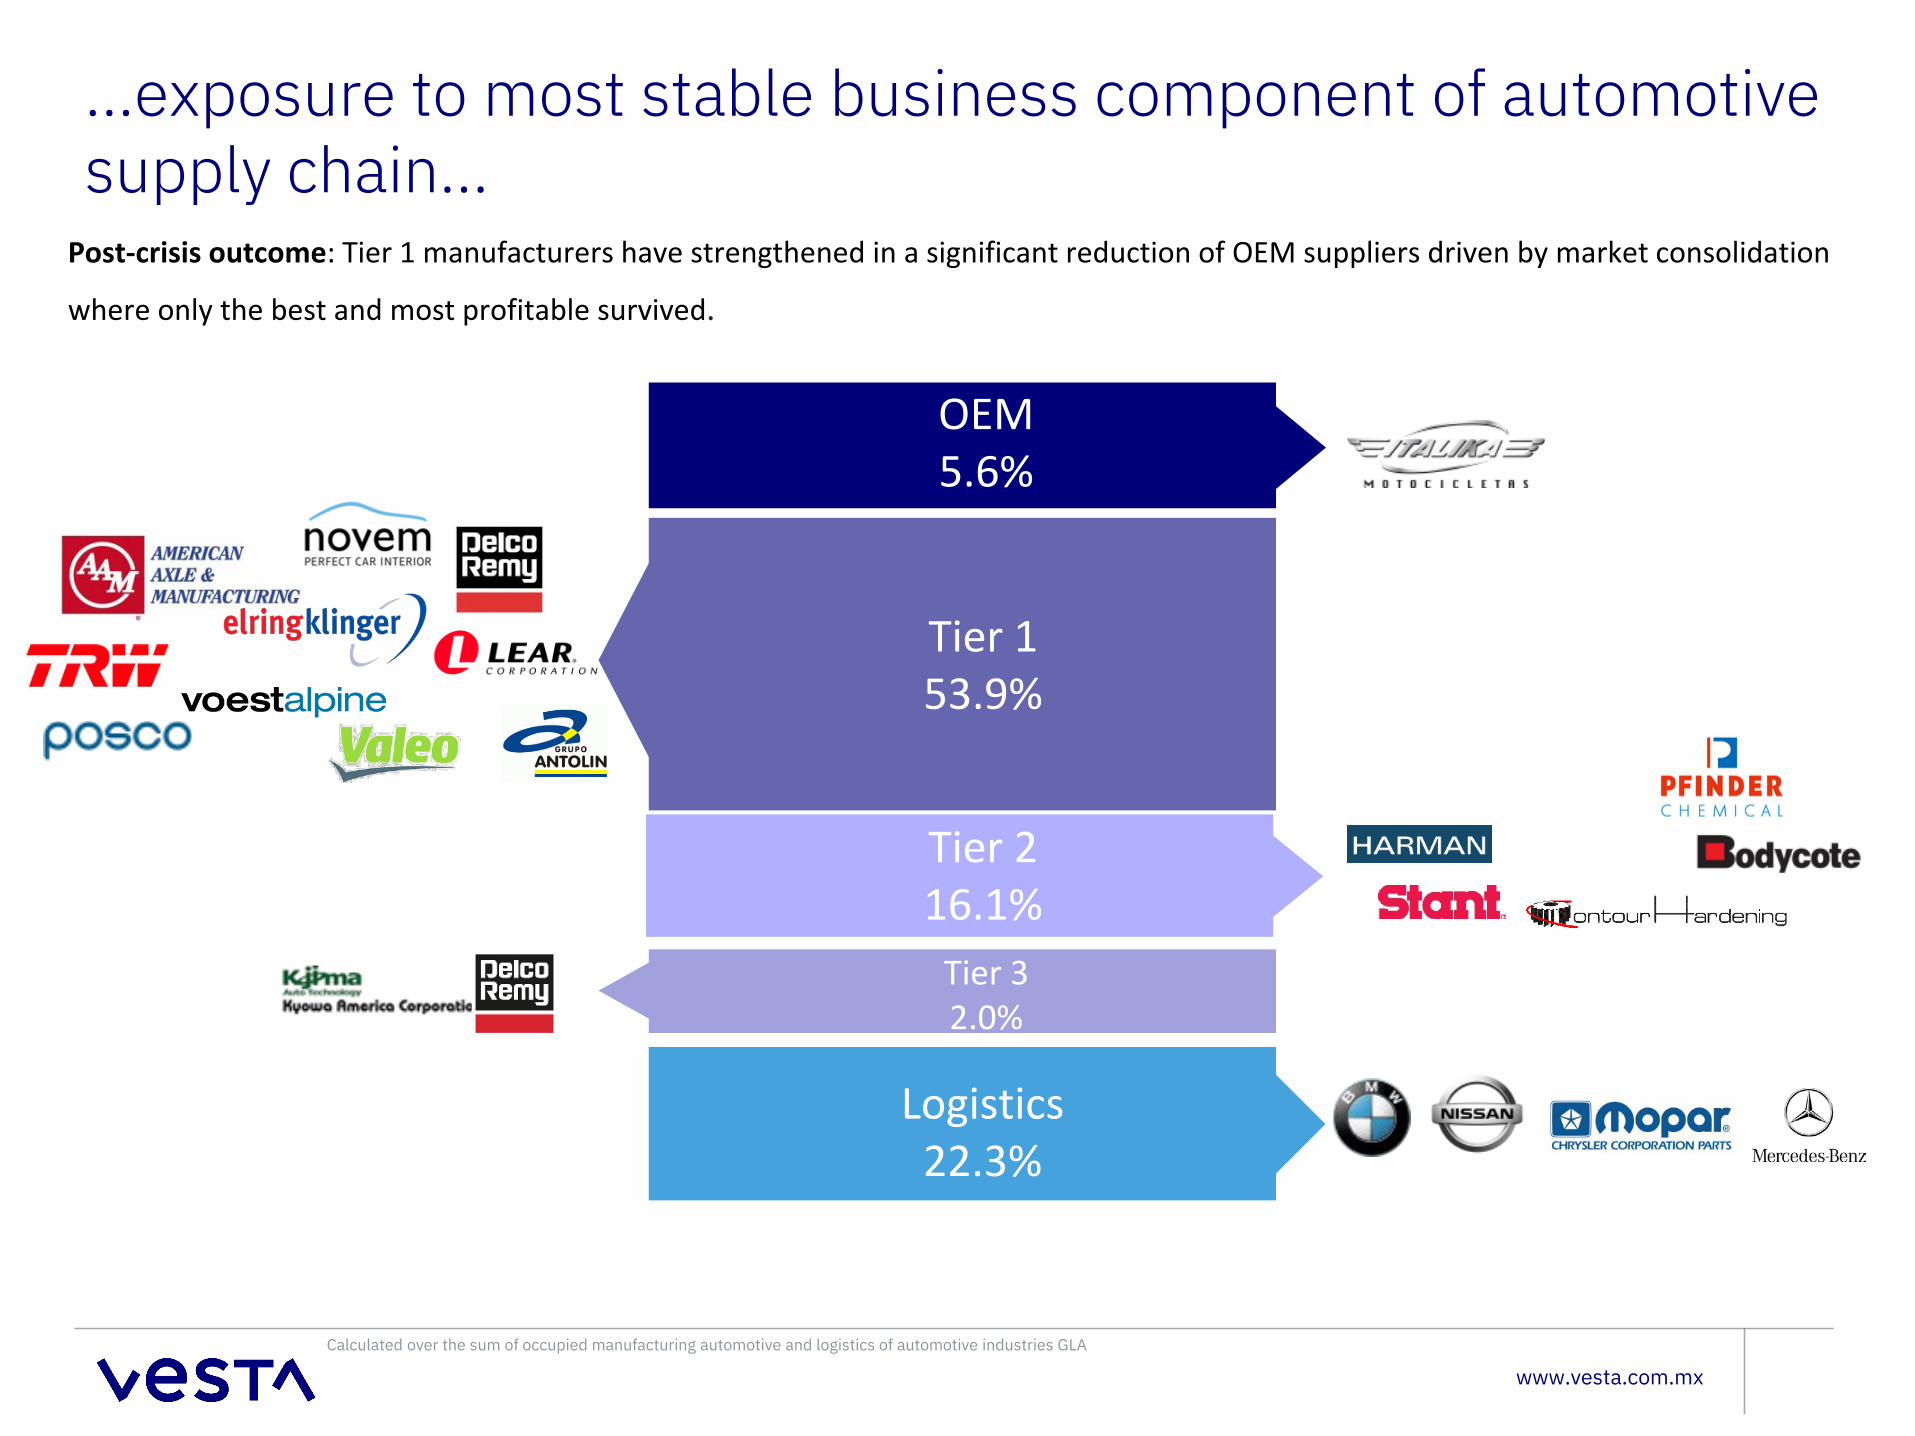
…exposure to most stable business component of automotive supply chain…
Post-crisis outcome: Tier 1 manufacturers have strengthened in a significant reduction of OEM suppliers driven by market consolidation
where only the best and most profitable survived.
OEM5.6%
Tier 153.9%
Tier 216.1%
Tier 32.0%
Logistics22.3%
Calculated over the sum of occupied manufacturing automotive and logistics of automotive industries GLA
Growth without dilution
www.vesta.com.mx
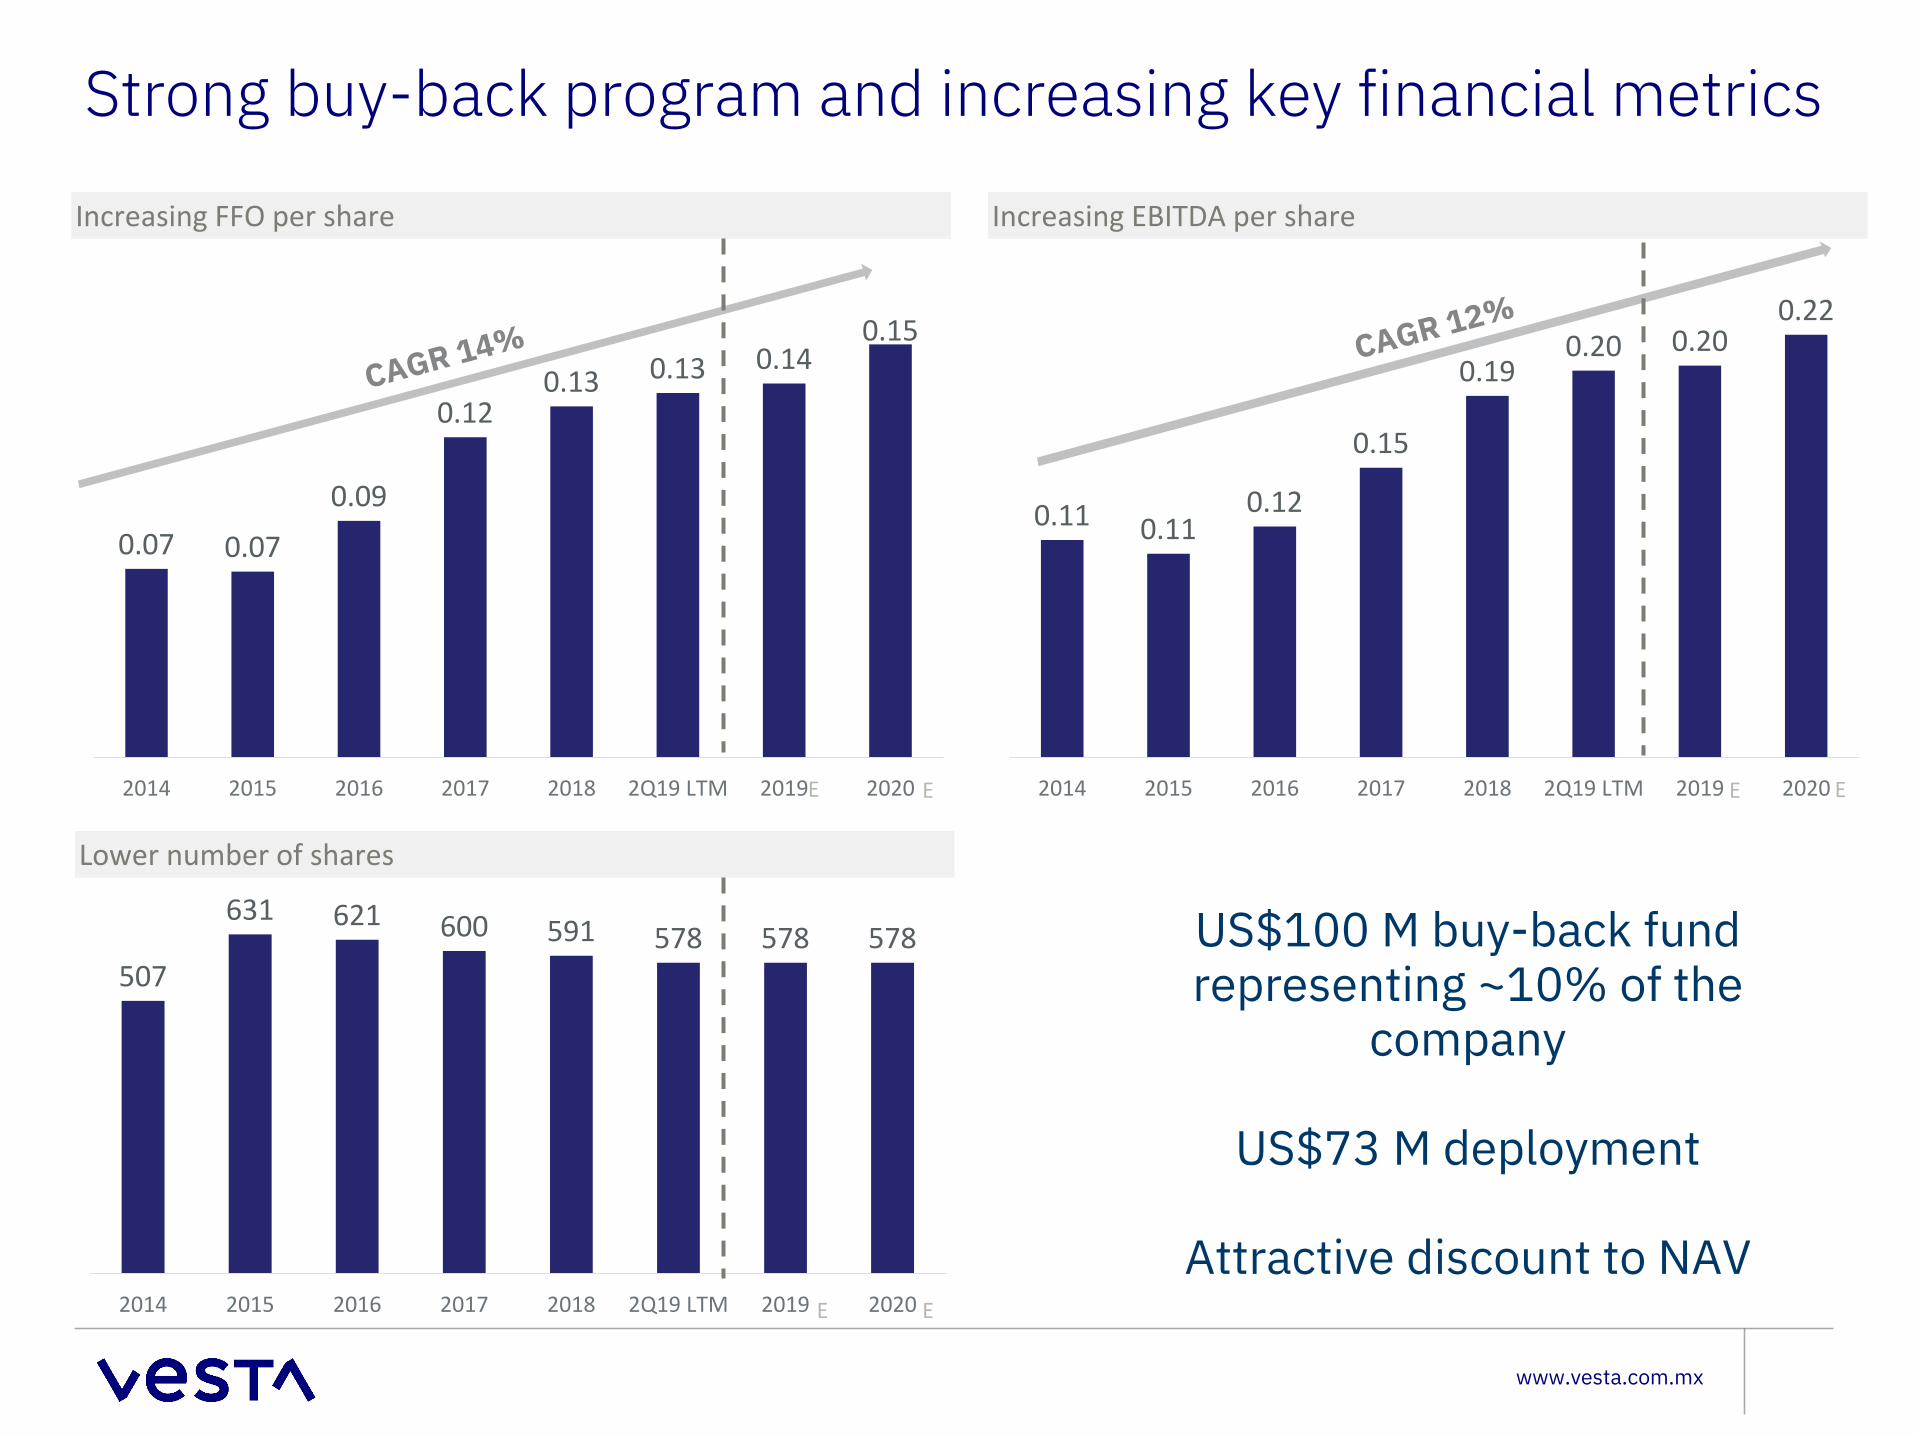
0.11 0.110.12
0.15
0.190.20 0.20
0.22
2014 2015 2016 2017 2018 2Q19 LTM 2019 2020
Strong buy-back program and increasing key financial metrics
Increasing FFO per share Increasing EBITDA per share
Lower number of shares
0.07 0.07
0.09
0.120.13 0.13 0.14
0.15
2014 2015 2016 2017 2018 2Q19 LTM 2019 2020
507
631 621 600 591 578 578 578
2014 2015 2016 2017 2018 2Q19 LTM 2019 2020
US$100 M buy-back fund representing ~10% of the
company
US$73 M deployment
Attractive discount to NAV
E E E E
E E
Increasing dividends
www.vesta.com.mx
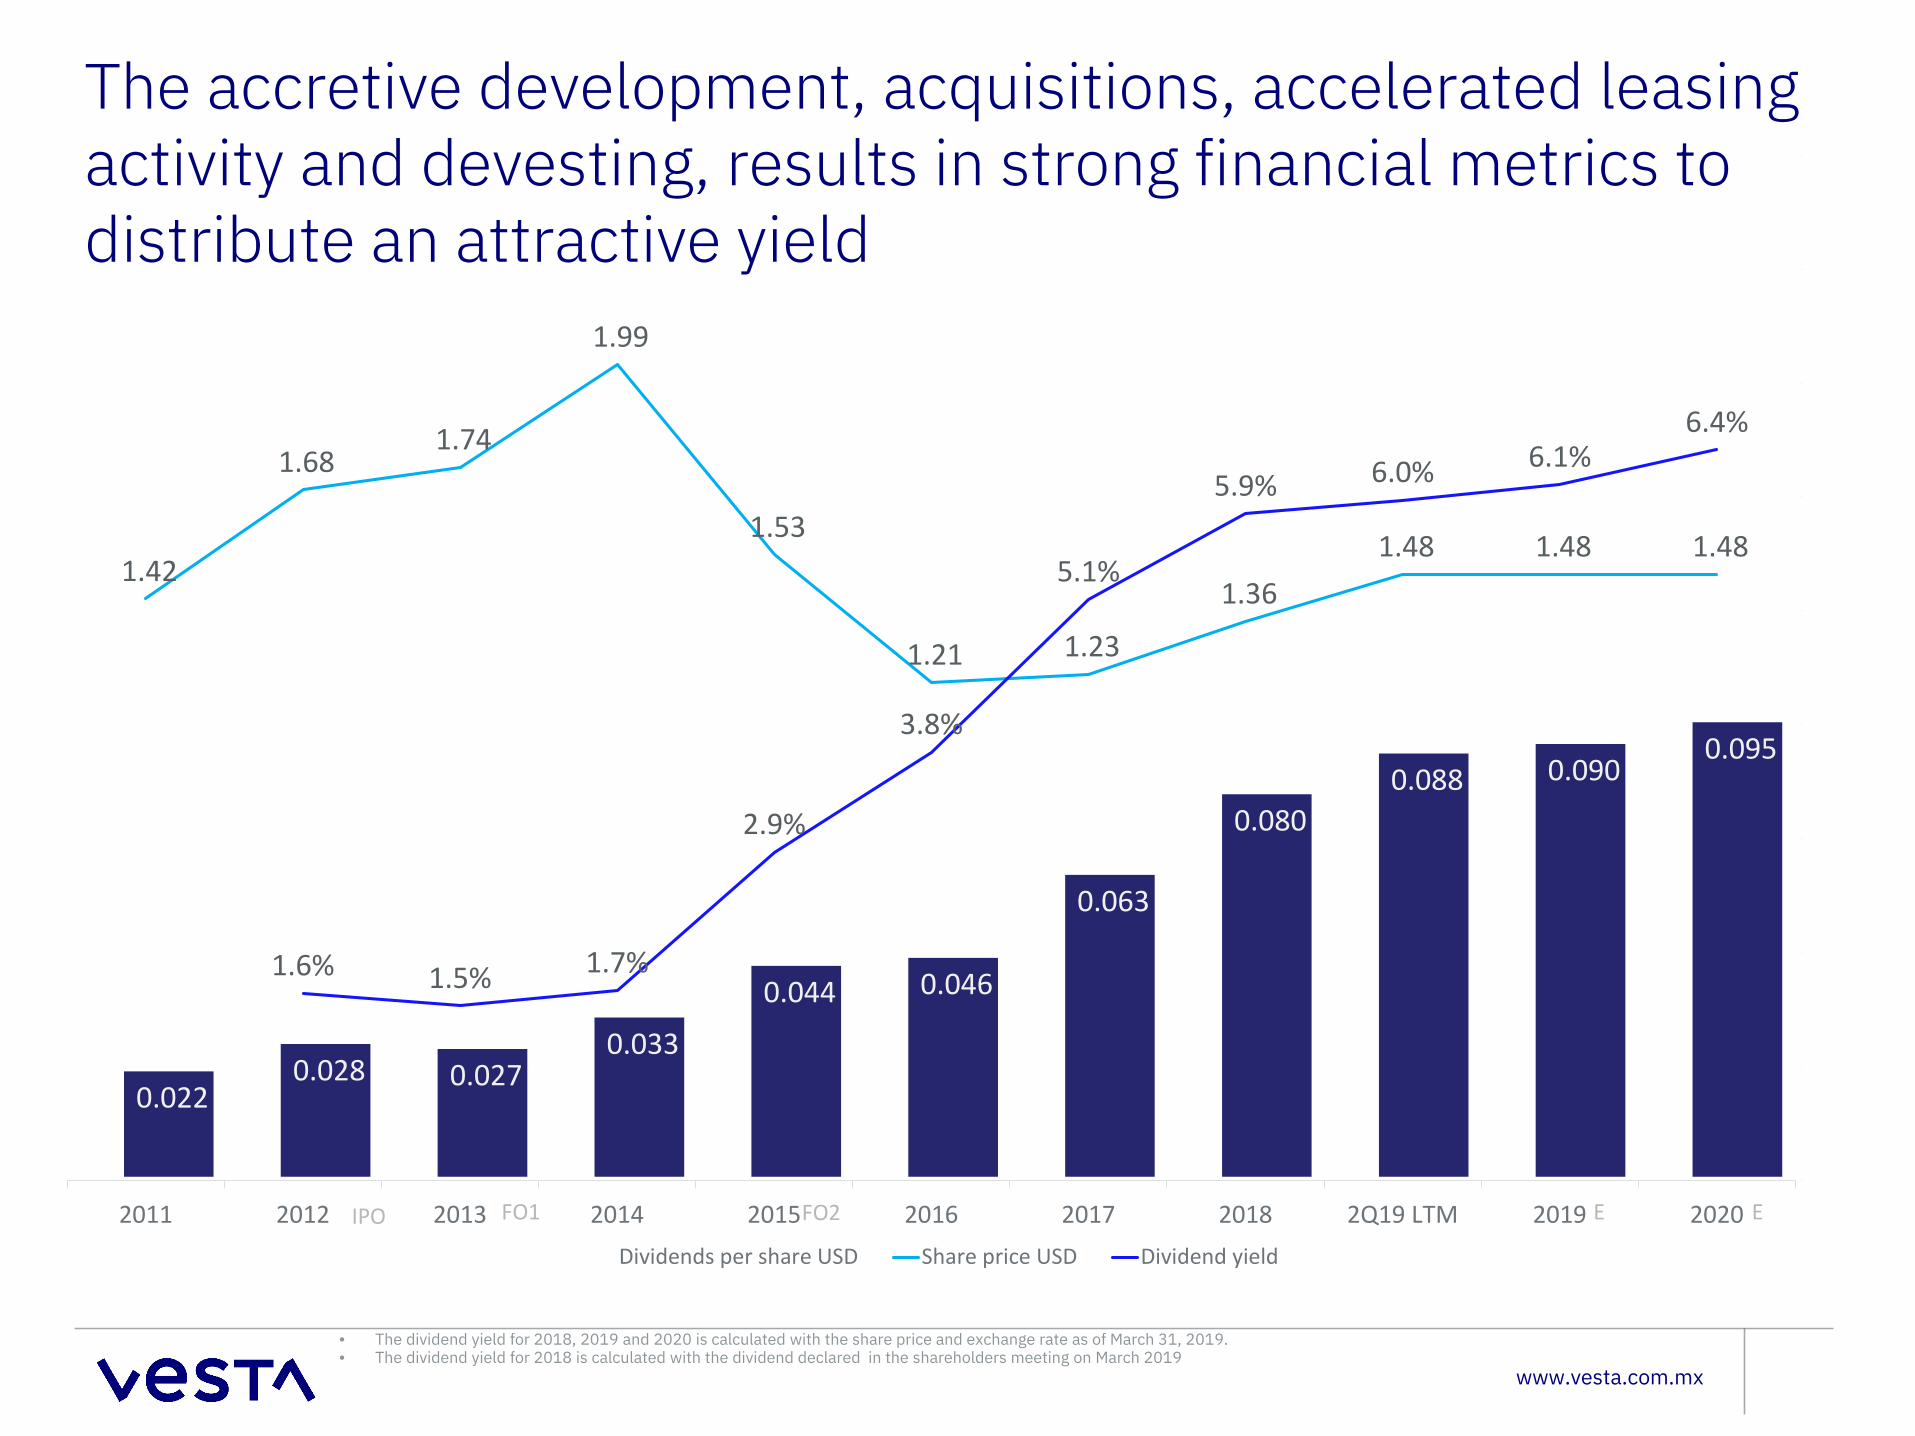
The accretive development, acquisitions, accelerated leasing activity and devesting, results in strong financial metrics to distribute an attractive yield
• The dividend yield for 2018, 2019 and 2020 is calculated with the share price and exchange rate as of March 31, 2019. • The dividend yield for 2018 is calculated with the dividend declared in the shareholders meeting on March 2019
1.42
1.68 1.74
1.99
1.53
1.21 1.23
1.36 1.48 1.48 1.48
1.6% 1.5% 1.7%
2.9%
3.8%
5.1%
5.9% 6.0% 6.1%6.4%
0.0%
1.0%
2.0%
3.0%
4.0%
5.0%
6.0%
7.0%
8.0%
9.0%
2011 2012 2013 2014 2015 2016 2017 2018 2Q19 LTM 2019 2020Dividends per share USD Share price USD Dividend yield
0.022 0.028 0.027
0.033
0.044 0.046
0.063
0.080 0.088 0.090
0.095
E EIPO FO1 FO2
Maximizing our stabilized portfolio
www.vesta.com.mx
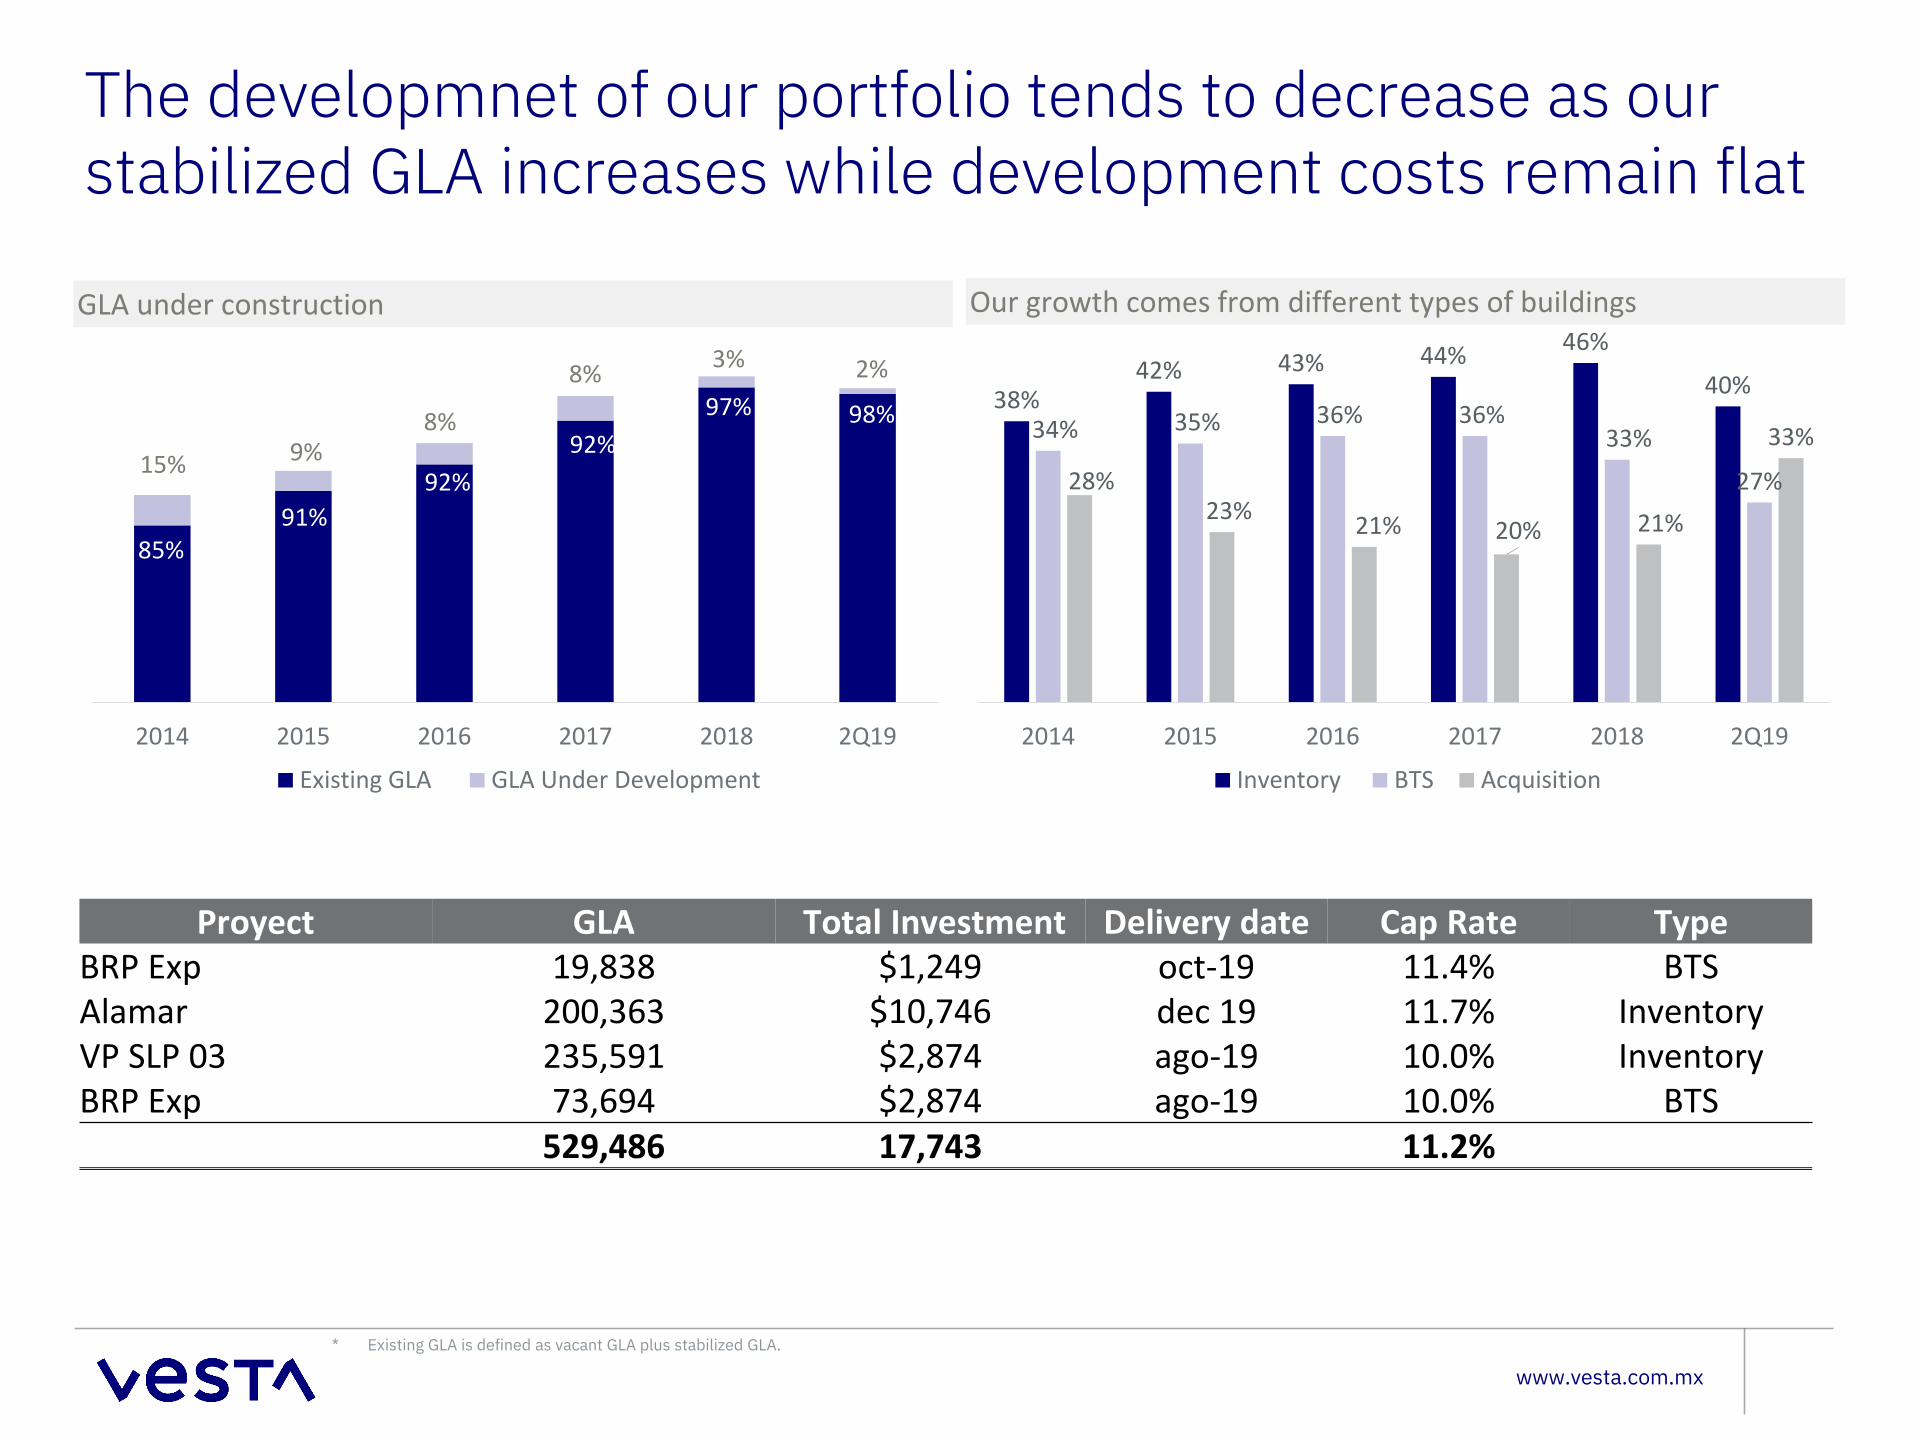
The developmnet of our portfolio tends to decrease as our stabilized GLA increases while development costs remain flat
GLA under construction Our growth comes from different types of buildings
* Existing GLA is defined as vacant GLA plus stabilized GLA.
2014 2015 2016 2017 2018 2Q19
Existing GLA GLA Under Development
85%91%
92%92%
97% 98%
15% 9%8%
8% 3% 2%38%
42% 43% 44% 46%
40%
34% 35% 36% 36%33%
27%28%23% 21% 20% 21%
33%
2014 2015 2016 2017 2018 2Q19
Inventory BTS Acquisition
Proyect GLA Total Investment Delivery date Cap Rate Type BRP Exp 19,838 $1,249 oct-19 11.4% BTSAlamar 200,363 $10,746 dec 19 11.7% InventoryVP SLP 03 235,591 $2,874 ago-19 10.0% InventoryBRP Exp 73,694 $2,874 ago-19 10.0% BTS
529,486 17,743 11.2%

Attractive discount
www.vesta.com.mx
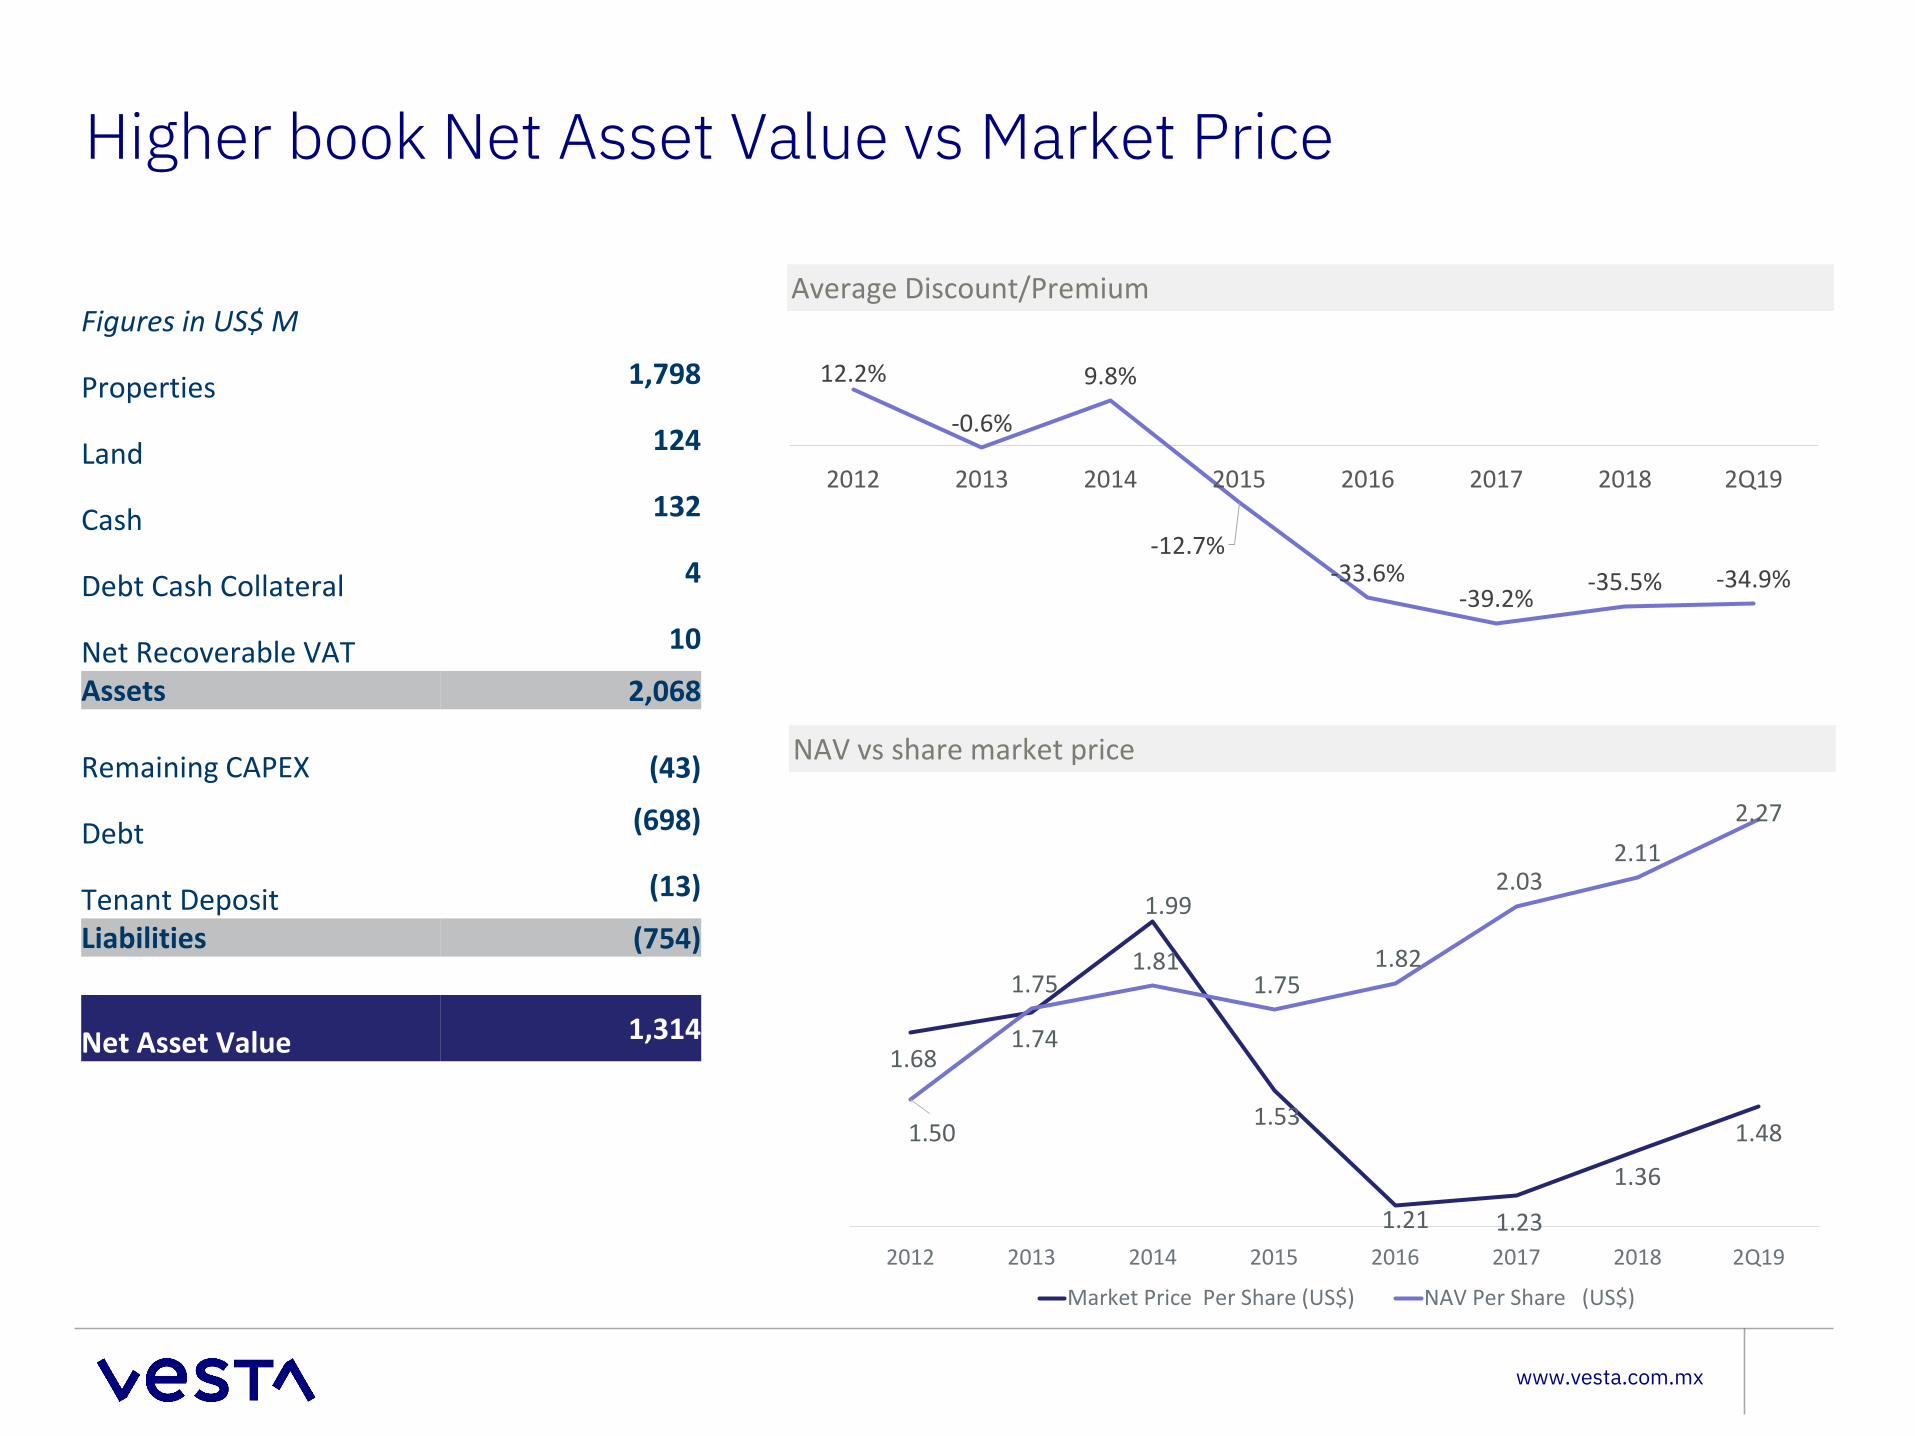
Higher book Net Asset Value vs Market Price
12.2%
-0.6%
9.8%
-12.7%-33.6%
-39.2% -35.5% -34.9%
2012 2013 2014 2015 2016 2017 2018 2Q19
Average Discount/Premium
NAV vs share market price
1.68 1.74
1.99
1.53
1.21 1.23
1.36
1.481.50
1.75 1.81
1.75 1.82
2.03 2.11
2.27
2012 2013 2014 2015 2016 2017 2018 2Q19
Market Price Per Share (US$) NAV Per Share (US$)
Figures in US$ M
Properties 1,798
Land 124
Cash 132
Debt Cash Collateral 4
Net Recoverable VAT 10
Assets 2,068
Remaining CAPEX (43)
Debt (698)
Tenant Deposit (13)
Liabilities (754)
Net Asset Value 1,314
www.vesta.com.mx
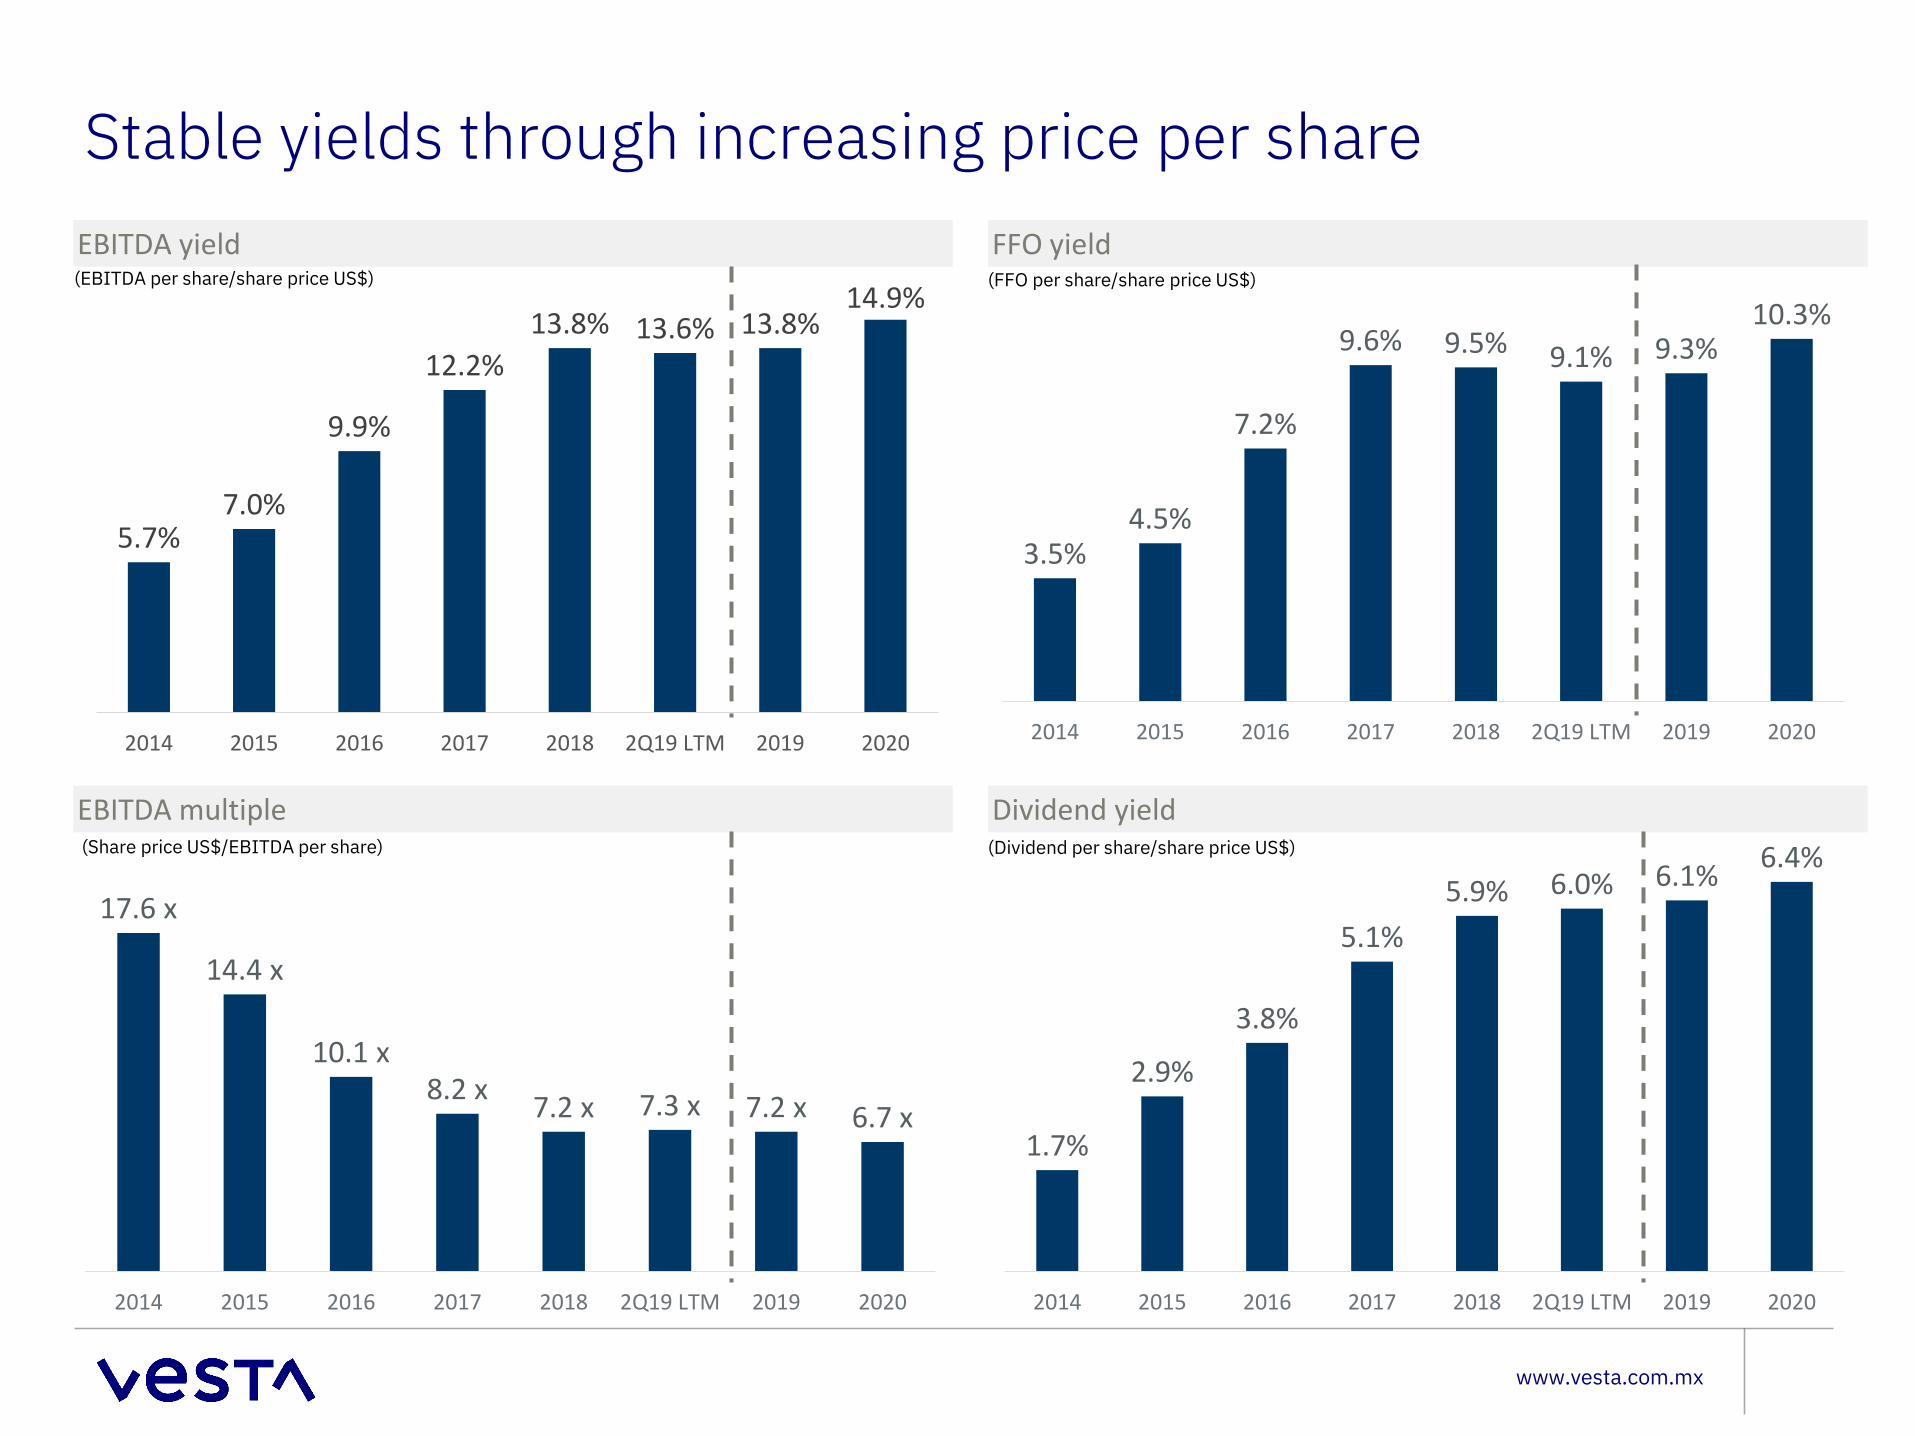
Stable yields through increasing price per shareEBITDA yield
Dividend yield
FFO yield
EBITDA multiple
(FFO per share/share price US$)
(Dividend per share/share price US$)(Share price US$/EBITDA per share)
(EBITDA per share/share price US$)
5.7%7.0%
9.9%
12.2%13.8% 13.6% 13.8%
14.9%
2014 2015 2016 2017 2018 2Q19 LTM 2019 2020
3.5%4.5%
7.2%
9.6% 9.5% 9.1% 9.3%10.3%
2014 2015 2016 2017 2018 2Q19 LTM 2019 2020
17.6 x
14.4 x
10.1 x 8.2 x 7.2 x 7.3 x 7.2 x 6.7 x
2014 2015 2016 2017 2018 2Q19 LTM 2019 2020
1.7%
2.9%
3.8%
5.1%5.9% 6.0% 6.1% 6.4%
2014 2015 2016 2017 2018 2Q19 LTM 2019 2020
Appendix
www.vesta.com.mx
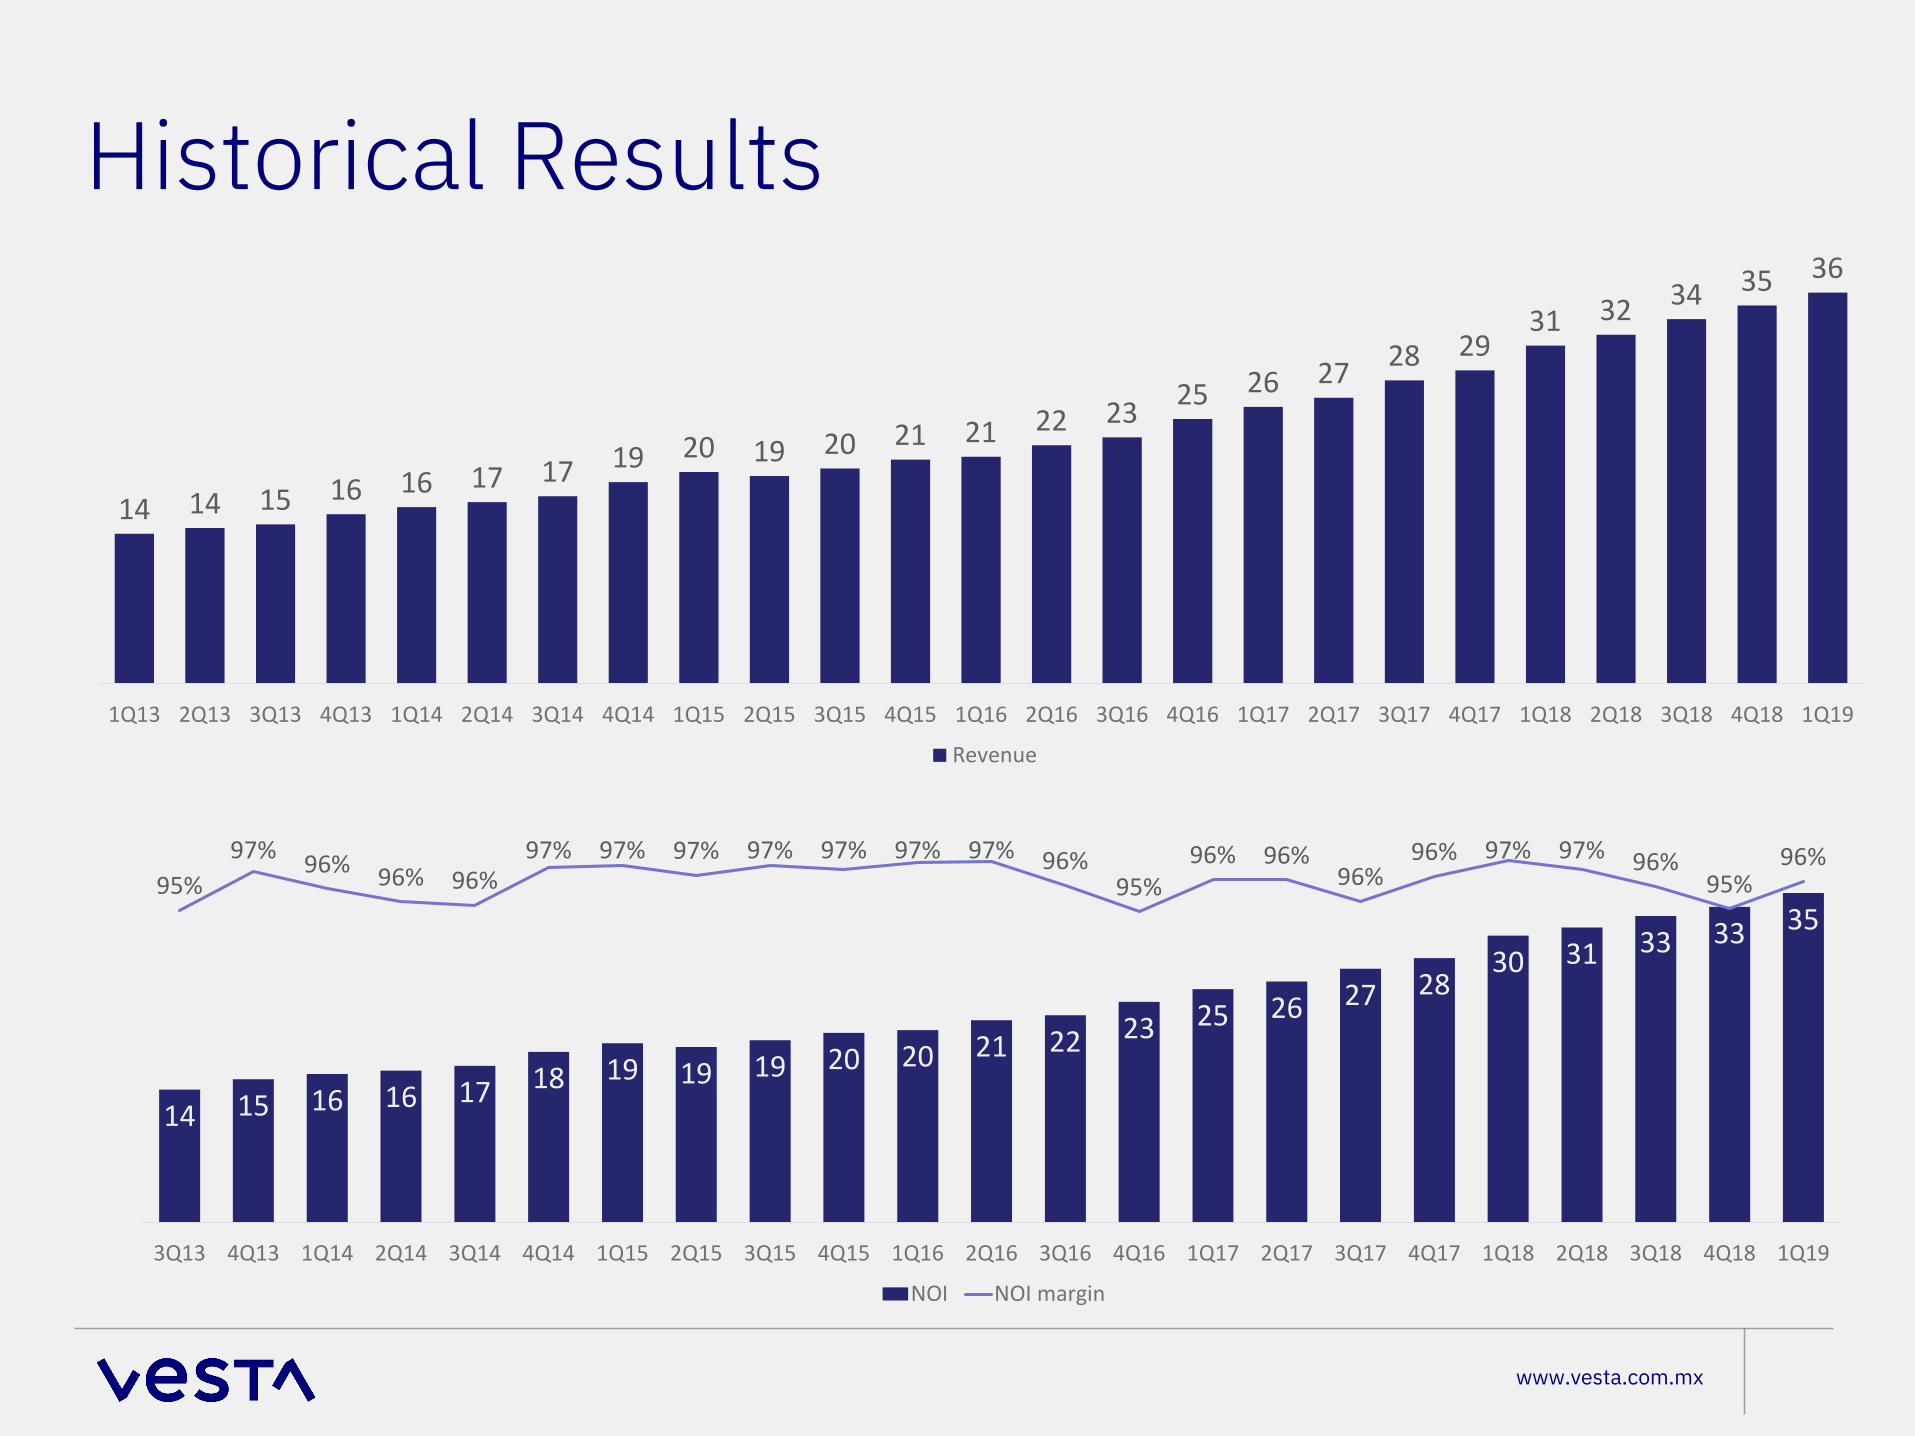
Historical Results
14 14 15 16 16 17 17 19 20 19 20 21 21 22 23 25 26 27 28 2931 32 34 35 36
1Q13 2Q13 3Q13 4Q13 1Q14 2Q14 3Q14 4Q14 1Q15 2Q15 3Q15 4Q15 1Q16 2Q16 3Q16 4Q16 1Q17 2Q17 3Q17 4Q17 1Q18 2Q18 3Q18 4Q18 1Q19
Revenue
14 15 16 16 17 18 19 19 19 20 20 21 22 23 25 26 27 2830 31 33 33 35
95%97% 96% 96% 96%
97% 97% 97% 97% 97% 97% 97% 96%95%
96% 96%96%
96% 97% 97% 96%95%
96%
85. 0%
87. 0%
89. 0%
91. 0%
93. 0%
95. 0%
97. 0%
3Q13 4Q13 1Q14 2Q14 3Q14 4Q14 1Q15 2Q15 3Q15 4Q15 1Q16 2Q16 3Q16 4Q16 1Q17 2Q17 3Q17 4Q17 1Q18 2Q18 3Q18 4Q18 1Q19
NOI NOI margin
www.vesta.com.mx
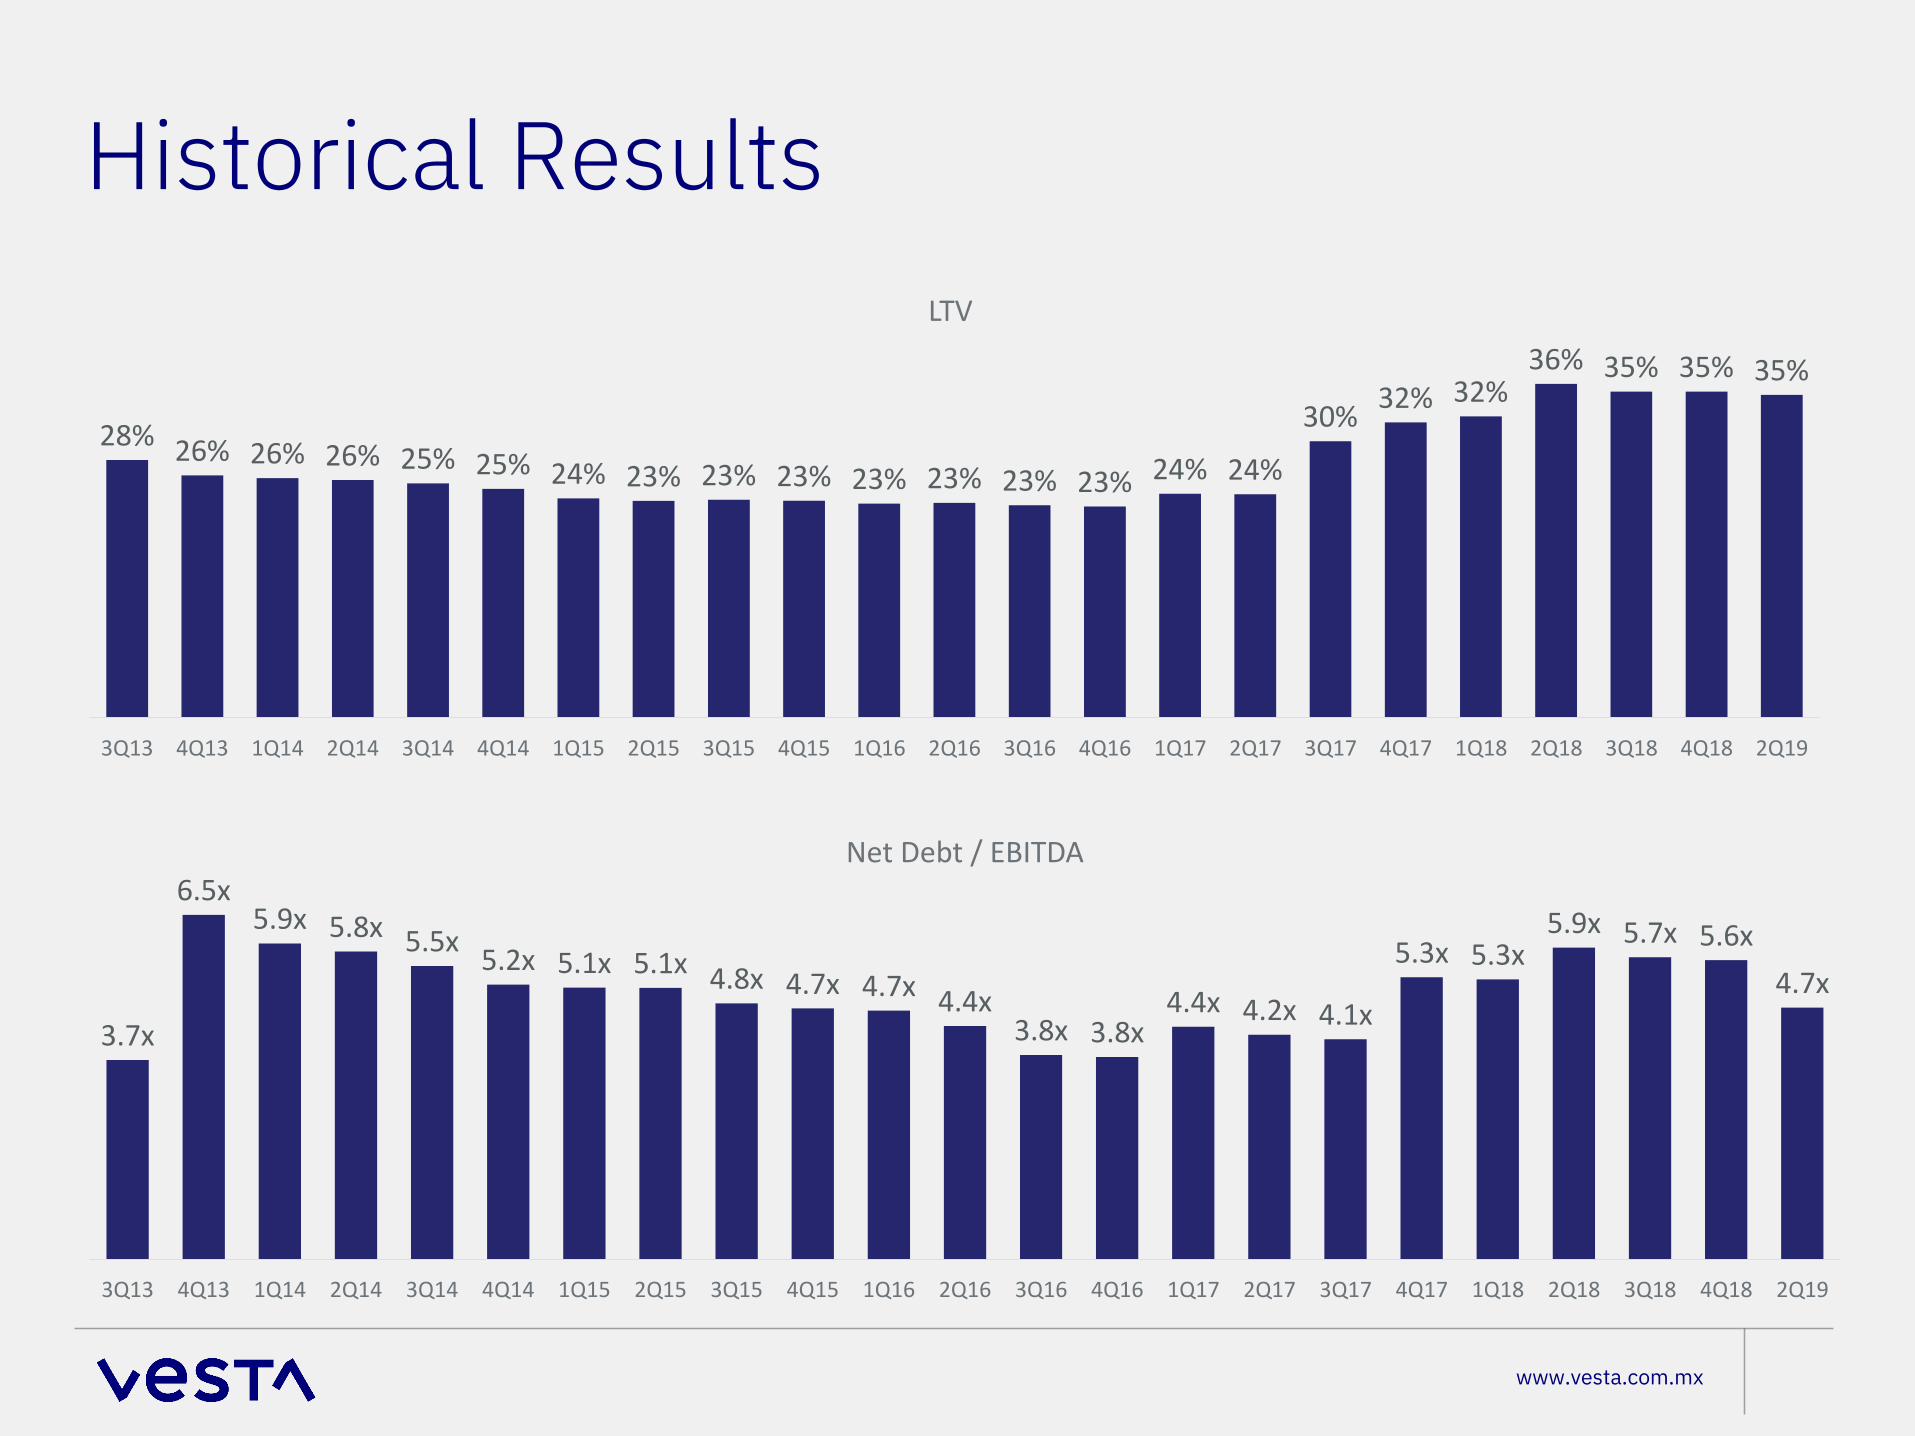
Historical Results
28% 26% 26% 26% 25% 25% 24% 23% 23% 23% 23% 23% 23% 23% 24% 24%
30% 32% 32%36% 35% 35% 35%
3Q13 4Q13 1Q14 2Q14 3Q14 4Q14 1Q15 2Q15 3Q15 4Q15 1Q16 2Q16 3Q16 4Q16 1Q17 2Q17 3Q17 4Q17 1Q18 2Q18 3Q18 4Q18 2Q19
LTV
3.7x
6.5x5.9x 5.8x 5.5x 5.2x 5.1x 5.1x 4.8x 4.7x 4.7x 4.4x
3.8x 3.8x4.4x 4.2x 4.1x
5.3x 5.3x5.9x 5.7x 5.6x
4.7x
3Q13 4Q13 1Q14 2Q14 3Q14 4Q14 1Q15 2Q15 3Q15 4Q15 1Q16 2Q16 3Q16 4Q16 1Q17 2Q17 3Q17 4Q17 1Q18 2Q18 3Q18 4Q18 2Q19
Net Debt / EBITDA
www.vesta.com.mx
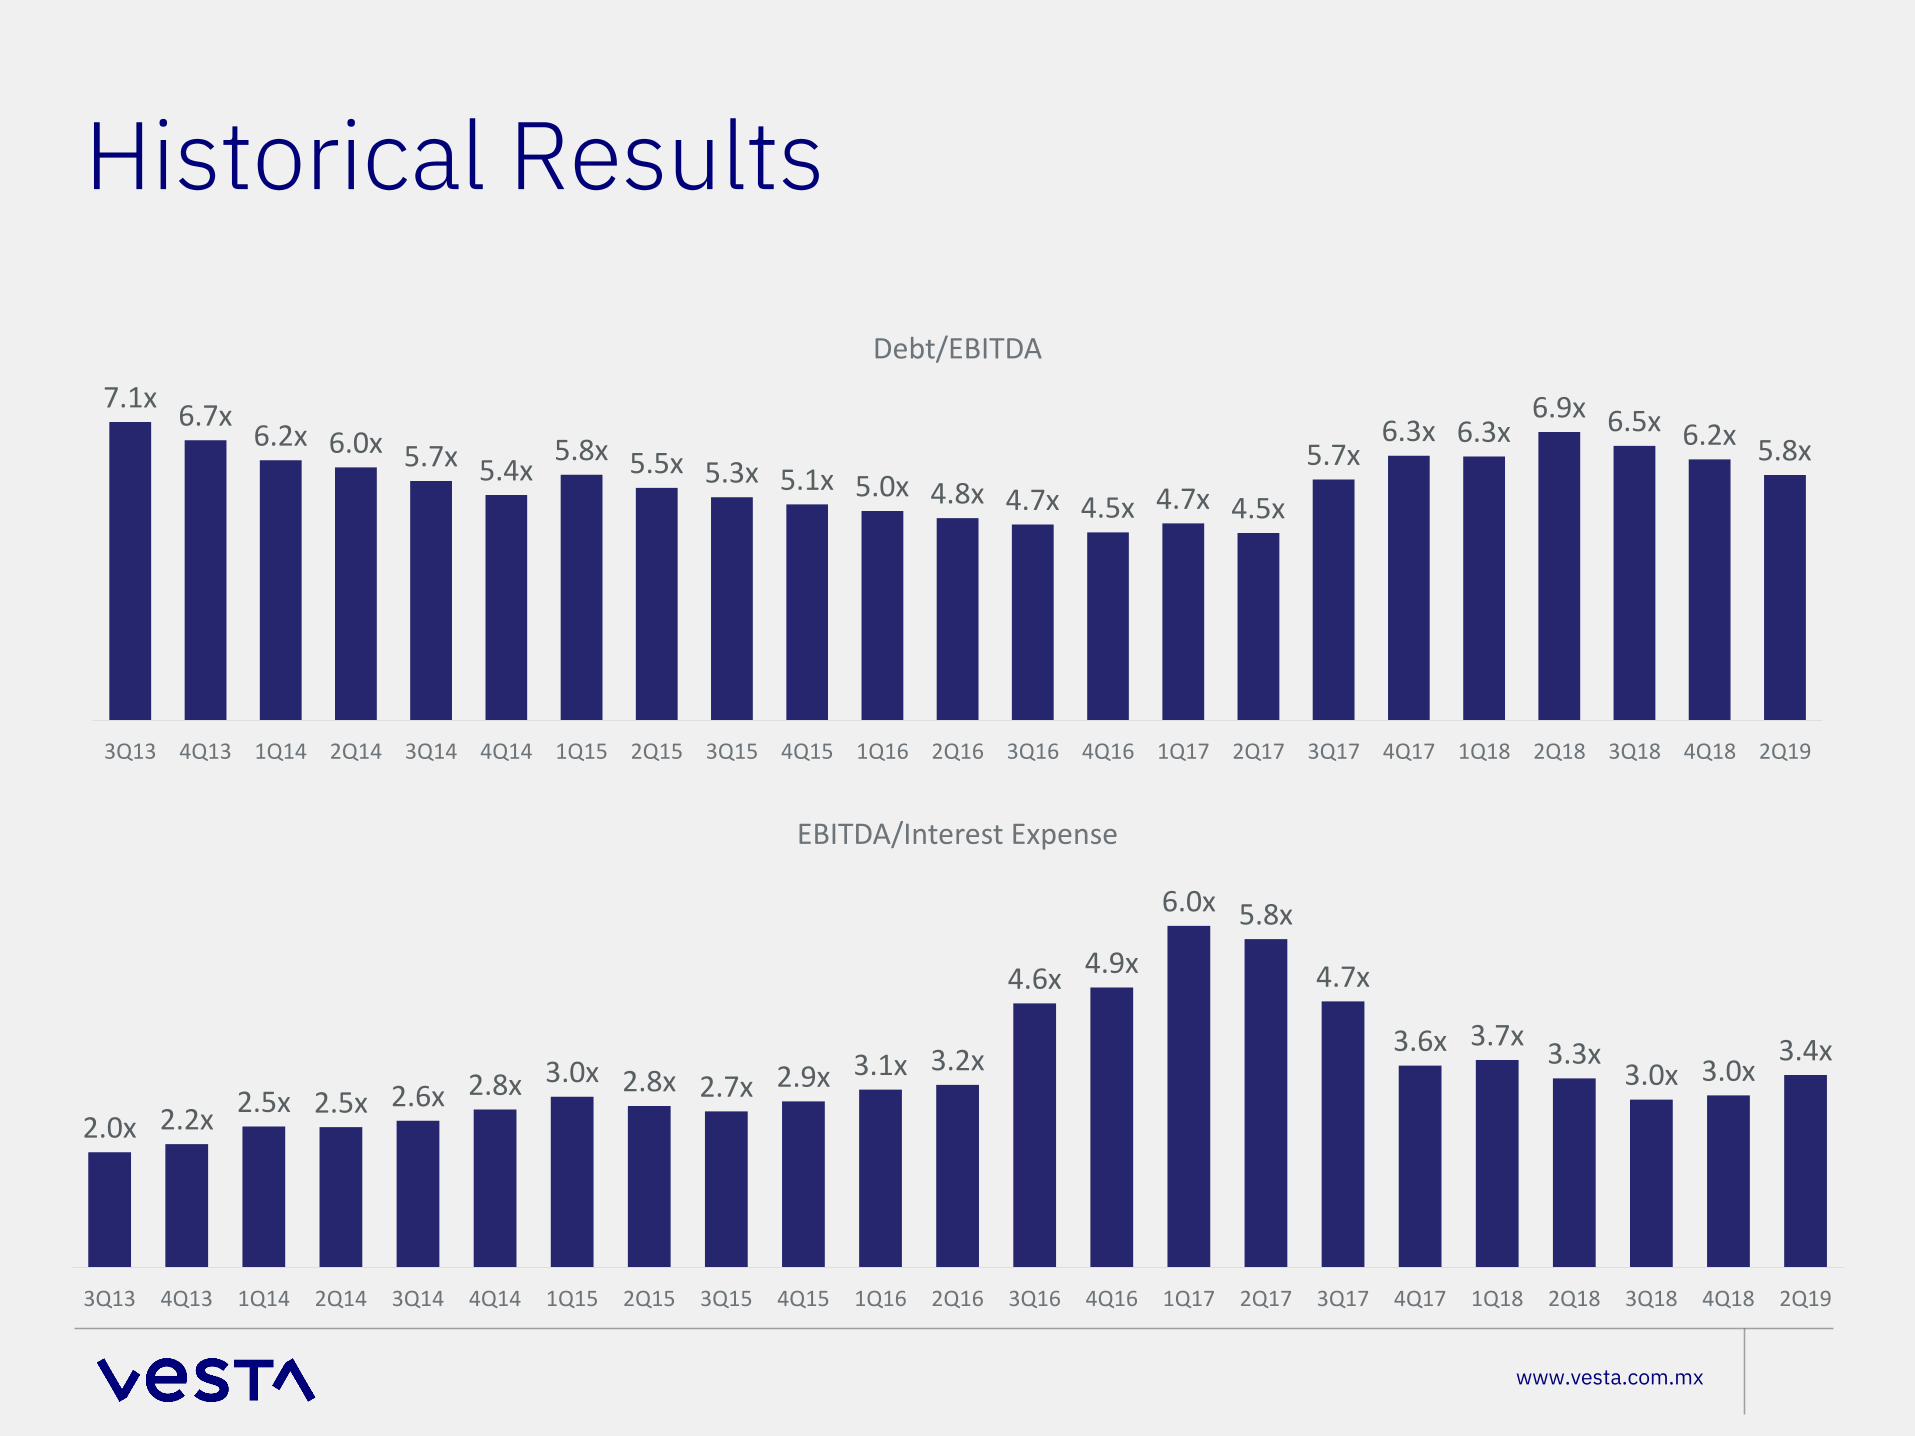
Historical Results
7.1x 6.7x 6.2x 6.0x 5.7x 5.4x5.8x 5.5x 5.3x 5.1x 5.0x 4.8x 4.7x 4.5x 4.7x 4.5x
5.7x6.3x 6.3x
6.9x 6.5x 6.2x 5.8x
3Q13 4Q13 1Q14 2Q14 3Q14 4Q14 1Q15 2Q15 3Q15 4Q15 1Q16 2Q16 3Q16 4Q16 1Q17 2Q17 3Q17 4Q17 1Q18 2Q18 3Q18 4Q18 2Q19
Debt/EBITDA
2.0x 2.2x 2.5x 2.5x 2.6x 2.8x 3.0x 2.8x 2.7x 2.9x 3.1x 3.2x
4.6x 4.9x
6.0x 5.8x
4.7x
3.6x 3.7x 3.3x3.0x 3.0x
3.4x
3Q13 4Q13 1Q14 2Q14 3Q14 4Q14 1Q15 2Q15 3Q15 4Q15 1Q16 2Q16 3Q16 4Q16 1Q17 2Q17 3Q17 4Q17 1Q18 2Q18 3Q18 4Q18 2Q19
EBITDA/Interest Expense
www.vesta.com.mx
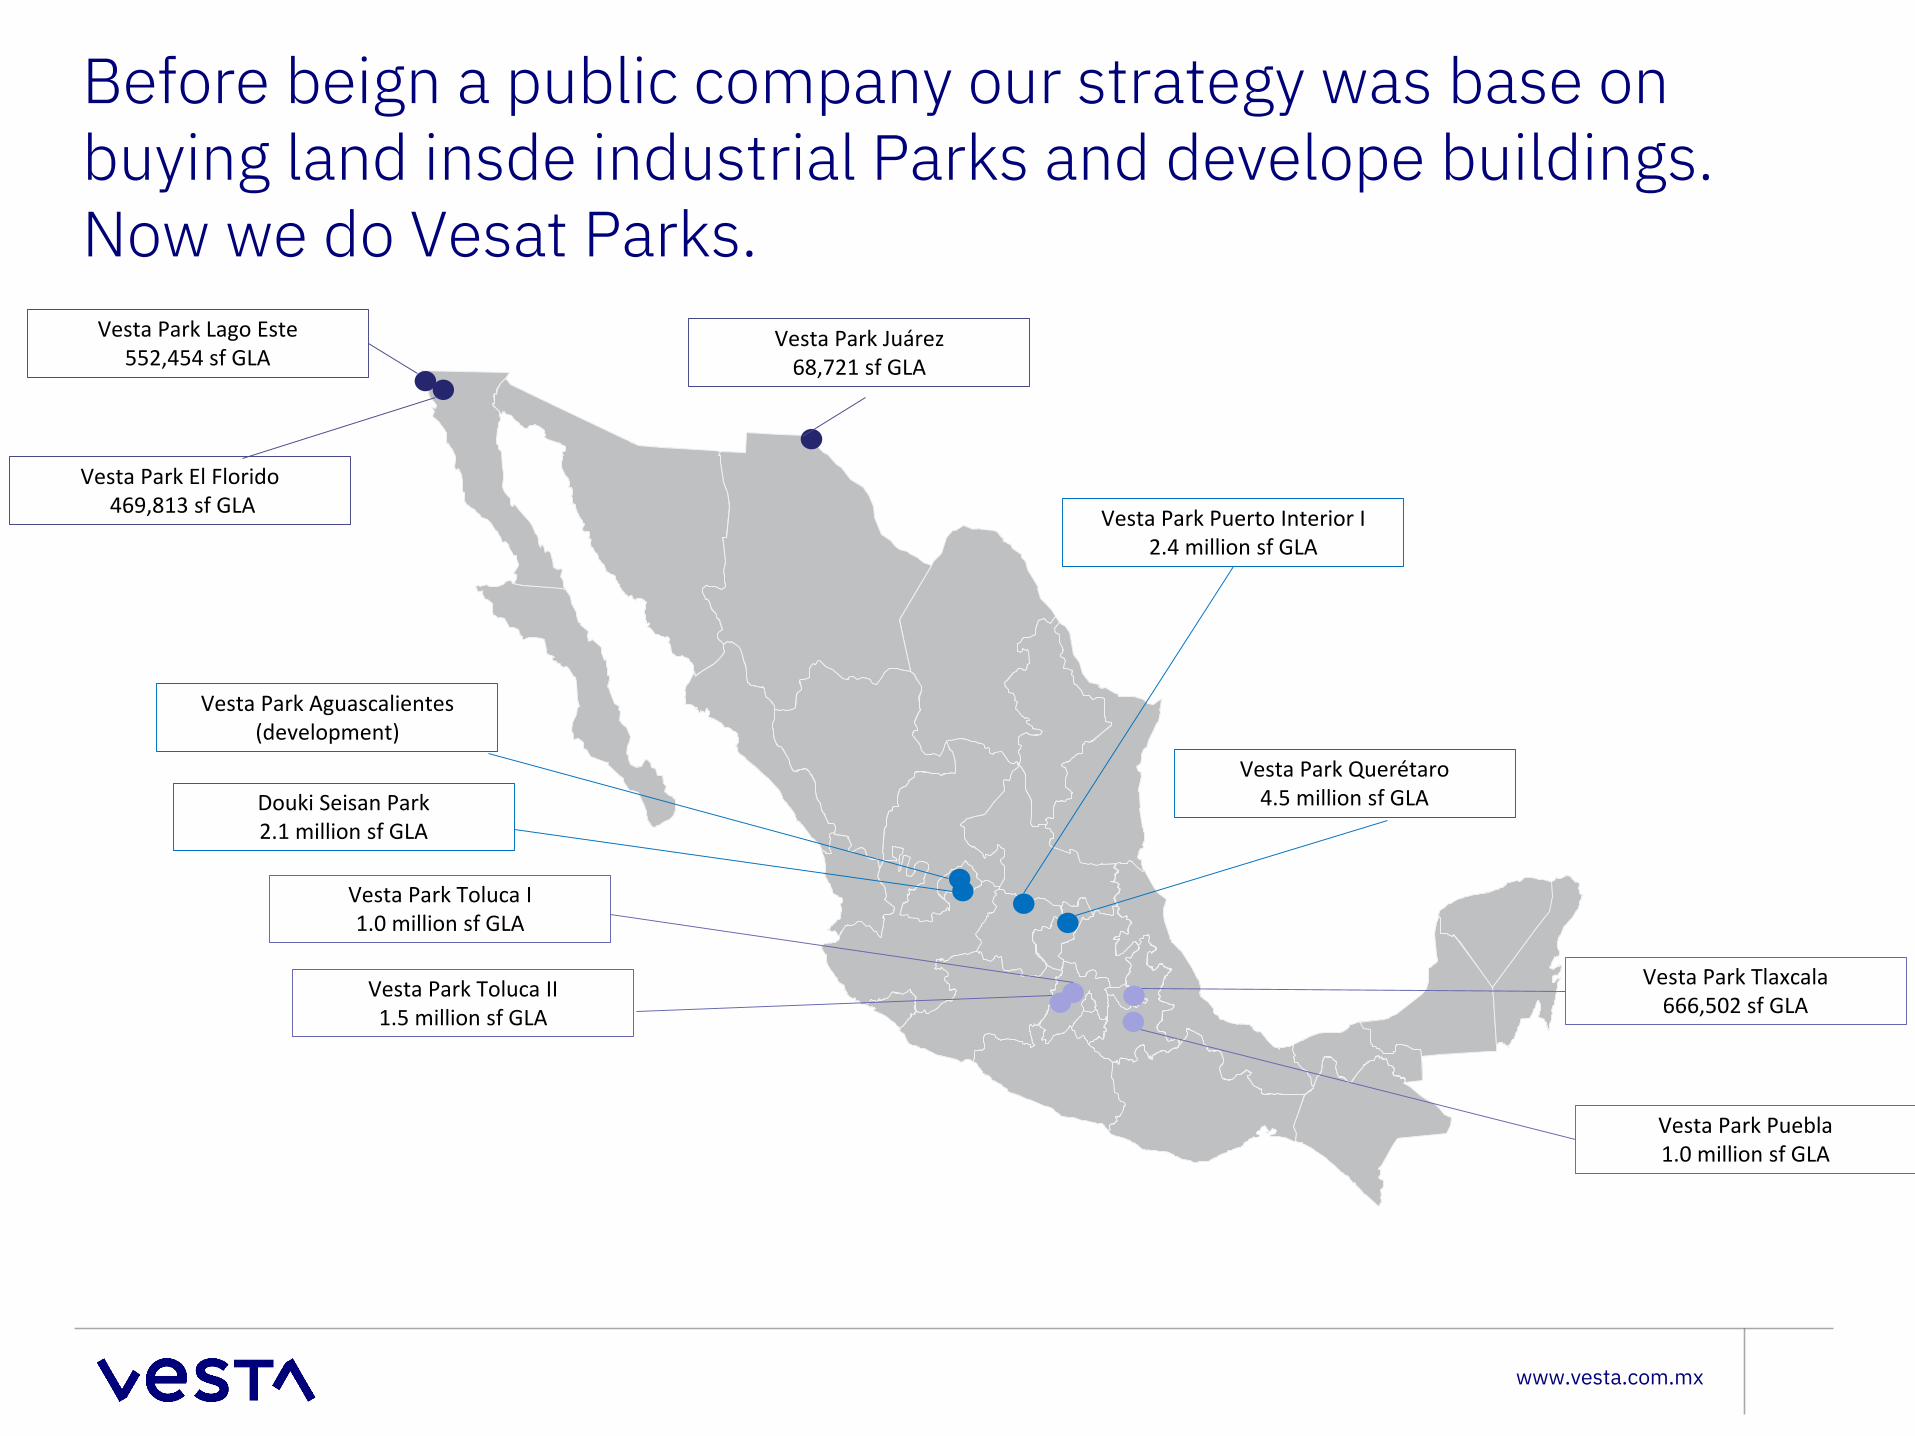
Before beign a public company our strategy was base on buying land insde industrial Parks and develope buildings. Now we do Vesat Parks.
Vesta Park Lago Este552,454 sf GLA
Vesta Park El Florido469,813 sf GLA
Vesta Park Juárez68,721 sf GLA
Vesta Park Querétaro4.5 million sf GLA
Vesta Park Toluca I1.0 million sf GLA
Vesta Park Toluca II1.5 million sf GLA
Vesta Park Aguascalientes(development)
Douki Seisan Park 2.1 million sf GLA
Vesta Park Puerto Interior I 2.4 million sf GLA
Vesta Park Tlaxcala 666,502 sf GLA
Vesta Park Puebla 1.0 million sf GLA
www.vesta.com.mx
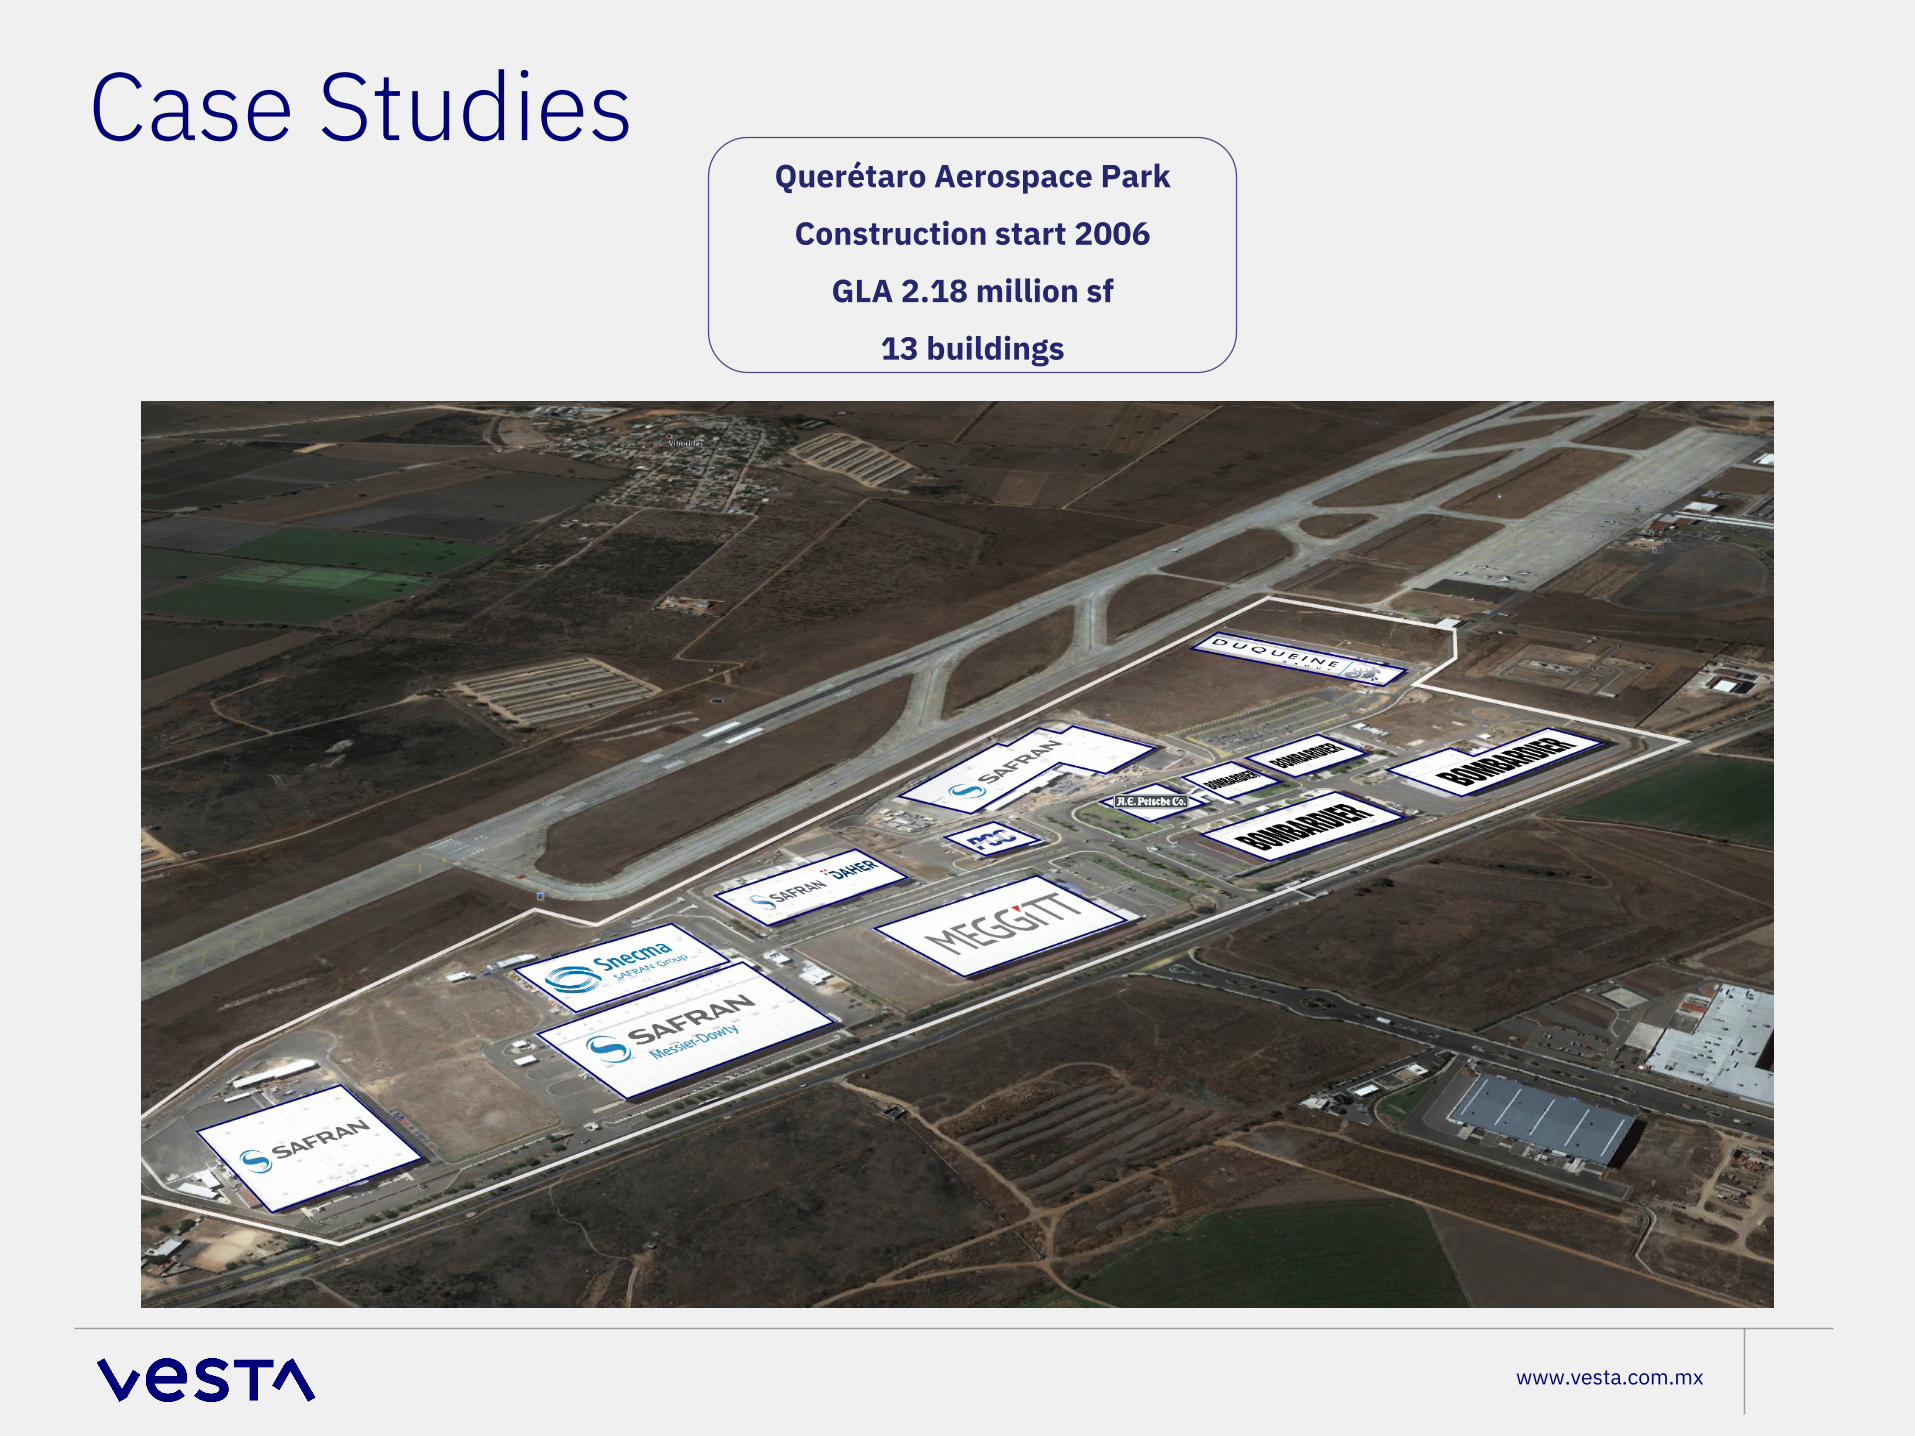
Case StudiesQuerétaro Aerospace Park
Construction start 2006
GLA 2.18 million sf
13 buildings
www.vesta.com.mx
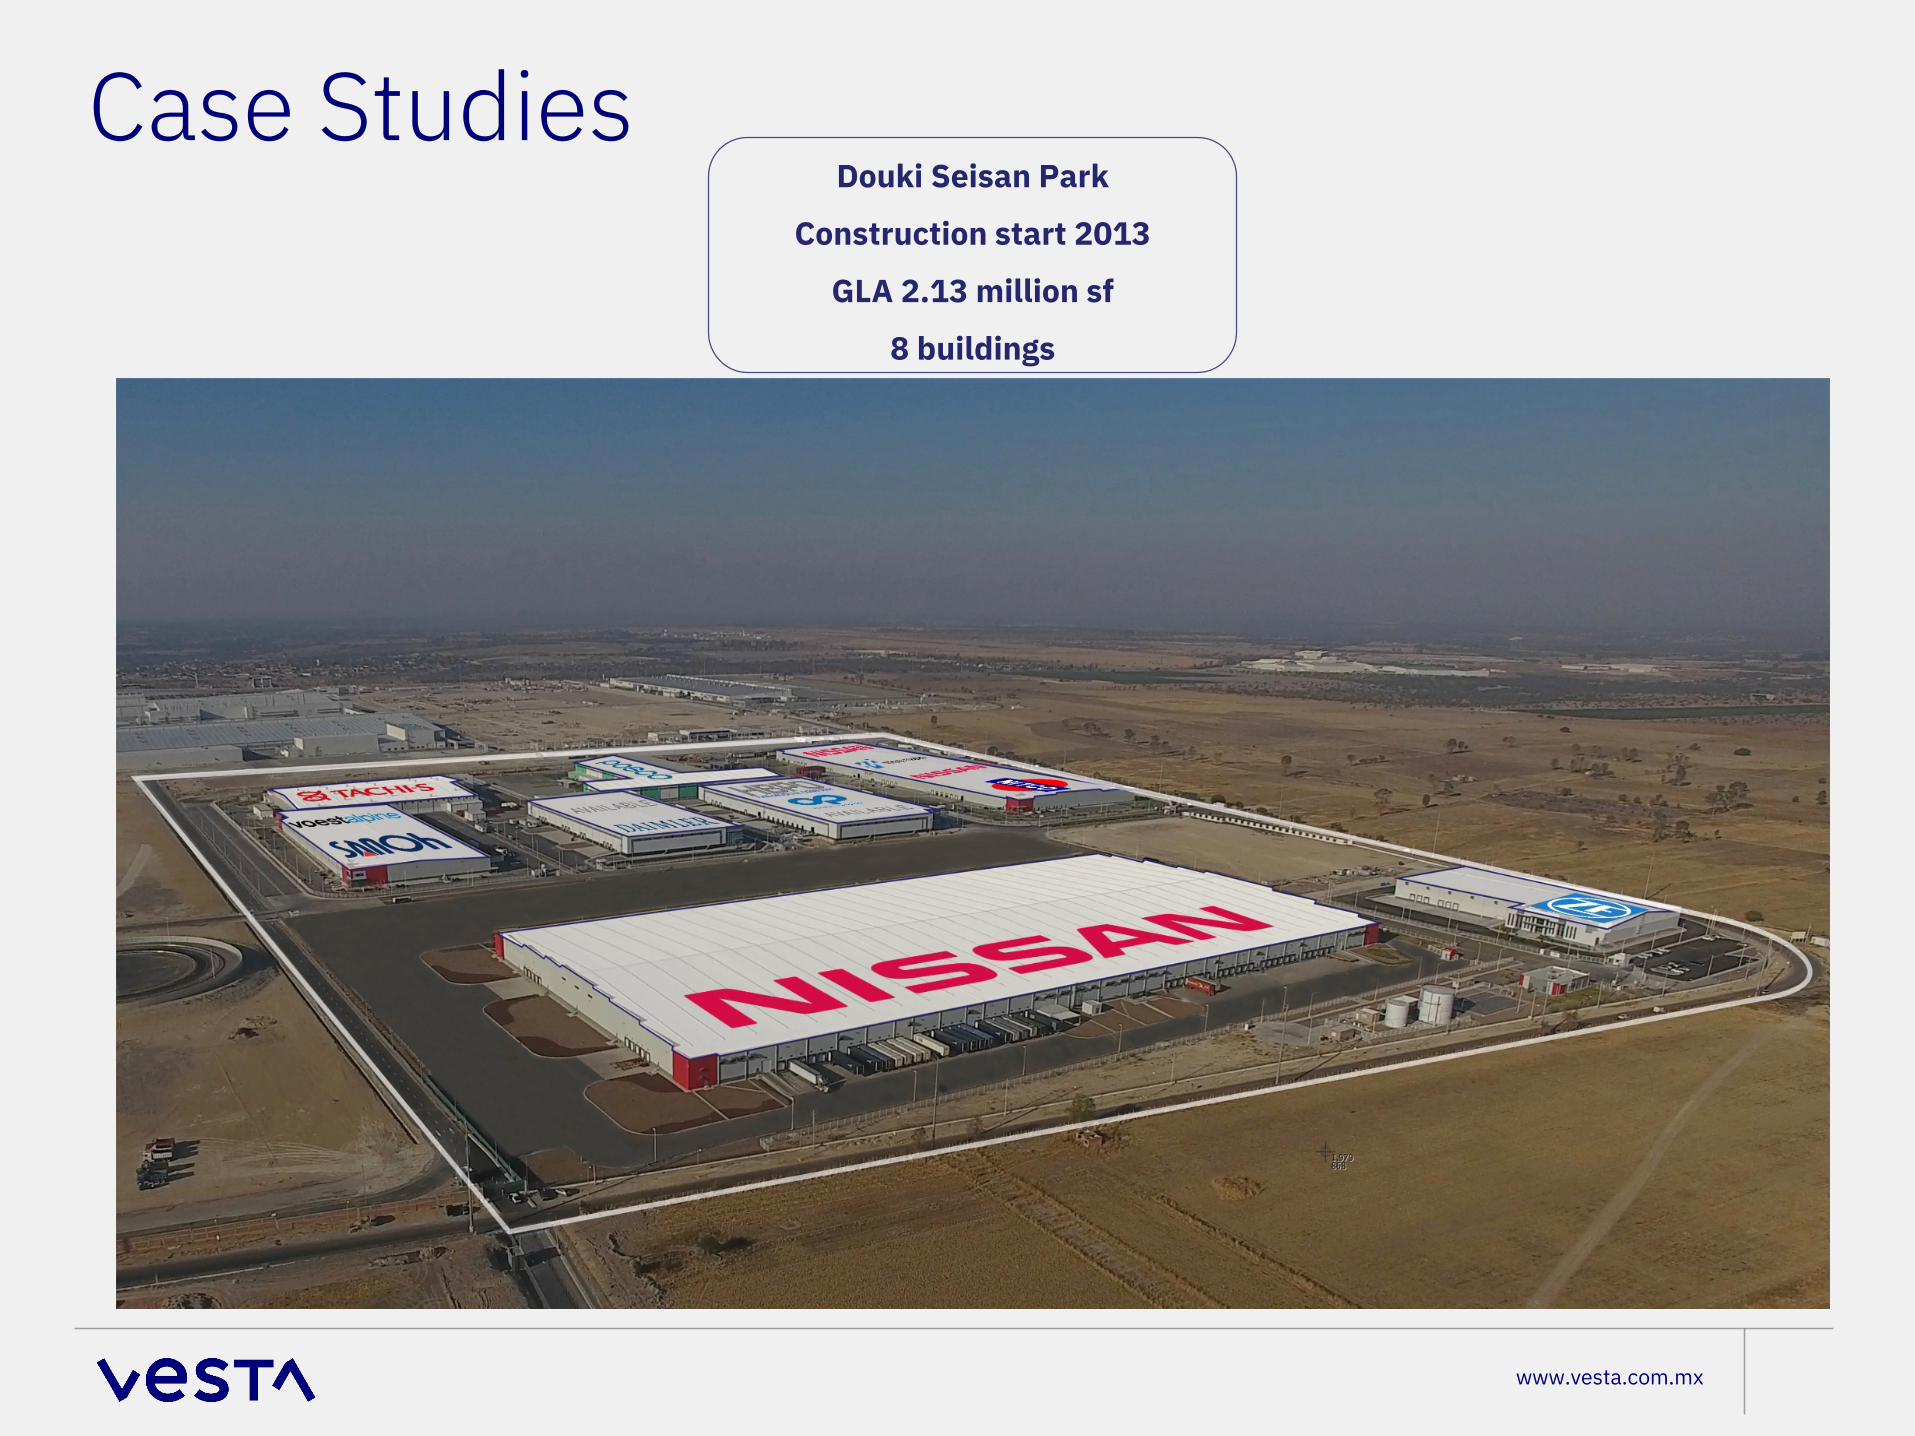
Case StudiesDouki Seisan Park
Construction start 2013
GLA 2.13 million sf
8 buildings
www.vesta.com.mx
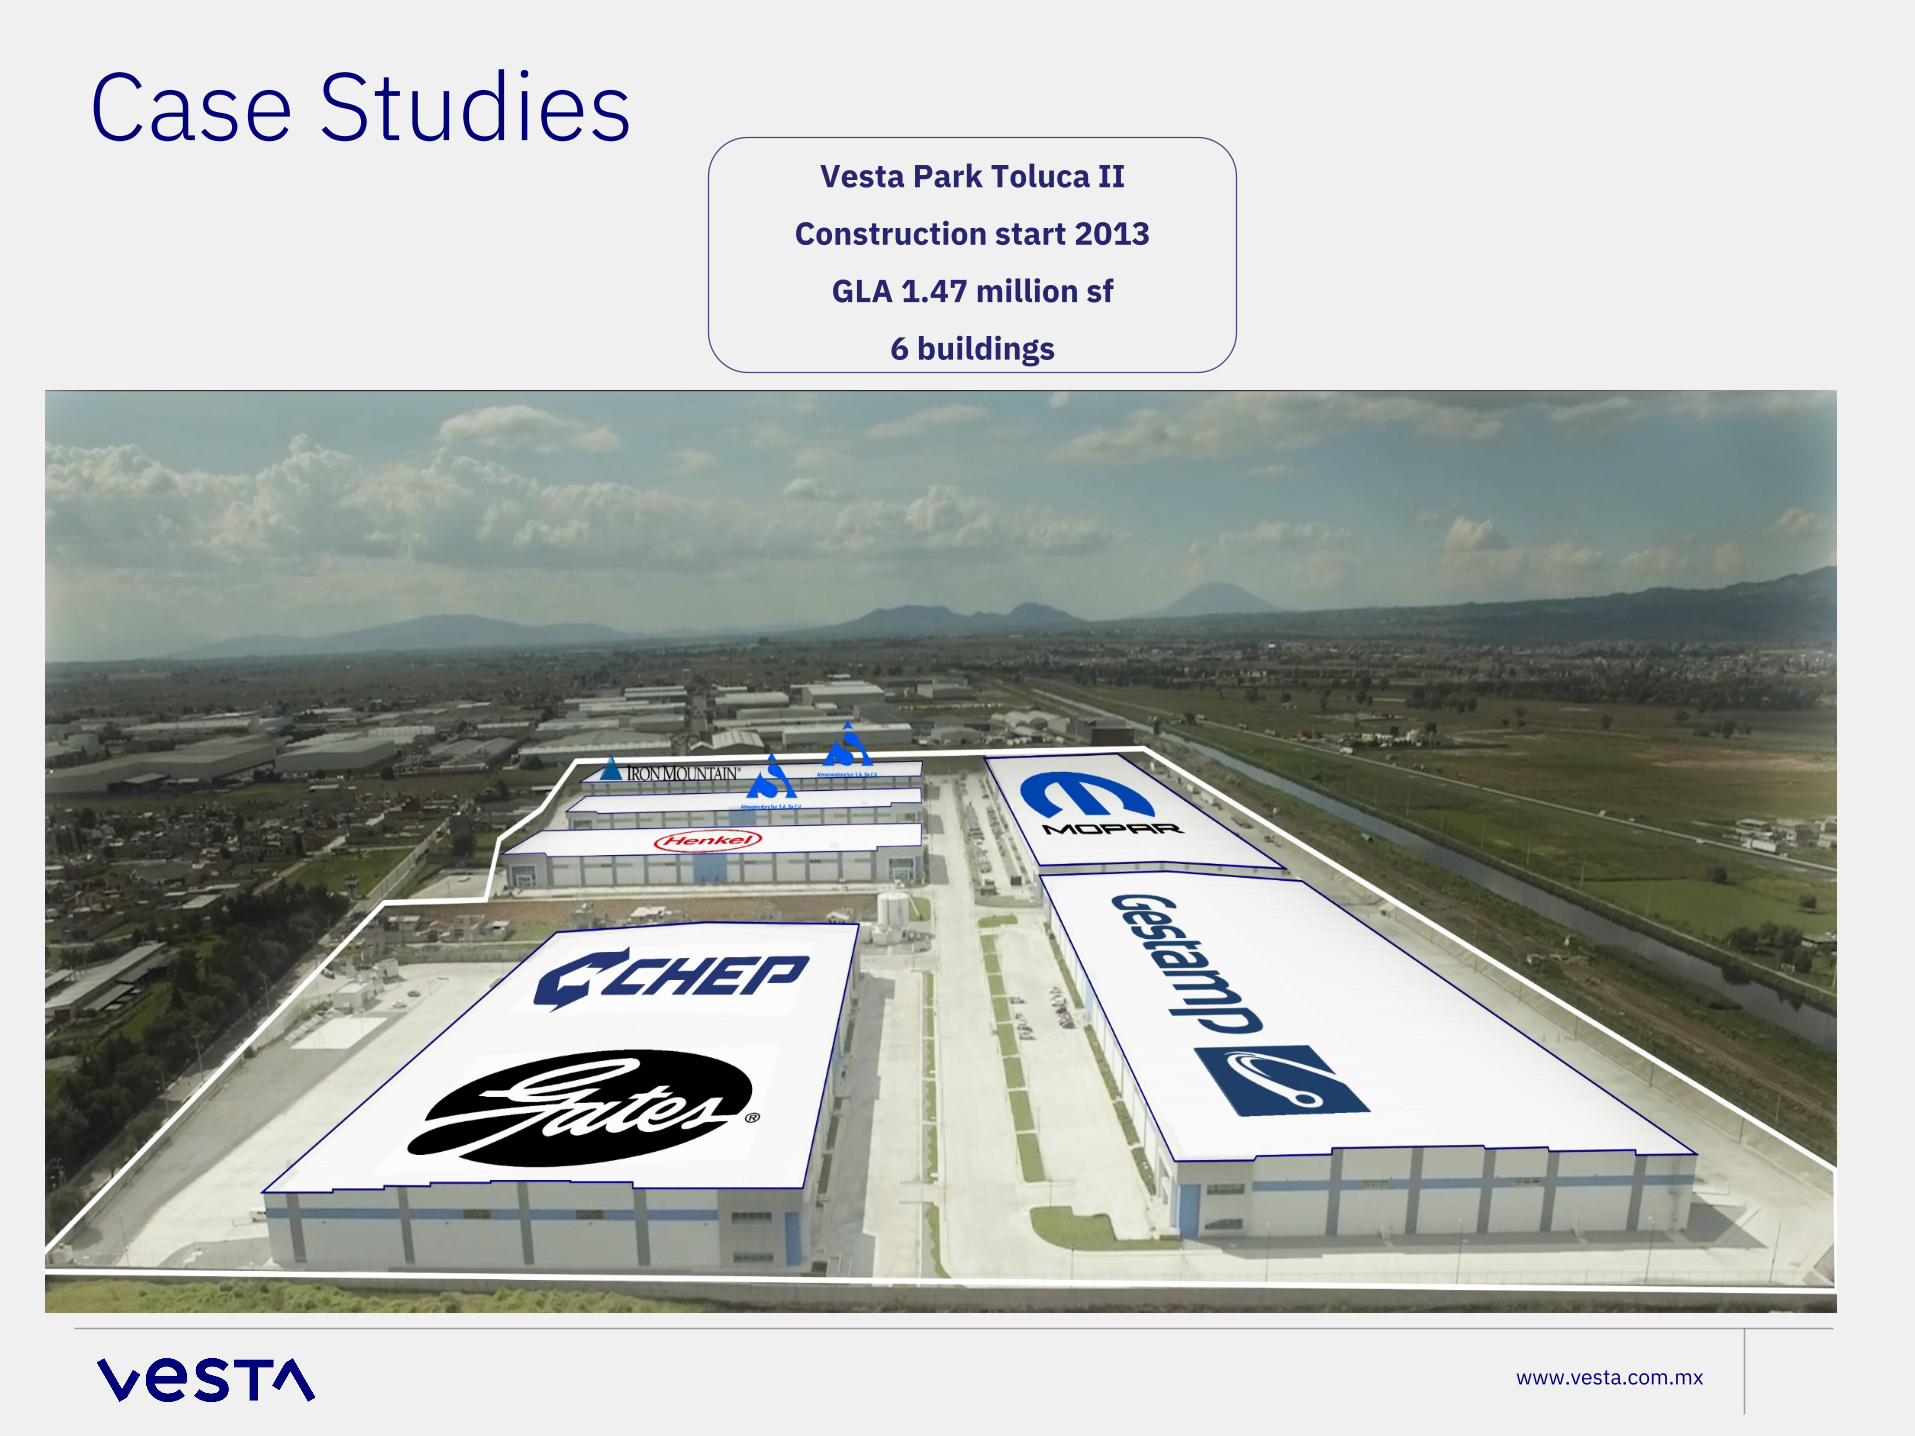
Case StudiesVesta Park Toluca II
Construction start 2013
GLA 1.47 million sf
6 buildings
www.vesta.com.mx
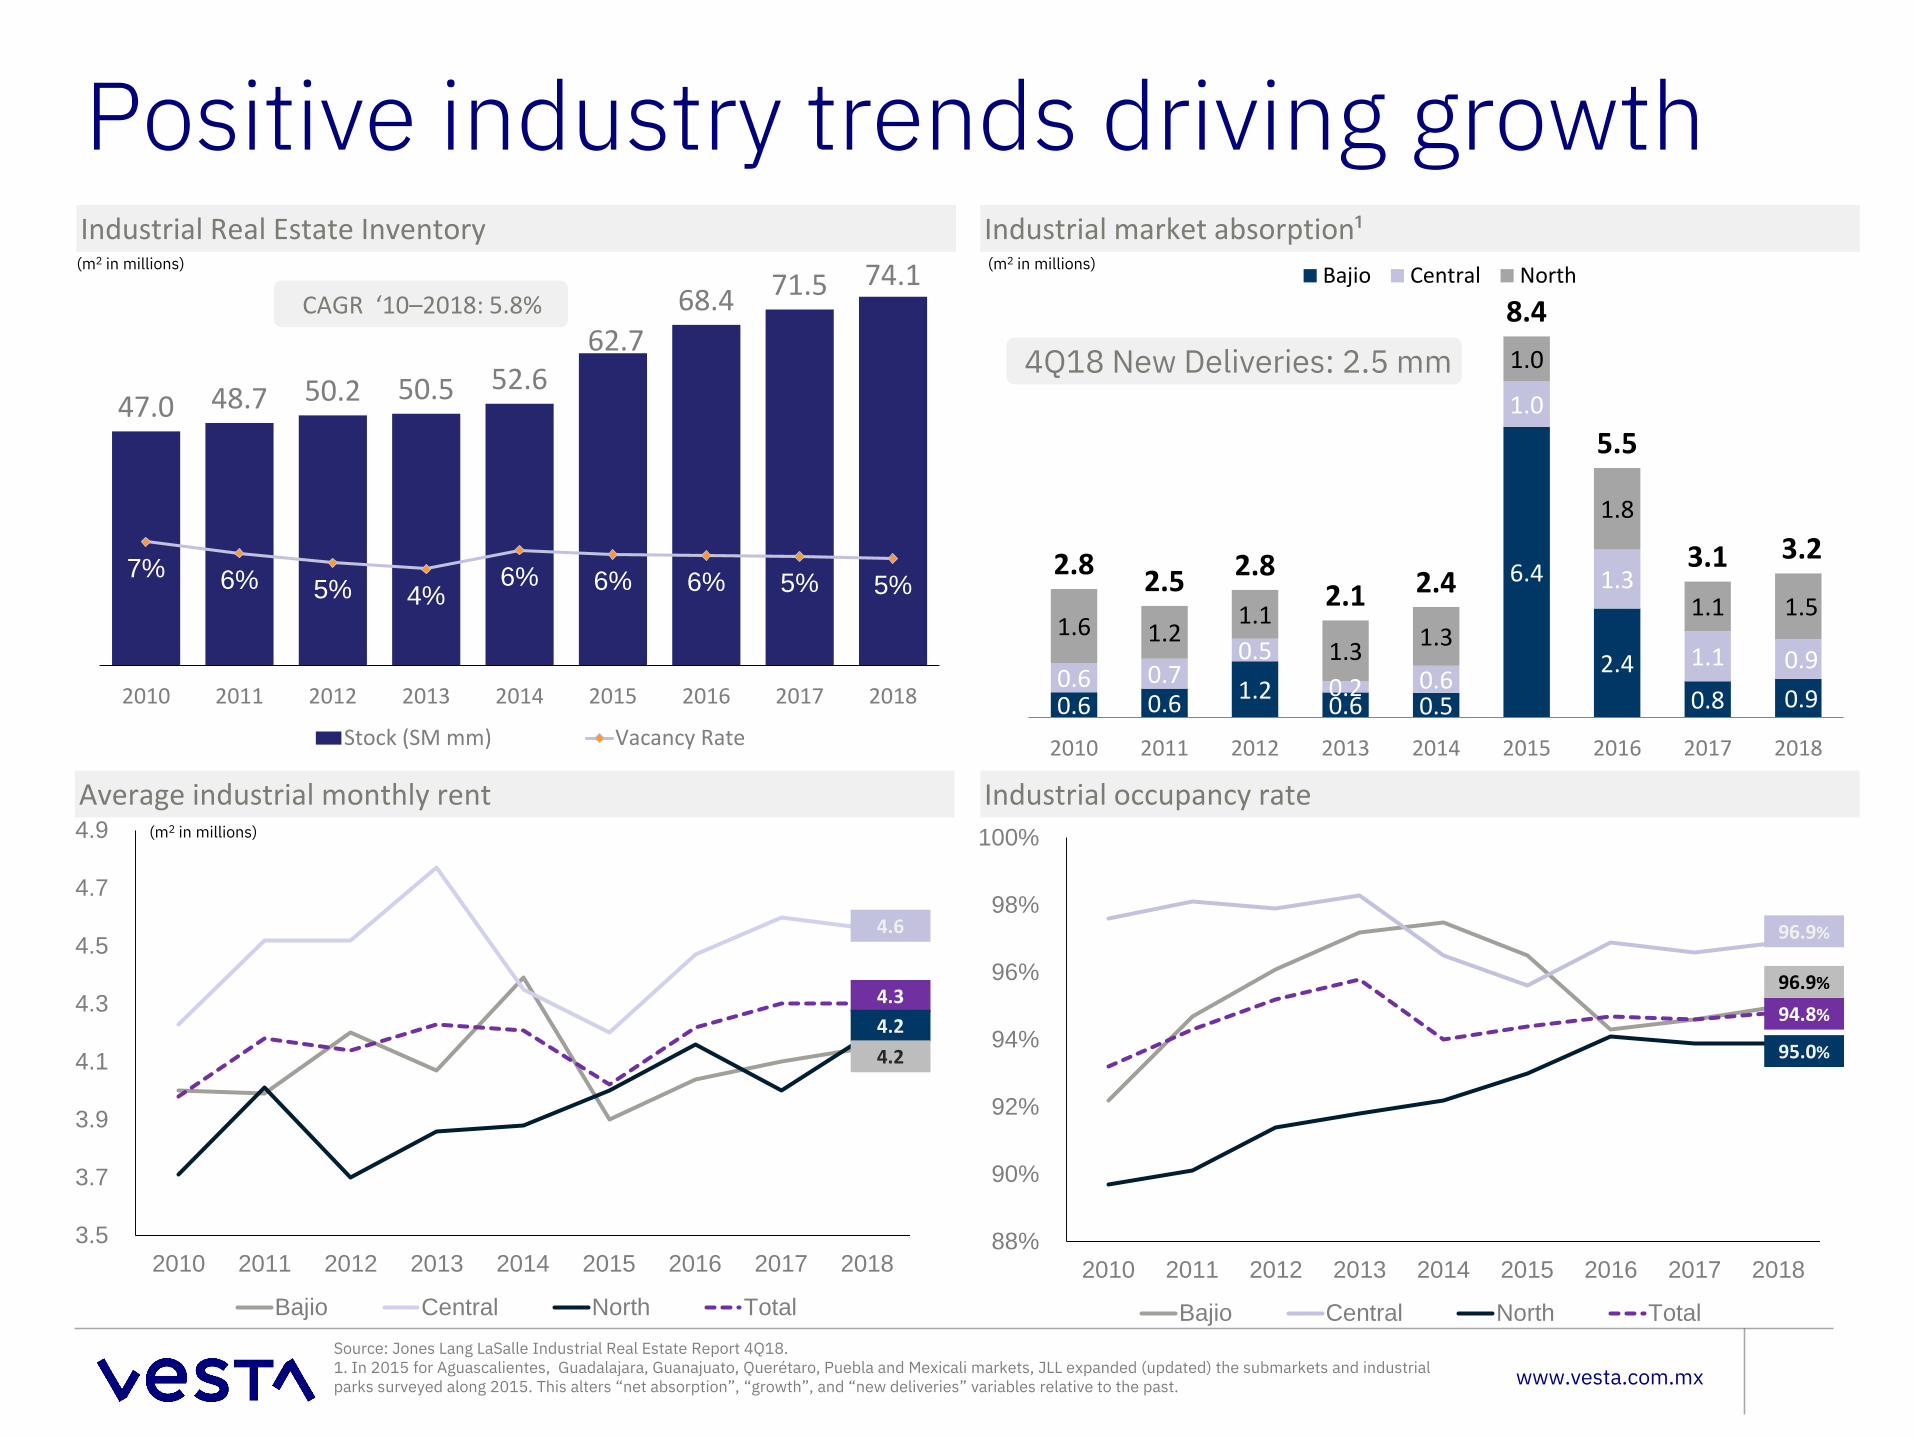
47.0 48.7 50.2 50.5 52.662.7
68.4 71.5 74.1
7% 6% 5% 4%6% 6% 6% 5% 5%
-5%
0%
5%
10%
15%
20%
25%
30%
0.0
10.0
20.0
30.0
40.0
50.0
60.0
70.0
80.0
2010 2011 2012 2013 2014 2015 2016 2017 2018
Stock (SM mm) Vacancy Rate
CAGR ‘10–2018: 5.8%
Positive industry trends driving growthIndustrial Real Estate Inventory Industrial market absorption¹
Average industrial monthly rent Industrial occupancy rate
(m2 in millions)
0.6 0.6 1.2 0.6 0.5
6.4
2.4 0.8 0.9
0.6 0.7 0.5
0.2 0.6
1.0
1.3
1.1 0.9 1.6 1.2
1.1 1.3 1.3
1.0
1.8
1.1 1.5 2.8 2.5 2.8
2.1 2.4
8.4
5.5
3.1 3.2
2010 2011 2012 2013 2014 2015 2016 2017 2018
Bajio Central North(m2 in millions)
4Q18 New Deliveries: 2.5 mm
3.5
3.7
3.9
4.1
4.3
4.5
4.7
4.9
2010 2011 2012 2013 2014 2015 2016 2017 2018
Bajio Central North Total
4.6
4.34.24.2
88%
90%
92%
94%
96%
98%
100%
2010 2011 2012 2013 2014 2015 2016 2017 2018
Bajio Central North Total
96.9%
94.8%
95.0%
96.9%
(m2 in millions)
Source: Jones Lang LaSalle Industrial Real Estate Report 4Q18.1. In 2015 for Aguascalientes, Guadalajara, Guanajuato, Querétaro, Puebla and Mexicali markets, JLL expanded (updated) the submarkets and industrial parks surveyed along 2015. This alters “net absorption”, “growth”, and “new deliveries” variables relative to the past.
www.vesta.com.mx
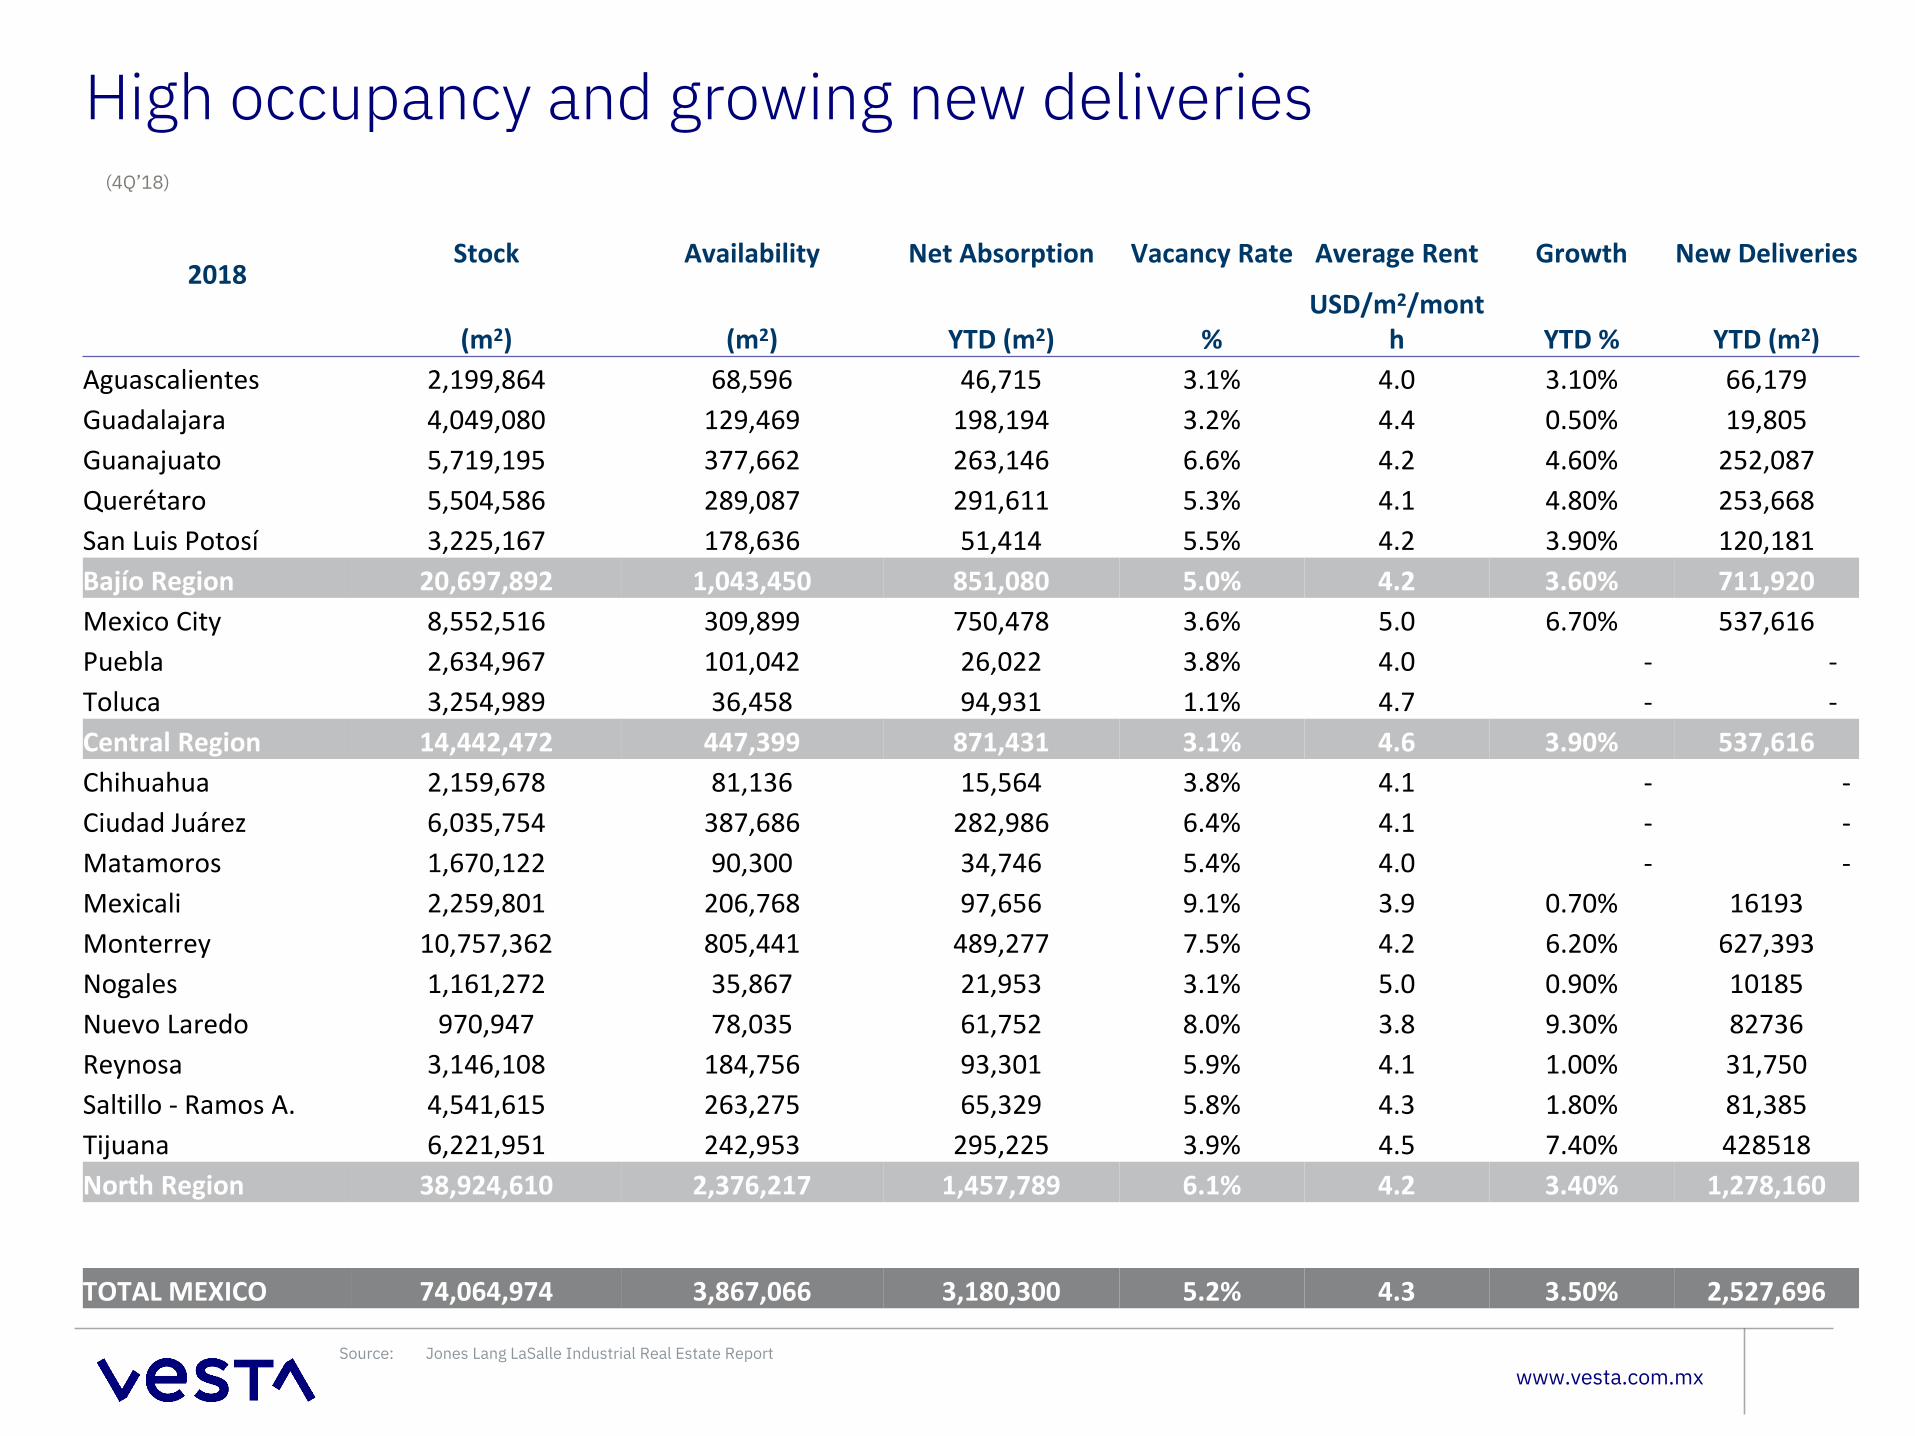
High occupancy and growing new deliveries
2018Stock Availability Net Absorption Vacancy Rate Average Rent Growth New Deliveries
(m2) (m2) YTD (m2) %USD/m2/mont
h YTD % YTD (m2)Aguascalientes 2,199,864 68,596 46,715 3.1% 4.0 3.10% 66,179Guadalajara 4,049,080 129,469 198,194 3.2% 4.4 0.50% 19,805Guanajuato 5,719,195 377,662 263,146 6.6% 4.2 4.60% 252,087Querétaro 5,504,586 289,087 291,611 5.3% 4.1 4.80% 253,668San Luis Potosí 3,225,167 178,636 51,414 5.5% 4.2 3.90% 120,181Bajío Region 20,697,892 1,043,450 851,080 5.0% 4.2 3.60% 711,920Mexico City 8,552,516 309,899 750,478 3.6% 5.0 6.70% 537,616Puebla 2,634,967 101,042 26,022 3.8% 4.0 - -Toluca 3,254,989 36,458 94,931 1.1% 4.7 - -Central Region 14,442,472 447,399 871,431 3.1% 4.6 3.90% 537,616Chihuahua 2,159,678 81,136 15,564 3.8% 4.1 - -Ciudad Juárez 6,035,754 387,686 282,986 6.4% 4.1 - -Matamoros 1,670,122 90,300 34,746 5.4% 4.0 - -Mexicali 2,259,801 206,768 97,656 9.1% 3.9 0.70% 16193Monterrey 10,757,362 805,441 489,277 7.5% 4.2 6.20% 627,393Nogales 1,161,272 35,867 21,953 3.1% 5.0 0.90% 10185Nuevo Laredo 970,947 78,035 61,752 8.0% 3.8 9.30% 82736Reynosa 3,146,108 184,756 93,301 5.9% 4.1 1.00% 31,750Saltillo - Ramos A. 4,541,615 263,275 65,329 5.8% 4.3 1.80% 81,385Tijuana 6,221,951 242,953 295,225 3.9% 4.5 7.40% 428518North Region 38,924,610 2,376,217 1,457,789 6.1% 4.2 3.40% 1,278,160
TOTAL MEXICO 74,064,974 3,867,066 3,180,300 5.2% 4.3 3.50% 2,527,696
(4Q’18)
Source: Jones Lang LaSalle Industrial Real Estate Report
www.vesta.com.mx
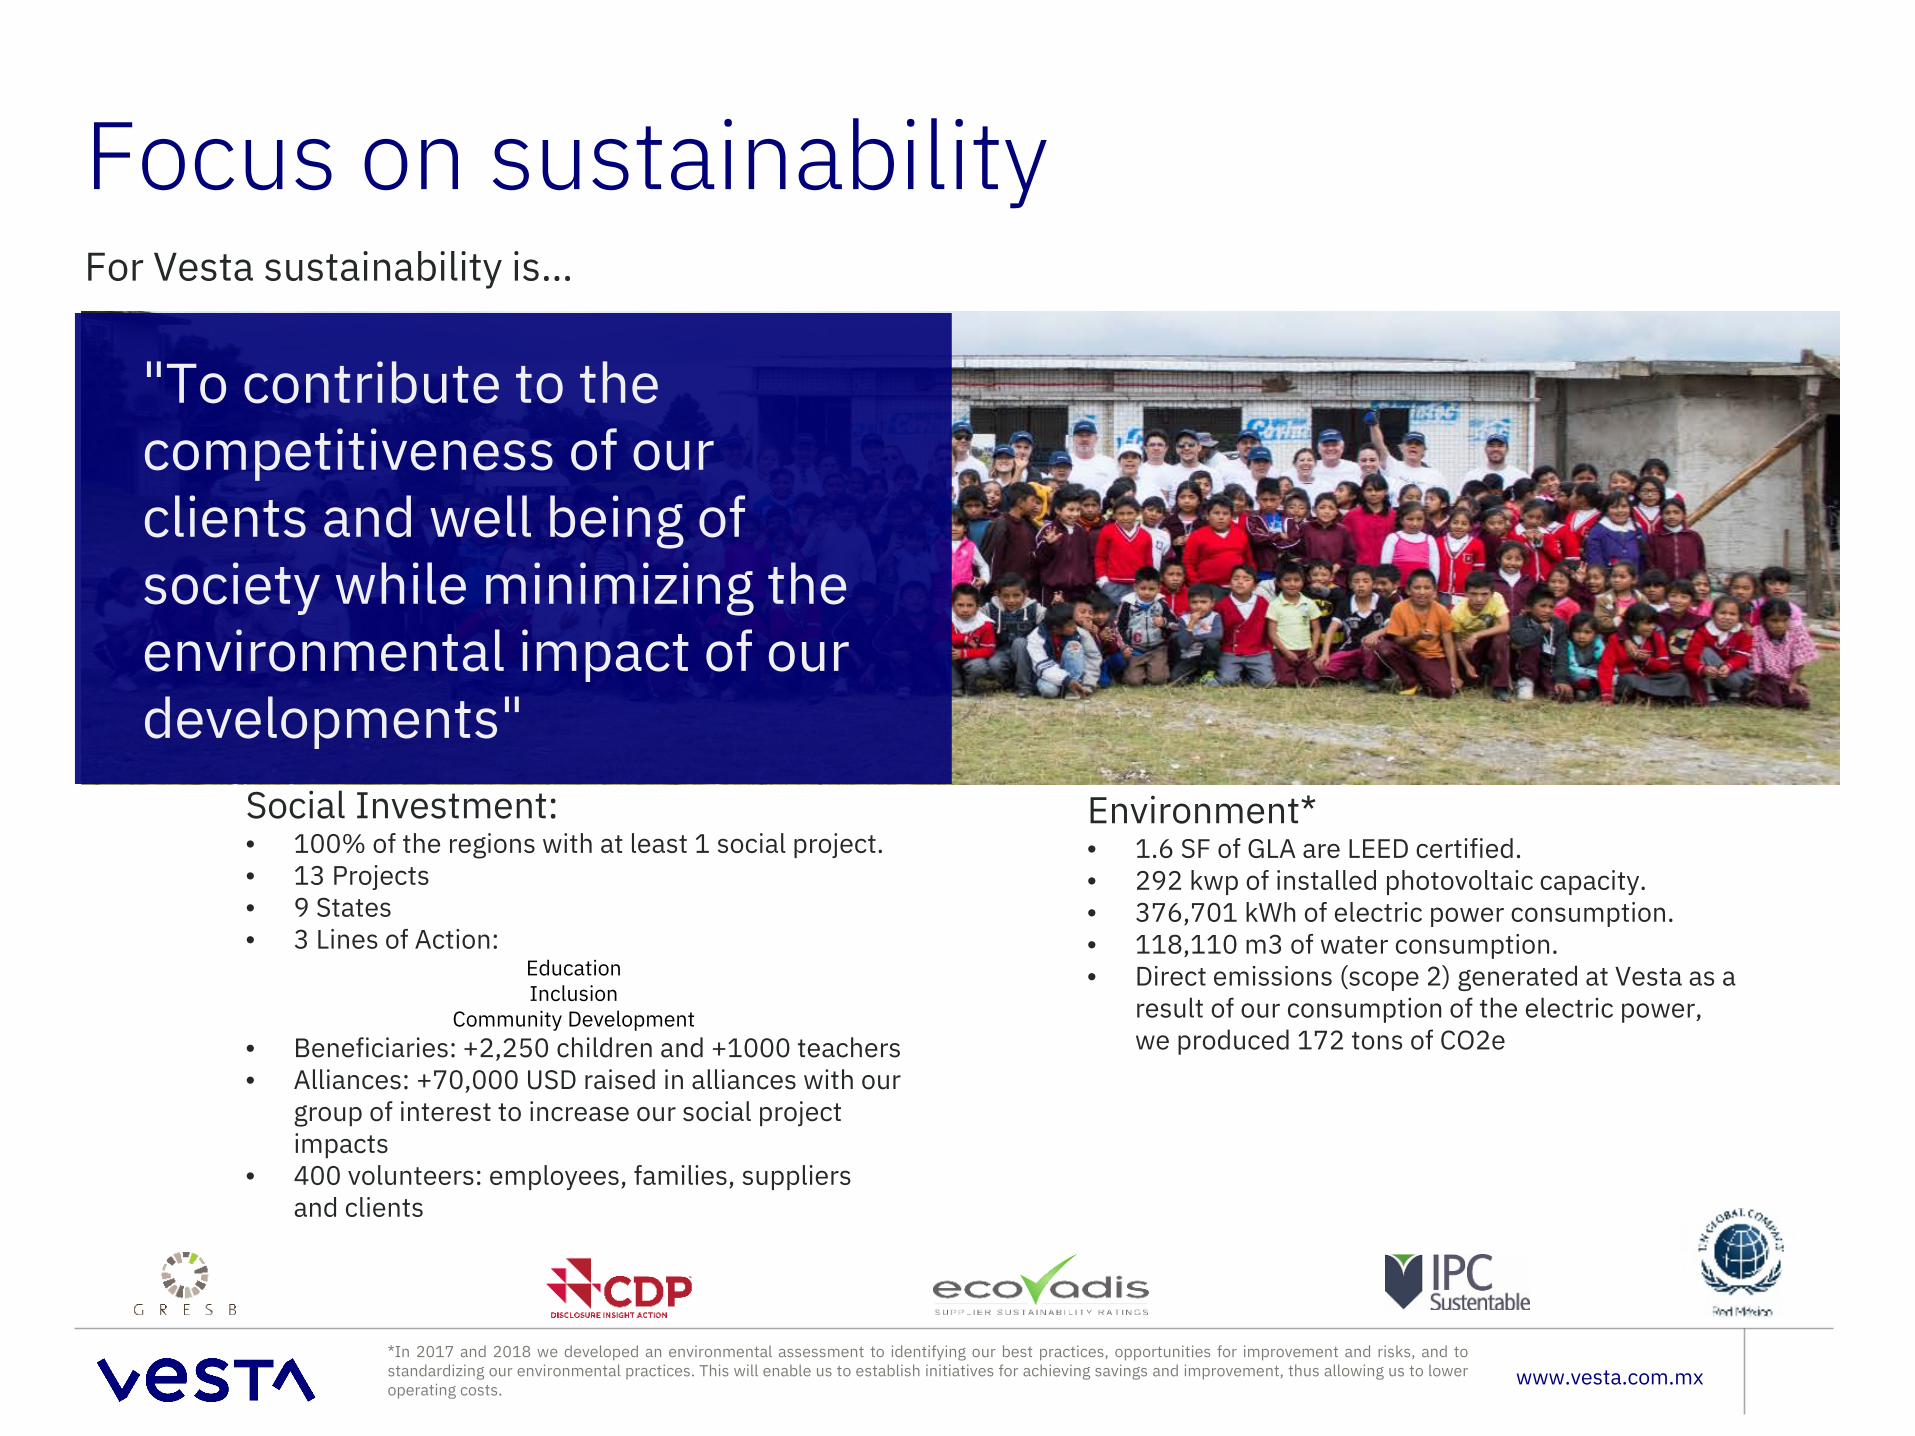
Focus on sustainability For Vesta sustainability is…
"To contribute to the competitiveness of our clients and well being of society while minimizing the environmental impact of our developments"
Social Investment: • 100% of the regions with at least 1 social project. • 13 Projects• 9 States• 3 Lines of Action:
EducationInclusion
Community Development• Beneficiaries: +2,250 children and +1000 teachers• Alliances: +70,000 USD raised in alliances with our
group of interest to increase our social project impacts
• 400 volunteers: employees, families, suppliers and clients
Environment*• 1.6 SF of GLA are LEED certified.• 292 kwp of installed photovoltaic capacity. • 376,701 kWh of electric power consumption. • 118,110 m3 of water consumption. • Direct emissions (scope 2) generated at Vesta as a
result of our consumption of the electric power, we produced 172 tons of CO2e
*In 2017 and 2018 we developed an environmental assessment to identifying our best practices, opportunities for improvement and risks, and tostandardizing our environmental practices. This will enable us to establish initiatives for achieving savings and improvement, thus allowing us to loweroperating costs.
www.vesta.com.mx
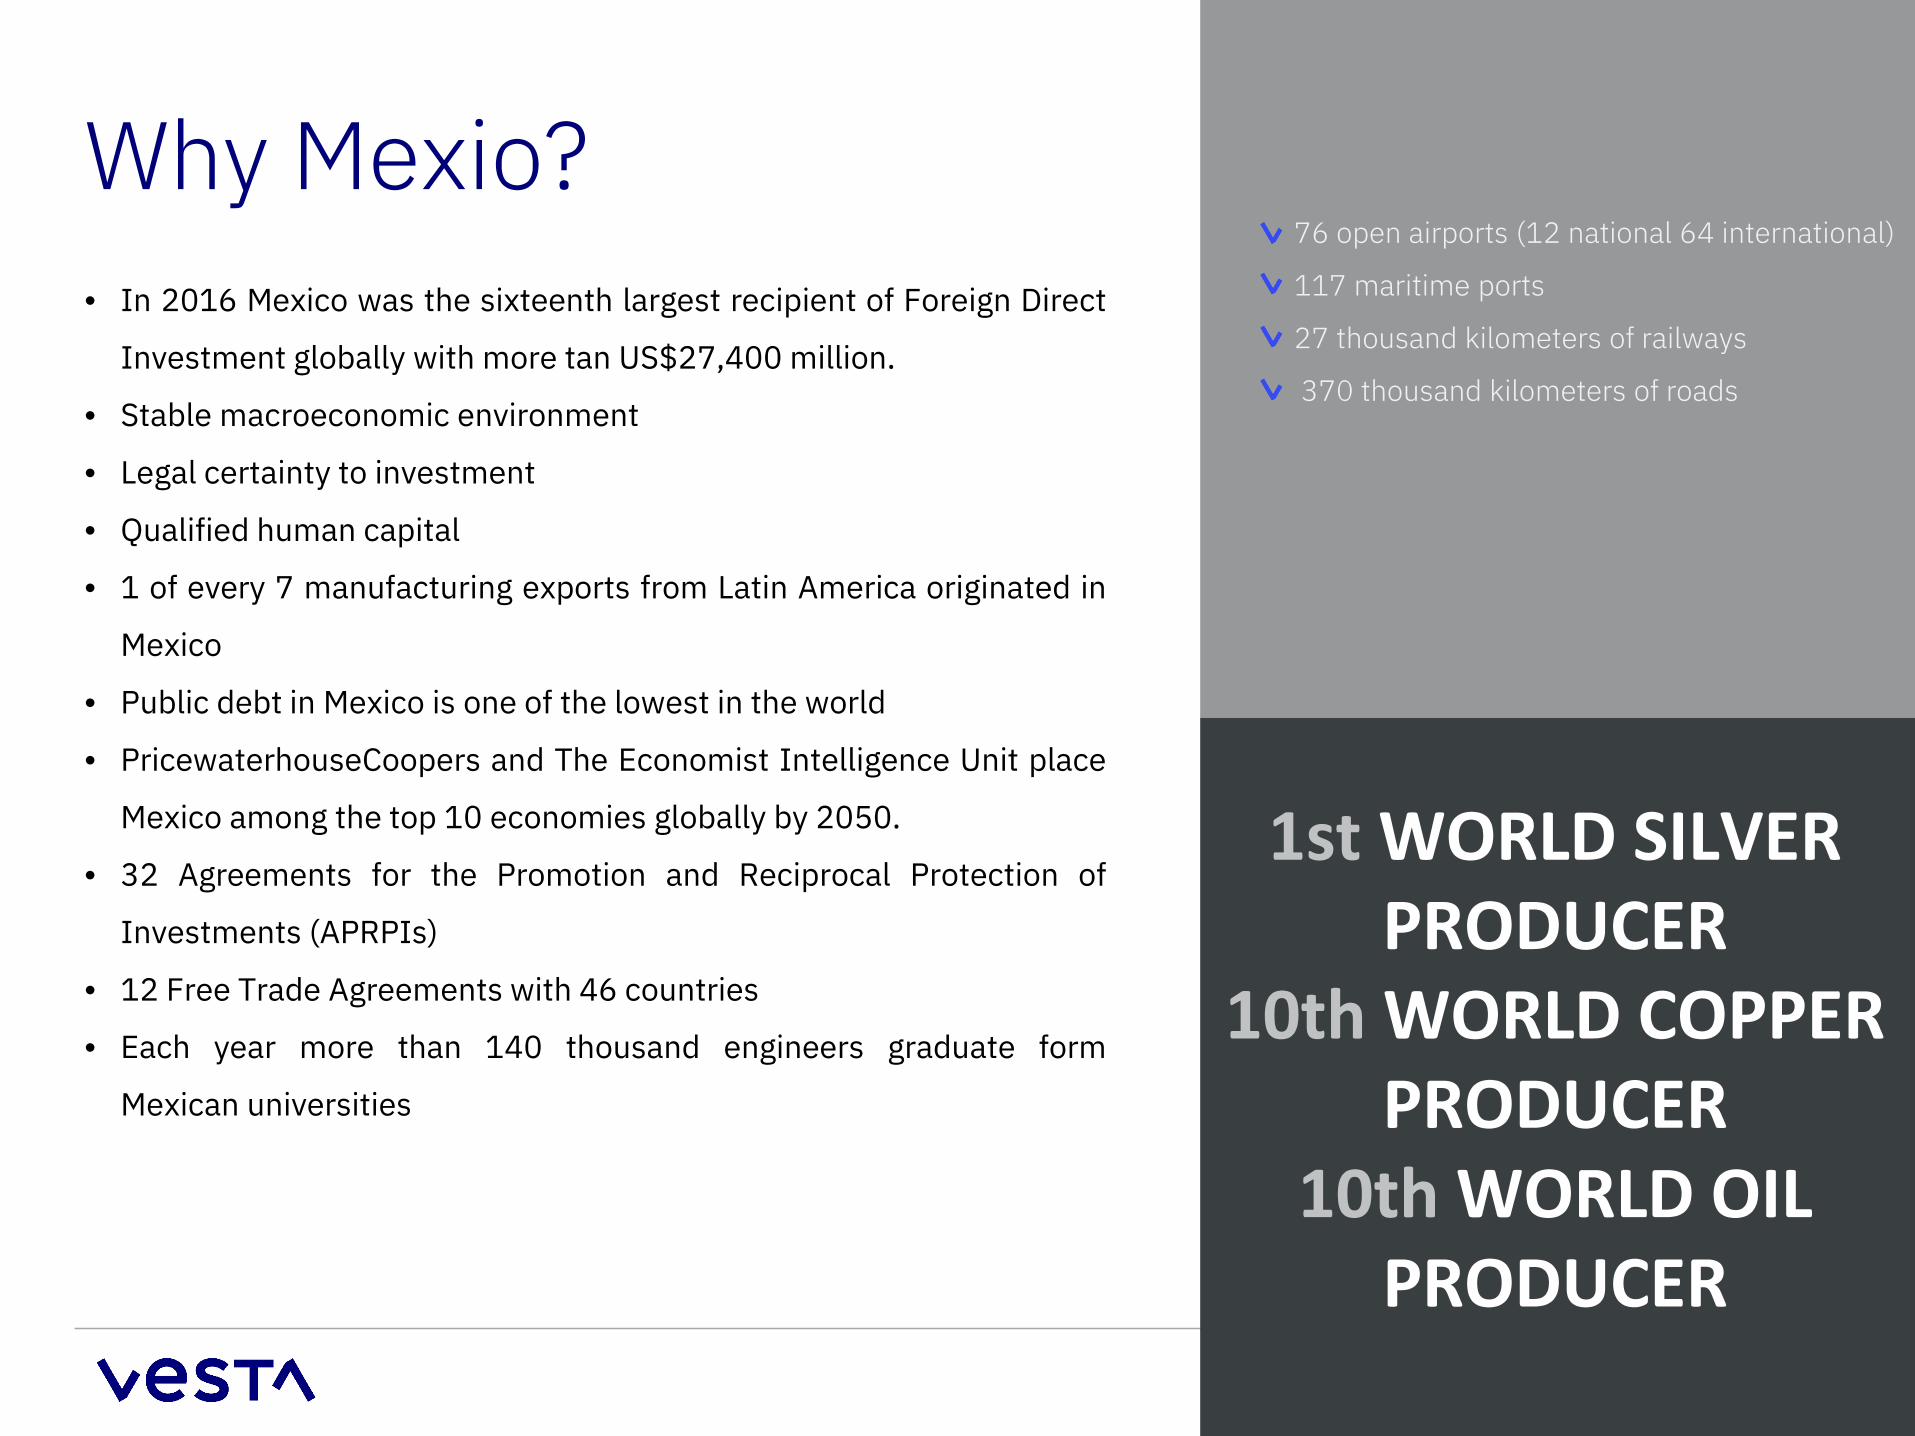
Why Mexio?• In 2016 Mexico was the sixteenth largest recipient of Foreign Direct
Investment globally with more tan US$27,400 million.
• Stable macroeconomic environment
• Legal certainty to investment
• Qualified human capital
• 1 of every 7 manufacturing exports from Latin America originated in
Mexico
• Public debt in Mexico is one of the lowest in the world
• PricewaterhouseCoopers and The Economist Intelligence Unit place
Mexico among the top 10 economies globally by 2050.
• 32 Agreements for the Promotion and Reciprocal Protection of
Investments (APRPIs)
• 12 Free Trade Agreements with 46 countries
• Each year more than 140 thousand engineers graduate form
Mexican universities
76 open airports (12 national 64 international)
117 maritime ports
27 thousand kilometers of railways
370 thousand kilometers of roads
1st WORLD SILVER PRODUCER
10th WORLD COPPER PRODUCER
10th WORLD OIL PRODUCER
www.vesta.com.mx
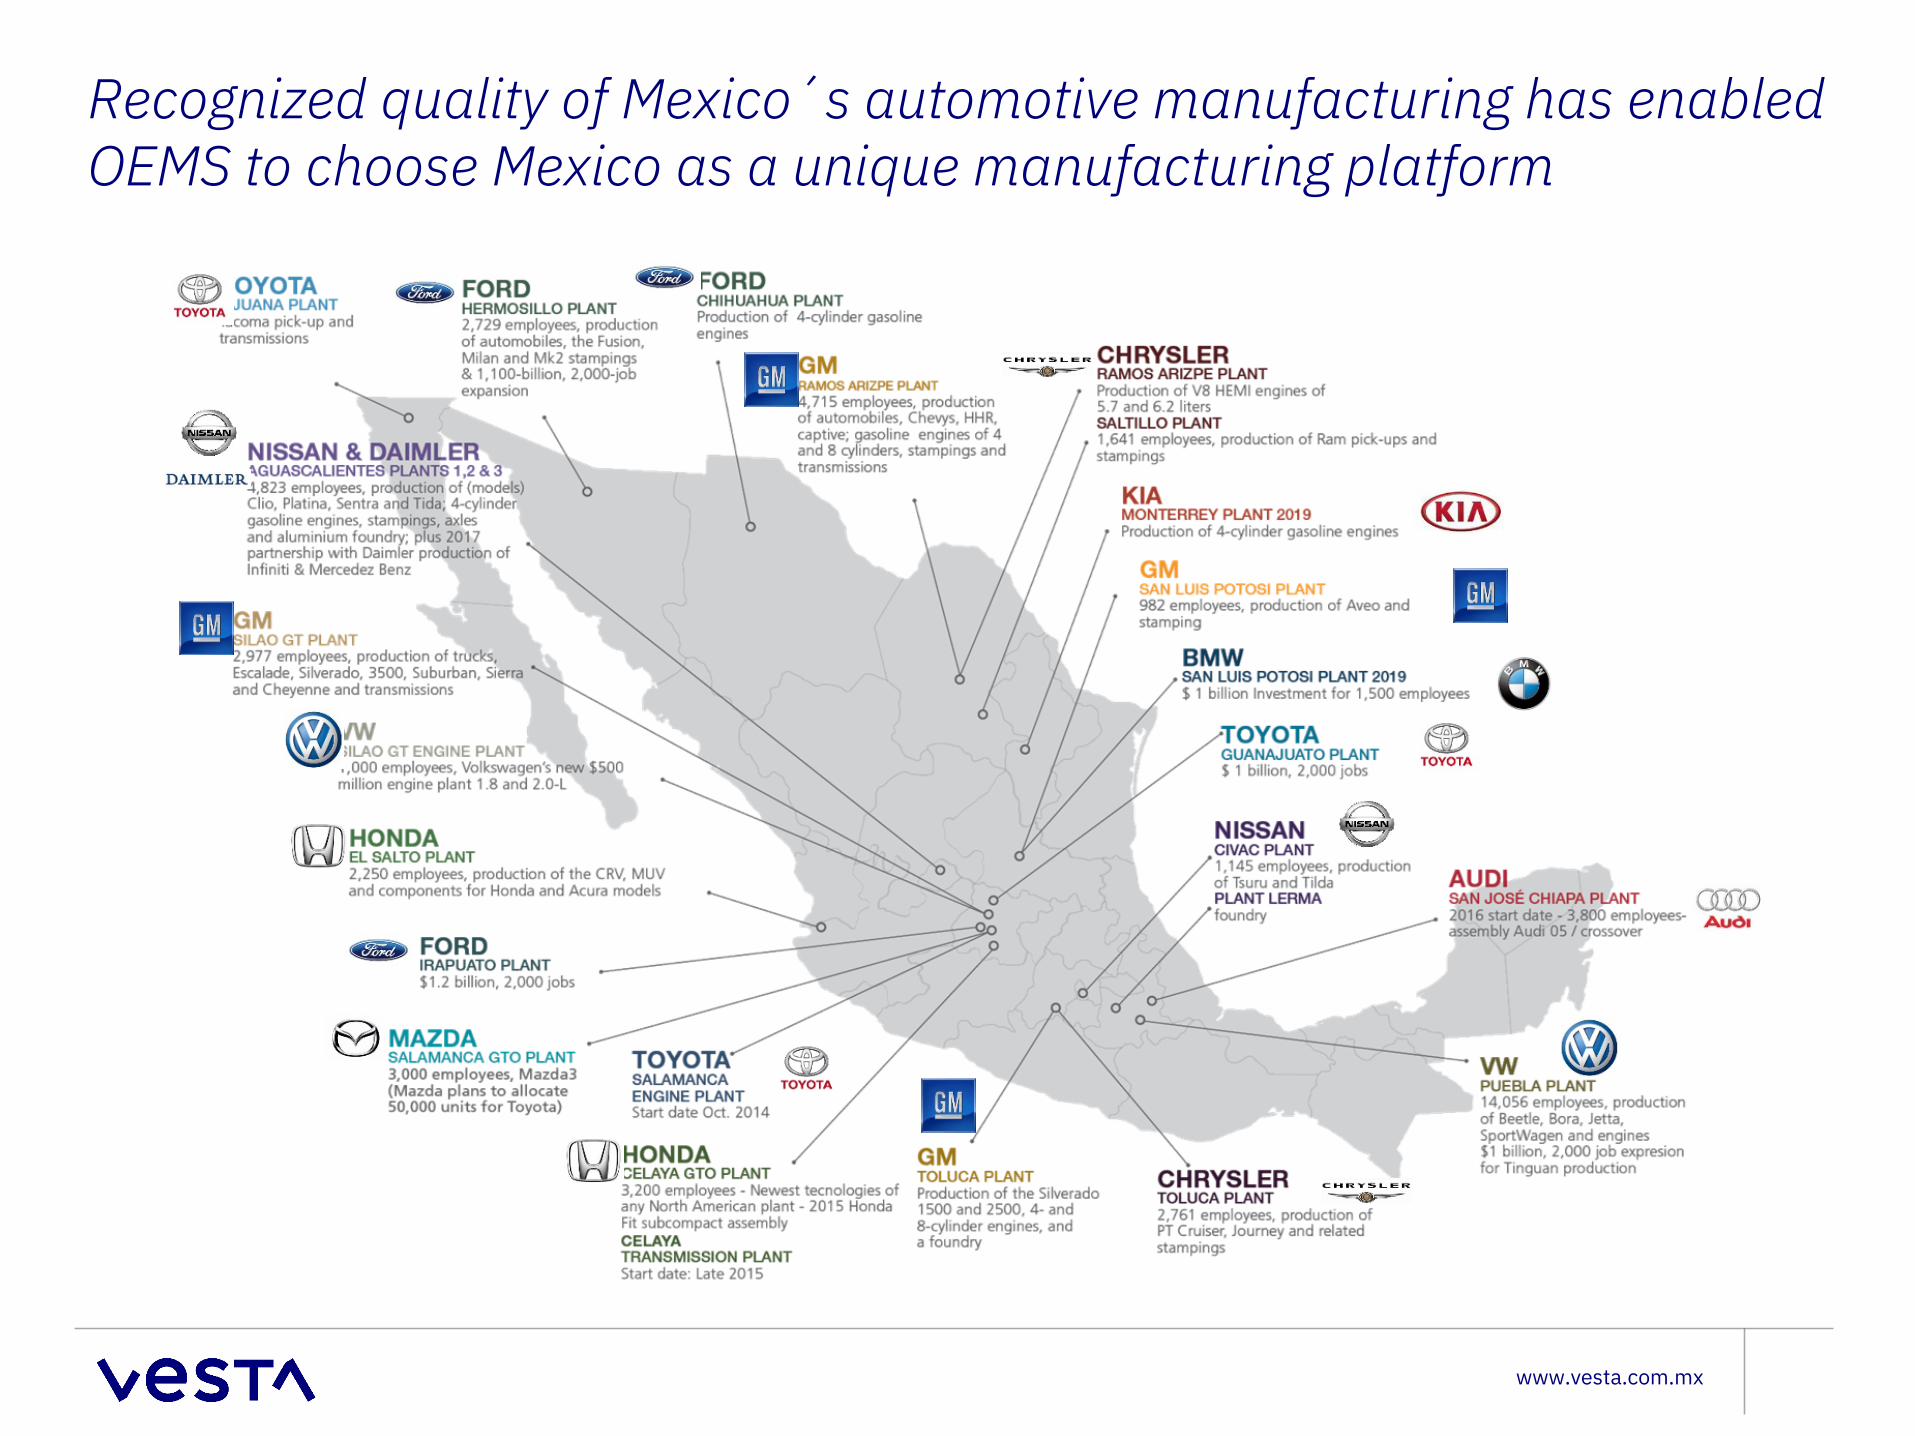
Recognized quality of Mexico´s automotive manufacturing has enabled OEMS to choose Mexico as a unique manufacturing platform
www.vesta.com.mx
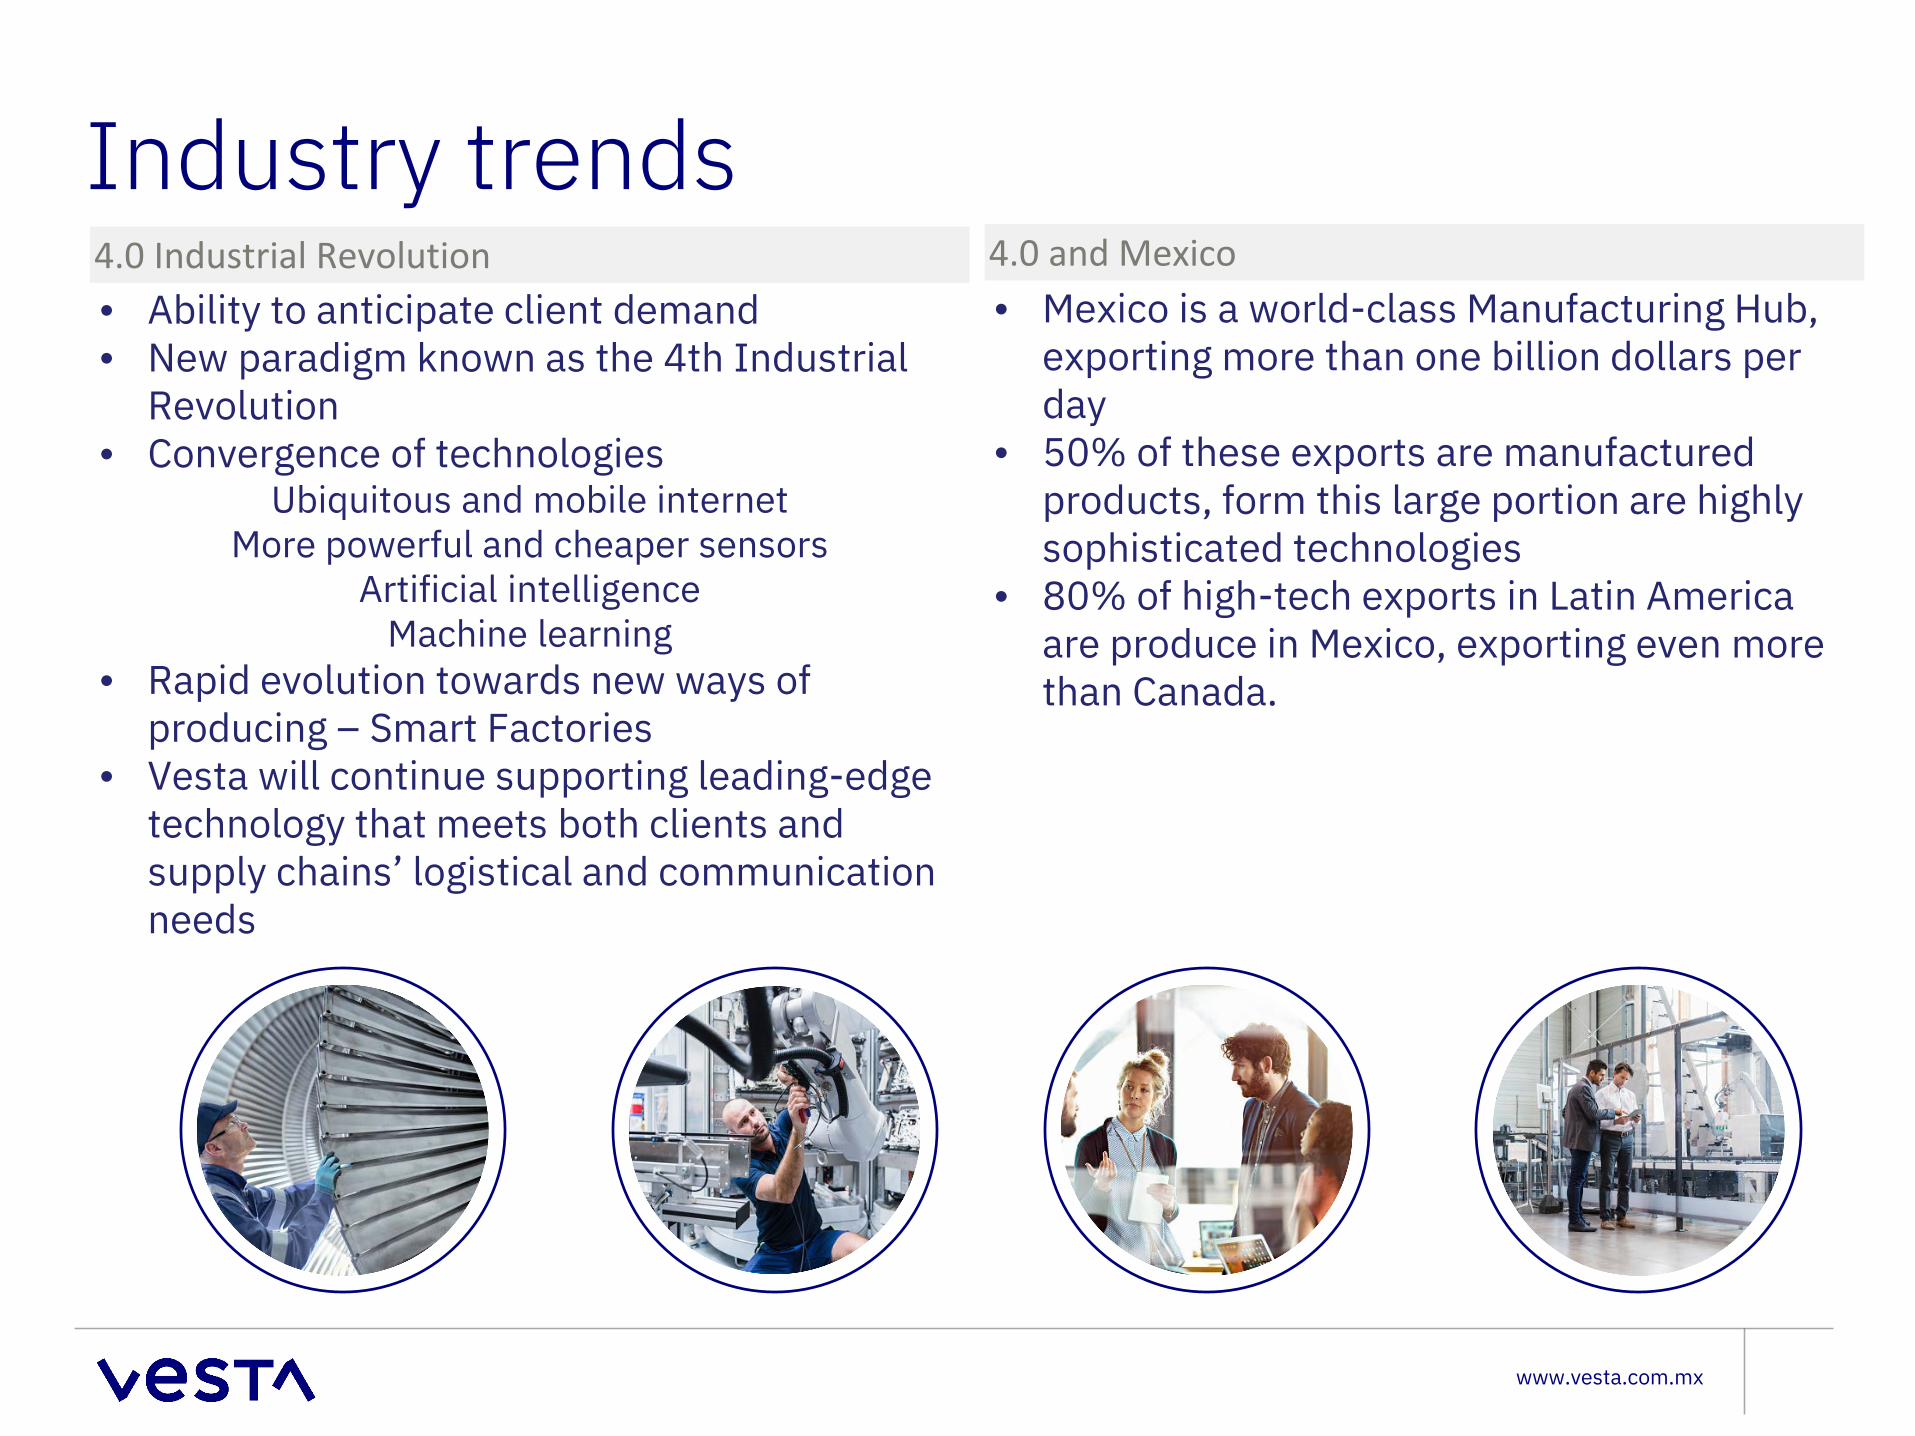
Industry trends4.0 Industrial Revolution 4.0 and Mexico• Ability to anticipate client demand• New paradigm known as the 4th Industrial
Revolution• Convergence of technologies
Ubiquitous and mobile internet More powerful and cheaper sensors
Artificial intelligenceMachine learning
• Rapid evolution towards new ways of producing – Smart Factories
• Vesta will continue supporting leading-edge technology that meets both clients and supply chains’ logistical and communication needs
• Mexico is a world-class Manufacturing Hub, exporting more than one billion dollars per day
• 50% of these exports are manufactured products, form this large portion are highly sophisticated technologies
• 80% of high-tech exports in Latin America are produce in Mexico, exporting even more than Canada.
Thank you!
www.vesta.com.mx