Embed Size (px)
Citation preview
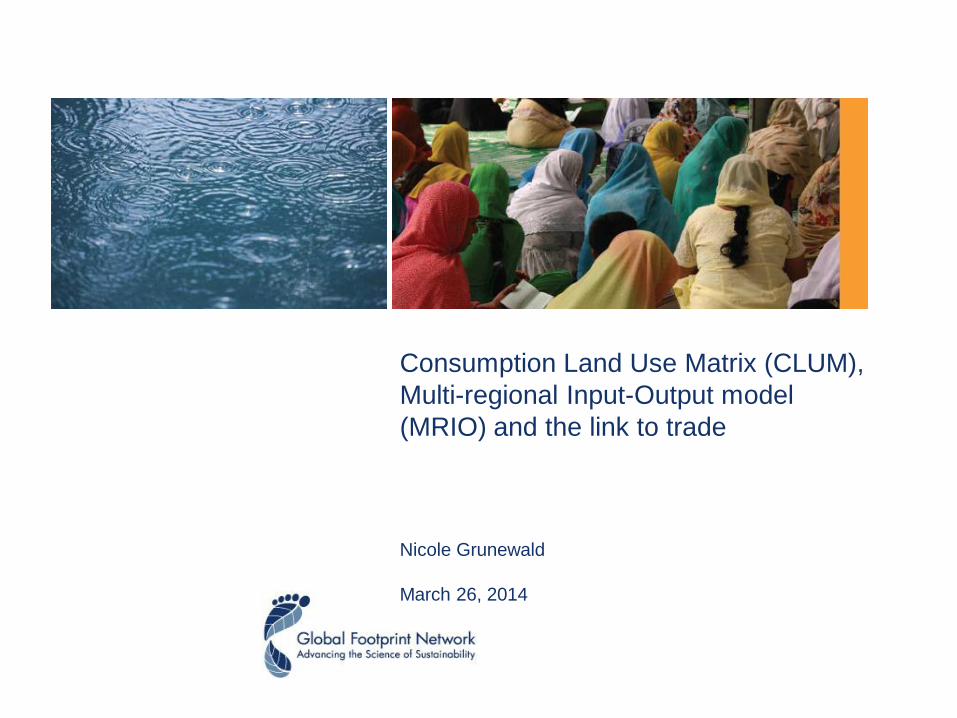
Consumption Land Use Matrix (CLUM),
Multi-regional Input-Output model
(MRIO) and the link to trade
Nicole Grunewald
March 26, 2014

Table of Contents
1. What is a CLUM?
2. What is IO?
3. What is MRIO?
4. Use of MRIO
5. How to reconcile NFA and MRIO?
6. Limitations
Table of Contents
1. What is a CLUM? And why is a CLUM useful?
2. What is IO?
3. What is MRIO?
4. Use of MRIO
5. How to reconcile NFA and MRIO?
6. Limitations
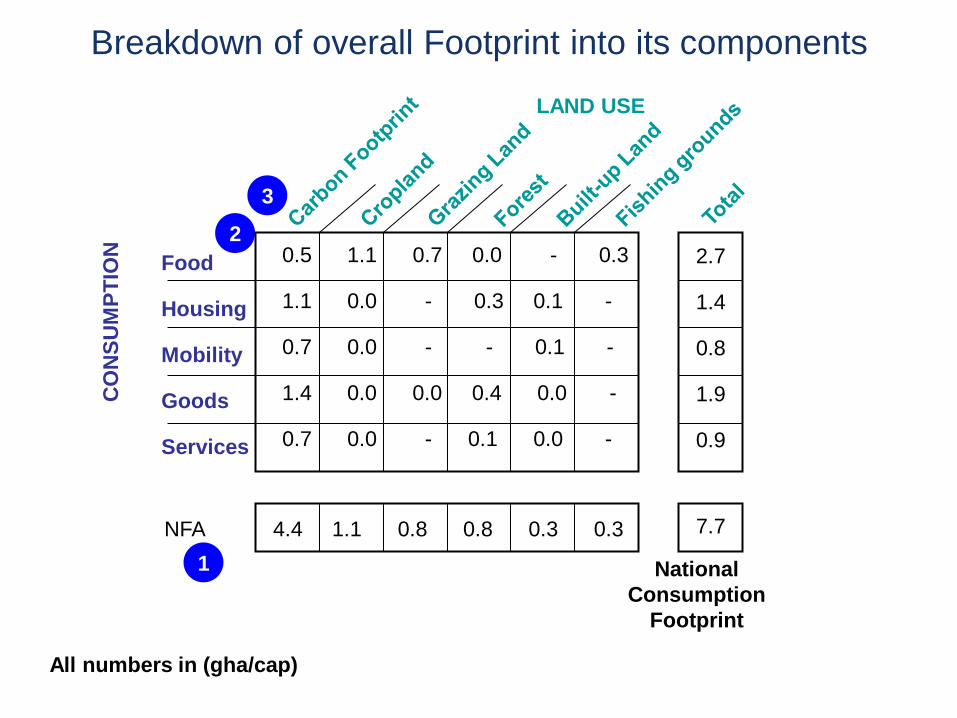
4.4 1.1 0.8 0.8 0.3 0.3
1
NFA
LAND USE C
ON
SU
MP
TIO
N
National
Consumption
Footprint
2 11% 100% 95% 2% 10% 100%
25% - - 35% 35% -
16% - - - 35% -
32% - 5% 50% 10% -
16% - - 13% 10% -
0.5 1.1 0.7 0.0 - 0.3
1.1 0.0 - 0.3 0.1 -
0.7 0.0 - - 0.1 -
1.4 0.0 0.0 0.4 0.0 -
0.7 0.0 - 0.1 0.0 -
3
2.7
1.4
0.8
1.9
0.9
7.7
Food
Housing
Mobility
Goods
Services
Breakdown of overall Footprint into its components
All numbers in (gha/cap)
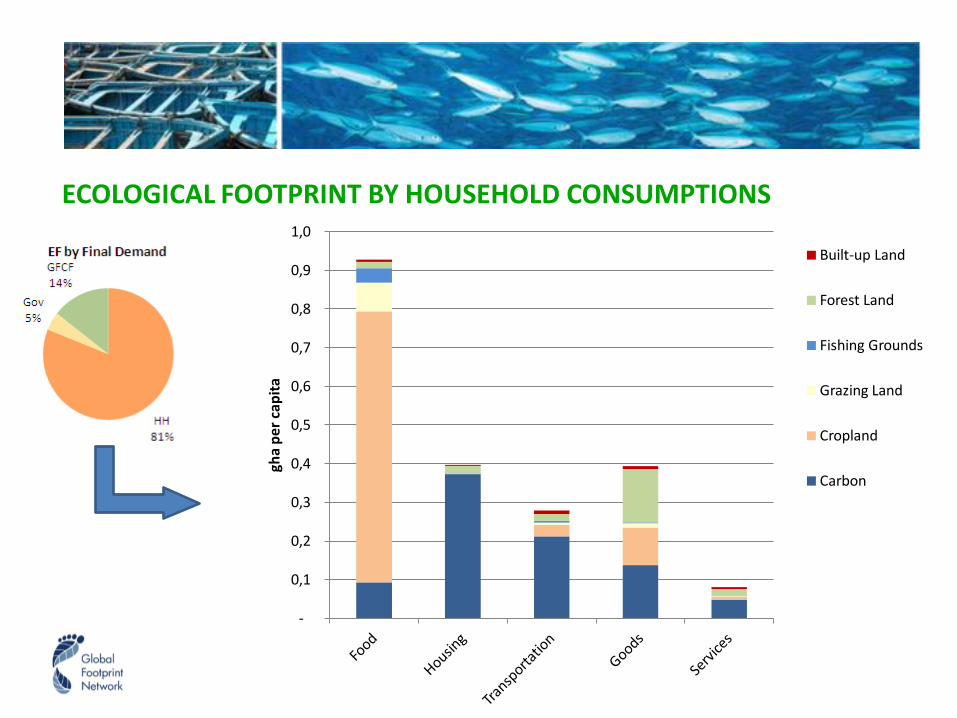
ECOLOGICAL FOOTPRINT BY HOUSEHOLD CONSUMPTIONS
-
0,1
0,2
0,3
0,4
0,5
0,6
0,7
0,8
0,9
1,0
gha
pe
r ca
pit
a Built-up Land
Forest Land
Fishing Grounds
Grazing Land
Cropland
Carbon

Table of Contents
1. What is a CLUM?
2. What is IO?
3. What is MRIO?
4. Use of MRIO
5. How to reconcile NFA and MRIO?
6. Limitations
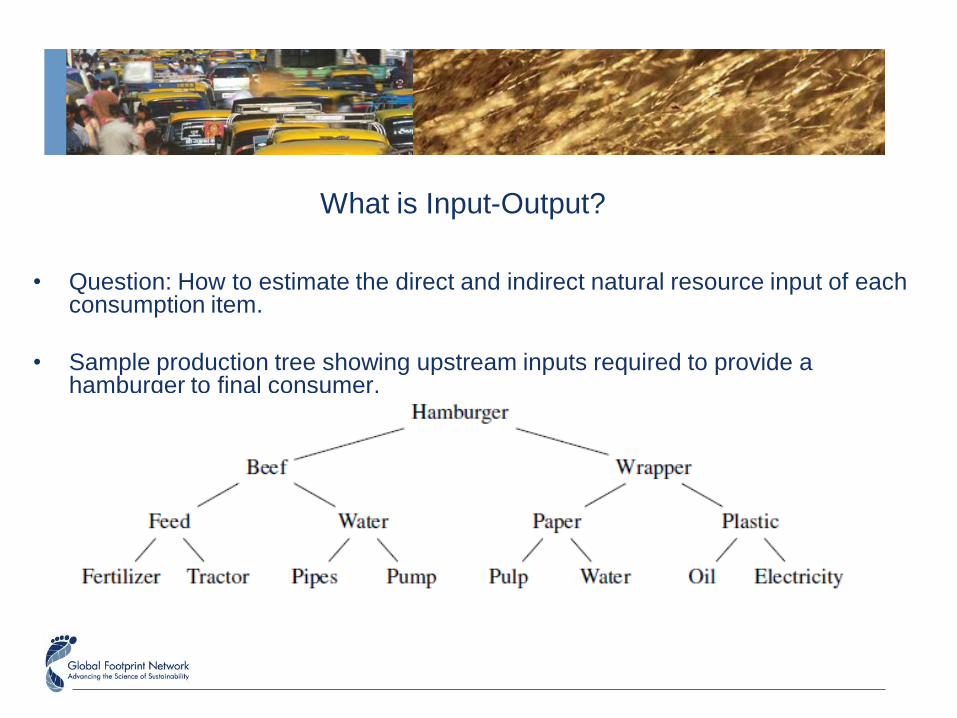
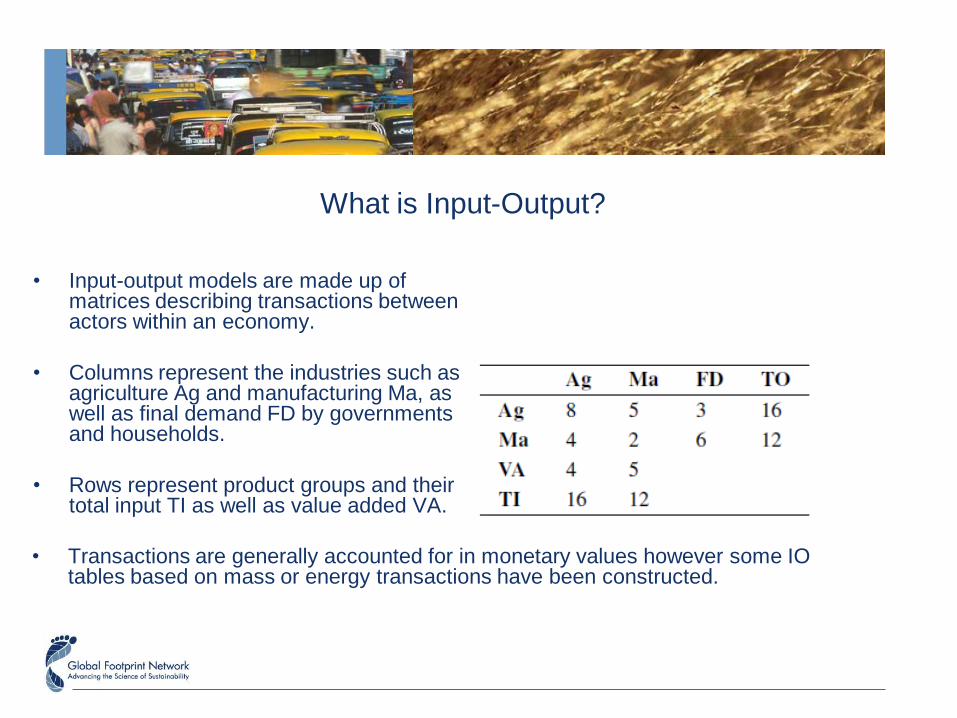
What is Input-Output?
• Question: How to estimate the direct and indirect natural resource input of each consumption item.
• Sample production tree showing upstream inputs required to provide a hamburger to final consumer.
What is Input-Output?
• Input-output models are made up of matrices describing transactions between actors within an economy.
• Columns represent the industries such as agriculture Ag and manufacturing Ma, as well as final demand FD by governments and households.
• Rows represent product groups and their total input TI as well as value added VA.
• Transactions are generally accounted for in monetary values however some IO tables based on mass or energy transactions have been constructed.
Table of Contents
1. What is a CLUM?
2. What is IO?
3. What is MRIO?
4. Use of MRIO
5. How to reconcile NFA and MRIO?
6. Limitations
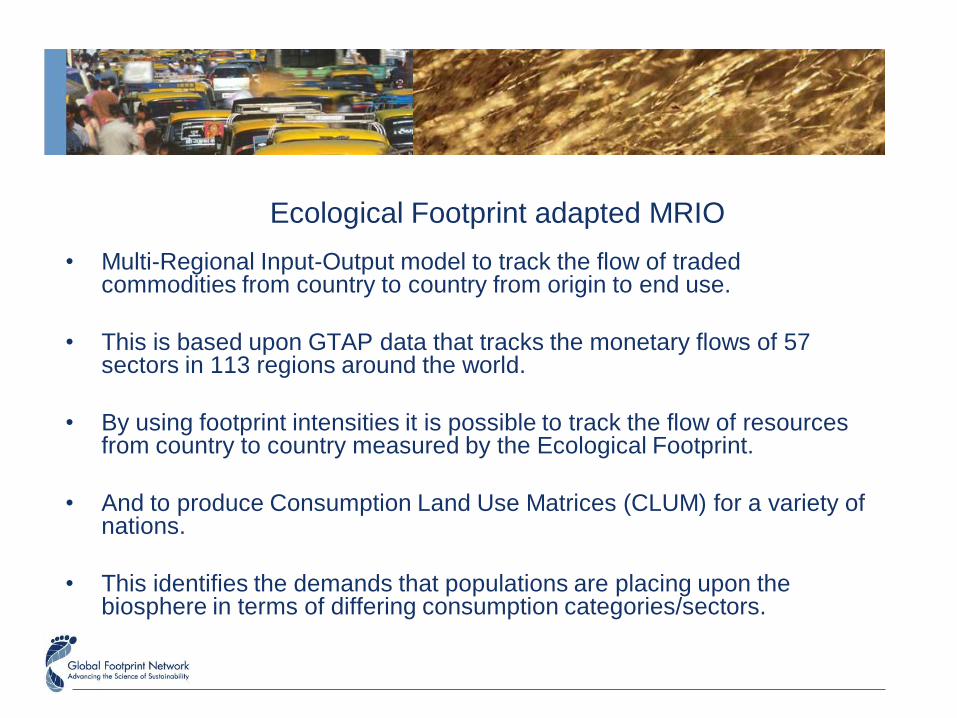
Ecological Footprint adapted MRIO
• Multi-Regional Input-Output model to track the flow of traded commodities from country to country from origin to end use.
• This is based upon GTAP data that tracks the monetary flows of 57 sectors in 113 regions around the world.
• By using footprint intensities it is possible to track the flow of resources from country to country measured by the Ecological Footprint.
• And to produce Consumption Land Use Matrices (CLUM) for a variety of nations.
• This identifies the demands that populations are placing upon the biosphere in terms of differing consumption categories/sectors.
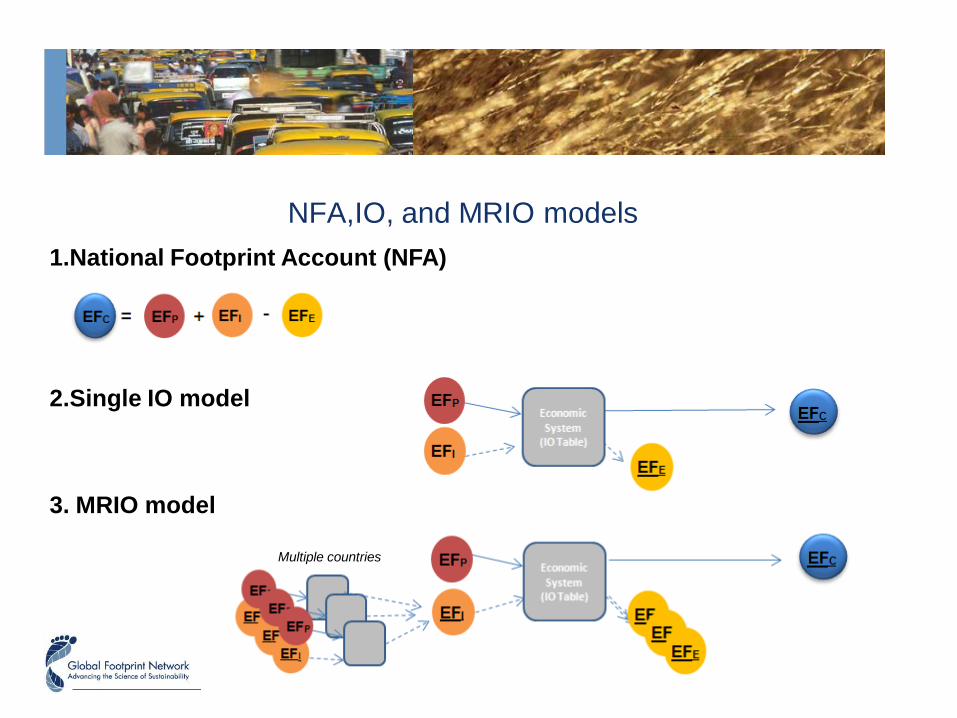
NFA,IO, and MRIO models
1.National Footprint Account (NFA)
3. MRIO model
2.Single IO model
Multiple countries
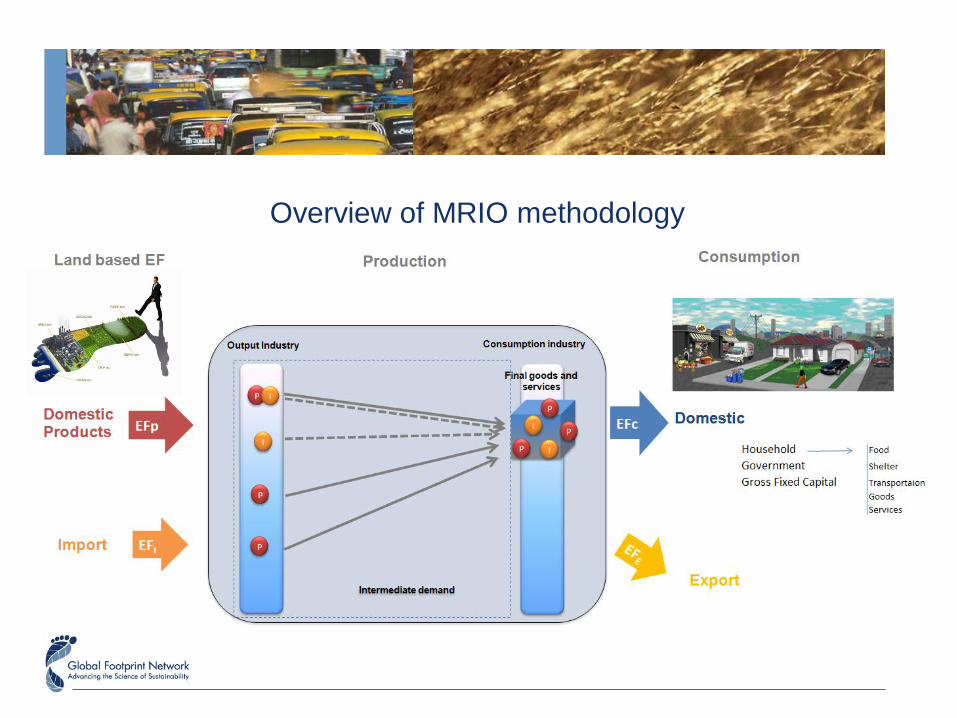
Overview of MRIO methodology
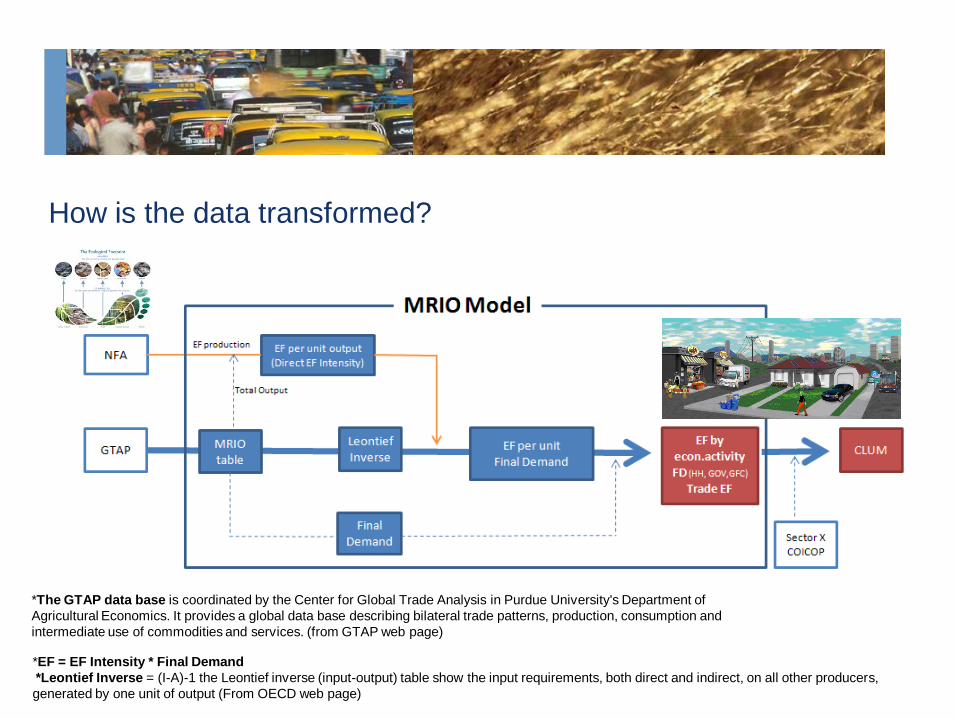
How is the data transformed?
*The GTAP data base is coordinated by the Center for Global Trade Analysis in Purdue University's Department of
Agricultural Economics. It provides a global data base describing bilateral trade patterns, production, consumption and
intermediate use of commodities and services. (from GTAP web page)
*EF = EF Intensity * Final Demand
*Leontief Inverse = (I-A)-1 the Leontief inverse (input-output) table show the input requirements, both direct and indirect, on all other producers,
generated by one unit of output (From OECD web page)
Table of Contents
1. What is a CLUM?
2. What is IO?
3. What is MRIO?
4. Use of MRIO
5. How to reconcile NFA and MRIO?
6. Limitations
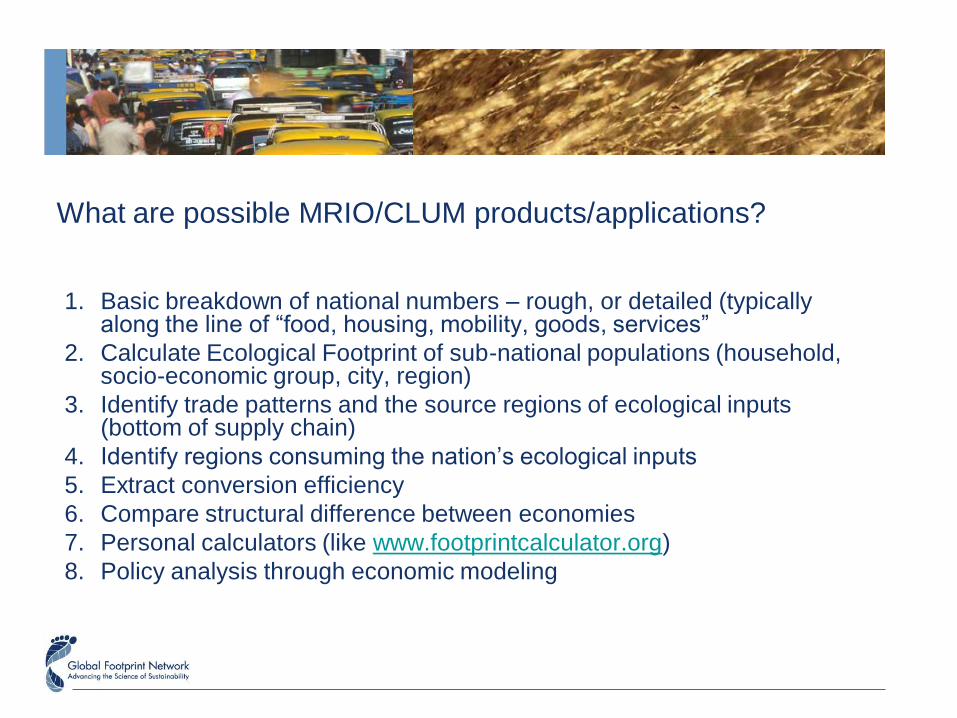
What are possible MRIO/CLUM products/applications?
1. Basic breakdown of national numbers – rough, or detailed (typically along the line of “food, housing, mobility, goods, services”
2. Calculate Ecological Footprint of sub-national populations (household, socio-economic group, city, region)
3. Identify trade patterns and the source regions of ecological inputs (bottom of supply chain)
4. Identify regions consuming the nation’s ecological inputs
5. Extract conversion efficiency
6. Compare structural difference between economies
7. Personal calculators (like www.footprintcalculator.org)
8. Policy analysis through economic modeling
Use of MRIO for analyzing trade patterns
• The results from the MRIO can be used to assess changes in trade patterns.
• As part of Global Footprint Network’s Mediterranean Initiative maps have been developed to show the shift in trading partners with this region and the rest of the world.
• Highlighted here are the trends for imports, but exports can also be assessed.
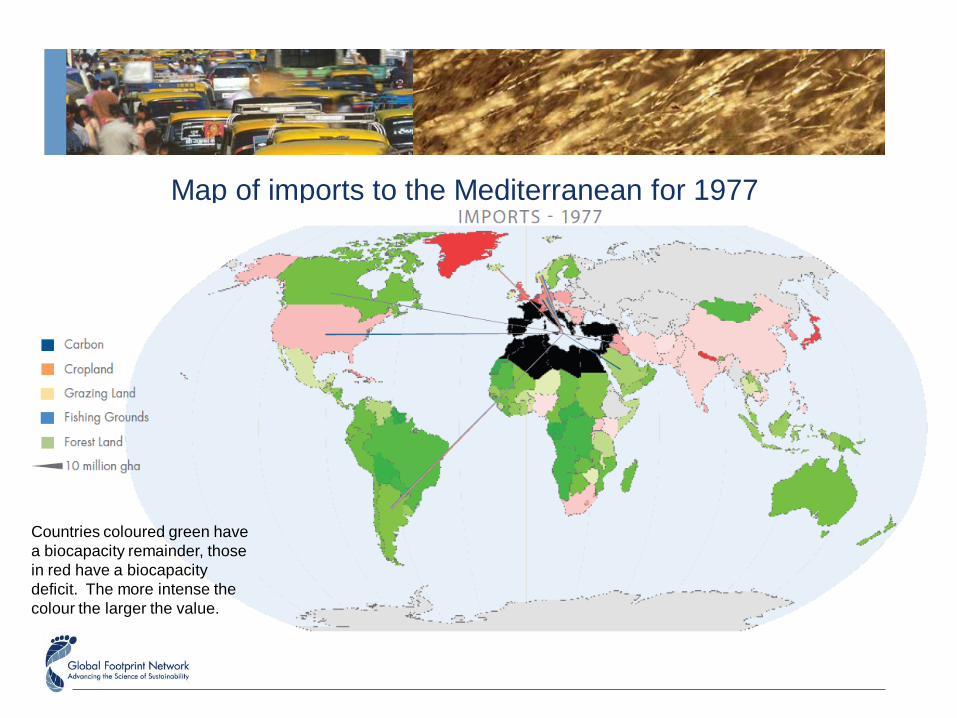
Map of imports to the Mediterranean for 1977
Countries coloured green have
a biocapacity remainder, those
in red have a biocapacity
deficit. The more intense the
colour the larger the value.
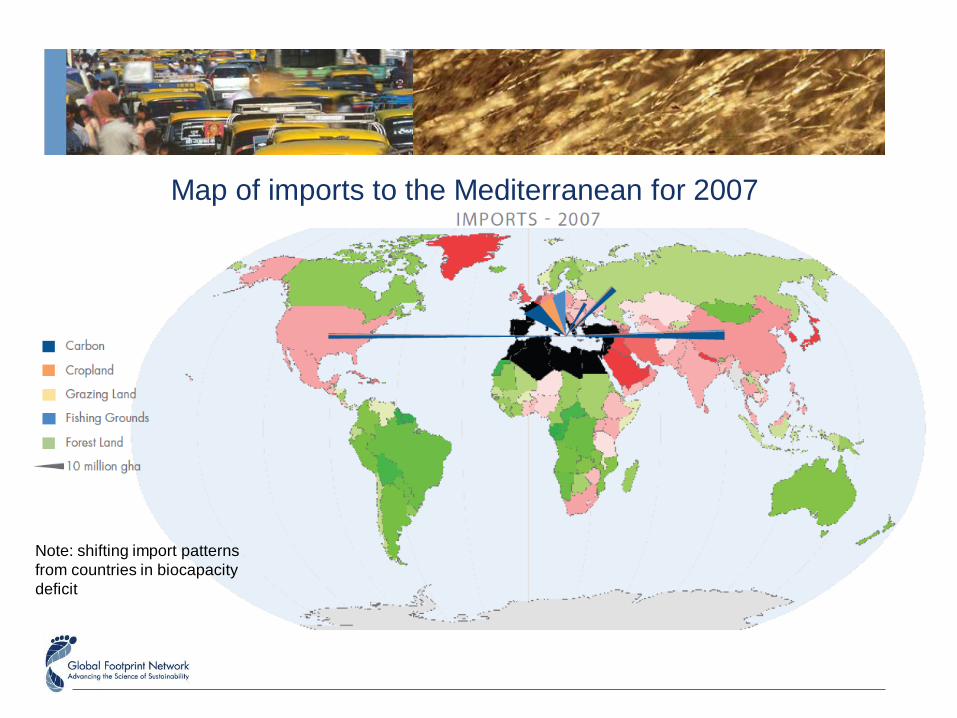
Map of imports to the Mediterranean for 2007
Note: shifting import patterns
from countries in biocapacity
deficit
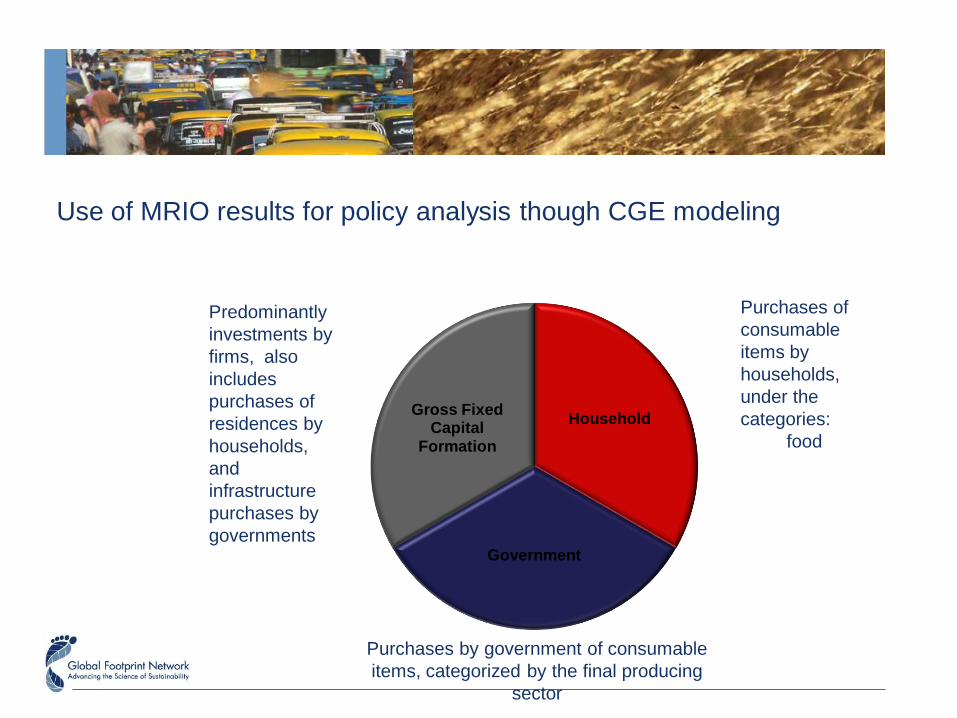
Use of MRIO results for policy analysis though CGE modeling
Household
Government
Gross Fixed Capital
Formation
Purchases of
consumable
items by
households,
under the
categories:
food
Predominantly
investments by
firms, also
includes
purchases of
residences by
households,
and
infrastructure
purchases by
governments
Purchases by government of consumable
items, categorized by the final producing
sector

Footprint of Cities
Table of Contents
1. What is a CLUM?
2. What is IO?
3. What is MRIO?
4. Use of MRIO
5. How to reconcile NFA and MRIO?
6. Limitations
2
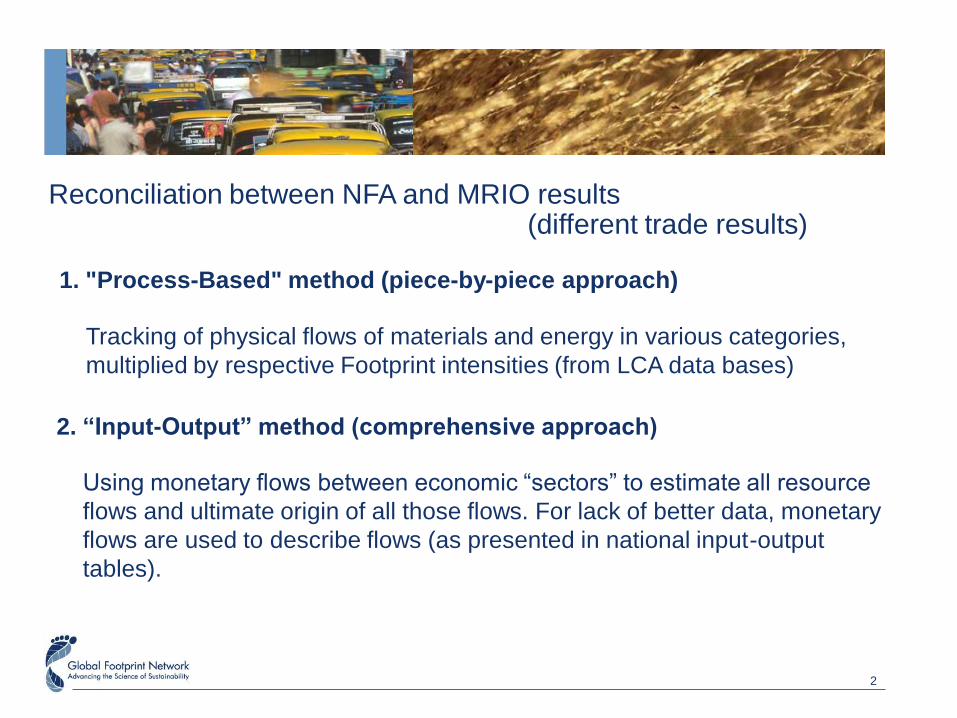
1. "Process-Based" method (piece-by-piece approach)
2. “Input-Output” method (comprehensive approach)
Tracking of physical flows of materials and energy in various categories,
multiplied by respective Footprint intensities (from LCA data bases)
Using monetary flows between economic “sectors” to estimate all resource
flows and ultimate origin of all those flows. For lack of better data, monetary
flows are used to describe flows (as presented in national input-output
tables).
Reconciliation between NFA and MRIO results (different trade results)
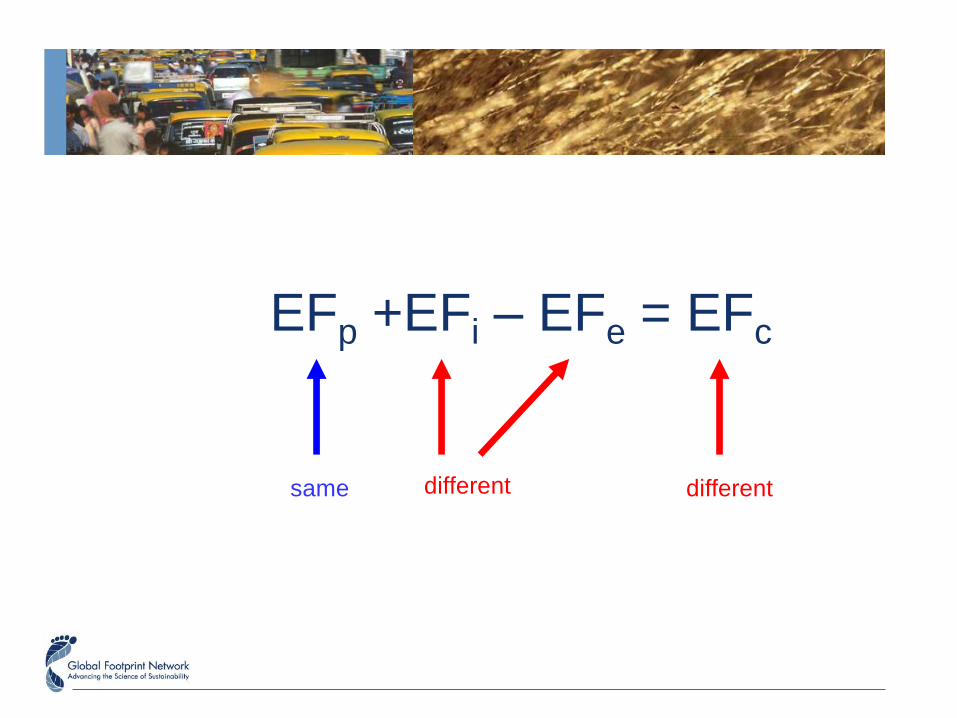
EFp +EFi – EFe = EFc
same different different
Table of Contents
1. What is a CLUM?
2. What is IO?
3. What is MRIO?
4. How to reconcile NFA and MRIO?
5. Limitations
6. Possible Applications
7. Questions?
What are some limitations? (1/2)
1.Uncertainties in source data / Data gaps
• There are substantial data gaps and intermittent publication of input-output tables. the different base year of the tables for various nations. (ex. Honk Kong’s data)
• Monetary flow (e.g., in current MRIO model) vs. physical flow (NFA)
• Monetary exchange rates, fluctuations within a year.
2.Resolution of sectors
• Aggregation and concordance to a common sectoral scheme
• Aggregation is a problem in particular when high and low impacting sectors are combined in one aggregated sector.( electricity together with gas and water production)
What are some limitations? (2/2)
3.Trade flow
• Trade statistics themselves bear a range of uncertainties which are (according to Lenzen et al., 2004, p.405) “ … due to
– time lags between shipping of exports and receipt of imports
– differences in commodity classification
– reporting errors
– losses due to accidents in transits
– discrepancies of origin and destination country due to commodity re-export.
4.Concordance between “industrial sectors” and consumption categories
The output from some industrial sectors corresponds to multiple consumption categories. In creating a concordance between industrial sectors and consumption categories, assumptions must be made regarding the distribution based on available data.

11111
Thank you for your attention

What is a CLUM?
2
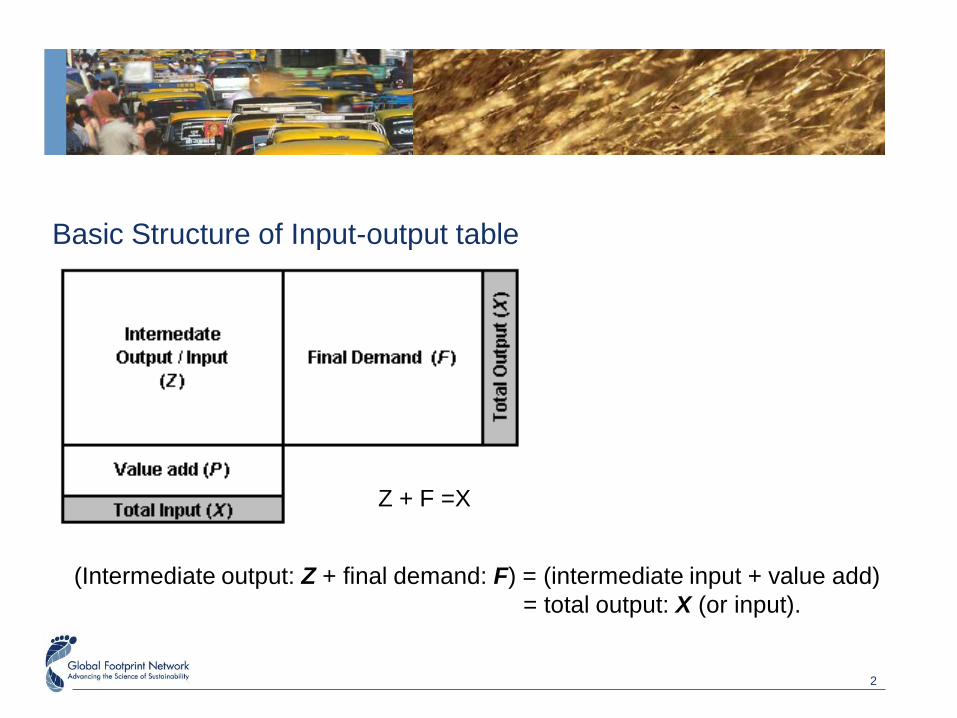
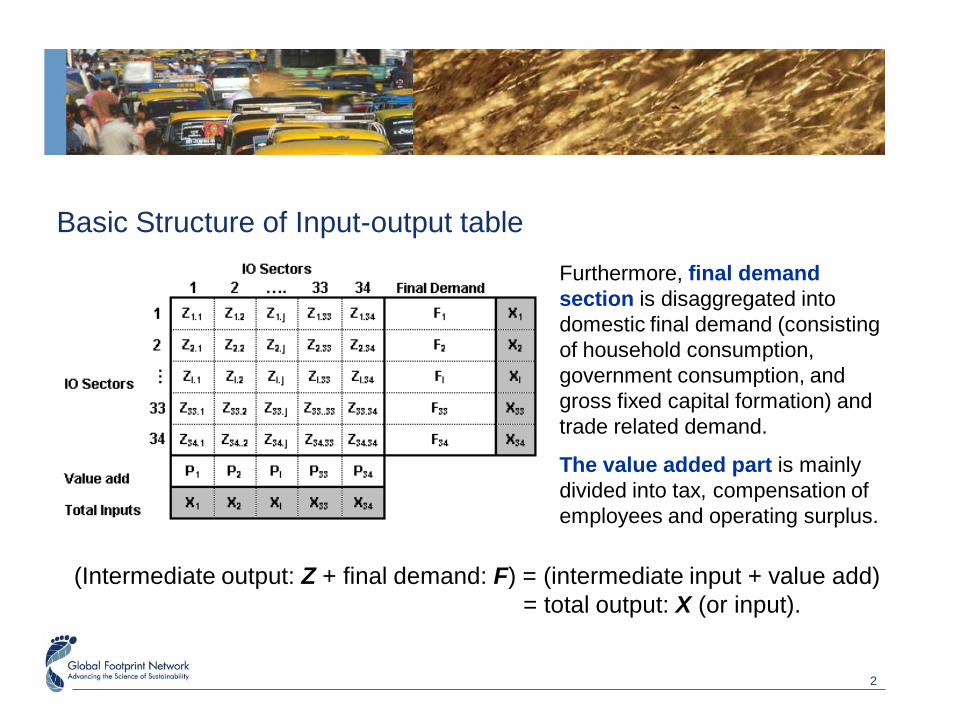
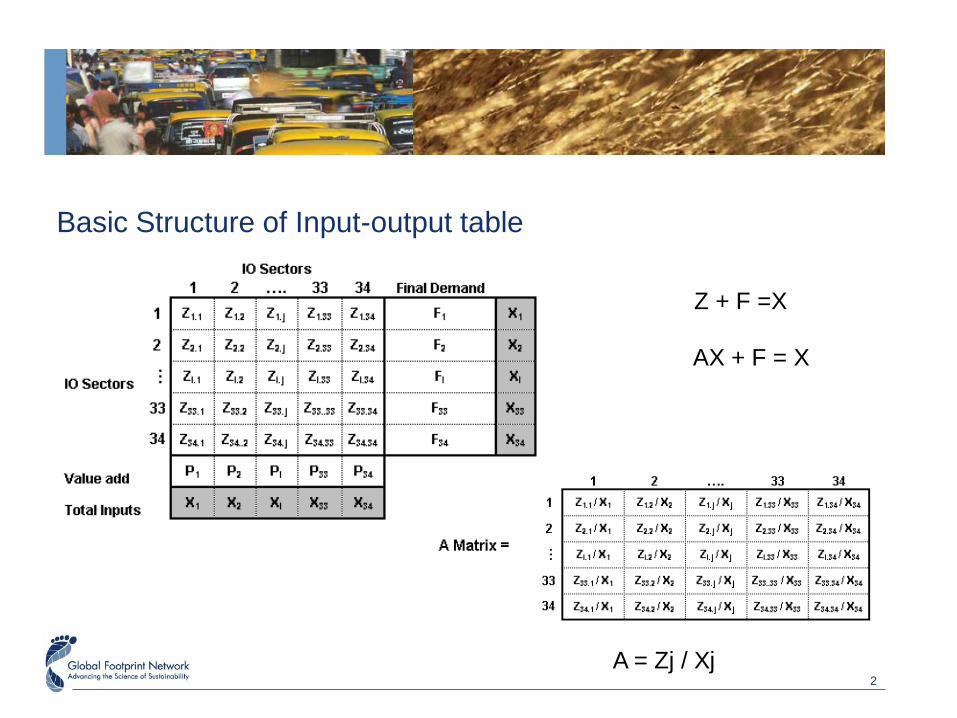
Basic Structure of Input-output table
(Intermediate output: Z + final demand: F) = (intermediate input + value add)
= total output: X (or input).
Z + F =X
2
Furthermore, final demand
section is disaggregated into
domestic final demand (consisting
of household consumption,
government consumption, and
gross fixed capital formation) and
trade related demand.
The value added part is mainly
divided into tax, compensation of
employees and operating surplus.
(Intermediate output: Z + final demand: F) = (intermediate input + value add)
= total output: X (or input).
Basic Structure of Input-output table
2
Z + F =X
AX + F = X
A = Zj / Xj
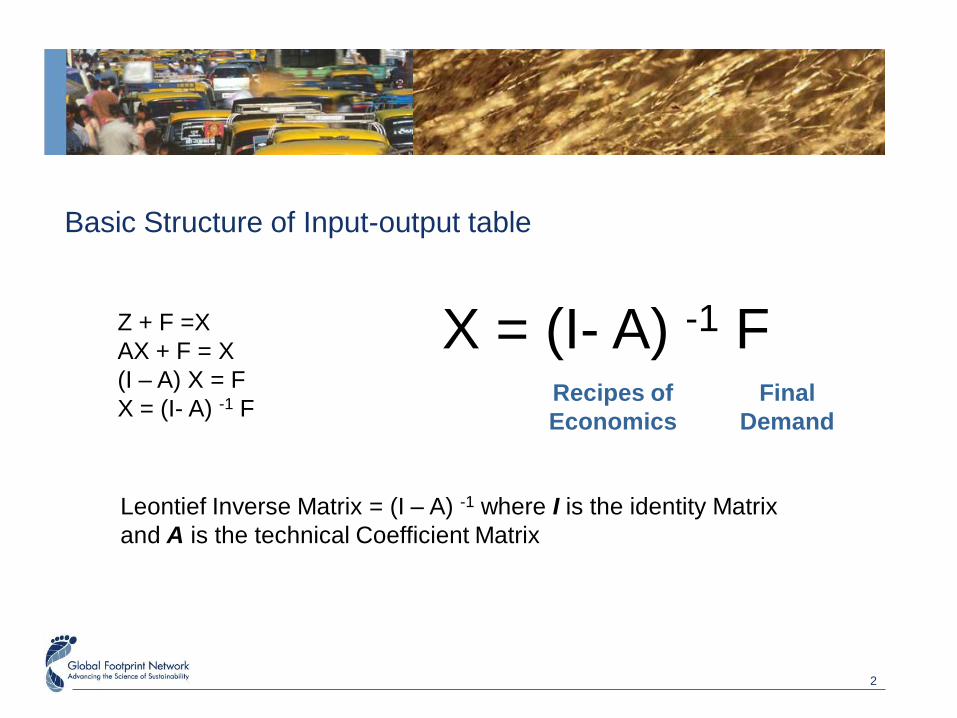
Basic Structure of Input-output table
2
Z + F =X
AX + F = X
(I – A) X = F
X = (I- A) -1 F
Leontief Inverse Matrix = (I – A) -1 where I is the identity Matrix
and A is the technical Coefficient Matrix
X = (I- A) -1 F Recipes of
Economics
Final
Demand
Basic Structure of Input-output table
2
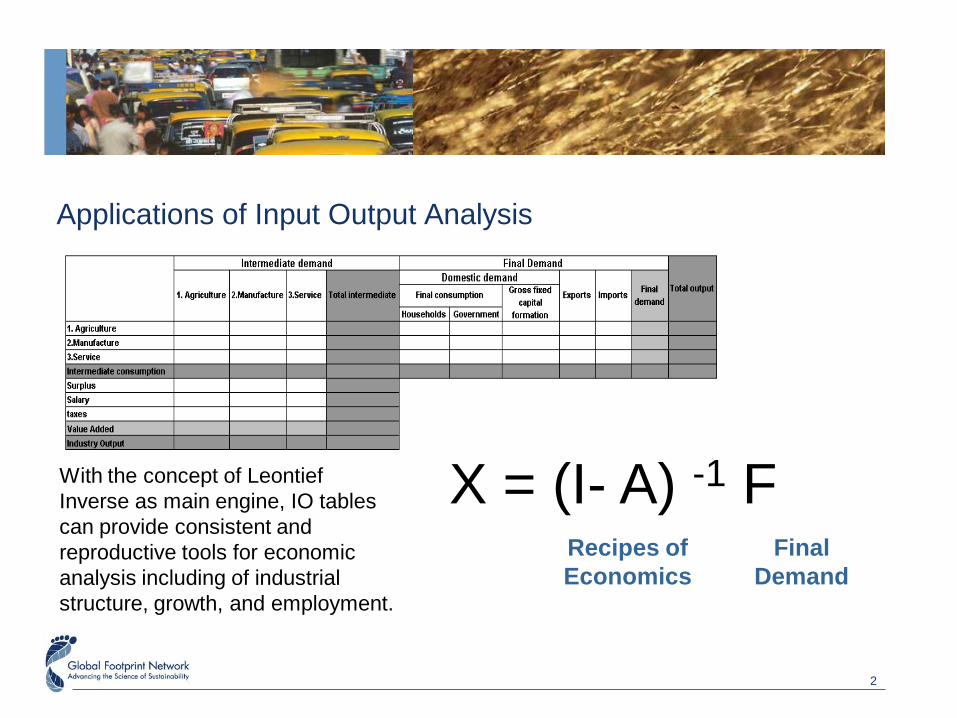
Applications of Input Output Analysis
X = (I- A) -1 F Recipes of
Economics
Final
Demand
With the concept of Leontief
Inverse as main engine, IO tables
can provide consistent and
reproductive tools for economic
analysis including of industrial
structure, growth, and employment.
2
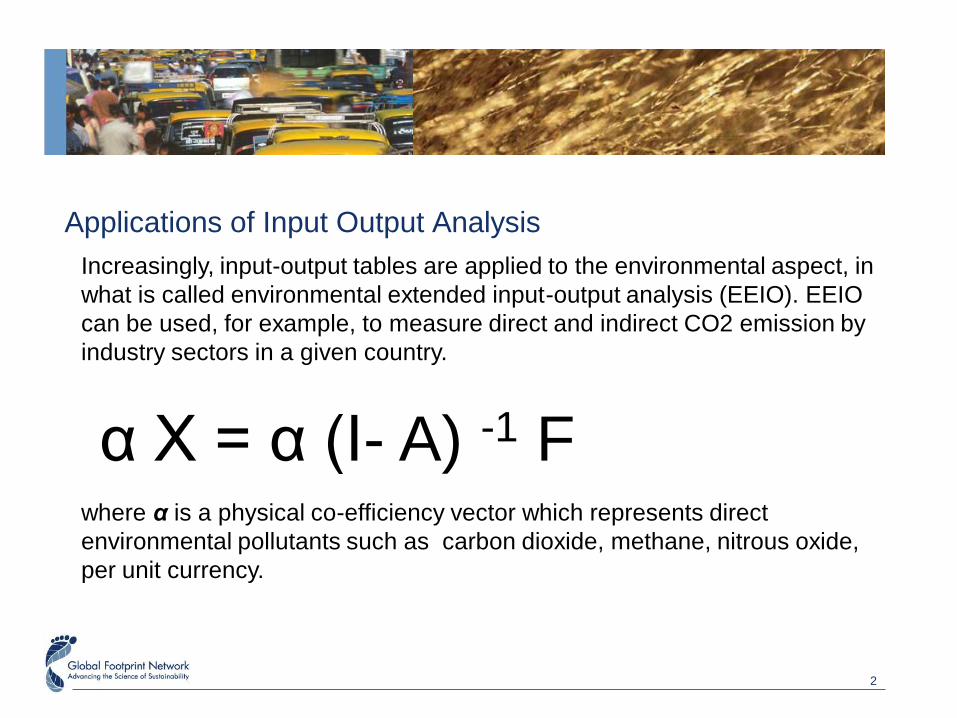
α X = α (I- A) -1 F
Increasingly, input-output tables are applied to the environmental aspect, in
what is called environmental extended input-output analysis (EEIO). EEIO
can be used, for example, to measure direct and indirect CO2 emission by
industry sectors in a given country.
where α is a physical co-efficiency vector which represents direct
environmental pollutants such as carbon dioxide, methane, nitrous oxide,
per unit currency.
Applications of Input Output Analysis
2
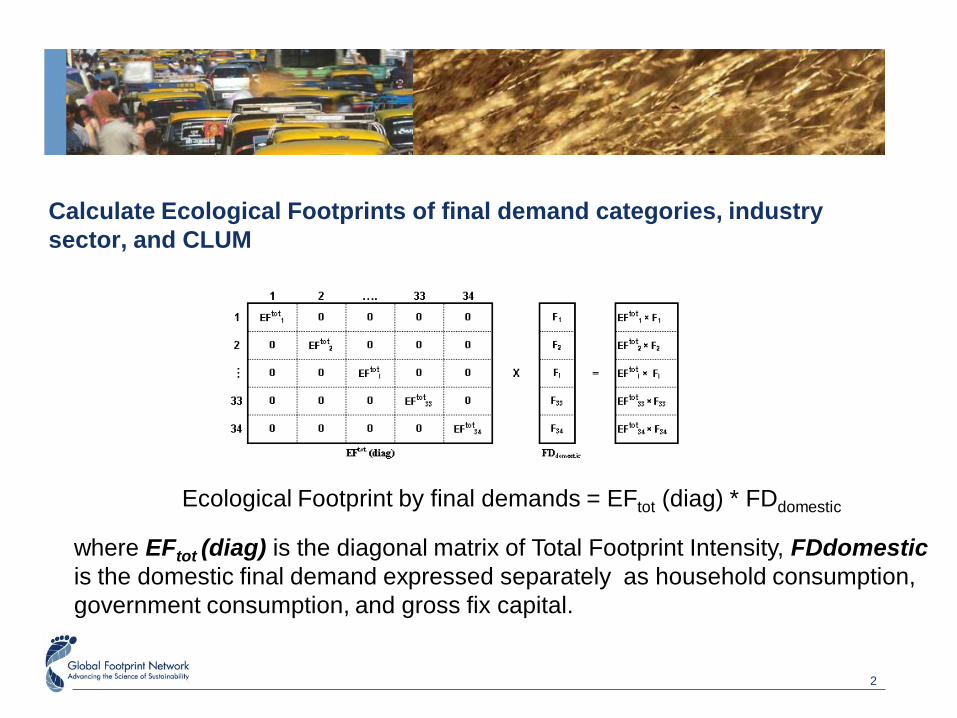
Calculate Ecological Footprints of final demand categories, industry
sector, and CLUM
Ecological Footprint by final demands = EFtot (diag) * FDdomestic
where EFtot (diag) is the diagonal matrix of Total Footprint Intensity, FDdomestic
is the domestic final demand expressed separately as household consumption,
government consumption, and gross fix capital.
2
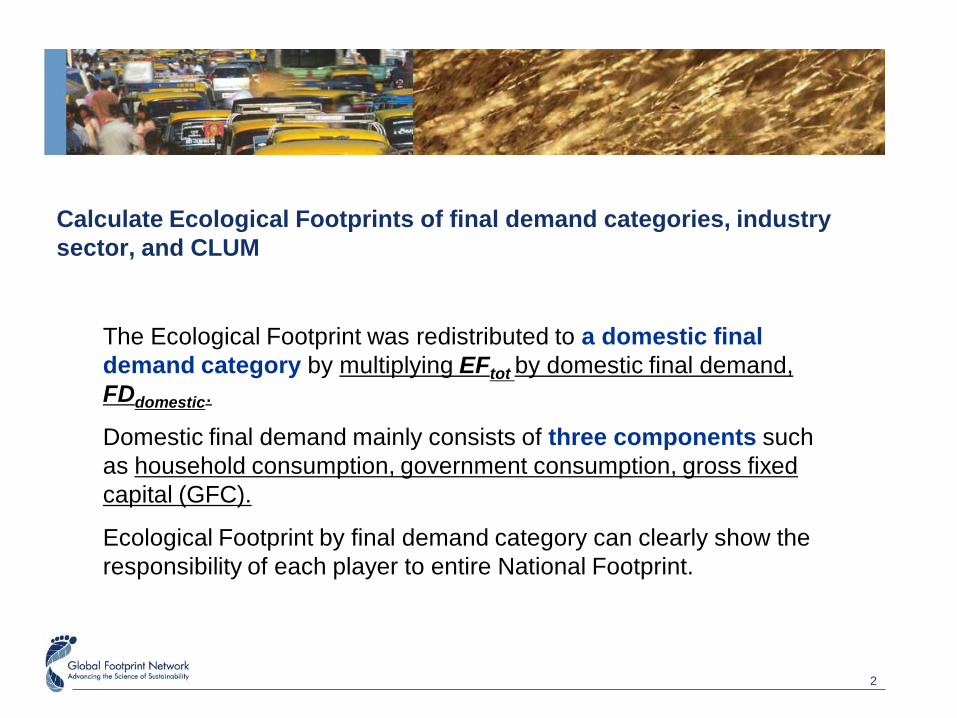
Calculate Ecological Footprints of final demand categories, industry
sector, and CLUM
The Ecological Footprint was redistributed to a domestic final
demand category by multiplying EFtot by domestic final demand,
FDdomestic.
Domestic final demand mainly consists of three components such
as household consumption, government consumption, gross fixed
capital (GFC).
Ecological Footprint by final demand category can clearly show the
responsibility of each player to entire National Footprint.
2
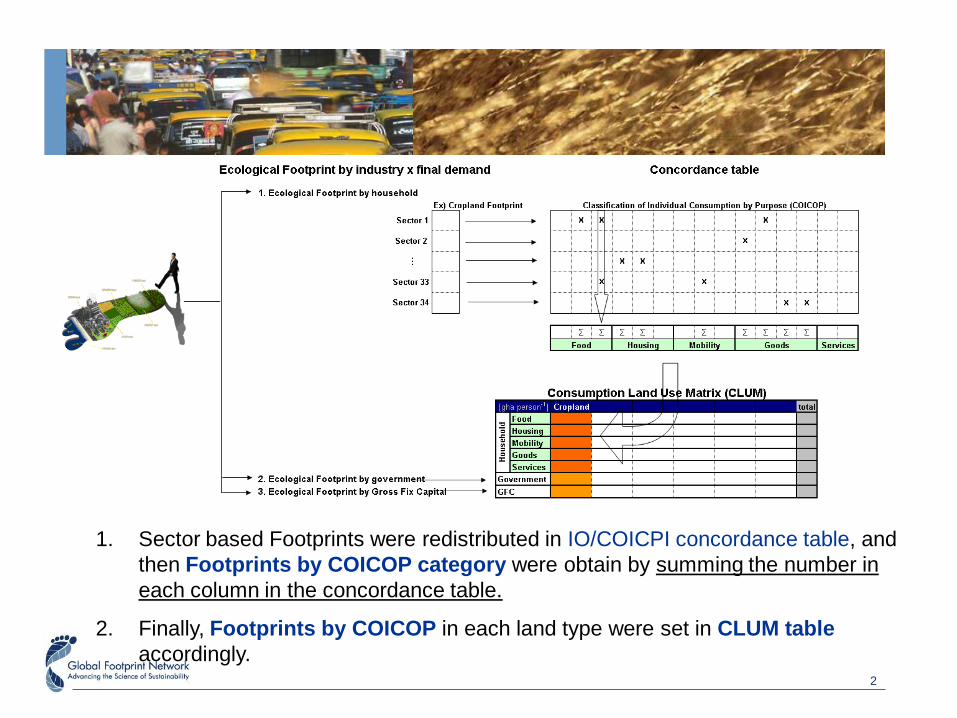
1. Sector based Footprints were redistributed in IO/COICPI concordance table, and
then Footprints by COICOP category were obtain by summing the number in
each column in the concordance table.
2. Finally, Footprints by COICOP in each land type were set in CLUM table
accordingly.
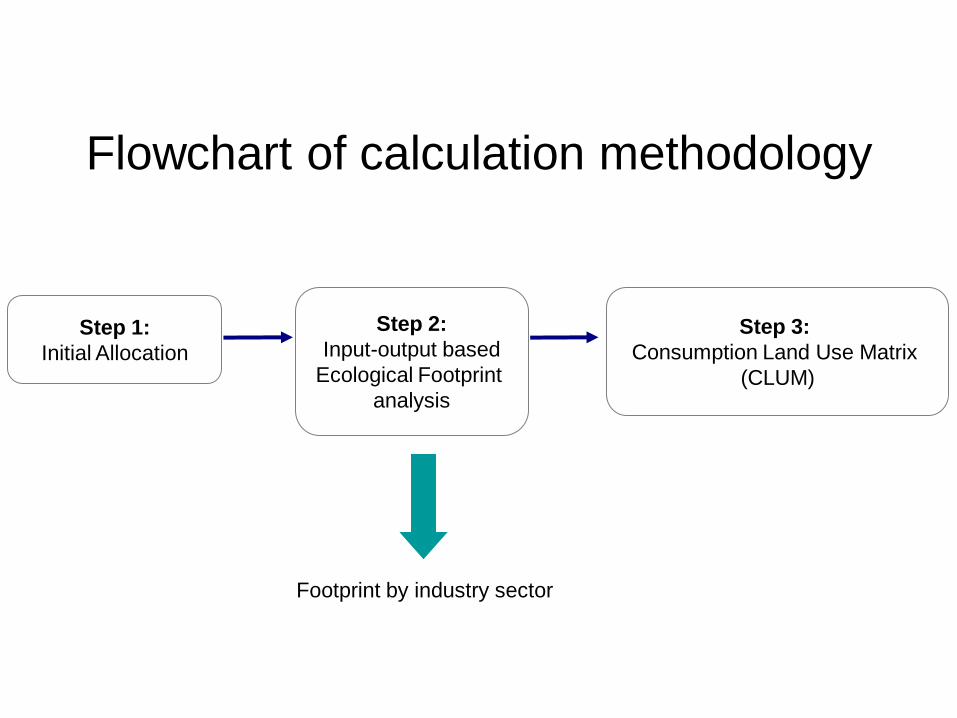
Flowchart of calculation methodology
Step 3:
Consumption Land Use Matrix
(CLUM)
Step 2:
Input-output based
Ecological Footprint
analysis
Step 1:
Initial Allocation
Footprint by industry sector
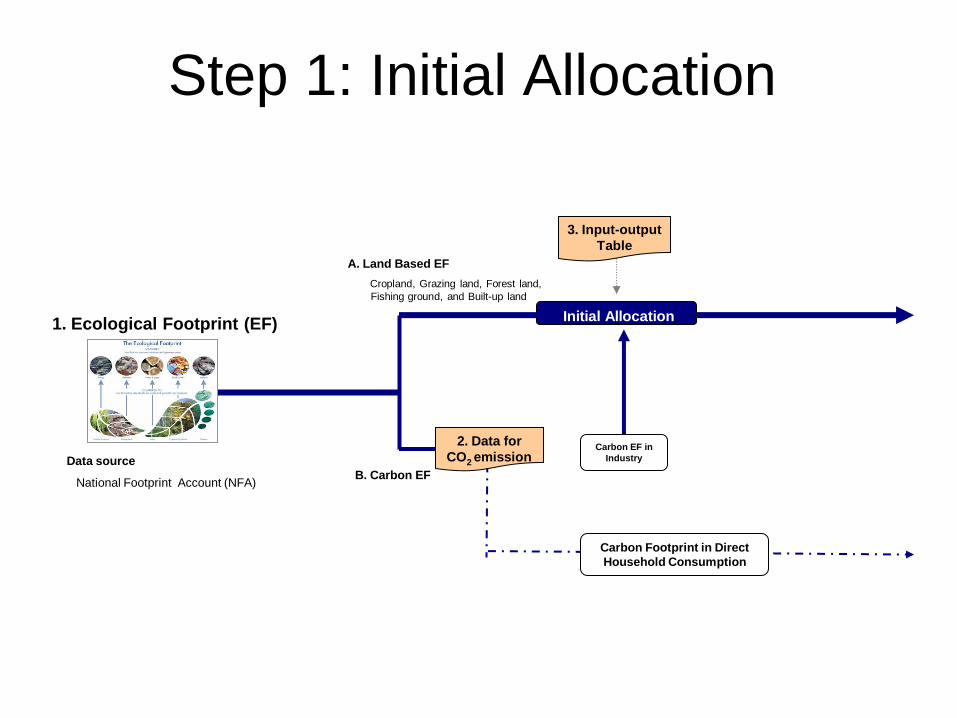
Step 1: Initial Allocation
Carbon EF in
Industry
Initial Allocation
2. Data for
CO2 emission
Carbon Footprint in Direct
Household Consumption
3. Input-output
Table
1. Ecological Footprint (EF)
A. Land Based EF
Cropland, Grazing land, Forest land,
Fishing ground, and Built-up land
B. Carbon EF
Data source
National Footprint Account (NFA)
Results
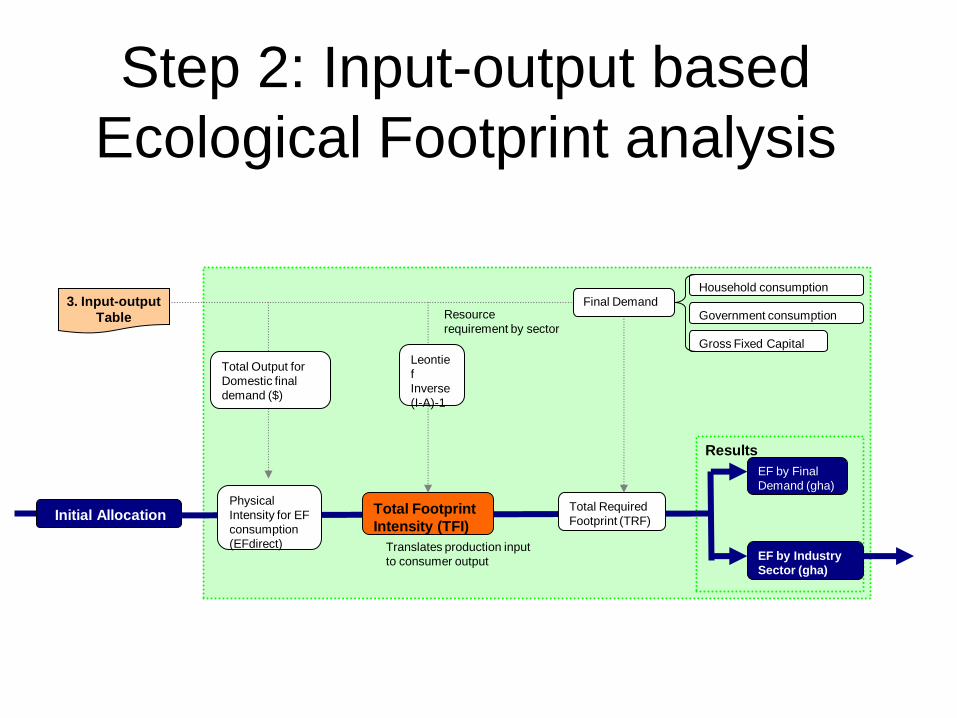
Step 2: Input-output based
Ecological Footprint analysis
Total Footprint
Intensity (TFI)
Physical
Intensity for EF
consumption
(EFdirect)
Government consumption
Household consumption
Gross Fixed Capital
Total Required
Footprint (TRF)
EF by Final
Demand (gha)
EF by Industry
Sector (gha)
Total Output for
Domestic final
demand ($)
Leontie
f
Inverse
(I-A)-1
Initial Allocation
Translates production input
to consumer output
Resource
requirement by sector
Final Demand 3. Input-output
Table
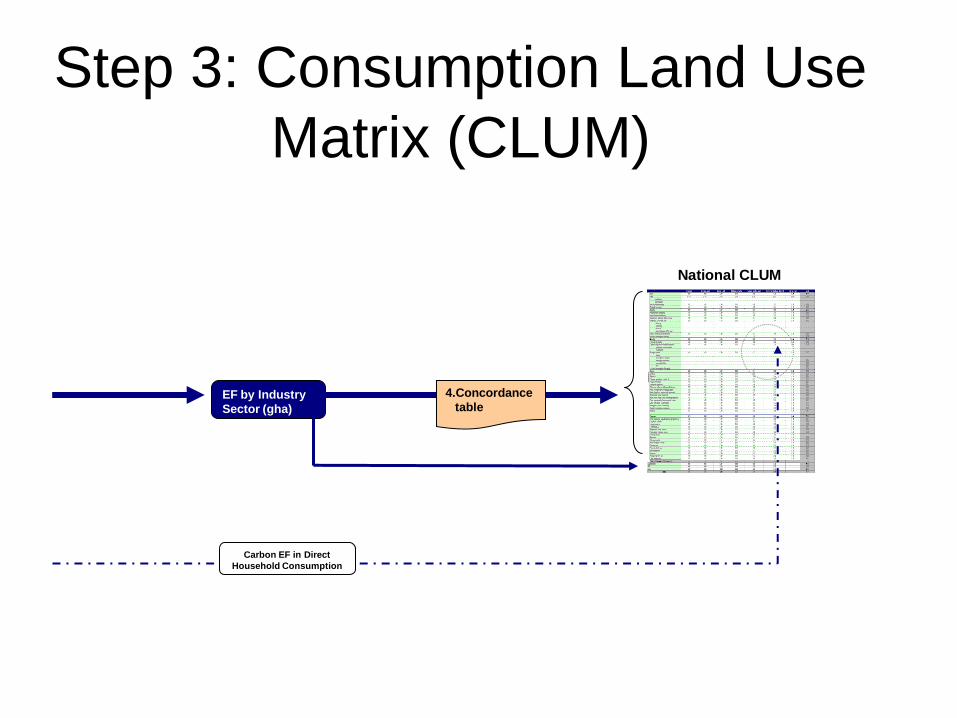
Step 3: Consumption Land Use
Matrix (CLUM)
EF by Industry
Sector (gha)
4.Concordance
table
Carbon EF in Direct
Household Consumption
National CLUM

Work hard!
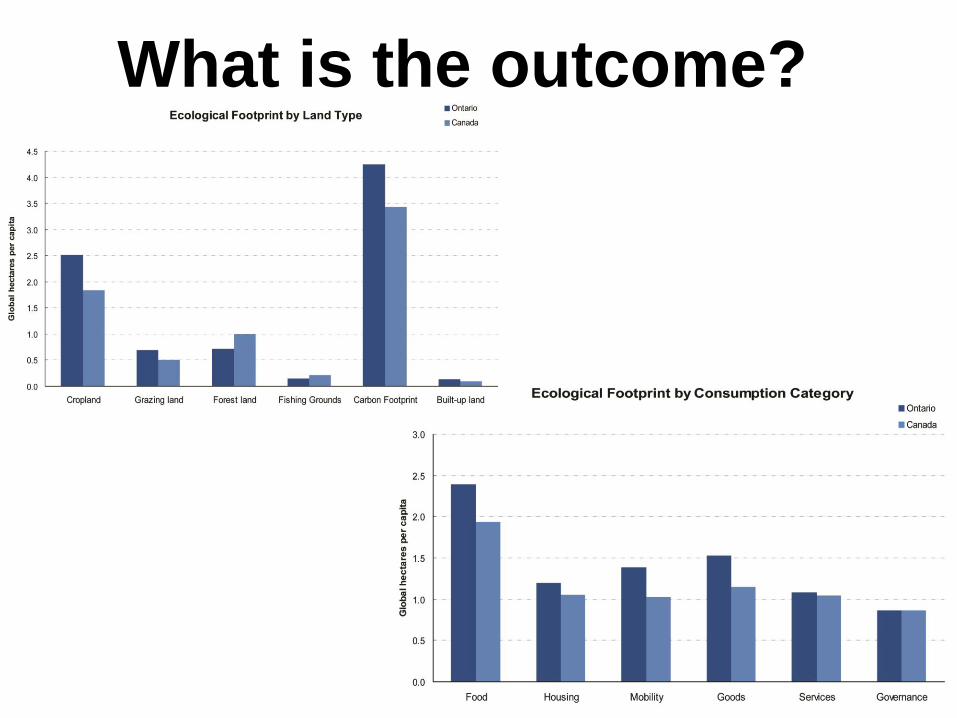
What is the outcome?
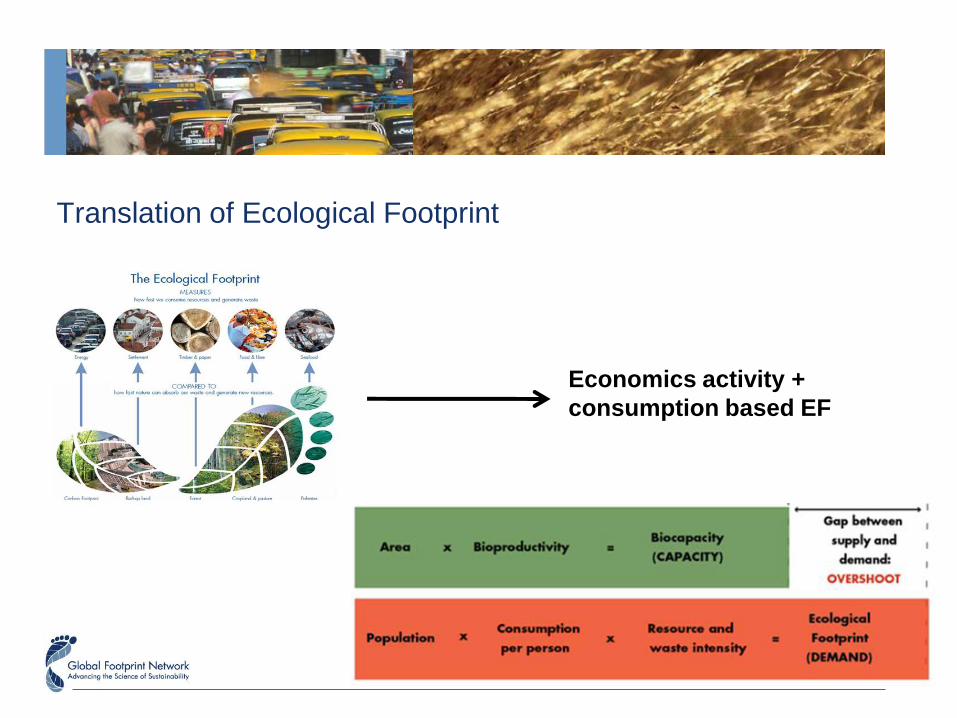
Translation of Ecological Footprint
Economics activity +
consumption based EF