Embed Size (px)
Citation preview
Mobile Source Emissions & Biofuels:An Overview of Selected Canadian Federal R&D

2
Outline
• Emissions Research and Measurement Division Facility
• Biodiesel Targeted Measure• Light duty ethanol programs• Biofuels and advanced combustion strategies• Summary of major findings
3
Acknowledgements• The work presented is the
product of the ERMD team along with our many partners.
• Fred Hendren, Division Chief• Project Management
– Greg Rideout– Debbie Rosenblatt– Jill Hendren– Norman Meyer– Sheri Belisle– Cara Baas
• Sample Collection Technologists– Scott Dey– Shannon Furino
• Chemistry Lab Staff– Trevor Connolly– Anthony Tong– Diane Dey– Kerri Longlade
• Vehicle and Engine Operations– Peter Barton– Jacek Rostkowski– Christopher Beregszaszy– Steve Rutherford– Guy Bracewell– Mike White– Ron Moodie– Brent Gauthier– Wayne Baas
4
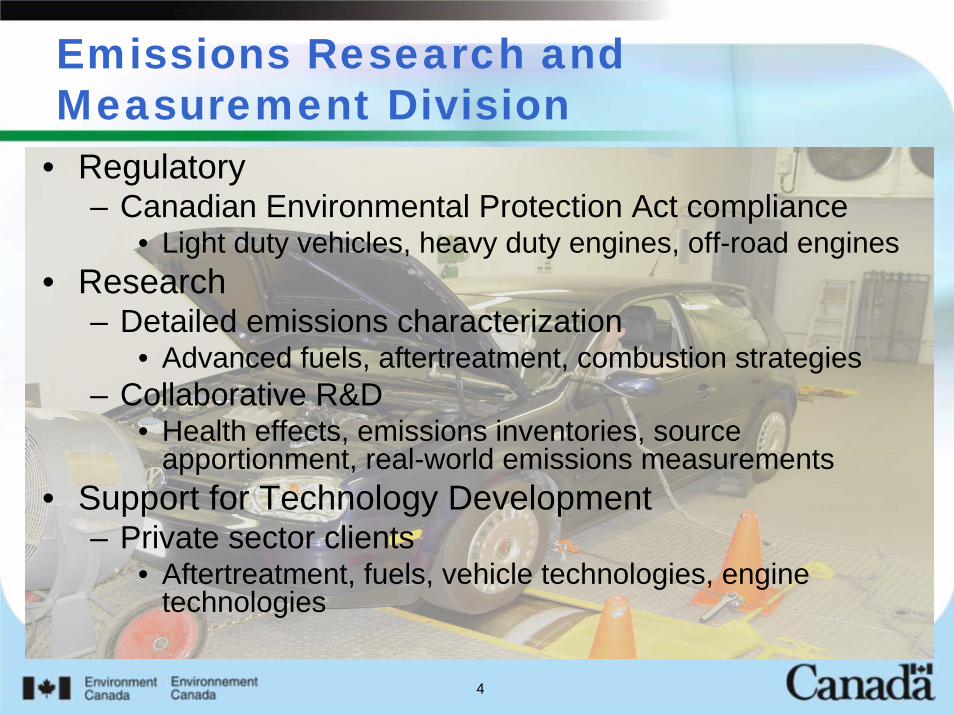
Emissions Research and Measurement Division
• Regulatory– Canadian Environmental Protection Act compliance
• Light duty vehicles, heavy duty engines, off-road engines• Research
– Detailed emissions characterization• Advanced fuels, aftertreatment, combustion strategies
– Collaborative R&D• Health effects, emissions inventories, source
apportionment, real-world emissions measurements• Support for Technology Development
– Private sector clients• Aftertreatment, fuels, vehicle technologies, engine
technologies
5
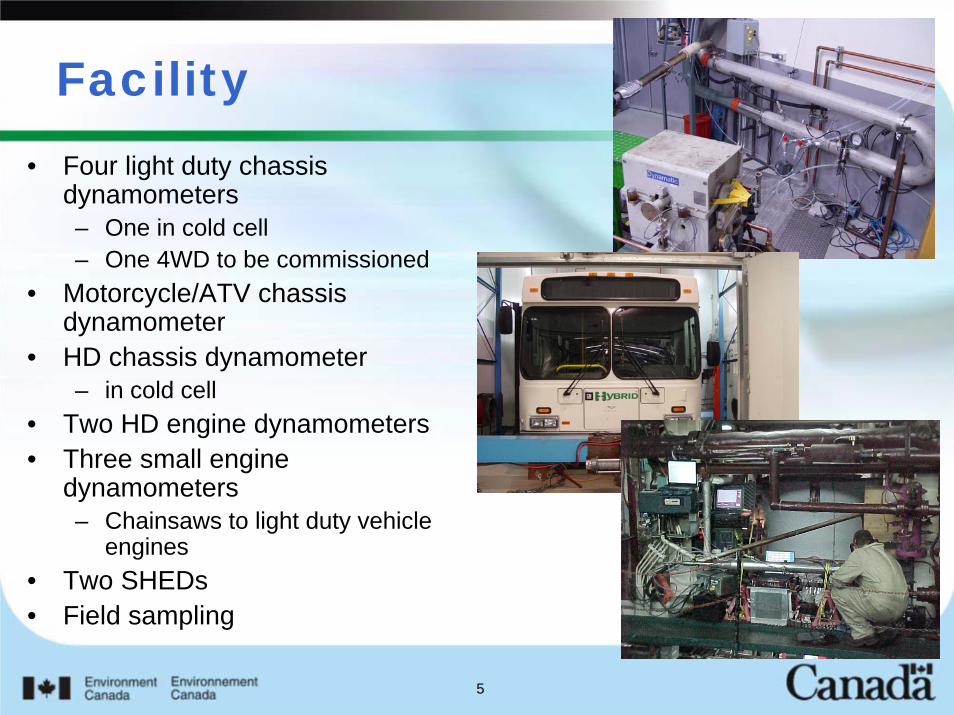
Facility• Four light duty chassis
dynamometers– One in cold cell– One 4WD to be commissioned
• Motorcycle/ATV chassis dynamometer
• HD chassis dynamometer – in cold cell
• Two HD engine dynamometers• Three small engine
dynamometers– Chainsaws to light duty vehicle
engines• Two SHEDs• Field sampling
Biodiesel Activities
7
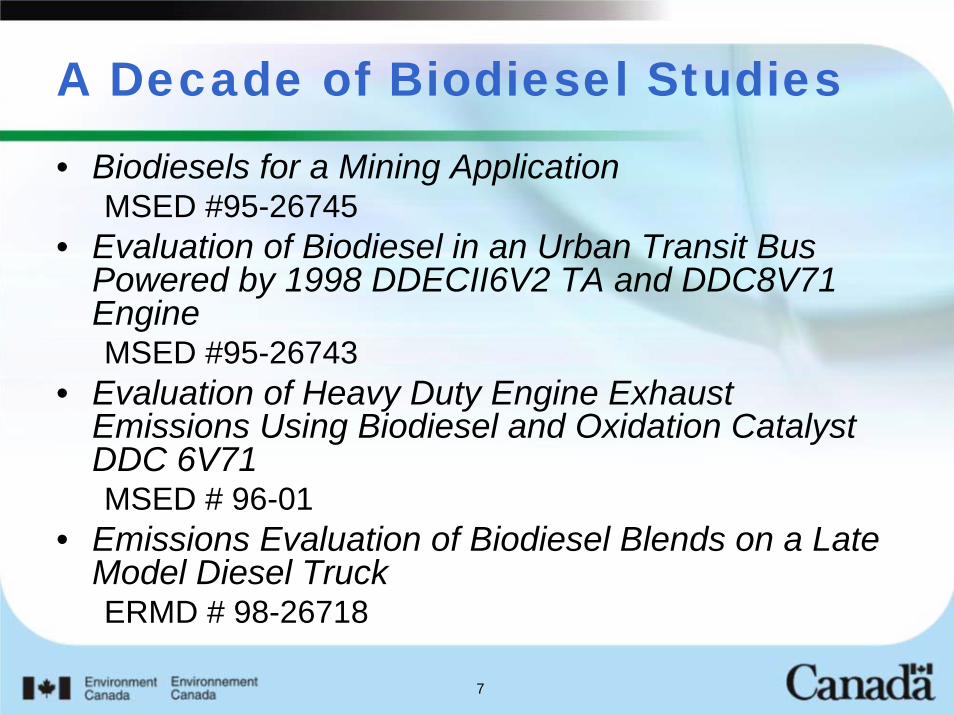
A Decade of Biodiesel Studies• Biodiesels for a Mining Application
MSED #95-26745• Evaluation of Biodiesel in an Urban Transit Bus
Powered by 1998 DDECII6V2 TA and DDC8V71 EngineMSED #95-26743
• Evaluation of Heavy Duty Engine Exhaust Emissions Using Biodiesel and Oxidation Catalyst DDC 6V71MSED # 96-01
• Emissions Evaluation of Biodiesel Blends on a Late Model Diesel TruckERMD # 98-26718
Biodiesel Targeted Measure
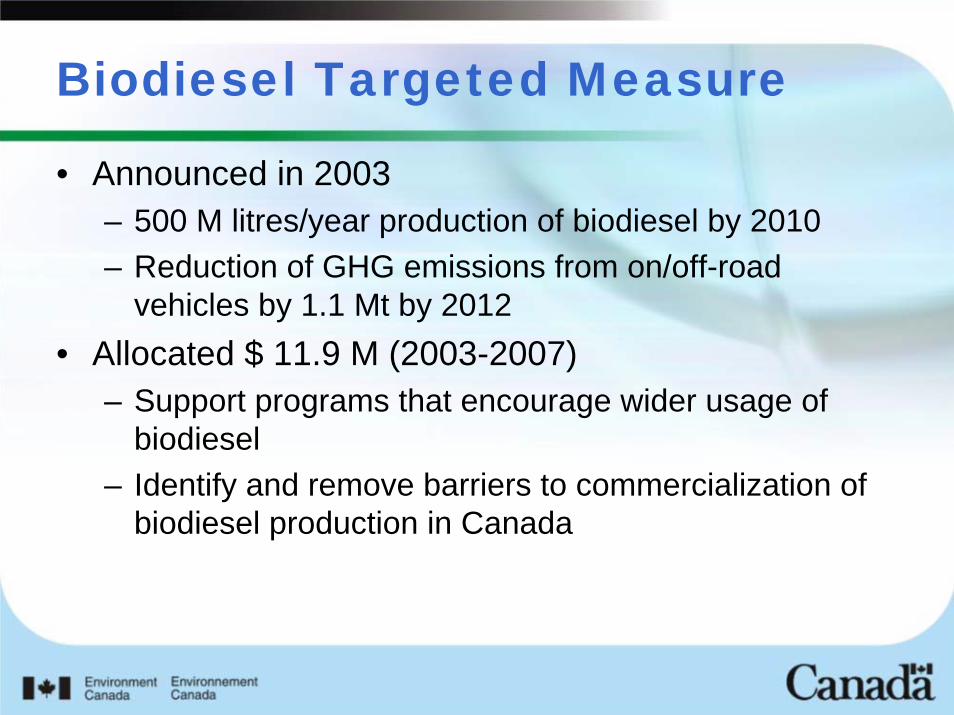
• Announced in 2003 – 500 M litres/year production of biodiesel by 2010– Reduction of GHG emissions from on/off-road
vehicles by 1.1 Mt by 2012• Allocated $ 11.9 M (2003-2007)
– Support programs that encourage wider usage of biodiesel
– Identify and remove barriers to commercialization of biodiesel production in Canada
9
Biodiesel Targeted Measure
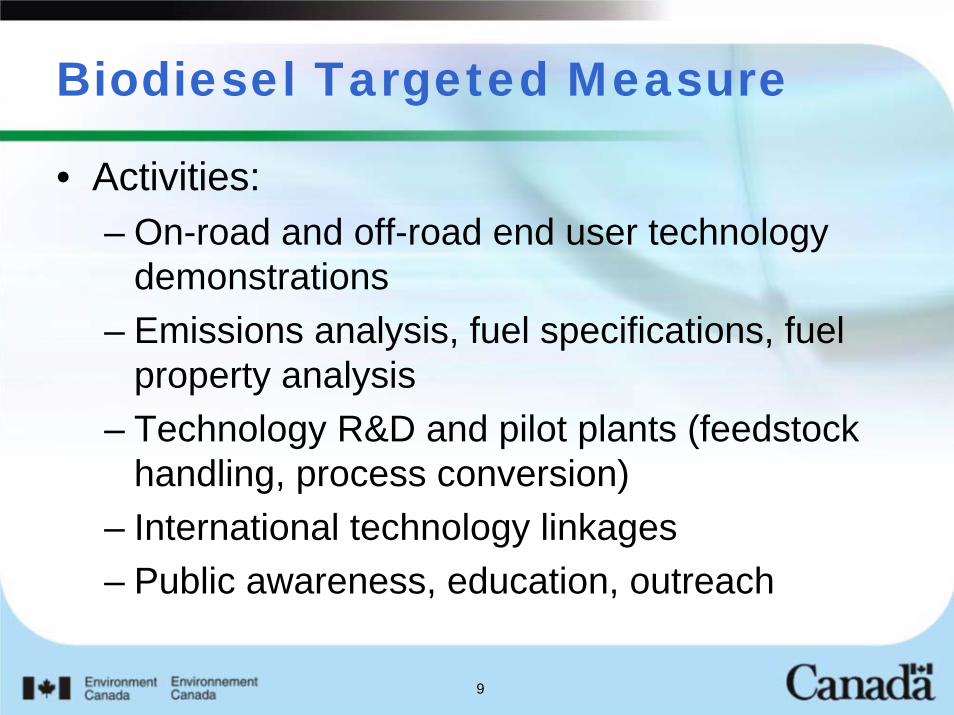
• Activities:– On-road and off-road end user technology
demonstrations– Emissions analysis, fuel specifications, fuel
property analysis– Technology R&D and pilot plants (feedstock
handling, process conversion)– International technology linkages– Public awareness, education, outreach

10
Emissions Studies• Urban Transit Buses
– BioBus– Halifax Transit Authority– GVRD Bus Technology Demo
• Class 8 Highway Trucks– Biodiesel Byway– Effect of Biodiesel on Criteria Air
Contaminants • HDE’s & Advanced After-Treatment
Technologies– Biodiesel fuel matrix– Diesel Particulate Filters
• Both Passive and Active Regeneration Strategies
– SCR Technologies (2 manufacturers)• Non-Road
– BioMer – river tour boats in Montreal– BioShip – Cargo Vessel Auxiliary
Engine– Gen Sets
• Criteria emissions– CO, NOX, TPM, HC– Fuel consumption
• Detailed emissions characterization– NMHC, carbonyls– organic acids– semiquantitative analysis for
oxygenated compounds– CH4, N2O– SO2, NH3– OC-EC– PM ions, metals– PM/SVOC characterization
• PAH, NO2PAH• Alkanes, biomarkers,
alkylcyclohexanes

11
Urban Buses
• Test Engines: – 98 Cummins 8.3L
mechanical fuel injection– 02 Cummins 8.3L
electronic fuel injection – 1999 NOVA LFS
Cummins ISC 250– 1994 NOVA Classic DDC
6V92• Test Fuels: B5, B20 • Feedstocks include canola,
animal tallow, recycled yellow grease, fish oil
12
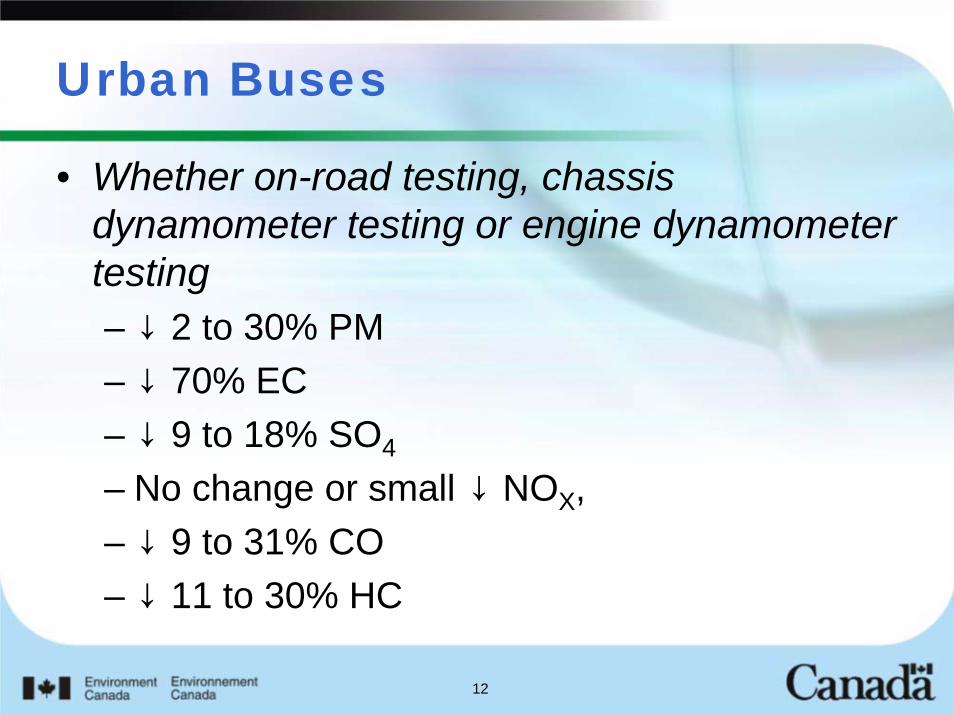
Urban Buses
• Whether on-road testing, chassis dynamometer testing or engine dynamometer testing– ↓ 2 to 30% PM – ↓ 70% EC– ↓ 9 to 18% SO4
– No change or small ↓ NOX, – ↓ 9 to 31% CO– ↓ 11 to 30% HC

13
Urban Buses
• Common Themes– PM
• Mechanical control engines showed greater decreases than electronic control engines
– NOX• If observed, electronic control engines showed
decrease. No change for mechanical control engines.
– Fuel Consumption• No statistically significant difference compared
to ULSD

14
Class 8 Highway Trucks
• Three Class 8 highway tractors– Engines: Cummins,
Caterpillar, Mercedes• Full emissions
characterization on chassis dynamometer (HD-UDDS)
• Test Fuels: – LSD, Biodiesel Blends; B2,
B5, B20, B100 – One test with ULSD/B20– One test with B5 @ -10oC
15
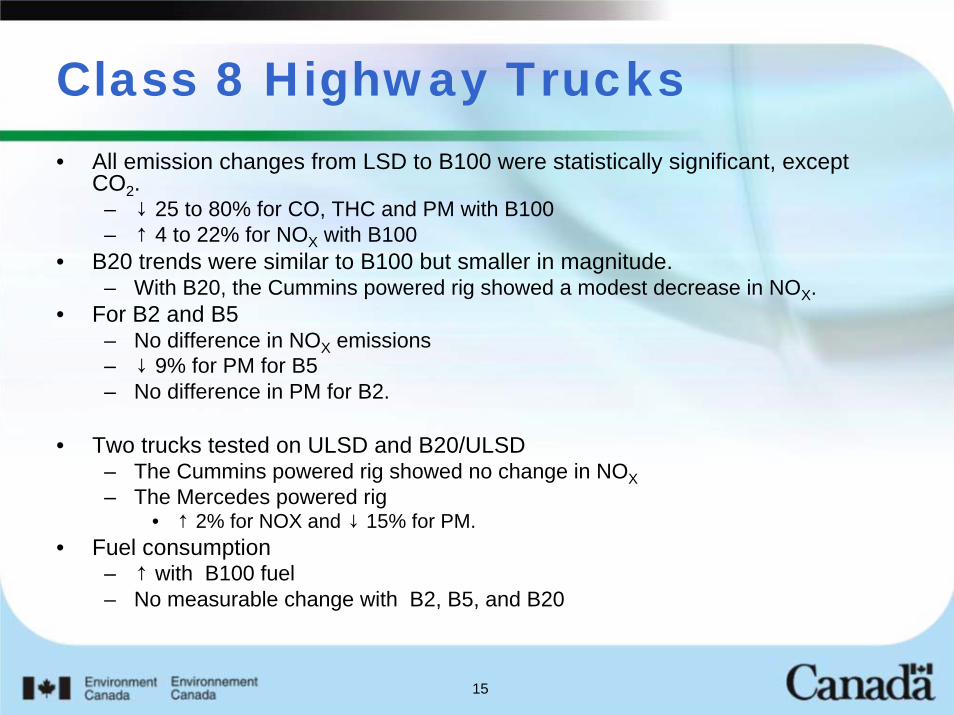
Class 8 Highway Trucks• All emission changes from LSD to B100 were statistically significant, except
CO2. – ↓ 25 to 80% for CO, THC and PM with B100 – ↑ 4 to 22% for NOX with B100
• B20 trends were similar to B100 but smaller in magnitude. – With B20, the Cummins powered rig showed a modest decrease in NOX.
• For B2 and B5– No difference in NOX emissions– ↓ 9% for PM for B5 – No difference in PM for B2.
• Two trucks tested on ULSD and B20/ULSD– The Cummins powered rig showed no change in NOX– The Mercedes powered rig
• ↑ 2% for NOX and ↓ 15% for PM. • Fuel consumption
– ↑ with B100 fuel– No measurable change with B2, B5, and B20
16
HDE’s & Advanced After-Treatment Technologies
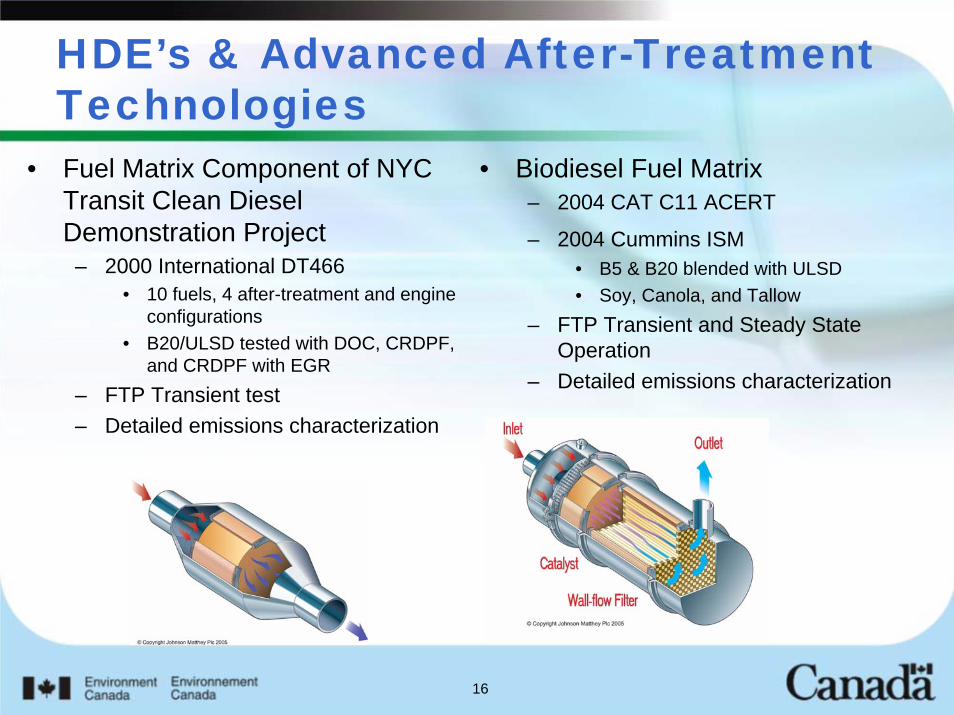
• Fuel Matrix Component of NYC Transit Clean Diesel Demonstration Project
– 2000 International DT466• 10 fuels, 4 after-treatment and engine
configurations• B20/ULSD tested with DOC, CRDPF,
and CRDPF with EGR– FTP Transient test– Detailed emissions characterization
• Biodiesel Fuel Matrix– 2004 CAT C11 ACERT
– 2004 Cummins ISM• B5 & B20 blended with ULSD • Soy, Canola, and Tallow
– FTP Transient and Steady State Operation
– Detailed emissions characterization

17
HDE’s & Advanced After-Treatment Technologies
0.0
1.0
2.0
3.0
4.0
5.0
6.0
7.0
Engine Out DOC CRT EGR/CRT
NO
X (g
/bhp
-hr)
ULSD B20
2001 International 466 (230 hp)FTP Hot Tests
0.0
1.0
2.0
3.0
4.0
5.0
6.0
7.0
8.0
PM*100 NOX NO HC CO
Em
issi
on R
ate
(g/b
hp-h
r)
Engine Out CRT ULSD CRT B20
2001 International 466 (230 hp)FTP Hot Tests
18
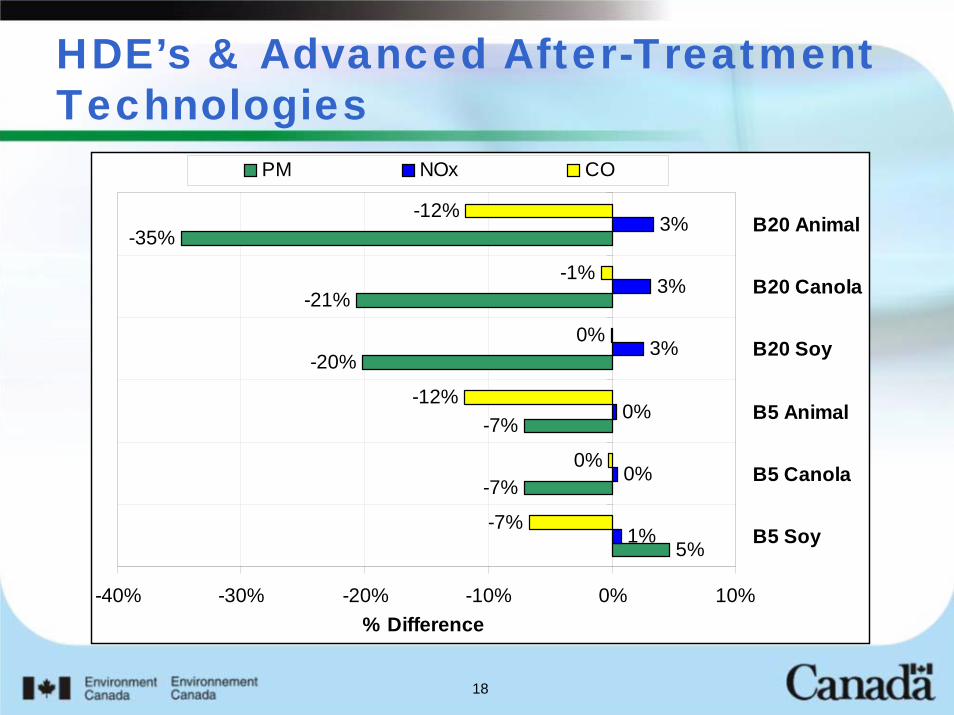
HDE’s & Advanced After-Treatment Technologies
5%
-7%
-7%
-20%
-21%
-35%
1%
0%
0%
3%
3%
3%
-7%
0%
-12%
0%
-1%
-12%
-40% -30% -20% -10% 0% 10%
B5 Soy
B5 Canola
B5 Animal
B20 Soy
B20 Canola
B20 Animal
% Difference
PM NOx CO
19
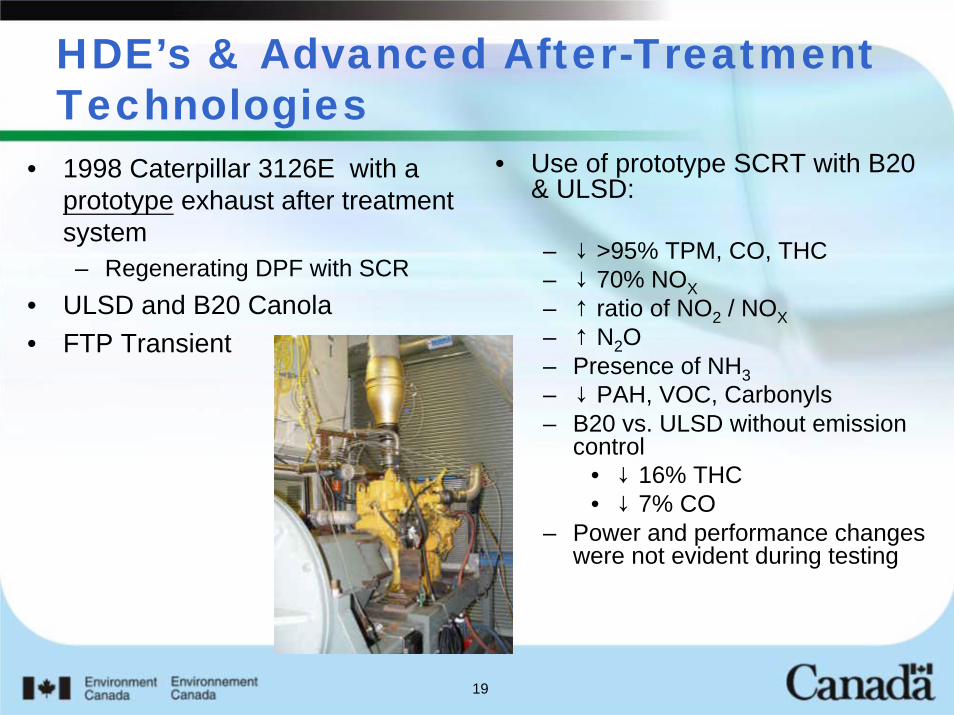
HDE’s & Advanced After-Treatment Technologies
• 1998 Caterpillar 3126E with a prototype exhaust after treatment system– Regenerating DPF with SCR
• ULSD and B20 Canola• FTP Transient
• Use of prototype SCRT with B20 & ULSD:
– ↓ >95% TPM, CO, THC– ↓ 70% NOX– ↑ ratio of NO2 / NOX– ↑ N2O – Presence of NH3– ↓ PAH, VOC, Carbonyls– B20 vs. ULSD without emission
control• ↓ 16% THC • ↓ 7% CO
– Power and performance changes were not evident during testing
20
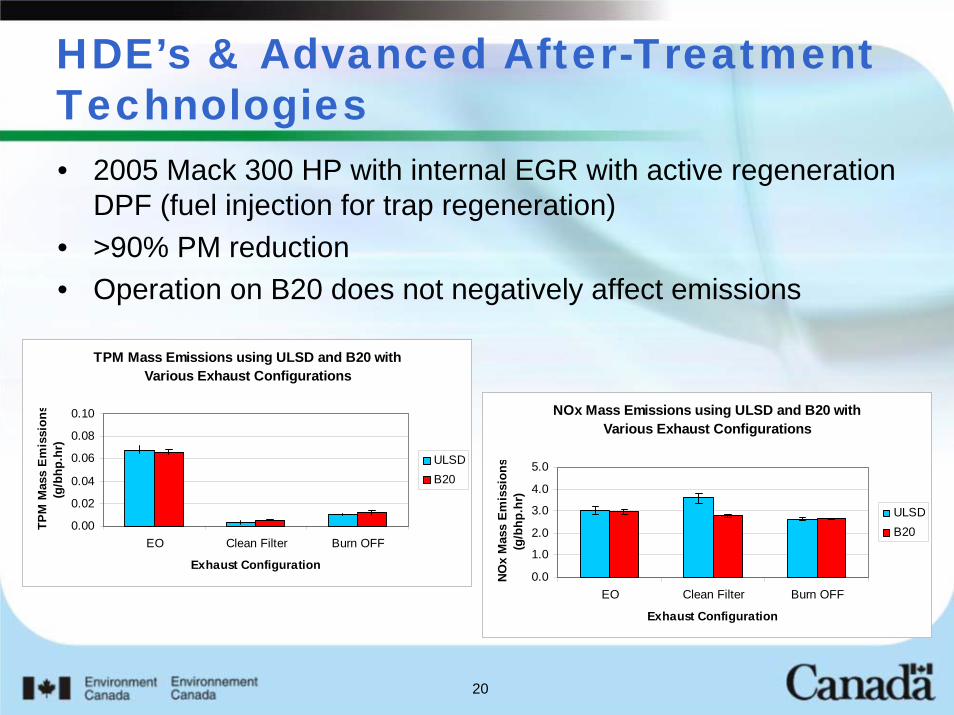
HDE’s & Advanced After-Treatment Technologies• 2005 Mack 300 HP with internal EGR with active regeneration
DPF (fuel injection for trap regeneration)• >90% PM reduction• Operation on B20 does not negatively affect emissions
NOx Mass Emissions using ULSD and B20 with Various Exhaust Configurations
0.0
1.0
2.0
3.0
4.0
5.0
EO Clean Filter Burn OFF
Exhaust Configuration
NOx
Mas
s Em
issi
ons
(g/b
hp.h
r)ULSDB20
TPM Mass Emissions using ULSD and B20 with Various Exhaust Configurations
0.00
0.02
0.04
0.06
0.08
0.10
EO Clean Filter Burn OFF
Exhaust Configuration
TPM
Mas
s E
mis
sion
s(g
/bhp
.hr)
ULSDB20
21
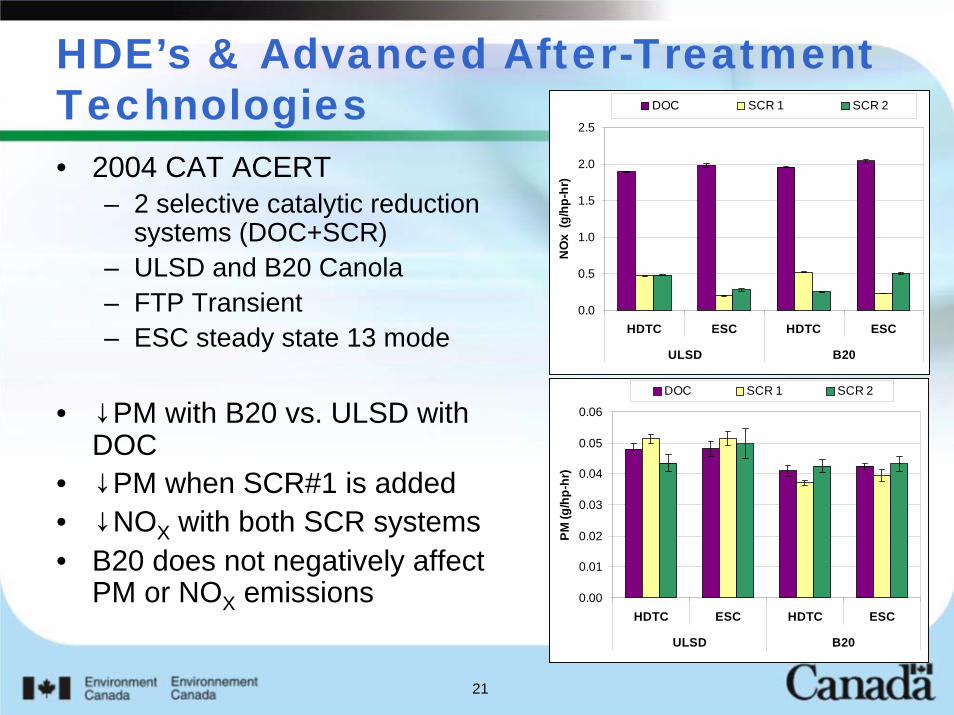
HDE’s & Advanced After-Treatment Technologies• 2004 CAT ACERT
– 2 selective catalytic reduction systems (DOC+SCR)
– ULSD and B20 Canola– FTP Transient– ESC steady state 13 mode
• ↓PM with B20 vs. ULSD with DOC
• ↓PM when SCR#1 is added• ↓NOX with both SCR systems • B20 does not negatively affect
PM or NOX emissions
0.0
0.5
1.0
1.5
2.0
2.5
HDTC ESC HDTC ESC
ULSD B20
NO
x (g
/hp-
hr)
DOC SCR 1 SCR 2
0.00
0.01
0.02
0.03
0.04
0.05
0.06
HDTC ESC HDTC ESC
ULSD B20
PM (g
/hp-
hr)
DOC SCR 1 SCR 2
22
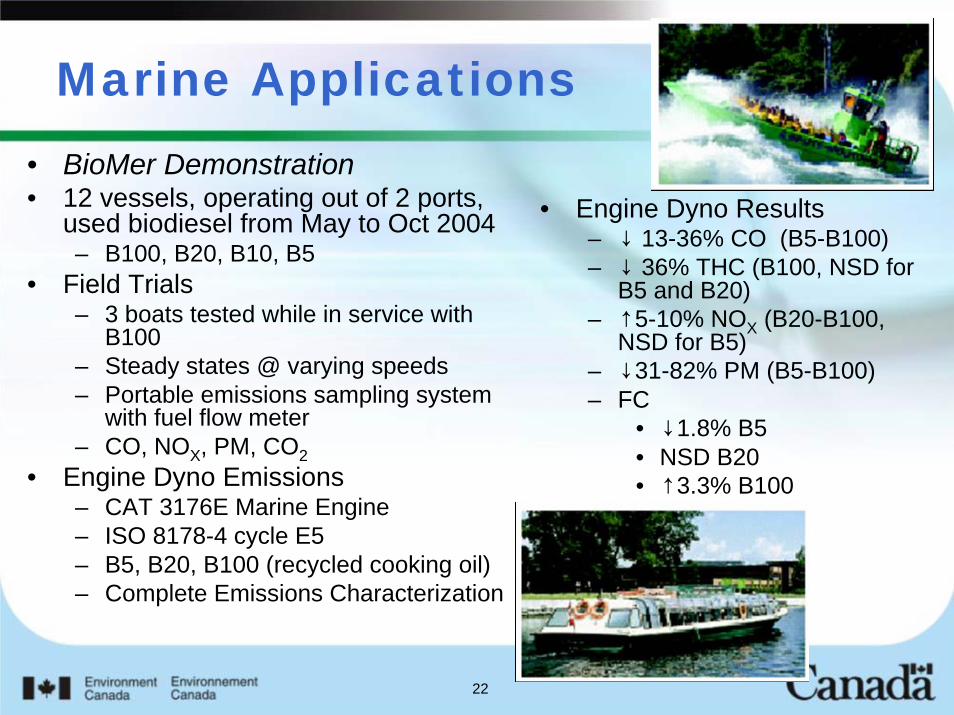
Marine Applications• BioMer Demonstration• 12 vessels, operating out of 2 ports,
used biodiesel from May to Oct 2004– B100, B20, B10, B5
• Field Trials– 3 boats tested while in service with
B100– Steady states @ varying speeds– Portable emissions sampling system
with fuel flow meter– CO, NOX, PM, CO2
• Engine Dyno Emissions– CAT 3176E Marine Engine– ISO 8178-4 cycle E5– B5, B20, B100 (recycled cooking oil) – Complete Emissions Characterization
• Engine Dyno Results– ↓ 13-36% CO (B5-B100)– ↓ 36% THC (B100, NSD for
B5 and B20)– ↑5-10% NOX (B20-B100,
NSD for B5)– ↓31-82% PM (B5-B100)– FC
• ↓1.8% B5• NSD B20• ↑3.3% B100

23
Marine Applications
• Merchant vessel Anna Desgagnés – 17850 ton ship – cargo of heavy machinery,
trucks and freights to ports along the Atlantic coast into Resolute Bay (cold temp)
– one of four generators powered with B20 rendered animal fats and cooking oils
% DIFF B20 vs Marine Diesel OilCO -5.6CO2 -1.5NOX -4.5HC -16PM +25FC -1.6
24
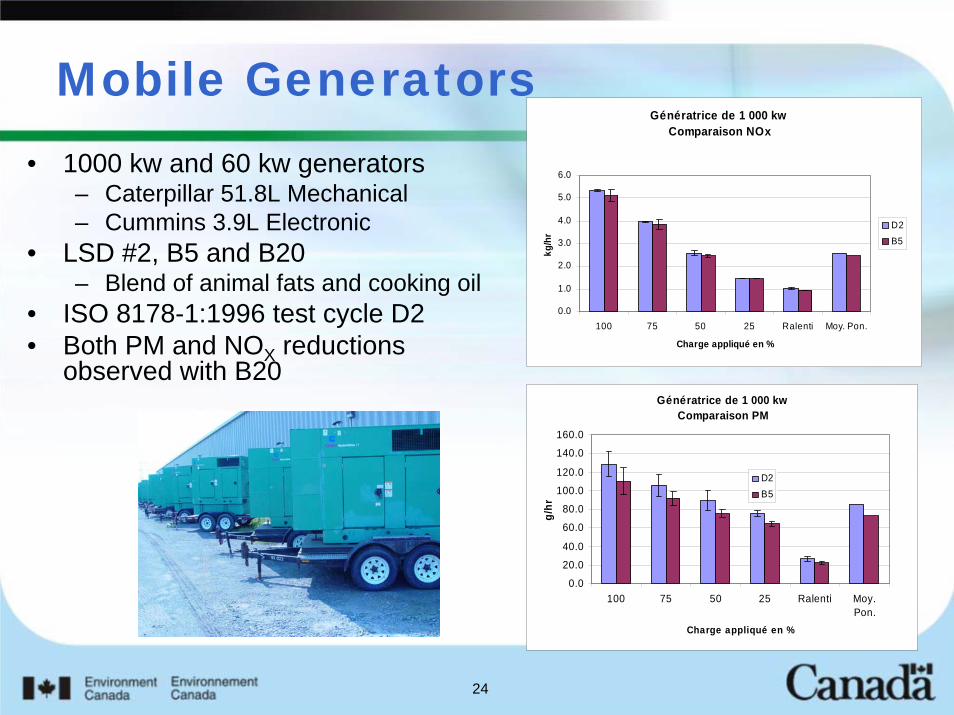
Mobile Generators• 1000 kw and 60 kw generators
– Caterpillar 51.8L Mechanical– Cummins 3.9L Electronic
• LSD #2, B5 and B20– Blend of animal fats and cooking oil
• ISO 8178-1:1996 test cycle D2 • Both PM and NOX reductions
observed with B20
Génératrice de 1 000 kw Comparaison NOx
0.0
1.0
2.0
3.0
4.0
5.0
6.0
100 75 50 25 Ralenti Moy. Pon.
Charge appliqué en %
kg/h
r
D2
B5
Génératrice de 1 000 kw Comparaison PM
0.0
20.0
40.0
60.0
80.0
100.0
120.0
140.0
160.0
100 75 50 25 Ralenti Moy.Pon.
Charge appliqué en %
g/hr
D2B5
Ethanol Activities
27
Two Recent Studies
• Tailpipe and Evaporative Emissions from Light Duty Vehicles of 4 Different Technologies Operating on Gasoline and Ethanol-Gasoline Blends (E10 and E20)
• Tailpipe Emissions from Two Flex-Fuel Vehicles Operating on Gasoline and E85
28
4 Vehicle Technologies• 4 light duty gasoline vehicles of different technologies
– Tier 1 (1998 Ford Escort)– California SULEV w/zero evap. emissions (2001 Nissan Sentra)– LEV LDT Flex-Fuel (2003 Dodge Caravan)– Gasoline Direct Injection vehicle (Japanese LEV, 2000 Mitsubishi Dion)
• 4 test fuels– Vary fuel ethanol content (E0, E10, E20) while holding sulphur content, RVP,
distillation and Octane Number constant.– Splash blend at 10% with base fuel
• Standard (20 oC) and cold (-10 oC) temperature testing
• FTP and US06 driving cycles
• Evaporative emissions (heat build and hot soak)

29
CO Emissions• FTP CO emissions
decrease for all vehicle technologies
• US06 CO emissions decrease for all vehicle technologies
0.00.20.40.60.81.01.21.41.6
Escort Sentra Caravan Dion
CO
(g /
mile
) FT
P E0E10E10-SplE20
02468
10121416
Escort Sentra Caravan Dion
CO
(g /
mile
) U
S06 E0
E10E10-SplE20
30
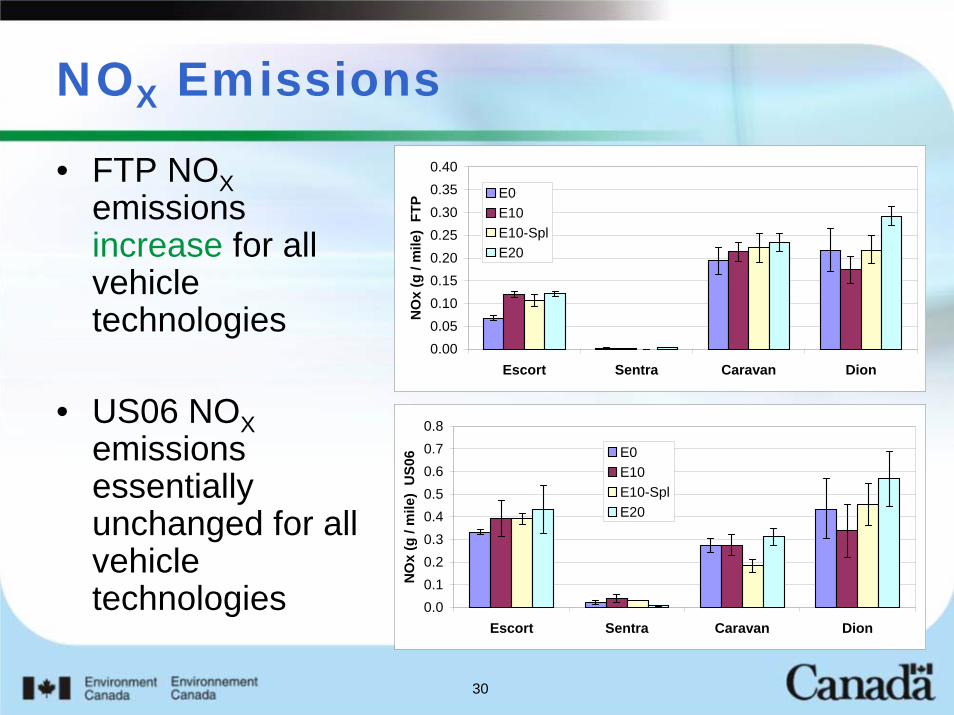
NOX Emissions
• FTP NOX emissions increase for all vehicle technologies
• US06 NOXemissions essentially unchanged for all vehicle technologies
0.000.050.100.150.200.250.300.350.40
Escort Sentra Caravan Dion
NO
x (g
/ m
ile)
FTP E0
E10E10-SplE20
0.00.10.20.30.40.50.60.70.8
Escort Sentra Caravan Dion
NO
x (g
/ m
ile)
US0
6 E0E10E10-SplE20
31
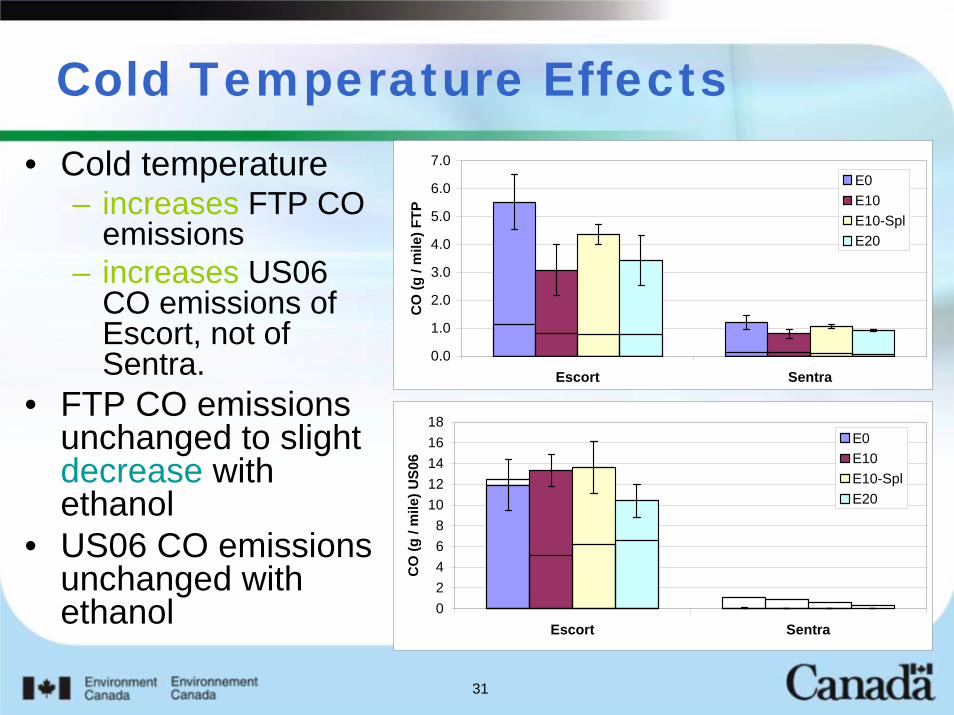
Cold Temperature Effects• Cold temperature
– increases FTP CO emissions
– increases US06 CO emissions of Escort, not of Sentra.
• FTP CO emissions unchanged to slight decrease with ethanol
• US06 CO emissions unchanged with ethanol
0.0
1.0
2.0
3.0
4.0
5.0
6.0
7.0
Escort Sentra
CO
(g /
mile
) FTP
E0E10E10-SplE20
02468
1012141618
Escort Sentra
CO
(g /
mile
) US0
6
E0E10E10-SplE20
32
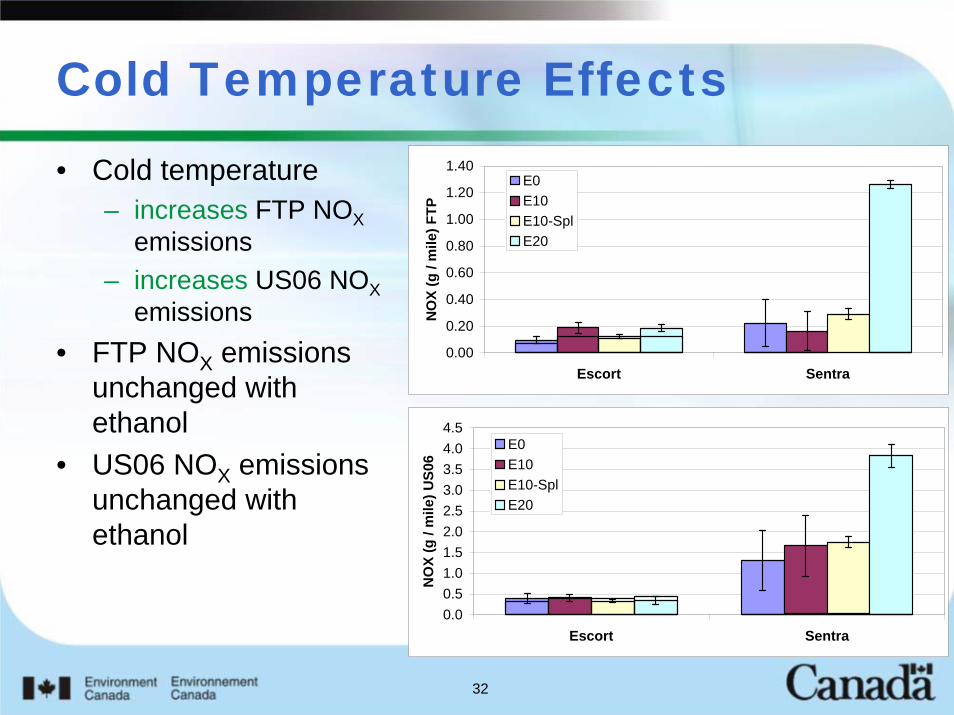
Cold Temperature Effects
• Cold temperature – increases FTP NOX
emissions – increases US06 NOX
emissions• FTP NOX emissions
unchanged with ethanol
• US06 NOX emissions unchanged with ethanol
0.00
0.20
0.40
0.60
0.80
1.00
1.20
1.40
Escort Sentra
NO
X (g
/ m
ile) F
TP
E0E10E10-SplE20
0.00.51.01.52.02.53.03.54.04.5
Escort Sentra
NO
X (g
/ m
ile) U
S06
E0E10E10-SplE20
33
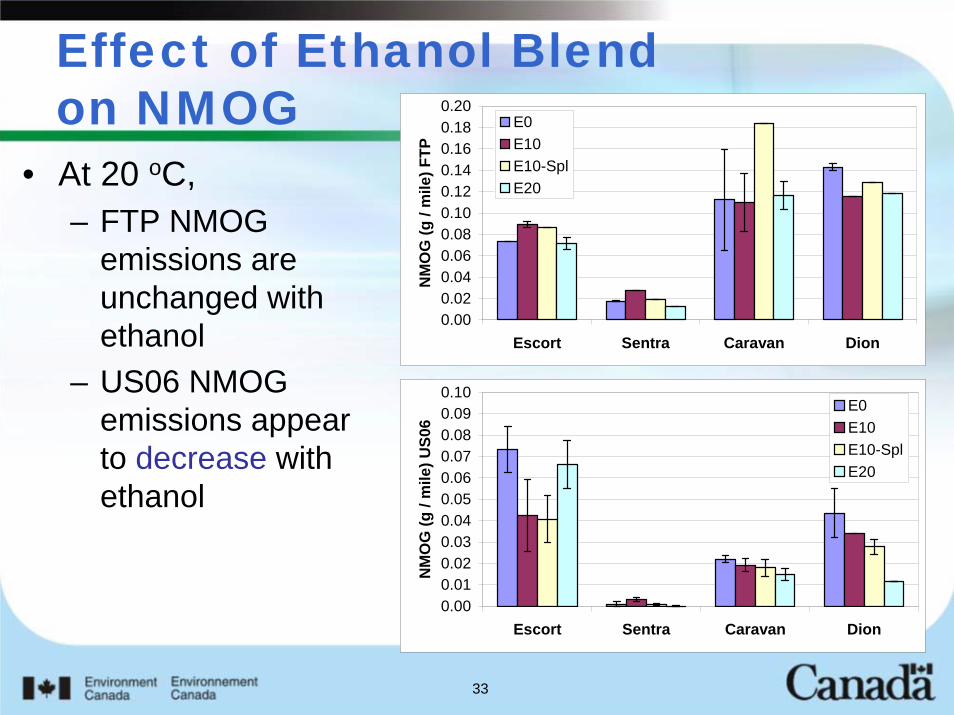
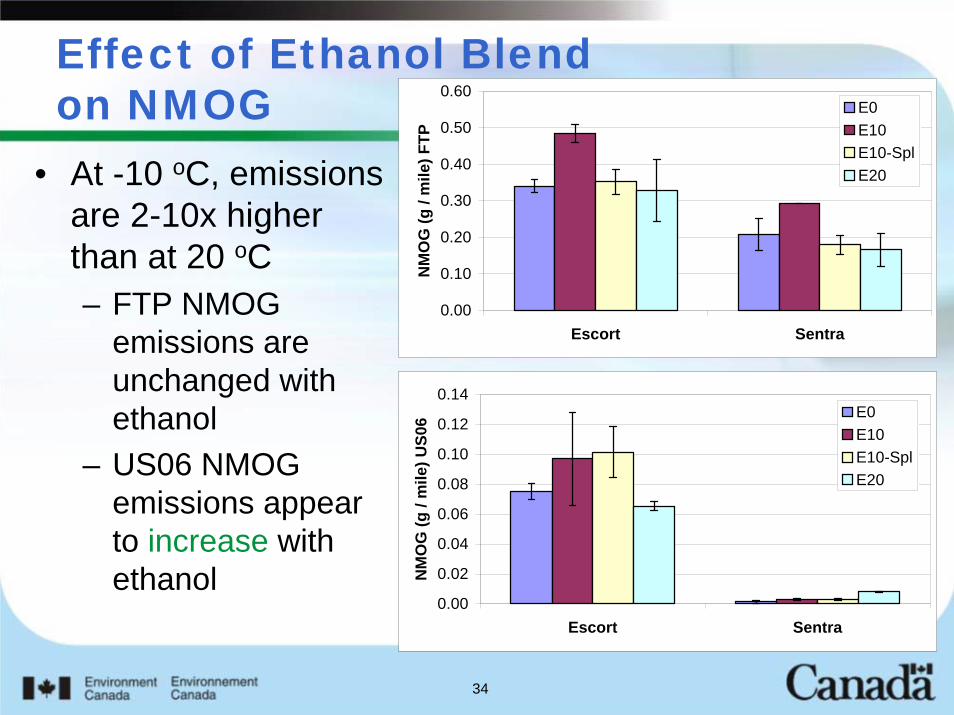
Effect of Ethanol Blend on NMOG
• At 20 oC, – FTP NMOG
emissions are unchanged with ethanol
– US06 NMOG emissions appear to decrease with ethanol
0.000.020.040.060.080.100.120.140.160.180.20
Escort Sentra Caravan Dion
NM
OG
(g /
mile
) FTP
E0E10E10-SplE20
0.000.010.020.030.040.050.060.070.080.090.10
Escort Sentra Caravan Dion
NM
OG
(g /
mile
) US0
6E0E10E10-SplE20
34
Effect of Ethanol Blend on NMOG
• At -10 oC, emissions are 2-10x higher than at 20 oC– FTP NMOG
emissions are unchanged with ethanol
– US06 NMOG emissions appear to increase with ethanol
0.00
0.10
0.20
0.30
0.40
0.50
0.60
Escort Sentra
NM
OG
(g /
mile
) FTP
E0E10E10-SplE20
0.00
0.02
0.04
0.06
0.08
0.10
0.12
0.14
Escort Sentra
NM
OG
(g /
mile
) US0
6 E0E10E10-SplE20
35
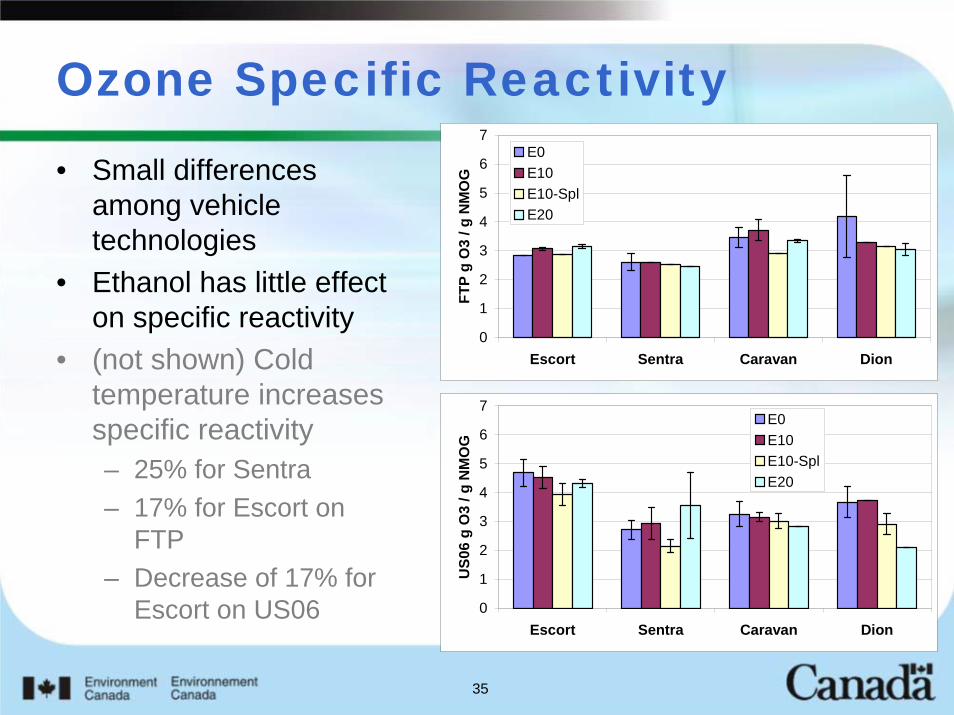
Ozone Specific Reactivity
• Small differences among vehicle technologies
• Ethanol has little effect on specific reactivity
• (not shown) Cold temperature increases specific reactivity – 25% for Sentra– 17% for Escort on
FTP– Decrease of 17% for
Escort on US06
0
1
2
3
4
5
6
7
Escort Sentra Caravan Dion
FTP
g O
3 / g
NM
OG
E0E10E10-SplE20
0
1
2
3
4
5
6
7
Escort Sentra Caravan Dion
US0
6 g
O3
/ g N
MO
G
E0E10E10-SplE20
36
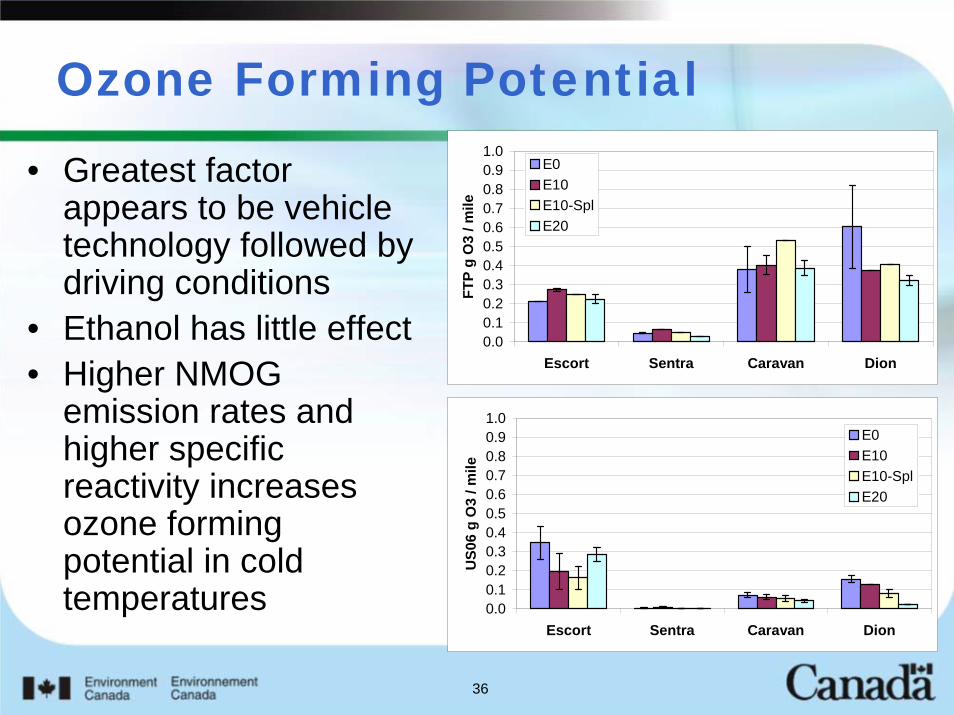
Ozone Forming Potential
• Greatest factor appears to be vehicle technology followed by driving conditions
• Ethanol has little effect• Higher NMOG
emission rates and higher specific reactivity increases ozone forming potential in cold temperatures
0.00.10.20.30.40.50.60.70.80.91.0
Escort Sentra Caravan Dion
FTP
g O
3 / m
ile
E0E10E10-SplE20
0.00.10.20.30.40.50.60.70.80.91.0
Escort Sentra Caravan Dion
US0
6 g
O3
/ mile
E0E10E10-SplE20
37
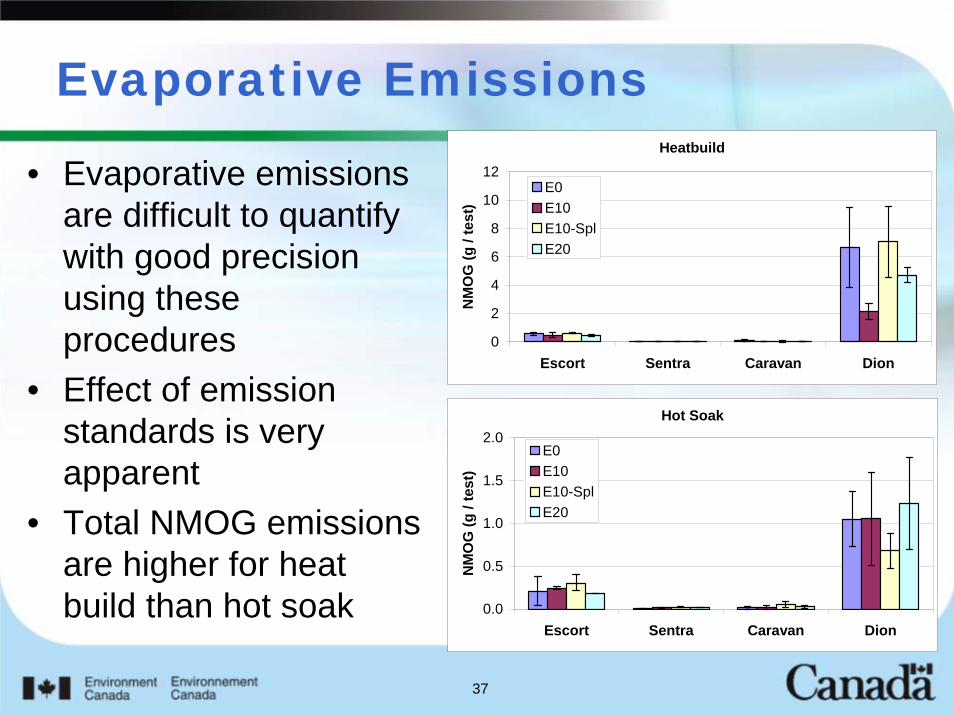
Evaporative Emissions
• Evaporative emissions are difficult to quantify with good precision using these procedures
• Effect of emission standards is very apparent
• Total NMOG emissions are higher for heat build than hot soak
Heatbuild
0
2
4
6
8
10
12
Escort Sentra Caravan Dion
NM
OG
(g /
test
)
E0E10E10-SplE20
Hot Soak
0.0
0.5
1.0
1.5
2.0
Escort Sentra Caravan Dion
NM
OG
(g /
test
)E0E10E10-SplE20
38
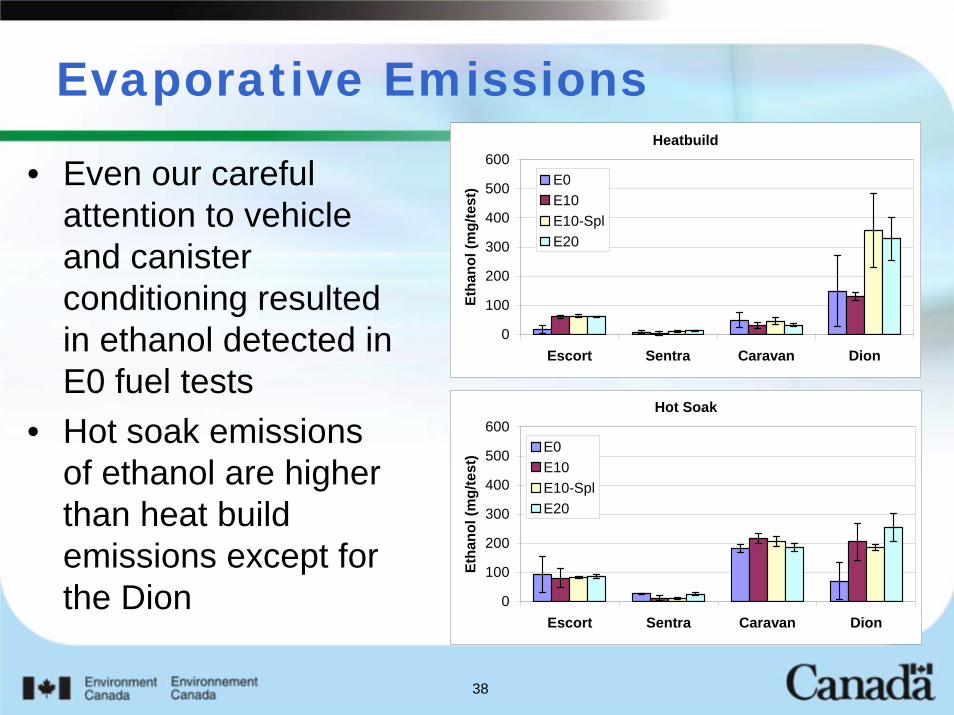
Evaporative Emissions
• Even our careful attention to vehicle and canister conditioning resulted in ethanol detected in E0 fuel tests
• Hot soak emissions of ethanol are higher than heat build emissions except for the Dion
Heatbuild
0
100
200
300
400
500
600
Escort Sentra Caravan Dion
Etha
nol (
mg/
test
) E0E10E10-SplE20
Hot Soak
0
100
200
300
400
500
600
Escort Sentra Caravan Dion
Etha
nol (
mg/
test
) E0E10E10-SplE20
39
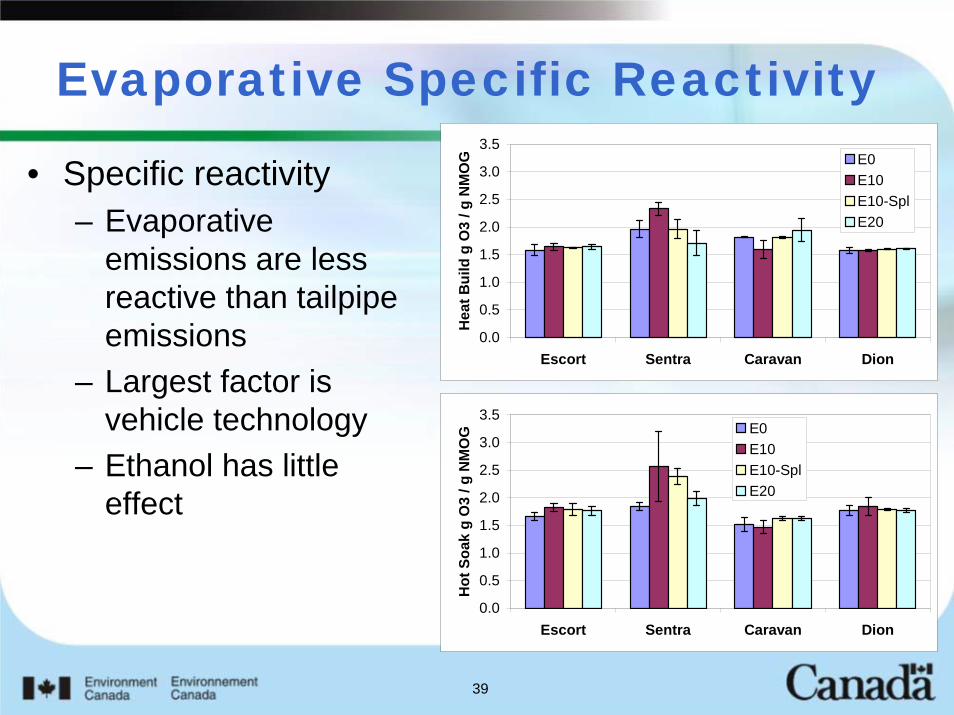
Evaporative Specific Reactivity
• Specific reactivity– Evaporative
emissions are less reactive than tailpipe emissions
– Largest factor is vehicle technology
– Ethanol has little effect
0.0
0.5
1.0
1.5
2.0
2.5
3.0
3.5
Escort Sentra Caravan Dion
Hea
t Bui
ld g
O3
/ g N
MO
G E0E10E10-SplE20
0.0
0.5
1.0
1.5
2.0
2.5
3.0
3.5
Escort Sentra Caravan Dion
Hot
Soa
k g
O3
/ g N
MO
G E0E10E10-SplE20
40
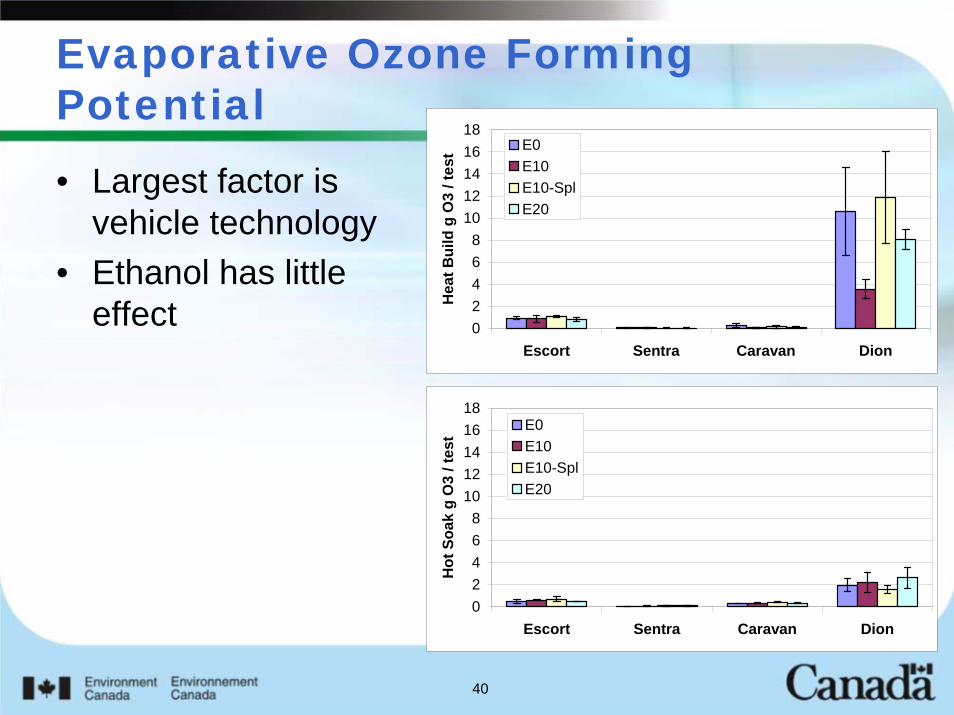
Evaporative Ozone Forming Potential• Largest factor is
vehicle technology• Ethanol has little
effect 02468
1012141618
Escort Sentra Caravan Dion
Hea
t Bui
ld g
O3
/ tes
t E0E10E10-SplE20
02468
1012141618
Escort Sentra Caravan Dion
Hot
Soa
k g
O3
/ tes
tE0E10E10-SplE20
41
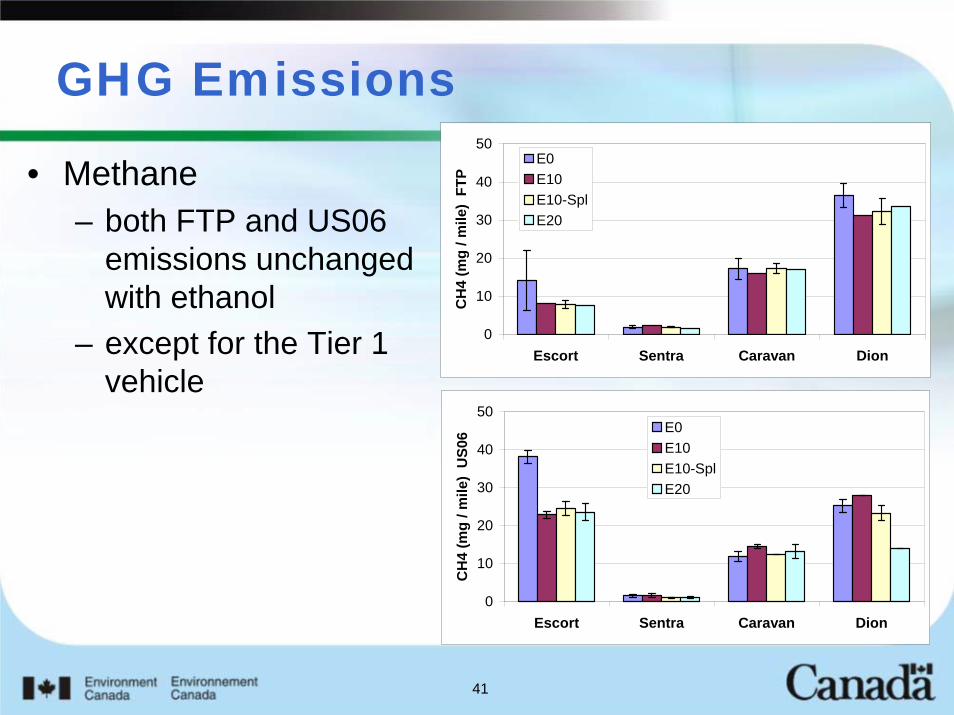
GHG Emissions
• Methane– both FTP and US06
emissions unchanged with ethanol
– except for the Tier 1 vehicle
0
10
20
30
40
50
Escort Sentra Caravan Dion
CH
4 (m
g / m
ile)
FTP
E0E10E10-SplE20
0
10
20
30
40
50
Escort Sentra Caravan Dion
CH
4 (m
g / m
ile)
US0
6 E0E10E10-SplE20
42
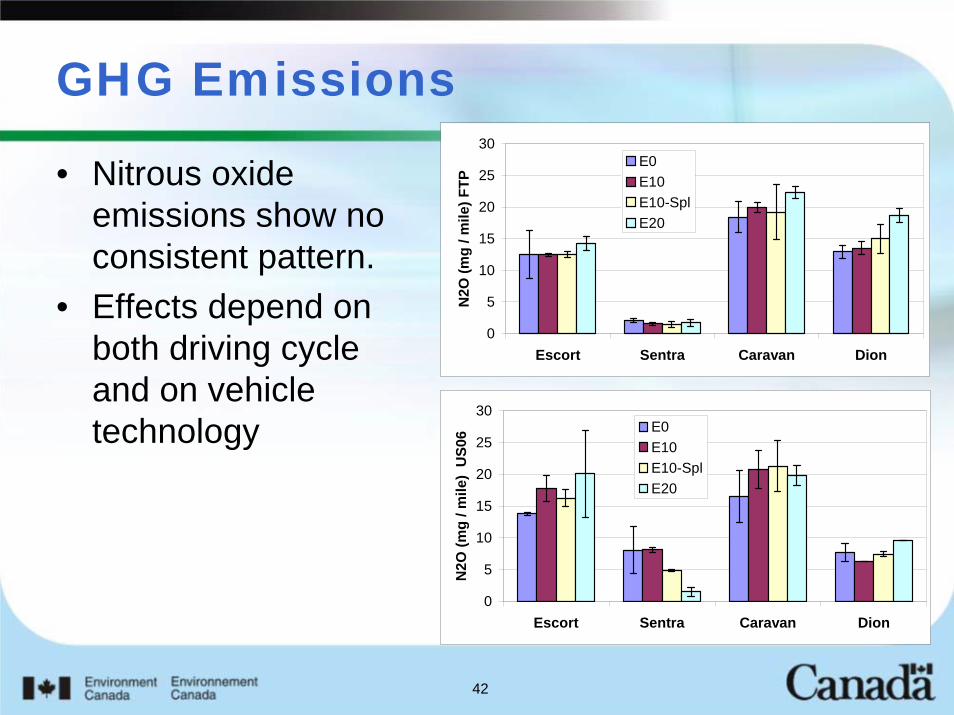
GHG Emissions
• Nitrous oxide emissions show no consistent pattern.
• Effects depend on both driving cycle and on vehicle technology
0
5
10
15
20
25
30
Escort Sentra Caravan Dion
N2O
(mg
/ mile
) FTP
E0E10E10-SplE20
0
5
10
15
20
25
30
Escort Sentra Caravan Dion
N2O
(mg
/ mile
) U
S06 E0
E10E10-SplE20
43
Vehicle Emissions
• 2 Studies
– Tailpipe and Evaporative Emissions from Light Duty Vehicles of 4 Different Technologies Operating on Gasoline and Ethanol-Gasoline Blends (E10 and E20)
– Tailpipe Emissions from Two Flex-Fuel Vehicles Operating on Gasoline and E85
44
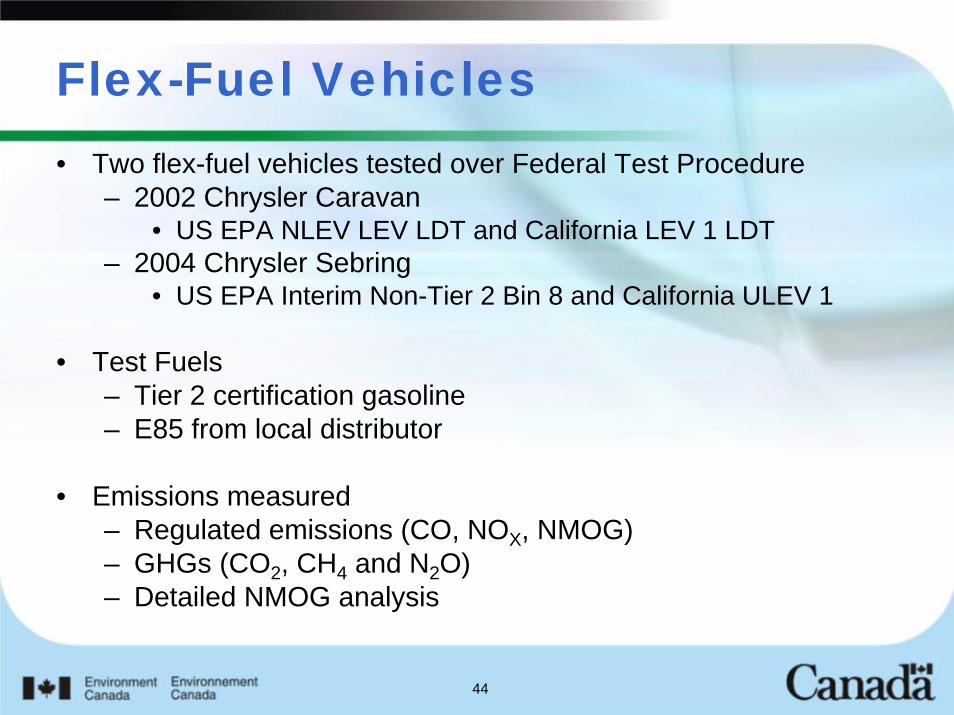
Flex-Fuel Vehicles• Two flex-fuel vehicles tested over Federal Test Procedure
– 2002 Chrysler Caravan • US EPA NLEV LEV LDT and California LEV 1 LDT
– 2004 Chrysler Sebring • US EPA Interim Non-Tier 2 Bin 8 and California ULEV 1
• Test Fuels– Tier 2 certification gasoline– E85 from local distributor
• Emissions measured– Regulated emissions (CO, NOX, NMOG)– GHGs (CO2, CH4 and N2O)– Detailed NMOG analysis

45
2002 FFV Caravan: Regulated Emissions• CO and NOX emissions decrease with E85• NMOG emissions unchanged• Fuel sensor reached only 64% on E85
FFV Caravan
0.00
0.20
0.40
0.60
0.80
1.00
CO NOx NMOG
g/m
ile
Tier 2 E85
46
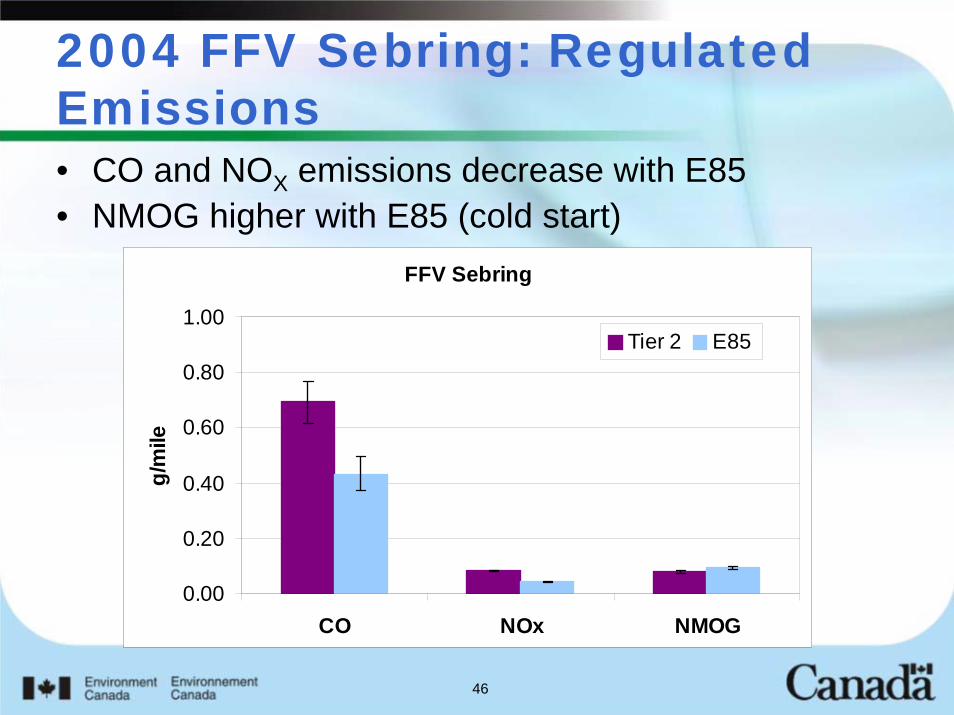
2004 FFV Sebring: Regulated Emissions• CO and NOX emissions decrease with E85 • NMOG higher with E85 (cold start)
FFV Sebring
0.00
0.20
0.40
0.60
0.80
1.00
CO NOx NMOG
g/m
ile
Tier 2 E85
47
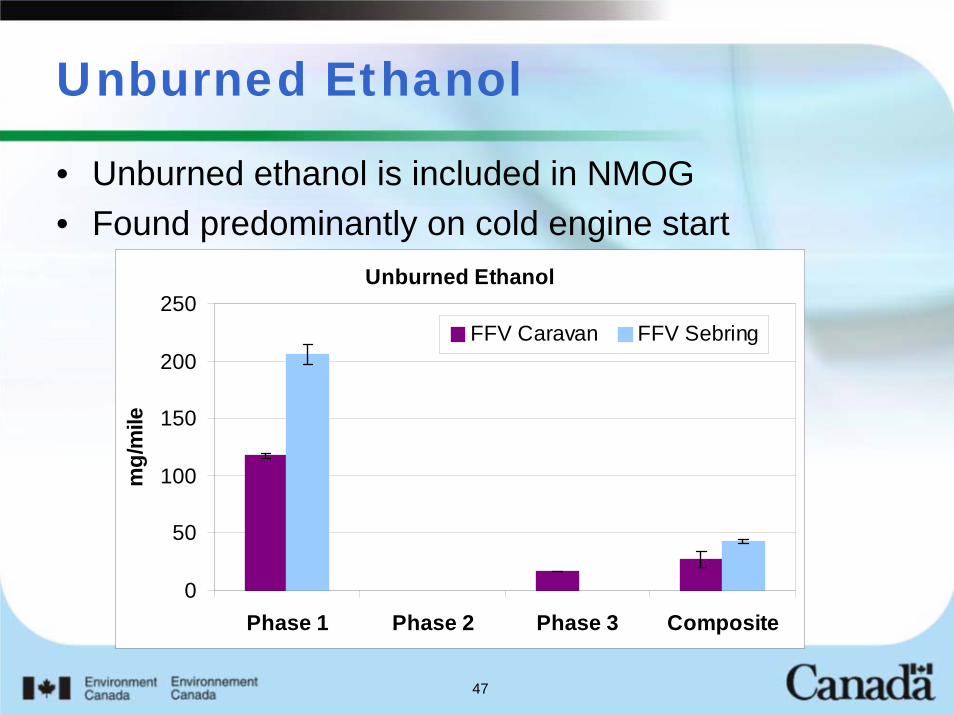
Unburned Ethanol
• Unburned ethanol is included in NMOG • Found predominantly on cold engine start
Unburned Ethanol
0
50
100
150
200
250
Phase 1 Phase 2 Phase 3 Composite
mg/
mile
FFV Caravan FFV Sebring

48
2002 FFV Caravan: Carbonyl Compounds• Carbonyl compounds emitted predominantly on cold start• E85 results in increases in formaldehyde, acetaldehyde and
acrolein emissionsFFV Caravan Carbonyl Compounds
0
2
4
6
8
10
12
14
16
18
20
T2 E85 T2 E85 T2 E85 T2 E85
Phase 1 Phase 2 Phase 3 Composite
mg/
mile
BenzaldehydeIsobutyraldehyde & ButyraldehydeMethyl Ethyl KetoneMethacroleinCrotonaldehydePropionaldehydeAcetoneAcroleinAcetaldehydeFormaldehyde
49
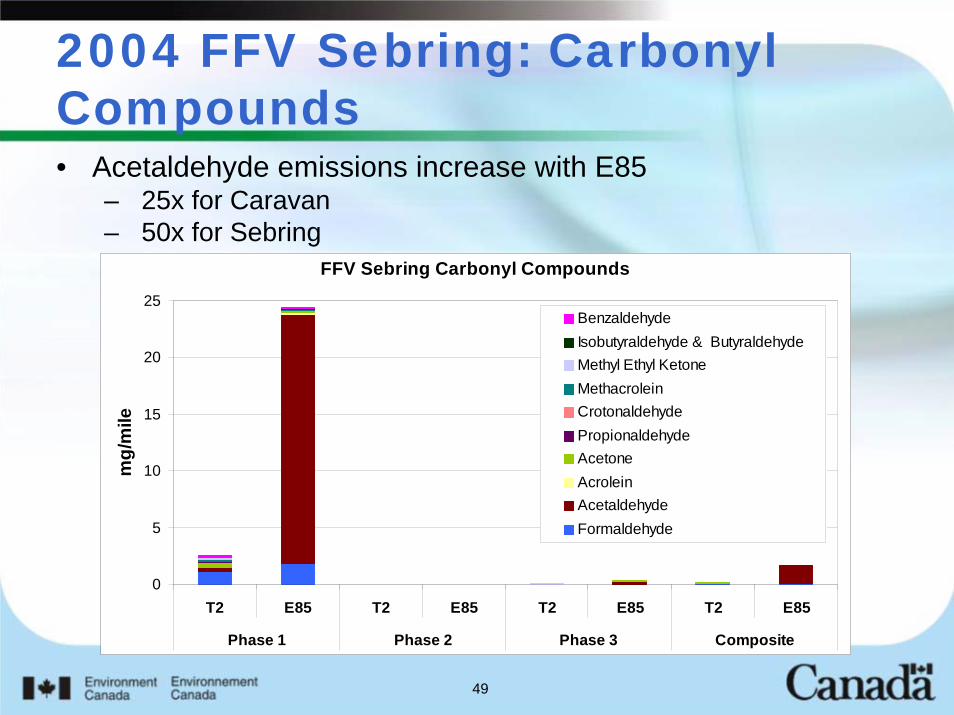
2004 FFV Sebring: Carbonyl Compounds• Acetaldehyde emissions increase with E85
– 25x for Caravan– 50x for Sebring
FFV Sebring Carbonyl Compounds
0
5
10
15
20
25
T2 E85 T2 E85 T2 E85 T2 E85
Phase 1 Phase 2 Phase 3 Composite
mg/
mile
BenzaldehydeIsobutyraldehyde & ButyraldehydeMethyl Ethyl KetoneMethacroleinCrotonaldehydePropionaldehydeAcetoneAcroleinAcetaldehydeFormaldehyde
50
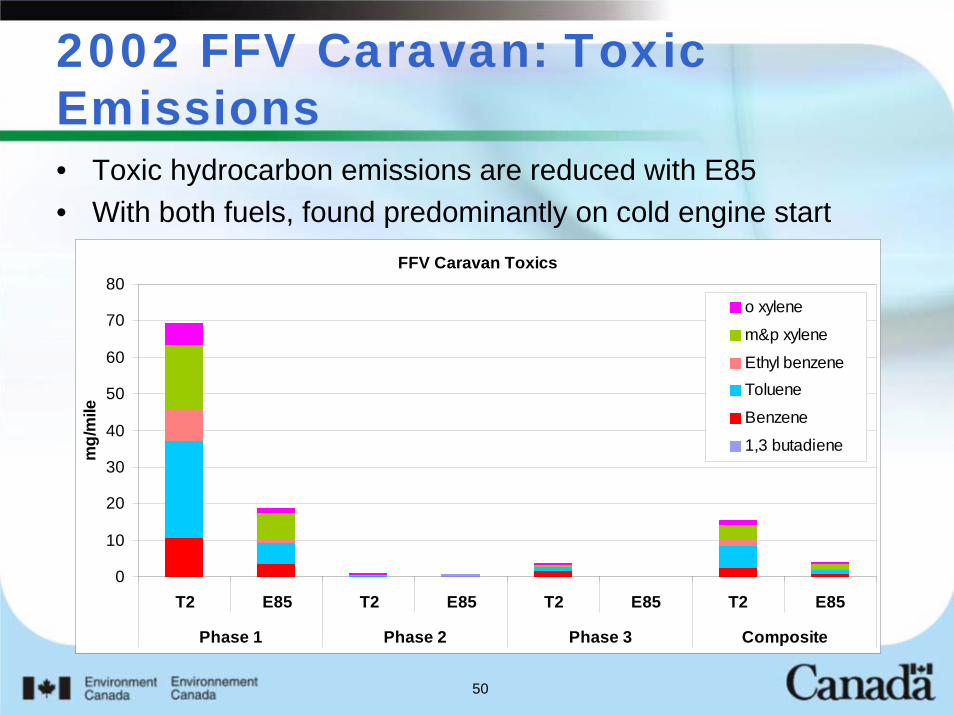
2002 FFV Caravan: Toxic Emissions• Toxic hydrocarbon emissions are reduced with E85• With both fuels, found predominantly on cold engine start
FFV Caravan Toxics
0
10
20
30
40
50
60
70
80
T2 E85 T2 E85 T2 E85 T2 E85
Phase 1 Phase 2 Phase 3 Composite
mg/
mile
o xylene
m&p xylene
Ethyl benzeneToluene
Benzene
1,3 butadiene

51
2004 FFV Sebring: Toxic Emissions
FFV Sebring Toxics
0
10
20
30
40
50
60
70
80
T2 E85 T2 E85 T2 E85 T2 E85
Phase 1 Phase 2 Phase 3 Composite
mg/
mile
o xylene
m&p xylene
Ethyl benzene
Toluene
Benzene
1,3 butadiene
52
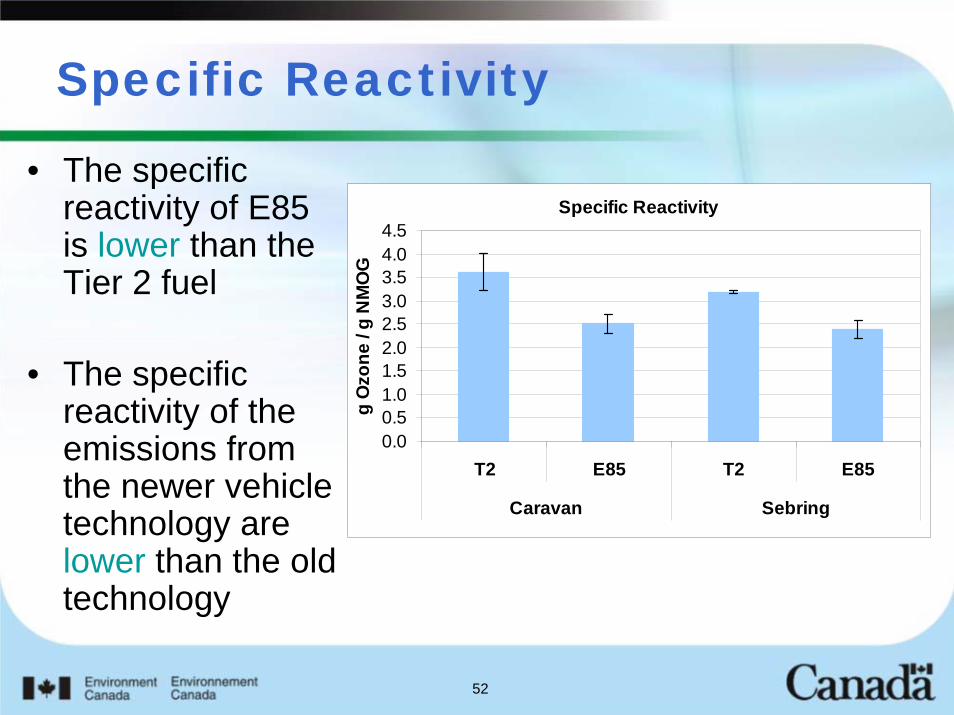
Specific Reactivity
• The specific reactivity of E85 is lower than the Tier 2 fuel
• The specific reactivity of the emissions from the newer vehicle technology are lower than the old technology
Specific Reactivity
0.00.51.01.52.02.53.03.54.04.5
T2 E85 T2 E85
Caravan Sebring
g O
zone
/ g
NM
OG
53
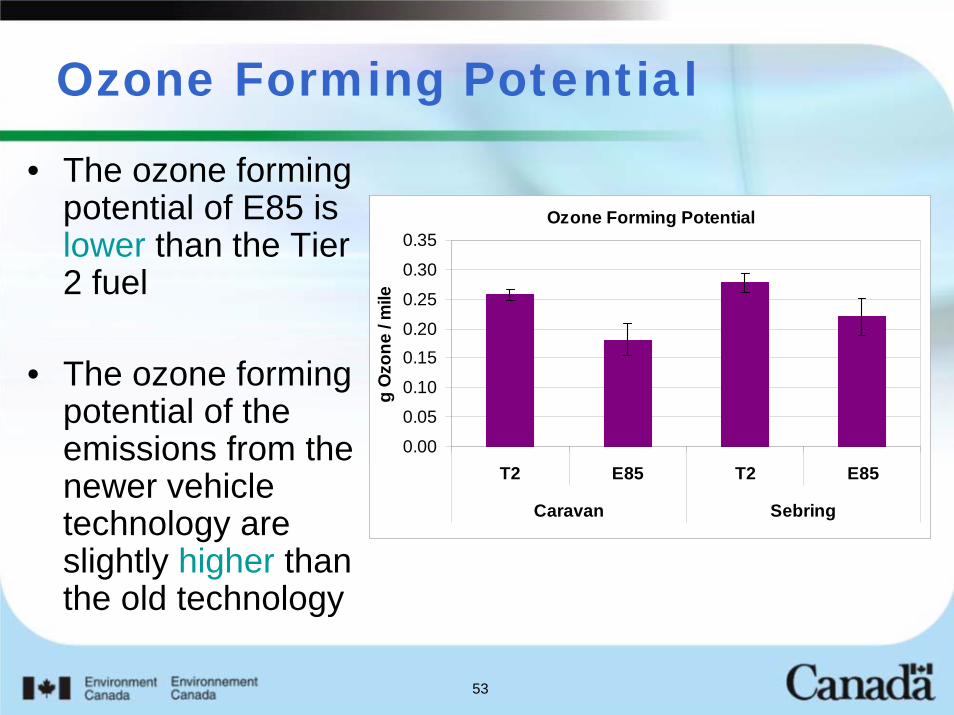
Ozone Forming Potential
• The ozone forming potential of E85 is lower than the Tier 2 fuel
• The ozone forming potential of the emissions from the newer vehicle technology are slightly higher than the old technology
Ozone Forming Potential
0.00
0.05
0.10
0.150.20
0.25
0.30
0.35
T2 E85 T2 E85
Caravan Sebring
g O
zone
/ m
ile
54
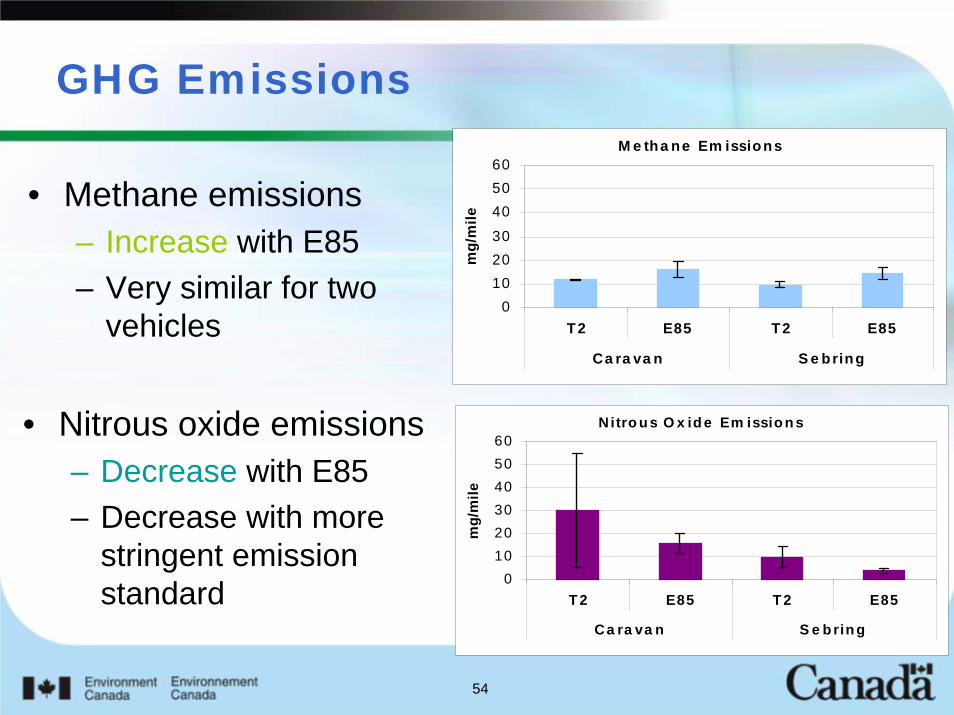
GHG Emissions
• Methane emissions – Increase with E85– Very similar for two
vehicles
• Nitrous oxide emissions – Decrease with E85 – Decrease with more
stringent emission standard
M e tha ne Em issions
0102030
405060
T2 E85 T2 E85
Ca ra va n S e bring
mg/
mile
N i tro u s O x id e Em issio n s
0102030405060
T 2 E85 T 2 E85
Ca ra va n S e b rin g
mg/
mile
55
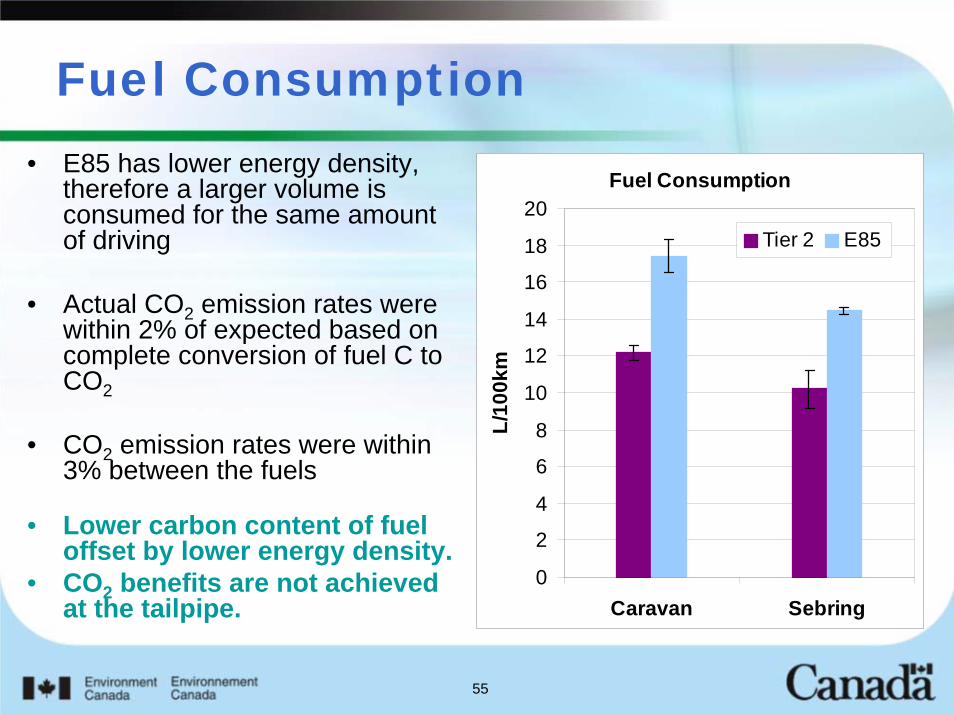
Fuel Consumption• E85 has lower energy density,
therefore a larger volume is consumed for the same amount of driving
• Actual CO2 emission rates were within 2% of expected based on complete conversion of fuel C to CO2
• CO2 emission rates were within 3% between the fuels
• Lower carbon content of fuel offset by lower energy density.
• CO2 benefits are not achieved at the tailpipe.
Fuel Consumption
0
2
4
6
8
10
12
14
16
18
20
Caravan Sebring
L/10
0km
Tier 2 E85
56
Summary
• For the vehicles tested, low ethanol gasoline blends (E10, E20) – Reduce FTP and US06 CO emissions– Increase FTP NOX emissions; US06 emissions
unchanged– Had little effect on FTP and US06 NMOG emissions– Had little effect on Specific Reactivity of NMOG
emissions– Had little effect on CH4 and N2O emissions– Had little effect on the evaporative NMOG emissions
nor their specific reactivity.
57
Summary
• For the vehicles tested, a higher ethanol gasoline blend (E85)– Reduced FTP CO and NOX– Had little effect on FTP NMOG– Significantly increased carbonyl emissions
• Acetaldehyde 25-50x greater– Decreased toxic hydrocarbons
• Fuel dilution effect– Reduced the specific reactivity of FTP emissions
thereby reduced ozone forming potential– Increased CH4 emissions– Decreased N2O emissions

Biofuels and Advanced Combustion Strategies

59
HCCI• Homogeneous Charge
Compression Ignition is a low temperature combustion strategy that can result in very low NOXand PM emissions with high thermal efficiency.
• HCCI is an auto-ignition process– start of combustion is controlled
by temperature and pressure not spark (SI) or fuel injection (CI)
• Because it is a low temperature process, engine out CO and unburned HC emissions are high in a relatively cool exhaust gas– Very challenging for conventional
TWC or OC technologies
UofA HCCI facilityWaukesha CFR engine and dynamometer
60
HCCI• Two collaborative projects looking at gasoline-like and diesel-like
fuels in HCCI combustion in a research engine– University of Alberta – ideal fuels with different octane numbers
prepared from iso-octane and heptane or ethanol and heptane– National Research Council of Canada – ideal fuel of n-heptane
studying effect of engine parameters and EGR on combustion efficiency.
• Dilute exhaust samples were collected in canisters and analyzed by GC-FID and GC-MS for NMHC, oxygenated organics, CH4and N2O– NRC study also included carbonyl sampling with DNPH
cartridges• Ideal fuels allow chemical reaction mechanisms to be studied
– Provides information useful in computer modeling of HCCI combustion
61
Effect of Ethanol on HCCI Combustion• Ethanol has an octane number similar to iso-octane
when measured in the standard manner. • Ethanol's latent heat of vaporization is about twice
that of iso-octane, providing a strong cooling effect on the intake charge, particularly as the mixture is made more fuel-rich. – This led to experimental problems of transferring the
engine from its initial CNG-fueled, spark-ignition operation to HCCI as well as problems in maintaining a constant intake mixture temperature and thus controlling combustion.
• HCCI combustion is much more sensitive to fuel properties than conventional SI combustion.

62
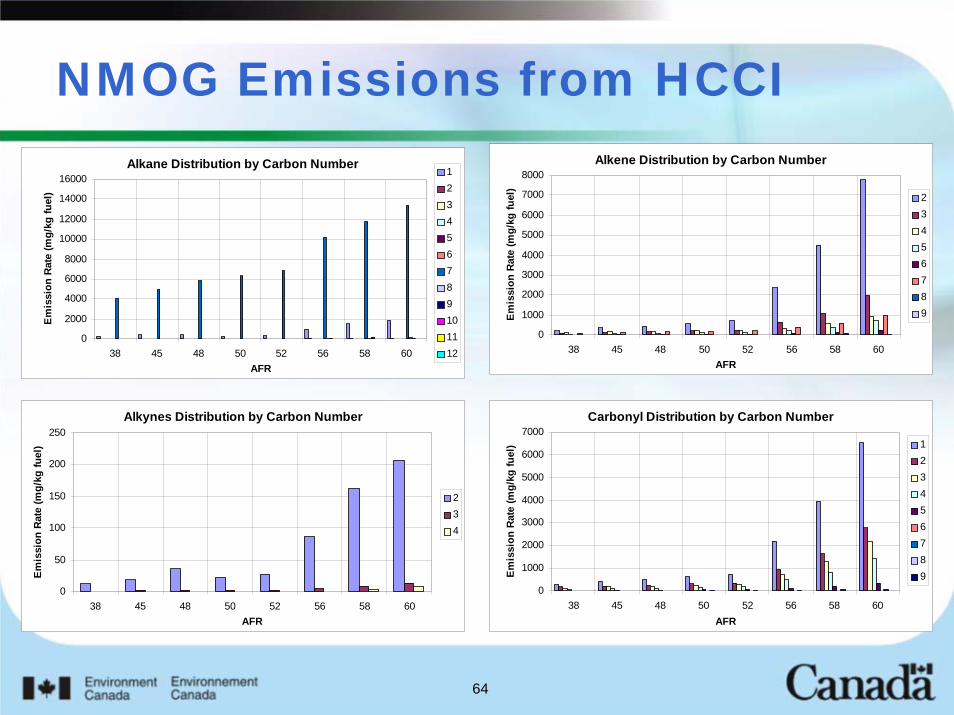
NMOG Emissions from HCCI• Unburned fuel compounds account for 58-75% of the NMOG
emissions, depending on conditions.• Partial combustion products, alkenes and carbonyls are the next
most prominent components of NMOG– Low molecular weight alkenes (ethylene, propylene, isobutene
and 1-butene) account for 7-25% of NMOG– Carbonyl compounds account for 12-33% of NMOG. – Formaldehyde dominates carbonyl emissions (41-50%).– Methane emissions are also significant (1-5% of NMOG)
• HCCI combustion appears to form unsaturated cyclic compounds (cycloalkenes and aromatics). – Whether these compounds come from the lubrication oil or the
combustion process is still not clear.

63
Carbon Balance of HCCI Emissions
• Fraction of carbon emitted as CO and HC increases with decreasing combustion temperature
• The HC fraction becomes more “reactive” and contains more unburned fuel components
Carbon Balance as a Function of AFR
0%
20%
40%
60%
80%
100%
38 45 48 50 52 56 58 60
AFR
% F
uel C
as
CO
2, C
O a
nd
THC
%C as THC%C as CO%C as CO2
64
NMOG Emissions from HCCIAlkane Distribution by Carbon Number
0
2000
4000
6000
8000
10000
12000
14000
16000
38 45 48 50 52 56 58 60AFR
Em
issi
on R
ate
(mg/
kg fu
el)
123456789101112
Alkene Distribution by Carbon Number
0
1000
2000
3000
4000
5000
6000
7000
8000
38 45 48 50 52 56 58 60AFR
Em
issi
on R
ate
(mg/
kg fu
el)
23456789
Alkynes Distribution by Carbon Number
0
50
100
150
200
250
38 45 48 50 52 56 58 60AFR
Em
issi
on R
ate
(mg/
kg fu
el)
234
Carbonyl Distribution by Carbon Number
0
1000
2000
3000
4000
5000
6000
7000
38 45 48 50 52 56 58 60AFR
Em
issi
on R
ate
(mg/
kg fu
el) 1
23456789

Advanced Emissions Characterization
66
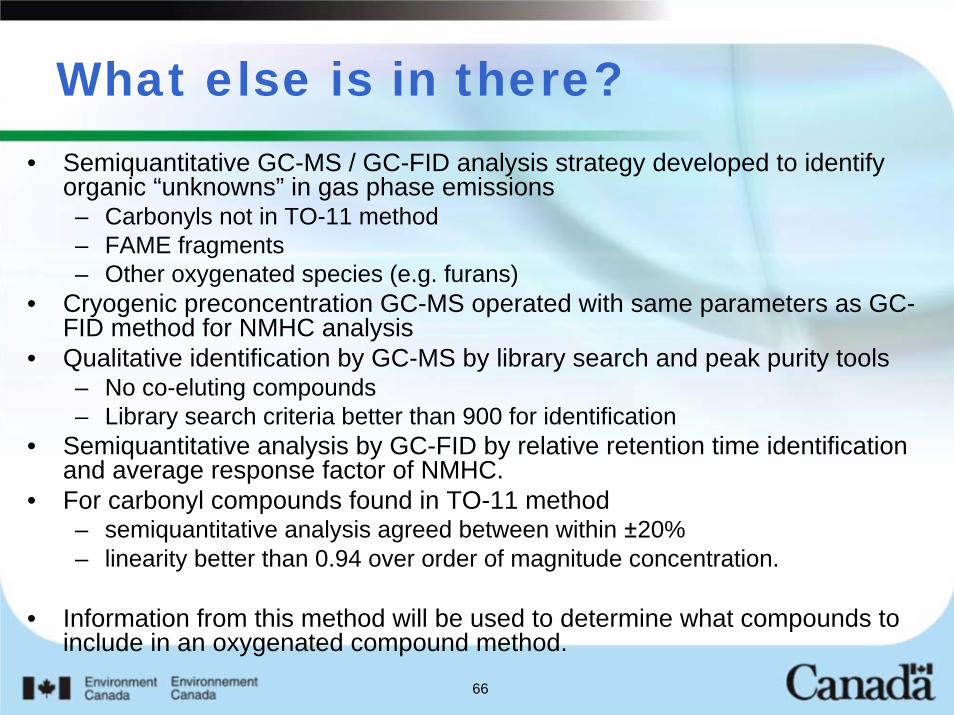
What else is in there?• Semiquantitative GC-MS / GC-FID analysis strategy developed to identify
organic “unknowns” in gas phase emissions– Carbonyls not in TO-11 method– FAME fragments– Other oxygenated species (e.g. furans)
• Cryogenic preconcentration GC-MS operated with same parameters as GC-FID method for NMHC analysis
• Qualitative identification by GC-MS by library search and peak purity tools – No co-eluting compounds– Library search criteria better than 900 for identification
• Semiquantitative analysis by GC-FID by relative retention time identification and average response factor of NMHC.
• For carbonyl compounds found in TO-11 method– semiquantitative analysis agreed between within ±20%– linearity better than 0.94 over order of magnitude concentration.
• Information from this method will be used to determine what compounds to include in an oxygenated compound method.

67
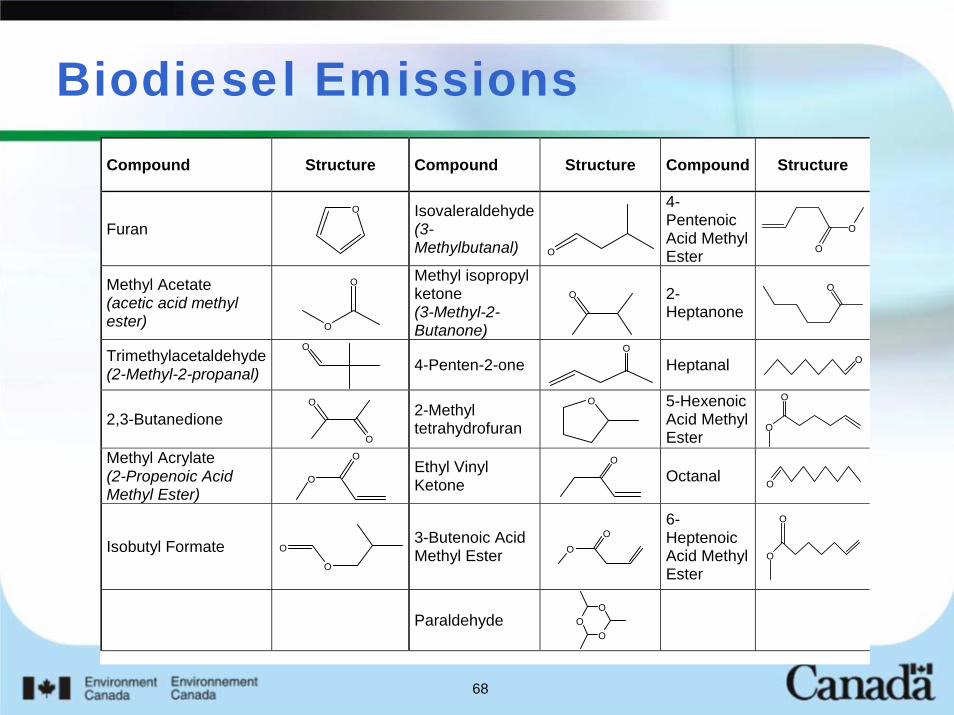
Biodiesel Emissions• Low Molecular Weight FAMEs
– Produced by cracking of higher MW fuel FAMEs– Other than Acetic Acid Methyl Ester, FAMEs are unsaturated
• Furans– Concentration appears not to change from Diesel to B100
• Nitro-compounds– Nitromethane– Nitrophenol in diesel, B20 and B100 emissions
• Carbonyl compounds not in TO-11 method– At least 10 carbonyl compounds were identified, many
unsaturated.• Unusual Finds
– MTBE appears to be produced by the combustion process. Levels are above dilution air concentrations
– Isobutyl formate was identified but its occurrence is not consistent
68
Biodiesel EmissionsCompound Structure Compound Structure Compound Structure
Furan O
Isovaleraldehyde (3-Methylbutanal) O
4-Pentenoic Acid Methyl Ester O
O
Methyl Acetate (acetic acid methyl ester)
O
O
Methyl isopropyl ketone (3-Methyl-2-Butanone)
O
2-Heptanone
O
Trimethylacetaldehyde (2-Methyl-2-propanal)
O
4-Penten-2-one
O
Heptanal O
2,3-Butanedione O
O
2-Methyl tetrahydrofuran
O
5-Hexenoic Acid Methyl Ester
O
O
Methyl Acrylate (2-Propenoic Acid Methyl Ester)
O
O
Ethyl Vinyl Ketone
O
Octanal O
Isobutyl Formate
O
O
3-Butenoic Acid Methyl Ester
OO
6-Heptenoic Acid Methyl Ester
O
O
Paraldehyde O
OO

69
HCCI Emissions
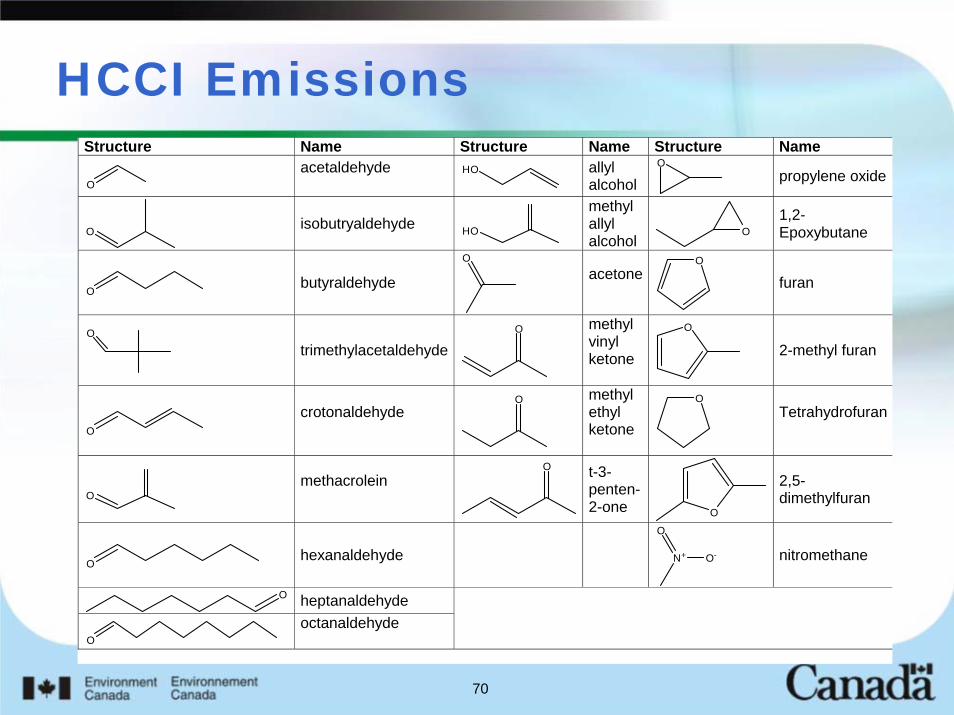
• The GC-MS qualitative analysis found that partial oxidation of hydrocarbons had taken place, resulting in a variety of alcohols, aldehydes, ketones, oxiranes and furans in the dilute exhaust.
• A number of hydrocarbons were identified that were not present in the quantitative analysis. These compounds were mostly branched pentadienes. A number of of these pentadiene isomers were found but correctly identifying them was difficult as the mass spectra are nearly identical.
70
HCCI EmissionsStructure Name Structure Name Structure Name
O acetaldehyde
HO
allyl alcohol
O
propylene oxide
O
isobutryaldehyde HO
methyl allyl alcohol
O
1,2-Epoxybutane
O butyraldehyde
O
acetone
O
furan
O
trimethylacetaldehyde
O
methyl vinyl ketone
O
2-methyl furan
O crotonaldehyde
O
methyl ethyl ketone
O
Tetrahydrofuran
O
methacrolein
O
t-3-penten-2-one O
2,5-dimethylfuran
O hexanaldehyde N+
O
O-
nitromethane
O heptanaldehyde
O octanaldehyde

71