Embed Size (px)
Citation preview
Consultative Analytics
2nd Quarter 2013 Results
Copyright 2013 Cigna - Confidential & Privileged - Not for Distribution
SM
October 15, 2013
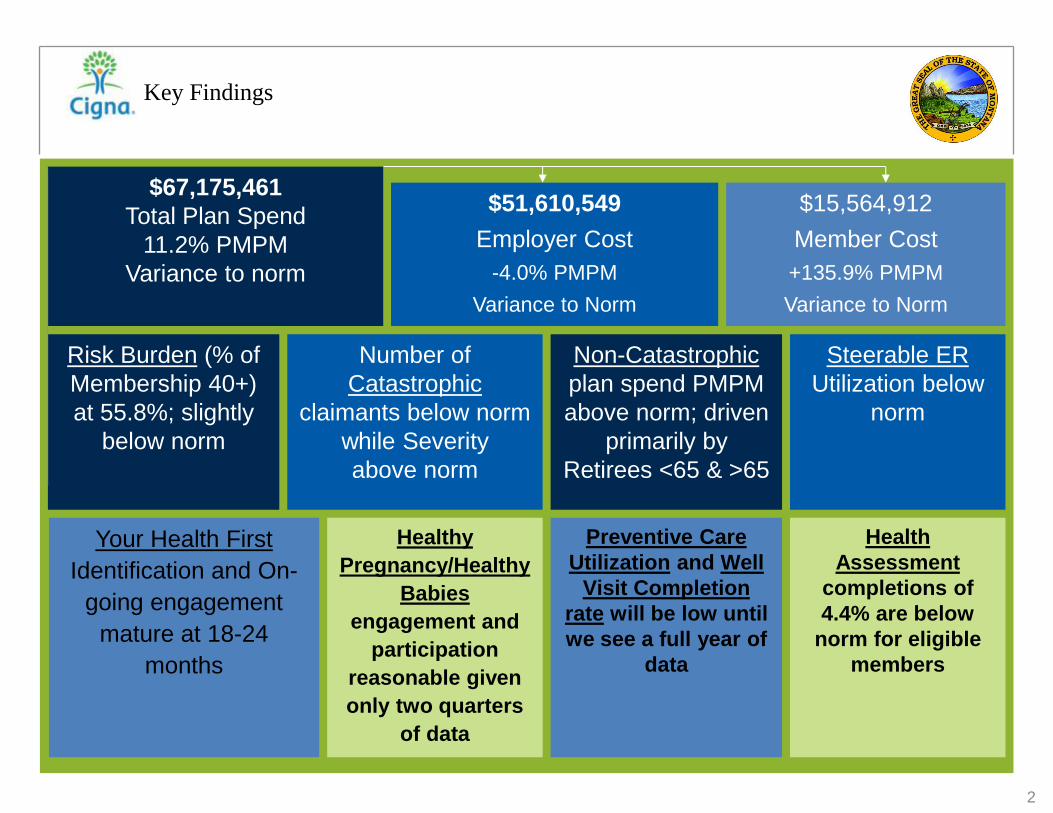
$67,175,461
Total Plan Spend
11.2% PMPM
Variance to norm
$51,610,549
Employer Cost
-4.0% PMPM
Variance to Norm
Preventive Care
Utilization and Well
Visit Completion
rate will be low until
we see a full year of
data
$15,564,912
Member Cost
+135.9% PMPM
Variance to Norm
Health
Assessment
completions of
4.4% are below
norm for eligible
members
Risk Burden (% of
Membership 40+)
at 55.8%; slightly
below norm
Number of
Catastrophic
claimants below norm
while Severity
above norm
Non-Catastrophic
plan spend PMPM
above norm; driven
primarily by
Retirees <65 & >65
Steerable ER
Utilization below
norm
Key Findings
Your Health First
Identification and On-
going engagement
mature at 18-24
months
Healthy
Pregnancy/Healthy
Babies
engagement and
participation
reasonable given
only two quarters
of data
2
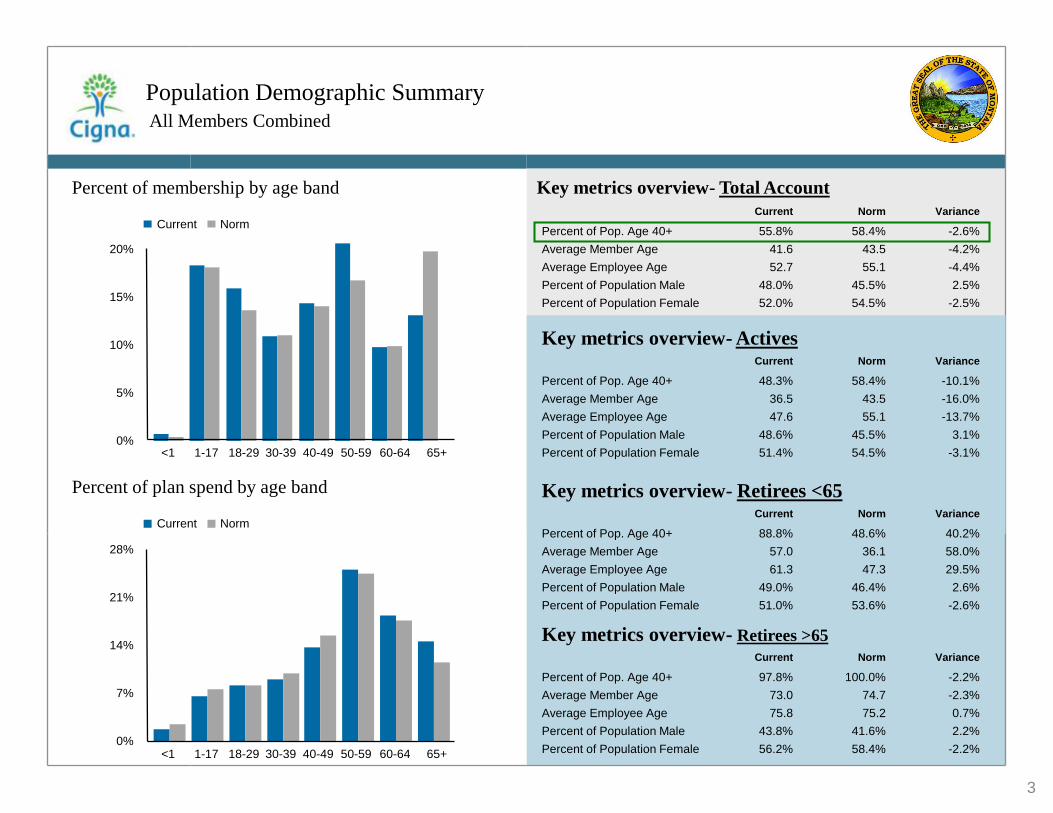
Population Demographic Summary All Members Combined
Percent of membership by age band Key metrics overview- Total Account
Current Norm Variance
Percent of Pop. Age 40+ 55.8% 58.4% -2.6%
Average Member Age 41.6 43.5 -4.2%
Average Employee Age 52.7 55.1 -4.4%
Percent of Population Male 48.0% 45.5% 2.5%
Percent of Population Female 52.0% 54.5% -2.5%
Percent of plan spend by age band
20%
15%
10%
5%
0% <1 1-17 18-29 30-39 40-49 50-59 60-64 65+
Current Norm
28%
21%
14%
7%
0% <1 1-17 18-29 30-39 40-49 50-59 60-64 65+
Current Norm
Key metrics overview- Retirees >65
Current Norm Variance
Percent of Pop. Age 40+ 97.8% 100.0% -2.2%
Average Member Age 73.0 74.7 -2.3%
Average Employee Age 75.8 75.2 0.7%
Percent of Population Male 43.8% 41.6% 2.2%
Percent of Population Female 56.2% 58.4% -2.2%
Key metrics overview- Retirees <65 Current Norm Variance
Percent of Pop. Age 40+ 88.8% 48.6% 40.2%
Average Member Age 57.0 36.1 58.0%
Average Employee Age 61.3 47.3 29.5%
Percent of Population Male 49.0% 46.4% 2.6%
Percent of Population Female 51.0% 53.6% -2.6%
Key metrics overview- Actives Current Norm Variance
Percent of Pop. Age 40+ 48.3% 58.4% -10.1%
Average Member Age 36.5 43.5 -16.0%
Average Employee Age 47.6 55.1 -13.7%
Percent of Population Male 48.6% 45.5% 3.1%
Percent of Population Female 51.4% 54.5% -3.1%
3
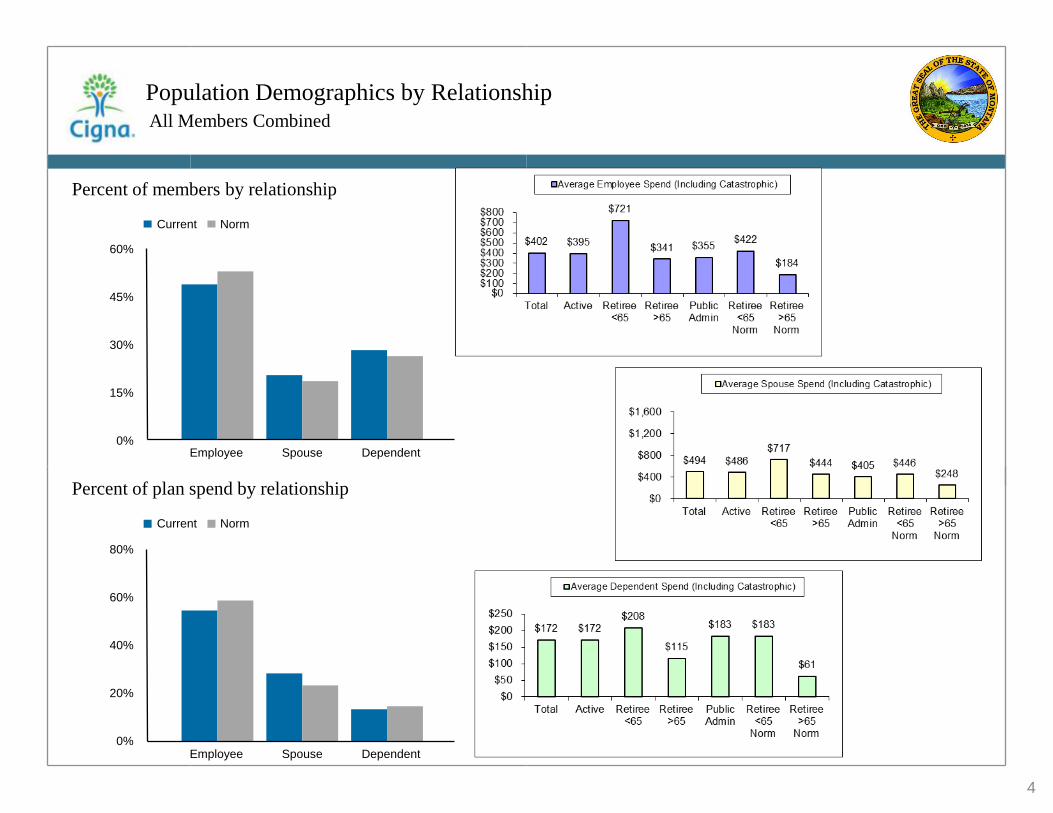
Population Demographics by Relationship All Members Combined
Percent of members by relationship
Percent of plan spend by relationship
60%
45%
30%
15%
0%
Current Norm
Employee Spouse Dependent
Current Norm
80%
60%
40%
20%
0% Employee Spouse Dependent
4
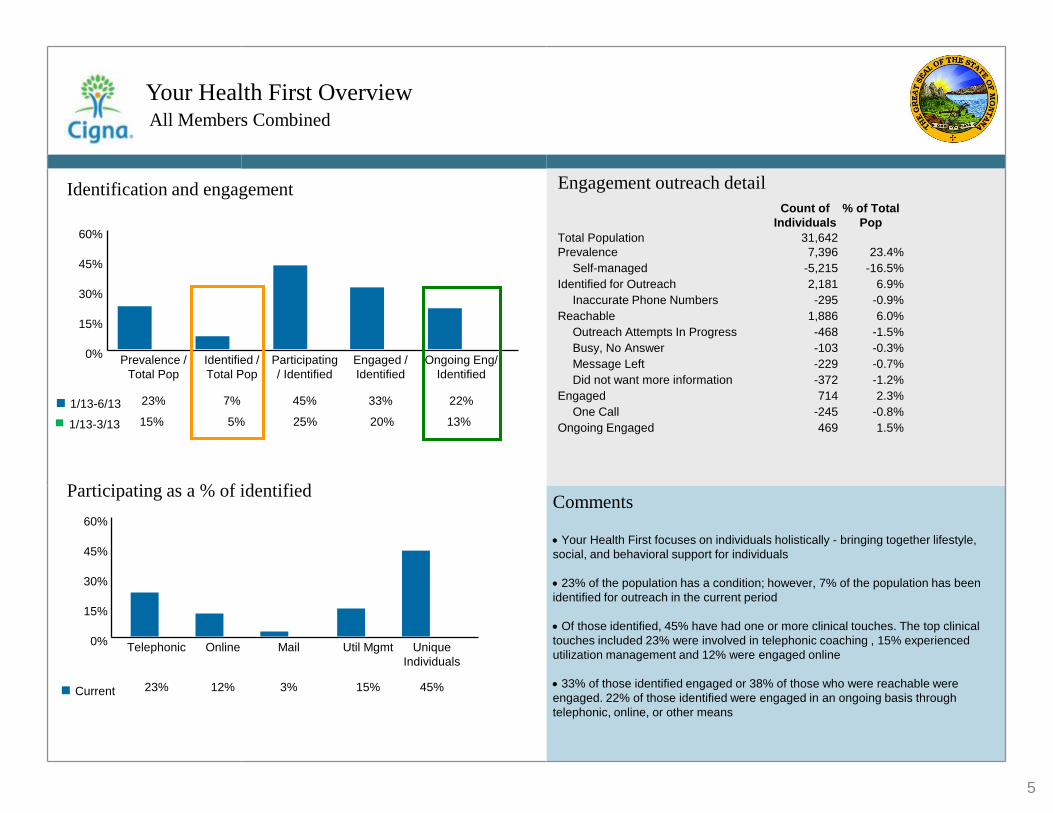
Identification and engagement
Participating as a % of identified
Your Health First Overview All Members Combined
Comments
Your Health First focuses on individuals holistically - bringing together lifestyle,
social, and behavioral support for individuals
23% of the population has a condition; however, 7% of the population has been
identified for outreach in the current period
Of those identified, 45% have had one or more clinical touches. The top clinical
touches included 23% were involved in telephonic coaching , 15% experienced
utilization management and 12% were engaged online
33% of those identified engaged or 38% of those who were reachable were
engaged. 22% of those identified were engaged in an ongoing basis through
telephonic, online, or other means
60%
45%
30%
15%
0%
1/13-6/13
Prevalence /
Total Pop
Identified /
Total Pop
Participating
/ Identified
Engaged /
Identified
Ongoing Eng/
Identified
23% 7% 45% 33% 22%
Engagement outreach detail
Count of
Individuals
% of Total
Pop
Total Population 31,642
Prevalence 7,396 23.4%
Self-managed -5,215 -16.5%
Identified for Outreach 2,181 6.9%
Inaccurate Phone Numbers -295 -0.9%
Reachable 1,886 6.0%
Outreach Attempts In Progress -468 -1.5%
Busy, No Answer -103 -0.3%
Message Left -229 -0.7%
Did not want more information -372 -1.2%
Engaged 714 2.3%
One Call -245 -0.8%
Ongoing Engaged 469 1.5%
60%
45%
30%
15%
0%
Current
Telephonic Online Mail Util Mgmt Unique
Individuals
23% 12% 3% 15% 45%
1/13-3/13 15% 5% 25% 20% 13%
5
YHF - Chronic Conditions All Members Combined
Comments
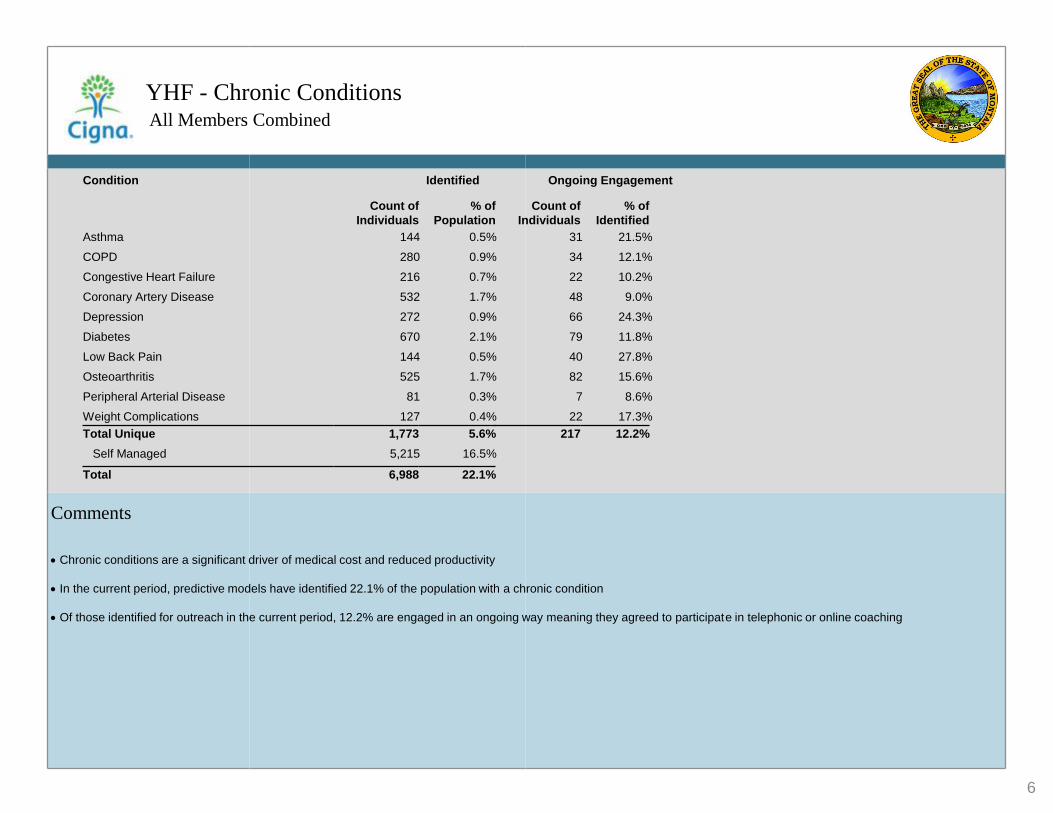
Chronic conditions are a significant driver of medical cost and reduced productivity
In the current period, predictive models have identified 22.1% of the population with a chronic condition
Of those identified for outreach in the current period, 12.2% are engaged in an ongoing way meaning they agreed to participate in telephonic or online coaching
Condition Identified Ongoing Engagement
Count of
Individuals
% of
Population
Count of
Individuals
% of
Identified
Asthma 144 0.5% 31 21.5%
COPD 280 0.9% 34 12.1%
Congestive Heart Failure 216 0.7% 22 10.2%
Coronary Artery Disease 532 1.7% 48 9.0%
Depression 272 0.9% 66 24.3%
Diabetes 670 2.1% 79 11.8%
Low Back Pain 144 0.5% 40 27.8%
Osteoarthritis 525 1.7% 82 15.6%
Peripheral Arterial Disease 81 0.3% 7 8.6%
Weight Complications 127 0.4% 22 17.3%
Total Unique 1,773 5.6% 217 12.2%
Self Managed 5,215 16.5%
Total 6,988 22.1%
6
Catastrophic Claim Summary All Members Combined
Comments
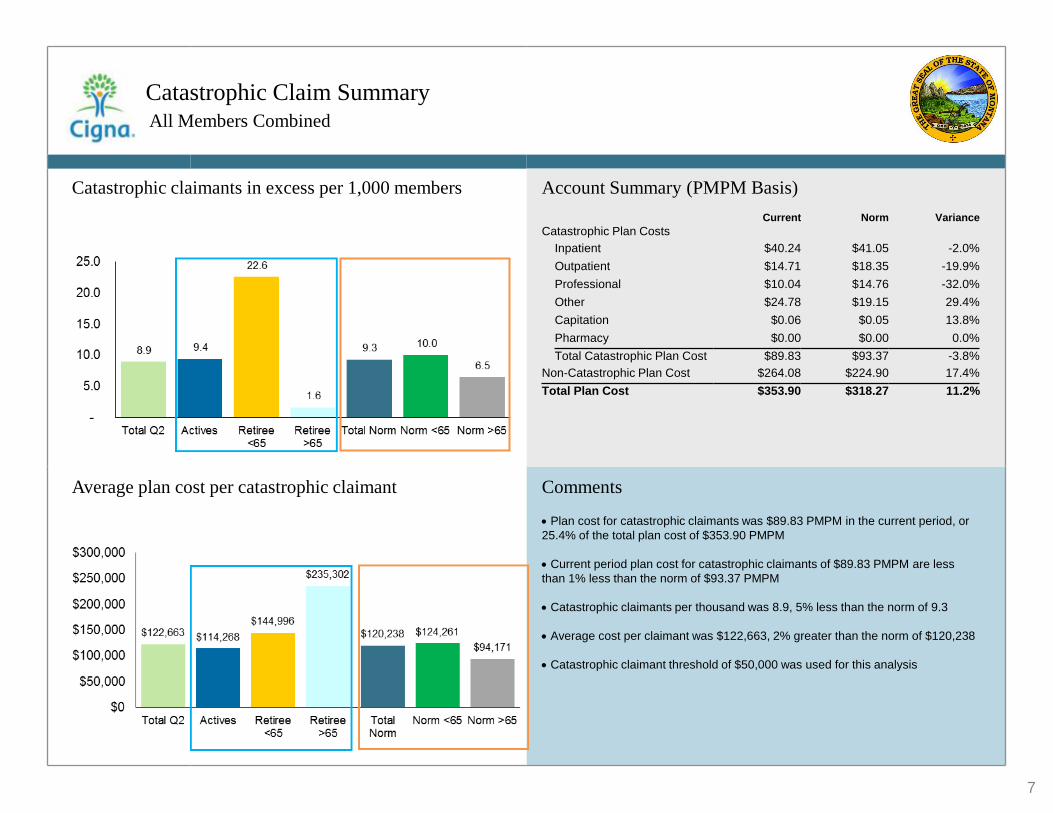
Plan cost for catastrophic claimants was $89.83 PMPM in the current period, or
25.4% of the total plan cost of $353.90 PMPM
Current period plan cost for catastrophic claimants of $89.83 PMPM are less
than 1% less than the norm of $93.37 PMPM
Catastrophic claimants per thousand was 8.9, 5% less than the norm of 9.3
Average cost per claimant was $122,663, 2% greater than the norm of $120,238
Catastrophic claimant threshold of $50,000 was used for this analysis
Account Summary (PMPM Basis)
Current Norm Variance
Catastrophic Plan Costs
Inpatient $40.24 $41.05 -2.0%
Outpatient $14.71 $18.35 -19.9%
Professional $10.04 $14.76 -32.0%
Other $24.78 $19.15 29.4%
Capitation $0.06 $0.05 13.8%
Pharmacy $0.00 $0.00 0.0%
Total Catastrophic Plan Cost $89.83 $93.37 -3.8%
Non-Catastrophic Plan Cost $264.08 $224.90 17.4%
Total Plan Cost $353.90 $318.27 11.2%
Catastrophic claimants in excess per 1,000 members
Average plan cost per catastrophic claimant
7
Case management referral source
Health Advocacy - Specialty Case Management All Members Combined
Comments
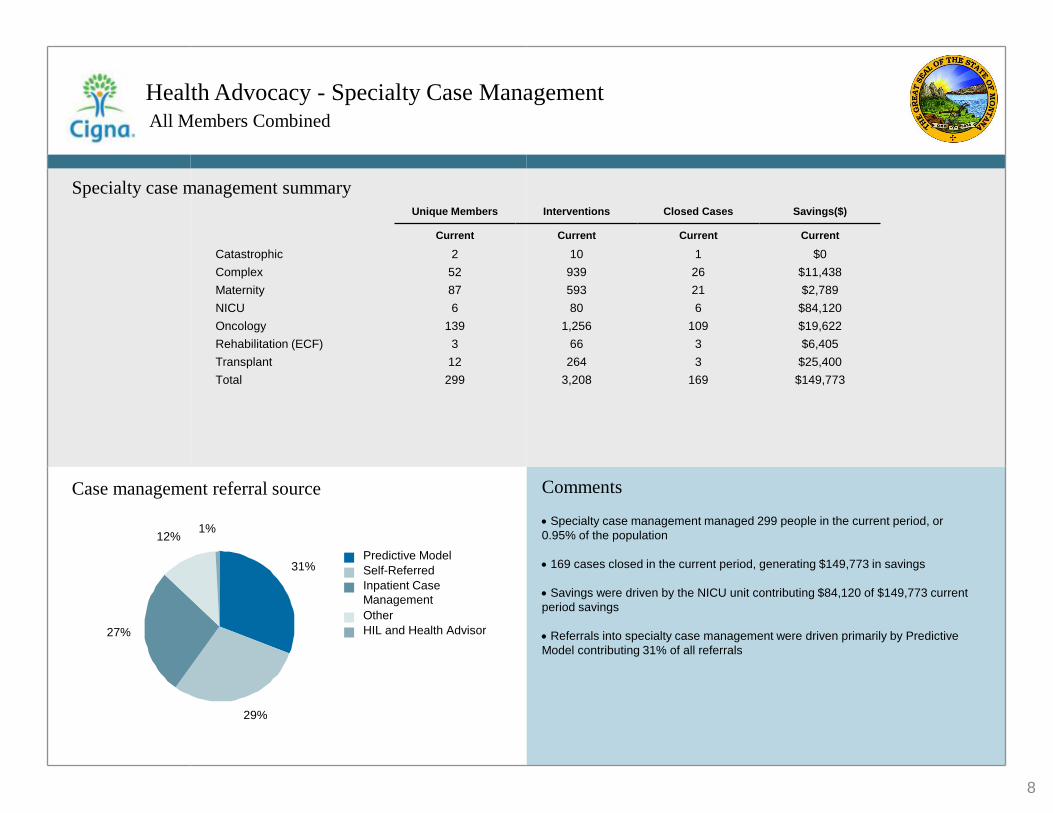
Specialty case management managed 299 people in the current period, or
0.95% of the population
169 cases closed in the current period, generating $149,773 in savings
Savings were driven by the NICU unit contributing $84,120 of $149,773 current
period savings
Referrals into specialty case management were driven primarily by Predictive
Model contributing 31% of all referrals
Specialty case management summary
Unique Members Interventions Closed Cases Savings($)
Current Current Current Current
Catastrophic 2 10 1 $0
Complex 52 939 26 $11,438
Maternity 87 593 21 $2,789
NICU 6 80 6 $84,120
Oncology 139 1,256 109 $19,622
Rehabilitation (ECF) 3 66 3 $6,405
Transplant 12 264 3 $25,400
Total 299 3,208 169 $149,773
Predictive Model
Self-Referred
Inpatient Case
Management
Other
HIL and Health Advisor
31%
29%
27%
12% 1%
8
Total Plan Spend by Condition All Members Combined
Current Norm 28.0%
21.0%
14.0%
7.0%
0.0%
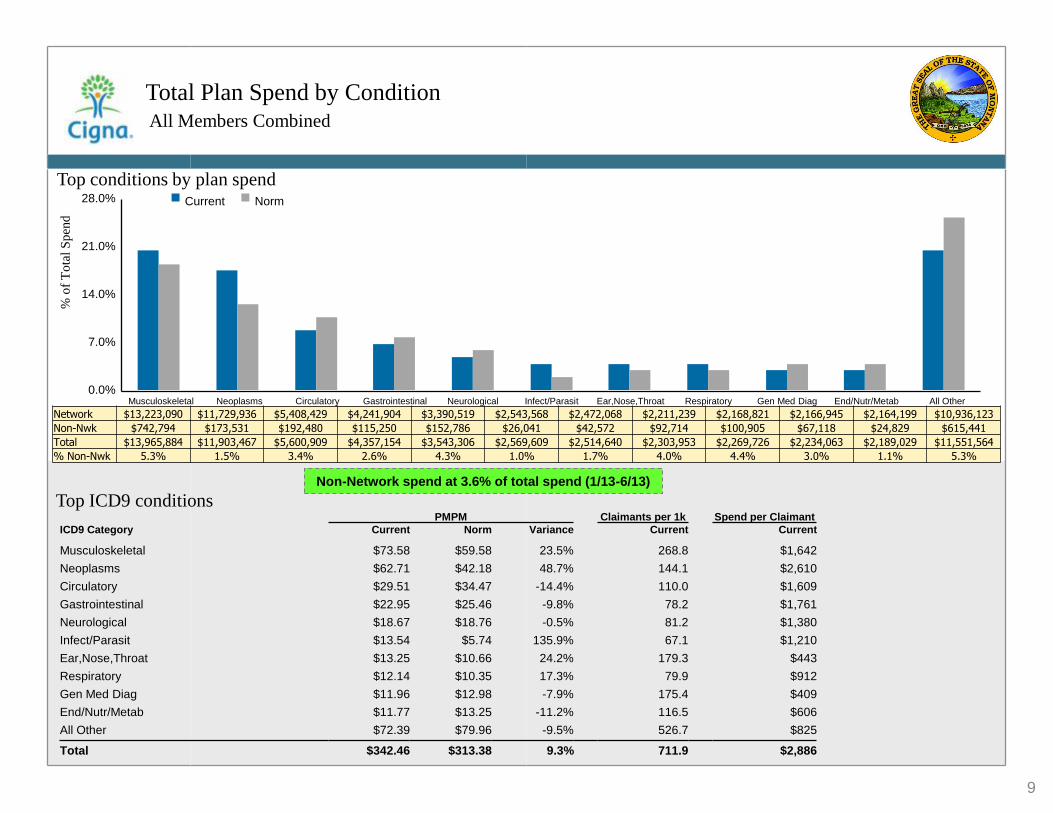
Top conditions by plan spend
Top ICD9 conditions PMPM Claimants per 1k Spend per Claimant
ICD9 Category Current Norm Variance Current Current
Musculoskeletal $73.58 $59.58 23.5% 268.8 $1,642
Neoplasms $62.71 $42.18 48.7% 144.1 $2,610
Circulatory $29.51 $34.47 -14.4% 110.0 $1,609
Gastrointestinal $22.95 $25.46 -9.8% 78.2 $1,761
Neurological $18.67 $18.76 -0.5% 81.2 $1,380
Infect/Parasit $13.54 $5.74 135.9% 67.1 $1,210
Ear,Nose,Throat $13.25 $10.66 24.2% 179.3 $443
Respiratory $12.14 $10.35 17.3% 79.9 $912
Gen Med Diag $11.96 $12.98 -7.9% 175.4 $409
End/Nutr/Metab $11.77 $13.25 -11.2% 116.5 $606
All Other $72.39 $79.96 -9.5% 526.7 $825
Total $342.46 $313.38 9.3% 711.9 $2,886
Musculoskeletal Neoplasms Circulatory Gastrointestinal Neurological Infect/Parasit Ear,Nose,Throat Respiratory Gen Med Diag End/Nutr/Metab All Other
% o
f T
ota
l S
pen
d
Non-Network spend at 3.6% of total spend (1/13-6/13)
Network $13,223,090 $11,729,936 $5,408,429 $4,241,904 $3,390,519 $2,543,568 $2,472,068 $2,211,239 $2,168,821 $2,166,945 $2,164,199 $10,936,123
Non-Nwk $742,794 $173,531 $192,480 $115,250 $152,786 $26,041 $42,572 $92,714 $100,905 $67,118 $24,829 $615,441
Total $13,965,884 $11,903,467 $5,600,909 $4,357,154 $3,543,306 $2,569,609 $2,514,640 $2,303,953 $2,269,726 $2,234,063 $2,189,029 $11,551,564
% Non-Nwk 5.3% 1.5% 3.4% 2.6% 4.3% 1.0% 1.7% 4.0% 4.4% 3.0% 1.1% 5.3%
9
Healthy Pregnancies Healthy Babies
All Members Combined
Comments
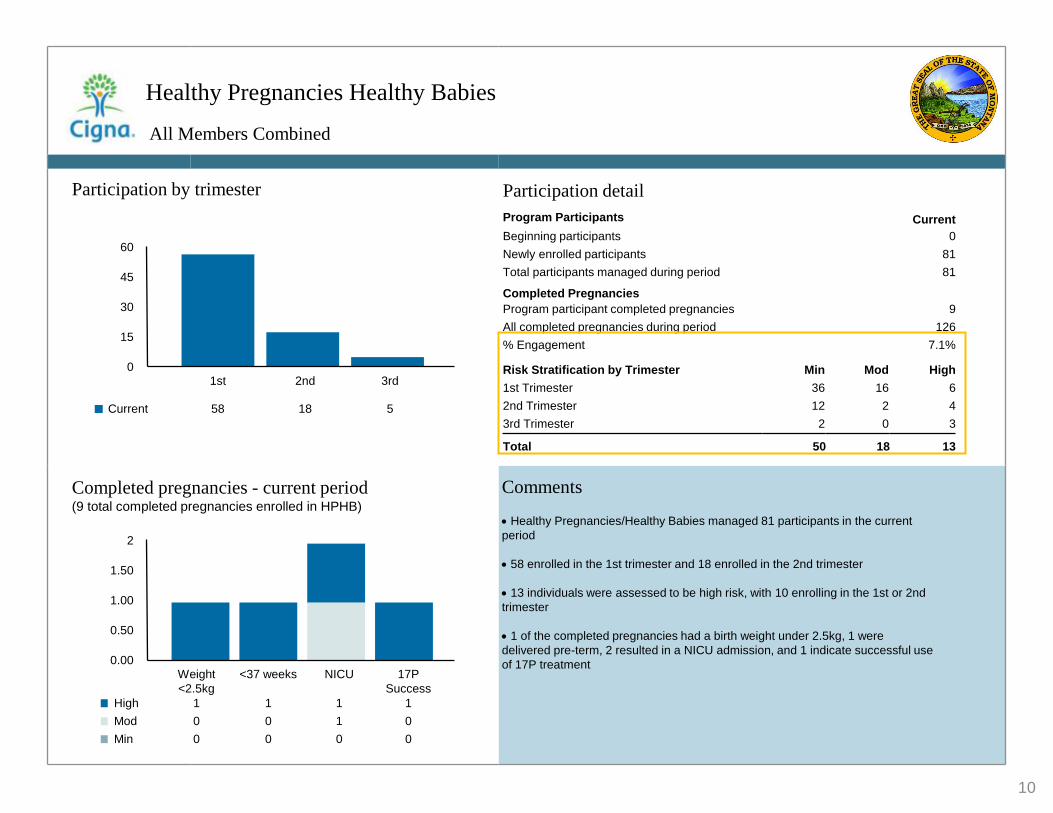
Healthy Pregnancies/Healthy Babies managed 81 participants in the current
period
58 enrolled in the 1st trimester and 18 enrolled in the 2nd trimester
13 individuals were assessed to be high risk, with 10 enrolling in the 1st or 2nd
trimester
1 of the completed pregnancies had a birth weight under 2.5kg, 1 were
delivered pre-term, 2 resulted in a NICU admission, and 1 indicate successful use
of 17P treatment
Completed pregnancies - current period (9 total completed pregnancies enrolled in HPHB)
2
1.50
1.00
0.50
0.00
High
Mod
Min
Weight
<2.5kg
<37 weeks NICU 17P
Success
1 1 1 1
0 0 1 0
0 0 0 0
Participation by trimester
60
45
30
15
0 1st 2nd 3rd
58 18 5 Current
Participation detail
Program Participants Current
Beginning participants 0
Newly enrolled participants 81
Total participants managed during period 81
Completed Pregnancies
Program participant completed pregnancies 9
All completed pregnancies during period 126
% Engagement 7.1%
Risk Stratification by Trimester Min Mod High
1st Trimester 36 16 6
2nd Trimester 12 2 4
3rd Trimester 2 0 3
Total 50 18 13
10
Clinical program management
Health Advocacy - Inpatient Utilization Management All Members Combined
Comments
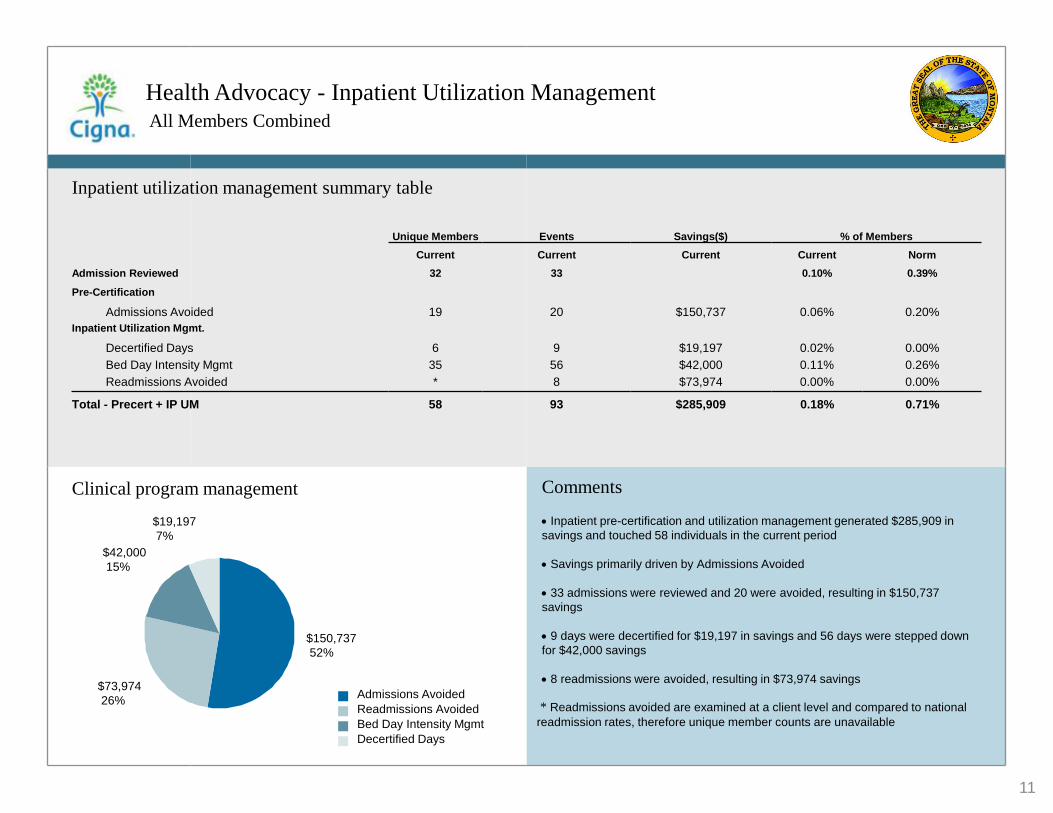
Inpatient pre-certification and utilization management generated $285,909 in
savings and touched 58 individuals in the current period
Savings primarily driven by Admissions Avoided
33 admissions were reviewed and 20 were avoided, resulting in $150,737
savings
9 days were decertified for $19,197 in savings and 56 days were stepped down
for $42,000 savings
8 readmissions were avoided, resulting in $73,974 savings
Admissions Avoided
Readmissions Avoided
Bed Day Intensity Mgmt
Decertified Days
$150,737
52%
$73,974
26%
$42,000
15%
$19,197
7%
* Readmissions avoided are examined at a client level and compared to national
readmission rates, therefore unique member counts are unavailable
Inpatient utilization management summary table
Unique Members Events Savings($) % of Members
Current Current Current Current Norm
Admission Reviewed 32 33 0.10% 0.39%
Pre-Certification
Admissions Avoided 19 20 $150,737 0.06% 0.20%
Inpatient Utilization Mgmt.
Decertified Days 6 9 $19,197 0.02% 0.00%
Bed Day Intensity Mgmt 35 56 $42,000 0.11% 0.26%
Readmissions Avoided * 8 $73,974 0.00% 0.00%
Total - Precert + IP UM 58 93 $285,909 0.18% 0.71%
11
Outpatient Plan Spend by Condition All Members Combined
Current Norm 20.0%
15.0%
10.0%
5.0%
0.0% Musculoskeletal Neoplasms Circulatory Gastrointestinal Renal/Urologic Neurological Ear,Nose,Throat Gen Med Diag Reproductive End/Nutr/Metab All Other
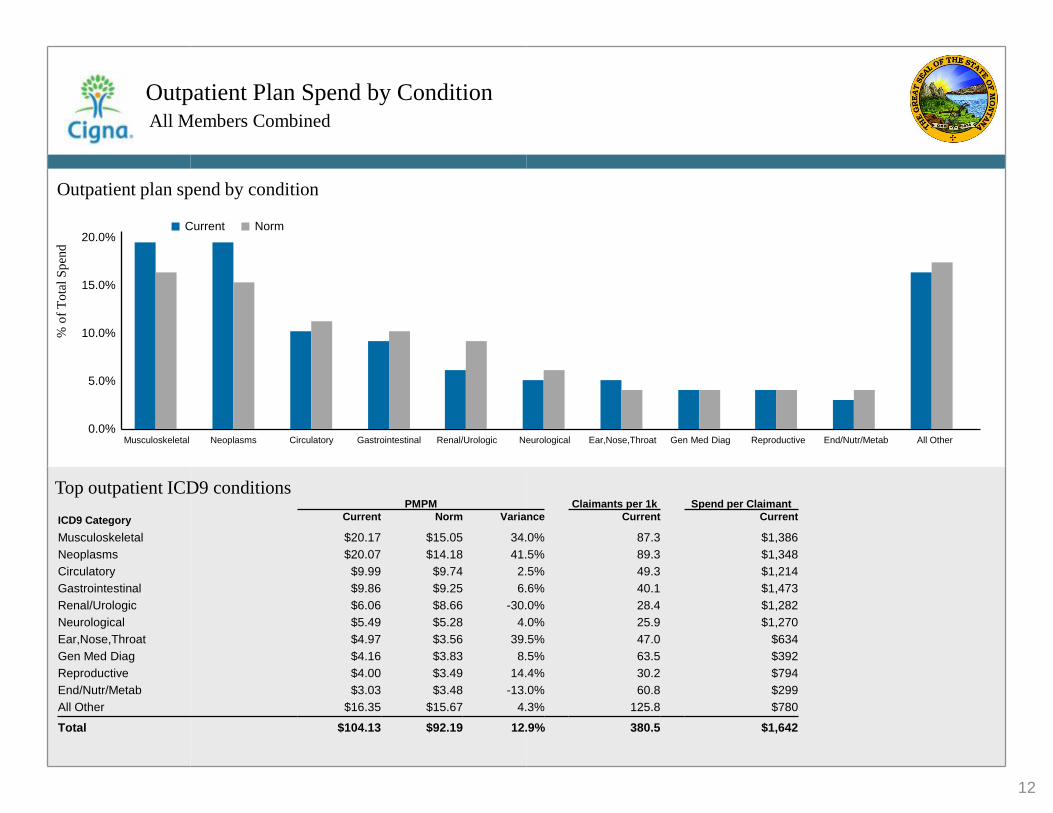
Outpatient plan spend by condition
Top outpatient ICD9 conditions PMPM Claimants per 1k Spend per Claimant
ICD9 Category Current Norm Variance Current Current
Musculoskeletal $20.17 $15.05 34.0% 87.3 $1,386
Neoplasms $20.07 $14.18 41.5% 89.3 $1,348
Circulatory $9.99 $9.74 2.5% 49.3 $1,214
Gastrointestinal $9.86 $9.25 6.6% 40.1 $1,473
Renal/Urologic $6.06 $8.66 -30.0% 28.4 $1,282
Neurological $5.49 $5.28 4.0% 25.9 $1,270
Ear,Nose,Throat $4.97 $3.56 39.5% 47.0 $634
Gen Med Diag $4.16 $3.83 8.5% 63.5 $392
Reproductive $4.00 $3.49 14.4% 30.2 $794
End/Nutr/Metab $3.03 $3.48 -13.0% 60.8 $299
All Other $16.35 $15.67 4.3% 125.8 $780
Total $104.13 $92.19 12.9% 380.5 $1,642
% o
f T
ota
l S
pen
d
12
Emergency Room/Urgent Care Opportunity All Members Combined
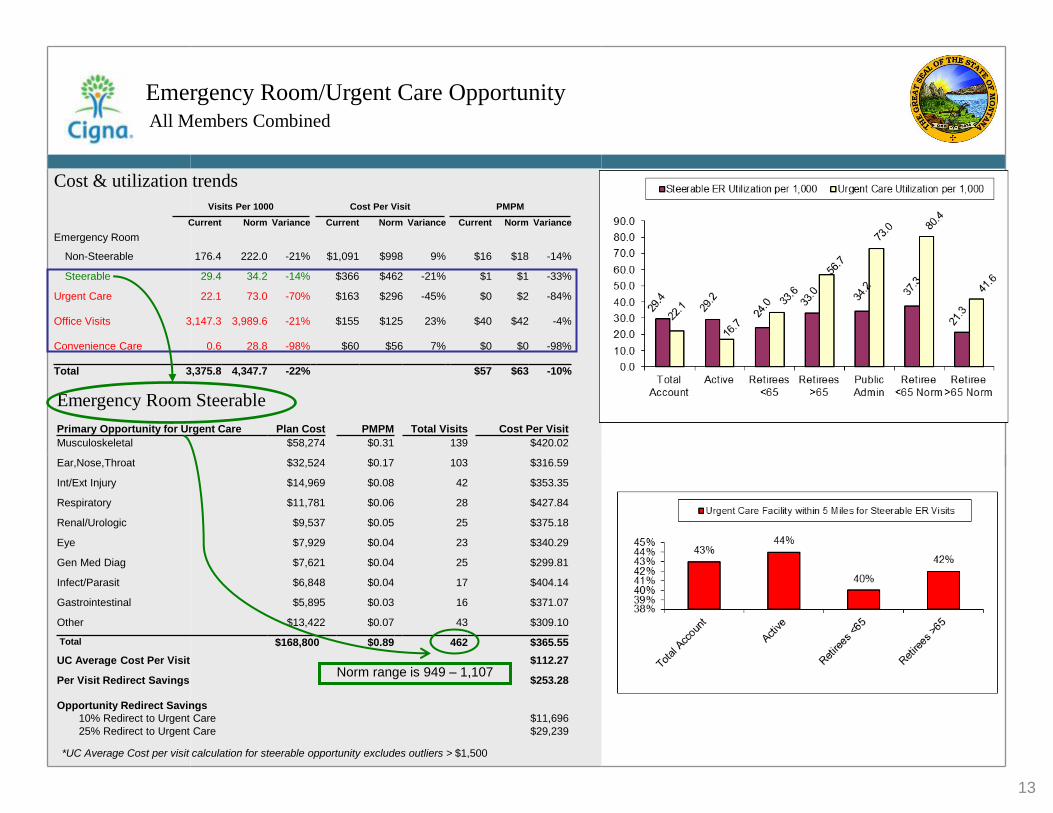
Cost & utilization trends
Visits Per 1000 Cost Per Visit PMPM
Current Norm Variance Current Norm Variance Current Norm Variance
Emergency Room
Non-Steerable 176.4 222.0 -21% $1,091 $998 9% $16 $18 -14%
Steerable 29.4 34.2 -14% $366 $462 -21% $1 $1 -33%
Urgent Care 22.1 73.0 -70% $163 $296 -45% $0 $2 -84%
Office Visits 3,147.3 3,989.6 -21% $155 $125 23% $40 $42 -4%
Convenience Care 0.6 28.8 -98% $60 $56 7% $0 $0 -98%
Total 3,375.8 4,347.7 -22% $57 $63 -10%
Emergency Room Steerable
Primary Opportunity for Urgent Care Plan Cost PMPM Total Visits
Cost Per Visit
Musculoskeletal $58,274 $0.31 139 $420.02
Ear,Nose,Throat $32,524 $0.17 103 $316.59
Int/Ext Injury $14,969 $0.08 42 $353.35
Respiratory $11,781 $0.06 28 $427.84
Renal/Urologic $9,537 $0.05 25 $375.18
Eye $7,929 $0.04 23 $340.29
Gen Med Diag $7,621 $0.04 25 $299.81
Infect/Parasit $6,848 $0.04 17 $404.14
Gastrointestinal $5,895 $0.03 16 $371.07
Other $13,422 $0.07 43 $309.10
Total $168,800 $0.89 462 $365.55
UC Average Cost Per Visit $112.27
Per Visit Redirect Savings $253.28
Opportunity Redirect Savings
10% Redirect to Urgent Care $11,696
25% Redirect to Urgent Care $29,239
*UC Average Cost per visit calculation for steerable opportunity excludes outliers > $1,500
Norm range is 949 – 1,107
13
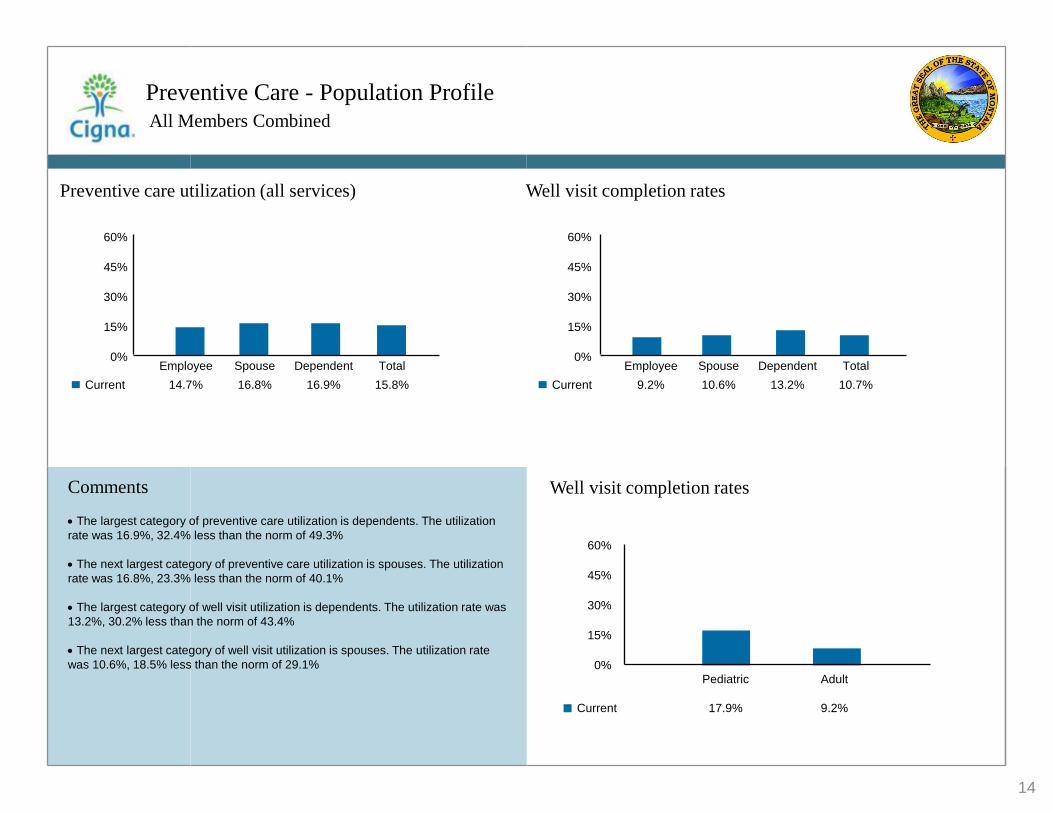
Preventive Care - Population Profile All Members Combined
Comments
The largest category of preventive care utilization is dependents. The utilization
rate was 16.9%, 32.4% less than the norm of 49.3%
The next largest category of preventive care utilization is spouses. The utilization
rate was 16.8%, 23.3% less than the norm of 40.1%
The largest category of well visit utilization is dependents. The utilization rate was
13.2%, 30.2% less than the norm of 43.4%
The next largest category of well visit utilization is spouses. The utilization rate
was 10.6%, 18.5% less than the norm of 29.1%
Current
60%
45%
30%
15%
0%
Well visit completion rates Preventive care utilization (all services)
60%
45%
30%
15%
0%
Current
Employee Spouse Dependent Total
14.7% 16.8% 16.9% 15.8%
Employee Spouse Dependent Total
9.2% 10.6% 13.2% 10.7%
Well visit completion rates
60%
45%
30%
15%
0%
Current
Pediatric Adult
17.9% 9.2%
14
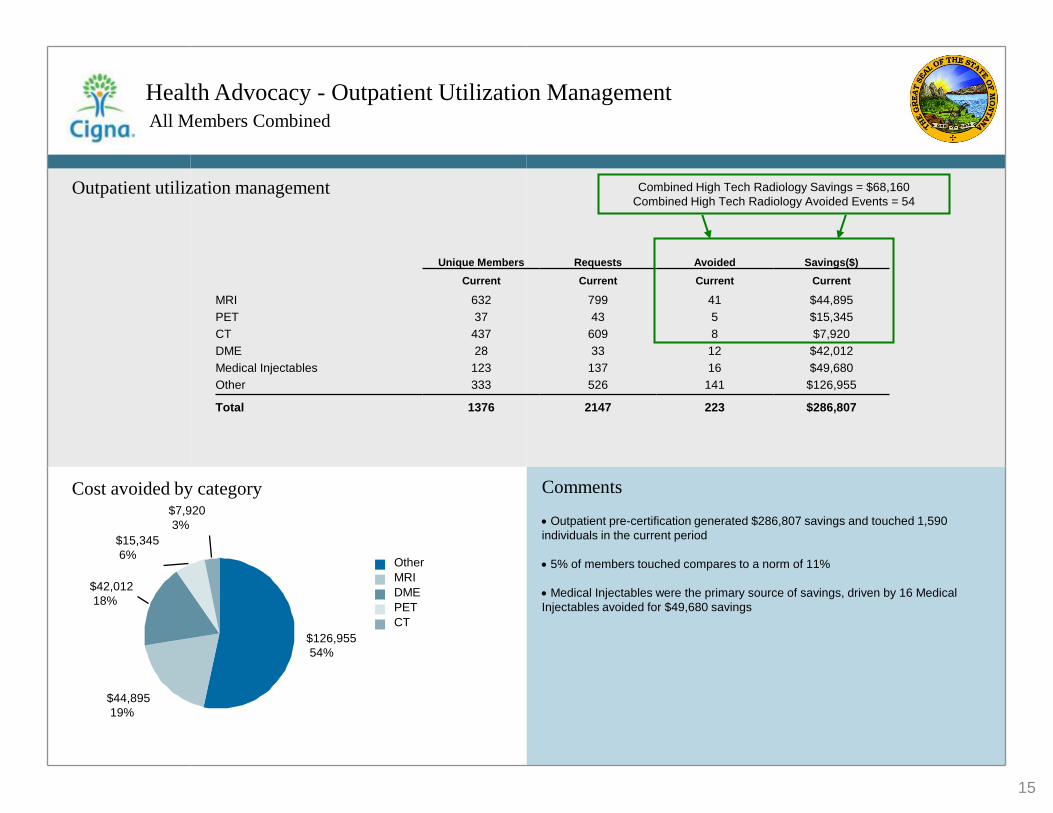
Cost avoided by category
Health Advocacy - Outpatient Utilization Management All Members Combined
Comments
Outpatient pre-certification generated $286,807 savings and touched 1,590
individuals in the current period
5% of members touched compares to a norm of 11%
Medical Injectables were the primary source of savings, driven by 16 Medical
Injectables avoided for $49,680 savings
Outpatient utilization management
Unique Members Requests Avoided Savings($)
Current Current Current Current
MRI 632 799 41 $44,895
PET 37 43 5 $15,345
CT 437 609 8 $7,920
DME 28 33 12 $42,012
Medical Injectables 123 137 16 $49,680
Other 333 526 141 $126,955
Total 1376 2147 223 $286,807
Other
MRI
DME
PET
CT
$126,955
54%
$44,895
19%
$42,012
18%
$15,345
6%
$7,920
3%
Combined High Tech Radiology Savings = $68,160
Combined High Tech Radiology Avoided Events = 54
15