Embed Size (px)
Citation preview
1
CONSOLIDATED RESULTS AT DECEMBER 31, 2019
A strong operational performance:
» Close to 68 million Group customers, up 11.1%;
» Growth in Group revenues (+0.9% on a like-for-like basis*), driven by the rise of Mobile
Data in Morocco and in the subsidiaries;
» Increased profitability with EBITDA margin of 51.8% up 1.2 pt on a like-for-like basis*,
promoted by ongoing cost optimization;
» Adjusted Consolidated Cash Flow From Operations up 29.0% on a like-for-like basis*.
Proposed dividend payment of MAD 4.9 billion, implying MAD 5.54 per share and
representing a yield of 3.8%**.
Maroc Telecom Group outlook for 2020 at constant scope and exchange rates:
► Stable revenues; ► Stable EBITDA; ► CAPEX of approximately 15% of revenues, excluding frequencies and licenses.
To mark the publication of this press release, Mr Abdeslam Ahizoune, Chairman of the Management
Board, made the following comments:
" Excluding the impact of ANRT decision, Maroc
Telecom Group improves its performance and
increases profits beyond its annual objectives. It
corroborates the relevance of its strategy based on
performing networks and a range of services
tailored to its market both domestic and in
subsidiaries.
Maroc Telecom will pursue in 2020 its investment
efforts and the digitization of its services in order to
improve the customer experience and the
operational efficiency of its organization."
* Like-for-like basis refers to the notes of consolidating Tigo Chad, an unchanged MAD/Ouguiya/CFA franc exchange rate and
neutralization of the impact of IFRS 16
** Based on the price at February 14, 2020 (MAD 145)
Rabat, February 17, 2020
PRESS RELEASE
2
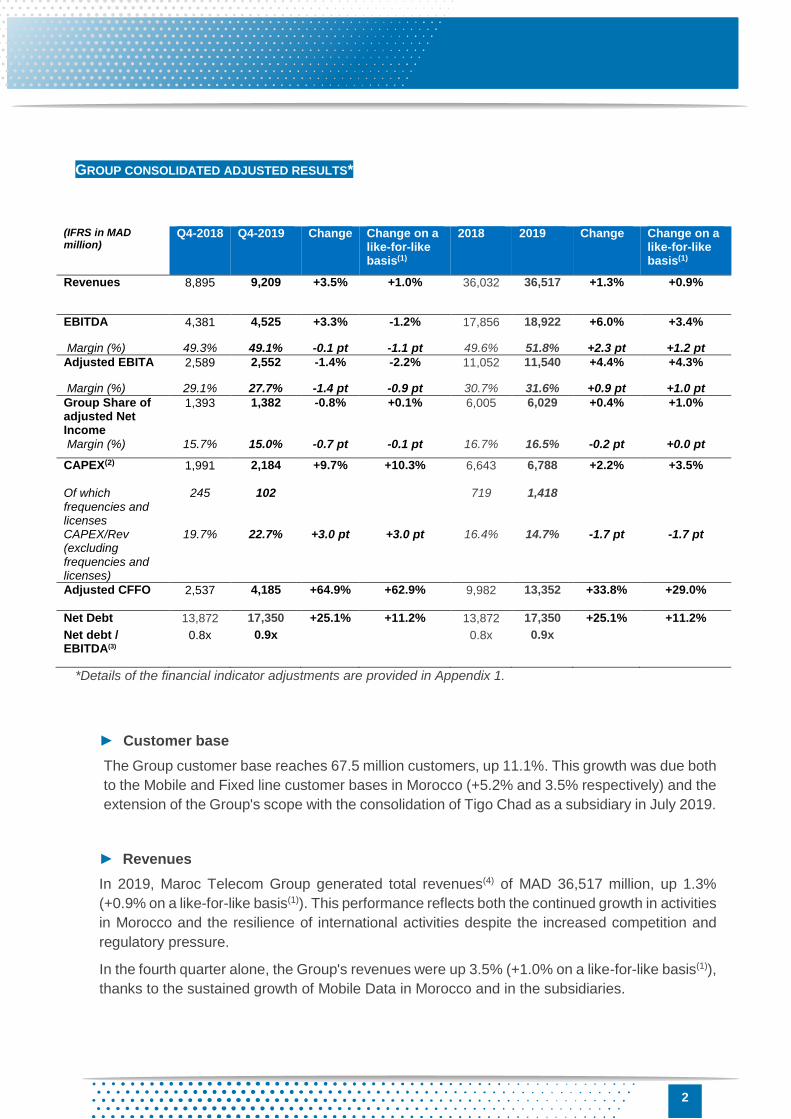
GROUP CONSOLIDATED ADJUSTED RESULTS*
(IFRS in MAD million)
Q4-2018 Q4-2019 Change Change on a like-for-like basis(1)
2018 2019 Change Change on a like-for-like basis(1)
Revenues 8,895 9,209 +3.5% +1.0% 36,032 36,517 +1.3% +0.9%
EBITDA 4,381 4,525 +3.3% -1.2% 17,856 18,922 +6.0% +3.4%
Margin (%) 49.3% 49.1% -0.1 pt -1.1 pt 49.6% 51.8% +2.3 pt +1.2 pt
Adjusted EBITA 2,589 2,552 -1.4% -2.2% 11,052 11,540 +4.4% +4.3%
Margin (%) 29.1% 27.7% -1.4 pt -0.9 pt 30.7% 31.6% +0.9 pt +1.0 pt
Group Share of adjusted Net Income
1,393 1,382 -0.8% +0.1% 6,005 6,029 +0.4% +1.0%
Margin (%) 15.7% 15.0% -0.7 pt -0.1 pt 16.7% 16.5% -0.2 pt +0.0 pt
CAPEX(2) 1,991 2,184 +9.7% +10.3% 6,643 6,788 +2.2% +3.5%
Of which frequencies and licenses
245 102 719 1,418
CAPEX/Rev (excluding frequencies and licenses)
19.7% 22.7% +3.0 pt +3.0 pt 16.4% 14.7% -1.7 pt -1.7 pt
Adjusted CFFO 2,537 4,185 +64.9% +62.9% 9,982 13,352 +33.8% +29.0%
Net Debt 13,872 17,350 +25.1% +11.2% 13,872 17,350 +25.1% +11.2%
Net debt / EBITDA(3)
0.8x 0.9x 0.8x 0.9x
*Details of the financial indicator adjustments are provided in Appendix 1.
► Customer base
The Group customer base reaches 67.5 million customers, up 11.1%. This growth was due both
to the Mobile and Fixed line customer bases in Morocco (+5.2% and 3.5% respectively) and the
extension of the Group's scope with the consolidation of Tigo Chad as a subsidiary in July 2019.
► Revenues
In 2019, Maroc Telecom Group generated total revenues(4) of MAD 36,517 million, up 1.3%
(+0.9% on a like-for-like basis(1)). This performance reflects both the continued growth in activities
in Morocco and the resilience of international activities despite the increased competition and
regulatory pressure.
In the fourth quarter alone, the Group's revenues were up 3.5% (+1.0% on a like-for-like basis(1)),
thanks to the sustained growth of Mobile Data in Morocco and in the subsidiaries.
3
► Earnings from operations before depreciation and amortization
Thanks to a robust management of costs, Maroc Telecom Group earnings from operations before
depreciation and amortization (EBITDA) amounted to MAD 18,922 million, up 3.4% on a like-for-
like basis(1). The EBITDA margin reached 51.8%, up 1.2 pt on a like-for-like basis(1).
► Earnings from operations
At the end of 2019, Maroc Telecom Group's adjusted earnings from operations
(EBITA)(5) amounted to MAD 11,540 million, up 4.3% on a like-for-like basis(1). This increase was
mainly due to an increased EBITDA. The adjusted EBITA margin increased by 0.9 pt (+1.0 pt on
a like-for-like basis(1)) to 31.6%.
► Group share of net income
The Group share of adjusted Net Income was up 1.0% on a like-for-like basis(1).
► Investments
The capital expenditures(2) reached MAD 6,788 million up 2.2% year-on-year and representing
14.7% of revenues (excluding frequencies and licences). This level of capital expenditures
remains in line with the stated objective for the year.
► Cash Flow
Adjusted Cash Flow From Operations (CFFO)(6) was up 33.8% (+29.0% on a like-for-like
basis(1)), to MAD 13,352 million due to the increased EBITDA and effective management of
working capital requirements (WCR).
At December 31, 2019, Maroc Telecom Group's consolidated net debt(7) represented 0.9 time
the Group's annual EBITDA excluding the impact of IFRS16.
► ANRT decision
The decision taken by the Management Committee of the ANRT on January 17, 2020, relating
to anti-competitive practices on the fixed-line market and fixed broadband internet access, has
been notified to Maroc Telecom on January 27, 2020.
This binding decision concerns a financial penalty of MAD 3.3 billion and injunctions relating to
the technical and pricing aspects of the local loop unbundling.
In view of the recent, complex and exceptional nature of the decision received, Maroc Telecom
is studying the file.
As required by law, Maroc Telecom has the option to lodge an appeal with the court of appeal
within 30 days from the notification of the decision.
In this context, Maroc Telecom has made a provision in its accounts as of 31 December 2019
for an amount of MAD 3.3 billion.
4
► Appointments to the Supervisory Board
At its meeting on Friday December 6, 2019, Maroc Telecom's Supervisory Board co-opted Mr
Obaid Bin Humaid Al Tayer as Vice-Chairman of the Board, replacing Mr Eissa Mohamed
Ghanem Al Suwaidi.
► Dividend
At the Shareholders' Meeting of April 21, 2020, Maroc Telecom's Supervisory Board will propose
to shareholders the distribution of a dividend of MAD 5.54 per share, representing a total of MAD
4.9 billion. This dividend would be paid from June 2, 2020.
► Outlook for Maroc Telecom group for 2020
On the basis of recent changes in the market and assuming that no new major exceptional events
impact the Group's business, Maroc Telecom is projecting the following for 2020, at constant
scope and exchange rates:
► Stable revenues; ► Stable EBITDA; ► CAPEX of approximately 15% of revenues, excluding frequencies and licenses.
5
REVIEW OF THE GROUP’S ACTIVITIES
Details of the financial indicator adjustments for "Morocco" and "International" are provided in
Appendix 1.
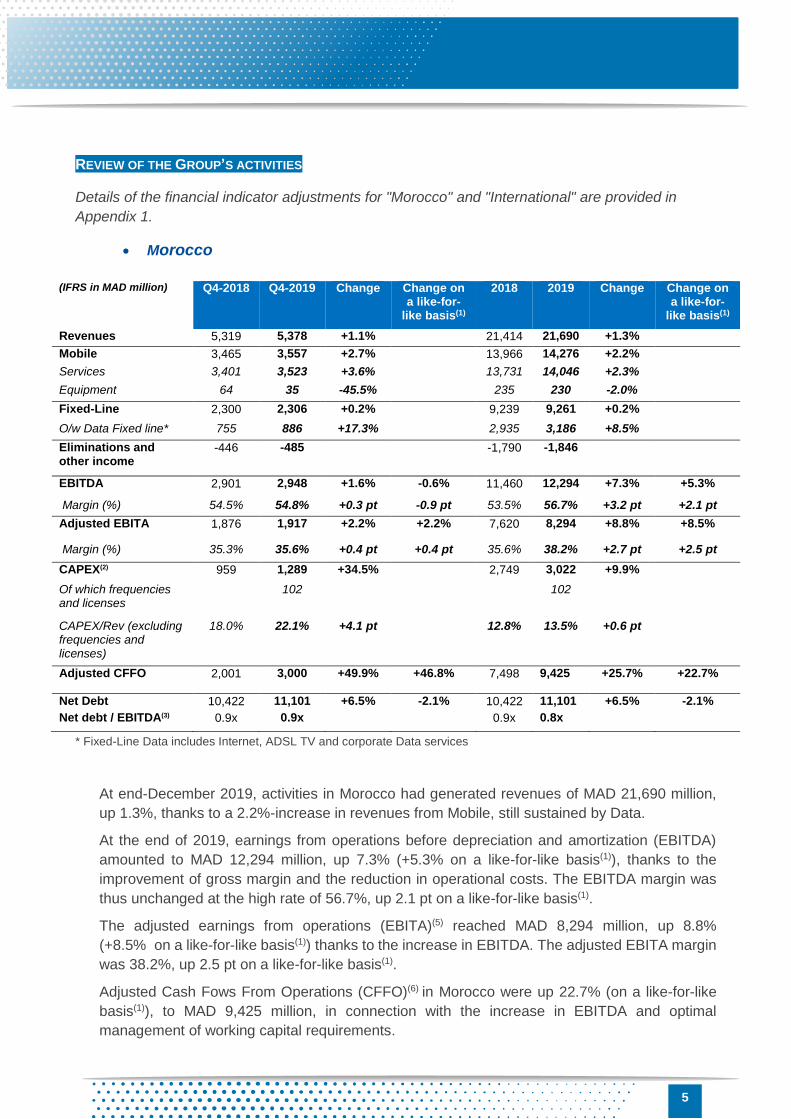
Morocco
(IFRS in MAD million) Q4-2018 Q4-2019 Change Change on a like-for-
like basis(1)
2018 2019 Change Change on a like-for-
like basis(1)
Revenues 5,319 5,378 +1.1% 21,414 21,690 +1.3%
Mobile 3,465 3,557 +2.7% 13,966 14,276 +2.2%
Services 3,401 3,523 +3.6% 13,731 14,046 +2.3%
Equipment 64 35 -45.5% 235 230 -2.0%
Fixed-Line 2,300 2,306 +0.2% 9,239 9,261 +0.2%
O/w Data Fixed line* 755 886 +17.3% 2,935 3,186 +8.5%
Eliminations and other income
-446 -485 -1,790 -1,846
EBITDA 2,901 2,948 +1.6% -0.6% 11,460 12,294 +7.3% +5.3%
Margin (%) 54.5% 54.8% +0.3 pt -0.9 pt 53.5% 56.7% +3.2 pt +2.1 pt
Adjusted EBITA 1,876 1,917 +2.2% +2.2% 7,620 8,294 +8.8% +8.5%
Margin (%) 35.3% 35.6% +0.4 pt +0.4 pt 35.6% 38.2% +2.7 pt +2.5 pt
CAPEX(2) 959 1,289 +34.5% 2,749 3,022 +9.9%
Of which frequencies and licenses
102 102
CAPEX/Rev (excluding frequencies and licenses)
18.0% 22.1% +4.1 pt 12.8% 13.5% +0.6 pt
Adjusted CFFO 2,001 3,000 +49.9% +46.8% 7,498 9,425 +25.7% +22.7%
Net Debt 10,422 11,101 +6.5% -2.1% 10,422 11,101 +6.5% -2.1%
Net debt / EBITDA(3) 0.9x 0.9x 0.9x 0.8x
* Fixed-Line Data includes Internet, ADSL TV and corporate Data services
At end-December 2019, activities in Morocco had generated revenues of MAD 21,690 million,
up 1.3%, thanks to a 2.2%-increase in revenues from Mobile, still sustained by Data.
At the end of 2019, earnings from operations before depreciation and amortization (EBITDA)
amounted to MAD 12,294 million, up 7.3% (+5.3% on a like-for-like basis(1)), thanks to the
improvement of gross margin and the reduction in operational costs. The EBITDA margin was
thus unchanged at the high rate of 56.7%, up 2.1 pt on a like-for-like basis(1).
The adjusted earnings from operations (EBITA)(5) reached MAD 8,294 million, up 8.8%
(+8.5% on a like-for-like basis(1)) thanks to the increase in EBITDA. The adjusted EBITA margin
was 38.2%, up 2.5 pt on a like-for-like basis(1).
Adjusted Cash Fows From Operations (CFFO)(6) in Morocco were up 22.7% (on a like-for-like
basis(1)), to MAD 9,425 million, in connection with the increase in EBITDA and optimal
management of working capital requirements.

6
Mobile
Unit 2018 2019 Change
Customer base(8) (000) 19,062 20,054 +5.2%
Prepaid (000) 17,068 17,752 +4.0%
Postpaid (000) 1,993 2,302 +15.5%
Of which 3G/4G+ Internet(9) (000) 10,828 11,789 +8.9%
ARPU(10) (MAD/month) 58.6 58.3 -0.5%
By the end of 2019, the Mobile customer base(8) totaled 20.1 million customers, up 5.2% year-
on-year, thanks to combined increases of postpaid and prepaid by 15.5% and 4.0% respectively.
Revenues from Mobile amounted to MAD 14,276 million up 2.2%, driven by the growth in Mobile
Data, the traffic of which continues to increase significantly (+36% in 2019).
In 2019, blended ARPU(10) amounted to MAD 58.3, down slightly by 0.5% year-on-year.
7
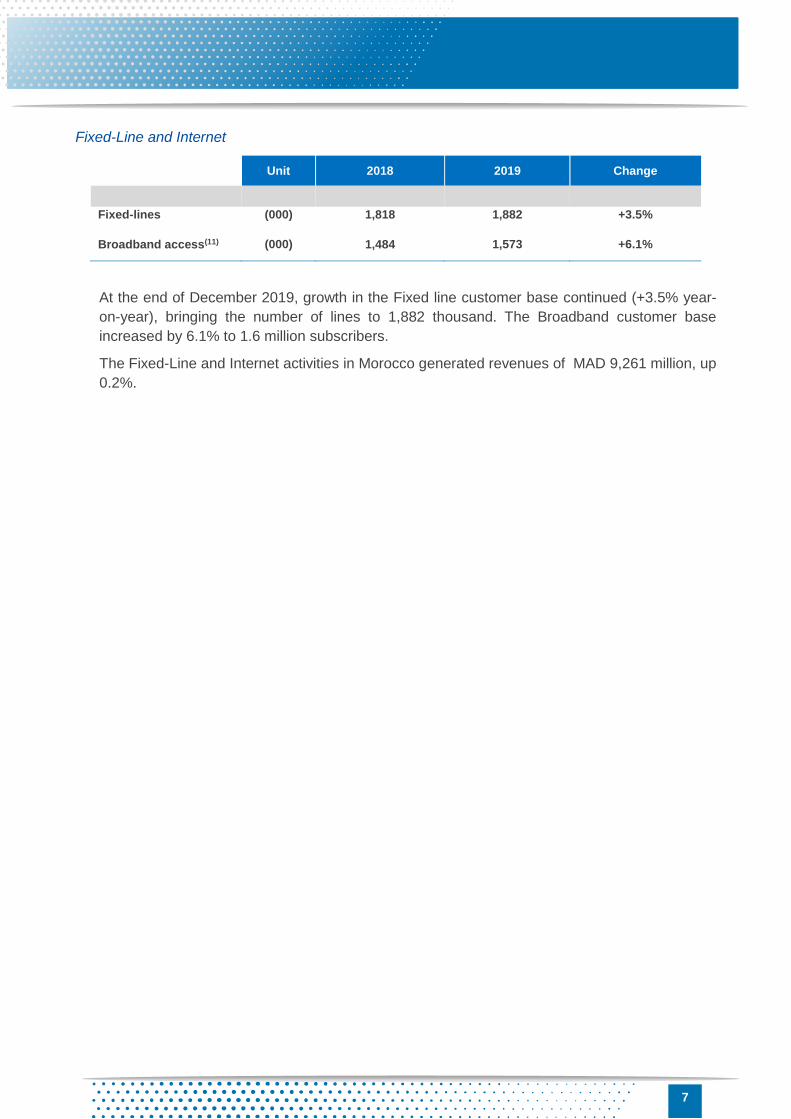
Fixed-Line and Internet
Unit 2018 2019 Change
Fixed-lines (000) 1,818 1,882 +3.5%
Broadband access(11) (000) 1,484 1,573 +6.1%
At the end of December 2019, growth in the Fixed line customer base continued (+3.5% year-
on-year), bringing the number of lines to 1,882 thousand. The Broadband customer base
increased by 6.1% to 1.6 million subscribers.
The Fixed-Line and Internet activities in Morocco generated revenues of MAD 9,261 million, up
0.2%.
8
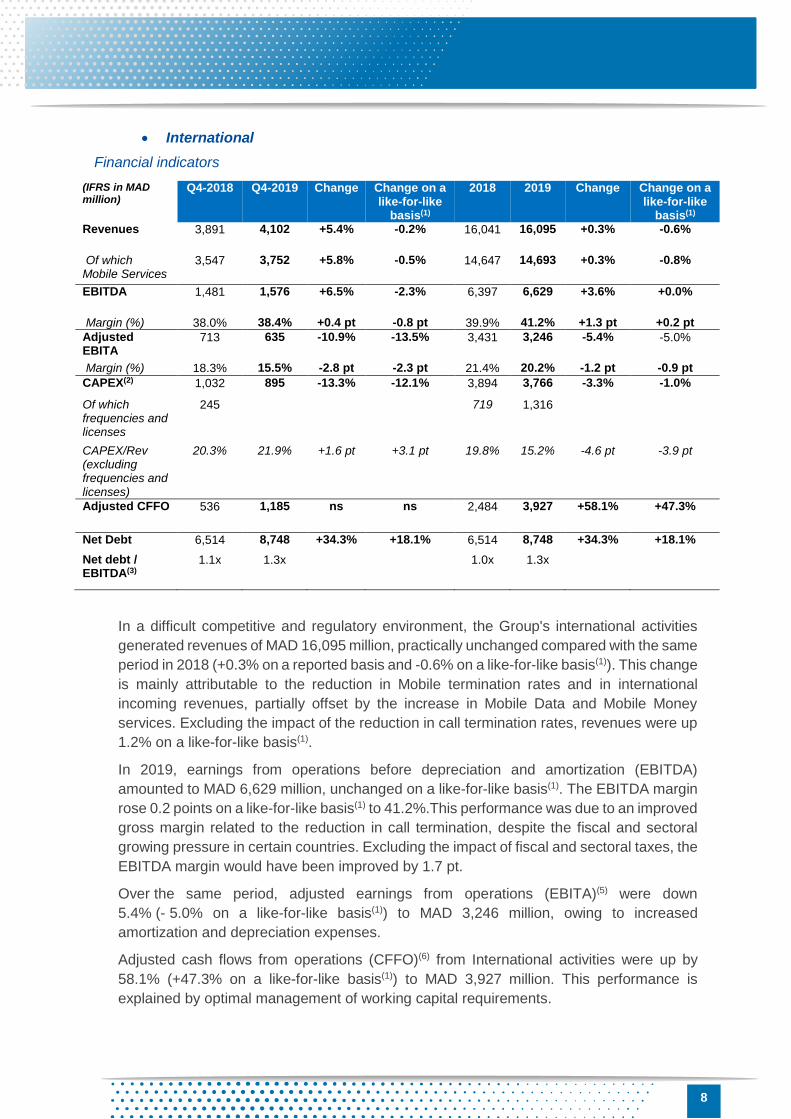
International
Financial indicators
(IFRS in MAD million)
Q4-2018 Q4-2019 Change Change on a like-for-like
basis(1)
2018 2019 Change Change on a like-for-like
basis(1) Revenues 3,891 4,102 +5.4% -0.2% 16,041 16,095 +0.3% -0.6%
Of which Mobile Services
3,547 3,752 +5.8% -0.5% 14,647 14,693 +0.3% -0.8%
EBITDA 1,481 1,576 +6.5% -2.3% 6,397 6,629 +3.6% +0.0%
Margin (%) 38.0% 38.4% +0.4 pt -0.8 pt 39.9% 41.2% +1.3 pt +0.2 pt
Adjusted EBITA
713 635 -10.9% -13.5% 3,431 3,246 -5.4% -5.0%
Margin (%) 18.3% 15.5% -2.8 pt -2.3 pt 21.4% 20.2% -1.2 pt -0.9 pt
CAPEX(2) 1,032 895 -13.3% -12.1% 3,894 3,766 -3.3% -1.0%
Of which frequencies and licenses
245 719 1,316
CAPEX/Rev (excluding frequencies and licenses)
20.3% 21.9% +1.6 pt +3.1 pt 19.8% 15.2% -4.6 pt -3.9 pt
Adjusted CFFO 536 1,185 ns ns 2,484 3,927 +58.1% +47.3%
Net Debt 6,514 8,748 +34.3% +18.1% 6,514 8,748 +34.3% +18.1%
Net debt / EBITDA(3)
1.1x 1.3x 1.0x 1.3x
In a difficult competitive and regulatory environment, the Group's international activities
generated revenues of MAD 16,095 million, practically unchanged compared with the same
period in 2018 (+0.3% on a reported basis and -0.6% on a like-for-like basis(1)). This change
is mainly attributable to the reduction in Mobile termination rates and in international
incoming revenues, partially offset by the increase in Mobile Data and Mobile Money
services. Excluding the impact of the reduction in call termination rates, revenues were up
1.2% on a like-for-like basis(1).
In 2019, earnings from operations before depreciation and amortization (EBITDA)
amounted to MAD 6,629 million, unchanged on a like-for-like basis(1). The EBITDA margin
rose 0.2 points on a like-for-like basis(1) to 41.2%.This performance was due to an improved
gross margin related to the reduction in call termination, despite the fiscal and sectoral
growing pressure in certain countries. Excluding the impact of fiscal and sectoral taxes, the
EBITDA margin would have been improved by 1.7 pt.
Over the same period, adjusted earnings from operations (EBITA)(5) were down
5.4% (- 5.0% on a like-for-like basis(1)) to MAD 3,246 million, owing to increased
amortization and depreciation expenses.
Adjusted cash flows from operations (CFFO)(6) from International activities were up by
58.1% (+47.3% on a like-for-like basis(1)) to MAD 3,927 million. This performance is
explained by optimal management of working capital requirements.
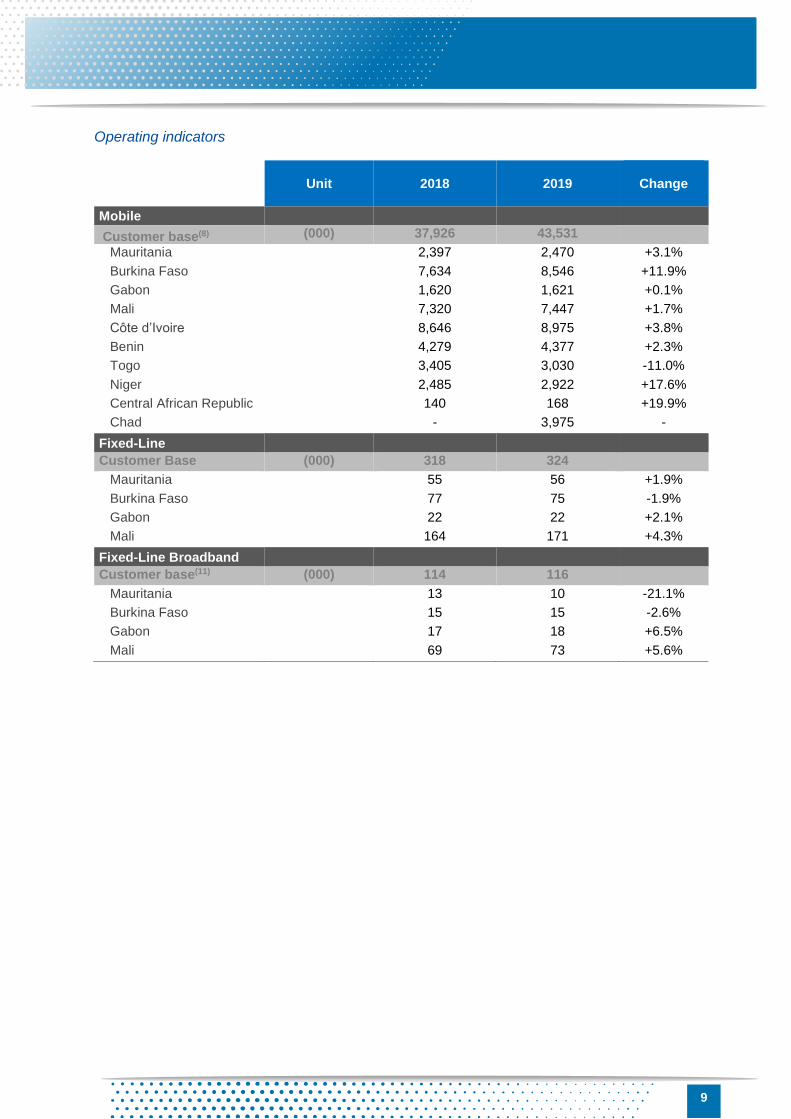
9
Operating indicators
Unit 2018 2019
Change
Mobile
Customer base(8) (000) 37,926 43,531 Mauritania 2,397 2,470 +3.1%
Burkina Faso 7,634 8,546 +11.9%
Gabon 1,620 1,621 +0.1%
Mali 7,320 7,447 +1.7%
Côte d’Ivoire 8,646 8,975 +3.8%
Benin 4,279 4,377 +2.3%
Togo 3,405 3,030 -11.0%
Niger 2,485 2,922 +17.6%
Central African Republic 140 168 +19.9%
Chad - 3,975 -
Fixed-Line
Customer Base (000) 318 324
Mauritania 55 56 +1.9%
Burkina Faso 77 75 -1.9%
Gabon 22 22 +2.1%
Mali 164 171 +4.3%
Fixed-Line Broadband
Customer base(11) (000) 114 116
Mauritania 13 10 -21.1%
Burkina Faso 15 15 -2.6%
Gabon 17 18 +6.5%
Mali 69 73 +5.6%

10
Notes:
(1) "Like-for-like" refers to the effects of consolidating Tigo Chad as if it had taken place on July 1, 2018, an unchanged MAD/Ouguiya/CFA franc exchange rate and the neutralization of the impact of the application of IFRS 16 on EBITDA, adjusted EBITA, Group share of adjusted Net Income, adjusted CFFO and Net debt. (2) CAPEX corresponds to purchases of tangible and intangible assets recognized for the period. (3) The ratio Net Debt/EBITDA excludes the impact of IFRS 16. (4) Maroc Telecom consolidates the following companies in its financial statements: Mauritel, Onatel, Gabon Telecom, Sotelma, Casanet, AT Côte d’Ivoire, Etisalat Bénin, AT Togo, AT Niger, AT Centrafrique, and Tigo Chad since July 1, 2019. (5) EBITA corresponds to EBIT before the amortization of intangible assets acquired through business combinations, write-downs of goodwill and other intangible assets acquired through business combinations, and other income and expenses relating to financial investment transactions and transactions with shareholders (except when recognized directly in equity). (6) CFFO includes net cash flow from operations before tax, as set out in the cash flow statement, as well as the dividends received from companies accounted for by the equity method and non-consolidated equity investments. CFFO also includes net capital expenditure, which corresponds to net uses of cash for acquisitions and disposals of tangible and intangible assets. (7) Loans and other current and non-current liabilities less cash and cash equivalents, including cash held in escrow for bank loans. (8) The active customer base consists of prepaid customers who have made or received a voice call (excluding ERPT or Call-Center calls) or received an SMS/MMS or used Data services (excluding ERPT services) during the past three months, and postpaid customers who have not terminated their agreements. (9) The active customer base for 3G and 4G+ Mobile Internet includes holders of a postpaid subscription agreement (with or without a voice offer) and holders of a prepaid Internet subscription agreement who have made at least one top-up during the past three months or whose top-up is still valid and who have used the service during that period. (10) ARPU is defined as revenues (generated by inbound and outbound calls and by data services) net of promotional offers, excluding roaming and equipment sales, divided by the average customer base for the period. In this instance, blended ARPU covers both the prepaid and postpaid segments. (11) The broadband customer base includes ADSL access, FTTH and leased lines as well as the CDMA customer base in Mauritania, Burkina Faso and Mali. Important notice: Forward-looking statements. This press release contains forward-looking statements regarding Maroc Telecom’s financial position, income
from operations, strategy, and outlook, as well as the impact of certain transactions. Although Maroc Telecom believes that these forward-
looking statements are based on reasonable assumptions, they do not amount to guarantees for the company’s future performance. The
actual results may be very different from the forward-looking statements, due to a number of risks and uncertainties, both known and
unknown. The majority of these risks are beyond our control, namely the risks described in the public documents filed by Maroc Telecom
with the Moroccan Capital Markets Authority (www.ammc.ma) and the French Financial Markets Authority (www.amf-france.org), which
are also available in French on our website (www.iam.ma). This press release contains forward-looking information that can only be
assessed at its publication date. Maroc Telecom does not undertake to supplement, update, or alter these forward-looking statements as
a result of new information, future events, or for any other reason, subject to the applicable regulations, and especially to Articles III.2.31
et seq. of the circular issued by the Moroccan Capital Markets Authority and to Articles 223-1 et seq. of the French Financial Markets
Authority’s General Regulations.
Maroc Telecom is a full-service telecommunications operator in Morocco and the leader in all of its Fixed-Line, Mobile and
Internet business sectors. It has expanded internationally, and currently operates in 11 African countries. Maroc Telecom is
listed on both the Casablanca and Paris Stock Exchanges, and its majority shareholders are Société de Participation dans les
Télécommunications (SPT*) (53%), and the Kingdom of Morocco (22%).
* SPT is a company incorporated under Moroccan law and controlled by Etisalat.
Contacts
Investor Relations
Press Relations
11
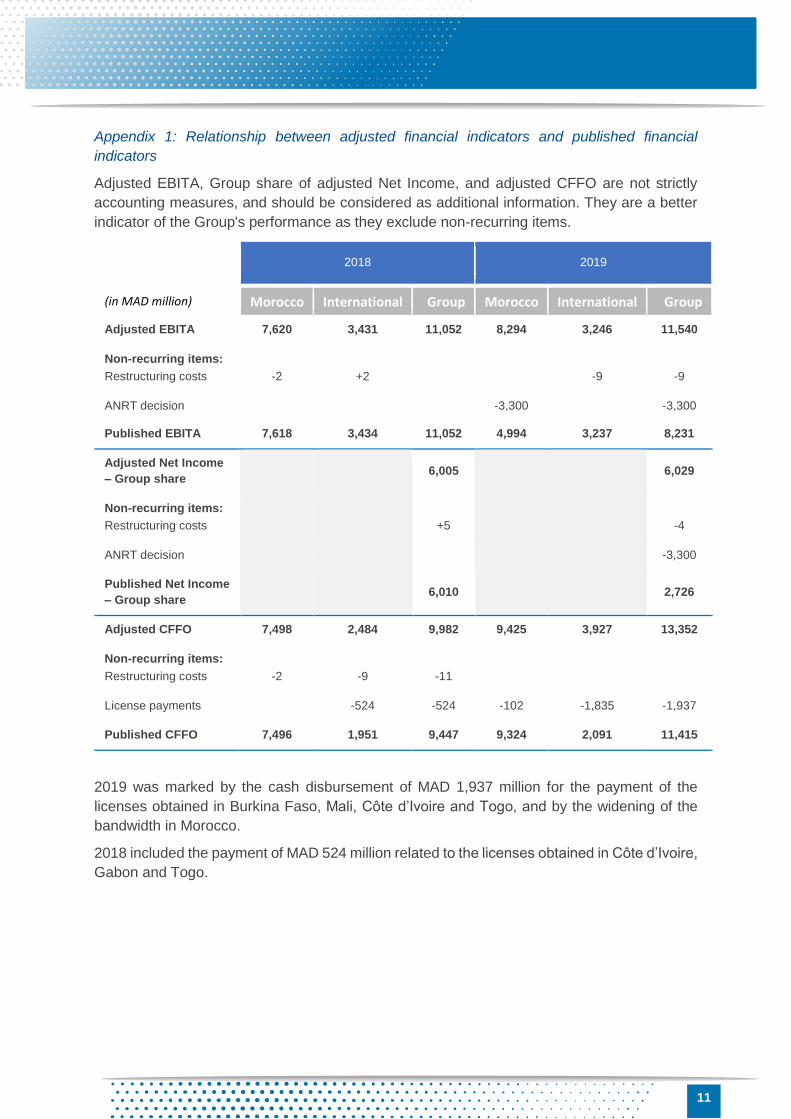
Appendix 1: Relationship between adjusted financial indicators and published financial
indicators
Adjusted EBITA, Group share of adjusted Net Income, and adjusted CFFO are not strictly
accounting measures, and should be considered as additional information. They are a better
indicator of the Group's performance as they exclude non-recurring items.
2018 2019
(in MAD million) Morocco International Group Morocco International Group
Adjusted EBITA 7,620 3,431 11,052 8,294 3,246 11,540
Non-recurring items:
Restructuring costs -2 +2 -9 -9
ANRT decision -3,300 -3,300
Published EBITA 7,618 3,434 11,052 4,994 3,237 8,231
Adjusted Net Income
– Group share 6,005 6,029
Non-recurring items:
Restructuring costs +5 -4
ANRT decision -3,300
Published Net Income
– Group share 6,010 2,726
Adjusted CFFO 7,498 2,484 9,982 9,425 3,927 13,352
Non-recurring items:
Restructuring costs -2 -9 -11
License payments -524 -524 -102 -1,835 -1,937
Published CFFO 7,496 1,951 9,447 9,324 2,091 11,415
2019 was marked by the cash disbursement of MAD 1,937 million for the payment of the
licenses obtained in Burkina Faso, Mali, Côte d’Ivoire and Togo, and by the widening of the
bandwidth in Morocco.
2018 included the payment of MAD 524 million related to the licenses obtained in Côte d’Ivoire,
Gabon and Togo.
12
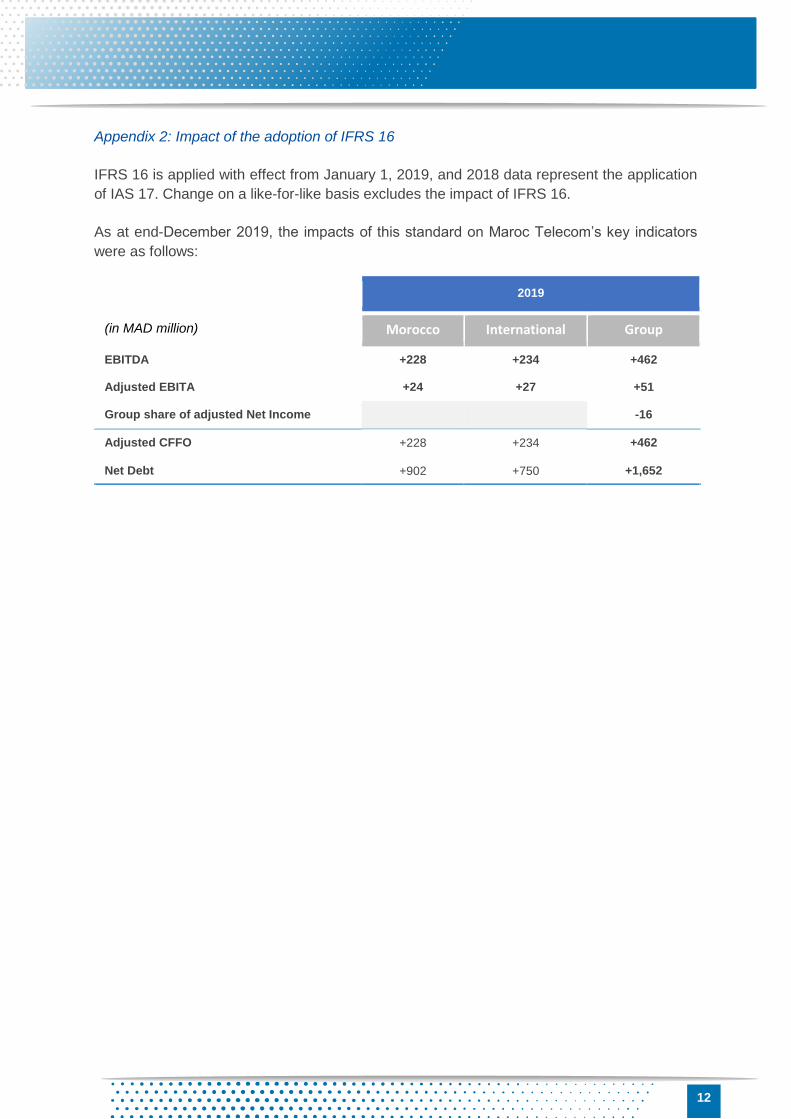
Appendix 2: Impact of the adoption of IFRS 16
IFRS 16 is applied with effect from January 1, 2019, and 2018 data represent the application
of IAS 17. Change on a like-for-like basis excludes the impact of IFRS 16.
As at end-December 2019, the impacts of this standard on Maroc Telecom’s key indicators
were as follows:
2019
(in MAD million) Morocco International Group
EBITDA +228 +234 +462
Adjusted EBITA +24 +27 +51
Group share of adjusted Net Income -16
Adjusted CFFO +228 +234 +462
Net Debt +902 +750 +1,652
13
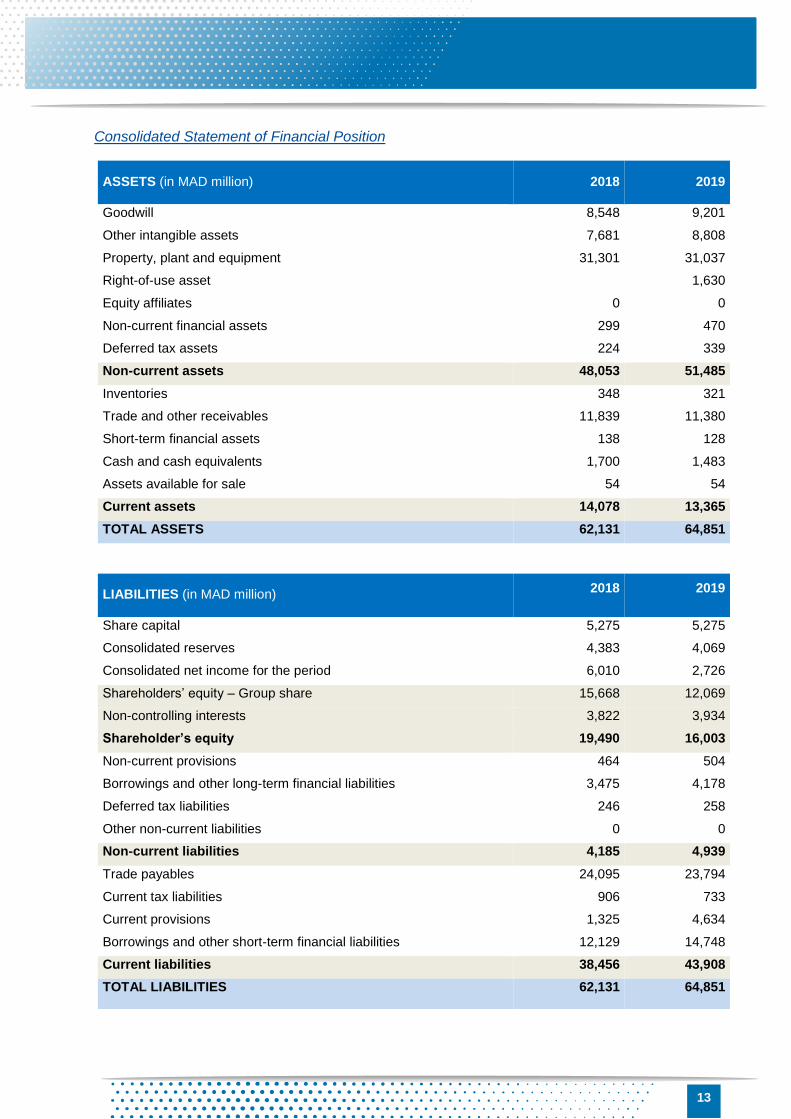
Consolidated Statement of Financial Position
ASSETS (in MAD million) 2018 2019
Goodwill 8,548 9,201
Other intangible assets 7,681 8,808
Property, plant and equipment 31,301 31,037
Right-of-use asset 1,630
Equity affiliates 0 0
Non-current financial assets 299 470
Deferred tax assets 224 339
Non-current assets 48,053 51,485
Inventories 348 321
Trade and other receivables 11,839 11,380
Short-term financial assets 138 128
Cash and cash equivalents 1,700 1,483
Assets available for sale 54 54
Current assets 14,078 13,365
TOTAL ASSETS 62,131 64,851
LIABILITIES (in MAD million) 2018 2019
Share capital 5,275 5,275
Consolidated reserves 4,383 4,069
Consolidated net income for the period 6,010 2,726
Shareholders’ equity – Group share 15,668 12,069
Non-controlling interests 3,822 3,934
Shareholder’s equity 19,490 16,003
Non-current provisions 464 504
Borrowings and other long-term financial liabilities 3,475 4,178
Deferred tax liabilities 246 258
Other non-current liabilities 0 0
Non-current liabilities 4,185 4,939
Trade payables 24,095 23,794
Current tax liabilities 906 733
Current provisions 1,325 4,634
Borrowings and other short-term financial liabilities 12,129 14,748
Current liabilities 38,456 43,908
TOTAL LIABILITIES 62,131 64,851
14
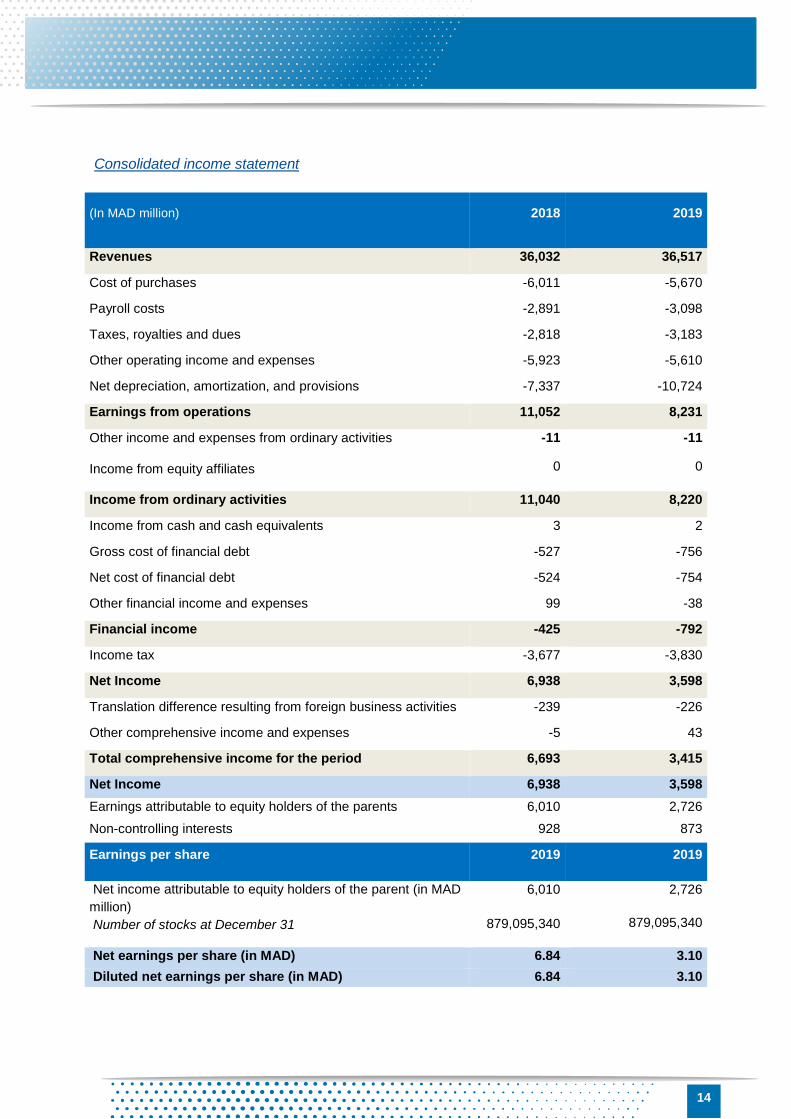
Consolidated income statement
(In MAD million) 2018 2019
Revenues 36,032 36,517
Cost of purchases -6,011 -5,670
Payroll costs -2,891 -3,098
Taxes, royalties and dues -2,818 -3,183
Other operating income and expenses -5,923 -5,610
Net depreciation, amortization, and provisions -7,337
-10,724
Earnings from operations 11,052 8,231
Other income and expenses from ordinary activities -11 -11
Income from equity affiliates 0 0
Income from ordinary activities 11,040 8,220
Income from cash and cash equivalents 3 2
Gross cost of financial debt -527 -756
Net cost of financial debt -524 -754
Other financial income and expenses 99 -38
Financial income -425 -792
Income tax -3,677
-3,830
Net Income 6,938 3,598
Translation difference resulting from foreign business activities -239 -226
Other comprehensive income and expenses -5 43
Total comprehensive income for the period 6,693 3,415
Net Income 6,938 3,598
Earnings attributable to equity holders of the parents 6,010 2,726
Non-controlling interests 928 873
Earnings per share 2019 2019
Net income attributable to equity holders of the parent (in MAD
million)
6,010
2,726
Number of stocks at December 31 879,095,340 879,095,340
Net earnings per share (in MAD) 6.84 3.10
Diluted net earnings per share (in MAD) 6.84 3.10

15
Consolidated cash flow statement
(In MAD million) 2018 2019
Earnings from operations 11,052 8,231
Depreciation, amortization, and other restatements 7,318 10,721
Gross cash flow from operating activities 18,370
18,952
Other changes in net working capital requirement -883
419
Net cash flow from operating activities before tax 17,487
19,372
Income tax paid -2,967
-4,091
Net cash flow from operating activities (a) 14,520
15,281
Purchases of property, plant and equipment and intangible assets -8,075 -7,949
Purchases of consolidated investments after acquired cash -469 -1,096
Increase in financial assets -194 -73
Disposals of property, plant and equipment and intangible assets 31 6
Decrease in financial assets 335 287
Dividends received from non-consolidated equity investments 2 6
Net cash flow used in investing activities (b) -8,369
-8,819
Capital increase 0 0
Dividends paid to shareholders -5,732 -6,003
Dividends paid by subsidiaries to their non-controlling shareholders -798 -838
Changes in equity capital -6,529
-6,841
Proceeds from borrowings and increase in other long-term financial liabilities 1,347
2,270
Proceeds from borrowings and increase in other short-term financial liabilities 1,933 2,860
Payments on borrowings and decrease in other short-term financial liabilities -2,682
-4,548
Net interest paid -575 -473
Other cash items relating to financing activities 6 -13
Change in borrowings and other financial liabilities 29
96
Net cash flow used in financing activities (d) -6,501
-6,744
Translation adjustments and other non-cash items (g) 40
65
Total cash flows (a)+(b)+(d)+(g) -310
-217
Cash and cash equivalents at beginning of period 2,010
1,700
Cash and cash equivalents at end of period 1,700
1,483


![[Chap 14] Injunctions in English Law](https://img.pdfslide.us/doc/110x75/577c80491a28abe054a808b8/chap-14-injunctions-in-english-law.jpg)