Embed Size (px)
Citation preview
Conservation Success Index: North Platte Wild Trout
Rev. 1.0 - 5/2009
SPECIES SUMMARY
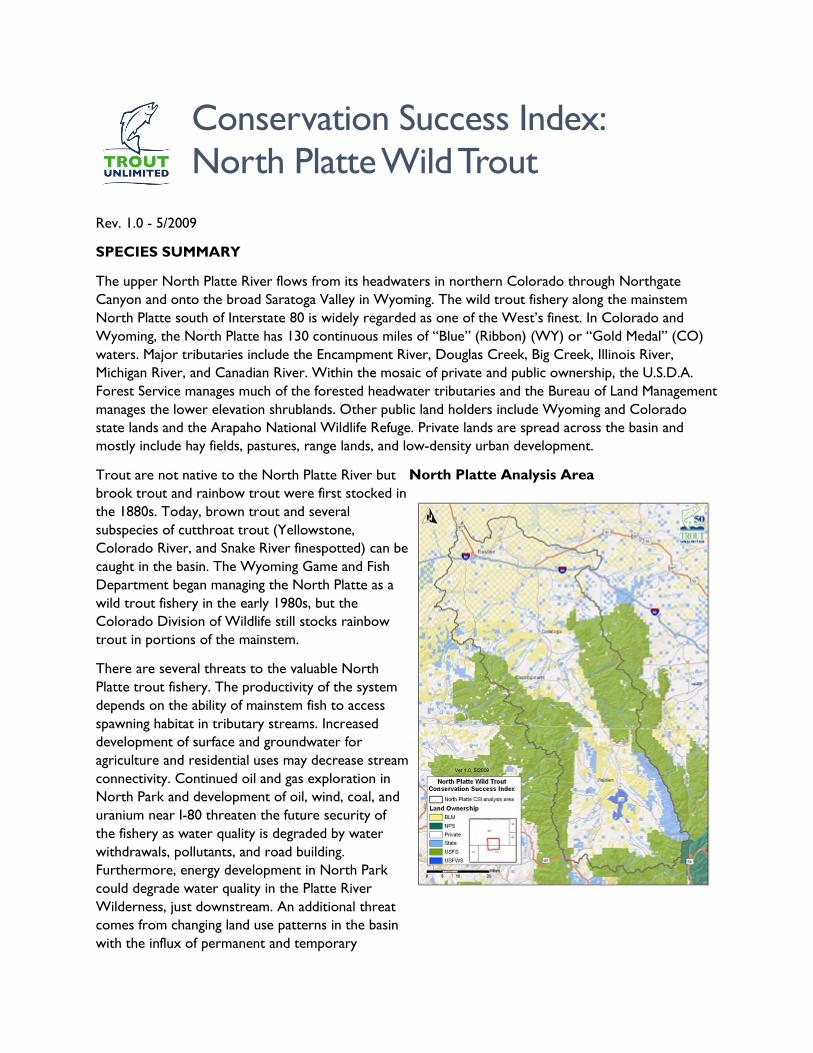
The upper North Platte River flows from its headwaters in northern Colorado through Northgate Canyon and onto the broad Saratoga Valley in Wyoming. The wild trout fishery along the mainstem North Platte south of Interstate 80 is widely regarded as one of the West’s finest. In Colorado and Wyoming, the North Platte has 130 continuous miles of “Blue” (Ribbon) (WY) or “Gold Medal” (CO) waters. Major tributaries include the Encampment River, Douglas Creek, Big Creek, Illinois River, Michigan River, and Canadian River. Within the mosaic of private and public ownership, the U.S.D.A. Forest Service manages much of the forested headwater tributaries and the Bureau of Land Management manages the lower elevation shrublands. Other public land holders include Wyoming and Colorado state lands and the Arapaho National Wildlife Refuge. Private lands are spread across the basin and mostly include hay fields, pastures, range lands, and low-density urban development.
Trout are not native to the North Platte River but brook trout and rainbow trout were first stocked in the 1880s. Today, brown trout and several subspecies of cutthroat trout (Yellowstone, Colorado River, and Snake River finespotted) can be caught in the basin. The Wyoming Game and Fish Department began managing the North Platte as a wild trout fishery in the early 1980s, but the Colorado Division of Wildlife still stocks rainbow trout in portions of the mainstem.
There are several threats to the valuable North Platte trout fishery. The productivity of the system depends on the ability of mainstem fish to access spawning habitat in tributary streams. Increased development of surface and groundwater for agriculture and residential uses may decrease stream connectivity. Continued oil and gas exploration in North Park and development of oil, wind, coal, and uranium near I-80 threaten the future security of the fishery as water quality is degraded by water withdrawals, pollutants, and road building. Furthermore, energy development in North Park could degrade water quality in the Platte River Wilderness, just downstream. An additional threat comes from changing land use patterns in the basin with the influx of permanent and temporary
North Platte Analysis Area
workers for the energy boom and continued second home development. A more acute threat is the ongoing mountain pine beetle outbreak that is causing extensive mortality of lodgepole pine, Engelmann spruce, and subalpine fir throughout the Colorado and Wyoming Rockies. This outbreak appears linked to prolonged drought caused by a changing climate and both past and present management decisions related to timber harvest. Large, homogenous stands of beetle-killed trees increase wildfire risk. Beyond fire risks, the outbreak may also alter hydrology, decrease stream shading, influence large wood inputs, and increase salvage logging activity – all of which can adversely impact wild trout habitat.
Our CSI for wild trout focuses on riverine trout populations and perennial streams in the North Platte Basin. This subbasin-scale CSI incorporates information not considered in the typical CSI, including:
• Trans-basin water diversions, reflected in the water quantity indicator at the subbasin scale;
• Conservation easements from the Wyoming Game and Fish Department, Wyoming Stock Grower’s Agricultural Land Trust, The Nature Conservancy, the Colorado Cattlemen’s Agricultural Land Trust, and the Legacy Land Trust, reflected in the land conversion indicator;
• Mountain pine beetle outbreak areas, included as a new Future Security indicator

The North Platte River. Photo: Amy Haak
Fish data were provided by Wyoming Game and Fish Department and Colorado Division of Wildlife. Because of the limited spatial extent of trout data for Colorado, population integrity findings in Colorado are based primarily on expert opinion. Potential fish migration barrier and general habitat information was provided by Jeff Streeter and the U.S.D.A. Forest Service Medicine Bow National Forest. We are grateful for their contributions to our understanding of wild trout in the North Platte River Basin. A complete list of data sources is provided separately.
Key CSI Findings
• Wild trout population integrity is high throughout the basin except in the tributaries in the northern portion (Sage Creek and downstream)
• Whirling disease has been prevalent in southeastern Wyoming since 1988 but has yet to affect the North Platte trout fishery
• Nearly 2,000 trout per mile have been recorded in the North Platte River, with the entire mainstem from Colorado to Saratoga, Wyoming, having Blue Ribbon or Gold Medal designation
• Although trout densities are high in the mainstem, there appears to be limited reproduction downstream of Sage Creek, Wyoming
• Wyoming Game and Fish Department manages the North Platte as a wild fishery, but Colorado Division of Wildlife stocks diploid rainbow trout near Delaney Buttes

• The lowest habitat integrity scores reflect decreased habitat connectivity and flow alteration associated with dams, diversions, and irrigation
• The lowest water quality scores reflect oil and gas development, high road densities, and extensive agricultural land use.
• Two streams are 303(d) listed: Sage Creek because of habitat degradation and Hot Slough Creek because of residual chlorine, ammonia, and fecal coliform from Saratoga’s waste water treatment plant.
• Resource extraction related to oil and gas, wind, coal, and uranium reserves constitutes the primary threat to future security of wild trout in most subwatersheds.
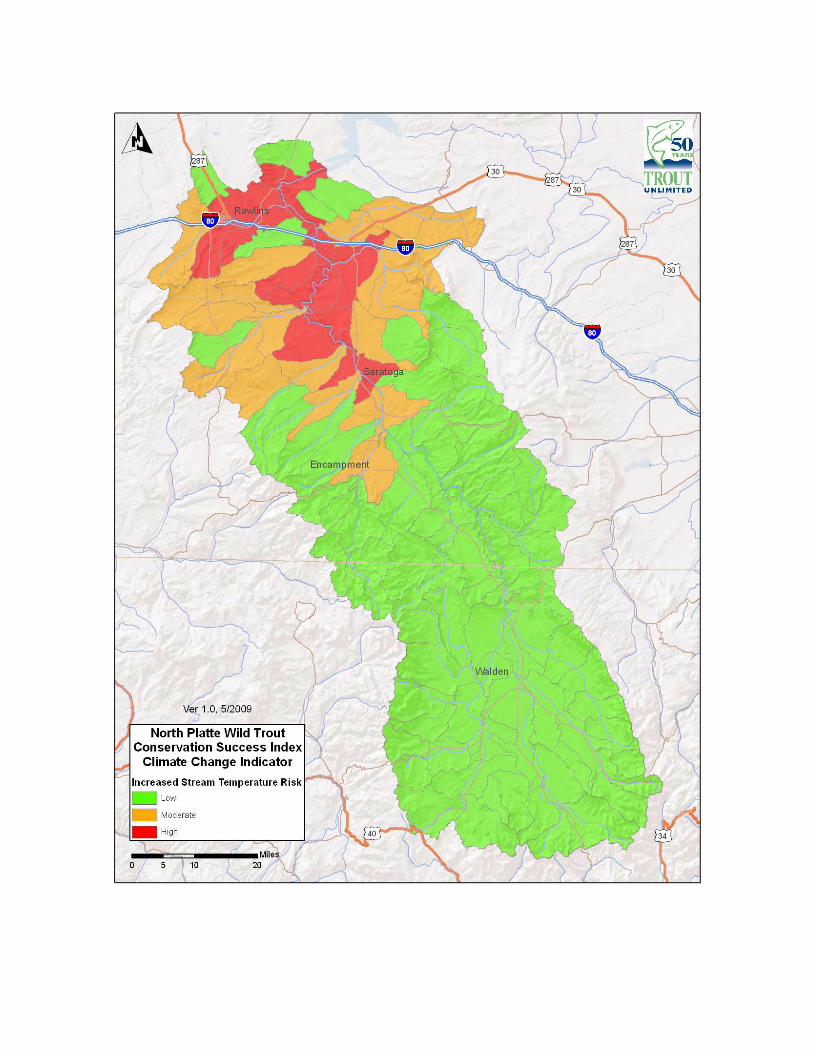
• Under a climate change scenario, the North Platte Basin is at low risk to flooding associated with rain-on-snow events but is at moderate risk to altered fire regimes and increasing stream temperatures and high risk to drought
• Dead and dying trees from the mountain pine beetle outbreak are the primary land cover in 10% of subwatersheds in the North Platte Basin, a major source of uncertainty affecting future security
Population integrity of wild trout is high throughout the North Platte River Basin except for tributary watersheds between Sage Creek and Seminoe Reservoir that lack suitable trout habitat. Trout densities in the North Platte River mainstem and lower Encampment River have been reported to be nearly 2,000 per mile. For this reason, the mainstem North Platte upstream from Sage Creek near Saratoga, Wyoming, through the Routt National Forest in Colorado has been designated as a “Blue” (Ribbon) or “Gold Medal” stream by Wyoming Game and Fish Department and Colorado Division of Wildlife, respectively. The ratio of fish from 1 to 6 inches to fish larger than 6 inches suggests that the lower mainstem below Saratoga, Wyoming, may have limited natural reproduction. Whirling disease was first documented in southeastern Wyoming in 1988, and the disease has been found in fish in the North Platte River and several tributaries; however, the disease has yet to have population-level effects in the basin. Although the Wyoming Game and Fish Department manages the North Platte as a wild fishery, the Colorado Division of Wildlife stocks diploid rainbow trout near Delaney Buttes.
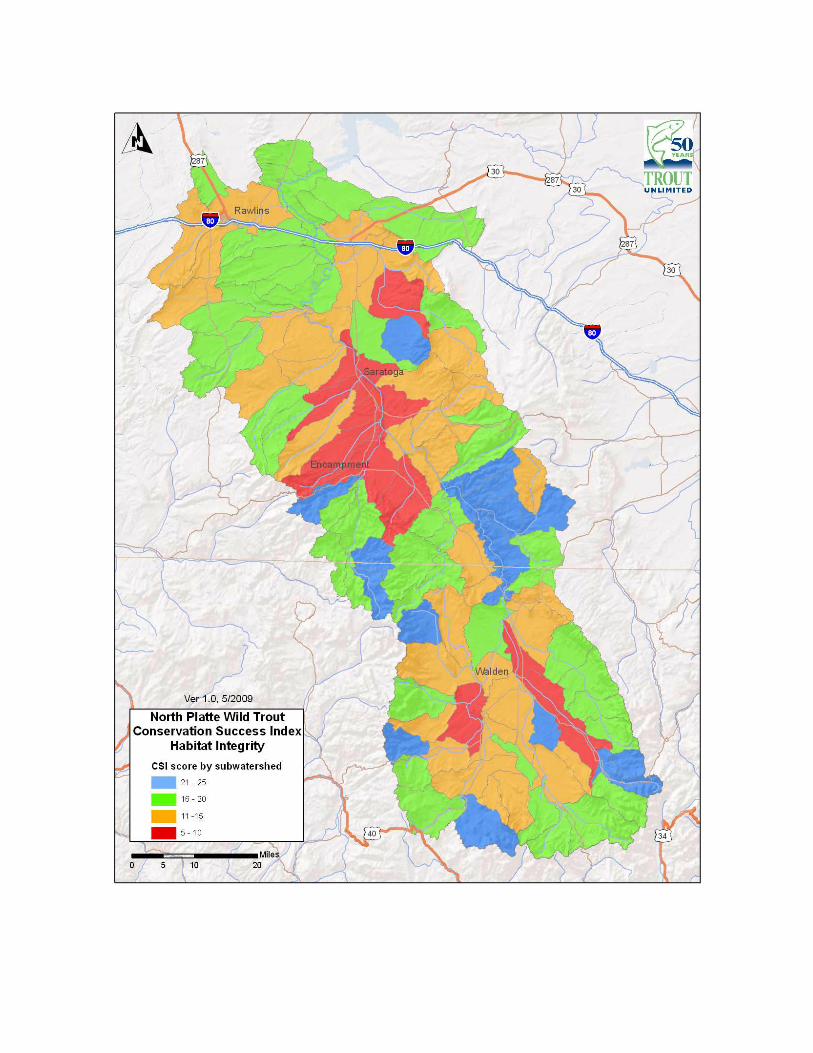
Habitat Integrity in the North Platte Basin ranges from degraded to pristine. Forested, headwater subwatersheds generally have high habitat integrity, while developed subwatersheds near Walden, Colorado, and along the North Platte mainstem near Saratoga, Wyoming, have low habitat integrity. Most watersheds score low for land stewardship with the exception of protected wilderness areas in the Medicine Bow and Routt National Forests in higher elevation watersheds, reflecting the lack of formal habitat protection in the basin. Watershed connectivity is generally high, but it is lowest in developed subwatersheds where water is diverted for agricultural and municipal use. Connectivity is also reduced by additional dams and diversions in headwater streams to store and move water. Flow regimes are altered by trans-basin water projects for the City of Cheyenne in Douglas Creek and Hog Park Creek. Extensive canal networks in flat, developed subwatersheds alter water quantity.
High road densities and agricultural lands contribute to lower watershed conditions scores around Saratoga and Encampment, Wyoming. Overall water quality is high, except in energy development areas along the I-80 corridor and in North Park, and along 303(d)-identified degraded stream reaches along Sage Creek and in Saratoga. The CSI lacks a specific indicator for addressing some fine-scale stressors to
the North Platte Basin, for example, cattle grazing. As a result, some habitat integrity scores may not reflect local instream habitat conditions.
Most subwatersheds have moderate scores for Future Security. Land conversion risk is moderate across the basin because undeveloped lands exist close to roads and existing urban areas. These remaining areas could experience intense development pressure from the influx of energy industry workers and continued second home development. A small portion of private lands is encumbered by conservation easements. Mining claims and energy development areas (including oil, gas and wind leases and coal and uranium reserves) are spread across the entire basin, from ridgetops to valley bottoms; most North Platte subwatersheds had low future security because of potential resource extraction. Six sites have been identified in the North Platte for future dam development. These areas, along the Michigan River in Colorado, along the mainstem North Platte in Wyoming, and on Jack Creek west of Saratoga, may become more attractive depending on climate change scenarios and future impacts to water availability, especially for existing water uses.
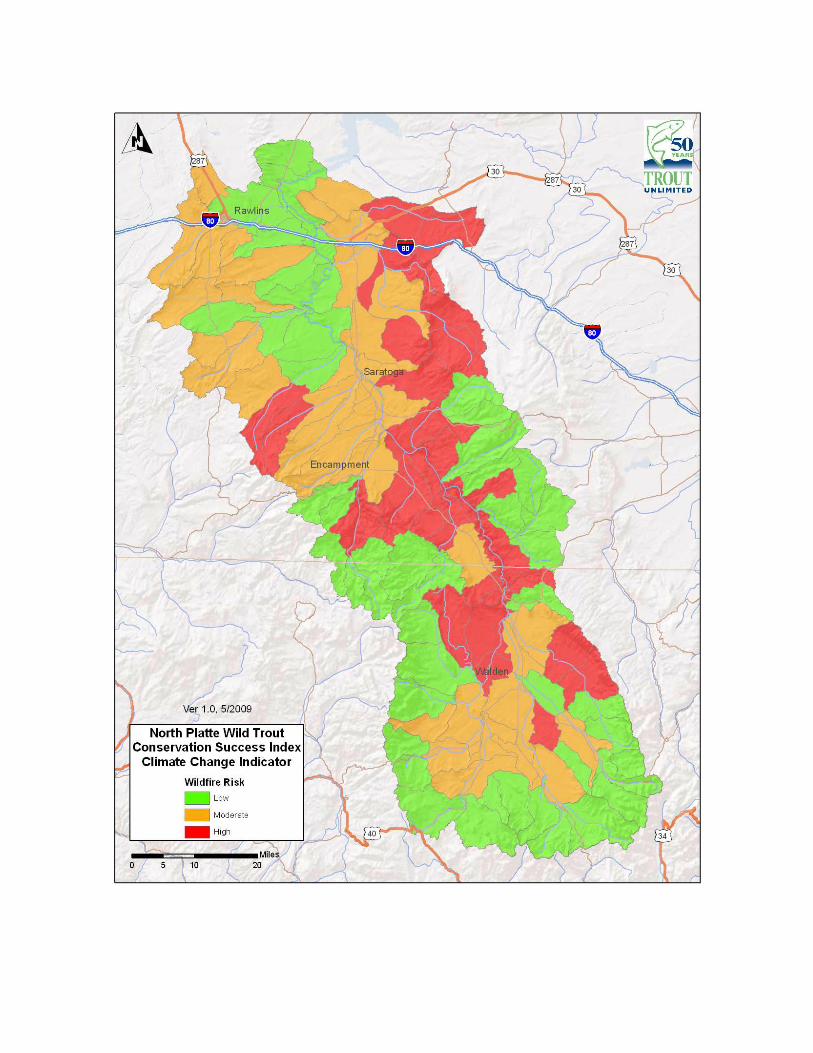
Forested subwatersheds scored low for future security due to the mountain pine beetle outbreak. Dead and dying lodgepole pine, Engelmann spruce, and subalpine fir are prevalent across the basin; up to 72% of the land cover in forested subwatersheds consists of dead trees. If a fire start occurs during hot summer conditions, it could quickly spread into a large, high-intensity wildfire. Such fires typically cause higher erosion rates as soils are exposed, which may lead to higher stream sedimentation rates at least during the immediate period following the fire. High intensity wildfire in the basin may be unavoidable given the large extent of dead and dying trees. Roads located along riparian areas as well as culverts (stream/road crossings) within the zone of mountain pine beetle outbreak may exacerbate stream hazards when high intensity wildfires occur. Immediate action may be needed to identify and fix stream crossings and culverts that would have a high probability of failure during debris and sediment flows following a wildfire.
Considering a 3°C increase due to climate change, the North Platte subbasin is not at risk to increased winter flooding because of more rain-on-snow events. However, warmer spring temperatures in mid-elevation watersheds are predicted to reduce moisture and alter fire regimes, and wild trout are at moderate risk to increased instream summer water temperatures. Drought severity models identify the lower elevation subwatersheds in the basin as at high risk to lower stream flows through water-loss associated with higher temperatures.
The CSI suggests that restoration efforts are especially appropriate on the lower Encampment because of the high habitat integrity and future security of the headwaters. Reconnecting the Encampment River to the mainstem North Platte will allow fluvial fish to reach important spawning reaches and increase natural reproduction. Because of its high habitat integrity and future security, Douglas Creek appears to be a good place to focus protection efforts.
Trout Unlimited strongly supports current efforts by Wyoming Game and Fish Department and Colorado Division of Wildlife to manage the North Platte River and its tributaries primarily as a wild trout fishery. The CSI analyses emphasize the importance of maintaining large interconnected habitats; such priorities will increase the resistance of existing populations to both natural and anthropogenic disturbances. Ongoing habitat restoration on impaired reaches will also improve trout habitat. Protection efforts should be targeted at areas prone to energy and ex-urban development, especially when they occur near habitats important to wild trout populations. Strategic conservation actions will keep the North Platte wild trout fishery one of the best in the West.

Prepared by Kurt Fesenmyer and Dan Dauwalter, TU, 2/3/2009
Table 1. CSI scoring result summary for North Platte Wild Trout
Number of Subwatersheds Receiving Scores
Total Subwatersheds Scored
CSI Indicator 1 2 3 4 5
Population Integrity
Population Density 15 5 6 48 25 99
Habitat extent 3 1 2 0 93 99
Management emphasis 0 0 2 0 97 99
Disease vulnerability 0 0 75 24 0 99
Population size structure 22 0 16 0 61 99
Habitat Integrity
Land Stewardship 66 8 3 3 25 105
Watershed connectivity 4 22 17 27 35 105
Watershed conditions 4 11 13 35 42 105
Water quality 1 2 15 42 45 105
Flow regime 28 22 27 27 1 105
Future Security
Land conversion 0 6 39 22 38 105
Resource extraction 8 17 27 25 28 105
Energy development 74 14 17 0 0 105
Climate change 30 37 0 3 35 105
Mountain pine beetle impact 0 6 13 23 63 105


v. 2 May 2009
Conservation Success Index: Wild Trout in the North Platte River basin, Colorado and Wyoming:
Subwatershed Scoring and Rule Set Introduction: The CSI is an aggregate index typically comprised of four different component groups: Range-wide Condition; Population Integrity; Habitat Integrity; and Future Security. However, for non-native wild trout there is no historical range, and, therefore, there is no Range-wide Condition group of indicators in a CSI developed for wild trout. Only Population Integrity, Habitat Integrity, and Future Security groups are used. Each CSI group has five indicators that describe a specific component of each group. Each indicator is scored from 1 to 5 for each subwatershed, with a score of 1 indicating poor condition and a score of 5 indicating good condition. Indicator scores are then added to obtain the subwatershed condition for a Group, and Group scores are added for a CSI score for a subwatershed (Figure 1). CSI scores can then be summarized to obtain the general condition within the current distribution of wild trout.
Figure 1. For a wild trout CSI, each subwatershed is scored from 1 to 5 using 15 indicators within three main groups. Indicator scores are added per group to obtain an overall group score. Group scores are then added to obtain a composite CSI score for each subwatershed. CSI Groups and Indicators

The CSI for wild trout consists of three main groups of indicators:
1. Population integrity 2. Habitat integrity 3. Future security
Below is an overview of each CSI group and the indicators within each group. Each section contains the indicator scoring rules, the rational for the indicator, and the data sources used for the indicator. Population Integrity: Indicators for the integrity of populations. Overview:
1. Population density 2. Habitat extent 3. Management emphasis 4. Disease vulnerability 5. Population size structure
Indicator: 1. Population density. Indicator Scoring:
Fish / mile Trophy-designated
stream miles
CSI Score
0 1 1 – 50 2
51 - 150 1 - 5 3 151 - 400 5 - 10 4
>400 >10 5 Score for highest
Explanation: Population density within each subwatershed. When multiple populations were present within a subwatershed, population density was calculated as the mean density across sample sites. Blue ribbon or gold medal designations are awarded to exceptionally productive streams. Rationale: Small, low density populations are more vulnerable to extirpation1. Data Sources: Densities for brook trout, brown trout, rainbow trout, and cutthroat trout >6 inches were obtained from Wyoming Department of Game and Fish’s fisheries database; abundance of all cutthroat subspecies were combined. The mean density of trout across sites was determined for each subwatershed. Trout densities for subwatersheds not sampled were scored

based on professional judgment using adjacent subwatershed density, location of subwatershed in the basin, and other data from the Wyoming Game and Fish Department fisheries database. Gold Medal designations for Colorado streams were based on Colorado Division of Wildlife designations2, and Blue Ribbon designations were based on Wyoming Game and Fish Department designations (Steve Gale ,Wyoming Game and Fish Department, pers. comm.)3. Indicator: 2 Habitat extent. Indicator Scoring:
Connectivity CSI Score < 6.2 mi (10 km) connected habitat 1
6.2 – 12.4 mi (10-20 km) connected habitat 2 12.4 – 18.6 mi (20-30 km) connected habitat 3 18.6 – 31.1 mi (30-50 km) connected habitat 4
> 31.1 mi (50 km) connected habitat 5 Explanation: Habitat extent is the amount of connected perennial stream habitat available to the population. Rationale: Populations with less available habitat are more vulnerable to extirpation4 as a result of small, localized disturbances. Data Sources: Connectivity was based on the connectedness of perennial streams in the National Hydrography Dataset Plus5. Barriers to fish passage were identified by Jeff Streeter 6, the Medicine Bow National Forest7, and the National Inventory of Dams8. Each continuous section of stream was scored using the ruleset above, and subwatersheds scores were a length weighted average of scores for each connected section in a subwatershed. Indicator: 3. Management emphasis. Indicator Scoring:
Management emphasis in subwatershed CSI Score Hatchery dependent (no natural reproduction) 1
Hatchery supported (some natural reproduction) 2 Wild trout fishery (self-sustaining), diploid stocked 3 Wild trout fishery (self-sustaining), triploid stocked 4
Wild trout fishery (self-sustaining), no stocking 5 Explanation: Management emphasis for wild trout in the subwatershed. Rationale: A wild trout fishery that is self-sustaining through natural reproduction reflects quality trout habitat. Although triploid trout are stocked to provide recreational opportunities for

anglers, there is the potential for stocked fish to compete with wild fish for food and space, reduce growth9, and result in lower fitness10. Wild trout populations sustained by stocking have lower integrity, and populations existing solely as a result of stocking have low integrity. Data Sources: Subwatersheds were scored based on Wyoming Game and Fish Department and Colorado Division of Wildlife stocking records for 2008. Only Colorado Department of Wildlife stocks trout into the North Platte River; they stock diploid rainbow trout at Delaney Buttes (Finger Rock Rearing Unit, Colorado Division of Wildlife, Yampa, Colorado, pers. comm.). Indicator: 4. Disease vulnerability. Indicator Scoring: .
Disease Vulnerability CSI Score 5 (Population is Infected) 1
4 (Significant Disease Risk) 2 3 (Moderate Disease Risk) 3 2 (Minimal Disease Risk) 4 1 (Limited Disease Risk) 5
Explanation: The risk of populations in each subwatershed to disease. Rationale: Non-native pathogens and parasites, including the myxozoan parasite that causes whirling disease, can infect native trout and reduce their populations. Data sources: Whirling disease is present in the North Platte River Basin11 but has not had population-level effects. Trout are more susceptible to whirling disease at warmer water temperatures at lower elevations; Moffitt et al.12 found whirling disease to be prevalent below 7,620 ft. For these reasons, all subwatersheds with a minimum elevation of 7,620 ft were given a score of 3, and all subwatersheds with a minimum elevation above 7,620 ft were given a score of 4 to reflect relative risks. Indicator: 5. Population size structure. Indicator Scoring:
Juvenile:Adult Ratio
Mean Length (inches)
CSI Score
<0.25, or >15 <4, or >16 1 <6, or >15 2
0.25-1, or 5-10 <8, or >14 3 12-14 4
1-5 8-12 5 Score Juvenile:Adult ratio if data are available

Explanation: Population size structure indicates the relative number of young fish to adult fish. The juvenile:adult ratio is the number of juvenile divided by the number of adult fish. The length of fish used to define juveniles and adults varies by species. When data are not available for juvenile or adult fish, then the mean length of fish in a population is used. Small average lengths indicate poor adult survival, whereas large average lengths indicate a lack of recruitment. Rationale: Low ratios indicate poor reproduction, poor recruitment, or the effect of stocking large fish. High ratios indicate excessive reproduction or low survival of adults13. Data sources: Trout densities greater from 1 to 6 inches (here classified as juveniles) and greater than 6 inches (classified as adults) were obtained from the Wyoming Game and Fish Department fisheries database and used to compute ratios for each site. Ratios were computed for brook trout, brown trout, rainbow trout, and cutthroat trout for each site and then averaged across sites for each species within each subwatershed. Size structure ratios across species were then computed as a weighted mean across species with density as the weight. Trout population size structure for subwatersheds not sampled were scored using professional judgment based on trout density and subwatershed location in the basin. Habitat Integrity: Indicators for the integrity of aquatic habitats. Overview:
1. Land stewardship 2. Watershed connectivity 3. Watershed conditions 4. Water quality 5. Flow regime
Indicator: 1. Land stewardship. Indicator Scoring:
Protected occupied habitat*
Subwatershed protection
CSI Score
none any 1 1 – 9% <25% 1 1 – 9% ≥25% 2
10 – 19% <25% 2 10 – 19% ≥25% 3 20 – 29% <50% 4 20 – 29% ≥50% 5
≥30% any 5 *If subwatershed only contains currently unoccupied habitat then scores are based only on subwatershed protection: <25% =1; 25 – 50%=2; >50%=5.

Explanation: The percent of occupied stream habitat AND percent subwatershed that is protected lands. Protected lands are federal or state lands with regulatory or congressionally-established protections, such as: federal or state parks and monuments, national wildlife refuges, wild and scenic river designations, designated wilderness areas, inventoried roadless areas on federal lands, Research Natural Areas, Areas of Critical Environmental Concern, others areas of special protective designations, or private ownership designated for conservation purposes. Rationale: Stream habitat and subwatersheds with higher proportions of protected lands typically support higher quality habitat than do other lands. Data Sources: Protected areas data were compiled from the ESRI, Tele Atlas North American / Geographic Data Technology dataset on protected areas14 and the U.S. Department of Agriculture, Forest Service’s National Inventoried Roadless Areas dataset15. Indicator: 2. Watershed connectivity. Indicator Scoring:
Number of stream/canal intersections
Current/perennial connectivity 6th
CSI Score
GE 12 LT 50% 1 8 – 11 50 – 74% 2 5 – 7 75 – 89% 3 1 – 4 90 – 94% 4
0 95 – 100% 5 Current/perennial connectivity 4th: • >90%: +1 • <50%: -1
Score for worst case Explanation: The number of stream-canal intersections and reduction in perennial stream connectivity in the subwatershed and subbasin. Connectivity is measured by determining the longest continuous section of stream habitat uninterrupted by man-made structures impassable by fish in the subwatershed and dividing that by the longest continuous section of connected perennial stream habitat. Connectivity is also computed for the subbasin. Man-made barriers may include dams, water diversion structures, or human-caused dewatered stream segments that impede fish movement. Rationale: Increased hydrologic connectivity provides more habitat area and better supports multiple life histories, which increases the likelihood of persistence4. Diversions, when they do not directly inhibit fish passage, can represent false movement corridors, cause fish entrainment, and act as population sinks16;17.

Data Sources: Diversion data from Wyoming State Engineer’s Office, clarified through personal communication with Jeff Streeter6; additional data from USFS barriers assessment7. Data on canals were obtained from the National Hydrography Dataset Plus5 and supplement with additional information from Medicine Bow National Forest18. Indicator: 3. Watershed condition. Indicator Scoring:
Land conversion
CSI Score
≥30% 1 20 – 29% 2 10 – 19% 3 5 – 9% 4 0 - 4% 5
CSI score is downgraded 1 point if road density is ≥1.7 and <4.7 mi/square mile. If road density is ≥4.7 mi/square mile it is downgraded 2 points.
Explanation: The percentage of converted lands in the subwatershed and the density of roads. Rationale: Habitat conditions are the primary determinant of persistence for most populations19. Converted lands are known to degrade aquatic habitats20;21. Road density is computed for the subwatershed; roads are known to cause sediment-related impacts to stream habitat22-24. Lee et al.23 recognized 6 road density classifications as they related to aquatic habitat integrity and noted densities of 1.7 and 4.7 mi/mi2 as important thresholds. Data Sources: Converted lands were determined using the National Land Cover Database25, with all Developed, Pasture/Hay, and Cultivated Crops land cover types considered to be converted lands. Road density was determined using Tiger roads26. Indicator: 4. Water quality. Indicator Scoring: Miles 303(d)
Streams Agricultural
Land Number Active Mines
Number active
oil/gas wells
Road mi/ Stream mi
CSI Score
>0 58-100% ≥10 ≥ 400 0.5 – 1.0 1 28-57% 7-9 300 - 399 0.25 – 0.49 2 16-27% 4-6 200 - 299 0.24 - 0.10 3 6-15% 1-3 50 - 199 0.05 – 0.09 4 0-5% 0 0 - 49 0 – 0.04 5
Score for worst case.
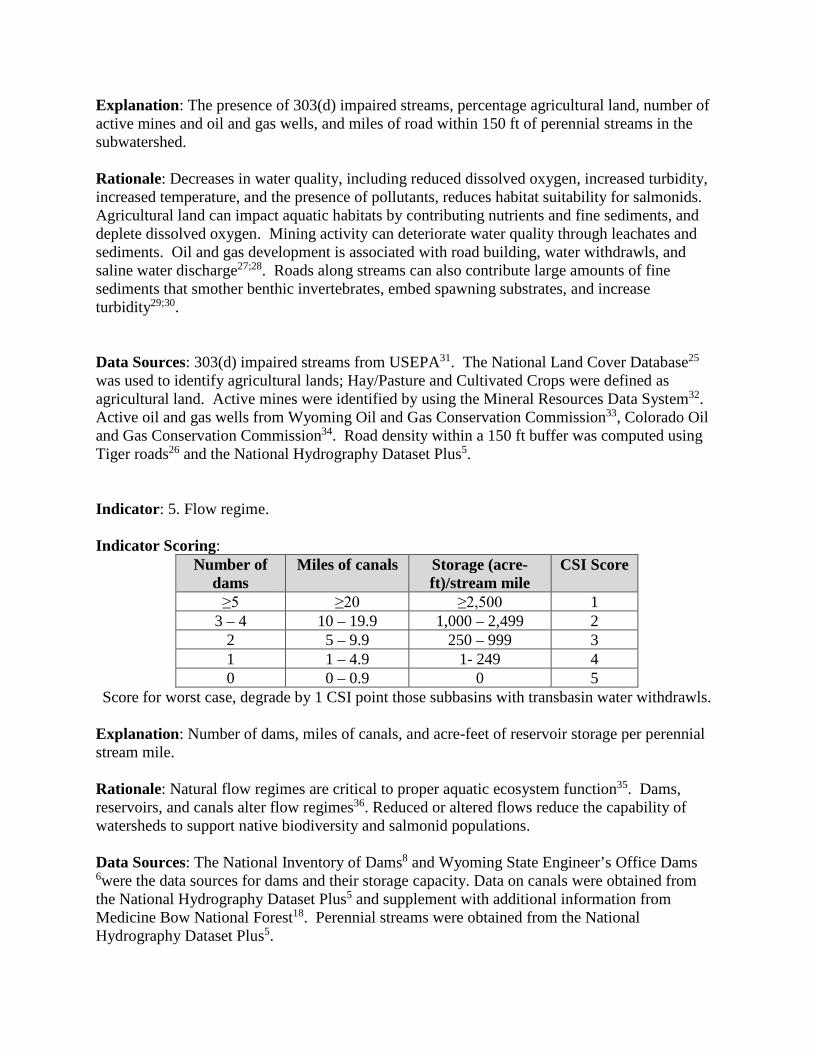
Explanation: The presence of 303(d) impaired streams, percentage agricultural land, number of active mines and oil and gas wells, and miles of road within 150 ft of perennial streams in the subwatershed. Rationale: Decreases in water quality, including reduced dissolved oxygen, increased turbidity, increased temperature, and the presence of pollutants, reduces habitat suitability for salmonids. Agricultural land can impact aquatic habitats by contributing nutrients and fine sediments, and deplete dissolved oxygen. Mining activity can deteriorate water quality through leachates and sediments. Oil and gas development is associated with road building, water withdrawls, and saline water discharge27;28. Roads along streams can also contribute large amounts of fine sediments that smother benthic invertebrates, embed spawning substrates, and increase turbidity29;30. Data Sources: 303(d) impaired streams from USEPA31. The National Land Cover Database25 was used to identify agricultural lands; Hay/Pasture and Cultivated Crops were defined as agricultural land. Active mines were identified by using the Mineral Resources Data System32. Active oil and gas wells from Wyoming Oil and Gas Conservation Commission33, Colorado Oil and Gas Conservation Commission34. Road density within a 150 ft buffer was computed using Tiger roads26 and the National Hydrography Dataset Plus5. Indicator: 5. Flow regime. Indicator Scoring:
Number of dams
Miles of canals Storage (acre-ft)/stream mile
CSI Score
≥5 ≥20 ≥2,500 1 3 – 4 10 – 19.9 1,000 – 2,499 2
2 5 – 9.9 250 – 999 3 1 1 – 4.9 1- 249 4 0 0 – 0.9 0 5
Score for worst case, degrade by 1 CSI point those subbasins with transbasin water withdrawls.
Explanation: Number of dams, miles of canals, and acre-feet of reservoir storage per perennial stream mile. Rationale: Natural flow regimes are critical to proper aquatic ecosystem function35. Dams, reservoirs, and canals alter flow regimes36. Reduced or altered flows reduce the capability of watersheds to support native biodiversity and salmonid populations. Data Sources: The National Inventory of Dams8 and Wyoming State Engineer’s Office Dams 6were the data sources for dams and their storage capacity. Data on canals were obtained from the National Hydrography Dataset Plus5 and supplement with additional information from Medicine Bow National Forest18. Perennial streams were obtained from the National Hydrography Dataset Plus5.

Future Security Indicators for the future security of populations and aquatic habitats. Overview:
1. Land conversion 2. Resource extraction 3. Energy development 4. Climate change 5. Mountain pine beetle impact
Indicator: 1. Land conversion. Indicator Scoring:
Land Vulnerable to Conversion CSI Score 81 – 100% 1 61 – 80% 2 41 - 60% 3 21 - 40% 4 0 – 20% 5
Explanation: The potential for future land conversion is modeled as a function of slope, land ownership, roads, and urban areas. Land is considered vulnerable to conversion if the slope is less than 15%, it is in private ownership and not already converted, it is within 0.5 miles of a road, and within 5 miles of an urban center. Lands encumbered by conservation easements are not available for conversion. Rationale: Conversion of land from its natural condition will reduce aquatic habitat quality and availability37. Data Sources: Slope was computed from elevation data from the National Hydrography Dataset Plus5. Land cover was determined from the National Land Cover Database25, and all land cover classes except developed areas and cultivated crops cover types were considered for potential conversion. Urban areas were determined using 2000 TIGER Census data38, roads from Integrated Road Transportation of Idaho data39, and land ownership using USGS data on Land Ownership in Western North America40. Conservation easement data from The Nature Conservancy41, the Wyoming Stock Grower’s Agricultural Land Trust42, the Colorado Cattlemen’s Agricultural Land Trust,43 and the Colorado Ownership, Management, and Protection v7 database44. Indicator: 2. Resource extraction.
Indicator Scoring:
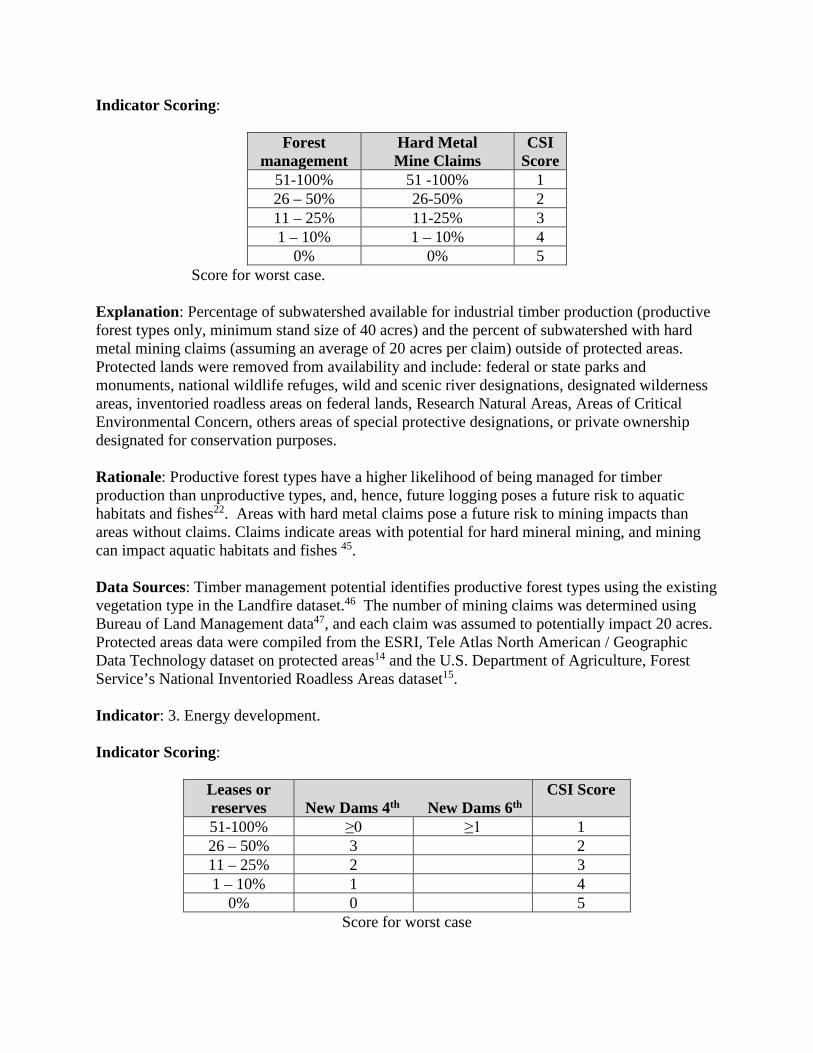
Forest management
Hard Metal Mine Claims
CSI Score
51-100% 51 -100% 1 26 – 50% 26-50% 2 11 – 25% 11-25% 3 1 – 10% 1 – 10% 4
0% 0% 5 Score for worst case.
Explanation: Percentage of subwatershed available for industrial timber production (productive forest types only, minimum stand size of 40 acres) and the percent of subwatershed with hard metal mining claims (assuming an average of 20 acres per claim) outside of protected areas. Protected lands were removed from availability and include: federal or state parks and monuments, national wildlife refuges, wild and scenic river designations, designated wilderness areas, inventoried roadless areas on federal lands, Research Natural Areas, Areas of Critical Environmental Concern, others areas of special protective designations, or private ownership designated for conservation purposes. Rationale: Productive forest types have a higher likelihood of being managed for timber production than unproductive types, and, hence, future logging poses a future risk to aquatic habitats and fishes22. Areas with hard metal claims pose a future risk to mining impacts than areas without claims. Claims indicate areas with potential for hard mineral mining, and mining can impact aquatic habitats and fishes 45. Data Sources: Timber management potential identifies productive forest types using the existing vegetation type in the Landfire dataset.46 The number of mining claims was determined using Bureau of Land Management data47, and each claim was assumed to potentially impact 20 acres. Protected areas data were compiled from the ESRI, Tele Atlas North American / Geographic Data Technology dataset on protected areas14 and the U.S. Department of Agriculture, Forest Service’s National Inventoried Roadless Areas dataset15. Indicator: 3. Energy development. Indicator Scoring:
Leases or reserves
New Dams 4th New Dams 6th
CSI Score
51-100% ≥0 ≥1 1 26 – 50% 3 2 11 – 25% 2 3 1 – 10% 1 4
0% 0 5 Score for worst case

Explanation: The acreage of oil, gas, coal, and uranium reserves; geothermal or wind development areas; and the number of dam sites located for potential development outside of protected areas within each subbasin and subwatershed. Rationale: Increased resource development will increase road densities, modify natural hydrology, and increase the likelihood of pollution to aquatic systems. Changes in natural flow regimes associated with dams are likely to reduce habitat suitability for native salmonids and increase the likelihood of invasion by non-native species.48 If lands are protected then the watersheds will be less likely to be developed. Data Sources: Wind resources (“Good” and better) from Wind Powering America/National Renewable Energy Lab (NREL).49 Geothermal known and closed lease areas, and oil and gas leases and agreements from BLM Geocommunicator*50 (selected: oil and gas authorized leases, authorized agreements, sale parcels, communitization agreements, and unit agreements); coal data from USGS;51 additional uranium data from the Internet Mapping Service for Energy and Minerals Data of Wyoming.52 Potential dam sites are based on Idaho National Laboratory (INL) hydropower potential data.53 Protected areas data were compiled from the ESRI, Tele Atlas North American / Geographic Data Technology dataset on protected areas14 and the U.S. Department of Agriculture, Forest Service’s National Inventoried Roadless Areas dataset.15 Indicator: 4. Climate change. Indicator Scoring:
TU Climate Change Analysis Climate Risk Factors CSI Score High, High, Any., Any 1 High, Any, Any, Any 2
Mod., Mod., Mod, (Mod or Low) 3
* Several geospatial data types are available from Geocommunicator, and they have the following definitions:
Lease: Parcel leased for oil and gas production.
Agreement: An ‘agreement’ between operator and host (private or public) to evaluate geological, logistic, geophysical, etc issues involving a concession. The agreement essentially allows a technical evaluation of lease feasibility.
Unit Agreements: Multiple entities go in collectively on an agreement. Implied: there are limits to the number of agreements that one individual entity can have outstanding, and a unit agreement allows them to get around the limit.
Communitization: Combining smaller federal tracts to meet the necessary minimum acreage required by the BLM (for spacing purposes).
Authorized: Bid on and sold lease or authorization, ready for production.
Lease Sale Parcel: Parcel slated for auction but not yet sold.
Closed: Not retired, just expired and may become available and open to resubmittal.
Other Agreements: Catch-all for other agreement types.

Mod, Mod, Low, Low 4 Low, Low, Low, (Mod or Low) 5
Explanation: Climate change is based on TU Climate Change analysis, which focuses on 4 identified risk factors related to climate change:
a. Increased Summer Temperature: loss of lower-elevation (higher-stream order) habitat impacts temperature sensitive species
b. Uncharacteristic Winter Flooding: rain-on-snow events lead to more and larger floods c. Uncharacteristic Wildfire: earlier spring snowmelt coupled with warmer temperatures
results in drier fuels and longer burning, more intense wildfire d. Drought: moisture loss under climate warming will overwhelm any gains in
precipitation and lead to higher drought risk
Each of the four factors is ranked as low, moderate, or high. Increased summer temperature due to climate change was modeled as a 3°C increase. Uncharacteristic winter flooding can result from basins transitioning from snow dominated to rain-on-snow dominated with increased winter flooding. Uncharacteristic wildfires result from changes in climate and fire fuels. Drought risk is based on the Palmer Drought Severity Index, but was adjusted for elevation and precipitation. Rationale: Climate change is likely to threaten most salmonid populations because of warmer water temperatures, changes in peak flows, and increased frequency and intensity of disturbances such as floods and wildfires.54;55 A 3°C increase in summer temperature has the potential to

impact coldwater species occupying habitat at the edge of their thermal tolerance; temperature thresholds for the North Platte Basin wild trout (<20 = low, 20 – 22 = moderate, >22 = high) from Rahel et al 199656. Increased winter flooding can cause local populations to be extirpated. Wildfire can change aquatic habitats, flow regimes, temperatures, and wood inputs that are important to salmonids.57 Drought is expected to reduce water availability58;59 and the availability of aquatic habitat. These risks are further discussed by Williams et al.54 Data Sources: Temperature and precipitation data were obtained from the PRISM Group.60 Elevation data was obtained from the National Elevation Dataset,61 and LANDFIRE data for the Anderson Fire Behavior Fuel Model 1346 was used as input for wildfire risk. The Palmer Drought Severity Index was used for drought risk,62 but was adjusted for elevation (elevations above 2690 have lower risk59) and the deviation from mean annual precipitation (areas with more precipitation on average have lower risk). Indicator: 5. Mountain pine beetle impact Indicator Scoring:
Mountain pine beetle infestation area
CSI Score
81 – 100% 1 61 – 80% 2 41 - 60% 3 21 - 40% 4 0 – 20% 5
Explanation: An outbreak of mountain pine beetle has caused extensive mortality of lodgepole pine, Engelmann spruce, and subalpine fir throughout the Colorado and Wyoming Rockies. Rationale: Standing dead trees from pine beetles immediately pose a high risk of severe canopy fire. Wildfire risk next decreases as the tree canopy collapses, but then increases with recruitment of an even-aged lodgepole pine stand. Severe wildfires have the potential to negatively impact stream habitat and trout populations via salvage logging, altered hydrology, decreased stream shading, and altered wood inputs.57 Data Sources: USFS Mountain pine beetle damage areas from aerial surveys, including damage types defoliation, mortality, and dieback for 2008.63
Reference List
1. M. E. Soule, Where do we go from here? Viable populations for conservation (Cambridge University Press, Cambridge, England, 1987).
2. CDW, "Wild and gold medal trout management" Report No. Colorado Wildlife Commission Policy (Colorado Division of Wildlife, 2008).
3. T. C. Annear et al., "Modification of the Wyoming Game and Fish Department's system for classifying stream fisheries" (Wyoming Game and Fish Department, Cheyenne, Wyoming, 2006).
4. W. T. Colyer, J. L. Kershner, R. H. Hilderbrand, "Movements of fluvial Bonneville cutthroat trout in the Thomas Fork of the Bear River, Idaho-Wyoming", N.Am.J.Fish.Manage. 25, 954-963 (2005).
5. USEPA and USGS. "National Hydrography Dataset Plus - NHDPlus (1:100,000 scale)". 2005. Sioux Falls, South Dakota, U.S. Environmental Protection Agency and U.S. Geological Survey. http://www.horizon-systems.com/nhdplus/.
6. Wyoming State Engineer's Office. "WYSEO Dams and Points of Diversion, Oct 2008". (October 2008). 2008. Contact: Becky Madsen.
7. USFS. "Medicine Bow National Forest Barriers Assessment 2008". 2008. USFS. November 2008.
8. USACE. "National Inventory of Dams". 2008. U.S. Army Corps of Engineers. http://crunch.tec.army.mil/nidpublic/webpages/nid.cfm.
9. T. Bohlin, L. F. Sundström, J. I. Johnsson, J. Höjesjö, J. Pettersson, "Density-dependent growth in brown trout: effects of introducing wild and hatchery fish", J.Anim.Ecol. 71, 683-692 (2002).
10. L. M. Miller, T. Close, A. R. Kapuscinski, "Lower fitness of hatchery and hybrid rainbow trout compared to naturalized populations in Lake Superior tributaries", Molecular Ecology 13, 3379-3388 (2004).
11. Money, D. and Wanner, S. "New findings and current status of whirling disease in Wyoming". 35-37. 1997. Logan, Utah, Whirling Disease Symposium. Expanding the database: 1996 research progress reports.
12. C. M. Moffitt, K. A. Johnson, B. E. Rieman, "Development of empirical models of Myxobolus cerebralis to predict risks for populations of fish across river drainages" (Final report to Whriling Disease Initiative 2001-2002 Funding Cycle, 2002).
13. R. O. Anderson and R. M. Neumann, "Length, weight, and associated structural indices" in Fisheries techniques, B. R. Murphy and D. W. Willis, Eds. (American Fisheries Society, Bethesda, Maryland, 1996).

14. ESRI. "Protected areas (1:100,000)". 2004. Redlands, California, U.S. Tele Atlas North America, Inc. / Geographic Data Technology, Inc., ESRI.
15. USDA Forest Service. "National inventoried roadless areas (IRAs)". 2008. Salt Lake City, Utah, Geospatial Service and Technology Center, U.S. Department of Agriculture, Forest Service. http://fsgeodata.fs.fed.us/clearinghouse/other_fs/other_fs.html.
16. A. J. Schrank and F. J. Rahel, "Movement patterns in inland cutthroat trout (Oncorhynchus clarki utah): management and conservation implications", Can.J.Fish.Aquat.Sci. 61, 1528-1537 (2004).
17. J. J. Roberts and F. J. Rahel, "Irrigation canals as sink habitat for trout and other fishes in a Wyoming drainage", Trans.Amer.Fish.Soc. 137, 951-961 (2008).
18. Dave Gloss and Carol Purchase. "Medicine Bow National Forest Ditches". 2008.
19. A. L. Harig, K. D. Fausch, M. K. Young, "Factors influencing success of greenback cutthroat trout translocations", N.Am.J.Fish.Manage. 20, 994-1004 (2000).
20. B. B. Shepard, R. Spoon, L. Nelson, "A native westslope cutthroat trout population responds positively after brook trout removal and habitat restoration", Intermount.J.Sci. 8, 191-211 (2002).
21. S. M. White and F. J. Rahel, "Complementation of habitats for Bonneville cutthroat trout in watersheds influenced by beavers, livestock, and drought", Trans.Amer.Fish.Soc. 137, 881-894 (2008).
22. G. S. Eaglin and W. A. Hubert, "Effects of logging and roads on substrate and trout in streams of the Medicine Bow National Forest, Wyoming", N.Am.J.Fish.Manage. 13, 844-846 (1993).
23. D. C. Lee, J. R. Sedell, B. E. Rieman, R. F. Thurow, J. E. Williams, "Broadscale assessment of aquatic species and habitats" in An assessment of ecosystem components in the Interior Columbia Basin and portions of the Klamath and Great Basins: Volume III, T. M. Quigley and S. J. Arbelbide, Eds. (USDA Forest Service, General Technical Report PNW-GTR-405, Portland, Oregon, 1997).
24. T. F. Waters, Sediment in streams: sources, biological effects, and control (American Fisheries Society Monograph 7, Bethesda, Maryland, 1995).
25. USGS. "National Land Cover Database". 2001. Sioux Falls, South Dakota, U.S. Geological Survey.
26. USGS. "All Roads in the Western United States (2000 TIGER) (1:100,000)". 2008. http://sagemap.wr.usgs.gov/HumanFootprint.aspx.

27. C. A. Rice, M. S. Ellis, J. H. Jr. Bullock, "Water co-produced with coalbed methane in the Powder River Basin, Wyoming: preliminary compositional data" Report No. Open-File Report 00-372 (U.S. Department of the Interior, U.S. Geological Survey, Denver, Colorado, 2000).
28. C. Murray-Gulde, J. E. Heatley, T. Karanfil, J. H. Jr. Rodgers, J. E. Myers, "Performance of a hybrid reverse osmosis-constructed wetland treatment system for brackish oil field produced water", Water Research 37, 705-713 (2003).
29. D. S. Lloyd, "Turbidity as a water quality standard for salmonid habitats in Alaska", N.Am.J.Fish.Manage. 7, 34-45 (1987).
30. R. J. Davies-Colley and D. G. Smith, "Turbidity, suspended sediment, and water clarity: a review", J.Am.Water Resour.Assoc. 37, 1085-1101 (2001).
31. USEPA. "303(d) listed waters". (2002). 2002. Washington, DC, U.S. Environmental Protection Agency.
32. USGS. "Mineral Resources Data System (MRDS) (Active)". (2005). 2008. Reston, Virginia, U.S. Geological Survey. http://tin.er.usgs.gov/mrds/.
33. Wyoming Oil and Gas Conservation Commission. "Wyoming Active Oil and Gas Wells". 9.
34. Colorado Oil and Gas Conservation Commission. "Colorado Oil and Gas Conservation Commission GIS Online". 2009. Accessed January 2009.
35. N. L. Poff et al., "The natural flow regime", BioScience 47, 769-784 (1997).
36. A. C. Benke, "A perspective on America's vanishing streams", J.N.Am.Benthol.Soc. 9, 77-88 (1990).
37. S. E. Stephens et al., "Predicting risk of habitat conversion in native temperate grasslands", Conserv.Biol. 22, 1320-1330 (2008).
38. ESRI. "US MapData Places (2000 TIGER)". (1998 - 2002). 2005. Redlands, CA, ESRI.
39. IGDC. "Integrated Road Transportation of Idaho". (2008-06-22). 2008. Moscow, Idaho, Idaho Geospatial Data Clearinghouse (INSIDE Idaho). http://insideidaho.org/asp/GeoData.asp.
40. USGS. "Land Ownership in Western North America, 180 m". (1986-2003). 2004. Boise, Idaho, Sage-grouse rangewide conservation assessment, Snake River Field Station, U.S. Geological Survey. http://sagemap.wr.usgs.gov/FTP/regional/USGS/westna_ownership_sgca.zip.
41. TNC-WY. "TNC Conservation Easements in Wyoming". (Accessed 11/4/2008). 2008. Source: Holly Copeland.

42. WYSGALT. "Wyoming Stock Grower's Agricultural Land Trust Conservation Easements, North Platte River Basin". 2009. Based on township and range information provided by Leah Burgess, December 2008.
43. Colorado Cattlemen's Agricultural Land Trust. "Conservation Easements held by the Colorado Cattlemen's Agricultural Land Trust, Routt County Colorado". 2009. NOT FOR DISTRIBUTION.
44. Theobald, D. M. G. W. S. E. L. N. P. a. M. L. "Colorado Ownership, Management, and Protection v7 database". (v7, Sept. 2008). 2008. Fort Collins,CO, Human Dimensions of Natural Resources and Natural Resource Ecology Lab,Colorado State University. http://www.nrel.colostate.edu/projects/comap/.
45. P. H. Rahn, A. D. Davis, C. J. Webb, A. D. Nichols, "Water quality impacts from mining in the Black Hills, South Dakota, USA", Environmental Geology 27, 38-53 (1996).
46. USFS. "LANDFIRE". (Rapid Refresh). 2008. Wildland Fire Leadership Council and U.S. Forest Service. http://www.landfire.gov/.
47. Hyndman, P. C. and Campbell, H. W. "BLM mining claim recordation system: mining claim density". 1996. Fort Collins, Colorado, Open-File Report 99-325. Natural Resource Ecology Labaoratory, U.S. Geological Survey.
48. K. D. Fausch, "A paradox of trout invasions in North America", Biol.Invasions 10, 685-701 (2008).
49. Wind Powering America and National Renewable Energy Laboratory. "Wind Resource Potential". 2003. National Renewable Energy Laboratory, USDOE.
50. USBLM. "Geocommunicator". 2008. USBLM and USFS. http://www.geocommunicator.gov/GeoComm/index.shtm.
51. USGS. "Coal Fields of the United States". 2009. Reston, VA, USGS Eastern Energy Team, National Atlas of the United States.
52. Wyoming Geographic Information Science Center. "Internet Mapping Service for Energy and Minerals Data of Wyoming". 2005. University of Wyoming.
53. INL. "Hydropower Resource Assessment". 2004. Idaho Falls, Idaho, Idaho National Laboratory.
54. J. E. Williams, A. L. Haak, H. M. Neville, W. T. Colyer, "Potential consequences of climate change to persistence of cutthroat trout populations", N.Am.J.Fish.Manage. 29, 533-548 (2009).
55. J. E. Williams, A. L. Haak, H. M. Neville, W. T. Colyer, N. G. Gillespie, "Climate change and western trout: strategies for restoring resistance and resilience in native populations" in Wild

Trout IX: Sustaining wild trout in a changing world, R. F. Carline and C. LoSapio, Eds. (Wild Trout Symposium, Bozeman, Montana, 2007).
56. F. J. Rahel, C. J. Keleher, J. L. Anderson, "Potential habitat loss and population fragmentation for cold water fish in the North Platte River drainage of the Rocky Mountains: Response to climate warming", Limnology and Oceanography 41, 1116-1123 (1996).
57. J. B. Dunham, M. K. Young, R. E. Gresswell, B. E. Rieman, "Effects of fire on fish populations: landscape perspectives on persistence of native fishes and nonnative fish invasions", Forest Ecology and Management 178, 183-196 (2003).
58. M. P. Hoerling and J. Eischeid, "Past peak water in the Southwest", Southwest Hydrology 6, 18-19,35 (2007).
59. A. L. Westerling, H. G. Hidalso, D. R. Cayan, T. W. Swetnam, "Warming and earlier spring increases western U.S. forest wildfire activity", Science 313, 940-943 (2006).
60. PRISM Group. "PRISM 800m Normals (1971 - 2000)". (1972 - 2000). 2008. Corvallis, Oregon, Oregon State University. http://www.prism.oregonstate.edu/.
61. USGS. "National Elevation Dataset (30m) (1:24,000)". 2008. Sioux Falls, SD, USGS EROS Data Center. http://ned.usgs.gov/.
62. W. C. Palmer, "Meteorological drought" Report No. Research Paper No. 45 (U.S. Weather Bureau, 1965).
63. USFS. "2008 USDA Forest Service, Rocky Mountain Region Aerial Detection Survey Data". 2009. USDA Forest Service.