Embed Size (px)
Citation preview
ICHEME SYMPOSIUM SERIES NO. 141
COMPUTER-AIDED HAZARD IDENTIFICATION: Methodology and System Architecture.
F.D. Larkin, A. G. Rushton, P. W. H. Chung, F. P. Lees, S. A. McCoy and S. J. Wakeman. Department of Chemical Engineering, Loughborough University, Loughborough, U.K.
Hazard and operabilily study (HAZOP) is a systematic hazard identification methodology for determining the causes and consequences of deviations of process variables (flow, pressure, temperature, etc) from design intent. A computer package titled HAZID is under development with the purpose of emulating the HAZOP procedure. The way in which the standard HAZOP procedure has been adapted for use by the computer is described. In addition to the HAZOP procedure a rule based approach has been implemented to complement the HAZOP approach. The techniques used for the acquisition of process unit fault and consequence data and the methods used for validation of the HAZID's results, i.e. test cases, benchmarks and user trials, are reviewed. Keywords: HAZOP. Computer, Automated, Hazard, Safety, Analysis.
1. INTRODUCTION
There are numerous procedures that can be employed to ensure that a new or existing process plant reaches a satisfactory level of safety and operability, e.g. checklists, hazard and operability studies (HAZOPs), failure modes effects and criticality analysis (FMECA). Pre-eminent amongst these methods is HAZOP.
HAZOP is a systematic hazard identification methodology for determining the causes and consequences of deviations of process variables (flow, pressure, temperature etc..) from design intent. It is essentially a 'problem identification' technique rather than a 'problem solving' one. For a detailed account of the HAZOP technique refer to the CIA guide (1). Other key sources are Kletz (2), Lawlcy (3) and Knowlton (4).
As part of a multi-national project titled 'Support Tool for Process Hazard and Operability Studies' (STOPHAZ)* a computer tool called HAZID is being developed to emulate the human HAZOP procedure. Further details on the STOPHAZ project are given in Preston (5).
The aim of the HAZID program is not to replace human HAZOP teams but to reduce the amount of time required for a human HAZOP, which is considerable. The principle is that if a plant can be analyzed at regular intervals during its development, then by the time it has come to be HAZOPed by the expert team many problems should have been highlighted and rectified. This would mean reduced HAZOP time and fewer actions arising from the HAZOP. It is not practical to have a HAZOP team convene regularly through the development of a plant but it is practical to get a computer to do such analyses.
STOPHAZ is part of the ESPRIT program and is part-financed by the Commission of the European Community. The project partners are AspenTech, Bureau Veritas, HyproTech, ICI, IntraSofl, Loughborough University, SFK, Snamprogetti, TXT, VTT.
337
ICHEME SYMPOSIUM SERIES NO. 141
2. SYSTEM COMPONENT MODULES AND ARCHITECTURE
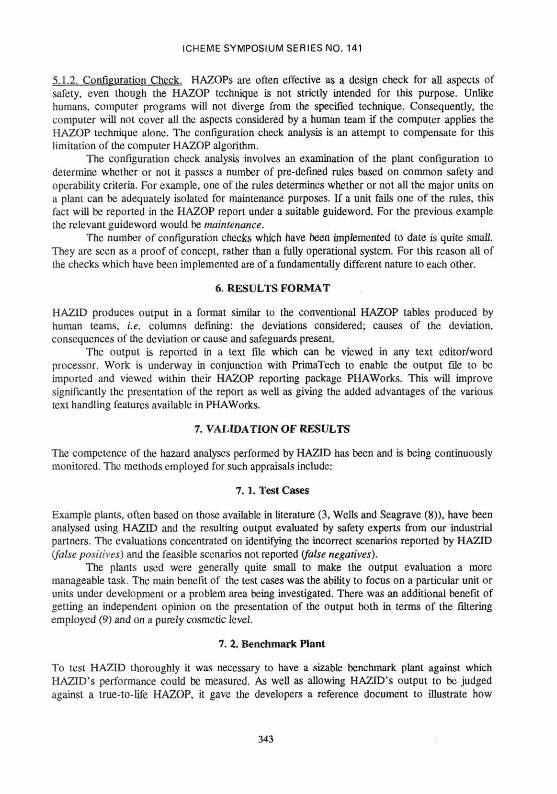
The HAZID system consists of several distinct but linked modules whose architecture is shown in Figure 1. The function of each module is outlined below. The more important ones are discussed in more detail in later sections.
AutoHAZID The AutoHAZID module performs hazard identification on a pre-defined process plant description.
The function of the other HAZID modules is essentially to support the decision making processes within the AutoHAZID module, i.e. to supply AutoHAZID with information about the process units or process materials.
Graphical Tool The Graphical Tool is a graphical user interface (GUI) which enables a user to specify a process plant. The Graphical Tool has been developed by TXT.
Unit Model Library The unit model library contains qualitative models of each type of process unit that can be represented in HAZID.
Model Creation Tool It is impossible to have a unit model library which contains models of every conceivable unit. There will always be a new vessel with some peculiar feature. For this reason it Is essential that a user is able to create unit models within HAZID. The model creation tool allows a user to build up a model of a unit by defining the following information relevant to the unit:
• structure - the number of chambers, inlets and outlets; • duty - phases present, heat transfer and/or mass transfer; • failure modes; • consequences of deviations and failure modes.
Chambers are distinct internal spaces (e.g. each side of a shell and tube heat exchanger). The model creation procedure takes the form of a question and answer session through which the user Is guided systematically.
Fluid Property Package The analyses performed by HAZID are primarily based on qualitative techniques but sometimes it is necessary to resort to quantitative data to determine whether or not an identified scenario is feasible. Much of the quantitative data required relates to the fluid being processed. For example, consider a heat exchanger, AutoHAZID would identify that loss of coolant flow results in increased temperature and possible evaporation of the process fluid. Whether or not evaporation is a realistic occurrence depends on the fluid's boiling point and the process conditions. To resolve this example problem AutoHAZID would ask the property package for the boiling point of the relevant fluid at the operating pressure and compare the returned value with the operating or deviant temperature.
The fluid property package enables AutoHAZID to resolve many such queries. Other queries that AutoHAZID might pose to the properly packages would typically be: what is the
338
ICHEME SYMPOSIUM SERIES NO. 141
freezing point of toluene at 3 bar ? or what is the flash point of benzene ? The property package contains calculation routines for numerous pre-defined queries and an extensive physical property database.
The property package is being developed with the aid of AspenTech, HyproTech and VTT.
Applications Programming Interface (API) The API provides a set of functions through which many of the modules within the HAZID system communicate with each other. The main reason for having a common set of functions is to simplify the maintenance, development and testing of the software.
HAZID Database The HAZID database stores information for the Graphical Tool, e.g. icon shapes and attribute sets, and more importantly the process descriptions created using the Graphical Tool. The database and its related access functions have been developed by Intrasoft.
3. UNIT MODEL LIBRARY
The unit model library contains qualitative models of many common and some not so common process units. For a particular unit type, its model defines:
• how deviations propagate through the unit; • the faults which can occur within the unit and their effect on process variables; • the adverse consequences of deviations and faults within the unit.
The models are represented in the library based on signed directed graph (SDG) methodology.
3.1. Signed Directed Graphs
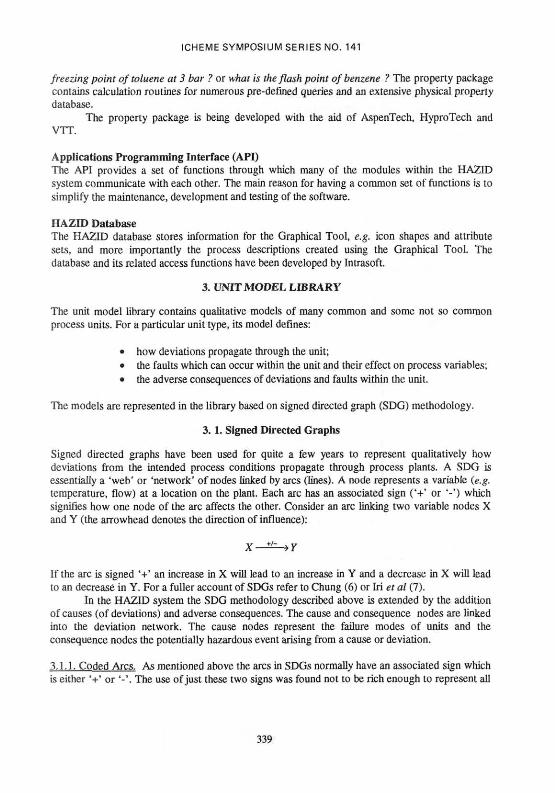
Signed directed graphs have been used for quite a few years to represent qualitatively how deviations from the intended process conditions propagate through process plants. A SDG is essentially a 'web' or 'network' of nodes linked by arcs (lines). A node represents a variable (e.g. temperature, flow) at a location on the plant. Each arc has an associated sign ('+' or '-') which signifies how one node of the arc affects the other. Consider an arc linking two variable nodes X and Y (the arrowhead denotes the direction of influence):
X—^->F
If the arc is signed '+' an increase in X will lead to an increase in Y and a decrease in X will lead to an decrease in Y. For a fuller account of SDGs refer to Chung (6) or Iri et al (7).
In the HAZID system the SDG methodology described above is extended by the addition of causes (of deviations) and adverse consequences. The cause and consequence nodes are linked into the deviation network. The cause nodes represent the failure modes of units and the consequence nodes the potentially hazardous event arising from a cause or deviation.
3.1.1. Coded Arcs. As mentioned above the arcs in SDGs normally have an associated sign which is either '+' or '-'. The use of just these two signs was found not to be rich enough to represent all
339
ICHEME SYMPOSIUM SERIES NO. 141
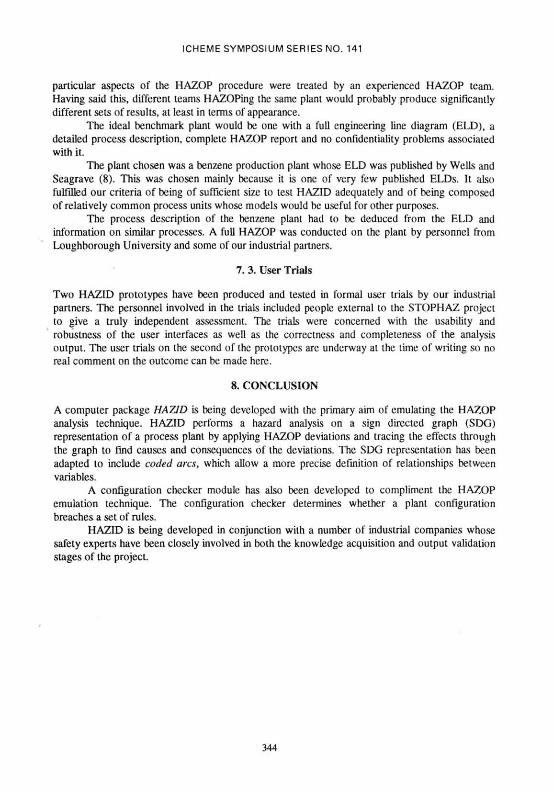
of the possible relationships between process variables. To demonstrate this point consider a gas feed to a column containing a body of liquid, as illustrated in Figure 2.
In the normal SDG representation of the example unit the effect of an increase in liquid level above the vapour inlet port on the vapour flow into the column could be specified as follows:
level —" > flow
This is interpreted as:
an increase in level causes low flow in and
a decrease in level causes high flow in
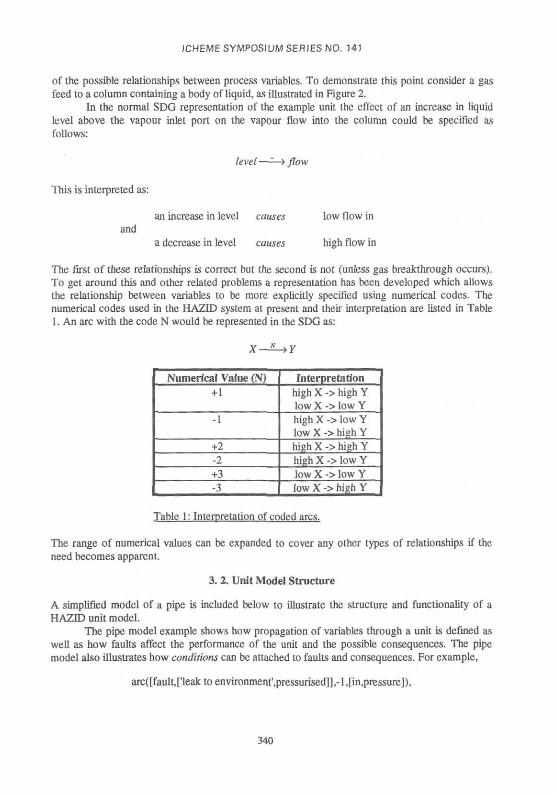
The first of these relationships is correct but the second is not (unless gas breakthrough occurs). To get around this and other related problems a representation has been developed which allows the relationship between variables to be more explicitly specified using numerical codes. The numerical codes used in the HAZID system at present and their interpretation are listed in Table 1. An arc with the code N would be represented in the SDG as:
Numerical Value (N) +1
-1
+2 -2 +3 -3
Interpretation high X -> high Y low X -> low Y high X -> low Y low X -> high Y high X -> high Y high X -> low Y low X -> low Y low X -> high Y
Table 1: Interpretation of coded arcs.
The range of numerical values can be expanded to cover any other types of relationships if the need becomes apparent.
3. 2. Unit Model Structure
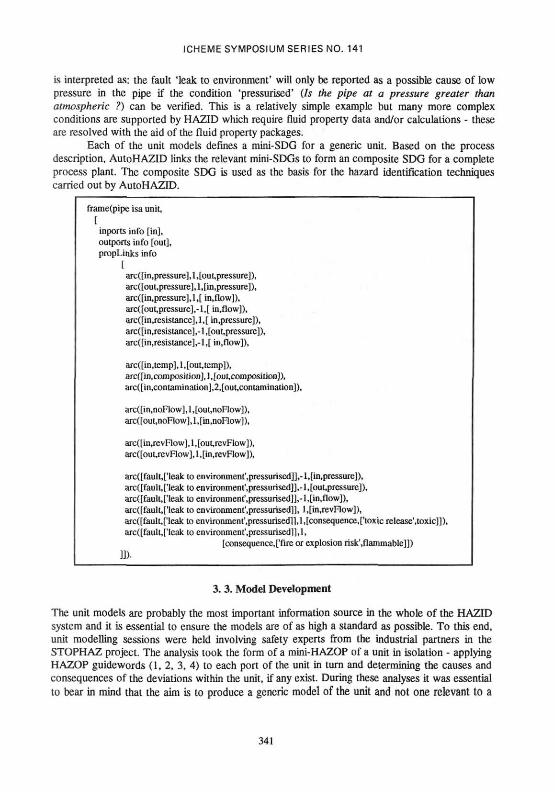
A simplified model of a pipe is included below to illustrate the structure and functionality of a HAZID unit model.
The pipe model example shows how propagation of variables through a unit is defined as well as how faults affect the performance of the unit and the possible consequences. The pipe model also illustrates how conditions can be attached to faults and consequences. For example,
arc([fault,['leak to environment',pressurised]],-l,[in,pressure]),
340
ICHEME SYMPOSIUM SERIES NO. 141
is interpreted as: the fault 'leak to environment' will only be reported as a possible cause of low pressure in the pipe if the condition 'pressurised' (Is the pipe at a pressure greater than atmospheric ?) can be verified. This is a relatively simple example but many more complex conditions are supported by HAZID which require fluid property data and/or calculations - these are resolved with the aid of the fluid property packages.
Each of the unit models defines a mini-SDG for a generic unit. Based on the process description, AutoHAZlD links the relevant mini-SDGs to form an composite SDG for a complete process plant. The composite SDG is used as the basis for the hazard identification techniques carried out by AutoHAZlD.
frame(pipe isa unit, r I
inports info [in], oulports info [out], propLinks info
i i arc([in,pressure],l,[out,pressure]), arc([out,prcssure], l,[in,pressure]), arc([in,pressure],l,[ in.flow]), arc([out,pressure],-l,[ in.flow]), arc([inresistance], 1,[ in.pressure]), arc([in,resistance],-1 ,[out,pressure]), arc([in,resistance],-l,[ in.flow]),
arc([in,tcmp], 1,[out, temp]), arc([in,composilion],l,[out,composiuon]), arc([in,contaminauon],2,[out,contamination])
arc([in,noFlow], 1 ,[out,noFlow]), arc([out,noFlow],l,[in,noFlow]),
arc([in,revFlow],l,[out,revFlow]), arc([out,revFlow], l,[in,revFlow]),
arc([fault,['leak to cnvironment',pressurised]],-l,[in,pressure]), arc([fault,['leak to environment',pressurised]],-l,[out,pressure]), arc([fault,['leak to environment',pressurised]],-l,[in.flow]), arc([fault,['leak to environment'.pressurised]], l,[in,revFlow]), arc([fault,['leak to environment'.pressurised]], 1,[consequence, ['toxic release'.toxic]]), arc([fault,I'leak to environment'.pressurised]],1,
[consequence,['fire or explosion risk'.flammable]])
3. 3. Model Development
The unit models are probably the most important information source in the whole of the HAZID system and it is essential to ensure the models are of as high a standard as possible. To this end, unit modelling sessions were held involving safety experts from the industrial partners in the STOPHAZ project. The analysis took the form of a mini-HAZOP of a unit in isolation - applying HAZOP guidewords (1, 2, 3, 4) to each port of the unit in turn and determining the causes and consequences of the deviations within the unit, if any exist. During these analyses it was essential to bear in mind that the aim is to produce a generic model of the unit and not one relevant to a
341
ICHEME SYMPOSIUM SERIES NO. 141
specific situation. For a potential fault or consequence identified in a mini-HAZOP, any assumptions made concerning the structure of the unit, its materials of construction or the fluid it handles were noted.
4. GRAPHICAL TOOL
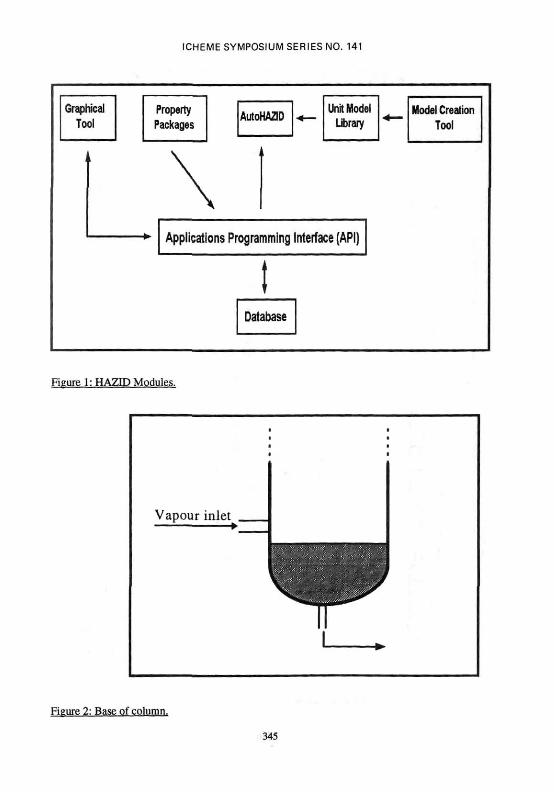
The Graphical Tool gives a user the facility to define a process plant in terms of: the units present, fluids present, materials of construction and operating conditions on a process plant. A screen for an example plant is shown in Figure 3. All the information entered using the Graphical Tool is stored in the HAZID database.
The detailed functionality of the Graphical Tool will not be described. One aspect that it is worth mentioning is the ability to specify the attributes of units. For example, an attribute could be the elevation above ground level of a heat exchanger or the dead-head value of a centrifugal pump. Each type of unit has an associated set of attributes which a user can optionally define. The more attributes declared the more relevant the analysis output will be.
The time required to specify a plant description in the detail necessary for a competent hazard analysis is always going to be considerable no matter what GUI is used. It is intended that where a plant description exists, having previously been created using an intelligent GUI, it will be possible to transfer this information into HAZID's database. To this end, work is underway to demonstrate that information can be imported from other packages, specifically Process WorkBench (produced by ZYQAD Ltd.) and Plant Design Systems (produced by Intergraph).
5. AUTOHAZID
The AutoHAZID module performs hazard identification on a process plant description. Using the process information stored in the HAZID database AutoHAZID creates an SDG representation of a process plant. This SDG representaiion is used as the basis for AuioHAZID's analysis techniques.
5.1. Analysis Methodology
AutoHAZID utilises two distinct analysis techniques to tackle two fundamentally different types of problems. The first technique is an emulation of a human HAZOP procedure and the second is a rule-based configuration check. Both analysis techniques are applied to the same SDG representation of a process and present their output in the same HAZOP table format but are otherwise independent.
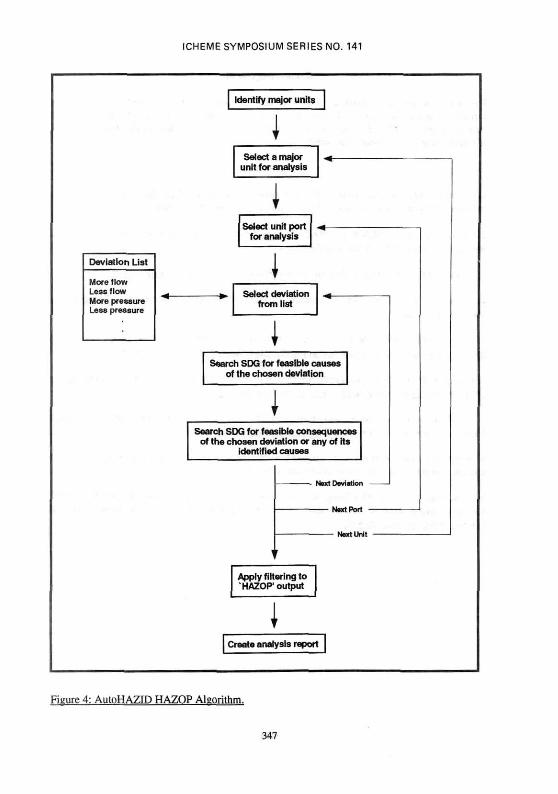
5.1.1. HAZOP Analysis. HAZOP is a very systematic and repetitive technique incorporating a considerable degree of redundancy. The redundancy in HAZOP is not undesirable as it acts as a safeguard, i.e. if a hazardous scenario is missed when considering one related deviation it will often be identified under another. Even though the repetitive and redundant aspects of HAZOP have benefits they are not particularly suited to the human teams, but more to computers which do not have a limited attention span.
The basic HAZOP algorithm used by HAZID is outlined in Figure 4. The repetitive nature of the analysis is evident.
Filtering of the output is used to reduce problems associated with the mechanistic application of a purely fault propagation based approach. The details of the filtering techniques developed are explained in an accompanying paper (Wakeman et al (9)).
342
ICHEME SYMPOSIUM SERIES NO. 141
5.1.2. Configuration Check. HAZOPs are often effective as a design check for all aspects of safety, even though the HAZOP technique is not strictly intended for this purpose. Unlike humans, computer programs will not diverge from the specified technique. Consequently, the computer will not cover all the aspects considered by a human team if the computer applies the HAZOP technique alone. The configuration check analysis is an attempt to compensate for this limitation of the computer HAZOP algorithm.
The configuration check analysis involves an examination of the plant configuration to determine whether or not it passes a number of pre-defined rules based on common safety and operabilily criteria. For example, one of the rules determines whether or not all the major units on a plant can be adequately isolated for maintenance purposes. If a unit fails one of the rules, this fact will be reported in the HAZOP report under a suitable guideword. For the previous example the relevant guideword would be maintenance.
The number of configuration checks which have been implemented to date is quite small. They are seen as a proof of concept, rather than a fully operational system. For this reason all of the checks which have been implemented are of a fundamentally different nature to each other.
6. RESULTS FORMAT
HAZ1D produces output in a format similar to the conventional HAZOP tables produced by human teams, i.e. columns defining: the deviations considered; causes of the deviation, consequences of the deviation or cause and safeguards present.
The output is reported in a text file which can be viewed in any text editor/word processor. Work is underway in conjunction with PrimaTech to enable the output file to be imported and viewed within their HAZOP reporting package PHAWorks. This will improve significantly the presentation of the report as well as giving the added advantages of the various text handling features available in PHAWorks.
7. VALIDATION OF RESULTS
The competence of the hazard analyses performed by HAZID has been and is being continuously monitored. The methods employed for such appraisals include:
7.1. Test Cases
Example plants, often based on those available in literature (3, Wells and Seagrave (8)), have been analysed using HAZID and the resulting output evaluated by safety experts from our industrial partners. The evaluations concentrated on identifying the incorrect scenarios reported by HAZID (false positives) and the feasible scenarios not reported (false negatives).
The plants used were generally quite small to make the output evaluation a more manageable task. The main benefit of the test cases was the ability to focus on a particular unit or units under development or a problem area being investigated. There was an additional benefit of getting an independent opinion on the presentation of the output both in terms of the filtering employed (9) and on a purely cosmetic level.
7. 2. Benchmark Plant
To test HAZID thoroughly it was necessary to have a sizable benchmark plant against which HAZID's performance could be measured. As well as allowing HAZID's output to be judged against a true-to-life HAZOP, it gave the developers a reference document to illustrate how
343
ICHEME SYMPOSIUM SERIES NO. 141
particular aspects of the HAZOP procedure were treated by an experienced HAZOP team. Having said this, different teams HAZOPing the same plant would probably produce significantly different sets of results, at least in terms of appearance.
The ideal benchmark plant would be one with a full engineering line diagram (ELD), a detailed process description, complete HAZOP report and no confidentiality problems associated with it.
The plant chosen was a benzene production plant whose ELD was published by Wells and Seagrave (8). This was chosen mainly because it is one of very few published ELDs. It also fulfilled our criteria of being of sufficient size to test HAZID adequately and of being composed of relatively common process units whose models would be useful for other purposes.
The process description of the benzene plant had to be deduced from the ELD and information on similar processes. A full HAZOP was conducted on the plant by personnel from Loughborough University and some of our industrial partners.
7. 3. User Trials
Two HAZID prototypes have been produced and tested in formal user trials by our industrial partners. The personnel involved in the trials included people external to the STOPHAZ project to give a truly independent assessment. The trials were concerned with the usability and robustness of the user interfaces as well as the correctness and completeness of the analysis output. The user trials on the second of the prototypes are underway at the time of writing so no real comment on the outcome can be made here.
8. CONCLUSION
A computer package HAZID is being developed with the primary aim of emulating the HAZOP analysis technique. HAZID performs a hazard analysis on a sign directed graph (SDG) representation of a process plant by applying HAZOP deviations and tracing the effects through the graph to Find causes and consequences of the deviations. The SDG representation has been adapted to include coded arcs, which allow a more precise definition of relationships between variables.
A configuration checker module has also been developed to compliment the HAZOP emulation technique. The configuration checker determines whether a plant configuration breaches a set of rules.
HAZID is being developed in conjunction with a number of industrial companies whose safety experts have been closely involved in both the knowledge acquisition and output validation stages of the project.
344
ICHEME SYMPOSIUM SERIES NO. 141
Graphical Tool
Property Packages
AutoHAZlD Unit Model
Library
Applications Programming Interface (API)
Database
Model Creation Tool
Figure 1: HAZID Modules-
Figure 2: Base of column.
345
ICHEME SYMPOSIUM SERIES NO. 141
» -;v . .RJ.
• < $ =
)-© EQA "
I
Figure 3: Graphical Tool Example Screen.
346
ICHEME SYMPOSIUM SERIES NO. 141
Deviation List
More flow Less flow More pressure Less pressure
Identify major units
J Select a major
unit for analysis
I Select unit port
for analysis
•
Select deviation from list
1 Search SDG for feasible causes
of the chosen deviation
i Search SDG for feasible consequences
of the chosen deviation or any of its identified causes
C
} r
Apply filtering to HAZOP' output
1 reate analysis reporl
Por
ctU
Figure 4: AutoHAZID HAZOP Algorithm.
347
ICHEME SYMPOSIUM SERIES NO. 141
Acknowledgements
The authors would like to thank all those who have been involved in the STOPHAZ project at its partner companies and to the Commission of the European Community who have provided finance for the STOPHAZ project. P.W.H. Chung is supported by a British Gas/Royal Academy of Engineering senior researh fellowship.
References
1. Chemical Industries Association, 1997, A guide to Hazard and Operability Studies, Chemical Industry Safety and Health Council of the Chemical Industries Association.
2. Kletz, T.A., 1992, HAZOP and HAZAN: Identifying and Assessing Process Industry Hazards, 3rd Edition, Institution of Chemical Engineers.
3. Lawley, H.G., 1974, Operability Studies and Hazard Analysis, Chem Eng Prog. 70: 45 - 56.
4. Knowlton, R.E., 1981, An Introduction to Hazard and Operability Studies, Chemetics Int. Vancouver, Canada.
5. Preston, M.L., 1995, The Process Systems contribution to Process Safety, Proc of the 8th Int Svmp on Loss and Safety Promotion in the Process Industries. Antwerp, Belgium.
6. Chung, P.W.H., 1993, Qualitative Analysis of Process Plant Behaviour, 6th Int Conference on Industrial and Engineering Applications of Artificial Intelligence, 277-283.
7. Iri, M, K. Aoki, E. O'Shima and Matsuyama, H., 1979, An Algorithm for Diagnosis of System Failures in the Chemical Process. Computers and Chem Eng. 3: 489-493.
8. Wells, G.L. and Seagrave, C.J., 1976, Flowsheeting for Safety, a guide on safety measures to consider during the design of chemical plant, IChemE.
9. Wakeman, S.J., P. W. H. Chung, A. G. Rushton, F. P. Lees, F. D. Larkin, McCoy, S. A., 1997, Computer-aided Hazard Identification: Fault propagation and fault-consequence scenarios filtering, Proc. of Hazards XIII.
348