Embed Size (px)
Citation preview
ALL-HAZARDS MITIGATION PLAN
HAZARD IDENTIFICATION
The objectives of the Hazard Identification section are two-fold:
1) Identify hazards that may affect the University of South Carolina
(USC) regional campuses, and
2) Provide a general description of these hazards including the
background and state-wide notable occurrences.
Since the USC regional campuses cover most of the state, a general description of state risk and
facts are found in this section. (The following section, Section 5: Hazard Analysis, describes specific
details on location, spatial extent, historical occurrences, and probably of future occurrence for
each campus.) All of the information presented herein is based on existing federal, state and local
sources as referenced throughout.
HAZARD SELECTION
South Carolina is vulnerable to a wide range of natural and human-caused hazards that threaten
life and property. Current FEMA regulations and interim guidance under the Disaster Mitigation Act
of 2000 (DMA 2000) require, at a minimum, an evaluation of a full range of natural hazards. This
plan draws on hazards found in the South Carolina State Hazard Mitigation Plan and those
suggested under FEMA planning guidance in order to identify a full range of hazards. These hazards
were then reviewed by the USC Committee to determine which were relevant to the USC
campuses.
University of South Carolina Floodplain Management and Hazard Mitigation Planning Committee
(FMHMPC) reviewed and identified a number of hazards that are to be addressed in the USC
Hazard Mitigation Plan. All of the hazards included underwent an extensive process that utilized
input from USC Committee members, research of past disaster declarations for in South Carolina,
historical hazard occurrences, and a review of the current South Carolina State Hazard Mitigation
Plan. USC opted to focus on natural hazards in this plan as man-made hazards are identified and
planned for in separate planning documents. Readily available online information from reputable
sources such as federal and state agencies was also evaluated to supplement information from
these key sources.
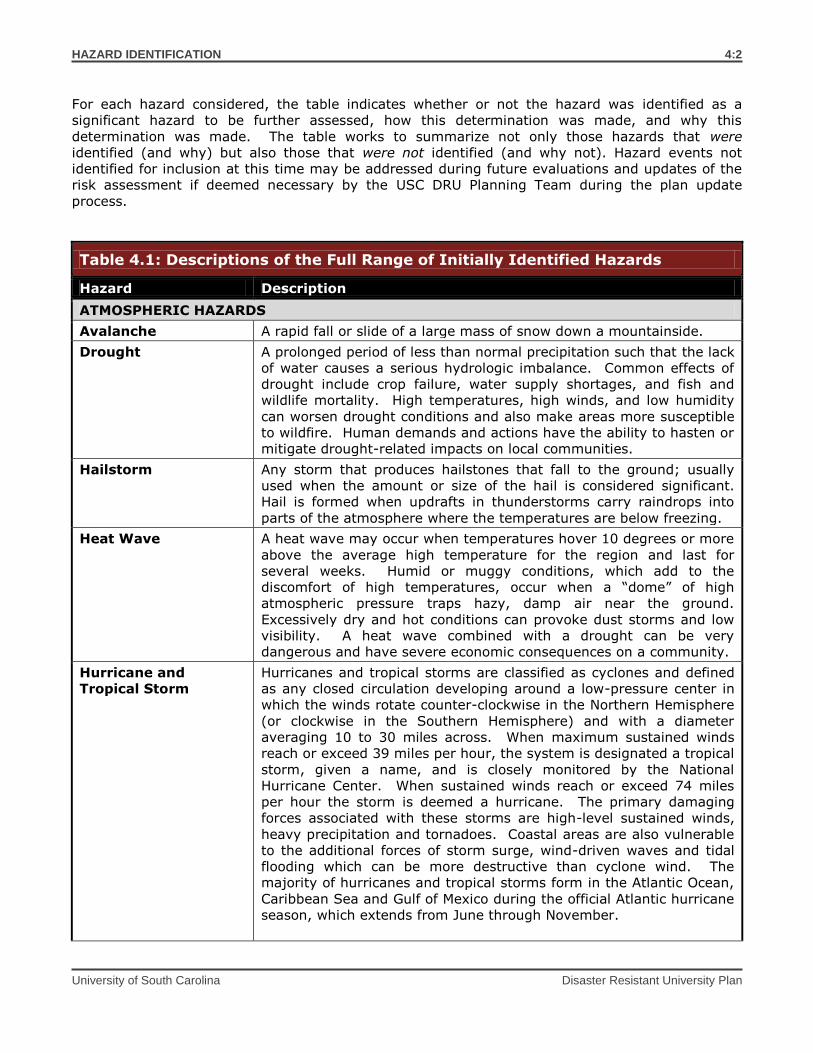
Table 4.1 lists the full range of natural hazards initially identified for inclusion in the plan and
provides a brief description for each. This table includes 24 individual hazards. Some of these
hazards are considered to be interrelated or cascading, but for preliminary hazard identification
purposes these individual hazards are broken out separately.
Next, Table 4.2 documents the evaluation process used for determining which of the initially
identified hazards are considered significant enough for further evaluation in the risk assessment.
Code of Federal Regulations (CFR) Requirement
44 CFR Part 201.6(c)(2)(i): The risk assessment shall include a description of the type, location and extent of all natural
hazards that can affect the jurisdiction. The plan shall include information on previous occurrences of hazard events and on
the probability of future hazard events.
HAZARD IDENTIFICATION
University of South Carolina Disaster Resistant University Plan
4:2
For each hazard considered, the table indicates whether or not the hazard was identified as a
significant hazard to be further assessed, how this determination was made, and why this
determination was made. The table works to summarize not only those hazards that were
identified (and why) but also those that were not identified (and why not). Hazard events not
identified for inclusion at this time may be addressed during future evaluations and updates of the
risk assessment if deemed necessary by the USC DRU Planning Team during the plan update
process.
Table 4.1: Descriptions of the Full Range of Initially Identified Hazards
Hazard Description
ATMOSPHERIC HAZARDS
Avalanche A rapid fall or slide of a large mass of snow down a mountainside.
Drought A prolonged period of less than normal precipitation such that the lack
of water causes a serious hydrologic imbalance. Common effects of
drought include crop failure, water supply shortages, and fish and
wildlife mortality. High temperatures, high winds, and low humidity
can worsen drought conditions and also make areas more susceptible
to wildfire. Human demands and actions have the ability to hasten or
mitigate drought-related impacts on local communities.
Hailstorm Any storm that produces hailstones that fall to the ground; usually
used when the amount or size of the hail is considered significant.
Hail is formed when updrafts in thunderstorms carry raindrops into
parts of the atmosphere where the temperatures are below freezing.
Heat Wave A heat wave may occur when temperatures hover 10 degrees or more
above the average high temperature for the region and last for
several weeks. Humid or muggy conditions, which add to the
discomfort of high temperatures, occur when a “dome” of high
atmospheric pressure traps hazy, damp air near the ground.
Excessively dry and hot conditions can provoke dust storms and low
visibility. A heat wave combined with a drought can be very
dangerous and have severe economic consequences on a community.
Hurricane and
Tropical Storm
Hurricanes and tropical storms are classified as cyclones and defined
as any closed circulation developing around a low-pressure center in
which the winds rotate counter-clockwise in the Northern Hemisphere
(or clockwise in the Southern Hemisphere) and with a diameter
averaging 10 to 30 miles across. When maximum sustained winds
reach or exceed 39 miles per hour, the system is designated a tropical
storm, given a name, and is closely monitored by the National
Hurricane Center. When sustained winds reach or exceed 74 miles
per hour the storm is deemed a hurricane. The primary damaging
forces associated with these storms are high-level sustained winds,
heavy precipitation and tornadoes. Coastal areas are also vulnerable
to the additional forces of storm surge, wind-driven waves and tidal
flooding which can be more destructive than cyclone wind. The
majority of hurricanes and tropical storms form in the Atlantic Ocean,
Caribbean Sea and Gulf of Mexico during the official Atlantic hurricane
season, which extends from June through November.
HAZARD IDENTIFICATION
University of South Carolina Disaster Resistant University Plan
4:3
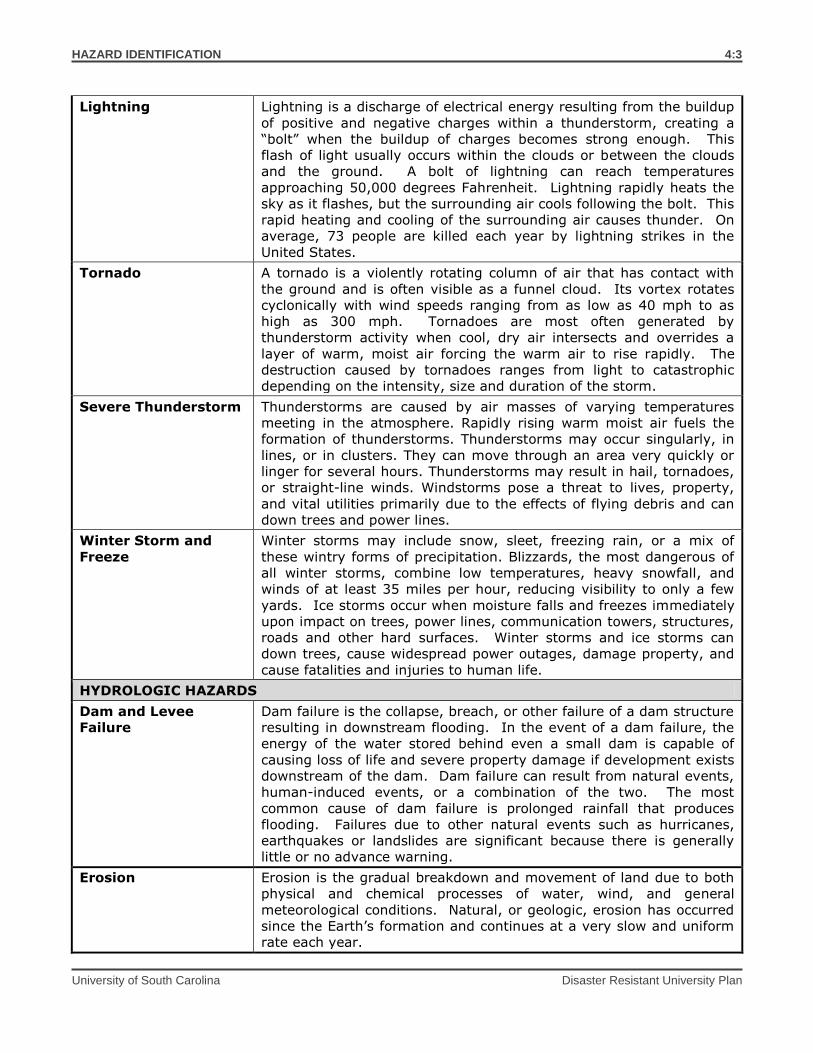
Lightning Lightning is a discharge of electrical energy resulting from the buildup
of positive and negative charges within a thunderstorm, creating a
“bolt” when the buildup of charges becomes strong enough. This
flash of light usually occurs within the clouds or between the clouds
and the ground. A bolt of lightning can reach temperatures
approaching 50,000 degrees Fahrenheit. Lightning rapidly heats the
sky as it flashes, but the surrounding air cools following the bolt. This
rapid heating and cooling of the surrounding air causes thunder. On
average, 73 people are killed each year by lightning strikes in the
United States.
Tornado A tornado is a violently rotating column of air that has contact with
the ground and is often visible as a funnel cloud. Its vortex rotates
cyclonically with wind speeds ranging from as low as 40 mph to as
high as 300 mph. Tornadoes are most often generated by
thunderstorm activity when cool, dry air intersects and overrides a
layer of warm, moist air forcing the warm air to rise rapidly. The
destruction caused by tornadoes ranges from light to catastrophic
depending on the intensity, size and duration of the storm.
Severe Thunderstorm Thunderstorms are caused by air masses of varying temperatures
meeting in the atmosphere. Rapidly rising warm moist air fuels the
formation of thunderstorms. Thunderstorms may occur singularly, in
lines, or in clusters. They can move through an area very quickly or
linger for several hours. Thunderstorms may result in hail, tornadoes,
or straight-line winds. Windstorms pose a threat to lives, property,
and vital utilities primarily due to the effects of flying debris and can
down trees and power lines.
Winter Storm and
Freeze
Winter storms may include snow, sleet, freezing rain, or a mix of
these wintry forms of precipitation. Blizzards, the most dangerous of
all winter storms, combine low temperatures, heavy snowfall, and
winds of at least 35 miles per hour, reducing visibility to only a few
yards. Ice storms occur when moisture falls and freezes immediately
upon impact on trees, power lines, communication towers, structures,
roads and other hard surfaces. Winter storms and ice storms can
down trees, cause widespread power outages, damage property, and
cause fatalities and injuries to human life.
HYDROLOGIC HAZARDS
Dam and Levee
Failure
Dam failure is the collapse, breach, or other failure of a dam structure
resulting in downstream flooding. In the event of a dam failure, the
energy of the water stored behind even a small dam is capable of
causing loss of life and severe property damage if development exists
downstream of the dam. Dam failure can result from natural events,
human-induced events, or a combination of the two. The most
common cause of dam failure is prolonged rainfall that produces
flooding. Failures due to other natural events such as hurricanes,
earthquakes or landslides are significant because there is generally
little or no advance warning.
Erosion Erosion is the gradual breakdown and movement of land due to both
physical and chemical processes of water, wind, and general
meteorological conditions. Natural, or geologic, erosion has occurred
since the Earth’s formation and continues at a very slow and uniform
rate each year.
HAZARD IDENTIFICATION
University of South Carolina Disaster Resistant University Plan
4:4
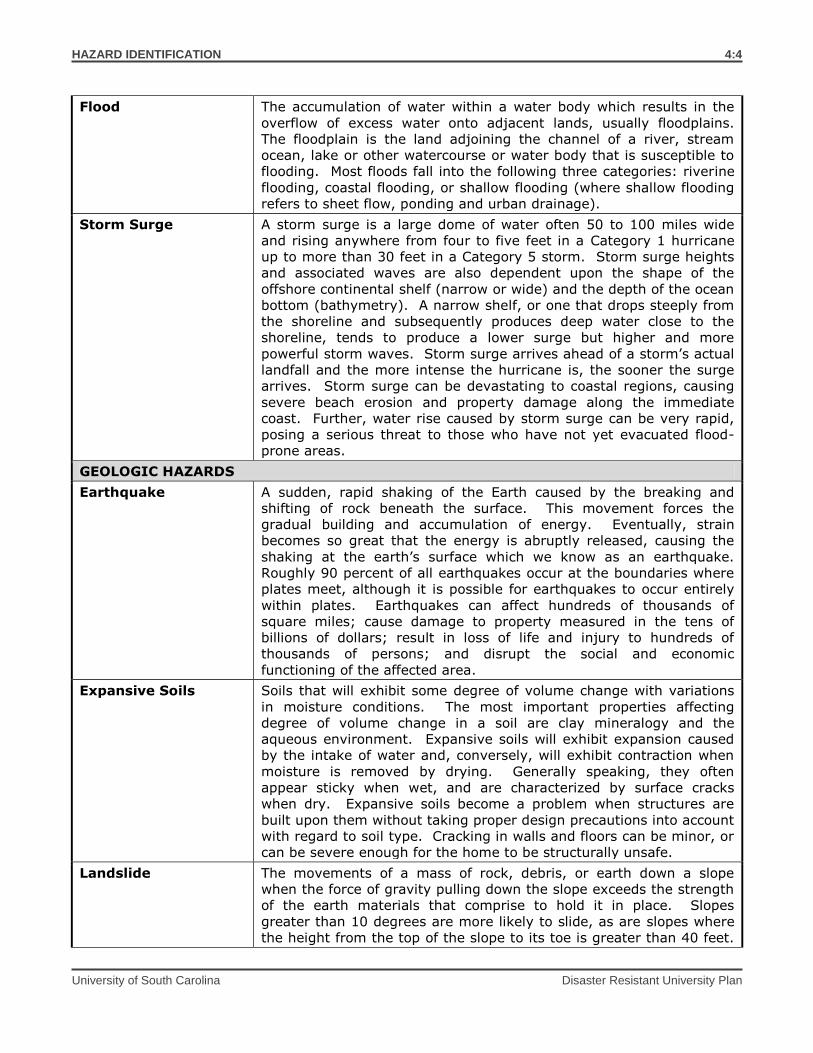
Flood The accumulation of water within a water body which results in the
overflow of excess water onto adjacent lands, usually floodplains.
The floodplain is the land adjoining the channel of a river, stream
ocean, lake or other watercourse or water body that is susceptible to
flooding. Most floods fall into the following three categories: riverine
flooding, coastal flooding, or shallow flooding (where shallow flooding
refers to sheet flow, ponding and urban drainage).
Storm Surge A storm surge is a large dome of water often 50 to 100 miles wide
and rising anywhere from four to five feet in a Category 1 hurricane
up to more than 30 feet in a Category 5 storm. Storm surge heights
and associated waves are also dependent upon the shape of the
offshore continental shelf (narrow or wide) and the depth of the ocean
bottom (bathymetry). A narrow shelf, or one that drops steeply from
the shoreline and subsequently produces deep water close to the
shoreline, tends to produce a lower surge but higher and more
powerful storm waves. Storm surge arrives ahead of a storm’s actual
landfall and the more intense the hurricane is, the sooner the surge
arrives. Storm surge can be devastating to coastal regions, causing
severe beach erosion and property damage along the immediate
coast. Further, water rise caused by storm surge can be very rapid,
posing a serious threat to those who have not yet evacuated flood-
prone areas.
GEOLOGIC HAZARDS
Earthquake A sudden, rapid shaking of the Earth caused by the breaking and
shifting of rock beneath the surface. This movement forces the
gradual building and accumulation of energy. Eventually, strain
becomes so great that the energy is abruptly released, causing the
shaking at the earth’s surface which we know as an earthquake.
Roughly 90 percent of all earthquakes occur at the boundaries where
plates meet, although it is possible for earthquakes to occur entirely
within plates. Earthquakes can affect hundreds of thousands of
square miles; cause damage to property measured in the tens of
billions of dollars; result in loss of life and injury to hundreds of
thousands of persons; and disrupt the social and economic
functioning of the affected area.
Expansive Soils Soils that will exhibit some degree of volume change with variations
in moisture conditions. The most important properties affecting
degree of volume change in a soil are clay mineralogy and the
aqueous environment. Expansive soils will exhibit expansion caused
by the intake of water and, conversely, will exhibit contraction when
moisture is removed by drying. Generally speaking, they often
appear sticky when wet, and are characterized by surface cracks
when dry. Expansive soils become a problem when structures are
built upon them without taking proper design precautions into account
with regard to soil type. Cracking in walls and floors can be minor, or
can be severe enough for the home to be structurally unsafe.
Landslide The movements of a mass of rock, debris, or earth down a slope
when the force of gravity pulling down the slope exceeds the strength
of the earth materials that comprise to hold it in place. Slopes
greater than 10 degrees are more likely to slide, as are slopes where
the height from the top of the slope to its toe is greater than 40 feet.
HAZARD IDENTIFICATION
University of South Carolina Disaster Resistant University Plan
4:5
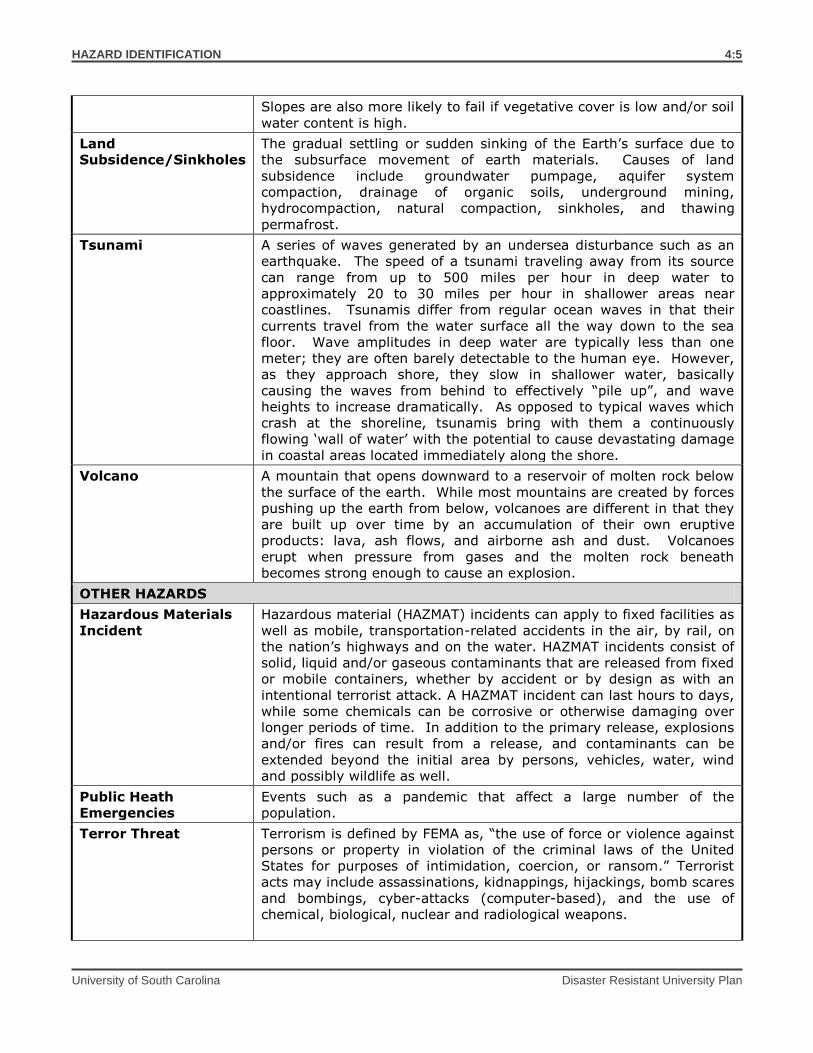
Slopes are also more likely to fail if vegetative cover is low and/or soil
water content is high.
Land
Subsidence/Sinkholes
The gradual settling or sudden sinking of the Earth’s surface due to
the subsurface movement of earth materials. Causes of land
subsidence include groundwater pumpage, aquifer system
compaction, drainage of organic soils, underground mining,
hydrocompaction, natural compaction, sinkholes, and thawing
permafrost.
Tsunami A series of waves generated by an undersea disturbance such as an
earthquake. The speed of a tsunami traveling away from its source
can range from up to 500 miles per hour in deep water to
approximately 20 to 30 miles per hour in shallower areas near
coastlines. Tsunamis differ from regular ocean waves in that their
currents travel from the water surface all the way down to the sea
floor. Wave amplitudes in deep water are typically less than one
meter; they are often barely detectable to the human eye. However,
as they approach shore, they slow in shallower water, basically
causing the waves from behind to effectively “pile up”, and wave
heights to increase dramatically. As opposed to typical waves which
crash at the shoreline, tsunamis bring with them a continuously
flowing ‘wall of water’ with the potential to cause devastating damage
in coastal areas located immediately along the shore.
Volcano A mountain that opens downward to a reservoir of molten rock below
the surface of the earth. While most mountains are created by forces
pushing up the earth from below, volcanoes are different in that they
are built up over time by an accumulation of their own eruptive
products: lava, ash flows, and airborne ash and dust. Volcanoes
erupt when pressure from gases and the molten rock beneath
becomes strong enough to cause an explosion.
OTHER HAZARDS
Hazardous Materials
Incident
Hazardous material (HAZMAT) incidents can apply to fixed facilities as
well as mobile, transportation-related accidents in the air, by rail, on
the nation’s highways and on the water. HAZMAT incidents consist of
solid, liquid and/or gaseous contaminants that are released from fixed
or mobile containers, whether by accident or by design as with an
intentional terrorist attack. A HAZMAT incident can last hours to days,
while some chemicals can be corrosive or otherwise damaging over
longer periods of time. In addition to the primary release, explosions
and/or fires can result from a release, and contaminants can be
extended beyond the initial area by persons, vehicles, water, wind
and possibly wildlife as well.
Public Heath
Emergencies
Events such as a pandemic that affect a large number of the
population.
Terror Threat Terrorism is defined by FEMA as, “the use of force or violence against
persons or property in violation of the criminal laws of the United
States for purposes of intimidation, coercion, or ransom.” Terrorist
acts may include assassinations, kidnappings, hijackings, bomb scares
and bombings, cyber-attacks (computer-based), and the use of
chemical, biological, nuclear and radiological weapons.
HAZARD IDENTIFICATION
University of South Carolina Disaster Resistant University Plan
4:6
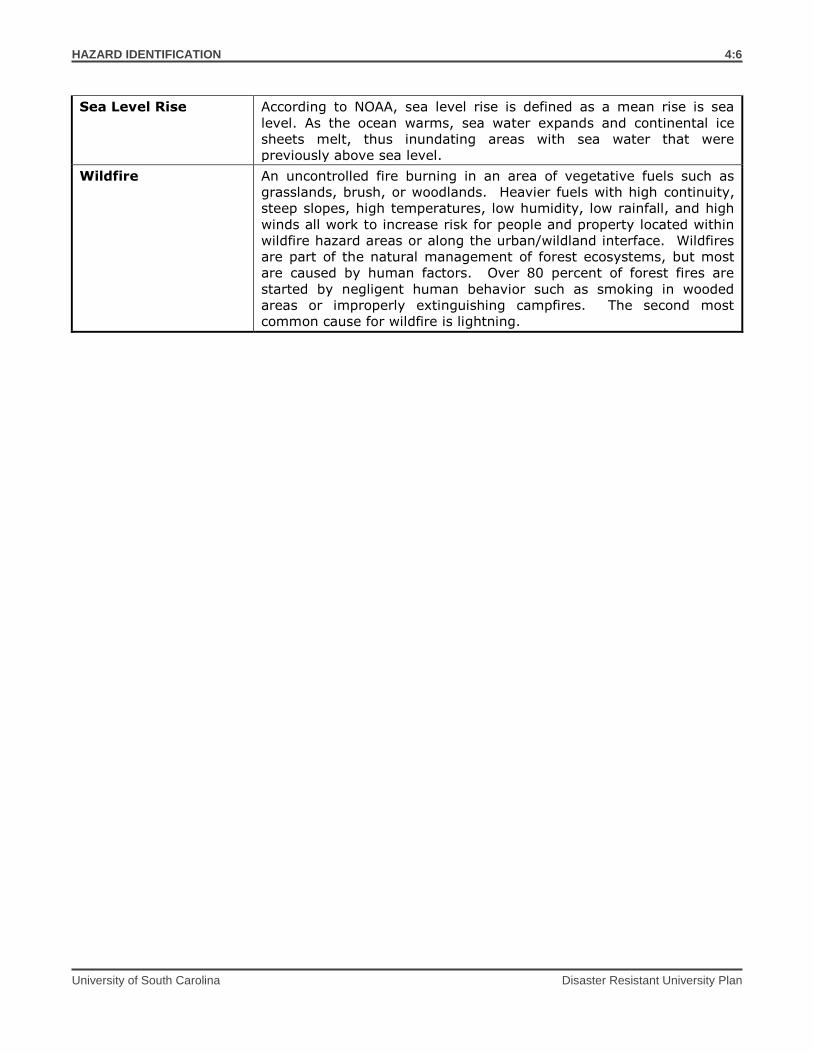
Sea Level Rise According to NOAA, sea level rise is defined as a mean rise is sea
level. As the ocean warms, sea water expands and continental ice
sheets melt, thus inundating areas with sea water that were
previously above sea level.
Wildfire An uncontrolled fire burning in an area of vegetative fuels such as
grasslands, brush, or woodlands. Heavier fuels with high continuity,
steep slopes, high temperatures, low humidity, low rainfall, and high
winds all work to increase risk for people and property located within
wildfire hazard areas or along the urban/wildland interface. Wildfires
are part of the natural management of forest ecosystems, but most
are caused by human factors. Over 80 percent of forest fires are
started by negligent human behavior such as smoking in wooded
areas or improperly extinguishing campfires. The second most
common cause for wildfire is lightning.
HAZARD IDENTIFICATION
University of South Carolina Disaster Resistant University Plan
4:7
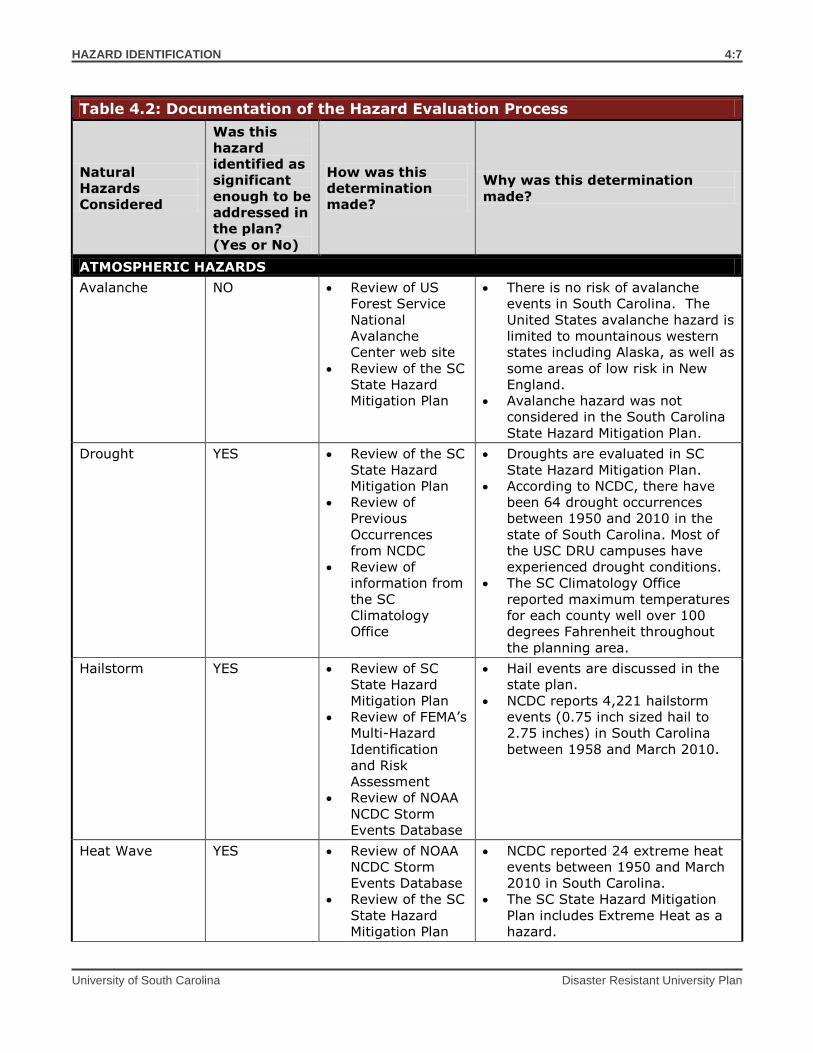
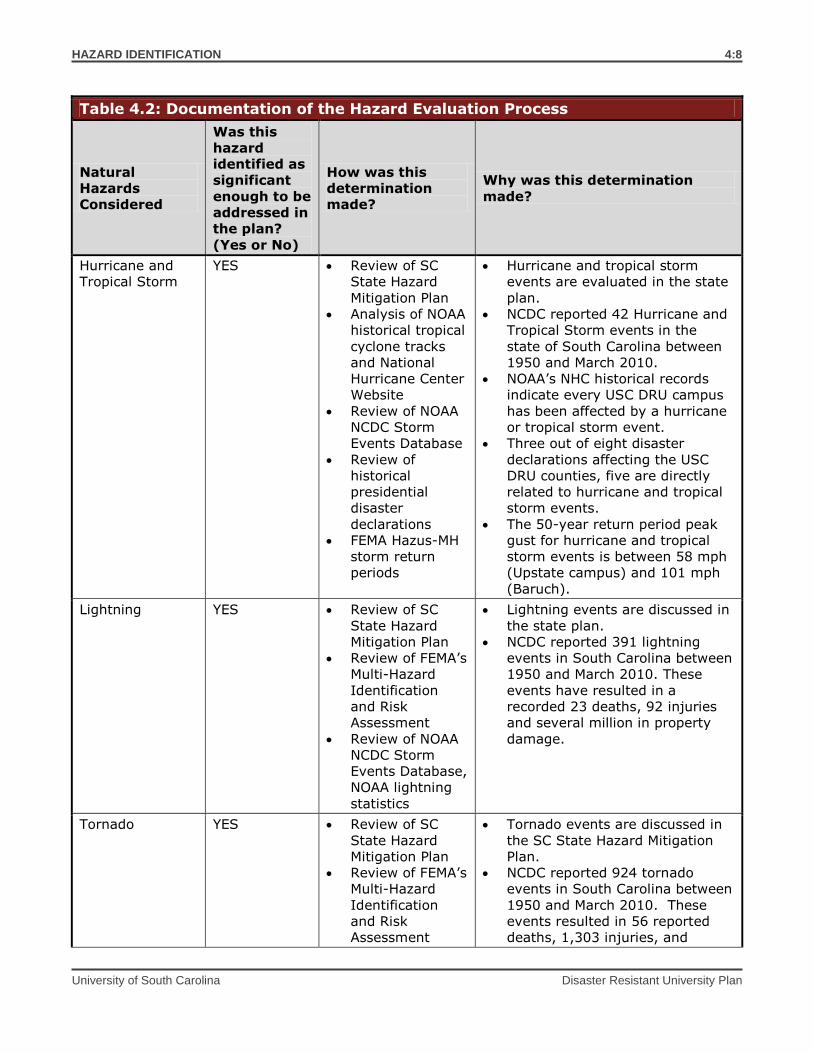
Table 4.2: Documentation of the Hazard Evaluation Process
Natural
Hazards
Considered
Was this
hazard
identified as
significant
enough to be
addressed in
the plan?
(Yes or No)
How was this
determination
made?
Why was this determination
made?
ATMOSPHERIC HAZARDS
Avalanche NO Review of US
Forest Service
National
Avalanche
Center web site
Review of the SC
State Hazard
Mitigation Plan
There is no risk of avalanche
events in South Carolina. The
United States avalanche hazard is
limited to mountainous western
states including Alaska, as well as
some areas of low risk in New
England.
Avalanche hazard was not
considered in the South Carolina
State Hazard Mitigation Plan.
Drought YES Review of the SC
State Hazard
Mitigation Plan
Review of
Previous
Occurrences
from NCDC
Review of
information from
the SC
Climatology
Office
Droughts are evaluated in SC
State Hazard Mitigation Plan.
According to NCDC, there have
been 64 drought occurrences
between 1950 and 2010 in the
state of South Carolina. Most of
the USC DRU campuses have
experienced drought conditions.
The SC Climatology Office
reported maximum temperatures
for each county well over 100
degrees Fahrenheit throughout
the planning area.
Hailstorm YES Review of SC
State Hazard
Mitigation Plan
Review of FEMA’s
Multi-Hazard
Identification
and Risk
Assessment
Review of NOAA
NCDC Storm
Events Database
Hail events are discussed in the
state plan.
NCDC reports 4,221 hailstorm
events (0.75 inch sized hail to
2.75 inches) in South Carolina
between 1958 and March 2010.
Heat Wave YES Review of NOAA
NCDC Storm
Events Database
Review of the SC
State Hazard
Mitigation Plan
NCDC reported 24 extreme heat
events between 1950 and March
2010 in South Carolina.
The SC State Hazard Mitigation
Plan includes Extreme Heat as a
hazard.
HAZARD IDENTIFICATION
University of South Carolina Disaster Resistant University Plan
4:8
Table 4.2: Documentation of the Hazard Evaluation Process
Natural
Hazards
Considered
Was this
hazard
identified as
significant
enough to be
addressed in
the plan?
(Yes or No)
How was this
determination
made?
Why was this determination
made?
Hurricane and
Tropical Storm
YES Review of SC
State Hazard
Mitigation Plan
Analysis of NOAA
historical tropical
cyclone tracks
and National
Hurricane Center
Website
Review of NOAA
NCDC Storm
Events Database
Review of
historical
presidential
disaster
declarations
FEMA Hazus-MH
storm return
periods
Hurricane and tropical storm
events are evaluated in the state
plan.
NCDC reported 42 Hurricane and
Tropical Storm events in the
state of South Carolina between
1950 and March 2010.
NOAA’s NHC historical records
indicate every USC DRU campus
has been affected by a hurricane
or tropical storm event.
Three out of eight disaster
declarations affecting the USC
DRU counties, five are directly
related to hurricane and tropical
storm events.
The 50-year return period peak
gust for hurricane and tropical
storm events is between 58 mph
(Upstate campus) and 101 mph
(Baruch).
Lightning YES Review of SC
State Hazard
Mitigation Plan
Review of FEMA’s
Multi-Hazard
Identification
and Risk
Assessment
Review of NOAA
NCDC Storm
Events Database,
NOAA lightning
statistics
Lightning events are discussed in
the state plan.
NCDC reported 391 lightning
events in South Carolina between
1950 and March 2010. These
events have resulted in a
recorded 23 deaths, 92 injuries
and several million in property
damage.
Tornado YES Review of SC
State Hazard
Mitigation Plan
Review of FEMA’s
Multi-Hazard
Identification
and Risk
Assessment
Tornado events are discussed in
the SC State Hazard Mitigation
Plan.
NCDC reported 924 tornado
events in South Carolina between
1950 and March 2010. These
events resulted in 56 reported
deaths, 1,303 injuries, and
HAZARD IDENTIFICATION
University of South Carolina Disaster Resistant University Plan
4:9
Table 4.2: Documentation of the Hazard Evaluation Process
Natural
Hazards
Considered
Was this
hazard
identified as
significant
enough to be
addressed in
the plan?
(Yes or No)
How was this
determination
made?
Why was this determination
made?
Review of NOAA
NCDC Storm
Events Database
several million in property
damage.
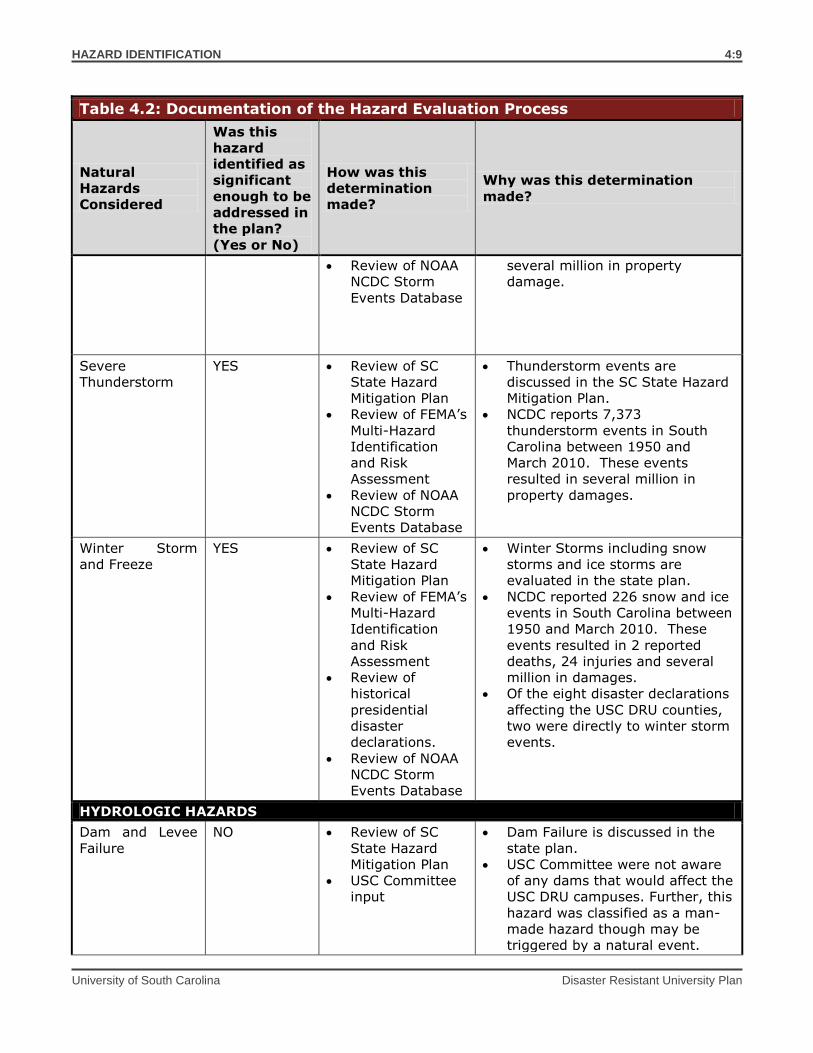
Severe
Thunderstorm
YES Review of SC
State Hazard
Mitigation Plan
Review of FEMA’s
Multi-Hazard
Identification
and Risk
Assessment
Review of NOAA
NCDC Storm
Events Database
Thunderstorm events are
discussed in the SC State Hazard
Mitigation Plan.
NCDC reports 7,373
thunderstorm events in South
Carolina between 1950 and
March 2010. These events
resulted in several million in
property damages.
Winter Storm
and Freeze
YES Review of SC
State Hazard
Mitigation Plan
Review of FEMA’s
Multi-Hazard
Identification
and Risk
Assessment
Review of
historical
presidential
disaster
declarations.
Review of NOAA
NCDC Storm
Events Database
Winter Storms including snow
storms and ice storms are
evaluated in the state plan.
NCDC reported 226 snow and ice
events in South Carolina between
1950 and March 2010. These
events resulted in 2 reported
deaths, 24 injuries and several
million in damages.
Of the eight disaster declarations
affecting the USC DRU counties,
two were directly to winter storm
events.
HYDROLOGIC HAZARDS
Dam and Levee
Failure
NO Review of SC
State Hazard
Mitigation Plan
USC Committee
input
Dam Failure is discussed in the
state plan.
USC Committee were not aware
of any dams that would affect the
USC DRU campuses. Further, this
hazard was classified as a man-
made hazard though may be
triggered by a natural event.
HAZARD IDENTIFICATION
University of South Carolina Disaster Resistant University Plan
4:10
Table 4.2: Documentation of the Hazard Evaluation Process
Natural
Hazards
Considered
Was this
hazard
identified as
significant
enough to be
addressed in
the plan?
(Yes or No)
How was this
determination
made?
Why was this determination
made?
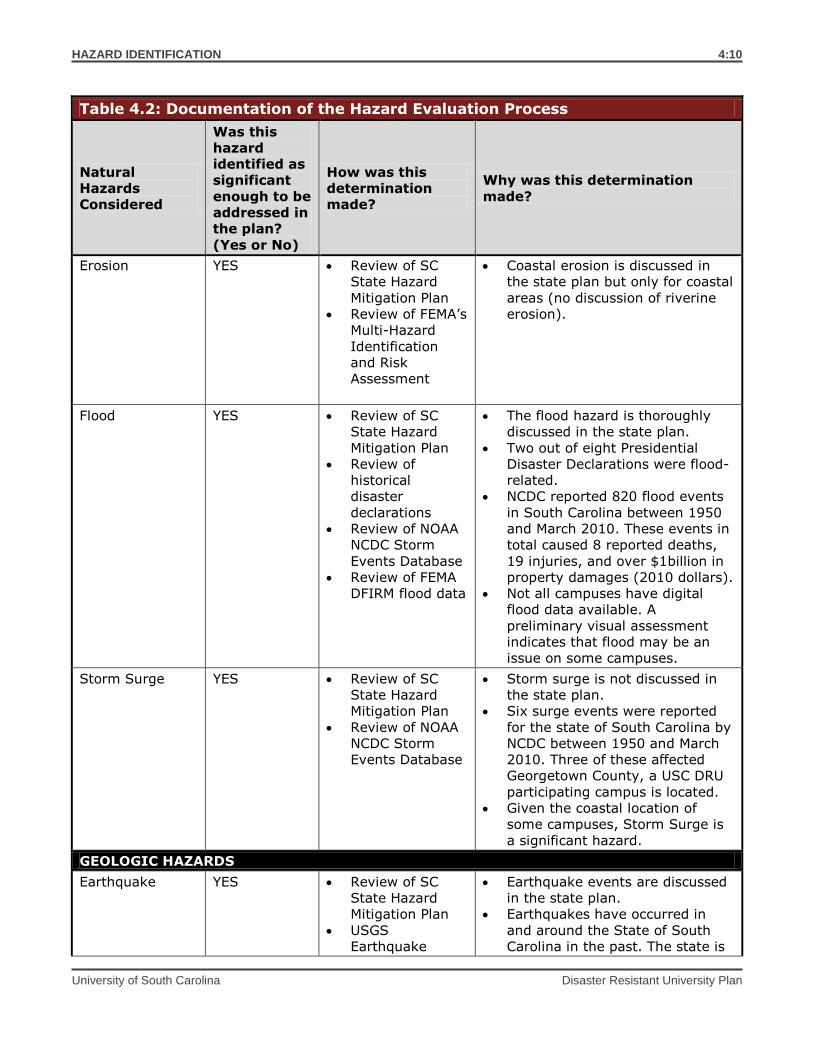
Erosion YES Review of SC
State Hazard
Mitigation Plan
Review of FEMA’s
Multi-Hazard
Identification
and Risk
Assessment
Coastal erosion is discussed in
the state plan but only for coastal
areas (no discussion of riverine
erosion).
Flood YES Review of SC
State Hazard
Mitigation Plan
Review of
historical
disaster
declarations
Review of NOAA
NCDC Storm
Events Database
Review of FEMA
DFIRM flood data
The flood hazard is thoroughly
discussed in the state plan.
Two out of eight Presidential
Disaster Declarations were flood-
related.
NCDC reported 820 flood events
in South Carolina between 1950
and March 2010. These events in
total caused 8 reported deaths,
19 injuries, and over $1billion in
property damages (2010 dollars).
Not all campuses have digital
flood data available. A
preliminary visual assessment
indicates that flood may be an
issue on some campuses.
Storm Surge YES Review of SC
State Hazard
Mitigation Plan
Review of NOAA
NCDC Storm
Events Database
Storm surge is not discussed in
the state plan.
Six surge events were reported
for the state of South Carolina by
NCDC between 1950 and March
2010. Three of these affected
Georgetown County, a USC DRU
participating campus is located.
Given the coastal location of
some campuses, Storm Surge is
a significant hazard.
GEOLOGIC HAZARDS
Earthquake YES Review of SC
State Hazard
Mitigation Plan
USGS
Earthquake
Earthquake events are discussed
in the state plan.
Earthquakes have occurred in
and around the State of South
Carolina in the past. The state is
HAZARD IDENTIFICATION
University of South Carolina Disaster Resistant University Plan
4:11
Table 4.2: Documentation of the Hazard Evaluation Process
Natural
Hazards
Considered
Was this
hazard
identified as
significant
enough to be
addressed in
the plan?
(Yes or No)
How was this
determination
made?
Why was this determination
made?
Hazards Program
web site
Review of the
National
Geophysical Data
Center
Review of FEMA’s
Multi-Hazard
Identification
and Risk
Assessment
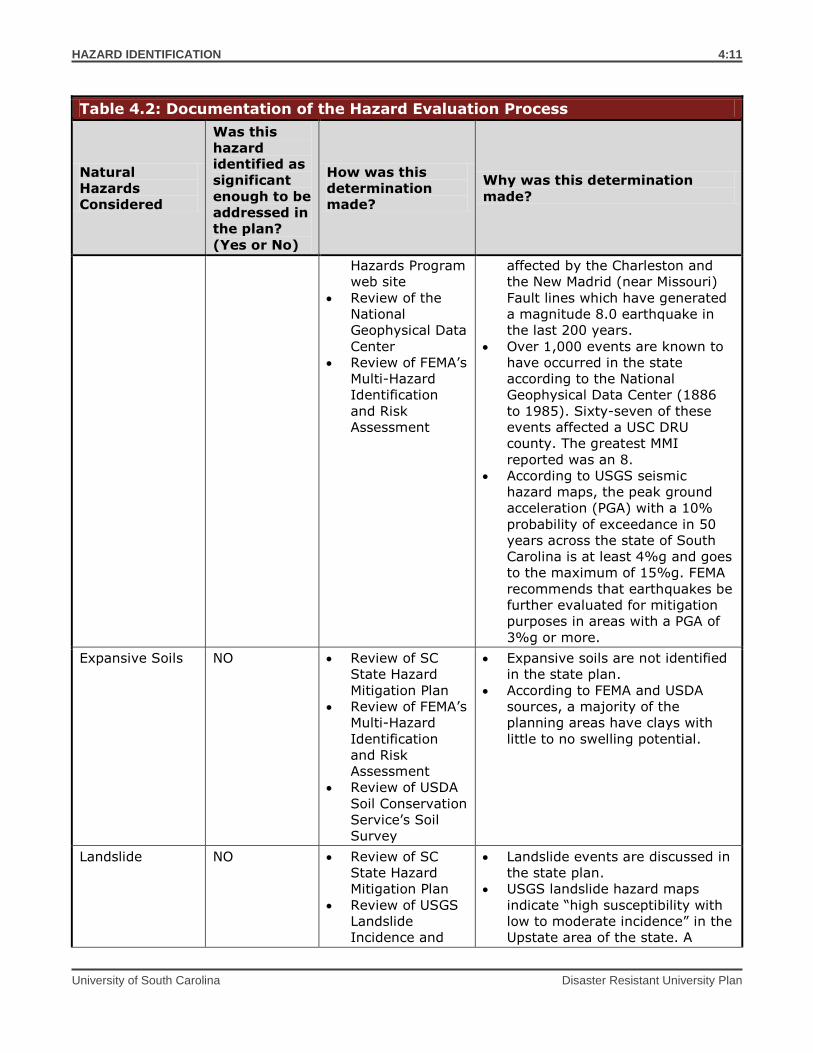
affected by the Charleston and
the New Madrid (near Missouri)
Fault lines which have generated
a magnitude 8.0 earthquake in
the last 200 years.
Over 1,000 events are known to
have occurred in the state
according to the National
Geophysical Data Center (1886
to 1985). Sixty-seven of these
events affected a USC DRU
county. The greatest MMI
reported was an 8.
According to USGS seismic
hazard maps, the peak ground
acceleration (PGA) with a 10%
probability of exceedance in 50
years across the state of South
Carolina is at least 4%g and goes
to the maximum of 15%g. FEMA
recommends that earthquakes be
further evaluated for mitigation
purposes in areas with a PGA of
3%g or more.
Expansive Soils NO Review of SC
State Hazard
Mitigation Plan
Review of FEMA’s
Multi-Hazard
Identification
and Risk
Assessment
Review of USDA
Soil Conservation
Service’s Soil
Survey
Expansive soils are not identified
in the state plan.
According to FEMA and USDA
sources, a majority of the
planning areas have clays with
little to no swelling potential.
Landslide NO Review of SC
State Hazard
Mitigation Plan
Review of USGS
Landslide
Incidence and
Landslide events are discussed in
the state plan.
USGS landslide hazard maps
indicate “high susceptibility with
low to moderate incidence” in the
Upstate area of the state. A
HAZARD IDENTIFICATION
University of South Carolina Disaster Resistant University Plan
4:12
Table 4.2: Documentation of the Hazard Evaluation Process
Natural
Hazards
Considered
Was this
hazard
identified as
significant
enough to be
addressed in
the plan?
(Yes or No)
How was this
determination
made?
Why was this determination
made?
Susceptibility
Hazard Map
Review of the
South Carolina
Geological
Survey (SCGS)
majority of the state received a
low incidence rating.
Information provided by SCGS
indicated that no major landslide
events have occurred in the state
(no loss of life or property
damage) and no recording
mechanisms are in place to
capture minor events.
Land
Subsidence/
Sinkholes
NO Review of SC
State Hazard
Mitigation Plan
The state plan indicates that
there are no known sinkhole
occurrences in the state.
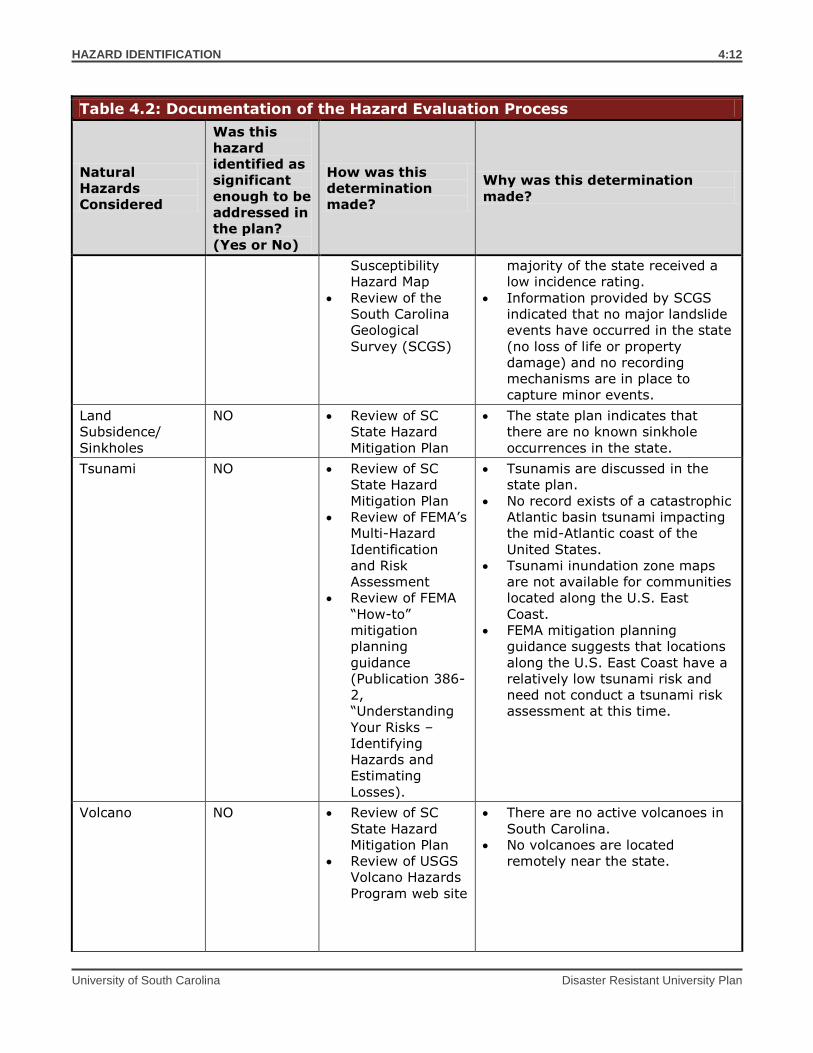
Tsunami NO Review of SC
State Hazard
Mitigation Plan
Review of FEMA’s
Multi-Hazard
Identification
and Risk
Assessment
Review of FEMA
“How-to”
mitigation
planning
guidance
(Publication 386-
2,
“Understanding
Your Risks –
Identifying
Hazards and
Estimating
Losses).
Tsunamis are discussed in the
state plan.
No record exists of a catastrophic
Atlantic basin tsunami impacting
the mid-Atlantic coast of the
United States.
Tsunami inundation zone maps
are not available for communities
located along the U.S. East
Coast.
FEMA mitigation planning
guidance suggests that locations
along the U.S. East Coast have a
relatively low tsunami risk and
need not conduct a tsunami risk
assessment at this time.
Volcano NO Review of SC
State Hazard
Mitigation Plan
Review of USGS
Volcano Hazards
Program web site
There are no active volcanoes in
South Carolina.
No volcanoes are located
remotely near the state.
HAZARD IDENTIFICATION
University of South Carolina Disaster Resistant University Plan
4:13
Table 4.2: Documentation of the Hazard Evaluation Process
Natural
Hazards
Considered
Was this
hazard
identified as
significant
enough to be
addressed in
the plan?
(Yes or No)
How was this
determination
made?
Why was this determination
made?
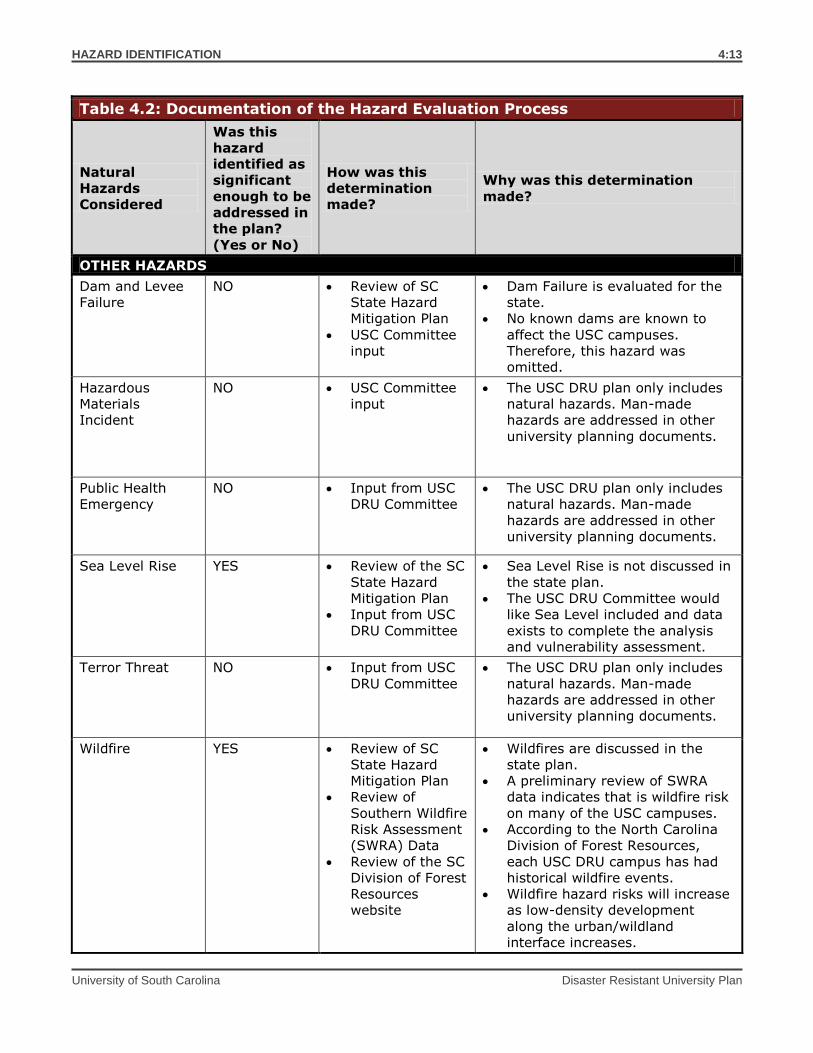
OTHER HAZARDS
Dam and Levee
Failure
NO Review of SC
State Hazard
Mitigation Plan
USC Committee
input
Dam Failure is evaluated for the
state.
No known dams are known to
affect the USC campuses.
Therefore, this hazard was
omitted.
Hazardous
Materials
Incident
NO USC Committee
input
The USC DRU plan only includes
natural hazards. Man-made
hazards are addressed in other
university planning documents.
Public Health
Emergency
NO Input from USC
DRU Committee
The USC DRU plan only includes
natural hazards. Man-made
hazards are addressed in other
university planning documents.
Sea Level Rise YES Review of the SC
State Hazard
Mitigation Plan
Input from USC
DRU Committee
Sea Level Rise is not discussed in
the state plan.
The USC DRU Committee would
like Sea Level included and data
exists to complete the analysis
and vulnerability assessment.
Terror Threat NO Input from USC
DRU Committee
The USC DRU plan only includes
natural hazards. Man-made
hazards are addressed in other
university planning documents.
Wildfire YES Review of SC
State Hazard
Mitigation Plan
Review of
Southern Wildfire
Risk Assessment
(SWRA) Data
Review of the SC
Division of Forest
Resources
website
Wildfires are discussed in the
state plan.
A preliminary review of SWRA
data indicates that is wildfire risk
on many of the USC campuses.
According to the North Carolina
Division of Forest Resources,
each USC DRU campus has had
historical wildfire events.
Wildfire hazard risks will increase
as low-density development
along the urban/wildland
interface increases.
HAZARD IDENTIFICATION
University of South Carolina Disaster Resistant University Plan
4:14
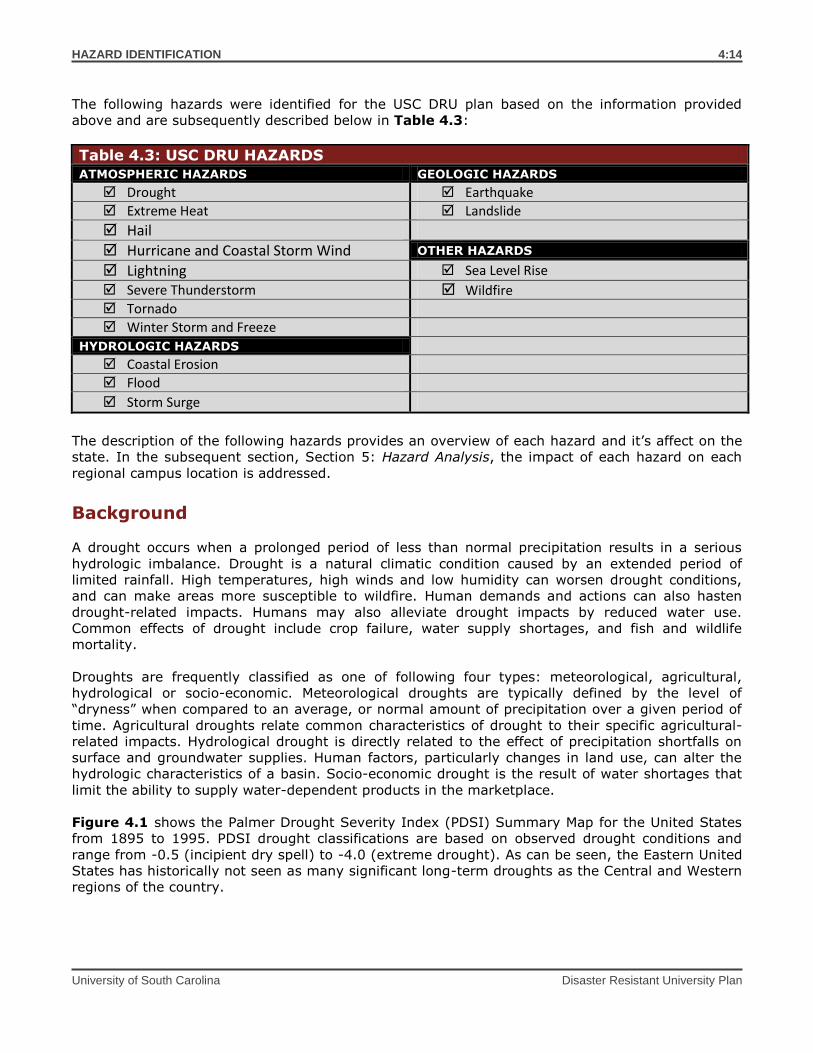
The following hazards were identified for the USC DRU plan based on the information provided
above and are subsequently described below in Table 4.3:
Table 4.3: USC DRU HAZARDS ATMOSPHERIC HAZARDS GEOLOGIC HAZARDS
Drought Earthquake
Extreme Heat Landslide
Hail
Hurricane and Coastal Storm Wind OTHER HAZARDS
Lightning Sea Level Rise
Severe Thunderstorm Wildfire Tornado
Winter Storm and Freeze
HYDROLOGIC HAZARDS
Coastal Erosion
Flood
Storm Surge
The description of the following hazards provides an overview of each hazard and it’s affect on the
state. In the subsequent section, Section 5: Hazard Analysis, the impact of each hazard on each
regional campus location is addressed.
Background
A drought occurs when a prolonged period of less than normal precipitation results in a serious
hydrologic imbalance. Drought is a natural climatic condition caused by an extended period of
limited rainfall. High temperatures, high winds and low humidity can worsen drought conditions,
and can make areas more susceptible to wildfire. Human demands and actions can also hasten
drought-related impacts. Humans may also alleviate drought impacts by reduced water use.
Common effects of drought include crop failure, water supply shortages, and fish and wildlife
mortality.
Droughts are frequently classified as one of following four types: meteorological, agricultural,
hydrological or socio-economic. Meteorological droughts are typically defined by the level of
“dryness” when compared to an average, or normal amount of precipitation over a given period of
time. Agricultural droughts relate common characteristics of drought to their specific agricultural-
related impacts. Hydrological drought is directly related to the effect of precipitation shortfalls on
surface and groundwater supplies. Human factors, particularly changes in land use, can alter the
hydrologic characteristics of a basin. Socio-economic drought is the result of water shortages that
limit the ability to supply water-dependent products in the marketplace.
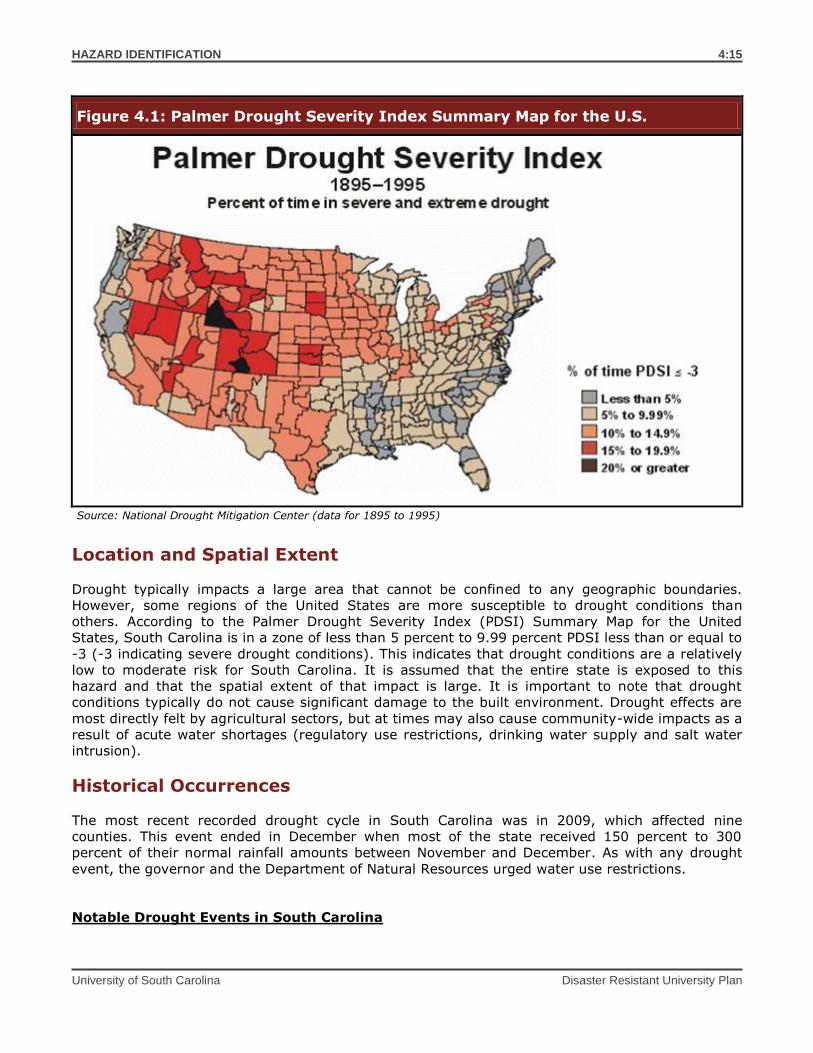
Figure 4.1 shows the Palmer Drought Severity Index (PDSI) Summary Map for the United States
from 1895 to 1995. PDSI drought classifications are based on observed drought conditions and
range from -0.5 (incipient dry spell) to -4.0 (extreme drought). As can be seen, the Eastern United
States has historically not seen as many significant long-term droughts as the Central and Western
regions of the country.
HAZARD IDENTIFICATION
University of South Carolina Disaster Resistant University Plan
4:15
Figure 4.1: Palmer Drought Severity Index Summary Map for the U.S.
Source: National Drought Mitigation Center (data for 1895 to 1995)
Location and Spatial Extent
Drought typically impacts a large area that cannot be confined to any geographic boundaries.
However, some regions of the United States are more susceptible to drought conditions than
others. According to the Palmer Drought Severity Index (PDSI) Summary Map for the United
States, South Carolina is in a zone of less than 5 percent to 9.99 percent PDSI less than or equal to
-3 (-3 indicating severe drought conditions). This indicates that drought conditions are a relatively
low to moderate risk for South Carolina. It is assumed that the entire state is exposed to this
hazard and that the spatial extent of that impact is large. It is important to note that drought
conditions typically do not cause significant damage to the built environment. Drought effects are
most directly felt by agricultural sectors, but at times may also cause community-wide impacts as a
result of acute water shortages (regulatory use restrictions, drinking water supply and salt water
intrusion).
Historical Occurrences
The most recent recorded drought cycle in South Carolina was in 2009, which affected nine
counties. This event ended in December when most of the state received 150 percent to 300
percent of their normal rainfall amounts between November and December. As with any drought
event, the governor and the Department of Natural Resources urged water use restrictions.
Notable Drought Events in South Carolina
HAZARD IDENTIFICATION
University of South Carolina Disaster Resistant University Plan
4:16
February through November 1925: The drought of 1925 caused the state to experience rainfall
deficits reaching 18.23 inches. The growing season alone had a recorded 12.41-inch rain deficit.
Livestock water was scarce, deep wells went dry and hydroelectric power was non-existent.
January through December 1954: Total statewide precipitation for that year was a mere 32.96
inches, which set the current record for driest year ever recorded in the state. An excessively hot
summer only exacerbated its impact. According to National Weather Service reports, the crop yield
was only 10 percent of its 10-year average production rate.
May through August 1993: Many locations in South Carolina broke records during the 1993
drought. For example, in July of 1993, Greenville-Spartanburg Airport recorded the hottest and
driest month on record. Nine daily record high temperatures were also set at the Greenville-
Spartanburg Airport during July 1993. Only 0.75" of rain was recorded during July 1993 making it
the driest July on record since 0.80'" in July 1977. Similar records were set at locations around the
state. The drought and record heat cost the State a total of $2251 million crop losses, including
$63.9 million for corn, $55.1 million for vegetables and fruits, $47.2 million for tobacco, $31.7
million for cotton and $27.8 million for soybeans. The drought, which started at the height of the
crop growing season in May and June, devastated South Carolina pastures and hay production. The
total loss for livestock, hay and pasture was estimated at $34.7 million.
March through May, 1995: Below normal rainfall from March through May reduced the potential
wheat yield approximately 30 percent, causing an estimated $20 million in crop damages and
losses. Water use was restricted at a few locations in the southeastern part of state.
1998–2002. The drought resulted in significantly reduced streamflows across the state. The
hydrologic-drought impacted water supplies, irrigation capacity and many lake-related businesses,
including golf courses. In addition, the drought caused numerous agricultural problems. For
example, the drought significantly contributed to the southern pine beetle epidemic. Trees
weakened by drought are more susceptible to the tree-killing beetles, which significantly increased
wildfire vulnerability. Agricultural impacts range from limited water for livestock, reduced feed
crops, and lowered crop quality. In 1998 and 2002, a natural disaster was declared for most of
South Carolina’s 46 counties by the United States Department of Agriculture.
Recent Drought Activity
According to NCDC records, there were forty-six drought events in South Carolina since 2001. No
fatalities, injuries, property, or crop damage were associated with these mild to moderate drought
events.
Probability of Future Events It can be expected that future drought events will continue to affect the state. Probability will vary
by campus location; thus an analysis of each campus is performed. The specific probability for each
campus can be found in Section 5: Hazard Analysis.
1 Clemson University Cooperative Extension Service
HAZARD IDENTIFICATION
University of South Carolina Disaster Resistant University Plan
4:17
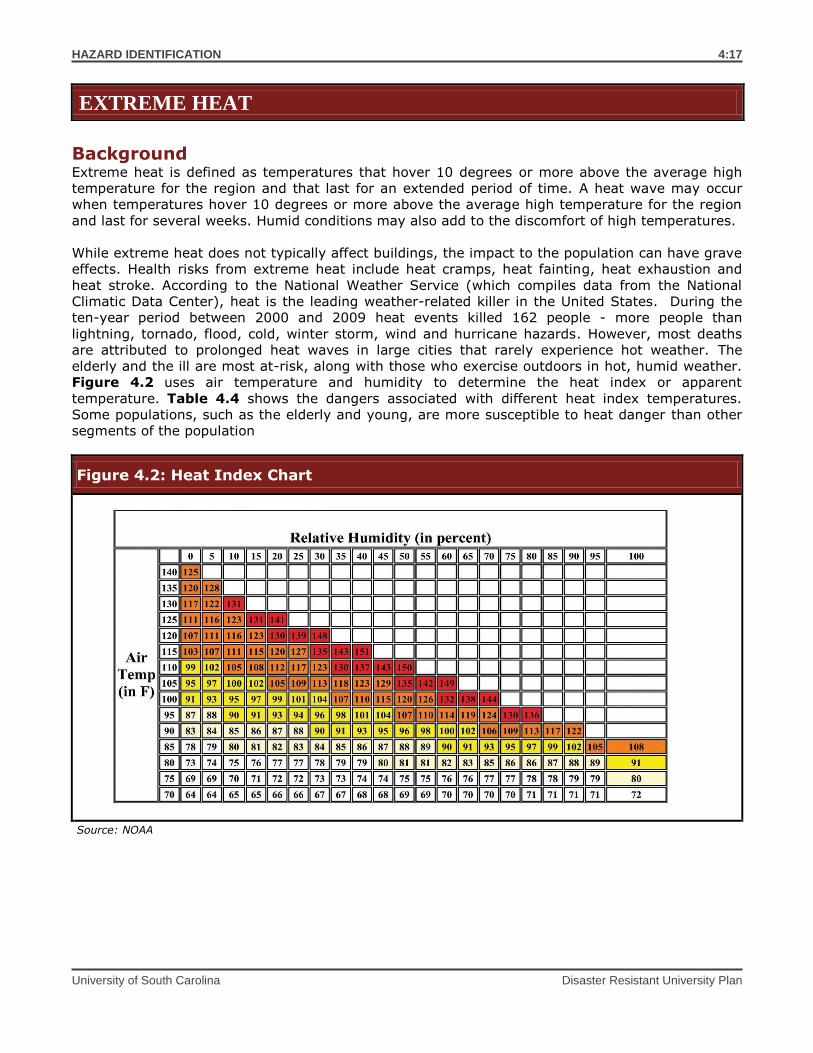
Background Extreme heat is defined as temperatures that hover 10 degrees or more above the average high
temperature for the region and that last for an extended period of time. A heat wave may occur
when temperatures hover 10 degrees or more above the average high temperature for the region
and last for several weeks. Humid conditions may also add to the discomfort of high temperatures.
While extreme heat does not typically affect buildings, the impact to the population can have grave
effects. Health risks from extreme heat include heat cramps, heat fainting, heat exhaustion and
heat stroke. According to the National Weather Service (which compiles data from the National
Climatic Data Center), heat is the leading weather-related killer in the United States. During the
ten-year period between 2000 and 2009 heat events killed 162 people - more people than
lightning, tornado, flood, cold, winter storm, wind and hurricane hazards. However, most deaths
are attributed to prolonged heat waves in large cities that rarely experience hot weather. The
elderly and the ill are most at-risk, along with those who exercise outdoors in hot, humid weather.
Figure 4.2 uses air temperature and humidity to determine the heat index or apparent
temperature. Table 4.4 shows the dangers associated with different heat index temperatures.
Some populations, such as the elderly and young, are more susceptible to heat danger than other
segments of the population
Figure 4.2: Heat Index Chart
Source: NOAA
EXTREME HEAT
HAZARD IDENTIFICATION
University of South Carolina Disaster Resistant University Plan
4:18
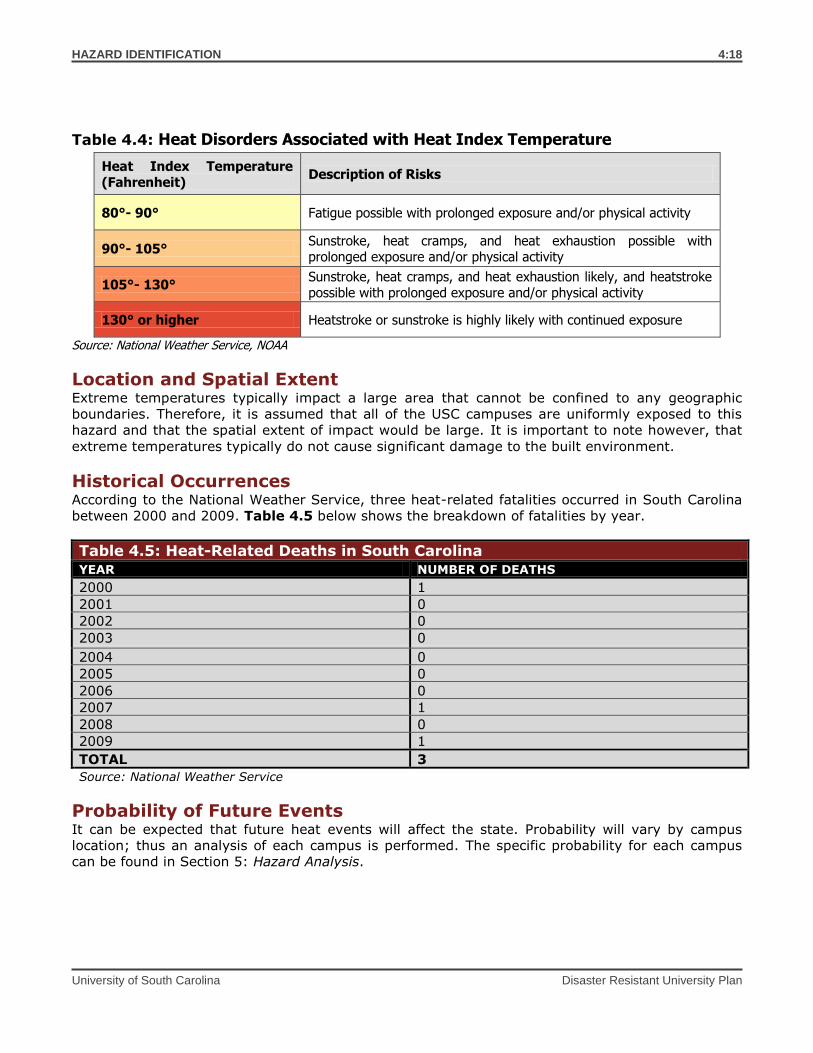
Table 4.4: Heat Disorders Associated with Heat Index Temperature
Heat Index Temperature (Fahrenheit)
Description of Risks
80°- 90° Fatigue possible with prolonged exposure and/or physical activity
90°- 105° Sunstroke, heat cramps, and heat exhaustion possible with prolonged exposure and/or physical activity
105°- 130° Sunstroke, heat cramps, and heat exhaustion likely, and heatstroke possible with prolonged exposure and/or physical activity
130° or higher Heatstroke or sunstroke is highly likely with continued exposure
Source: National Weather Service, NOAA
Location and Spatial Extent Extreme temperatures typically impact a large area that cannot be confined to any geographic
boundaries. Therefore, it is assumed that all of the USC campuses are uniformly exposed to this
hazard and that the spatial extent of impact would be large. It is important to note however, that
extreme temperatures typically do not cause significant damage to the built environment.
Historical Occurrences According to the National Weather Service, three heat-related fatalities occurred in South Carolina
between 2000 and 2009. Table 4.5 below shows the breakdown of fatalities by year.
Table 4.5: Heat-Related Deaths in South Carolina YEAR NUMBER OF DEATHS 2000 1
2001 0
2002 0
2003 0
2004 0
2005 0
2006 0
2007 1
2008 0
2009 1
TOTAL 3
Source: National Weather Service
Probability of Future Events It can be expected that future heat events will affect the state. Probability will vary by campus
location; thus an analysis of each campus is performed. The specific probability for each campus
can be found in Section 5: Hazard Analysis.
HAZARD IDENTIFICATION
University of South Carolina Disaster Resistant University Plan
4:19
Background Hailstorms are a potentially damaging outgrowth of severe thunderstorms. Early in the
developmental stages of a hailstorm, ice crystals form within a low-pressure front due to the rapid
rising of warm air into the upper atmosphere and the subsequent cooling of the air mass. Frozen
droplets gradually accumulate on the ice crystals until they develop to a sufficient weight and fall
as precipitation. Hail typically takes the form of spheres or irregularly-shaped masses greater than
0.75 inches in diameter. The size of hailstones is a direct function of the size and severity of the
storm. High velocity updraft winds are required to keep hail in suspension in thunderclouds. The
strength of the updraft is a function of the intensity of heating at the Earth’s surface. Higher
temperature gradients relative to elevation above the surface result in increased suspension time
and hailstone size.
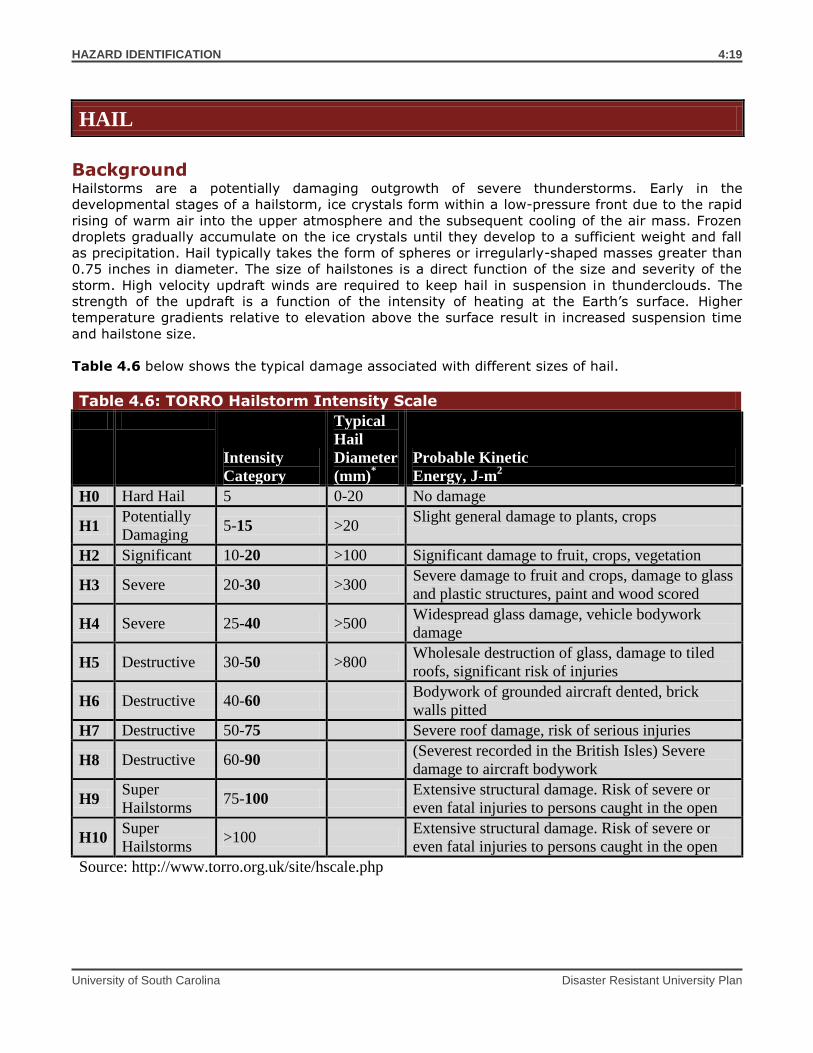
Table 4.6 below shows the typical damage associated with different sizes of hail.
Table 4.6: TORRO Hailstorm Intensity Scale
Intensity
Category
Typical
Hail
Diameter
(mm)*
Probable Kinetic
Energy, J-m2 Typical Damage Impacts
H0 Hard Hail 5 0-20 No damage
H1 Potentially
Damaging 5-15 >20
Slight general damage to plants, crops
H2 Significant 10-20 >100 Significant damage to fruit, crops, vegetation
H3 Severe 20-30 >300 Severe damage to fruit and crops, damage to glass
and plastic structures, paint and wood scored
H4 Severe 25-40 >500 Widespread glass damage, vehicle bodywork
damage
H5 Destructive 30-50 >800 Wholesale destruction of glass, damage to tiled
roofs, significant risk of injuries
H6 Destructive 40-60 Bodywork of grounded aircraft dented, brick
walls pitted
H7 Destructive 50-75 Severe roof damage, risk of serious injuries
H8 Destructive 60-90 (Severest recorded in the British Isles) Severe
damage to aircraft bodywork
H9 Super
Hailstorms 75-100
Extensive structural damage. Risk of severe or
even fatal injuries to persons caught in the open
H10 Super
Hailstorms >100
Extensive structural damage. Risk of severe or
even fatal injuries to persons caught in the open
Source: http://www.torro.org.uk/site/hscale.php
HAIL
HAZARD IDENTIFICATION
University of South Carolina Disaster Resistant University Plan
4:20
Location and Spatial Extent Hailstorms frequently accompany thunderstorms, so their locations and spatial extents coincide.
Thunderstorms are atmospheric in nature and thus threaten the entire state of South Carolina.
Therefore, hail has the potential to impact the entire state as well.
Historical Occurrences According to the National Climatic Data Center, 4,221 recorded hail events have affected South
Carolina since 1950.2 Events specific to each campus location can be found in Section 5: Hazard
Analysis.
Notable South Carolina Hail Events
April 24, 1999: A super cell thunderstorm moved through Saluda County and produced hail, some
as large as baseballs, along its entire path. Homes, buildings, farm equipment, vehicles, and crops
were damaged. The thunderstorm, including the associated hail, caused damages across a three-
mile wide swath. Property damages were estimated to be $2 million, crop damages were estimated
to be $2 million, and two injuries were reported.
August 20, 1999: Severe thunderstorms developed across the Upstate, causing damaging
straight-line winds and hail. Dime to ping-pong ball size hail was reported from near Stumphouse
Mountain to Walhalla. Various reports of hail ranging from dime to quarter size were reported from
Oconee, Anderson, Laurens and Greenville counties. Golf ball to grapefruit-size hail was reported in
Greenville and Spartanburg counties. Roof damage, as well as damage to vehicles and windows,
was widely reported. Damage estimates, considered to be quite conservative, were approximately
$1 million.
May 25, 2000: A severe thunderstorm caused straight-line winds and dime size hail in Darlington,
as well as 2-inch hailstones to the south of the city. Property damage was estimated at $150,000.
The County Agricultural Service reported several areas of crop damage near Highway 401,
estimated at $10,000. In Florence, a severe thunderstorm caused large hail and wind gusts
estimated at over 80 mph. The largest hail size was estimated at over four inches in diameter,
causing extensive damage to roof and siding. Approximately 2,000 homes were damaged, with
repair costs exceeding 6 million dollars. The storm knocked out power to over 20,000 residences.
Two injuries were reported due to broken glass impacted by hail.
Probability of Future Events It can be expected that future hail events will continue to cause minor damages to property and
vehicles throughout the state. Probability will vary by campus location; thus an analysis of each
campus is performed. The specific probability for each campus can be found in Section 5: Hazard
Analysis.
2 These hail events are only inclusive of those reported by the National Climatic Data Center (NCDC). It is likely that additional hail events have affected the state of South Carolina. As additional local data becomes available, this hazard profile will be amended.
HAZARD IDENTIFICATION
University of South Carolina Disaster Resistant University Plan
4:21
Background Hurricanes and tropical storms are classified as cyclones and defined as any closed circulation
developing around a low-pressure center in which the winds rotate counter-clockwise in the
Northern Hemisphere (or clockwise in the Southern Hemisphere) and whose diameter averages 10
to 30 miles across. A tropical cyclone refers to any such circulation that develops over tropical
waters. Tropical cyclones act as a “safety-valve,” limiting the continued build-up of heat and
energy in tropical regions by maintaining the atmospheric heat and moisture balance between the
tropics and the pole-ward latitudes. The primary damaging forces associated with these storms are
high-level sustained winds, heavy precipitation and tornadoes. Coastal areas are also vulnerable to
the additional forces of storm surge, wind-driven waves and tidal flooding which can be more
destructive than cyclone wind.
The key energy source for a tropical cyclone is the release of latent heat from the condensation of
warm water. Their formation requires a low-pressure disturbance, warm sea surface temperature,
rotational force from the spinning of the earth and the absence of wind shear in the lowest 50,000
feet of the atmosphere. The majority of hurricanes and tropical storms form in the Atlantic Ocean,
Caribbean Sea and Gulf of Mexico during the official Atlantic hurricane season, which encompasses
the months of June through November. The peak of the Atlantic hurricane season is in early to
mid-September and the average number of storms that reach hurricane intensity per year in this
basin is about six (6).
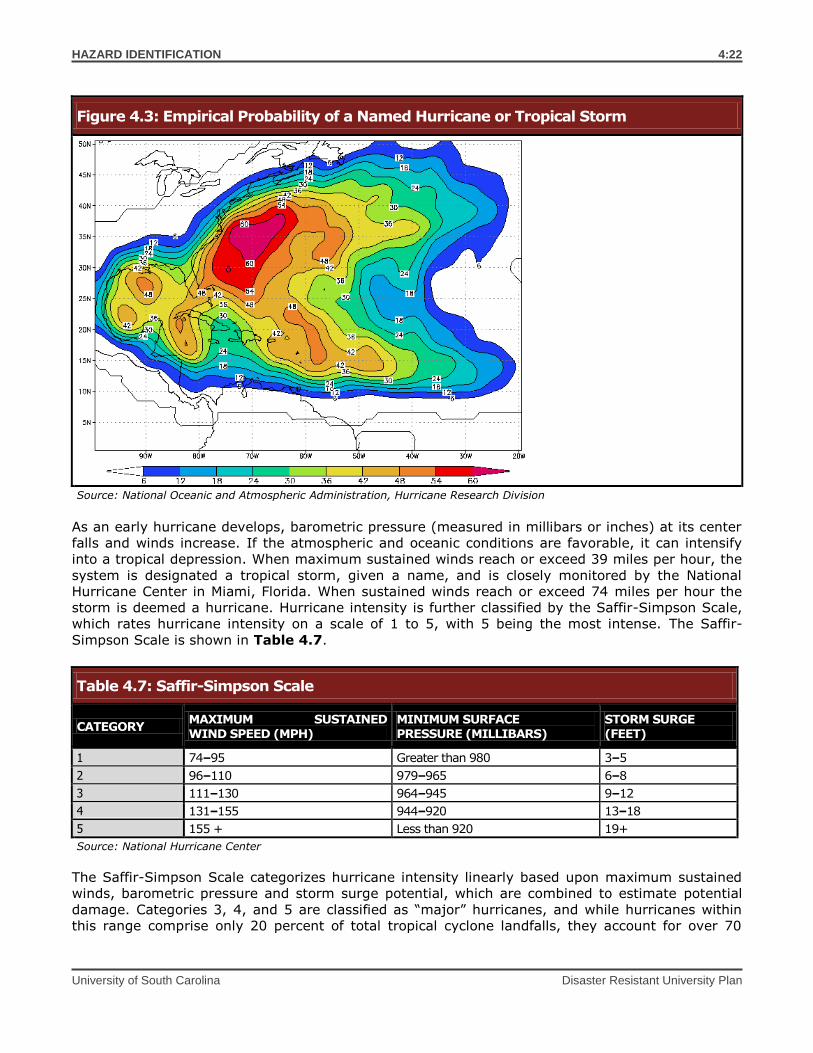
Figure 4.3 shows for any particular location what the chance is that a tropical storm or hurricane
will affect the area sometime during the Atlantic hurricane season. (Land is outlined in black,
showing Florida and the South Carolina coast in the top left quadrant.) This illustration was created
by the National Oceanic and Atmospheric Administration’s Hurricane Research Division using data
from 1944 to 1999 and counting hits when a storm or hurricane was within approximately 100
miles (165 km) of each location.
HURRICANE AND TROPICAL STORM
HAZARD IDENTIFICATION
University of South Carolina Disaster Resistant University Plan
4:22
Figure 4.3: Empirical Probability of a Named Hurricane or Tropical Storm
Source: National Oceanic and Atmospheric Administration, Hurricane Research Division
As an early hurricane develops, barometric pressure (measured in millibars or inches) at its center
falls and winds increase. If the atmospheric and oceanic conditions are favorable, it can intensify
into a tropical depression. When maximum sustained winds reach or exceed 39 miles per hour, the
system is designated a tropical storm, given a name, and is closely monitored by the National
Hurricane Center in Miami, Florida. When sustained winds reach or exceed 74 miles per hour the
storm is deemed a hurricane. Hurricane intensity is further classified by the Saffir-Simpson Scale,
which rates hurricane intensity on a scale of 1 to 5, with 5 being the most intense. The Saffir-
Simpson Scale is shown in Table 4.7.
The Saffir-Simpson Scale categorizes hurricane intensity linearly based upon maximum sustained
winds, barometric pressure and storm surge potential, which are combined to estimate potential
damage. Categories 3, 4, and 5 are classified as “major” hurricanes, and while hurricanes within
this range comprise only 20 percent of total tropical cyclone landfalls, they account for over 70
Table 4.7: Saffir-Simpson Scale
CATEGORY MAXIMUM SUSTAINED WIND SPEED (MPH)
MINIMUM SURFACE PRESSURE (MILLIBARS)
STORM SURGE (FEET)
1 74–95 Greater than 980 3–5
2 96–110 979–965 6–8
3 111–130 964–945 9–12
4 131–155 944–920 13–18
5 155 + Less than 920 19+
Source: National Hurricane Center
HAZARD IDENTIFICATION
University of South Carolina Disaster Resistant University Plan
4:23
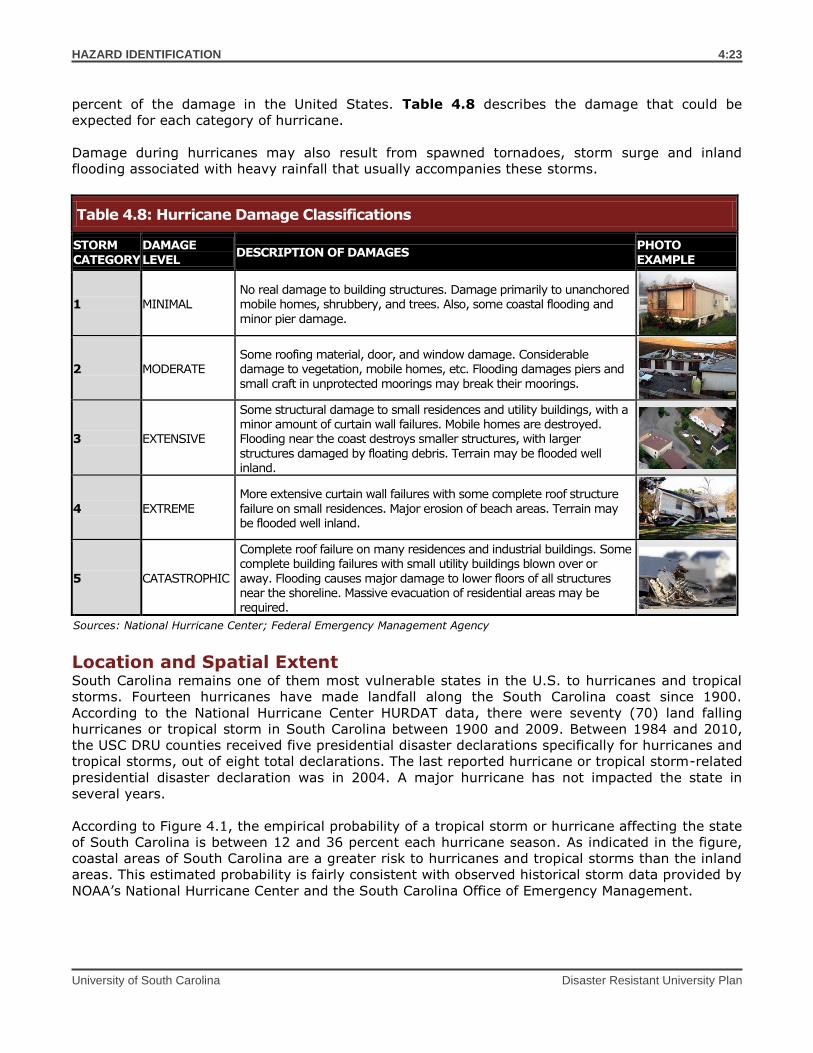
percent of the damage in the United States. Table 4.8 describes the damage that could be
expected for each category of hurricane.
Damage during hurricanes may also result from spawned tornadoes, storm surge and inland
flooding associated with heavy rainfall that usually accompanies these storms.
Location and Spatial Extent South Carolina remains one of them most vulnerable states in the U.S. to hurricanes and tropical
storms. Fourteen hurricanes have made landfall along the South Carolina coast since 1900.
According to the National Hurricane Center HURDAT data, there were seventy (70) land falling
hurricanes or tropical storm in South Carolina between 1900 and 2009. Between 1984 and 2010,
the USC DRU counties received five presidential disaster declarations specifically for hurricanes and
tropical storms, out of eight total declarations. The last reported hurricane or tropical storm-related
presidential disaster declaration was in 2004. A major hurricane has not impacted the state in
several years.
According to Figure 4.1, the empirical probability of a tropical storm or hurricane affecting the state
of South Carolina is between 12 and 36 percent each hurricane season. As indicated in the figure,
coastal areas of South Carolina are a greater risk to hurricanes and tropical storms than the inland
areas. This estimated probability is fairly consistent with observed historical storm data provided by
NOAA’s National Hurricane Center and the South Carolina Office of Emergency Management.
Table 4.8: Hurricane Damage Classifications
STORM
CATEGORY
DAMAGE
LEVEL DESCRIPTION OF DAMAGES
PHOTO
EXAMPLE
1 MINIMAL No real damage to building structures. Damage primarily to unanchored mobile homes, shrubbery, and trees. Also, some coastal flooding and
minor pier damage.
2 MODERATE Some roofing material, door, and window damage. Considerable damage to vegetation, mobile homes, etc. Flooding damages piers and
small craft in unprotected moorings may break their moorings.
3 EXTENSIVE
Some structural damage to small residences and utility buildings, with a minor amount of curtain wall failures. Mobile homes are destroyed. Flooding near the coast destroys smaller structures, with larger
structures damaged by floating debris. Terrain may be flooded well inland.
4 EXTREME
More extensive curtain wall failures with some complete roof structure
failure on small residences. Major erosion of beach areas. Terrain may be flooded well inland.
5 CATASTROPHIC
Complete roof failure on many residences and industrial buildings. Some
complete building failures with small utility buildings blown over or
away. Flooding causes major damage to lower floors of all structures near the shoreline. Massive evacuation of residential areas may be required.
Sources: National Hurricane Center; Federal Emergency Management Agency
HAZARD IDENTIFICATION
University of South Carolina Disaster Resistant University Plan
4:24
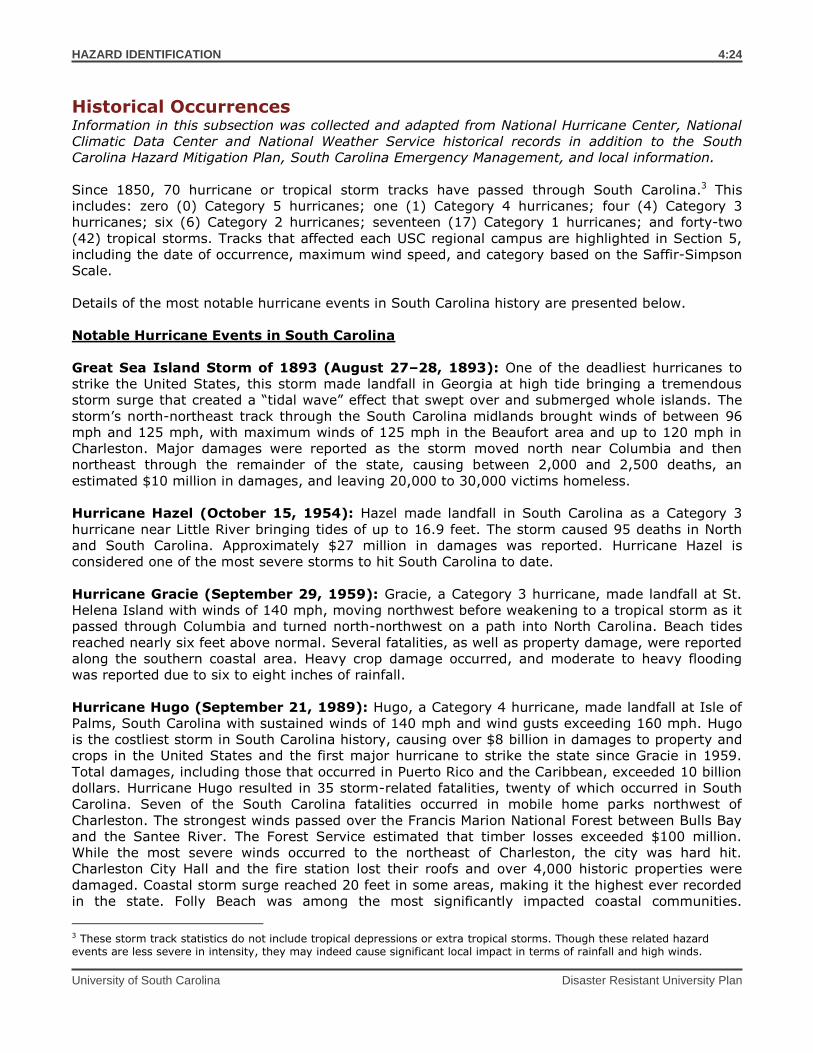
Historical Occurrences Information in this subsection was collected and adapted from National Hurricane Center, National
Climatic Data Center and National Weather Service historical records in addition to the South
Carolina Hazard Mitigation Plan, South Carolina Emergency Management, and local information.
Since 1850, 70 hurricane or tropical storm tracks have passed through South Carolina.3 This
includes: zero (0) Category 5 hurricanes; one (1) Category 4 hurricanes; four (4) Category 3
hurricanes; six (6) Category 2 hurricanes; seventeen (17) Category 1 hurricanes; and forty-two
(42) tropical storms. Tracks that affected each USC regional campus are highlighted in Section 5,
including the date of occurrence, maximum wind speed, and category based on the Saffir-Simpson
Scale.
Details of the most notable hurricane events in South Carolina history are presented below.
Notable Hurricane Events in South Carolina
Great Sea Island Storm of 1893 (August 27–28, 1893): One of the deadliest hurricanes to
strike the United States, this storm made landfall in Georgia at high tide bringing a tremendous
storm surge that created a “tidal wave” effect that swept over and submerged whole islands. The
storm’s north-northeast track through the South Carolina midlands brought winds of between 96
mph and 125 mph, with maximum winds of 125 mph in the Beaufort area and up to 120 mph in
Charleston. Major damages were reported as the storm moved north near Columbia and then
northeast through the remainder of the state, causing between 2,000 and 2,500 deaths, an
estimated $10 million in damages, and leaving 20,000 to 30,000 victims homeless.
Hurricane Hazel (October 15, 1954): Hazel made landfall in South Carolina as a Category 3
hurricane near Little River bringing tides of up to 16.9 feet. The storm caused 95 deaths in North
and South Carolina. Approximately $27 million in damages was reported. Hurricane Hazel is
considered one of the most severe storms to hit South Carolina to date.
Hurricane Gracie (September 29, 1959): Gracie, a Category 3 hurricane, made landfall at St.
Helena Island with winds of 140 mph, moving northwest before weakening to a tropical storm as it
passed through Columbia and turned north-northwest on a path into North Carolina. Beach tides
reached nearly six feet above normal. Several fatalities, as well as property damage, were reported
along the southern coastal area. Heavy crop damage occurred, and moderate to heavy flooding
was reported due to six to eight inches of rainfall.
Hurricane Hugo (September 21, 1989): Hugo, a Category 4 hurricane, made landfall at Isle of
Palms, South Carolina with sustained winds of 140 mph and wind gusts exceeding 160 mph. Hugo
is the costliest storm in South Carolina history, causing over $8 billion in damages to property and
crops in the United States and the first major hurricane to strike the state since Gracie in 1959.
Total damages, including those that occurred in Puerto Rico and the Caribbean, exceeded 10 billion
dollars. Hurricane Hugo resulted in 35 storm-related fatalities, twenty of which occurred in South
Carolina. Seven of the South Carolina fatalities occurred in mobile home parks northwest of
Charleston. The strongest winds passed over the Francis Marion National Forest between Bulls Bay
and the Santee River. The Forest Service estimated that timber losses exceeded $100 million.
While the most severe winds occurred to the northeast of Charleston, the city was hard hit.
Charleston City Hall and the fire station lost their roofs and over 4,000 historic properties were
damaged. Coastal storm surge reached 20 feet in some areas, making it the highest ever recorded
in the state. Folly Beach was among the most significantly impacted coastal communities.
3 These storm track statistics do not include tropical depressions or extra tropical storms. Though these related hazard events are less severe in intensity, they may indeed cause significant local impact in terms of rainfall and high winds.
HAZARD IDENTIFICATION
University of South Carolina Disaster Resistant University Plan
4:25
Approximately 80 percent of the homes were destroyed. Sullivan’s Island and the Isle of Palms
were also severely damaged. Numerous homes were knocked off their foundations and boats in the
local marina were tossed into a 50 foot high pile of debris. Severe inland wind damage occurred as
winds gusting to 109 mph at Sumter were reported. The hurricane exited the state just north of
Rock Hill, causing significant damage in Charlotte, North Carolina. South Carolina received a
Presidential Disaster Declaration for this event.
Hurricane Fran (September 5, 1996): Although Hurricane Fran skirted the South Carolina coast
before making landfall at the entrance of the Cape Fear River in North Carolina, it triggered the
evacuation of 500,000 tourists in the coastal areas of both states, creating the largest peacetime
evacuation in U.S. history. Wind gusts of 60 mph were reported along the Horry County coast. In
Georgetown County, 57 mph winds in the City of Georgetown contributed to $150,000 in county
government infrastructure damage. Eleven evacuation shelters housed 5,400 people. One death
was attributed to the storm. In Horry County, agricultural losses of $19.8 million were reported,
with corn, tobacco and sweet potato crops hardest hit. Downed trees caused power outages
affecting about 60,000 customers. Horry County reported property losses totaling over $1 million,
including $448,000 at North Myrtle Beach, $341,000 at Myrtle Beach, $42,000 at Surfside Beach,
$46,000 at Garden City Beach, and $135,000 in unincorporated areas. South Carolina received a
Presidential Disaster Declaration for this event.
Hurricane Bonnie (August 26, 1998): The center of Hurricane Bonnie came within 70 miles of
the Horry County coast as the storm tracked north during the afternoon and early evening. Wind
reports were as high as 82 mph at the Cherry Grove pier and 76 mph at the Myrtle Beach Pavilion.
Reported rainfall was between two and four inches. Downed trees and power lines caused some
structural damages. Estimated property damages were reported to be $3.8 million and the State of
South Carolina received a federal disaster declaration.
Hurricane Floyd (September 15, 1999): Hurricane Floyd weakened to a Category 3 hurricane
as it approached the southeast Georgia and southern South Carolina coasts on the morning of
September 15. The storm skirted the coast, its center moving northeast about 60 miles offshore
late in the afternoon and early evening as it took a more north and northeast course toward North
Carolina. Sustained winds of tropical storm force were reported from Savannah, Georgia to
Charleston with wind gusting to hurricane force strength in the Charleston area. The highest
recorded sustained wind speed was 58 mph in downtown Charleston, with gusts reaching 85 mph.
Rainfall was heavy along coastal counties as 12 inches of rain fell in Georgetown County. A
reported 18 inches fell in eastern Horry County, causing major flooding along the Waccamaw River
in and around the City of Conway for a month. Waves were reported to be 15 feet at Cherry Grove
Pier, where damage was the greatest. Tides exceeded three feet above normal with a maximum
tidal height of 10.66 feet in the City of Charleston. Minor to moderate beach erosion occurred along
the South Carolina coast. Many businesses and homes suffered major damage, with thousands of
homes experiencing at least some minor damage in Charleston County, causing approximately
$10.5 million in damage. In Horry County, approximately 400 homes and numerous roads were
inundated for over one month following the storm. Beaufort County reported $750,000 damage
with Berkeley and Dorchester counties reporting $500,000 each. Over 1,000 trees were blown
down, knocking out power to over 200,000 customers across the southern coast. In Myrtle Beach,
the tree and sign damage was reported to reach approximately $250,000. In Williamsburg County,
total damage estimates due to the high winds and rain reached approximately $650,000. In
Florence County, high winds downed trees, caused power outages and resulted in $150,000 in
property damages. Total estimated property damages for the affected counties totaled
approximately $17 million. While Hurricane Floyd did not make landfall in South Carolina, it
resulted in the largest peacetime evacuation in the state’s history. It is estimated that between
500,000 and one million people evacuated the coast. South Carolina received a Presidential
Disaster Declaration for this event.
HAZARD IDENTIFICATION
University of South Carolina Disaster Resistant University Plan
4:26
Recent Hurricane and Tropical Storm Activity
South Carolina has been affected by four hurricanes or tropical storms since 2001. These events
account for three injuries and $23.42 million in property damage for the state of South Carolina
(Hazards Research Lab, 2006). Only two of these systems caused serious damage to people and
property in South Carolina. Hurricane Charley hit Florida in August 2004 as a category four
hurricane, but weakened as it left Florida’s east coast. Taking a northerly track, Charley made a
second landfall near Cape Romain as a weak category one hurricane. Nearly 180,000 people
evacuated Horry County in advance of the storm. Charley brought down trees, damaged roofs, and
flooded coastal areas around the Grand Strand. More than 65,000 residents lost power and
insurance claims totaling $5 million along the grand strand were reported (NCDC Storm Data
Online, 2006).
Tropical Storm Gaston impacted Berkeley, Charleston, and Dorchester Counties on August 29,
2004, causing $16.6 million dollars in property damage in Charleston and Berkeley Counties (NCDC
Storm Data Online, 2006). Gaston came ashore near Bulls Bay with sustained 70 mph winds, which
knocked down numerous trees and large limbs. Major damage was reported to over 3000
structures and power loss to over 150,000 people. A storm surge of 4 to 4.5 feet caused localized
flooding.
Tropical Storm Frances passed through South Carolina in early September of 2004. The state
received a presidential disaster declaration for this event. Areas around Caesar’s Head and Rich
Mountain received over 12 inches of rain from the storm. According to the National Weather
Services, a reported 45 tornadoes in South Carolina were associated with this storm.
Tropical Storm Hannah made landfall on September 6, 2008, impacting Myrtle Beach and the
North Carolina-South Carolina border. Hannah brought substantial rain, strong winds, and storm
surge to South Carolina.
Probability of Future Events It can be expected that future hurricane and tropical storm events will affect the state. Probability
will vary by campus location; thus an analysis of each campus is performed. The specific
probability for each campus can be found in Section 5: Hazard Analysis.
HAZARD IDENTIFICATION
University of South Carolina Disaster Resistant University Plan
4:27
Background Lightning is a discharge of electrical energy resulting from the buildup of positive and negative
charges within a thunderstorm, creating a “bolt” when the buildup of charges becomes strong
enough. This flash of light usually occurs within the clouds or between the clouds and the ground. A
bolt of lightning can reach temperatures approaching 50,000 degrees Fahrenheit. Lightning rapidly
heats the sky as it flashes but the surrounding air cools following the bolt. This rapid heating and
cooling of the surrounding air causes the thunder which often accompanies lightning strikes. While
most often affiliated with severe thunderstorms, lightning may also strike outside of heavy rain and
might occur as far as 10 miles away from any rainfall.
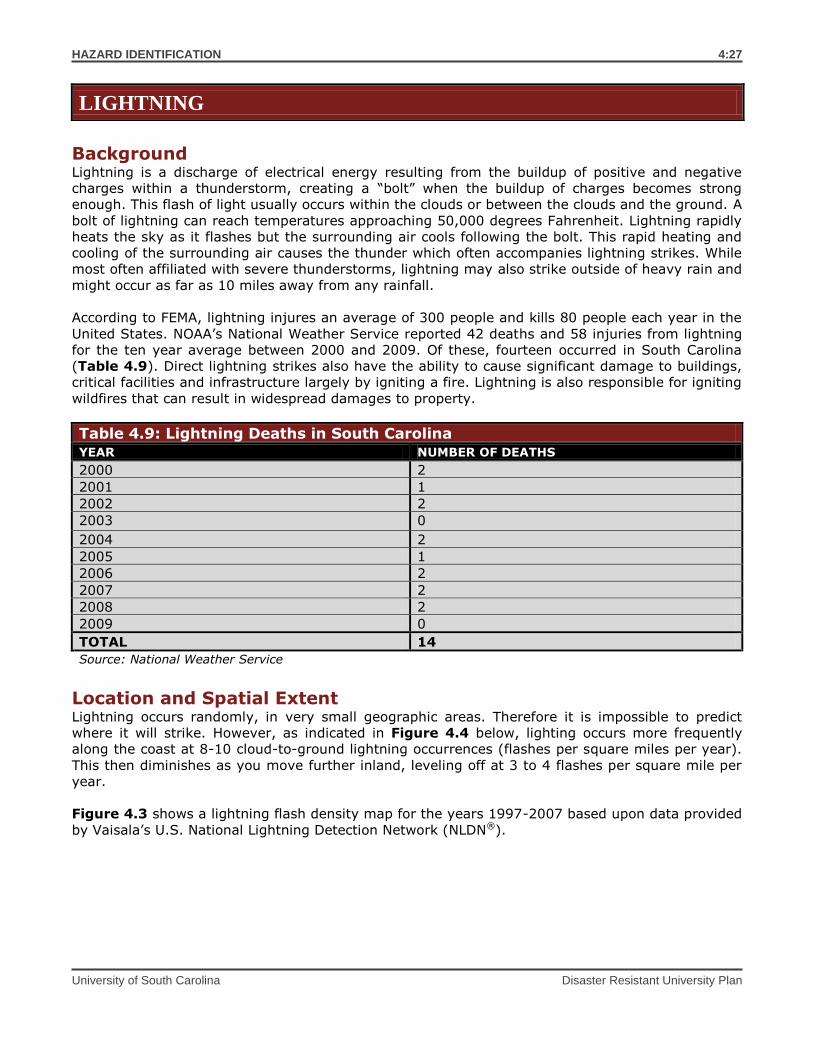
According to FEMA, lightning injures an average of 300 people and kills 80 people each year in the
United States. NOAA’s National Weather Service reported 42 deaths and 58 injuries from lightning
for the ten year average between 2000 and 2009. Of these, fourteen occurred in South Carolina
(Table 4.9). Direct lightning strikes also have the ability to cause significant damage to buildings,
critical facilities and infrastructure largely by igniting a fire. Lightning is also responsible for igniting
wildfires that can result in widespread damages to property.
Table 4.9: Lightning Deaths in South Carolina YEAR NUMBER OF DEATHS 2000 2
2001 1
2002 2
2003 0
2004 2
2005 1
2006 2
2007 2
2008 2
2009 0
TOTAL 14
Source: National Weather Service
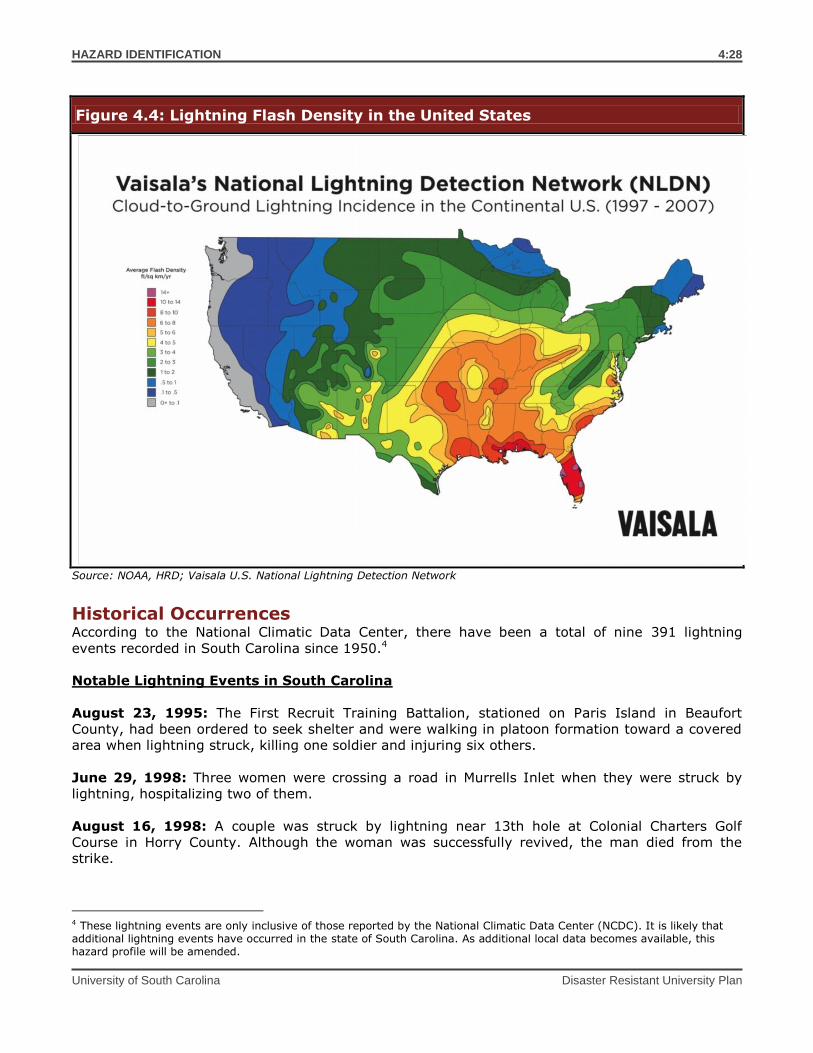
Location and Spatial Extent Lightning occurs randomly, in very small geographic areas. Therefore it is impossible to predict
where it will strike. However, as indicated in Figure 4.4 below, lighting occurs more frequently
along the coast at 8-10 cloud-to-ground lightning occurrences (flashes per square miles per year).
This then diminishes as you move further inland, leveling off at 3 to 4 flashes per square mile per
year.
Figure 4.3 shows a lightning flash density map for the years 1997-2007 based upon data provided
by Vaisala’s U.S. National Lightning Detection Network (NLDN®).
LIGHTNING
HAZARD IDENTIFICATION
University of South Carolina Disaster Resistant University Plan
4:28
Figure 4.4: Lightning Flash Density in the United States
Source: NOAA, HRD; Vaisala U.S. National Lightning Detection Network
Historical Occurrences According to the National Climatic Data Center, there have been a total of nine 391 lightning
events recorded in South Carolina since 1950.4
Notable Lightning Events in South Carolina
August 23, 1995: The First Recruit Training Battalion, stationed on Paris Island in Beaufort
County, had been ordered to seek shelter and were walking in platoon formation toward a covered
area when lightning struck, killing one soldier and injuring six others.
June 29, 1998: Three women were crossing a road in Murrells Inlet when they were struck by
lightning, hospitalizing two of them.
August 16, 1998: A couple was struck by lightning near 13th hole at Colonial Charters Golf
Course in Horry County. Although the woman was successfully revived, the man died from the
strike.
4 These lightning events are only inclusive of those reported by the National Climatic Data Center (NCDC). It is likely that additional lightning events have occurred in the state of South Carolina. As additional local data becomes available, this hazard profile will be amended.
HAZARD IDENTIFICATION
University of South Carolina Disaster Resistant University Plan
4:29
August 27, 1999: Three people were hit by lightning while visiting the River Banks Zoo in
Richland County. The victims were taken to nearby hospitals and released the next day.
June 21, 2001: Lightning struck an apartment complex in Myrtle Beach, igniting a fire. Residents
in the building's 14 apartments were forced to relocate after a Horry County code enforcer deemed
the building uninhabitable. Damages were estimated at $20,000.
June 24, 2001: Lightning struck a transformer at a manufacturing plant in Cherokee County in the
Town of Gaffney, shutting it down for more than 24 hours. This forced shutdown resulted in
approximately 1,000 employees unable to work and caused $1 million in damages.
February 22, 2003: A home was struck by lightning that caused a fire resulting in $70,000 worth
of damage.
June 11, 2003: Lightning struck a home starting a fire that caused $55k in damage.
July 21, 2003: Lightning struck a home in Spring Valley at 411 Bridgecrest Drive and caused
$175,000 in damage.
August 14, 2005: Lightning caused a home fire at 204 Upland Trail that caused $300k worth of
damage.
June 12, 2006: Lightning struck a tree and ran through the ground into the home starting a fire in
the home in the Woodcreek Farms Subdivision.
June 11, 2009: Lightning struck a home and ignited a fire which destroyed it. The home was
located at 150 Rivendale Drive. Lightning struck a home at 38 Shoreline Drive and ignited a fire
which destroyed it.
July 26, 2010: WIS TV reported a home destroyed from a fire caused by lightning on Ripplerock
road.
June 28, 2011: A mid-afternoon thunderstorm produced lightning that struck an Oak tree at Allen
Benedict Court on Harden Street where 5 landscape and maintenance workers were sitting. One
worker was taken to the hospital with non-life threatening injuries. The others were treated and
released.
Probability of Future Occurrences It can be expected that future lightning events will continue to cause minor damages to property
and vehicles throughout the state. Probability will vary by campus location; thus an analysis of
each campus is performed. According to NOAA, South Carolina experienced an average of 2-16
lightning flashes per square kilometer per year between 1997 and 2007. Coastal areas generally
have a greater threat than inland areas. The specific probability for each campus can be found in
Section 5: Hazard Analysis.
HAZARD IDENTIFICATION
University of South Carolina Disaster Resistant University Plan
4:30
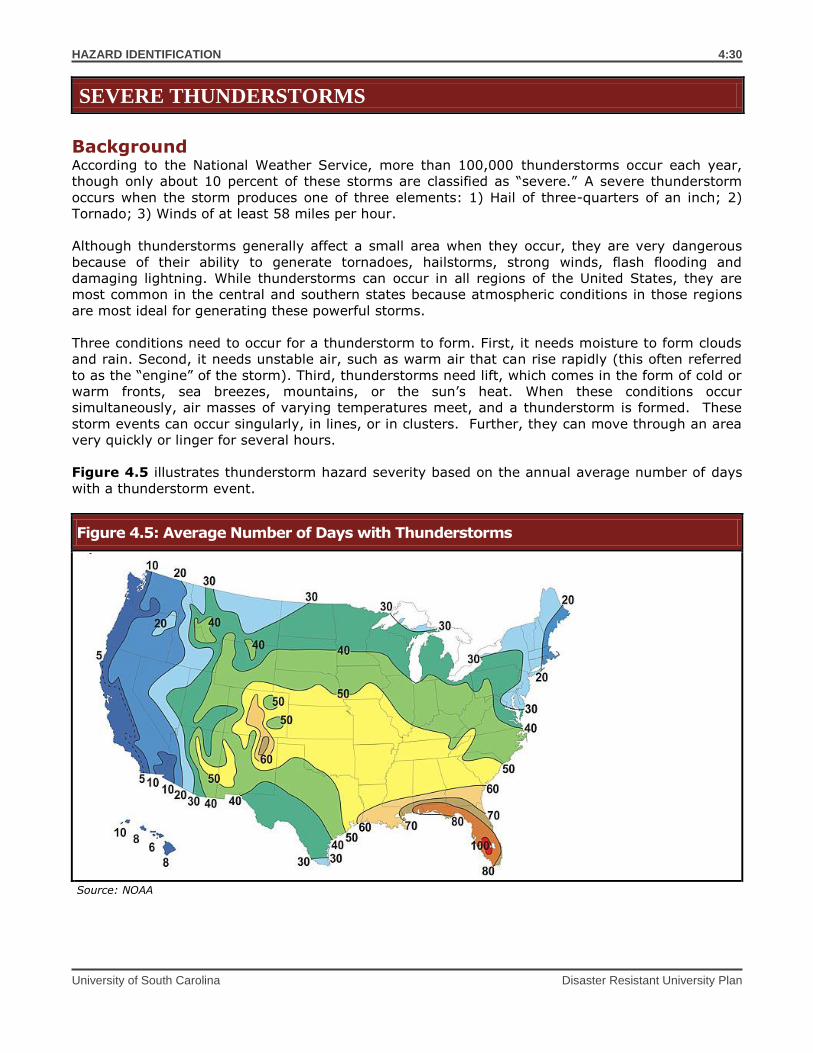
Background According to the National Weather Service, more than 100,000 thunderstorms occur each year,
though only about 10 percent of these storms are classified as “severe.” A severe thunderstorm
occurs when the storm produces one of three elements: 1) Hail of three-quarters of an inch; 2)
Tornado; 3) Winds of at least 58 miles per hour.
Although thunderstorms generally affect a small area when they occur, they are very dangerous
because of their ability to generate tornadoes, hailstorms, strong winds, flash flooding and
damaging lightning. While thunderstorms can occur in all regions of the United States, they are
most common in the central and southern states because atmospheric conditions in those regions
are most ideal for generating these powerful storms.
Three conditions need to occur for a thunderstorm to form. First, it needs moisture to form clouds
and rain. Second, it needs unstable air, such as warm air that can rise rapidly (this often referred
to as the “engine” of the storm). Third, thunderstorms need lift, which comes in the form of cold or
warm fronts, sea breezes, mountains, or the sun’s heat. When these conditions occur
simultaneously, air masses of varying temperatures meet, and a thunderstorm is formed. These
storm events can occur singularly, in lines, or in clusters. Further, they can move through an area
very quickly or linger for several hours.
Figure 4.5 illustrates thunderstorm hazard severity based on the annual average number of days
with a thunderstorm event.
SEVERE THUNDERSTORMS
Figure 4.5: Average Number of Days with Thunderstorms
Source: NOAA
HAZARD IDENTIFICATION
University of South Carolina Disaster Resistant University Plan
4:31
Straight-line Wind
Straight-line winds, which in extreme cases have the potential to cause wind gusts that exceed 100
miles per hour, are responsible for most thunderstorm wind damage. One type of straight-line
wind, the downburst, can cause damage equivalent to a strong tornado and can be extremely
dangerous to aviation.
Location and Spatial Extent Thunderstorm are atmospheric and thus occur almost anywhere. As can be seen in Figure 4.4
above, South Carolina is one of the more vulnerable states in the U.S. to thunderstorm events. A
majority of state experiences 60 days with a thunderstorm event, while the most northern part
experiences 50 days per year. In the southeast, thunderstorms typically occur in the afternoon,
especially in the summer months. As heat and moisture builds in the atmosphere throughout the
day, it needs a release for of the built-up energy resulting in a thunderstorm. Thunderstorms vary
tremendously in terms of size, location, intensity and duration but are considered frequent
occurrences throughout South Carolina, especially in coastal areas. It is assumed that all of the
USC campuses are exposed to severe thunderstorms.
Historical Occurrences According to the National Climatic Data Center, 7,373 thunderstorm wind events have been
reported in South Carolina since 1950. Specific historical events on each campus are described in
the proceeding section: Hazard Analysis.
Probability of Future Events It can be expected that future thunderstorm events will continue to cause minor damages to
property and vehicles throughout the state. Probability will vary by campus location; thus an
analysis of each campus is performed. The specific probability for each campus can be found in
Section 5: Hazard Analysis.
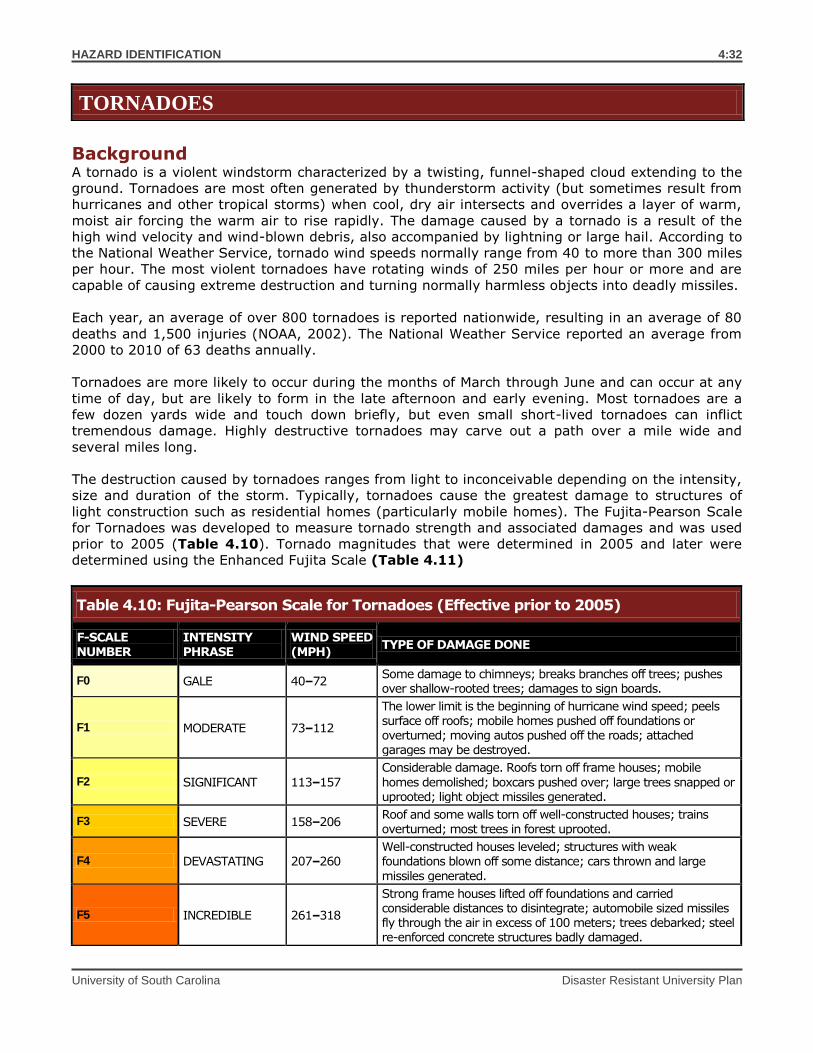
HAZARD IDENTIFICATION
University of South Carolina Disaster Resistant University Plan
4:32
Background A tornado is a violent windstorm characterized by a twisting, funnel-shaped cloud extending to the
ground. Tornadoes are most often generated by thunderstorm activity (but sometimes result from
hurricanes and other tropical storms) when cool, dry air intersects and overrides a layer of warm,
moist air forcing the warm air to rise rapidly. The damage caused by a tornado is a result of the
high wind velocity and wind-blown debris, also accompanied by lightning or large hail. According to
the National Weather Service, tornado wind speeds normally range from 40 to more than 300 miles
per hour. The most violent tornadoes have rotating winds of 250 miles per hour or more and are
capable of causing extreme destruction and turning normally harmless objects into deadly missiles.
Each year, an average of over 800 tornadoes is reported nationwide, resulting in an average of 80
deaths and 1,500 injuries (NOAA, 2002). The National Weather Service reported an average from
2000 to 2010 of 63 deaths annually.
Tornadoes are more likely to occur during the months of March through June and can occur at any
time of day, but are likely to form in the late afternoon and early evening. Most tornadoes are a
few dozen yards wide and touch down briefly, but even small short-lived tornadoes can inflict
tremendous damage. Highly destructive tornadoes may carve out a path over a mile wide and
several miles long.
The destruction caused by tornadoes ranges from light to inconceivable depending on the intensity,
size and duration of the storm. Typically, tornadoes cause the greatest damage to structures of
light construction such as residential homes (particularly mobile homes). The Fujita-Pearson Scale
for Tornadoes was developed to measure tornado strength and associated damages and was used
prior to 2005 (Table 4.10). Tornado magnitudes that were determined in 2005 and later were
determined using the Enhanced Fujita Scale (Table 4.11)
TORNADOES
Table 4.10: Fujita-Pearson Scale for Tornadoes (Effective prior to 2005)
F-SCALE NUMBER
INTENSITY PHRASE
WIND SPEED (MPH)
TYPE OF DAMAGE DONE
F0 GALE 40–72 Some damage to chimneys; breaks branches off trees; pushes over shallow-rooted trees; damages to sign boards.
F1 MODERATE 73–112
The lower limit is the beginning of hurricane wind speed; peels surface off roofs; mobile homes pushed off foundations or overturned; moving autos pushed off the roads; attached garages may be destroyed.
F2 SIGNIFICANT 113–157
Considerable damage. Roofs torn off frame houses; mobile
homes demolished; boxcars pushed over; large trees snapped or uprooted; light object missiles generated.
F3 SEVERE 158–206 Roof and some walls torn off well-constructed houses; trains overturned; most trees in forest uprooted.
F4 DEVASTATING 207–260 Well-constructed houses leveled; structures with weak foundations blown off some distance; cars thrown and large
missiles generated.
F5 INCREDIBLE 261–318
Strong frame houses lifted off foundations and carried considerable distances to disintegrate; automobile sized missiles fly through the air in excess of 100 meters; trees debarked; steel re-enforced concrete structures badly damaged.
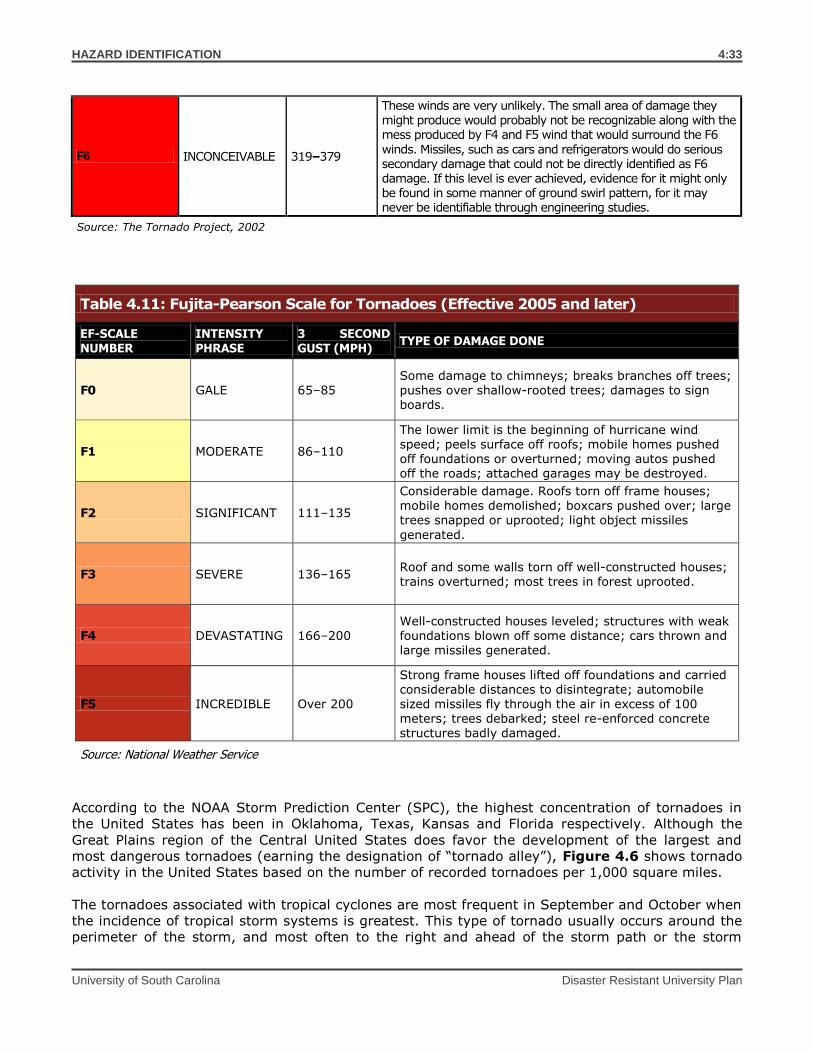
HAZARD IDENTIFICATION
University of South Carolina Disaster Resistant University Plan
4:33
According to the NOAA Storm Prediction Center (SPC), the highest concentration of tornadoes in
the United States has been in Oklahoma, Texas, Kansas and Florida respectively. Although the
Great Plains region of the Central United States does favor the development of the largest and
most dangerous tornadoes (earning the designation of “tornado alley”), Figure 4.6 shows tornado
activity in the United States based on the number of recorded tornadoes per 1,000 square miles.
The tornadoes associated with tropical cyclones are most frequent in September and October when
the incidence of tropical storm systems is greatest. This type of tornado usually occurs around the
perimeter of the storm, and most often to the right and ahead of the storm path or the storm
F6 INCONCEIVABLE 319–379
These winds are very unlikely. The small area of damage they
might produce would probably not be recognizable along with the mess produced by F4 and F5 wind that would surround the F6
winds. Missiles, such as cars and refrigerators would do serious secondary damage that could not be directly identified as F6 damage. If this level is ever achieved, evidence for it might only be found in some manner of ground swirl pattern, for it may never be identifiable through engineering studies.
Source: The Tornado Project, 2002
Table 4.11: Fujita-Pearson Scale for Tornadoes (Effective 2005 and later)
EF-SCALE NUMBER
INTENSITY PHRASE
3 SECOND GUST (MPH)
TYPE OF DAMAGE DONE
F0 GALE 65–85 Some damage to chimneys; breaks branches off trees; pushes over shallow-rooted trees; damages to sign boards.
F1 MODERATE 86–110
The lower limit is the beginning of hurricane wind speed; peels surface off roofs; mobile homes pushed off foundations or overturned; moving autos pushed off the roads; attached garages may be destroyed.
F2 SIGNIFICANT 111–135
Considerable damage. Roofs torn off frame houses; mobile homes demolished; boxcars pushed over; large trees snapped or uprooted; light object missiles
generated.
F3 SEVERE 136–165 Roof and some walls torn off well-constructed houses; trains overturned; most trees in forest uprooted.
F4 DEVASTATING 166–200 Well-constructed houses leveled; structures with weak foundations blown off some distance; cars thrown and large missiles generated.
F5 INCREDIBLE Over 200
Strong frame houses lifted off foundations and carried considerable distances to disintegrate; automobile sized missiles fly through the air in excess of 100 meters; trees debarked; steel re-enforced concrete structures badly damaged.
Source: National Weather Service
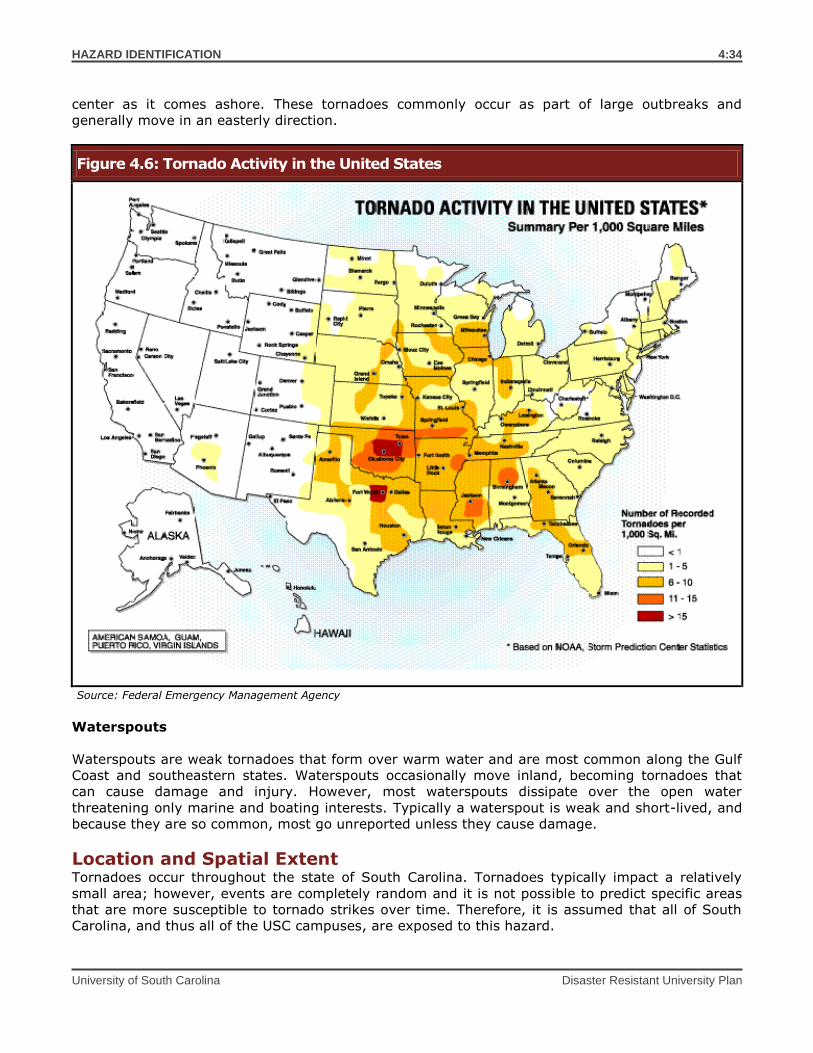
HAZARD IDENTIFICATION
University of South Carolina Disaster Resistant University Plan
4:34
center as it comes ashore. These tornadoes commonly occur as part of large outbreaks and
generally move in an easterly direction.
Figure 4.6: Tornado Activity in the United States
Source: Federal Emergency Management Agency
Waterspouts
Waterspouts are weak tornadoes that form over warm water and are most common along the Gulf
Coast and southeastern states. Waterspouts occasionally move inland, becoming tornadoes that
can cause damage and injury. However, most waterspouts dissipate over the open water
threatening only marine and boating interests. Typically a waterspout is weak and short-lived, and
because they are so common, most go unreported unless they cause damage.
Location and Spatial Extent Tornadoes occur throughout the state of South Carolina. Tornadoes typically impact a relatively
small area; however, events are completely random and it is not possible to predict specific areas
that are more susceptible to tornado strikes over time. Therefore, it is assumed that all of South
Carolina, and thus all of the USC campuses, are exposed to this hazard.
HAZARD IDENTIFICATION
University of South Carolina Disaster Resistant University Plan
4:35
Historical Occurrences The National Climatic Data Center reported 924 tornadoes in South Carolina between 1950 and
March 2010. During this time, it reported 56 deaths and 1,303 injuries as a result of the tornadoes.
The National Weather Service, three deaths have occurred in South Carolina between 2000 and
2009 (Table 4.12).
Table 4.12: Tornado Deaths in South Carolina YEAR NUMBER OF DEATHS 2000 1
2001 0
2002 0
2003 0
2004 1
2005 0
2006 0
2007 1
2008 0
2009 0
TOTAL 3
Source: National Weather Service
All campuses should be considered equally exposed to tornado events.
Probability of Future Events It can be expected that future tornado events will continue to cause minor damages to property
and vehicles throughout the state. Probability will vary by campus location; thus an analysis of
each campus is performed. The specific probability for each campus can be found in Section 5:
Hazard Analysis.
HAZARD IDENTIFICATION
University of South Carolina Disaster Resistant University Plan
4:36
Background Severe winter storms may include snow, sleet, freezing rain, or a mix of these wintry forms of
precipitation. Blizzards, the most dangerous of all winter storms, combine low temperatures, heavy
snowfall, and winds of at least 35 miles per hour, reducing visibility to only a few yards. Ice storms
occur when moisture falls and freezes immediately upon impact on trees, power lines,
communication towers, structures, roads and other hard surfaces. Winter storms and ice storms
can down trees, cause widespread power outages, damage property, and cause fatalities and
injuries to human life.
A winter storm can range from a moderate snow over a period of a few hours to blizzard conditions
with blinding wind-driven snow that lasts for several days. Some winter storms may be large
enough to affect several States, while others may affect only a single community. Many winter
storms are accompanied by low temperatures and heavy and/or blowing snow, which can severely
impair visibility.
Winter storm events may include snow, sleet, freezing rain, or a mix of these wintry forms of
precipitation. Sleet is a raindrop that freezes into an ice pellet formation before reaching the
ground, where it usually bounces upon hitting the surface and does not stick to objects. However,
sleet can accumulate like snow and cause a hazard to motorists. Freezing rain is rain that falls to
the ground when the temperature is below freezing, forming a glaze of ice on roadways and other
surfaces. An ice storm occurs when freezing rain falls and freezes immediately upon impact. Even
small accumulations of ice can cause a significant hazard, especially on power lines, roads, and
trees.
A freeze event is weather marked by low temperatures below the freezing point (zero degrees
Celsius or thirty-two degrees Fahrenheit). Freeze events are particularly dangerous as they are the
second biggest killer among natural hazards (extreme heat being first). Further, agricultural
production can be seriously affected when temperatures remain below the freezing point for an
extended period of time, particularly in areas when vulnerable crops or livestock are located.
Location and Spatial Extent South Carolina’s climate varies across the state. The western portion of the state is more
susceptible to winter weather and often experiences winter weather during the winter months. The
eastern portion, however, is much less susceptible to winter weather, making these areas less
adept in dealing with such situations. Of the planning area counties, Spartanburg, Union, and
Lancaster Counties have the highest number of reported events and damage. When such events do
occur, regardless of the location, the effects will be felt over a widespread area. The effects of
extreme cold temperatures will be primarily limited to the elderly and homeless populations, with
occasionally minor, sporadic property damages.
Deep freezes occasionally occur in South Carolina. Typically, these events cause minimal impact
outside of agricultural losses and related economic industries (including commercial nurseries).
USC does not have any agricultural programs that would be affected by deep freeze events.
Historical Occurrences The National Climatic Data Center reported 232 winter storm events in South Carolina between
1950 and March 2010 which includes winter storm, snow, freezing rain, and sleet events. Sixty-one
of these events were reported in the planning area counties where USC DRU campuses reside.
WINTER STORM AND FREEZE
HAZARD IDENTIFICATION
University of South Carolina Disaster Resistant University Plan
4:37
These events resulted in approximately $174,230,000 (2010 dollars) in damage. It should be noted
that since these are regional occurrences and reported as such, some double counting may occur.
Notable Winter Storm Events in South Carolina
February 8-11, 1973: A snowstorm of historic proportions impacted the state, leaving behind a
record 24 inches of snow in some areas. Snowdrifts of up to eight inches were recorded.
Approximately 30,000 motorists were stranded on the state’s highways—many rescued by
helicopter. Eight exposure-related fatalities were reported. Over 200 buildings, in addition to
thousands of awnings and carports, collapsed under the weight of the snow. Property and road
damages as well as the cost of snow removal and rescue operations were estimated to total
approximately $30 million.
March 13, 1993: This winter storm, which possessed an extremely low atmospheric pressure,
passed across South Carolina bringing damaging winds, recorded snowfalls of as much as 11.5 feet
in portions of the mountains, and snow flurries on the southeast tip of the coast. Preliminary
damage assessments at the time were estimated at over $22 million.
March 8, 1996: This event brought record low temperatures that caused a recorded $20 million
loss to the peach crop in the upper portion of the state.
January 22-29, 2000: Low pressure rapidly deepened near the Carolina coast, wrapping
abundant moisture back across the piedmont of the Carolinas. By the time snow ended,
accumulations ranged from 12 to 20 inches. Due to the heavy wet snow, numerous power outages
occurred and buildings collapsed. On January 29, a weakening low pressure system in the Ohio
River Valley, and a low pressure system along the Gulf Coast, coupled with arctic air across the
Carolinas, resulted in an icy mess throughout Upstate South Carolina. Precipitation, which briefly
began as a light mixture of sleet and snow, quickly turned to freezing rain, resulting in a glaze 1/4
to 1/2 inch thick on exposed surfaces. Power outages were common across the region, especially in
the Lower Piedmont from Abbeville to Greenwood. South Carolina requested $9.2 million in federal
disaster aid to remove snow and downed trees. A total of 38 counties received a Presidential
Disaster Declaration.
There have been four severe winter events in South Carolina since 2001. These winter storms
account for two fatalities, twenty-four injuries and $129.8 million in property damage (NCDC Storm
Data Online, 2006).
December 4, 2002: An ice storm causing $100 million in property damages affected a majority of
the counties in the state. Abbeville, Anderson, Cherokee, Chester, Greenville, Oconee, Pickens,
Greenwood, Laurens, Spartanburg, Union, and York Counties suffered most of the losses from this
event, which included ice accumulations up to 1½ inch in some areas. Hundreds of thousands of
homes were without power, many for as long as two weeks in some areas.
January 25-27, 2004: A severe winter storm affected all but five counties statewide with ice and
snow. Damages to property primarily in the Pee Dee region-- Darlington, Dillon, Florence, Marion,
Marlboro, and Williamsburg Counties—were estimated at over $26 million (NCDC Storm Data
Online, 2006). Major power outages occurred due to falling limbs and many homes were without
power for a week. This incident prompted the first disaster declaration in two years.
February 2004: A late winter mix affecting all of the Upstate counties and those in the northern
piedmont of the state caused one fatality and almost $2 million in property damages. Total snowfall
accumulation was up to 22 inches in some areas and caused one fatal vehicle accident in which
thousands of people became stranded on I-77.
HAZARD IDENTIFICATION
University of South Carolina Disaster Resistant University Plan
4:38
December 2005: A winter storm producing ice and snow in the upstate counties of Abbeville,
Anderson, Cherokee, Chester, Greenville, Laurens, Oconee, Pickens, Spartanburg, Union, and York.
This event caused almost $1.5 million in property damage due to power outages and housing unit
damage from falling limbs and trees. There were four (indirect) fatalities associated with carbon
monoxide poisoning due to indoor generator use in Anderson. This winter storm resulted in a
Presidential disaster declaration.
Probability of Future Events It can be expected that future winter storm and freeze events will continue to cause minor
damages to property and vehicles throughout the state. Probability will vary by campus location;
thus an analysis of each campus is performed. The specific probability for each campus can be
found in Section 5: Hazard Analysis.
HAZARD IDENTIFICATION
University of South Carolina Disaster Resistant University Plan
4:39
Background Erosion is the gradual breakdown and movement of land due to both physical and chemical
processes of water, wind, and general meteorological conditions. Natural, or geologic, erosion has
occurred since the Earth’s formation and continues at a very slow and uniform rate each year.
There are two types of soil erosion: wind erosion and water erosion. Wind erosion can cause
significant soil loss as winds blowing across sparsely vegetated or disturbed land can pick up and
carry soil particles through the air, thus displacing them. Water erosion can occur over land or in
streams and channels. Water erosion that takes place over land may result from raindrops, shallow
sheets of water flowing off the land, or shallow surface flow, which is concentrated in low spots.
Major storms such as hurricanes may cause significant coastal erosion by combining high winds
with heavy surf and storm surge.
An area’s potential for erosion is determined by four factors: soil characteristics, vegetative cover,
climate or rainfall, and topography. Soils composed of a large percentage of silt and fine sand are
most susceptible to erosion. As the clay and organic content of these soils increase, the potential
for erosion decreases. Well-drained and well-graded gravels and gravel-sand mixtures are the least
likely to erode. Coarse gravel soils are highly permeable and have a good capacity for absorption,
which can prevent or delay the amount of surface runoff. Vegetative cover can reduce erosion by
shielding the soil surface from falling rain, absorbing water from the soil, and slowing the velocity
of runoff. Runoff is also affected by the topography of the area including size, shape and slope. The
greater the slope length and gradient, the more potential an area has for erosion. Climate can
affect the amount of runoff, especially the frequency, intensity and duration of rainfall and storms.
When rainstorms are frequent, intense, or of long duration, erosion risks increase. Seasonal
changes in temperature and rainfall amounts define the period of highest erosion risk.
Death and injury are not associated with erosion; however, it can cause the destruction of buildings
and infrastructure and represents a major threat to the local economies of communities that rely
on the financial benefits of recreational areas such as rivers or beaches.
Location and Spatial Extent All of the coastal areas in South Carolina are susceptible to the coastal erosion hazard. These areas
are subject to repeated, episodic coastal erosion events that threaten public and private property.
However, some areas, such as Myrtle Beach, replenish the sand lost to coastal erosion through re-
nourishment projects, thus greatly reducing the effects.
Historical Occurrences The severity of coastal erosion is typically measured through a quantitative assessment of annual
shoreline change for a given beach cross-section of profile (feet or meters per year) over a long
period of time. Erosion rates vary as a function of shoreline type and are influenced primarily by
episodic events, but can be used in land use and hazard management to define areas of critical
concern. Unfortunately, there is no uniform erosion rate database or GIS data layer that defines
erosion rates or such areas of critical concern for the state’s shoreline. A review of the national
Climatic Data Center does not indicate any significant erosion events that would impact USC
campuses.
COASTAL EROSION

HAZARD IDENTIFICATION
University of South Carolina Disaster Resistant University Plan
4:40
Probability of Future Events It can be expected that coastal erosion events will continue to occur along the coast. Probability
will vary by campus location; thus an analysis of each campus is performed. The specific
probability for each campus can be found in Section 5: Hazard Analysis.
HAZARD IDENTIFICATION
University of South Carolina Disaster Resistant University Plan
4:41
Background Flooding is the most frequent and costly natural hazard in the United States, a hazard that has
caused more than 10,000 deaths since 1900. Nearly 90 percent of presidential disaster
declarations result from natural events where flooding was a major component.
Floods are generally the result of excessive precipitation, and can be classified under two
categories: general floods, precipitation over a given river basin for a long period of time; and flash
floods, the product of heavy localized precipitation in a short time period over a given location. The
severity of a flooding event is determined by the following: a combination of stream and river basin
topography and physiography; precipitation and weather patterns; recent soil moisture conditions;
and the degree of vegetative clearing.
General floods are usually long-term events that may last for several days. The primary types of
general flooding include riverine, coastal and urban flooding. Riverine flooding is a function of
excessive precipitation levels and water runoff volumes within the watershed of a stream or river.
Coastal flooding is typically a result of storm surge, wind-driven waves and heavy rainfall produced
by hurricanes, tropical storms and other large coastal storms. Urban flooding occurs where
manmade development has obstructed the natural flow of water and decreased the ability of
natural groundcover to absorb and retain surface water runoff.
Most flash flooding is caused by slow-moving thunderstorms in a local area or by heavy rains
associated with hurricanes and tropical storms. However, flash flooding events may also occur from
a dam or levee failure within minutes or hours of heavy amounts of rainfall, or from a sudden
release of water held by a retention basin or other stormwater control facility. Although flash
flooding occurs most often along mountain streams, it is also common in urbanized areas where
much of the ground is covered by impervious surfaces. Flash flood waters move at very high
speeds—“walls” of water can reach heights of 10 to 20 feet. Flash flood waters and the
accompanying debris can uproot trees, roll boulders, destroy buildings, and obliterate bridges and
roads.
The periodic flooding of lands adjacent to rivers, streams and shorelines (land known as floodplain)
is a natural and inevitable occurrence that can be expected to take place based upon established
recurrence intervals. The recurrence interval of a flood is defined as the average time interval, in
years, expected between a flood event of a particular magnitude and an equal or larger flood. Flood
magnitude increases with increasing recurrence interval.
Floodplains are designated by the frequency of the flood that is large enough to cover them. For
example, the 10-year floodplain will be covered by the 10-year flood and the 100-year floodplain
by the 100-year flood. Flood frequencies such as the 100-year flood are determined by plotting a
graph of the size of all known floods for an area and determining how often floods of a particular
size occur. Another way of expressing the flood frequency is the chance of occurrence in a given
year, which is the percentage of the probability of flooding each year. For example, the 100-year
flood has a 1 percent chance of occurring in any given year. The 500-year flood has a 0.2 percent
chance of occurring in any given year.
Location and Spatial Extent Several areas throughout the state of South Carolina are subject to flooding. Location varies
substantially by campus and is discussed extensively in Section 5: Hazard Analysis using maps and
narrative. In addition to riverine flooding, areas closer to the coast general are very flat and close
FLOOD
HAZARD IDENTIFICATION
University of South Carolina Disaster Resistant University Plan
4:42
to sea level. This results in extensive “ponding” due to the lack of elevation gradients to facilitate
adequate stormwater runoff. Further, its water supply lies just below the surface of the ground.
Regardless of the location, major rainfall events sometimes leave rainwater nowhere to drain,
causing flooding near rivers and canals as well as in urban areas due to poor percolation rates and
the low elevations (particularly in western parts of the county). Coastal flooding along the shoreline
is typically associated with tidal surge caused by land-falling tropical storms and hurricane events.
Historical Occurrences According to the National Climatic Data Center, there have been 777 reported flood events
throughout the State between 1950 and March 2010. Of these, 215 occurred in the planning area
counties where USC campuses reside. These events accounted for nearly $108 million (2010
dollars) in damages. Obviously this makes flooding a frequent and costly hazard for the state.
Of the flood events recorded, six events are considered notable based on the following criteria:
extent, number of deaths, and amount of property damage sustained. Prior to 1993, four particular
floods in the 20th century are remembered for causing numerous deaths, significant property
damage, and/or Presidential Disaster Declarations.
The following information highlights flood events that are detailed in the state hazard mitigation
plan.
June 6, 1903 (“The Great Pacolet Flood”): “The Great Pacolet Flood” of 1903 resulted in the
greatest loss of life from riverine flooding during the 20th century in the state. Sixty-five (65)
people drowned. According to a National Weather Service Monthly Weather Review report, the
water rose so rapidly that the land near the river was covered by 41 feet of water within 40
minutes. Homes, churches and businesses, including 7 cotton mills, 13 railroad bridges, and 17
farm houses were destroyed. 4,300 people were put out of work due to the flood. Railway traffic
was disrupted and the textile communities of Pacolet in Spartanburg County and Clinton in Laurens
County were devastated by this event. Flood damages were also reported along other streams in
the northwestern section of the state. Damages were estimated to be approximately $3,866,000.
August 26–30, 1908 (Riverine Flooding): This storm event formed in the Gulf of Mexico and
moved slowly northeastward across the state. This event is considered to be the most extensive
flood in South Carolina on record, as all the major rivers in the state exceeded flood stage by
between nine and 22 feet. Heavy damages to property and crops were reported.
September 21–24, 1928 (Riverine and Coastal Flooding): This flood event was caused by an
unnamed hurricane. Severe flooding was reported statewide, with rainfall totals ranging from 10 to
12 inches. Many bridges were destroyed, and roads and railways were impassable. Property losses
reached an estimated $4 to $6 million.
October 22, 1990 (Severe Storm Flooding): The worst riverine flooding in recent times
occurred in October 1990 as a result of rains from Tropical Storms Klaus and Marco. Eleven of the
state’s fifteen river basins exceeded flood stage. Within a 24-hour period, areas in Orangeburg,
Sumter, Kershaw, Lancaster, and Chesterfield counties experienced as much as 10-15 inches of
rain, which exceeded the 50-100 year events. This flood event resulted in a Presidential Disaster
Declaration (DR-881) for 13 counties in South Carolina, including Aiken, Calhoun, Cherokee,
Darlington, Edgefield, Florence, Kershaw, Lancaster, Lee, Orangeburg, Spartanburg, Sumter and
Union.
April 5, 1993 (Coastal Flooding): The northeast coastal beaches experienced a combination of
high spring tides and strong onshore winds on this date, causing considerable beach erosion and
coastal flooding. Many dune crossovers, walkways, and staircases were destroyed in the Myrtle-
HAZARD IDENTIFICATION
University of South Carolina Disaster Resistant University Plan
4:43
Crescent Beach area in Horry County. North Myrtle Beach lost three to four feet of dunes. Property
damages, totaling $7,716,247 based on current cost estimates, were reported.
June 27, 1994 (Flash Flooding): Within a 24-hour period, heavy rain caused flash flooding in
portions of central South Carolina. Severe flash flooding in Lexington County flooded roadways and
culverts, and breached a millpond dam on Red Bank Creek that resulted in two additional
downstream dam failures. Approximately $7,330,363 in current estimated property damages
occurred, primarily along Red Bank Creek and Congaree Creek, as floodwaters washed trees and
other debris into sheds, homes, and vehicles. Two people were rescued when the car they were
riding in was swept off of Highway 6 near Red Bank Creek, shortly after the failure of Red Bank Mill
Dam.
October 3, 1994 (Coastal and Flash Flooding): Record-breaking rainstorms, with unofficially
recorded rainfall exceeding 13 inches within 24-hour period in Beaufort County, impacted the
South Carolina coast. A 24-hour rain total of 11.5 inches was recorded at Honey Horn Plantation,
located on northern Hilton Head Island. This rainfall event broke the official all-time rainfall record
at that location. There were also scattered areas of flash flooding in the county, followed by severe
coastal flooding. Heaviest flooding was reported on Hilton Head Island. Floodwaters covered many
streets, damaged more than 147 homes, six government buildings, 36 businesses and at least 45
cars. Approximately 37 roads washed out or were damaged. The area’s oyster beds were closed
from October 3 to October 24 due to effluent releases. Several Low Country sewage treatment
plants reported flooding problems and more than 3,012 consumers lost electrical power. Based on
current cost estimations, $1,466,073 in property damages was reported. In Colleton County,
$1,466,073 in property damages (based on current cost estimations) was reported when roads
flooded and numerous homes were damaged by the floodwaters. Rainfall amounts of four to eight
inches fell within a 24-hour period across much of Charleston County. Runoff from heavy rains,
high tides and strong winds caused significant flooding over much of the coastal areas of the
county, especially in the City of Charleston and over most of the nearby barrier islands. Buildings
and homes were damaged, sewers backed up, roads flooded, and cars were inundated by the
floodwaters. The county experienced $439,822 in property damages and $8,796 in crop damages,
based on current cost estimates. There was an additional $73,304 in property damages reported
due to flash flooding.
October 13, 1994 (Flash and Coastal Flooding): Bands of heavy precipitation produced four to
10 inches of rain along the South Carolina coast, causing varying degrees of flash flooding in 40
counties. Flash flooding caused $2,932,000 in property damages and $11,720 in crop damages,
based on current dollar estimations. The heaviest rainfall and the worst flooding occurred in
Charleston, southern Colleton County, Beaufort County and southern Jasper County. Numerous
roads were flooded and/or washed away. There was considerable flooding of homes and businesses
throughout the area. Beach erosion was also noted at several locations along the South Carolina
coast. Beaufort County was heavily impacted, reporting 218 homes/villas/apartments damaged or
destroyed. Fifteen businesses reported flood damage. Eight wastewater treatment plants and two
golf courses were heavily damaged. Moderate beach erosion was reported along the south coast,
with 200,000 cubic yards of sand lost on Hilton Head Island. Coastal flooding caused $36,651,824
in property damages and $73,260 in crop damages based on current dollar estimates.
August 24–31, 1995 (Flooding and Flash Flooding): Slow moving bands of heavy rain, formed
from remnants of Tropical Storm Jerry, began moving into South Carolina, dumping an initial three
to five inches of rain. As additional bands moved across the state, flash flooding developed in
various areas and roads became flooded and impassable. Approximately 11 inches fell within a 48-
hour period in Abbeville County, washing out bridges and closing roads. Flooding from the heavy
rains disrupted traffic on Hilton Head Island and St. Helena Island, covering roads and bridges and
flooding some homes. Already saturated ground produced flash flooding in some areas, as well as
HAZARD IDENTIFICATION
University of South Carolina Disaster Resistant University Plan
4:44
flooding in areas where flash flooding had occurred earlier. As rivers and creeks continued to rise,
at least six bridges were destroyed in Laurens County, including the Highway 418 Bridge across the
Enoree River. Several small dams broke, including one in Union County where a wall of water
rushed across a road. Throughout much of eastside of Greenville, Greer, Taylors, and the western
side of Spartanburg, storm water totals of approximately 15 inches were reported. Two deaths
were reported in the Greenville-Spartanburg area and one death was reported in Gaffney. Flooding
along the Enoree River, Abner Creek, Brushy Creek, Gilder Creek, and Horseman Creek in the
eastern half of Greenville and the western side of Spartanburg County was the worst in recent
memory. The South Carolina Department of Transportation estimated between $4 and $5 million in
damages to roads and bridges. The current total cost estimates for the damages caused by this
extended flood event equal $18,717,472.
August 14–15, 1998 (Flash Flooding): A flash flood in Spartanburg County rapidly developed
following four to five inches of rainfall, which fell during a very short time period. The flash flooding
affected several creeks around the City of Spartanburg and moved southward to Roebuck, Walnut
Grove and Pauline. Most of the damages occurred along Timms Creek and Lawson Fork Creek.
Roads were washed out and several people had to be rescued from their homes. A country club
experienced severe damage and a restaurant was destroyed. Property damages of $3,145,092,
based on current cost estimates, were reported. For a second consecutive night, on August 15, a
flash flood occurred in Spartanburg County. The primary flooding occurred along Fairforest Creek
and affected the communities located on the west side of the city. An area motel was flooded,
requiring the evacuation of the residents. This second flood event caused additional property
damages of $629,018, based on current cost estimates.
Recent Flood Activity
Five flood events have occurred in the state since 2001 that are considered significant events
(causing more than $1 million in property or crop damage). The first event was the Greater
Greenville flood of March 20, 2003, which caused $1.3 million in property damage in Greenville
and over $1.0 million in Spartanburg. Heavy overnight rainfall produced flash flooding, and
continued moderate rainfall resulted in additional flooding along many creeks and streams in areas
of Greenville County. The flooding was quite significant in Berea, Taylors, and Mauldin. In Berea,
some residents had to be rescued via canoe from their homes (NCDC Storm Data Reports Online).
Another flood event caused by heavy rainfall occurred on September 7, 2004 in Oconee and
Greenville counties causing an estimated $2.6 million in property damage and $5 million in crop
damage. Widespread flooding of creeks and streams developed across the two counties. Numerous
roads were covered with water or washed out, and the sewer systems of several communities were
damaged.
Another large flash-flooding event hit Greenville on July 29, 2004 causing $3.5 million in property
damage. A nearly stationary thunderstorm produced 4 to 9 inches of rainfall in approximately 4
hours resulting in major flooding in areas from Berea to downtown Greenville. The Reedy River
crested at 19.2 feet in downtown Greenville, the second highest level on record (NCDC Storm Data
reports Online, 2006). Several businesses and homes along the river incurred major damage,
hundreds of vehicles were damaged or destroyed, and numerous roads and bridges were damaged
or washed out. At least 30 homes were condemned (NCDC Storm Data Reports, 2006).
A flash flood on July 7, 2005 in Greenville, Pickens, and Spartanburg Counties caused $1.8 million
in property damage as more than thirty homes were inundated by floodwaters. More than 100
people had to be rescued from various locations throughout these counties as floodwaters washed
out roadways and bridges across the three counties.
HAZARD IDENTIFICATION
University of South Carolina Disaster Resistant University Plan
4:45
The most recent flood event occurred on August 10, 2005 and caused $1.5 million in property
damage when a pond overflowed into a new subdivision in Spartanburg County, affecting fifteen
new homes.
Probability of Future Events It can be expected that future flooding events will cause damage to property and vehicles
throughout the state. Probability will vary by campus location; thus an analysis of each campus is
performed. The specific probability for each campus can be found in Section 5: Hazard Analysis.
HAZARD IDENTIFICATION
University of South Carolina Disaster Resistant University Plan
4:46
Background Storm surge occurs when the water level of a tidally influenced body of water increases above the
normal astronomical high tide, and are most common in conjunction with coastal storms with
massive low-pressure systems with cyclonic flows such as hurricanes, tropical storms and
nor’easters. The low barometric pressure associated with these storms cause the water surface to
rise, and storms making landfall during peak tides have surge heights and more extensive flood
inundation limits. Storm surges will inundate coastal floodplains by dune overwash, tidal elevation
rise in inland bays and harbors, and backwater flooding through coastal river mouths. The duration
of a storm is the most influential factor affecting the severity and impact of storm surges.
A storm surge is often described as a wave that has outrun its generating source and become a
long period swell. It is often recognized as a large dome of water that may be 50 to 100 miles
wide and generally rising anywhere from four to five feet in a Category 1 hurricane to over 20 feet
in a Category 5 storm. The storm surge arrives ahead of the storm center’s actual landfall and the
more intense the storm is, the sooner the surge arrives. Water rise can be very rapid, posing a
serious threat to those who have not yet evacuated flood-prone areas. The surge is always highest
in the right-front quadrant of the direction in which the storm is moving. As the storm approaches
shore, the greatest storm surge will be to the north of the low-pressure system or hurricane eye.
Such a surge of high water topped by waves driven by hurricane force winds can be devastating to
coastal regions, causing severe beach erosion and property damage along the immediate shoreline.
Storm surge heights and associated waves are dependent on not only the storm’s intensity but also
upon the shape of the offshore continental shelf (narrow or wide) and the depth of the ocean
bottom (bathymetry). A narrow shelf, or one that drops steeply from the shoreline and
subsequently produces deep water close to the shoreline, tends to produce a lower surge but
higher and more powerful storm waves. The storms that generate the largest coastal storm surges
can develop year-round, but they are most frequent from late summer to early spring.
Location and Spatial Extent Areas along coasts, bays, inlets, and lakes are at risk to storm surge. The USC campuses located in
coastal areas (Baruch and Beaufort) were analyzed for surge risk. Specific information on the
locations at risk can be found in Section 5: Hazard Analysis.
Historical Occurrences The National Climatic Data Center reported just 18 events for storm surge events in the state from
1995 to March 2010. Just one of these occurred in a planning area county (Aiken County), which
does not pertain to coastal storm surge. However, hurricane and tropical storm events result in
surge and it is known hazard in the state. Specific historical occurrences are detailed for coastal
campuses in Section 5: Hazard Analysis.
Probability of Future Events It can be expected that future coastal storm surge events will cause damage to property and
coastal erosion along coastal areas in the state. Probability will vary by location; therefore, an
analysis of each campus is performed and can be found in Section 5: Hazard Analysis.
STORM SURGE
HAZARD IDENTIFICATION
University of South Carolina Disaster Resistant University Plan
4:47
Background An earthquake is movement or trembling of the ground produced by sudden displacement of rock
in the Earth's crust. Earthquakes result from crustal strain, volcanism, landslides or the collapse of
caverns. Earthquakes can affect hundreds of thousands of square miles, cause damage to property
measured in the tens of billions of dollars, result in loss of life and injury to hundreds of thousands
of persons; and disrupt the social and economic functioning of the affected area.
Most property damage and earthquake-related deaths are caused by the failure and collapse of
structures due to ground shaking. The level of damage depends upon the amplitude and duration
of the shaking, which are directly related to the earthquake size, distance from the fault, site and
regional geology. Other damaging earthquake effects include landslides, the down-slope movement
of soil and rock (mountain regions and along hillsides), and liquefaction, in which ground soil loses
the ability to resist shear and flows much like quick sand. In the case of liquefaction, anything
relying on the substrata for support can shift, tilt, rupture or collapse.
Most earthquakes are caused by the release of stresses accumulated as a result of the rupture of
rocks along opposing fault planes in the Earth’s outer crust. These fault planes are typically found
along borders of the Earth's 10 tectonic plates. The areas of greatest tectonic instability occur at
the perimeters of the slowly moving plates, as these locations are subjected to the greatest strains
from plates traveling in opposite directions and at different speeds. Deformation along plate
boundaries causes strain in the rock and the consequent buildup of stored energy. When the built-
up stress exceeds the rocks' strength, a rupture occurs. The rock on both sides of the fracture is
snapped, releasing the stored energy and producing seismic waves, generating an earthquake.
Earthquakes are measured in terms of their magnitude and intensity. Magnitude is measured using
the Richter Scale, an open-ended logarithmic scale that describes the energy release of an
earthquake through a measure of shock wave amplitude (Table 4.13). Each unit increase in
magnitude on the Richter Scale corresponds to a 10-fold increase in wave amplitude, or a 32-fold
increase in energy. Intensity is most commonly measured using the Modified Mercalli Intensity
(MMI) Scale based on direct and indirect measurements of seismic effects. The scale levels are
typically described using roman numerals, with a I corresponding to imperceptible (instrumental)
events, IV corresponding to moderate (felt by people awake), to XII for catastrophic (total
destruction). A detailed description of the Modified Mercalli Intensity Scale of earthquake intensity
and its correspondence to the Richter Scale is given in Table 4.14.
EARTHQUAKES
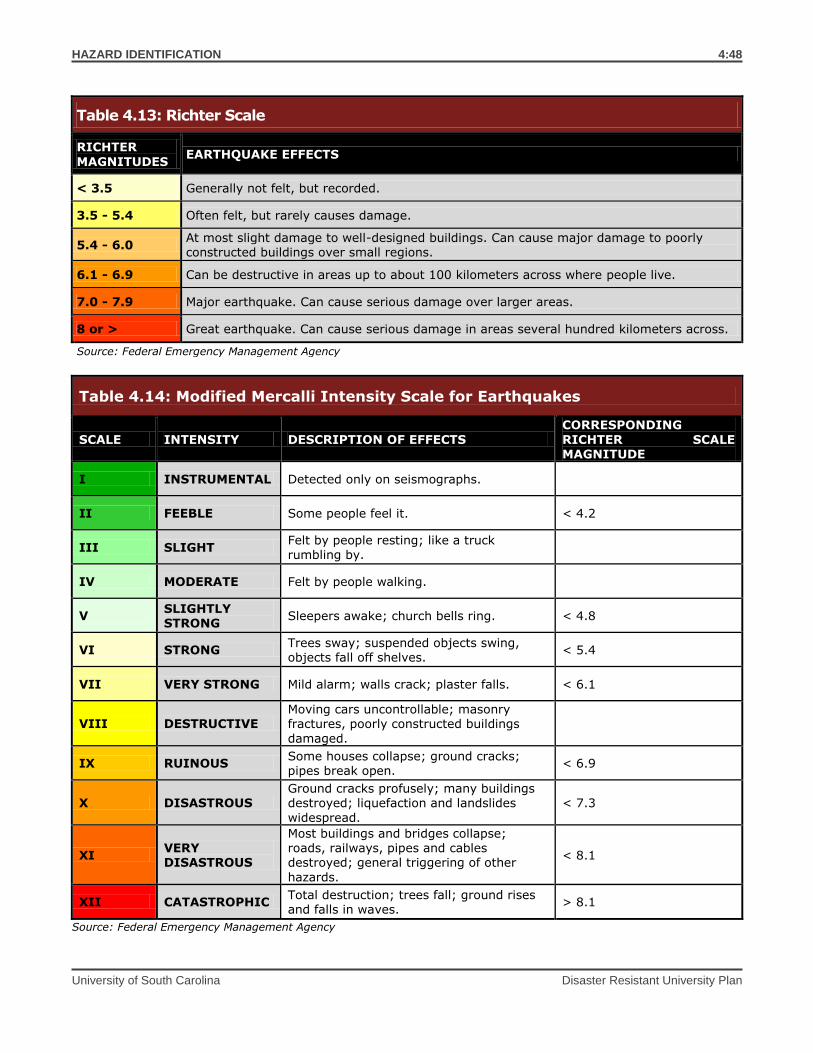
HAZARD IDENTIFICATION
University of South Carolina Disaster Resistant University Plan
4:48
Table 4.13: Richter Scale
RICHTER
MAGNITUDES EARTHQUAKE EFFECTS
< 3.5 Generally not felt, but recorded.
3.5 - 5.4 Often felt, but rarely causes damage.
5.4 - 6.0 At most slight damage to well-designed buildings. Can cause major damage to poorly constructed buildings over small regions.
6.1 - 6.9 Can be destructive in areas up to about 100 kilometers across where people live.
7.0 - 7.9 Major earthquake. Can cause serious damage over larger areas.
8 or > Great earthquake. Can cause serious damage in areas several hundred kilometers across.
Source: Federal Emergency Management Agency
Table 4.14: Modified Mercalli Intensity Scale for Earthquakes
SCALE INTENSITY DESCRIPTION OF EFFECTS
CORRESPONDING
RICHTER SCALE MAGNITUDE
I INSTRUMENTAL Detected only on seismographs.
II FEEBLE Some people feel it. < 4.2
III SLIGHT Felt by people resting; like a truck
rumbling by.
IV MODERATE Felt by people walking.
V SLIGHTLY STRONG
Sleepers awake; church bells ring. < 4.8
VI STRONG Trees sway; suspended objects swing, objects fall off shelves.
< 5.4
VII VERY STRONG Mild alarm; walls crack; plaster falls. < 6.1
VIII DESTRUCTIVE Moving cars uncontrollable; masonry fractures, poorly constructed buildings
damaged.
IX RUINOUS Some houses collapse; ground cracks; pipes break open.
< 6.9
X DISASTROUS Ground cracks profusely; many buildings destroyed; liquefaction and landslides
widespread.
< 7.3
XI VERY DISASTROUS
Most buildings and bridges collapse; roads, railways, pipes and cables destroyed; general triggering of other
hazards.
< 8.1
XII CATASTROPHIC Total destruction; trees fall; ground rises and falls in waves.
> 8.1
Source: Federal Emergency Management Agency
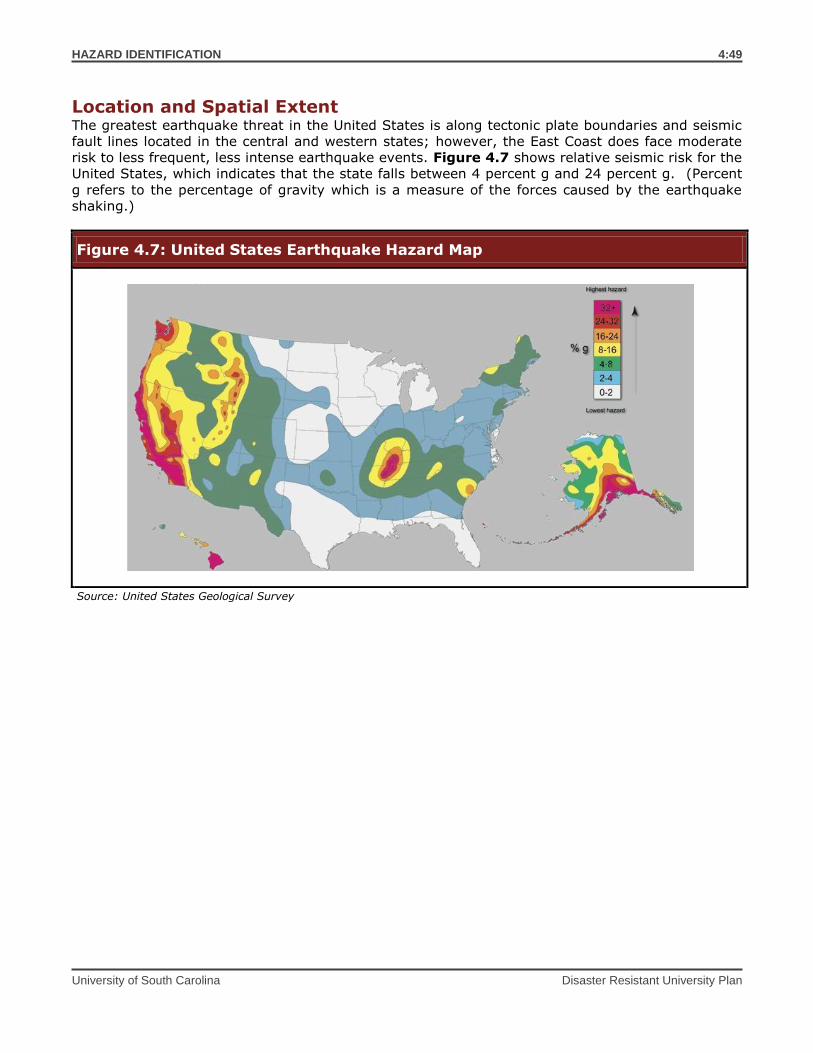
HAZARD IDENTIFICATION
University of South Carolina Disaster Resistant University Plan
4:49
Location and Spatial Extent The greatest earthquake threat in the United States is along tectonic plate boundaries and seismic
fault lines located in the central and western states; however, the East Coast does face moderate
risk to less frequent, less intense earthquake events. Figure 4.7 shows relative seismic risk for the
United States, which indicates that the state falls between 4 percent g and 24 percent g. (Percent
g refers to the percentage of gravity which is a measure of the forces caused by the earthquake
shaking.)
Figure 4.7: United States Earthquake Hazard Map
Source: United States Geological Survey
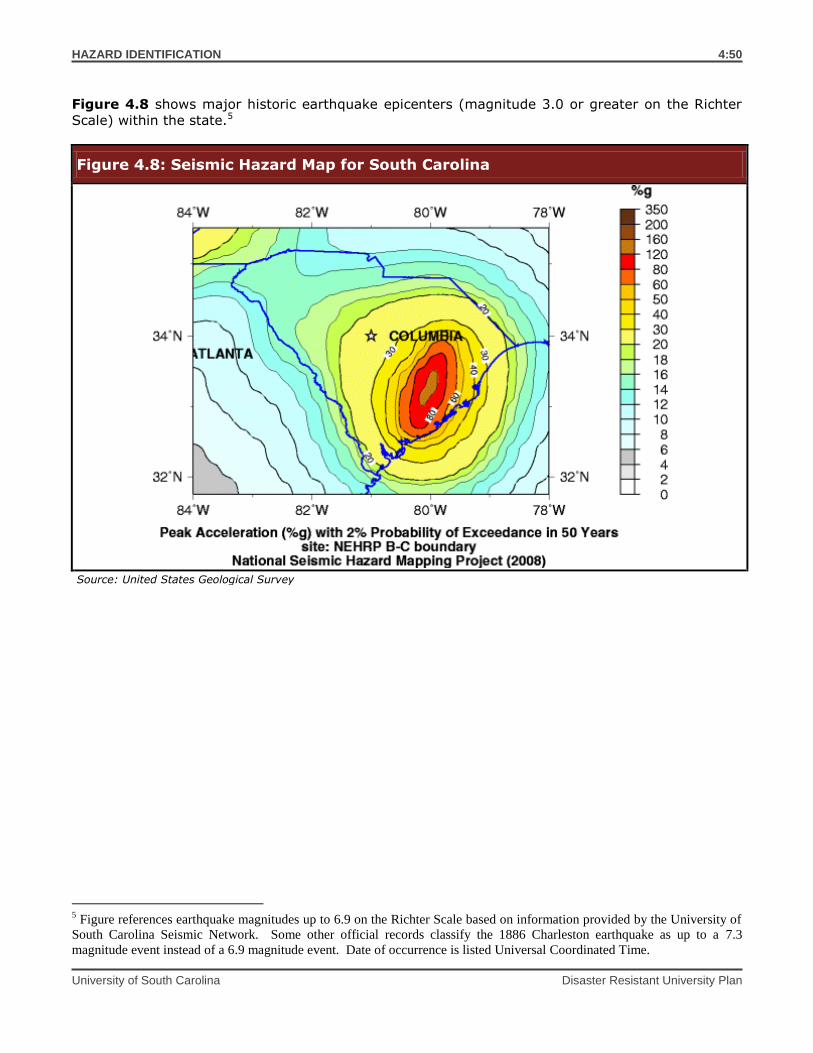
HAZARD IDENTIFICATION
University of South Carolina Disaster Resistant University Plan
4:50
Figure 4.8 shows major historic earthquake epicenters (magnitude 3.0 or greater on the Richter
Scale) within the state.5
Figure 4.8: Seismic Hazard Map for South Carolina
Source: United States Geological Survey
5 Figure references earthquake magnitudes up to 6.9 on the Richter Scale based on information provided by the University of
South Carolina Seismic Network. Some other official records classify the 1886 Charleston earthquake as up to a 7.3
magnitude event instead of a 6.9 magnitude event. Date of occurrence is listed Universal Coordinated Time.
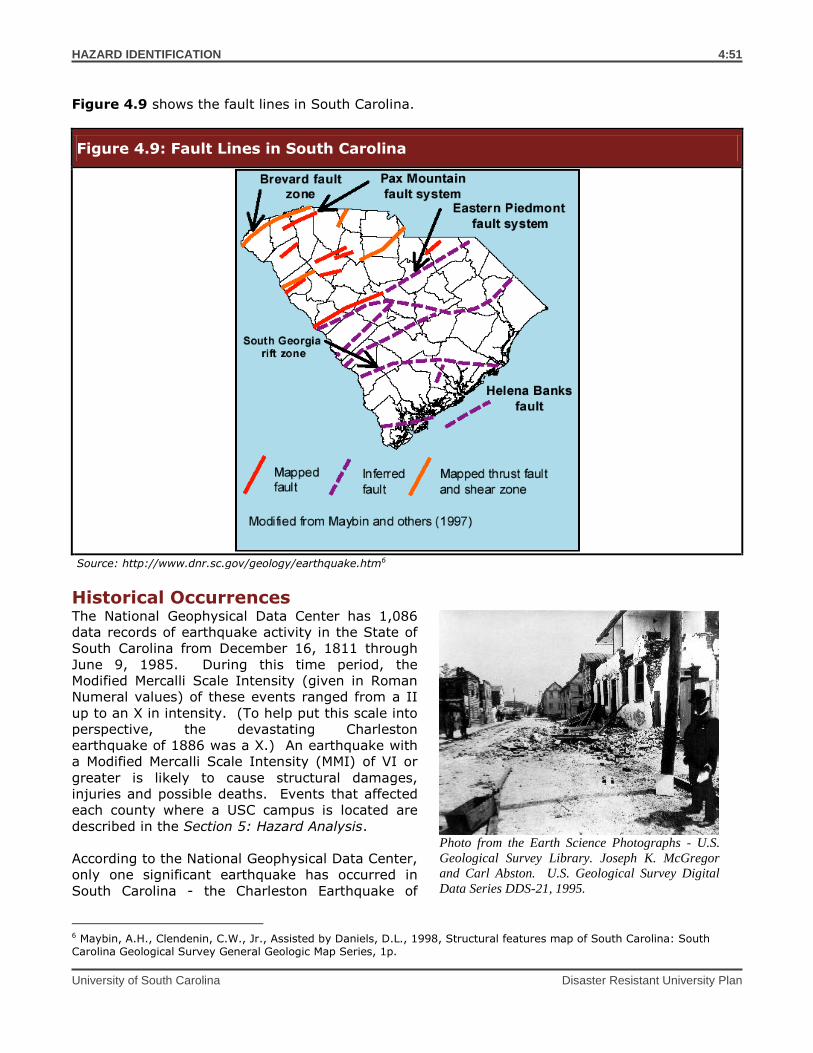
HAZARD IDENTIFICATION
University of South Carolina Disaster Resistant University Plan
4:51
Figure 4.9 shows the fault lines in South Carolina.
Figure 4.9: Fault Lines in South Carolina
Source: http://www.dnr.sc.gov/geology/earthquake.htm6
Historical Occurrences The National Geophysical Data Center has 1,086
data records of earthquake activity in the State of
South Carolina from December 16, 1811 through
June 9, 1985. During this time period, the
Modified Mercalli Scale Intensity (given in Roman
Numeral values) of these events ranged from a II
up to an X in intensity. (To help put this scale into
perspective, the devastating Charleston
earthquake of 1886 was a X.) An earthquake with
a Modified Mercalli Scale Intensity (MMI) of VI or
greater is likely to cause structural damages,
injuries and possible deaths. Events that affected
each county where a USC campus is located are
described in the Section 5: Hazard Analysis.
According to the National Geophysical Data Center,
only one significant earthquake has occurred in
South Carolina - the Charleston Earthquake of
6 Maybin, A.H., Clendenin, C.W., Jr., Assisted by Daniels, D.L., 1998, Structural features map of South Carolina: South Carolina Geological Survey General Geologic Map Series, 1p.
Photo from the Earth Science Photographs - U.S.
Geological Survey Library. Joseph K. McGregor
and Carl Abston. U.S. Geological Survey Digital
Data Series DDS-21, 1995.
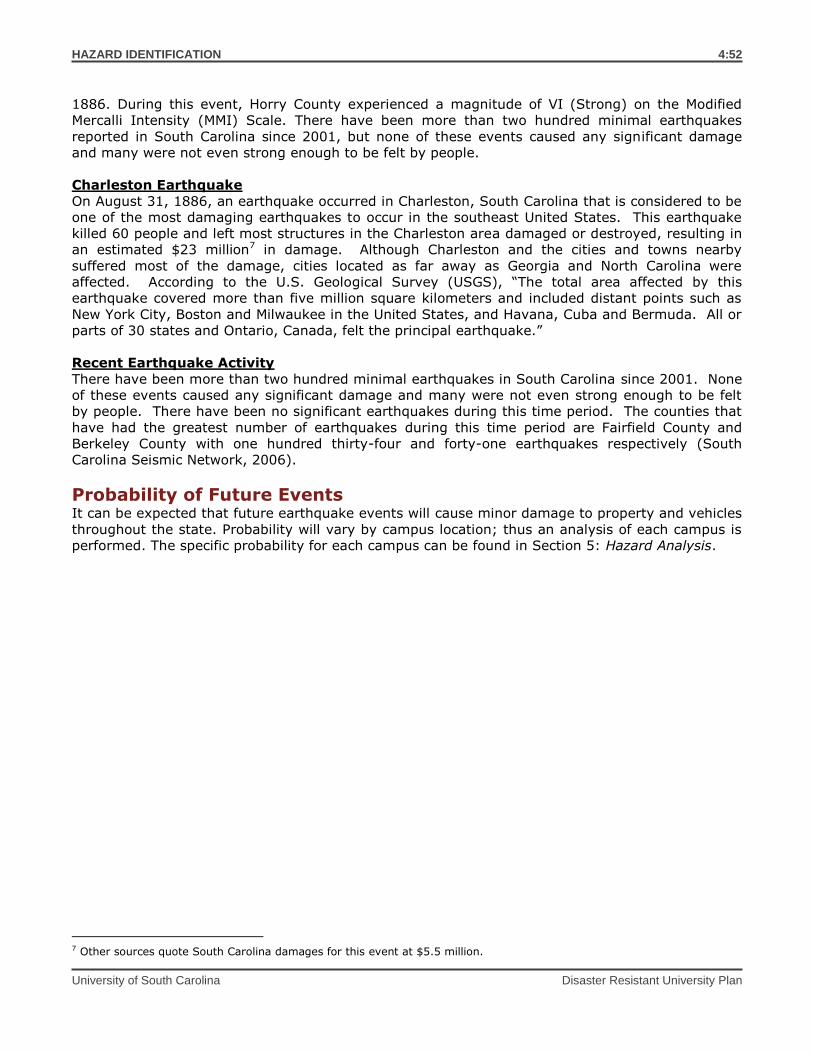
HAZARD IDENTIFICATION
University of South Carolina Disaster Resistant University Plan
4:52
1886. During this event, Horry County experienced a magnitude of VI (Strong) on the Modified
Mercalli Intensity (MMI) Scale. There have been more than two hundred minimal earthquakes
reported in South Carolina since 2001, but none of these events caused any significant damage
and many were not even strong enough to be felt by people.
Charleston Earthquake
On August 31, 1886, an earthquake occurred in Charleston, South Carolina that is considered to be
one of the most damaging earthquakes to occur in the southeast United States. This earthquake
killed 60 people and left most structures in the Charleston area damaged or destroyed, resulting in
an estimated $23 million7 in damage. Although Charleston and the cities and towns nearby
suffered most of the damage, cities located as far away as Georgia and North Carolina were
affected. According to the U.S. Geological Survey (USGS), “The total area affected by this
earthquake covered more than five million square kilometers and included distant points such as
New York City, Boston and Milwaukee in the United States, and Havana, Cuba and Bermuda. All or
parts of 30 states and Ontario, Canada, felt the principal earthquake.”
Recent Earthquake Activity
There have been more than two hundred minimal earthquakes in South Carolina since 2001. None
of these events caused any significant damage and many were not even strong enough to be felt
by people. There have been no significant earthquakes during this time period. The counties that
have had the greatest number of earthquakes during this time period are Fairfield County and
Berkeley County with one hundred thirty-four and forty-one earthquakes respectively (South
Carolina Seismic Network, 2006).
Probability of Future Events It can be expected that future earthquake events will cause minor damage to property and vehicles
throughout the state. Probability will vary by campus location; thus an analysis of each campus is
performed. The specific probability for each campus can be found in Section 5: Hazard Analysis.
7 Other sources quote South Carolina damages for this event at $5.5 million.
HAZARD IDENTIFICATION
University of South Carolina Disaster Resistant University Plan
4:53
Background Sea Level Rise is defined by NOAA as the mean rise in sea level. It is caused by two factors: 1) as
the ocean warms, sea water expands in volume; 2) continental ice shelves melt, increasing the
amount of water in the oceans. This leads to a greater area of land being inundated by sea water.
Rising sea level contributes to the loss of coastal wetlands (which provide protective buffers from
flood events), beach erosion, population and property in low areas, coastal habitats and species.
Further, flooding and hurricane events are more severe and affect a greater area.
Given that 600 million people live in an area that is less that 10 meters (33 feet) above sea level,
and the coastal population has doubled in the last 50 years, sea level rise is a formidable threat.
Location and Spatial Extent Sea level rise is occurring along coasts across the globe. However, it does not affect areas
uniformly and will be more severe in some places. Figure 4.10 shows a hypothetical situation of
sea level rise where the sea rises at 1.0, 2.0, 4.0 and 8.0 meters. This research comes from NOAA.
As can be seen, sea level rise affects the South Carolina coast in each scenario. In Section 5, maps
depict sea level rise scenarios along the coastal USC DRU campus counties.
SEA LEVEL RISE
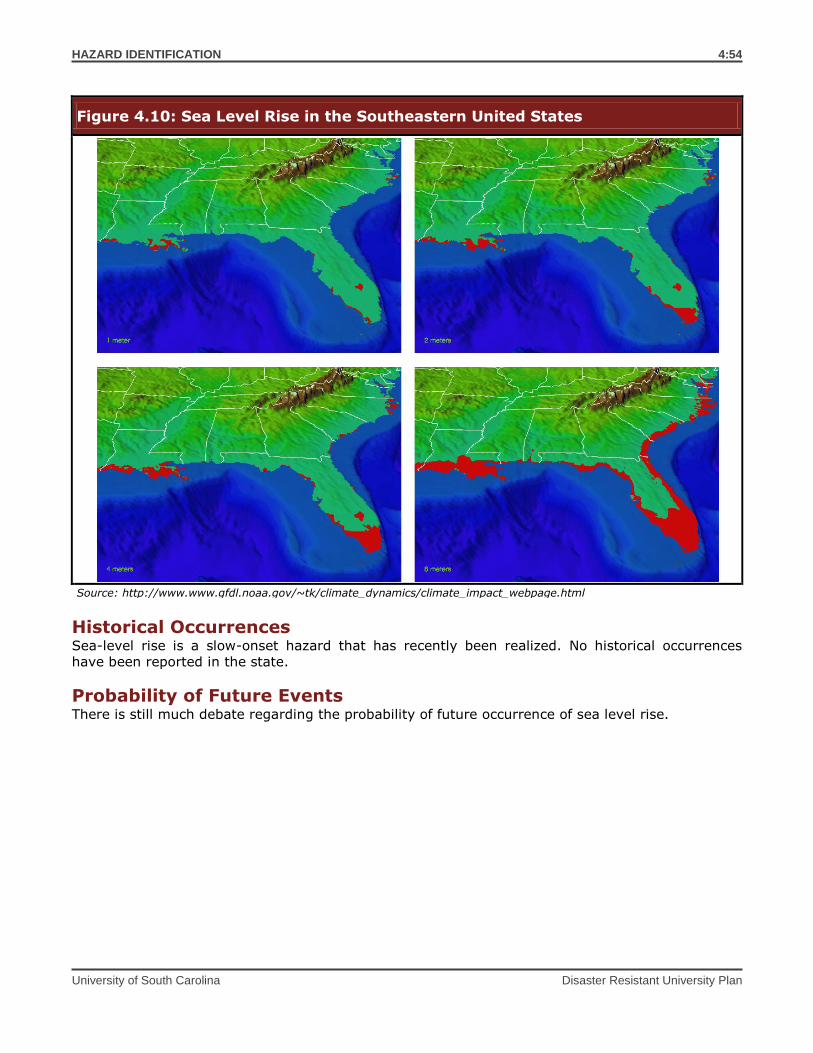
HAZARD IDENTIFICATION
University of South Carolina Disaster Resistant University Plan
4:54
Figure 4.10: Sea Level Rise in the Southeastern United States
Source: http://www.www.gfdl.noaa.gov/~tk/climate_dynamics/climate_impact_webpage.html
Historical Occurrences Sea-level rise is a slow-onset hazard that has recently been realized. No historical occurrences
have been reported in the state.
Probability of Future Events There is still much debate regarding the probability of future occurrence of sea level rise.
HAZARD IDENTIFICATION
University of South Carolina Disaster Resistant University Plan
4:55
Background A wildfire is any fire occurring in a wildland area (i.e. grassland, forest, brush land) except for fire
under prescription.8 Wildfires are part of the natural management of forest ecosystems, but may
also be caused by human factors. Over 80 percent of forest fires are started by negligent human
behavior such as smoking in wooded areas or improperly extinguishing campfires. The second most
common cause for wildfire is lightning.
There are three classes of wildland fires: surface fire, ground fire and crown fire. A surface fire is
the most common of these three classes and burns along the floor of a forest, moving slowly and
killing or damaging trees. A ground fire (muck fire) is usually started by lightning or human
carelessness and burns on or below the forest floor. Crown fires spread rapidly by wind and move
quickly by jumping along the tops of trees. Wildland fires are usually signaled by dense smoke that
fills the area for miles around.
State and local governments can impose fire safety regulations on home sites and developments to
help curb wildfire. Land treatment measures such as fire access roads, water storage, helipads,
safety zones, buffers, firebreaks, fuel breaks and fuel management can be designed as part of an
overall fire defense system to aid in fire control. Fuel management, prescribed burning and
cooperative land management planning can also be encouraged to reduce fire hazards.
Fire probability depends on local weather conditions, outdoor activities such as camping, debris
burning, and construction, and the degree of public cooperation with fire prevention measures.
Drought conditions and other natural hazards (such as tornadoes, hurricanes, etc.) increase the
probability of wildfires by producing fuel in both urban and rural settings. Forest damage from
hurricanes and tornadoes may also block interior access roads and fire breaks, pull down overhead
power lines, or damage pavement and underground utilities.
Many individual homes and cabins, subdivisions, resorts, recreational areas, organizational camps,
businesses and industries are located within high wildfire hazard areas. The increasing demand for
outdoor recreation places more people in wildlands during holidays, weekends and vacation
periods. Unfortunately, wildland residents and visitors are rarely educated or prepared for wildfire
events that can sweep through the brush and timber and destroy property within minutes.
Location and Spatial Extent Wildfires are a substantial threat in South Carolina. The South Carolina Forestry Commission
reports that it responds to over 3,000 fires annually. Essentially all areas are susceptible to
wildfire, though highly developed areas have a fairly low risk. Wildland and areas on the wildland-
urban fringe are at the greatest risk. Drought conditions can make a fire more likely in these locations and exacerbate the severity of the fire.
Future wildfires could pose interruptions to ongoing research efforts that draw in outside area for
laboratory experiments. Human respiratory health is another related concern with regard to
wildfires occurring nearby the USC campuses.
8 Prescription burning, or “controlled burn,” undertaken by land management agencies is the process of igniting fires under selected conditions, in accordance with strict parameters.
WILDFIRE
HAZARD IDENTIFICATION
University of South Carolina Disaster Resistant University Plan
4:56
Historical Occurrences Data was provided from the South Carolina Forestry Commission. There are 13.6 million acres of
forestland in the State of which 12.2 is commercial forestland. The Forestry Commission responds
to more than 3,000 wildland fires each year which typically burn around 20,000 acres in all. Most
of these fires (98%) are caused by human activity such as debris burning, arson, and camp fires.
The Forestry Commission also provided specific data of fires and acres burned for the Counties
where a USC campus resides between 1946 and 2009, a 63 year period. Nearly 78,000 fires
burned a combined 700,375 acres for the subject counties. This averages to 1,251 fires annually
burning a combined average of approximately 11,117 acres. Specific events by county and that
impacting the campuses are reported in Section 5: Hazard Analysis.
Probability of Future Events It can be expected that future wildfire events will occur in the proximately of USC campuses and
cause minor damage to property and vehicles throughout the state. Probability will vary by campus
location; thus an analysis of each campus is performed. Several factors influence probability
including climate and surrounding groundcover. In most cases wildfires can be contained that
greatest externality will be the secondary effects of smoke and ash in the air. The specific
probability for each campus can be found in Section 5: Hazard Analysis.