Embed Size (px)
Citation preview

Available online at www.sciencedirect.com
www.elsevier.com/locate/gca
ScienceDirect
Geochimica et Cosmochimica Acta 185 (2016) 182–197
Compositional variation within thick (>10 m) flow unitsof Mauna Kea Volcano cored by the Hawaii
Scientific Drilling Project
Shichun Huang a,⇑, Michael J. Vollinger b, Frederick A. Frey c, J. Michael Rhodes b,Qun Zhang d
aDepartment of Geoscience, University of Nevada, Las Vegas, United StatesbDepartment of Geosciences, University of Massachusetts Amherst, United States
cDepartment of Earth, Atmospheric and Planetary Sciences, Massachusetts Institute of Technology, United StatesdSchool of Earth and Space Sciences, University of Science and Technology of China, China
Available online 1 February 2016
Abstract
Geochemical analyses of stratigraphic sequences of lava flows are necessary to understand how a volcano works. Typicallyone sample from each lava flow is collected and studied with the assumption that this sample is representative of the flowcomposition. This assumption may not be valid. The thickness of flows ranges from <1 to >100 m. Geochemical heterogeneityin thin flows may be created by interaction with the surficial environment whereas magmatic processes occurring duringemplacement may create geochemical heterogeneities in thick flows. The Hawaii Scientific Drilling Project (HSDP) cored�3.3 km of basalt erupted at Mauna Kea Volcano. In order to determine geochemical heterogeneities in a flow, multiple sam-ples from four thick (9.3–98.4 m) HSDP flow units were analyzed for major and trace elements. We found that major elementabundances in three submarine flow units are controlled by the varying proportion of olivine, the primary phenocryst phase inthese samples. Post-magmatic alteration of a subaerial flow led to loss of SiO2, CaO, Na2O, K2O and P2O5, and as a conse-quence, contents of immobile elements, such as Fe2O3 and Al2O3, increase. The mobility of SiO2 is important because MaumaKea shield lavas divide into two groups that differ in SiO2 content. Post-magmatic mobility of SiO2 adds complexity to deter-mining if these groups reflect differences in source or process. The most mobile elements during post-magmatic subaerial andsubmarine alteration are K and Rb, and Ba, Sr and U were also mobile, but their abundances are not highly correlated with Kand Rb. The Ba/Th ratio has been used to document an important role for a plagioclase-rich source component for basaltfrom the Galapagos, Iceland and Hawaii. Although Ba/Th is anomalously high in Hawaiian basalt, variation in Ba abun-dance within a single flow shows that it is not a reliable indicator of a deep source component. In contrast, ratios involvingelements that are typically immobile, such as La/Nb, La/Th, Nb/Th, Ce/Pb, Sr/Nd, La/Sm, Sm/Yb, Nb/Zr, Nb/Y andLa/Yb, are uniform within the units, and they can be used to constrain petrogenetic processes. Nevertheless all elementsare mobile under some conditions. For example, a surprising result is that relative to other samples, the uppermost samplecollected from subaerial flow Unit 70, less than 1 m below the flow surface, is depleted in P, HREE and Y relative to all othersamples from this flow unit. This result is complementary to the P, REE and Y enrichment found in subaerial lava flows fromseveral Hawaiian shields, e.g., Kahoolawe and Koolau Volcanoes. These enrichments require mobilization of REE andfollowed by deposition a P-rich mineral.� 2016 Elsevier Ltd. All rights reserved.
http://dx.doi.org/10.1016/j.gca.2016.01.015
0016-7037/� 2016 Elsevier Ltd. All rights reserved.
⇑ Corresponding author.E-mail address: [email protected] (S. Huang).

S. Huang et al. /Geochimica et Cosmochimica Acta 185 (2016) 182–197 183
1. INTRODUCTION
Major objectives of the Hawaii Scientific DrillingProject (HSDP) were to determine the temporal variationin geochemical characteristics of lavas erupted at MaunaKea Volcano, and to understand the magmatic history ofa Hawaiian volcano as it approaches, overrides and recedesfrom the Hawaiian hotspot (Stolper et al., 1996). Followinga 1 km pilot hole, HSDP-1, drilled in 1996 (see papers inSpecial Session of Hawaii Scientific Drilling Project inJ. Geophys. Res. 1996), in 1999 Phase 1 of HSDP-2 cored3098 m of basalt; the upper 245 m are from Mauna Loavolcano, and lower 2853 m are from Mauna Kea Volcano.Within the Mauna Kea section, 345 flow units were identi-fied (DePaolo et al., 1999; Garcia et al., 2007). Above 1079mbsl the units are subaerial lava flows, and below this depththe core includes submarine pillow lavas, massive flow units(possibly intrusive) as well as hyaloclastites (DePaolo et al.,1999; Garcia et al., 2007). In 2005, the HSDP hole wasdeepened and recovered a further 408 m of basaltic lavas(3098–3506 mbsl), including submarine lavas and severaldikes (Rhodes et al., 2012). Analyses of these units showsignificant temporal variations in geochemical characteris-tics (see papers on Theme of Hawaii Scientific DrillingProject in Gechemistry, Geophysics, Geosystems 2005;Garcia et al., 2007; Blichert-Toft and Albarede, 2009;Rhodes et al., 2012; Nobre Silva et al., 2013).
It is often assumed that a single sample accurately repre-sents the composition of the flow unit. Therefore to charac-terize the temporal geochemical variations in the drill core,only one or two samples were analyzed for each HSDP flowunit. These samples, the HSDP reference suite, were dis-tributed to many analytical facilities, thereby ensuring thatmost geochemical analyses were conducted on the samerock powder. However, evaluation of geochemical varia-tions among units requires determining and understandingthe geochemical variability within a single unit. The objec-tive of this study is to determine the variability of major andtrace element abundances in multiple samples (5–7) fromfour thick, 9.3 to 98.4 m, flow units.
Previous study of the geochemical variation in a single,thick (11 m), Tertiary tholeiitic basalt flow from EasternIceland (Lindstrom and Haskin, 1981) showed that theintra-flow compositional variations exceed the analyticaluncertainty, and reflect variation in proportions of phe-nocrysts, groundmass minerals, and residual melt. Multiple(14) samples from a thick (15 m) highly alkalic, melilitenephelinite flow of the rejuvenated stage Honolulu Vol-canics in Oahu, Hawaii were studied by Clague et al.(2016). The intra-flow compositional variations are largerthan analytical uncertainty, and they are attributed to vari-able phenocryst proportions, segregation of pegmatoidveins, and mobility of Na, K, Sr, Ba, Rb, Pb and U in afluid phase. In contrast, Rhodes (1983) studied lavas from16 historical eruptions of Mauna Loa volcano in Hawaii,and found that most flows were homogeneous and thatthe geochemical variations in these lavas primarily reflectvariable olivine contents. As another example, the MaunaLoa 1984 eruption has been carefully studied by taking 67samples over three three-week eruption period from a
20 km long vent system, and their chemical compositionsare almost within analytical uncertainty (Rhodes, 1984).
2. SAMPLE SELECTION
It is imperative to distinguish geochemical features thatreflect the mantle source of basalt from those that reflectmagmatic processes, such as varying extents of meltingand crystallization occurring in the mantle and crust.Within the HSDP core, most of the flow units have experi-enced some postmagmatic alteration (e.g., Fig. 4 of Huangand Frey, 2003). The alteration environment varies withdepth: subaerial for the upper most units (245–1079 mbsl,834 m of core) and submarine for the underlying units(1079–3506 mbsl, 2427 m of core). We chose Unit 70, a9.3 m thick subaerial pahoehoe flow in the upper part ofthe core, to determine the effect of subaerial post-magmatic alteration. In the submarine part of the coreolivine-rich basalts are abundant and we studied Unit284, a 49.4 m thick unit, that has abundant glass analysesthat can be compared with the whole-rock compositions.
Some Mauna Kea units have compositional and isotopicsimilarities to tholeiitic basalt from Loihi Seamount. That islavas with relatively low SiO2, high Nb/Zr and 3He/4He anddistinctive Pb isotopic ratios. It is well known that shieldsforming Hawaiian islands define two subparallel spatialtrends, known as the Kea- and Loa-trends. Shield lavason these two trends have different compositional and iso-topic characteristics (e.g., Abouchami et al., 2005; Huanget al., 2011; Weis et al., 2011). Since Mauna Kea is aKea-trend volcano, and Loihi is a Loa-trend volcano, theirsimilarity in Pb and He isotopic compositions is a surpriseand one of the most significant results arising from theHSDP (Blichert-Toft et al., 2003; Eisele et al., 2003;Huang and Frey, 2003; Kurz et al., 2004; Rhodes andVollinger, 2004; Seaman et al., 2004; Stolper et al., 2004;Sharp and Renne, 2005; Garcia et al., 2007; Blichert-Toftand Albarede, 2009; Rhodes et al., 2012; Nobre Silvaet al., 2013). We selected submarine Units 292 (31.5 mthick) and 293 (98.4 m thick) to determine the composi-tional variation within thick units of the Low-SiO2 Group(Huang and Frey, 2003).
3. ANALYTICAL PROCEDURES
Samples were crushed in a tungsten carbide shatter boxat the University of Massachusetts at Amherst using theprocedure described by Rhodes and Vollinger (2004). Majorelement contents (Table 1a) and some trace element abun-dances (Table 1b) were determined by X-ray fluorescenceanalysis (XRF) at University of Massachusetts at Amherstfollowing the procedure described in Rhodes (1996) andRhodes and Vollinger (2004), and other trace element abun-dances (Table 1c) were determined by ICP-MS at MITfollowing the procedure described in Huang and Frey(2003). The analytical uncertainty and accuracy, as well asdata for USGS standard BHVO-2, are discussed in Huangand Frey (2003) and Rhodes and Vollinger (2004).
In order to evaluate the tungsten contamination result-ing from use of a tungsten carbide shatterbox to powder

Table 1aMajor element abundances (wt%) of samples from 4 units in HSDP2 core.a
Unit Sample Depth (mbsl) SiO2 TiO2 Al2O3 Fe2O3* MnO MgO CaO NazO K2O P2O5 Total LOI
Top 372.970 SR0166-1.3 373.8 46.64 2.98 13.83 13.96 0.19 10.14 9.91 1.77 0.13 0.27 99.82 2.1670 SR0166-6.2 375.4 46.80 2.91 13.43 13.51 0.18 10.05 10.50 1.93 0.13 0.32 99.77 0.4570 SR0166-6.8 375.5 46.96 2.90 13.48 13.39 0.18 9.95 10.53 1.93 0.13 0.32 99.78 0.4670 SR0167-1.6 376.9 46.83 3.19 13.88 14.16 0.19 9.17 9.90 1.84 0.17 0.34 99.65 2.0970b SR0167-5.9 378.4 47.85 3.00 13.46 13.39 0.18 8.94 10.39 2.11 0.22 0.33 99.87 0.2370 SR0168-2.9 380.4 47.32 3.05 13.49 13.75 0.18 9.11 10.23 1.90 0.16 0.32 99.52 1.00
Bottom 382.2
Top 2086.5284 SR0754-11.0 2087.5 46.70 1.83 10.02 12.68 0.17 17.84 8.44 1.46 0.24 0.17 99.55 0.31284 SR0756-1.0 2094.3 46.90 1.85 10.05 12.79 0.18 17.90 8.48 1.38 0.21 0.17 99.89 0.38284b SR0756-13.25 2098.7 46.38 1.77 9.69 12.69 0.17 18.91 8.16 1.54 0.21 0.17 99.69 0.00284 SR0757-17.1 2103.8 46.17 1.70 9.19 12.70 0.17 20.11 7.81 1.26 0.20 0.16 99.47 0.28284 SR0759-9.2 2112.4 46.01 1.66 9.06 12.84 0.18 20.69 7.73 1.10 0.17 0.15 99.58 0.57284b SR0762-4.6 2123.8 46.69 1.82 9.98 12.67 0.18 17.93 8.40 1.63 0.25 0.17 99.71 -0.10284 SR0764-2.3 2133.0 46.51 1.81 9.75 12.73 0.17 18.85 8.06 1.31 0.30 0.16 99.65 1.19
Bottom 2135.9
Top 2327.8292 SR0801-17.6 2328.9 47.01 2.35 11.90 13.21 0.18 12.44 10.46 1.54 0.29 0.21 99.58 3.72292 SR0803-0.0 2331.4 47.48 2.38 12.16 13.10 0.18 12.42 10.13 1.28 0.14 0.22 99.49 4.84292 SR0806-0.5 2337.1 46.89 2.33 11.90 13.15 0.18 12.41 9.93 1.73 0.38 0.21 99.11 0.98292 SR0808-8.8 2345.4 47.21 2.30 11.89 13.24 0.18 12.86 9.89 1.56 0.38 0.21 99.72 1.14292 SR0810-0.8 2350.3 47.07 2.37 12.06 13.31 0.18 12.73 10.27 1.39 0.10 0.22 99.70 4.32292b SR0814-14.4 2357.1 47.18 2.35 12.03 13.17 0.18 12.60 10.13 1.56 0.10 0.22 99.51 3.71
Bottom 2359.3
Top 2359.3293 SR0820-2.8 2374.5 47.14 2.31 11.97 13.23 0.18 12.55 9.68 1.56 0.61 0.21 99.42 3.59293 SR0820-8.1 2376.1 47.35 2.32 11.76 13.34 0.19 13.39 9.74 1.25 0.08 0.22 99.63 5.18293 SR0823-10.80 2391.4 47.54 2.39 12.06 13.20 0.18 12.30 10.23 1.38 0.10 0.22 99.60 4.78293b SR0826-20.6 2414.2 47.37 2.32 11.93 13.14 0.18 12.69 9.92 1.69 0.16 0.22 99.61 4.54293 SR0829-12.70 2429.5 47.09 2.32 12.01 13.09 0.18 12.23 9.90 1.92 0.51 0.21 99.45 1.60293 SR0832-2.40 2443.7 47.24 2.36 12.06 13.12 0.18 12.24 10.31 1.74 0.14 0.22 99.61 6.89293 SR0834-7.50 2455.2 47.58 2.35 11.94 13.34 0.18 12.91 9.72 1.09 0.09 0.22 99.42 1.75
Bottom 2457.7
a All data are obtained by XRF at Univ. of Mass.; see Rhodes and Vollinger (2004) for discussion of accuracy and precision.b Samples from reference suite (DePaolo et al., 1999).* Total Fe as Fe2O3.
184 S. Huang et al. /Geochimica et Cosmochimica Acta 185 (2016) 182–197
the HSDP samples (Rhodes and Vollinger, 2004), four sam-ples, from each of the Units 70, 284, 292 and 293, were mea-sured for W abundance at University of Science andTechnology of China. About 4 g of powder was dissolvedin a mixture of concentrated HNO3 and HF. Then W waspurified using a cation column as described in Qin et al.(2007) and W abundance was determined using a ELANDRC II ICP-MS and a synthetic W standard solution.
4. RESULTS
4.1. Comparison between results from XRF and ICP-MS
Six trace elements, Zr, Rb, Sr, Ba, Y and Nb, were ana-lyzed by both XRF and ICP-MS. Except for Y, both tech-niques obtained similar abundances for these elements(Fig. 1); however, Y abundances obtained by ICP-MS are�15% higher than those obtained by XRF. This result issimilar to that obtained based on HSDP reference suitesamples (Huang and Frey, 2003), and reflects different
values used for standard reference materials when con-structing calibration curves for ICP-MS and XRF analyses.A future inter-lab calibration of XRF and ICP-MSmeasurements involving Y standard prepared from Y metalshould solve this discrepancy.
4.2. Contamination from WC shatterbox
The procedures used to prepare samples for analysiscontaminate the sample (e.g., Hickson and Juras, 1986;Norman et al., 1989; Frey et al., 1991a; Weis et al., 2005;Sertek et al., 2015). The use of tungsten carbide to powdersamples is well known to introduce significant amounts ofCo, W, Ta and C and in some cases Nb to the sample pow-der. However there are few measurements of how muchratios such as Nb/Zr and Nb/Ta are changed by use ofWC to prepare rock powders. Our W data, 3–9 ppm,(Table 1c) on four samples from HSDP Units 70, 284,292 and 293 are much higher than in typical Hawaiian lavas(<0.5 ppm; Ireland et al., 2009). Also Nb/Ta ranges from

Table 1bTracer element abundances (ppm) of samples from 4 units in HSDP2 core by XRF.a
Unit Sample Nb Zr Y Sr Rb Ga Zn Ni Cr V Ba
70 SR0166-1.3 16.0 199 28.8 376 1.4 23 132 269 407 260 18970 SR0166-6.2 15.8 196 28.9 410 0.6 22 117 248 401 248 12870 SR0166-6.8 15.8 195 29.0 409 0.4 22 120 252 390 252 14170 SR0167-1.6 17.2 210 31.7 384 1.2 23 140 225 328 249 23870b SR0167-5.9 16.4 201 29.6 404 0.6 23 124 201 312 255 14570 SR0168-2.9 16.7 203 30.3 400 0.8 23 132 213 317 268 186
284 SR0754-11.0 9.5 103 17.7 228 3.8 14 112 983 955 190 61284 SR0756-1.0 9.6 105 18.0 232 3.3 14 112 972 963 196 58284b SR0756-13.25 9.5 102 17.5 226 3.5 14 111 992 960 191 57284 SR0757-17.1 8.8 96 16.6 214 3.0 13 111 1151 997 184 60284 SR0759-9.2 8.7 94 16.3 210 2.7 13 109 1164 965 178 46284b SR0762-4.6 9.6 104 17.8 232 3.9 14 112 928 1004 197 62284 SR0764-2.3 9.4 102 17.4 227 5.7 13 112 963 966 198 107
292 SR0801-17.6 12.2 127 21.7 252 4.8 18 122 469 643 244 105292 SR0803-0.0 11.7 124 21.4 246 2.2 17 117 455 671 230 135292 SR0806-0.5 12.7 131 21.9 274 7.0 18 122 459 637 249 108292 SR0808-8.8 12.5 128 21.7 277 6.6 17 123 501 675 248 99292 SR0810-0.8 12.0 126 21.6 273 1.0 18 121 471 647 241 91292b SR0814-14.4 12.2 126 21.6 280 0.5 17 120 458 646 232 69
293 SR0820-2.8 12.1 126 21.4 254 12.3 17 121 448 626 249 168293 SR0820-8.1 11.6 121 20.9 236 1.0 17 122 517 636 225 117293 SR0823-10.80 11.9 125 21.6 255 0.9 17 125 485 641 229 146293b SR0826-20.6 11.7 122 21.0 272 2.6 17 116 458 624 210 118293 SR0829-12.70 12.5 128 21.5 267 10.1 17 120 440 616 235 135293 SR0832-2.40 12.4 131 22.3 300 1.6 19 123 462 659 236 113293 SR0834-7.50 11.2 119 20.6 214 1.4 17 117 522 716 210 93
a All data are obtained by XRF at Univ. of Mass.; see Rhodes and Vollinger (2004) for discussion of accuracy and precision.b Samples from reference suite (DePaolo et al., 1999).
S. Huang et al. /Geochimica et Cosmochimica Acta 185 (2016) 182–197 185
10.5 to 15.7 (Huang and Frey, 2003; Rhodes et al., 2012),lower and more variable compared to MORB and OIB(16.7 ± 1.8 and 17.1 ± 2, respectively, Kamber andCollerson, 2000). In contrast, Nb/Zr in HSDP tholeiiticlavas ranges from 0.07 to 0.10, similar to other Kea trendvolcanoes, such as Kilauea (e.g., Fig. 13 of Huang andFrey, 2003).
4.3. Unit 70 (372.9–382.2 mbsl)
This unit is a moderately olivine-phyric subaerial pahoe-hoe flow, and is classified as post-shield stage tholeiitic lava(Huang and Frey, 2003). Six samples including one refer-ence suite sample were analyzed by XRF, and five byICP-MS (Table 1). The MgO content in these samplesranges from 8.94% to 10.14% (Table 1). They have lowerSiO2 and higher Fe2O3 (total Fe) contents than the Low-SiO2 shield lavas deeper in the core (below 834 mbsl)(Fig. 2). These geochemical characteristics, low Si and highFe, of post-shield stage lavas, are inferred to reflect meltsegregation at higher pressure than shield stage lavas(Frey et al., 1990, 1991a; Huang and Frey, 2003; Rhodesand Vollinger, 2004; Rhodes et al., 2012).
Compared with the trends of the �140 HSDP referencesuite samples, Unit 70 samples form steeper, near verticaltrends in plots of SiO2, Fe2O3, P2O5 and K2O vs. MgO(Fig. 2). Such trends are not consistent with liquid lines of
descent (e.g., black solid lines in Fig. 2a and b) or HSDPwhole rock trends. Unit 70 samples form negativeLOI-SiO2 and positive LOI-Fe2O3 trends (see inserts inFig. 2a and b), implying that the steep trends for Unit 70samples in Fig. 2 reflect post-magmatic subaerial alteration.Based on criteria used by Huang and Frey (2003) thataltered HSDP lavas have K2O/P2O5 < 1, all samples fromthis flow have been affected by substantial post-magmaticalteration; the five samples have K2O/P2O5 < 0.67 andBa/Rb > 75 (Fig. 3).
SR166-1.3, with the largest LOI (2.16%) among all Unit70 samples, has the lowest P2O5 content (Fig. 2f; Table 1).It also has the lowest abundances of HREEs andY (Table 1) and lowest Lu/Hf (0.0626, compared to0.0636–0.0653 in the other four Unit 70 samples) (Fig. 2finset). This observation is complementary to the enrich-ment of Y and REEs in some lavas from KahoolaweVolcano (Fodor et al., 1989), and Koolau Volcano, Sample69TAN-2 (Roden et al., 1984; Frey et al., 1994). Clearly,under some subaerial conditions REEs are mobile appar-ently by transport in a fluid and incorporation into sec-ondary phosphate minerals (Fodor et al., 1989).
The Ni content in Unit 70 samples ranges from 201 ppmto 269 ppm (Table 1), and it is positively correlated withMgO content, with a slope similar to that of the HSDP-2reference suite samples, reflecting minor olivine control(Fig. 4).

Table 1cTracer element abundances (ppm) of samples from 4 units in HSDP2 core by ICP-MS.a
Unit Sample Sc Rb Sr Y Zr Nb Ba La Ce Pr Nd Sm Eu Gd Tb Dy Ho
70 SR0166-1.3 29.2 2.06 350 31.1 189 16.1 156 14.3 35.1 5.37 25.3 6.66 2.30 7.02 1.11 6.04 1.1270 SR0166-6.8 29.2 1.14 391 31.7 188 16.3 118 14.2 35.2 5.37 25.5 6.74 2.37 6.99 1.11 6.03 1.1170 SR0167-1.6 30.1 1.92 367 35.6 203 17.6 208 15.8 37.3 5.86 27.5 7.37 2.49 7.71 1.22 6.65 1.2570b SR0167-5.9 29.3 1.38 375 32.8 193 16.5 137 14.8 37.4 5.67 26.2 7.13 2.31 7.27 1.14 6.31 1.2070 SR0168-2.9 30.8 1.42 380 33.4 196 17.0 157 14.9 35.8 5.53 26.7 7.05 2.42 7.33 1.14 6.24 1.16
284 SR0754-11.0 22.4 4.02 224 19.8 100 9.6 67.2 8.02 19.9 2.97 13.9 3.62 1.26 4.06 0.644 3.67 0.72284 SR0756-1.0 26.0 3.85 244 21.5 107 10.5 66.3 8.56 21.5 3.17 15.0 3.96 1.40 4.32 0.697 3.99 0.77284b SR0756-13.25 24.3 3.83 225 19.6 101 9.6 61.9 7.64 19.3 2.95 13.7 3.67 1.23 3.94 0.646 3.64 0.70284 SR0757-17.1 23.2 3.39 215 19.0 95.6 9.2 63.2 7.54 18.6 2.80 13.0 3.46 1.19 3.76 0.619 3.45 0.66284 SR0759-9.2 22.2 2.88 207 18.4 90.8 8.9 49.9 7.33 18.1 2.71 12.6 3.39 1.16 3.63 0.589 3.33 0.65284b SR0762-4.6 22.9 3.86 221 19.3 98.3 9.5 64.3 7.95 19.3 2.99 14.0 3.64 1.24 3.88 0.634 3.54 0.71284 SR0764-2.3 22.7 5.28 214 19.0 96.0 9.2 87.3 7.81 19.0 2.84 13.3 3.56 1.26 3.84 0.622 3.56 0.69
292 SR0801-17.6 27.5 5.09 251 24.5 126 12.6 87.4 9.84 24.4 3.66 17.1 4.58 1.57 4.93 0.791 4.51 0.87292 SR0803-0.0 28.0 2.44 243 24.7 123 12.6 109 9.71 24.1 3.60 17.1 4.52 1.55 4.84 0.777 4.50 0.87292 SR0806-0.5 26.7 7.29 269 25.0 126 12.8 101 10.2 25.1 3.81 17.4 4.70 1.64 5.09 0.817 4.59 0.88292 SR0808-8.8 27.3 6.71 271 24.3 123 12.6 91.9 9.92 24.3 3.65 17.1 4.59 1.60 4.96 0.815 4.51 0.87292 SR0810-0.8 27.1 1.37 267 24.2 123 12.4 70.6 9.78 24.1 3.61 17.0 4.45 1.56 4.88 0.795 4.40 0.86292b SR0814-14.4 26.4 1.24 262 23.2 123 12.0 63.5 9.58 23.6 3.65 17.2 4.59 1.55 4.87 0.802 4.31 0.87
293 SR0820-2.8 27.5 12.5 252 24.4 126 12.6 137 9.80 24.1 3.62 17.1 4.47 1.54 4.98 0.788 4.52 0.86293 SR0820-8.1 25.4 1.46 226 22.9 116 11.8 95.5 9.35 23.0 3.43 16.0 4.28 1.49 4.64 0.751 4.26 0.81293 SR0823-10.80 26.8 1.58 248 24.0 122 12.3 97.1 9.66 23.8 3.58 16.6 4.47 1.52 4.80 0.788 4.40 0.85293b SR0826-20.6 27.6 3.07 256 23.2 122 12.0 103 9.38 23.8 3.63 16.7 4.44 1.50 4.69 0.767 4.39 0.84293 SR0829-12.70 22.9 10.0 267 24.5 126 12.7 113 9.90 24.3 3.69 17.2 4.57 1.59 4.96 0.799 4.52 0.87293 SR0832-2.40 28.3 2.34 292 25.1 129 12.8 96.5 9.93 24.6 3.72 17.5 4.63 1.59 5.00 0.815 4.50 0.89293 SR0834-7.50 26.1 1.51 211 23.5 119 11.9 77.5 9.37 23.1 3.49 16.6 4.46 1.55 4.78 0.771 4.39 0.84
BHVO-2, n = 4 30.7 9.13 374 27.1 165 18.2 131 14.8 37.0 5.36 23.8 6.07 2.05 6.09 0.933 5.26 0.98
Unit Sample Er Tm Yb Lu Hf Ta Pb Th U W
70 SR0166-1.3 2.80 0.383 2.17 0.300 4.80 1.07 1.07 1.12 0.28070 SR0166-6.8 2.82 0.386 2.19 0.308 4.77 1.09 1.04 1.10 0.22370 SR0167-1.6 3.14 0.422 2.38 0.339 5.20 1.16 1.22 1.23 0.51170b SR0167-5.9 2.90 0.393 2.33 0.323 5.07 1.16 1.18 1.14 0.26070 SR0168-2.9 2.90 0.384 2.27 0.320 4.94 1.13 1.04 1.15 0.239 4.4
284 SR0754-11.0 1.84 0.253 1.51 0.213 2.60 0.81 0.67 0.61 0.191284 SR0756-1.0 1.95 0.272 1.56 0.221 2.81 0.87 0.69 0.65 0.212284b SR0756-13.25 1.75 0.251 1.46 0.218 2.49 0.77 0.66 0.59 0.184284 SR0757-17.1 1.73 0.241 1.41 0.197 2.45 0.76 0.61 0.58 0.189284 SR0759-9.2 1.67 0.236 1.38 0.202 2.35 0.69 0.59 0.55 0.183 8.9284b SR0762-4.6 1.77 0.251 1.51 0.207 2.53 0.78 0.69 0.62 0.180284 SR0764-2.3 1.80 0.249 1.43 0.206 2.52 0.74 0.62 0.59 0.196
292 SR0801-17.6 2.21 0.314 1.78 0.250 3.19 0.88 0.80 0.77 0.238292 SR0803-0.0 2.22 0.307 1.76 0.251 3.22 0.82 0.80 0.74 0.289 3.2292 SR0806-0.5 2.27 0.303 1.83 0.257 3.33 1.01 0.84 0.77 0.234292 SR0808-8.8 2.26 0.304 1.80 0.255 3.25 1.03 0.81 0.77 0.239292 SR0810-0.8 2.17 0.304 1.79 0.250 3.17 0.84 0.79 0.75 0.281292b SR0814-14.4 2.20 0.309 1.77 0.253 3.24 0.84 0.81 0.79 0.304
293 SR0820-2.8 2.20 0.307 1.79 0.245 3.19 0.95 0.80 0.75 0.256293 SR0820-8.1 2.11 0.287 1.68 0.235 3.01 0.78 0.75 0.71 0.279293 SR0823-10.80 2.17 0.305 1.76 0.242 3.12 0.83 0.78 0.74 0.248293b SR0826-20.6 2.09 0.334 1.72 0.244 3.14 0.80 0.86 0.73 0.276293 SR0829-12.70 2.27 0.304 1.80 0.257 3.20 1.00 0.81 0.76 0.237 8.9293 SR0832-2.40 2.30 0.316 1.84 0.264 3.24 0.90 0.81 0.79 0.311293 SR0834-7.50 2.23 0.297 1.75 0.247 3.12 0.81 0.76 0.73 0.245
BHVO-2, n = 4 2.51 0.341 1.97 0.277 4.29 1.22 1.10 1.27 0.431
a All data are obtained by ICP-MS at Mass. Inst. of Tech.; see Huang and Frey (2003) for discussion of accuracy and precision.b Samples from reference suite (DePaolo et al., 1999).
186 S. Huang et al. /Geochimica et Cosmochimica Acta 185 (2016) 182–197
Ba
0
100
200
300
400
0 100 200 300 400ICP-MS
slope=1
Y
0
10
20
30
40
0 10 20 30 40ICP-MS
slope=1 Nb
0
10
20
30
0 10 20 30ICP-MS
slope=1
Zr
0
100
200
300
0 100 200 300ICP-MS
slope=1
Rb
0
5
10
15
0 5 10 15ICP-MS
Sr
0
200
400
600
800
0 200 400 600 800ICP-MS
slope=1
Unit 70Unit 284Unit 292Unit 293
HSDP-2 referencesample field HSDP-2 reference
sample field
HSDP-2 referencesample field
HSDP-2 referencesample field
HSDP-2 referencesample fieldHSDP-2 reference
sample field
2 sigma
Fig. 1. Comparison of trace element abundances obtained by ICP-MS and XRF. The HSDP-2 reference sample field is from Huang and Frey(2003) and Rhodes and Vollinger (2004). Based on multiple analyses of BHVO-2, the two standard deviation uncertainties are indicated in theupper left of each panel.
S. Huang et al. /Geochimica et Cosmochimica Acta 185 (2016) 182–197 187
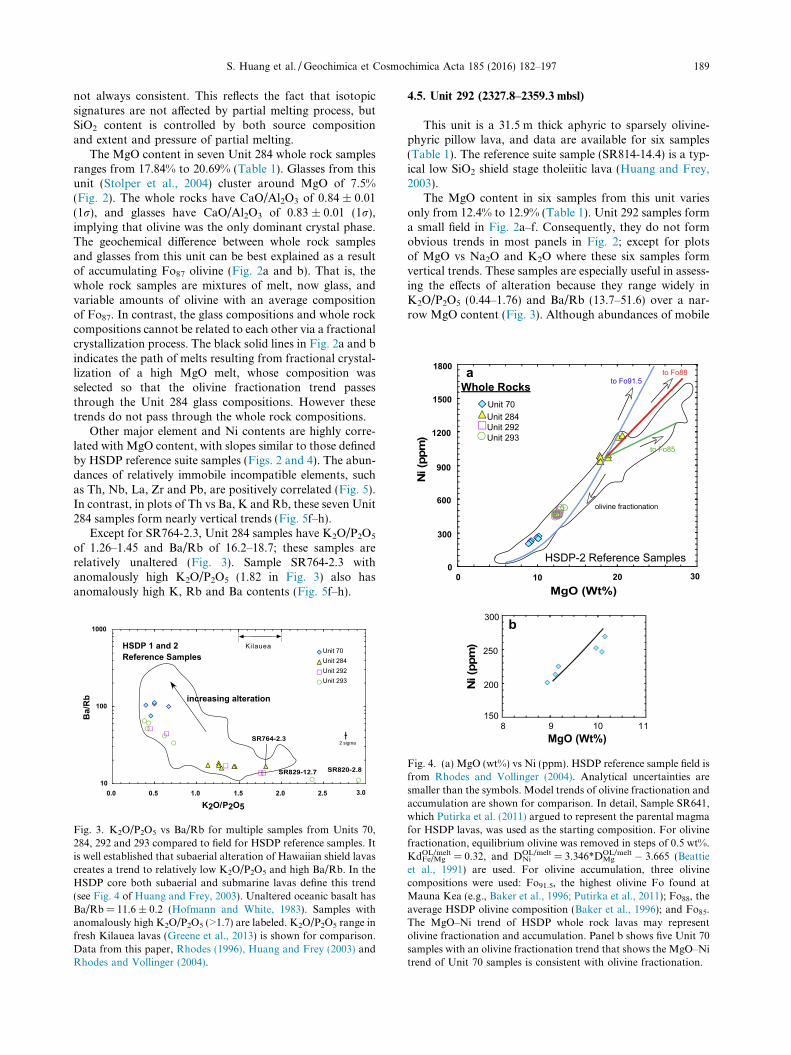
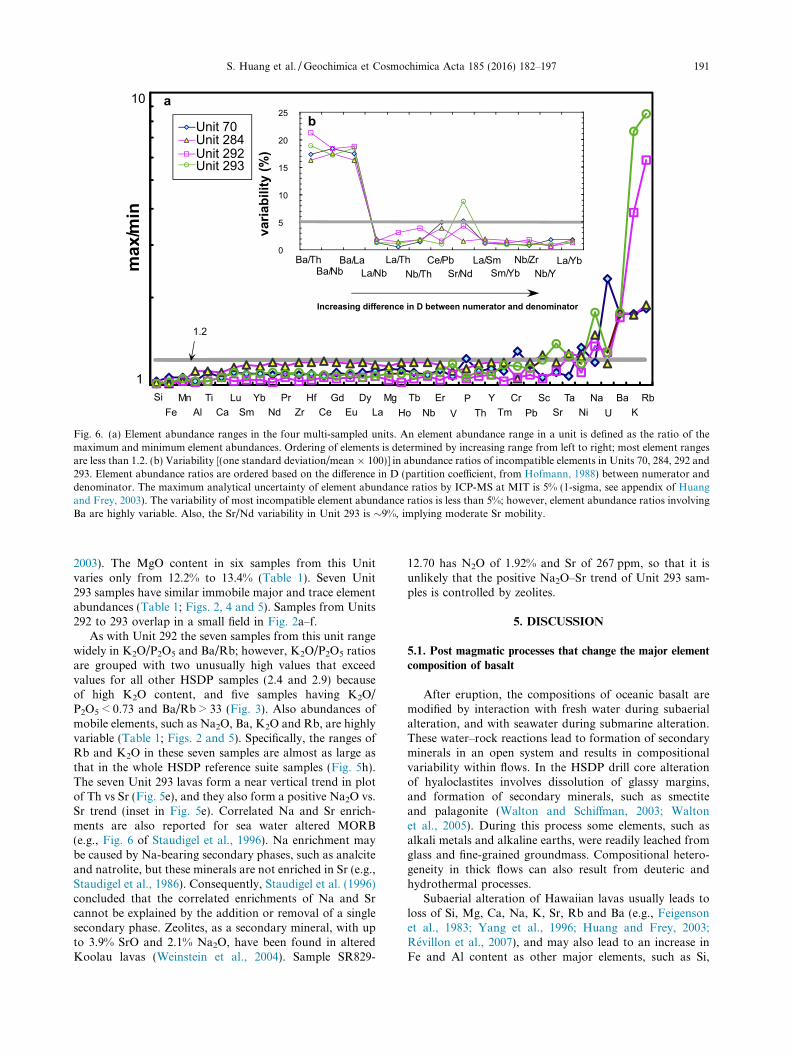
Abundances of relatively non-mobile incompatibleelements, such as Th, Nb, La, Ce, Pb, Zr, Hf and Ti,are positively correlated with each other (Fig. 5). Withineach unit, their abundances range is less than a factor of1.2 (Table 1, Fig. 6a). In contrast, abundances of K, Rband U are not correlated with Th abundance (Fig. 5);K, Rb and U are commonly mobile during post-magmatic alteration of Hawaiian lavas (e.g., Lipmanet al., 1990; Kennedy et al., 1991; Yang et al., 1996),and their abundances range widely, factors of 2.3 for U,1.8 for Rb, 1.7 for K (Table 1, Fig. 6a). Ba abundancesare correlated with Th abundances in most HSDP sam-ples. In the Unit 70 flow, however, Ba forms a steep trendwith Th, intersecting the Th axis (Fig. 5f), that is unlikelyto be a magmatic trend.
4.4. Unit 284 (2086.5–2135.9 mbsl)
This is a highly olivine-phyric pillow unit and data areavailable for seven samples (Table 1). Whole-rock samplesfrom this unit are close to the lower boundary of the HighSiO2 shield stage field in Fig. 2a; however, based on Pb andHe isotopic ratios, this unit is classified as a Low SiO2
shield stage tholeiitic lava (Huang and Frey, 2003). Thisdepth interval (1950–2230 mbsl), in fact, represents a tran-sition from high SiO2 to low SiO2 compositions (Fig. 7 ofHuang and Frey, 2003; Fig. 20 of Stolper et al., 2004).The compositions and isotopic signatures of HSDP lavasare correlated, and differ in the two SiO2 groups of shieldstage Mauna Kea lavas; however in detail, the geochemicaland isotopic boundaries between these two SiO2 groups are

11
12
13
14
15
0 10 20 30MgO (Wt%)
b
HSDP-2
45
47
49
51
43
Unit 70Unit 284Unit 292Unit 293
Whole RocksLow SiO2Tholeiite
a
High SiO2Tholeiite
glass
to Fo87
to Fo87
4
6
8
10
12
0 10 20 30MgO (Wt%)
6
8
10
12
14
16
Whole Rocks
13.4
13.6
13.8
14.0
0.0 0.5 1.0 1.5 2.0 2.5
d
c
0.5
1.5
2.5
3.5
0.1
0.2
0.3
0.4
0 10 20 30MgO (Wt%)
SR0166-1.3
Unit 70Unit 284Unit 292Unit 293
Whole Rocks
0
1
2
3
0.0
0.2
0.4
0.6
0.8
0 10 20 30MgO(Wt%)
Unit 70Unit 284Unit 292Unit 293
Whole Rocks
e
f
g
h
Fig. 2. MgO vs SiO2, Fe2O3, Al2O3, CaO, TiO2, P2O5, Na2O and K2O (in wt%) in multiple samples from four units. Panels a, b and c haveinsets for LOI vs SiO2, Fe2O3 and Al2O3, respectively and Panel f has an inset for Lu/Hf vs P2O5 for Unit 70 samples. Whole rock HSDP-2reference sample fields are from Rhodes and Vollinger (2004). Note in Panel a that two distinct fields are defined for SiO2. In all panels, glassesfrom Unit 284 are plotted (yellow triangles with MgO around 8 wt%; Stolper et al., 2004). Analytical uncertainties are smaller than thesymbols. In Panels a and b the black lines show calculated trends for olivine fractionation from a high MgO parental melt to the Unit 284glasses. The red dotted lines show the calculated trends for olivine accumulation in Unit 284 glasses. For olivine fractionation trends,equilibrium olivine was subtracted from a high MgO melt in steps of 0.5 wt% with KdFe/Mg
OL/melt = 0.32. The high MgO melt composition waschosen so that the olivine fractionation trend intersects the field for Unit 284 glass composition. For the olivine accumulation trends, Fo87olivine was added to the average glass composition. Unit 284 glasses and whole rocks can be related by olivine accumulation, but not byolivine fractionation. (For interpretation of the references to color in this figure legend, the reader is referred to the web version of this article.)
188 S. Huang et al. /Geochimica et Cosmochimica Acta 185 (2016) 182–197
MgO (Wt%)0 10 20 30
0
300
600
900
1200
1500
1800
Unit 70Unit 284Unit 292Unit 293
Whole Rocks
olivine fractionation
to Fo91.5to Fo88
to Fo85
a
S. Huang et al. /Geochimica et Cosmochimica Acta 185 (2016) 182–197 189
not always consistent. This reflects the fact that isotopicsignatures are not affected by partial melting process, butSiO2 content is controlled by both source compositionand extent and pressure of partial melting.
The MgO content in seven Unit 284 whole rock samplesranges from 17.84% to 20.69% (Table 1). Glasses from thisunit (Stolper et al., 2004) cluster around MgO of 7.5%(Fig. 2). The whole rocks have CaO/Al2O3 of 0.84 ± 0.01(1r), and glasses have CaO/Al2O3 of 0.83 ± 0.01 (1r),implying that olivine was the only dominant crystal phase.The geochemical difference between whole rock samplesand glasses from this unit can be best explained as a resultof accumulating Fo87 olivine (Fig. 2a and b). That is, thewhole rock samples are mixtures of melt, now glass, andvariable amounts of olivine with an average compositionof Fo87. In contrast, the glass compositions and whole rockcompositions cannot be related to each other via a fractionalcrystallization process. The black solid lines in Fig. 2a and bindicates the path of melts resulting from fractional crystal-lization of a high MgO melt, whose composition wasselected so that the olivine fractionation trend passesthrough the Unit 284 glass compositions. However thesetrends do not pass through the whole rock compositions.
Other major element and Ni contents are highly corre-lated with MgO content, with slopes similar to those definedby HSDP reference suite samples (Figs. 2 and 4). The abun-dances of relatively immobile incompatible elements, suchas Th, Nb, La, Zr and Pb, are positively correlated (Fig. 5).In contrast, in plots of Th vs Ba, K and Rb, these seven Unit284 samples form nearly vertical trends (Fig. 5f–h).
Except for SR764-2.3, Unit 284 samples have K2O/P2O5
of 1.26–1.45 and Ba/Rb of 16.2–18.7; these samples arerelatively unaltered (Fig. 3). Sample SR764-2.3 withanomalously high K2O/P2O5 (1.82 in Fig. 3) also hasanomalously high K, Rb and Ba contents (Fig. 5f–h).
10
100
1000
0.0 0.5 1.0 1.5 2.0 2.5 3.0
K2O/P2O5
Unit 70Unit 284Unit 292Unit 293
HSDP 1 and 2Reference Samples
SR820-2.8SR829-12.7
SR764-2.3
increasing alteration
2 sigma
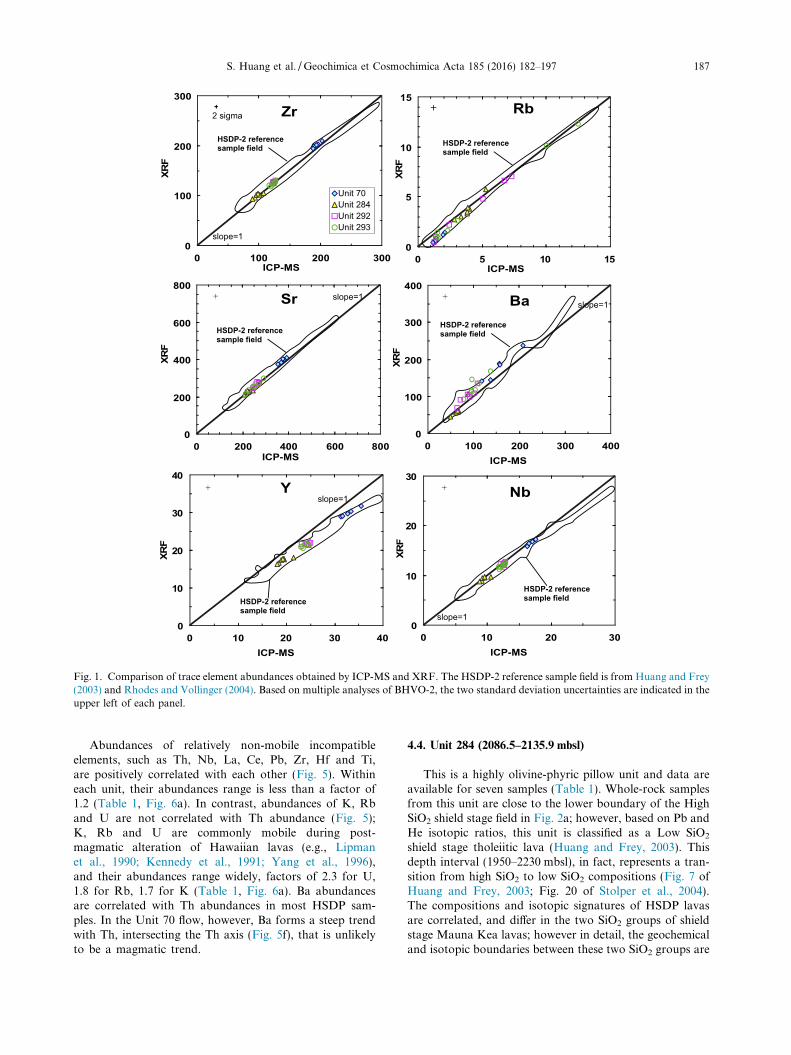
Fig. 3. K2O/P2O5 vs Ba/Rb for multiple samples from Units 70,284, 292 and 293 compared to field for HSDP reference samples. Itis well established that subaerial alteration of Hawaiian shield lavascreates a trend to relatively low K2O/P2O5 and high Ba/Rb. In theHSDP core both subaerial and submarine lavas define this trend(see Fig. 4 of Huang and Frey, 2003). Unaltered oceanic basalt hasBa/Rb = 11.6 ± 0.2 (Hofmann and White, 1983). Samples withanomalously high K2O/P2O5 (>1.7) are labeled. K2O/P2O5 range infresh Kilauea lavas (Greene et al., 2013) is shown for comparison.Data from this paper, Rhodes (1996), Huang and Frey (2003) andRhodes and Vollinger (2004).
4.5. Unit 292 (2327.8–2359.3 mbsl)
This unit is a 31.5 m thick aphyric to sparsely olivine-phyric pillow lava, and data are available for six samples(Table 1). The reference suite sample (SR814-14.4) is a typ-ical low SiO2 shield stage tholeiitic lava (Huang and Frey,2003).
The MgO content in six samples from this unit variesonly from 12.4% to 12.9% (Table 1). Unit 292 samples forma small field in Fig. 2a–f. Consequently, they do not formobvious trends in most panels in Fig. 2; except for plotsof MgO vs Na2O and K2O where these six samples formvertical trends. These samples are especially useful in assess-ing the effects of alteration because they range widely inK2O/P2O5 (0.44–1.76) and Ba/Rb (13.7–51.6) over a nar-row MgO content (Fig. 3). Although abundances of mobile
MgO (Wt%)
b
Fig. 4. (a) MgO (wt%) vs Ni (ppm). HSDP reference sample field isfrom Rhodes and Vollinger (2004). Analytical uncertainties aresmaller than the symbols. Model trends of olivine fractionation andaccumulation are shown for comparison. In detail, Sample SR641,which Putirka et al. (2011) argued to represent the parental magmafor HSDP lavas, was used as the starting composition. For olivinefractionation, equilibrium olivine was removed in steps of 0.5 wt%.KdFe/Mg
OL/melt = 0.32, and DNiOL/melt = 3.346*DMg
OL/melt � 3.665 (Beattieet al., 1991) are used. For olivine accumulation, three olivinecompositions were used: Fo91.5, the highest olivine Fo found atMauna Kea (e.g., Baker et al., 1996; Putirka et al., 2011); Fo88, theaverage HSDP olivine composition (Baker et al., 1996); and Fo85.The MgO–Ni trend of HSDP whole rock lavas may representolivine fractionation and accumulation. Panel b shows five Unit 70samples with an olivine fractionation trend that shows the MgO–Nitrend of Unit 70 samples is consistent with olivine fractionation.
a b
c d
e f
g h
Fig. 5. Th vs Nb, La, Zr, Pb, Sr, Ba, K and Rb (ppm). Samples with anomalous enrichments of K, Rb and Ba are labeled. HSDP-2 referencesample fields are from Huang and Frey (2003) and Rhodes and Vollinger (2004). Two HSDP-2 reference suite samples, SR3465-5.6 andSR531-4.4, with anomalously high Pb abundances are not included in panel d. Panel e shows an inset for Sr vs Na2O in Unit 293 samples.
190 S. Huang et al. /Geochimica et Cosmochimica Acta 185 (2016) 182–197
elements, such as Ba, Rb and K are highly variable, the sixsamples have similar non-mobile trace element abundances(Table 1; Figs. 2 and 5), confirming the generally acceptedconclusion that abundances of Ti, Nb, Zr, and Th are notcommonly changed by postmagmatic alteration; conse-quently they are referred to as non-mobile elements.
4.6. Unit 293 (2359.3–2457.7 mbsl)
This unit is a very thick (98.4 m) aphyric to sparselyolivine-phyric pillow lava, and seven samples were analyzed(Table 1). The reference suite sample (SR826-20.6) is a typ-ical Low SiO2 shield stage tholeiitic lava (Huang and Frey,
ab
Fig. 6. (a) Element abundance ranges in the four multi-sampled units. An element abundance range in a unit is defined as the ratio of themaximum and minimum element abundances. Ordering of elements is determined by increasing range from left to right; most element rangesare less than 1.2. (b) Variability [(one standard deviation/mean � 100)] in abundance ratios of incompatible elements in Units 70, 284, 292 and293. Element abundance ratios are ordered based on the difference in D (partition coefficient, from Hofmann, 1988) between numerator anddenominator. The maximum analytical uncertainty of element abundance ratios by ICP-MS at MIT is 5% (1-sigma, see appendix of Huangand Frey, 2003). The variability of most incompatible element abundance ratios is less than 5%; however, element abundance ratios involvingBa are highly variable. Also, the Sr/Nd variability in Unit 293 is �9%, implying moderate Sr mobility.
S. Huang et al. /Geochimica et Cosmochimica Acta 185 (2016) 182–197 191
2003). The MgO content in six samples from this Unitvaries only from 12.2% to 13.4% (Table 1). Seven Unit293 samples have similar immobile major and trace elementabundances (Table 1; Figs. 2, 4 and 5). Samples from Units292 to 293 overlap in a small field in Fig. 2a–f.
As with Unit 292 the seven samples from this unit rangewidely in K2O/P2O5 and Ba/Rb; however, K2O/P2O5 ratiosare grouped with two unusually high values that exceedvalues for all other HSDP samples (2.4 and 2.9) becauseof high K2O content, and five samples having K2O/P2O5 < 0.73 and Ba/Rb > 33 (Fig. 3). Also abundances ofmobile elements, such as Na2O, Ba, K2O and Rb, are highlyvariable (Table 1; Figs. 2 and 5). Specifically, the ranges ofRb and K2O in these seven samples are almost as large asthat in the whole HSDP reference suite samples (Fig. 5h).The seven Unit 293 lavas form a near vertical trend in plotof Th vs Sr (Fig. 5e), and they also form a positive Na2O vs.Sr trend (inset in Fig. 5e). Correlated Na and Sr enrich-ments are also reported for sea water altered MORB(e.g., Fig. 6 of Staudigel et al., 1996). Na enrichment maybe caused by Na-bearing secondary phases, such as analciteand natrolite, but these minerals are not enriched in Sr (e.g.,Staudigel et al., 1986). Consequently, Staudigel et al. (1996)concluded that the correlated enrichments of Na and Srcannot be explained by the addition or removal of a singlesecondary phase. Zeolites, as a secondary mineral, with upto 3.9% SrO and 2.1% Na2O, have been found in alteredKoolau lavas (Weinstein et al., 2004). Sample SR829-
12.70 has N2O of 1.92% and Sr of 267 ppm, so that it isunlikely that the positive Na2O–Sr trend of Unit 293 sam-ples is controlled by zeolites.
5. DISCUSSION
5.1. Post magmatic processes that change the major element
composition of basalt
After eruption, the compositions of oceanic basalt aremodified by interaction with fresh water during subaerialalteration, and with seawater during submarine alteration.These water–rock reactions lead to formation of secondaryminerals in an open system and results in compositionalvariability within flows. In the HSDP drill core alterationof hyaloclastites involves dissolution of glassy margins,and formation of secondary minerals, such as smectiteand palagonite (Walton and Schiffman, 2003; Waltonet al., 2005). During this process some elements, such asalkali metals and alkaline earths, were readily leached fromglass and fine-grained groundmass. Compositional hetero-geneity in thick flows can also result from deuteric andhydrothermal processes.
Subaerial alteration of Hawaiian lavas usually leads toloss of Si, Mg, Ca, Na, K, Sr, Rb and Ba (e.g., Feigensonet al., 1983; Yang et al., 1996; Huang and Frey, 2003;Revillon et al., 2007), and may also lead to an increase inFe and Al content as other major elements, such as Si,
0.06
0.07
0.08
0.09
0.10
0.11
0.12
50 100 150 200
Ba/Th
Historical Kilauea Lavas
Unit 70Unit 284Unit 292Unit 293 HSDP2 Reference Samples
2-sigma
a
b
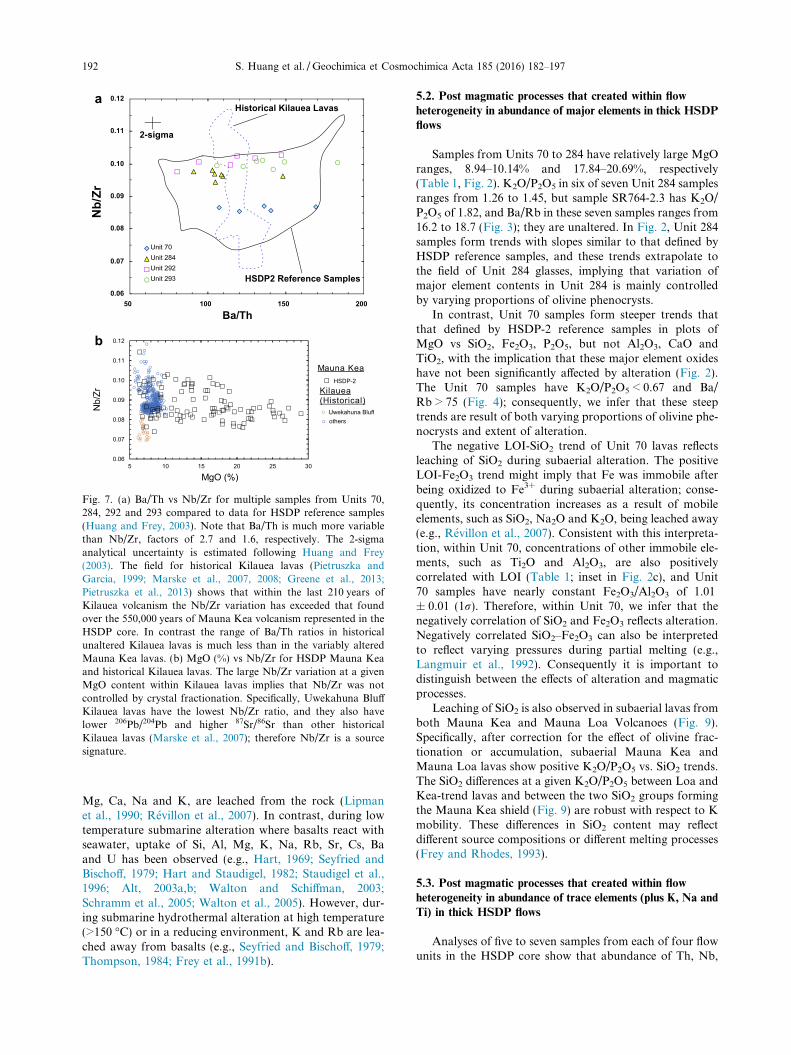
Fig. 7. (a) Ba/Th vs Nb/Zr for multiple samples from Units 70,284, 292 and 293 compared to data for HSDP reference samples(Huang and Frey, 2003). Note that Ba/Th is much more variablethan Nb/Zr, factors of 2.7 and 1.6, respectively. The 2-sigmaanalytical uncertainty is estimated following Huang and Frey(2003). The field for historical Kilauea lavas (Pietruszka andGarcia, 1999; Marske et al., 2007, 2008; Greene et al., 2013;Pietruszka et al., 2013) shows that within the last 210 years ofKilauea volcanism the Nb/Zr variation has exceeded that foundover the 550,000 years of Mauna Kea volcanism represented in theHSDP core. In contrast the range of Ba/Th ratios in historicalunaltered Kilauea lavas is much less than in the variably alteredMauna Kea lavas. (b) MgO (%) vs Nb/Zr for HSDP Mauna Keaand historical Kilauea lavas. The large Nb/Zr variation at a givenMgO content within Kilauea lavas implies that Nb/Zr was notcontrolled by crystal fractionation. Specifically, Uwekahuna BluffKilauea lavas have the lowest Nb/Zr ratio, and they also havelower 206Pb/204Pb and higher 87Sr/86Sr than other historicalKilauea lavas (Marske et al., 2007); therefore Nb/Zr is a sourcesignature.
192 S. Huang et al. /Geochimica et Cosmochimica Acta 185 (2016) 182–197
Mg, Ca, Na and K, are leached from the rock (Lipmanet al., 1990; Revillon et al., 2007). In contrast, during lowtemperature submarine alteration where basalts react withseawater, uptake of Si, Al, Mg, K, Na, Rb, Sr, Cs, Baand U has been observed (e.g., Hart, 1969; Seyfried andBischoff, 1979; Hart and Staudigel, 1982; Staudigel et al.,1996; Alt, 2003a,b; Walton and Schiffman, 2003;Schramm et al., 2005; Walton et al., 2005). However, dur-ing submarine hydrothermal alteration at high temperature(>150 �C) or in a reducing environment, K and Rb are lea-ched away from basalts (e.g., Seyfried and Bischoff, 1979;Thompson, 1984; Frey et al., 1991b).
5.2. Post magmatic processes that created within flow
heterogeneity in abundance of major elements in thick HSDP
flows
Samples from Units 70 to 284 have relatively large MgOranges, 8.94–10.14% and 17.84–20.69%, respectively(Table 1, Fig. 2). K2O/P2O5 in six of seven Unit 284 samplesranges from 1.26 to 1.45, but sample SR764-2.3 has K2O/P2O5 of 1.82, and Ba/Rb in these seven samples ranges from16.2 to 18.7 (Fig. 3); they are unaltered. In Fig. 2, Unit 284samples form trends with slopes similar to that defined byHSDP reference samples, and these trends extrapolate tothe field of Unit 284 glasses, implying that variation ofmajor element contents in Unit 284 is mainly controlledby varying proportions of olivine phenocrysts.
In contrast, Unit 70 samples form steeper trends thatthat defined by HSDP-2 reference samples in plots ofMgO vs SiO2, Fe2O3, P2O5, but not Al2O3, CaO andTiO2, with the implication that these major element oxideshave not been significantly affected by alteration (Fig. 2).The Unit 70 samples have K2O/P2O5 < 0.67 and Ba/Rb > 75 (Fig. 4); consequently, we infer that these steeptrends are result of both varying proportions of olivine phe-nocrysts and extent of alteration.
The negative LOI-SiO2 trend of Unit 70 lavas reflectsleaching of SiO2 during subaerial alteration. The positiveLOI-Fe2O3 trend might imply that Fe was immobile afterbeing oxidized to Fe3+ during subaerial alteration; conse-quently, its concentration increases as a result of mobileelements, such as SiO2, Na2O and K2O, being leached away(e.g., Revillon et al., 2007). Consistent with this interpreta-tion, within Unit 70, concentrations of other immobile ele-ments, such as Ti2O and Al2O3, are also positivelycorrelated with LOI (Table 1; inset in Fig. 2c), and Unit70 samples have nearly constant Fe2O3/Al2O3 of 1.01± 0.01 (1r). Therefore, within Unit 70, we infer that thenegatively correlation of SiO2 and Fe2O3 reflects alteration.Negatively correlated SiO2–Fe2O3 can also be interpretedto reflect varying pressures during partial melting (e.g.,Langmuir et al., 1992). Consequently it is important todistinguish between the effects of alteration and magmaticprocesses.
Leaching of SiO2 is also observed in subaerial lavas fromboth Mauna Kea and Mauna Loa Volcanoes (Fig. 9).Specifically, after correction for the effect of olivine frac-tionation or accumulation, subaerial Mauna Kea andMauna Loa lavas show positive K2O/P2O5 vs. SiO2 trends.The SiO2 differences at a given K2O/P2O5 between Loa andKea-trend lavas and between the two SiO2 groups formingthe Mauna Kea shield (Fig. 9) are robust with respect to Kmobility. These differences in SiO2 content may reflectdifferent source compositions or different melting processes(Frey and Rhodes, 1993).
5.3. Post magmatic processes that created within flow
heterogeneity in abundance of trace elements (plus K, Na and
Ti) in thick HSDP flows
Analyses of five to seven samples from each of four flowunits in the HSDP core show that abundance of Th, Nb,

0.1
0.2
0.3
0.4
0.5
0.6
0.7
SR820-2.8
SR829-12.7
SR167-1.6
50
100
150
200
250
300
350
0
2
4
6
8
10
12
14
0 1000 2000 3000 4000 5000 6000 7000
K (ppm)
HSDP2 Reference Samples
Unit 70Unit 284Unit 292Unit 293
2 sigma
2
4
6
8
10
12
14
0.0
0.1
0.2
0.3
0.4
0.5
0.6
0.7
0 50 100 150 200 250 300 350
Ba (ppm)
Unit 70Unit 284Unit 292Unit 293
HSDP2 ReferenceSamples
a
b
Fig. 8. (a) K vs U, Ba and Rb and (b) Ba vs Rb and U (ppm) for multiple samples from units 70, 284, 292 and 293. These elements are mobileduring post-magmatic alteration. Shown for comparison is field for HSDP reference lava suite (Huang and Frey, 2003; Rhodes and Vollinger,2004).
S. Huang et al. /Geochimica et Cosmochimica Acta 185 (2016) 182–197 193
La, Ce, Pb, Zr, Hf and Ti in each unit varies by <20%(Fig. 6a). Except for Pb, this result is consistent with otherstudies that found that these elements are immobile duringpost-magmatic alteration. (e.g., Lindstrom and Haskin,1981; Rhodes, 1983; Lipman et al., 1990; Pearce, 1996).The uniformity of Pb abundances is also indicated by thelimited range of Ce/Pb ratio in these 25 samples, 31 ± 3(2r), similar to the average Ce/Pb in MORB (25 ± 1, 2r)(Gale et al., 2013). This is a surprising result since alteredwhole-rock sample from Hawaii such as Detroit Seamountin the Emperor Chain, range widely in Ce/Pb (5–65), com-pared to nearly constant Ce/Pb ratio (31 ± 6, 2r) in glassesrecovered from the same location (Fig. 7 of Huang et al.,2005a). Similarly, Ce/Pb in altered whole rock samplesfrom Kahoolawe, Hawaii ranges from 12 to 29 (Huanget al., 2005b).
The largest compositional variations are in the olivine-phyric Unit 284; the abundance variations of the incompat-ible elements reflect varying proportions of olivinephenocrysts as reflected by the large range in MgO content,from 17.8% to 20.7% in whole rocks to 7.1% to 7.7% in
glasses (Fig. 2). Abundance ratios involving Th, Nb, La,Ce, Pb, Zr, Hf and Ti are quite uniform within each unit(e.g., Fig. 6b); hence a ratio such as Nb/Zr is a useful dis-criminant that reflects the magmatic processes (Fig. 7;Rhodes et al., 2012). A surprising result is that historicalKilauea lavas, erupted in last �210 years, vary more inNb/Zr than the 550,000 years of Mauna Kea volcanism inthe HSDP core. The large Nb/Zr variation in Kilauea lavasis likely to be source related because the Uwekahuna Blufflavas from Kilauea Volcano that define the lower Nb/Zrend of the Kilauea field (Fig. 7b) are also isotopicallydistinct from other Kilauea lavas (Marske et al., 2007). Incontrast, the Ba/Th ratio which involves two highly incom-patible elements (in the absence of phlogopite and feldspar)is highly variable within a unit (Fig. 7a). Consequently, weconclude that, unlike Nb/Zr, whole rock Ba/Th shouldnot be used to constrain magmatic processes. Neverthelesshigh Ba/Th and Sr/Nd ratios, greater than the primitivemantle value, in Hawaiian lavas have been used to argue forrecycled plagioclase-rich gabbroic crust, in the Hawaiianplume (Hofmann and Jochum, 1996; Sobolev et al., 2000).

SiO213 = 47.98 + 1.144K2O/P2O5
R2 = 0.73
SiO213 = 46.22 + 1.347K2O/P2O5
R2 = 0.58
Fig. 9. K2O/P2O5 vs SiO213 (wt%) for Mauna Loa and Mauna Kea lavas. In order to remove the effects of olivine fractionation or
accumulation, SiO213 content which represents SiO2 content at MgO of 13 wt% is plotted (see Rhodes and Vollinger, 2004 for details). K2O/
P2O5 range in fresh Kilauea lavas (Greene et al., 2013) is shown for comparison. In the upper panel, subaerial shield lavas from Mauna Loaand Mauna Kea define distinct fields with Mauna Loa lavas offset to higher SiO2. Subaerial lavas show positive K2O/P2O5 vs SiO2
13 trends,reflecting K2O mobility. Although submarine Mauna Kea lavas can be divided into two SiO2 groups, the SiO2 content of submarine lavas isnot correlated with K2O/P2O5 (the lower panel).
194 S. Huang et al. /Geochimica et Cosmochimica Acta 185 (2016) 182–197
High Ba/Th ratios are also reported for some Icelandicbasalts (Chauvel and Hemond, 2000) and Galapagos basalts(Saal et al., 2007), and in both locations the high Ba/Thratios are attributed to a plagioclase-rich gabbro componentin the source. However the correlation betweenBa/Th and Sr/Nd in Hawaiian shield lavas is poor (Freyet al., this issue; Pietruszka et al., 2013) and all Hawaiianshield lavas have Ba/Th greater than primitive mantle;hence, it is likely that these two ratios were controlled by dif-ferent processes (see Frey et al., this issue for a detaileddiscussion).
Although there is no doubt that the abundance of Na,K, Rb, Ba, and to a lesser extent Sr and U, have beenaffected by post-magmatic processes (Figs. 2g and h,5e–h, 7a and 8), there are complex relationships amongthese elements. For example, K and Rb abundance arestrongly positively correlated (Fig. 8a), but the correlationbetween abundances of Ba and K is complex (Fig. 8a): insubaerial Unit 70 the trend is to relatively high Ba with onlymodest increases in K and Rb; in Unit 284 Ba is well corre-lated with K and Rb; in contrast in Units 292 and 293 themost altered samples are markedly enriched in K and Rbwith only modest increase in Ba and no increase in U.
These complexities reflect alteration reactions such asinteraction of glass and minerals with both fresh and seawa-ter under different temperatures at oxidizing or reducing
environments that lead to formation of secondary mineralsand leaching of elements, especially from glass and fine-grained groundmass. Low temperature, subaerial alterationof Hawaiian shield lavas typically results in K and Rb loss(e.g., Feigenson et al., 1983; Yang et al., 1996). Behaviors ofK and Rb during submarine alteration are more compli-cated: low temperature submarine alteration of MORBtypically increases K and Rb abundance, but submarinealteration under high temperature (>150 �C) or at a reduc-ing environment also lead to loss of K and Rb (e.g.,Seyfried and Bischoff, 1979; Thompson, 1984; Frey et al.,1991b; Staudigel et al., 1996). Based on Fig. 3 some ofthe Phase 2 core has lost K and Rb during alteration, buta few samples, such as SR820-2.8 and SR829-12.70 fromUnit 293 have gained K and Rb (Figs. 3 and 9).
6. WHAT HAS BEEN LEARNED BY ANALYSIS OF
MULTIPLE SAMPLES FROM FOUR THICK FLOW
UNITS IN MAUNA KEA VOLCANO
(1) Analyses of multiple samples, five to seven, fromthick HSDP lava flow units show that compositionalvariations were controlled by subaerial and sub-marine post magmatic processes as well as varyingmixing proportions of olivine phenocrysts and melt.
S. Huang et al. /Geochimica et Cosmochimica Acta 185 (2016) 182–197 195
(2) K and Rb were the most mobile elements duringpost-magmatic alteration. Typically K and Rb werelost, but there are a few examples of K and Rb gain.Ba and to lesser extents Sr and U were also mobilebut their abundances are not highly correlated withK and Rb abundance.
(3) Heterogeneous distribution of P-HREE-Y isobserved in subaerial Unit 70. Specifically, SampleSR166-1.3, within 1 m of the upper contact of thislava unit, has lower P2O5 and HREE-Y contents,and a lower Lu/Hf ratio. REE-Y enrichment causedby the growth of a secondary phosphate phase; rhab-dophane has been reported for subaerial lavas fromKahoolawe Volcano (Fodor et al., 1989). If somesamples are enriched in REE and Y as a result oftheir mobility and subsequent incorporation into agroundmass phosphate, nearby samples, such asSR166-1.3, must be depleted in REE and Y.
(4) Element ratios such as Nb/Zr, La/Nb and Ce/Pb, butnot Ba/Th, are uniform (±4%) within a flow unit andare useful indicators of petrogenesis. Usually, Pb ismobile during submarine alteration, leading to vari-able Ce/Pb in altered submarine lavas (e.g., Fig. 7of Huang et al., 2005a). However, such Pb mobilityis not observed in our studied samples that includesome highly altered lavas (with LOI up to 7%). The25 analyzed lavas have nearly constant Ce/Pb ratioof 31 ± 3 (2r).
(5) Classification of HSDP basalt based on He and Pbisotopic compositions, may differ from that basedon major element composition. For example Unit284 was classified as a Low-SiO2 shield lava(Huang and Frey, 2003). However, two referencesuite samples from this unit, SR756-13.25 andSR762-4.6, have major element compositions similarto the High-SiO2 shield group. The high SiO2 signa-ture of this unit has been confirmed by analyses offive more samples from this unit, implying that thegeochemical and isotopic boundaries between twoHSDP-2 SiO2 groups are not always consistent. Thisis because elemental compositions, such as SiO2 con-tent and Nb/Zr, of a melt are controlled by bothsource heterogeneity and partial melting process.
ACKNOWLEDGEMENTS
We thank D. DePaolo, E. Stolper and D. Thomas for theirleadership of the HSDP, M. Garcia, C. Seaman and the loggingcrew for their on site efforts, and our colleagues studying thesecores. We thank B. Grant for assistance in ICP-MS analysis andP. Dawson for assistance in XRF analysis. We thank M. Bakerfor discussion. Constructive reviews from R. V. Fodor, and twoanonymous reviewers, as well as Guest Editor R. Hickey-Vargas,are highly appreciated. S.H. acknowledges support from NSFawards EAR-1524387 and EAR-1144727.
REFERENCES
Abouchami W., Hofmann A. W., Galer S. J. G., Frey F. A., EiseleJ. and Feigenson M. (2005) Lead isotopes reveal bilateral
asymmetry and vertical continuity in the Hawaiian mantleplume. Nature 434, 851–856. http://dx.doi.org/10.1038/nature03402.
Alt J. C. (2003a) Alteration of the upper oceanic crust: mineralogy,chemistry and processes. In Hydrogeology of the Oceanic
Lithosphere (eds. H. Elderfield and E. Davis). Cambridge Univ.Press, New York, pp. 495–533.
Alt J. C. (2003b) Hydrothermal fluxes at mid-ocean ridges andon ridge flanks. C. R. Acad. Sci. Geosci. 335, 853–864.
Baker M. B., Alves S. and Stolper E. M. (1996) Petrography andpetrology of the Hawaii Scientific Drilling Project lavas:inferences from olivine phenocryst abundances and composi-tions. J. Geophys. Res. 101, 11715–11727.
Beattie P., Ford C. and Russell D. (1991) Partition coefficients forolivine-melt and orthopyroxene-melt systems. Contrib. Mineral.
Petrol. 109, 212–224.Blichert-Toft J. and Albarede F. (2009) Mixing of isotopic
heterogeneities in the Mauna Kea plume Conduit. Earth Planet.Sci. Lett. 282, 190–200. http://dx.doi.org/10.1016/j.epsl.2009.03.015.
Blichert-Toft J., Weis D., Maerschalk C., Agranier A. andAlbarede F. (2003) Hawaiian hot spot dynamics as inferredfrom the Hf and Pb isotope evolution of Mauna Kea volcano.Geochem. Geophys. Geosyst. 4(2), 8704. http://dx.doi.org/10.1029/2002GC000340.
Chauvel C. and Hemond C. (2000) Melting of a complete section ofrecycled oceanic crust: trace element and Pb isotopic evidencefrom Iceland. Geochem. Geophys. Geosyst. 1. http://dx.doi.org/10.1029/1999GC000002.
Clague D. A., Frey F. A., Garcia M. O., Huang S.,McWilliams M. and Beeson M. H. (2016) Compositionalheterogeneity of the Sugarloaf melilite nephelinite flow,Honolulu Volcanics, Hawai‘i. Geochim. Cosmochim. Acta.185, 251–277.
DePaolo D. J., Stolper E. M., Thomas D. M. and Garcia M. O.(1999) Hawaii Scientific Drilling Project: core logs and sum-marizing data [CD-ROM].
Eisele J., Abouchami W., Galer S. J. G. and Hofmann A. W. (2003)The 320 kyr Pb isotope evolution of Mauna Kea lavas recordedin the HSDP-2 drill core. Geochem. Geophys. Geosyst. 4(5),8710. http://dx.doi.org/10.1029/2002GC000339.
Feigenson M. D., Hofmann A. W. and Spera F. J. (1983) Casestudies on the origin of basalt. II. The transition from tholeiiticto alkalic volcanism on Kohala volcano, Hawaii. Contrib.
Mineral. Petrol. 84, 390–405.Fodor R. V., Malta D. P., Bauer G. R. and Jacobs R. S. (1989)
Microbeam analyses of rare-earth element phosphate in basaltfrom Kahoolawe Island, Hawaii. In Proceedings of the 24th
Annual Conf (ed. P. E. Russell). Microbeam Analyt Soc, SanFrancisco Press, San Francisco, pp. 554–558.
Frey F. A. and Rhodes J. M. (1993) Intershield geochemicaldifferences among Hawaiian volcanoes: implications for sourcecompositions, melting process, and magma ascent paths. Philos.Trans. R. Soc. Lond. A 342, 121–136.
Frey F. A., Wise W. S., Garcia M. O., West H., Kwon S.-T. andKennedy A. (1990) Evolution of Mauna Kea Volcano, Hawaii:petrologic and geochemical constrains on postshield volcanism.J. Geophys. Res. 95, 1271–1300.
Frey F. A., Garcia M. O., Wise W. S., Kennedy A., Gurriet P. andAlbarede F. (1991a) The evolution of Mauna Kea Volcano,Hawaii: petrogenesis of tholeiitic and alkalic basalts. J.
Geophys. Res. 96, 14347–14375.Frey F. A., JonesW. B., Davis H. andWeis D. (1991b) Geochemical
and petrological data for basalts from Site 756, 757, and 758:implications for the origin and evolution of Ninetyeast Ridge. InProc. ODP, Sci. Results, 121 (eds. J.Weissel, J. Peirce, E. Taylor,
196 S. Huang et al. /Geochimica et Cosmochimica Acta 185 (2016) 182–197
J. Alt, et al.). College Station, TX (Ocean Drilling Program). pp.611–659.
Frey F. A., Huang S. and Xu G. (this issue) Plagioclase andclinopyroxene cumulate in the source of hawaiian shield basalt:evidence based on abundance ratios of incompatible elements.Geochim. Cosmochim. Acta.
Gale A., Dalton C. A., Langmuir C. H., Su Y. and Schilling J.-G.(2013) The mean composition of ocean ridge basalts. Geochem.
Geophys. Geosyst. 14, 489–518. http://dx.doi.org/10.1029/2012GC004334.
Garcia M. O., Haskins E. H., Stolper E. M. and Baker M. (2007)Stratigraphy of the Hawai’i Scientific Drilling Project core(HSDP2): anatomy of a Hawaiian shield volcano. Geochem.
Geophys. Geosyst. 8, Q02G20. http://dx.doi.org/10.1029/2006GC001379.
Greene A. R., Garcia M. O., Pietruszka A. J., Weis D., Marske J.P., Vollinger M. J. and Eiler J. (2013) Temporal geochemicalvariations in lavas from Kilauea’s Pu’u O’o eruption (1983–2010): cyclic variations from melting of source heterogeneities.Geochem. Geophys. Geosyst. 14, 4849–4873. http://dx.doi.org/10.1002/ggge.20285.
Hart S. R. (1969) K, Rb, Cs contents and K/Rb, K/Cs ratios offresh and altered submarine basalts. Earth Planet. Sci. Lett. 6,295–303.
Hart S. R. and Staudigel H. (1982) The control of alkalies anduranium in seawater by ocean crust alteration. Earth Planet.
Sci. Lett. 58, 202–212.Hickson C. J. and Juras S. J. (1986) Sample contamination by
grinding. Can. Mineral. 24, 585–589.Hofmann A. W. (1988) Chemical differentiation of the Earth: the
relationship between mantle, continental crust, and oceaniccrust. Earth Planet. Sci. Lett. 90, 297–314.
Hofmann A. W. and Jochum K. P. (1996) Source characteristicsderived from very incompatible trace elements in Mauna Loaand Mauna Kea basalts (Hawaiian Scientific Drilling Project).J. Geophys. Res. 101, 11831–11839.
Hofmann A. W. and White W. M. (1983) Ba, Rb and Cs in theEarth’s mantle. Z. Naturforssch. 38a, 258–266.
Huang S. and Frey F. A. (2003) Trace element abundances ofMauna Kea basalt from Phase 2 of the Hawaiian ScientificDrilling Project: petrogenetic implications of correlations withmajor element content and isotopic ratios. Geochem. Geophys.
Geosyst. 4(6), 8711, 1029/2002 GC000322, 2003.Huang S., Regelous M., Thordarson T. and Frey F. A. (2005a)
Petrogenesis of lavas from Detroit Seamount: geochemicaldifferences between Emperor Chain and Hawaiian volcanoes.Geochem. Geophys. Geosyst. 6, Q01L06. http://dx.doi.org/10.1029/2004GC000756.
Huang S., Frey F. A., Blichert-Toft J., Fodor R. V., Bauer G. R.and Xu G. (2005b) Enriched components in the Hawaiianplume: evidence from Kahoolawe Volcano, Hawaii. Geochem.
Geophys. Geosyst. 6, Q11006. http://dx.doi.org/10.1029/2005GC001012.
Huang S., Hall P. S. and Jackson M. G. (2011) Geochemicalzoning of volcanic chains associated with Pacific hotspots. Nat.
Geosci. 4, 874–878. http://dx.doi.org/10.1038/NGEO1263.Ireland T. J., Arevalo, Jr., R., Walker R. J. and McDonough W. F.
(2009) Tungsten in Hawaiian picrites: a compositional modelfor the sources of Hawaiian lavas. Geochim. Cosmochim. Acta
73, 4517–4530. http://dx.doi.org/10.1016/j.gca.2009.04.016.Kamber B. S. and Collerson K. D. (2000) Zr/Nb systematics of
ocean island basalts reassessed – the case for binary mixing. J.Petrol. 41, 1007–1021.
Kennedy A. K., Kwon S. T., Frey F. A. and West H. B. (1991) Theisotopic composition of postshield lavas from Mauna KeaVolcano, Hawaii. Earth Planet. Sci. Lett. 103, 339–353.
Kurz M. D., Curtice J., Lott, III, D. E. and Solow A. (2004) Rapidhelium isotopic variability in Mauna Kea shield lavas from theHawaiian Scientific Drilling Project. Geochem. Geophys. Geo-
syst. 5, Q04G14. http://dx.doi.org/10.1029/2002GC000439.Langmuir C., Klein E. and Plank T. (1992) Petrological systematics
of mid-ocean ridge basalts: constraints on melt generationbeneath ocean ridges. AGU Monogr. 71, 183–280.
Lindstrom M. M. and Haskin L. A. (1981) Compositionalinhomogeneities in a single Icelandic tholeiite flow. Geochim.
Cosmochim. Acta 45, 15–31.Lipman P. W., Rhodes J. M. and Dalrymple G. B. (1990) The
Ninole Basalt – implications for the structural evolution ofMauna Loa volcano, Hawaii. Bull. Volcanol. 53, 1–19.
Marske J. P., Pietruszka A. J., Weis D., Garcia M. O. and RhodesJ. M. (2007) Rapid passage of a small-scale mantle heterogene-ity through the melting regions of Kilauea and Mauna LoaVolcanoes. Earth Planet. Sci. Lett. 259, 34–50.
Marske J. P., Garcia M. O., Pietruszka A. J., Rhodes J. M. andNorman M. D. (2008) Geochemical variations during Kilauea’sPu’u O’o eruption reveal a fine-scale mixture of mantleheterogeneities within the Hawaiian plume. J. Petrol. 49,1297–1318. http://dx.doi.org/10.1093/petrology/egn025.
Nobre Silva I. G., Weis D. and Scoates J. S. (2013) Isotopicsystematics of the early Mauna Kea shield phase and insightinto the deep mantle beneath the Pacific Ocean. Geophys.
Geosyst. 14, 659–676. http://dx.doi.org/10.1002/ggge.20047.Norman M. D., Leeman W. P., Blanchard D. P., Fitton J. G. and
James D. (1989) Comparison of major and trace elementanalyses by ICP, XRF, INAA and ID methods. Geostand.
Newslett. 13(2), 283–290.Pearce J. A. (1996) User’s guide to basalt discrimination diagrams
in trace element geochemistry of volcanic rocks: applicationsfor massive sulphide exploration. In Geological Association of
Canada (ed. D. A. Wyman). pp. 79–113.Pietruszka A. J. and Garcia M. O. (1999) A rapid fluctuation in the
mantle source and melting history of Kilauea Volcano inferredfrom the geochemistry of its historical summit lavas (1790–1982). J. Petrol. 40, 1321–1342.
Pietruszka A. J., Norman M. D., Garcia M. O., Marske J. P. andBurns D. H. (2013) Chemical heterogeneity in the Hawaiianmantle plume from the alteration and dehydration of recycledoceanic crust. Earth Planet. Sci. Lett. 361, 298–309. http://dx.doi.org/10.1016/j.epsl.2012.10.030.
Putirka K., Ryerson F. J., Perfit M. and Ridley W. I. (2011)Mineralogy and composition of the oceanic mantle. J. Petrol.52, 279–313.
Qin L., Dauphas N., Janney P. E. and Wadhwa M. (2007)Analytical developments for high-precision measurements of Wisotopes in iron meteorites. Anal. Chem. 79, 3148–3154.
Revillon S., Teagle D. A. H., Boulvais P., Shafer J. and Neal C. R.(2007) Geochemical fluxes related to alteration of a subaeriallyexposed seamount: Nintoku seamount, ODP Leg 197, Site1205. Geochem. Geophys. Geosyst. 8, Q02014. http://dx.doi.org/10.1029/2006GC001400.
Rhodes J. M. (1983) Homogeneity of Lava Flows: chemical datafor historical Mauna Loa eruptions. J. Geophys. Res. 88, A869–A879.
Rhodes J. M. (1984) Geochemistry of the 1984 Mauna Loaeruption: implications for magma storage and supply. J.
Geophys. Res. 93, 4453–4466.Rhodes J. M. (1996) Geochemical stratigraphy of lava flows
sampled by the Hawaii Scientific Drilling Project. J. Geophys.Res. 101, 11729–11746.
Rhodes J. M. and Vollinger M. J. (2004) Composition of basalticlavas sampled by phase-2 of the Hawaii Scientific DrillingProject: geochemical stratigraphy and magma types. Geochem.

S. Huang et al. /Geochimica et Cosmochimica Acta 185 (2016) 182–197 197
Geophys. Geosyst. 5, Q03G13. http://dx.doi.org/10.1029/2002GC000434.
Rhodes J. M., Huang S., Frey F. A., Pringle M. and Xu G. (2012)Compositional diversity of Mauna Kea shield lavas recoveredby the Hawaii Scientific Drilling Project: inferences on sourcelithology, magma supply, and the role of multiple volcanoes.Geochem. Geophys. Geosyst. 13(3), Q03014. http://dx.doi.org/10.1029/2011GC003812.
Roden M. F., Frey F. A. and Clague D. A. (1984) Geochemistry oftholeiitic and alkalic lavas from the Koolau Range, Oahu,Hawaii: implications for Hawaiian volcanism. Earth Planet.
Sci. Lett. 69, 141–158.Saal A. E., Kurz M. D., Hart S. R., Blusztajn J. S., Blichert-Toft J.,
Liang Y. and Geist D. J. (2007) The role of lithospheric gabbroson the composition of Galapagos lavas. Earth Planet. Sci. Lett.
257, 391–406. http://dx.doi.org/10.1016/j.epsl.2007.02.040.Schramm B., Devey C. W., Gillis K. M. and Lackschewitz K.
(2005) Quantitative assessment of chemical and mineralogicalchanges due to progressive low-temperature alteration of EastPacific Rise basalts from 0 to 9 Ma. Chem. Geol. 218, 281–313.
Seaman C., Sherman S. B., Garcia M. O., Baker M. B., Balta B.and Stolper E. (2004) Volatiles in glasses from the HSDP2 drillcore. Geochem. Geophys. Geosyst. 5, Q09G16. http://dx.doi.org/10.1029/2003GC000596.
Sertek J. P., Andrade S. and Ulbrich H. H. (2015) An evaluation ofthe effects of primary and cross-contamination during thepreparation of rock powders for chemical determinations.Geostand. Geoanal. Res.. http://dx.doi.org/10.1111/j.1751-908X.2014.00324.x.
Seyfried, Jr, W. E. and Bischoff J. L. (1979) Low temperaturebasalt alteration by seawater: an experimental study at 70 �Cand 150 �C. Geochim. Cosmochim. Acta. 43, 1937–1947.
Sharp W. D. and Renne P. R. (2005) The 40Ar/39Ar dating of corerecovered by the Hawaii Scientific Drilling Project (phase 2),Hilo, Hawaii. Geochem. Geophys. Geosyst. 6, Q04G17. http://dx.doi.org/10.1029/2004GC000846.
Sobolev A. V., Hofmann A. W. and Nikogosian I. K. (2000)Recycled oceanic crust observed in ghost plagioclase within thesource of Mauna Loa lavas. Nature 404, 986–990.
Staudigel H., Gillis K. and Duncan R. (1986) K/Ar and Rb/Sr agesof celadonites from the Troodos ophiolite, Cyprus. Geology 14,72–75.
Staudigel H., Plank T., While B. and Schmincke H.-U. (1996)Geochemical fluxes during seafloor alteration of the basaltic
upper oceanic crust: DSDP Sites 417 and 418. In Subduction
Top to Bottom, vol. 96 (ed. G. E. Bebout et al.). AGU,Washington, D.C., pp. 19–38.
Stolper E. M., DePaolo D. J. and Thomas D. M. (1996)Introduction to special section; Hawaii Scientific DrillingProject. J. Geophys. Res. 101, 11593–11598.
Stolper E. M., Sherman S., Garcia M., Baker M. and Seaman C.(2004) Glass in the submarine section of the HSDP2 drill core,Hilo, Hawaii. Geochem. Geophys. Geosyst. 5, Q07G15. http://dx.doi.org/10.1029/2003GC000553.
Thompson G. (1984) Basalt-seawater interaction. In Hydrothermal
Processes at Seafloor Spreading Centers (eds. P. A. Rona, K.Bostrom, L. Laubier and K. L. Smith). Plenum, New York, pp.225–278.
Walton A. W. and Schiffman P. (2003) Alteration of hyaloclastitesin the HSDP 2 Phase 1 Drill Core. 1. Description andparagenesis. Geochem. Geophys. Geosyst. 4, 8709. http://dx.doi.org/10.1029/2002GC00368.
Walton A. W., Schiffman P. and Macpherson G. L. (2005)Alteration of hyaloclastites in the HSDP 2 Phase 1 Drill Core:2. Mass balance of the conversion of sideromelane to palagoniteand chabazite. Geochem. Geophys. Geosyst. 6, Q09G19. http://dx.doi.org/10.1029/2004GC000903.
Weinstein J. P., Fodor R. V. and Bauer G. R. (2004)Koolau shield basalt as xenoliths entrained during reju-venated-stage eruption: perspectives on magma mixing.Bull. Volcanol. 66, 182–199. http://dx.doi.org/10.1007/s00445-003-0302-1.
Weis D., Kieffer B., Maerschalk C., Pretorium W. and Barling J.(2005) High-precision Pb–Sr–Nd–Hf isotopic characterizationof USGS BHVO-1 and BHVO-2 reference materials. Geochem.
Geophys. Geosyst. 6, Q02002. http://dx.doi.org/10.1029/2004GC000852.
Weis D., Garcia M. O., Rhodes J. M., Jellinek M. and Scoates J. S.(2011) Role of the deep mantle in generating the compositionalasymmetry of the Hawaiian mantle plume. Nat. Geosci. 4, 831–838.
Yang H.-J., Frey F. A., Rhodes J. M. and Garcia M. O. (1996)Evolution of Mauna Kea volcano: inferences from lavacompositions recovered in the Hawaii Scientific Drilling Pro-ject. J. Geophys. Res. 101, 11747–11767.
Associate editor: Rosemary Hickey-Vargas