Embed Size (px)
Citation preview
1
COMPARING CONFLICTING CONCLUSIONS FROM DIFFERENT INTEGRITY TESTING METHODS ON THE SAME DRILLED SHAFTS Matthew L. Becker, P.E., GRL Engineers, Holmes, PA, USA, [email protected] Alex Ryberg, P.E., GRL Engineers, Holmes, PA, USA, [email protected] ABSTRACT Several integrity testing methods exist which may be used to evaluate drilled shafts. Each test method has advantages and limitations. On occasion, the results from different test methods may lead to conflicting conclusions, making it difficult to conclusively know which results more accurately represent the quality and integrity of a drilled shaft. This case study focuses on the integrity testing evaluation for two drilled shafts which were constructed using permanent casings and installed through flowing river water. Integrity testing was performed using Thermal Integrity Profiling (TIP) and Crosshole Sonic Logging (CSL) on each shaft. During testing, the influence of flowing water and soil layering needed consideration in the collected TIP data. Similarly, concrete curing time influenced the CSL test results and required the CSL tests to be performed multiple times with additional wait times following concrete placement. To aid in the shaft integrity evaluations, Low Strain Integrity testing via the Pulse Echo Method (PEM) was performed on several shafts and concrete coring was also performed to help further assess the acceptance or rejection of the questionable shafts. This paper presents an overview of the testing methods that were applied, their basic methodology, as well as potential limitations that should be considered when evaluating their results. Keywords: drilled shaft, caisson, cross-hole sonic logging, thermal integrity profiling, low strain, non-destructive integrity testing INTRODUCTION Review of Performed Integrity Testing Methods for Drilled Shafts Cross hole Sonic Logging (CSL) was performed in accordance with ASTM D6760. Generally testing is performed by lowering transmitting and receiving probes into cast in steel or PVC access tubes. Access tubes are located evenly around the reinforcing cage with the number of tubes typically 1 tube per 1 feet of shaft diameter, with a minimum of 3 tubes. Ultrasonic waves are transmitted in the direct path between probe pairs for the vertical extent of the cast in tubes to establish a profile of first arrival time (FAT) and energy. Testing is typically performed 4-7 days after concrete placement to allow the concrete to develop sufficient strength and reduce potential data collection issues after extended testing period wait times (i.e. Webster et al. 2011). Changes in the FAT and energy vs depth are recorded for a number of profiles, and the engineer may then evaluate abnormal CSL results for individual shaft sections. The ultrasonic signal for CSL is measured from probe to probe and therefore effects outside of this direct path, including outside the reinforcing cage for drilled shafts may not be evaluated through CSL. Furthermore debonding of the access tubes (either steel or PVC) or bleedwater channels may inhibit ultrasonic signal transmission and therefore impede the reliability of CSL results. Thermal Integrity Profiling (TIP) requires the measurement of temperature during the first several hours to days after concrete placement and was performed in accordance with ASTM D7949. As cementitious material hydrates, significant heat is generated relative to the surrounding environmental conditions and creates a thermal profile for the foundation. Heat generation increases to a maximum or “peak” temperature, and then normalizes to equilibrium with the surrounding environment (i.e. Mullins and Kranc, 2007). The time to peak temperature for drilled shafts is generally observed in less than 48 hours after placement, however this time period may be affected by a number of factors including the drilled shaft size, concrete mix or admixtures and local environmental conditions. Integrity of the drilled shaft may be evaluated based upon the consistency and uniformity of measured temperature over the tested length. While testing may be
2
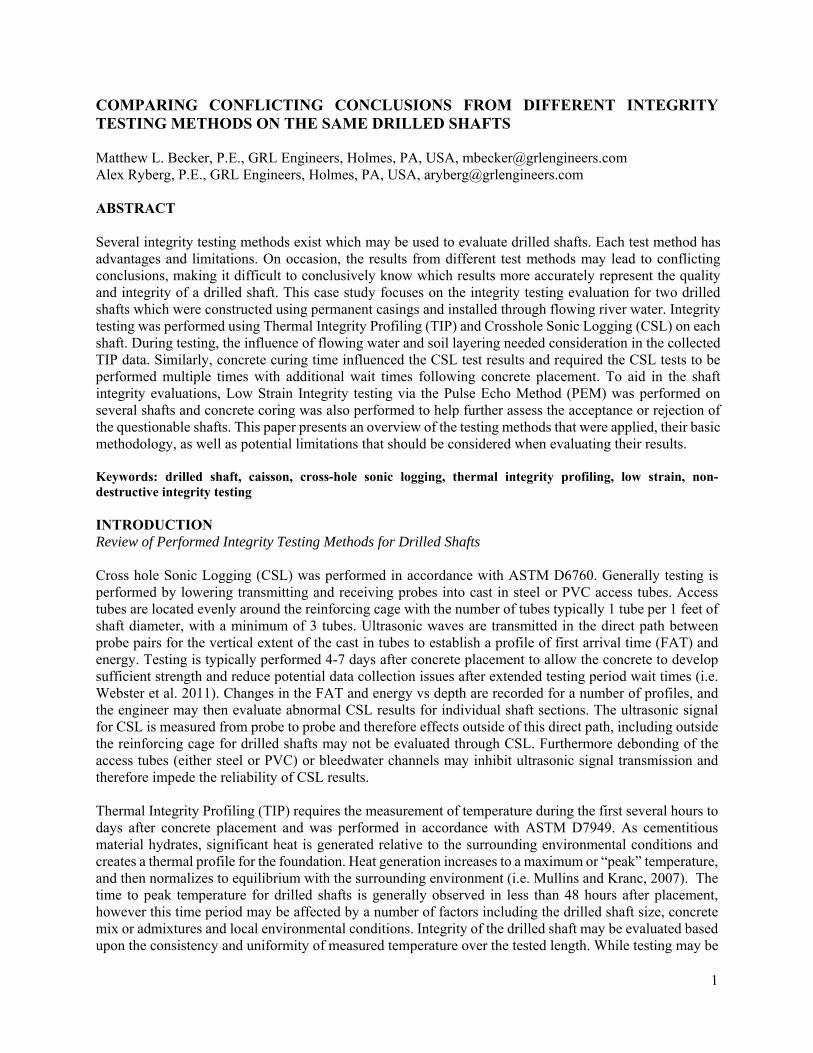
performed utilizing a downhole thermal probe (ASTM D7949 method A) or embedded thermal sensors, (ASTM D7949 method B) multiple time periods of temperature data provide useful confirmation of the data, including cases where anomalous temperature data is observed. To locate potential anomalous sections, temperature data must be collected during the initial hydration phase when the foundation’s temperature increases relative to the surrounding environment. Data collected after this time period, (i.e. during the normalization phase) may be unreliable as the thermal profile is smoothed. Furthermore, evaluation relies on a reasonably uniform concrete mix throughout the shaft or an otherwise uniform temperature profile to be generated. Low strain integrity testing using the pulse echo method (PEM) was performed in accordance with ASTM D5882. An accelerometer typically set on the top of a constructed drilled shaft measures a hammer induced velocity wave (e.g., Rausche et al. 1988). The wave travels down the shaft and reflects off impedance changes including constructed shape irregularities, soil/pile stiffness changes and material quality changes. Good data quality is exhibited by a clear impact and stable wave record, and where observable, a reflection near the known shaft base location. Testing is generally performed no sooner than 7 days after concrete placement or until the concrete has gained 75% of its design strength (ASTM D5882). Multiple hammer sizes are generally utilized to evaluate the response frequency with multiple impacts applied to confirm data consistency and to reduce random noise. We note that as the velocity waves travel down the shaft, the amplitude decreases with depth as the energy is absorbed by the material and/or soil, and therefore it is not uncommon for larger diameter shafts and/or long length foundations to not show clear reflections from the known shaft base. Project Description and Testing Scope As part of infrastructure upgrades, a replacement roadway bridge over the Passaic River in Northern New Jersey was needed. While the project is comprised of separate eastbound and westbound bridges, the first project phase was to complete the eastbound bridge. This stage required the installation of two abutments and two piers, with the piers constructed through flowing water. Each substructure location utilized three (3) 36-in diameter drilled shafts as deep foundation supports. Depending on substructure location, the lengths ranged from approximately 87 to 100 ft. Fig 1 presents a general plan and profile view of the bridge. For final construction, each of the 12 production shafts were installed within a full-length, 3 feet diameter permanent steel casing and the reinforcing cage was installed in the upper approximate 56 and 62-ft of the abutment and pier shafts, respectively. As part of the quality control/quality assurance program, integrity testing of every drill shaft was performed with Thermal Integrity Profiling (TIP) method B and Crosshole-Sonic Logging (CSL). As is typical for many construction projects, any integrity testing would be on the critical path for the project and would need to be performed as soon as practically possible. Project specifications identified CSL as the primary integrity test method, while TIP and low strain impact tests (PEM) were used as an additional aid in the overall integrity evaluation of the shafts that were tested. The drilled shafts were constructed during the months from November 2019 to January 2020. For each substructure location, concrete placement via tremie was completed in a single day for all three respective shafts. As previously mentioned, the reinforcing cage did not extend full length and therefore only the upper 59 feet of the pier shafts were evaluated with CSL and TIP. Four (4) steel access tubes were cast within each drilled shaft for CSL testing and three (3) thermal wire cables were attached to each reinforcing cage for TIP testing.
3
Fig 1. Plan and profile view of the replacement bridge.
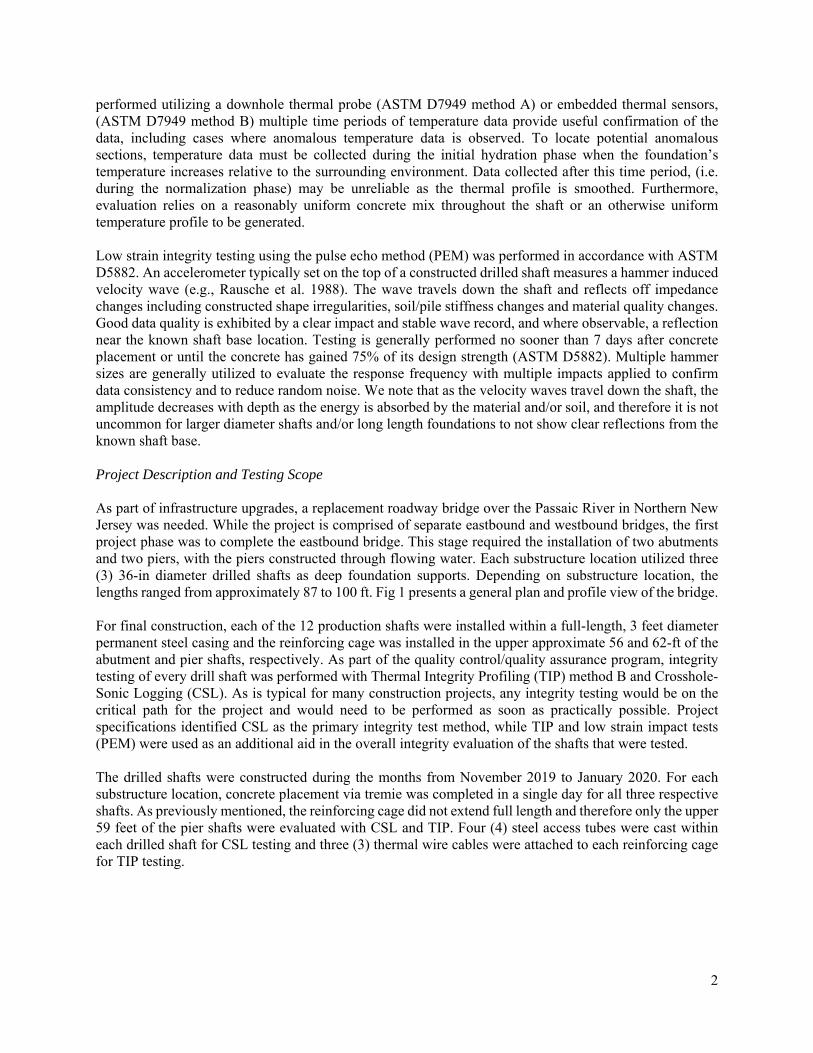
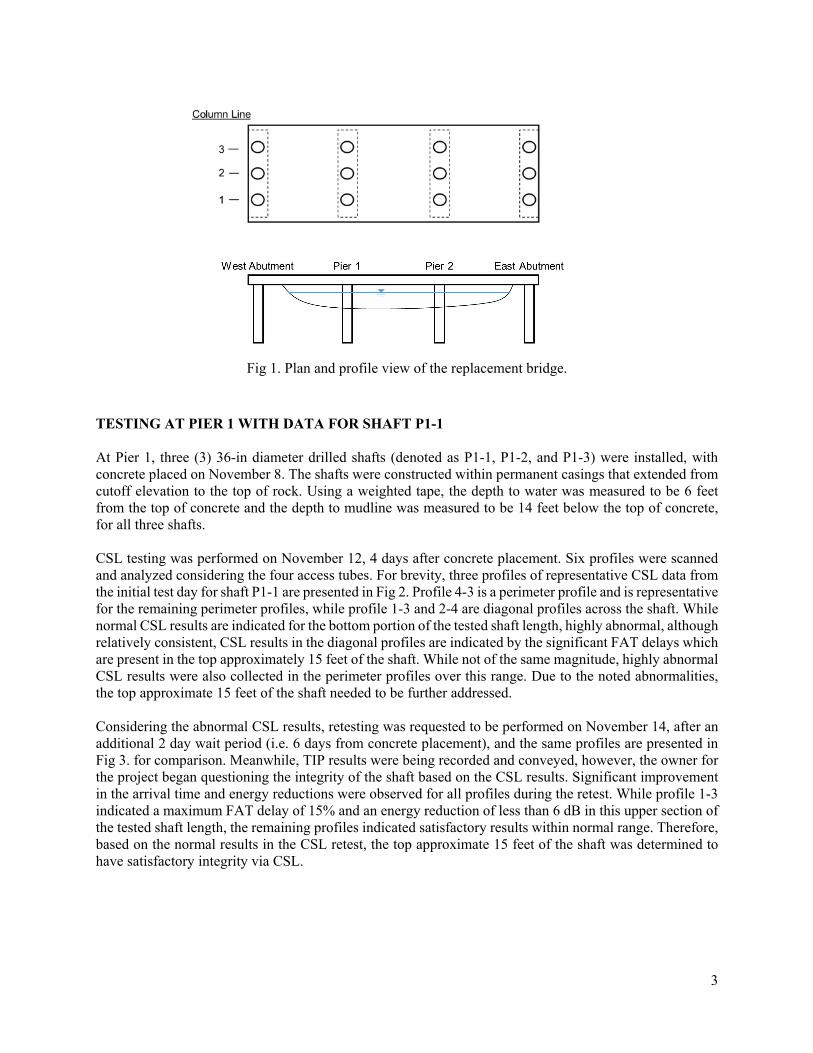
TESTING AT PIER 1 WITH DATA FOR SHAFT P1-1 At Pier 1, three (3) 36-in diameter drilled shafts (denoted as P1-1, P1-2, and P1-3) were installed, with concrete placed on November 8. The shafts were constructed within permanent casings that extended from cutoff elevation to the top of rock. Using a weighted tape, the depth to water was measured to be 6 feet from the top of concrete and the depth to mudline was measured to be 14 feet below the top of concrete, for all three shafts. CSL testing was performed on November 12, 4 days after concrete placement. Six profiles were scanned and analyzed considering the four access tubes. For brevity, three profiles of representative CSL data from the initial test day for shaft P1-1 are presented in Fig 2. Profile 4-3 is a perimeter profile and is representative for the remaining perimeter profiles, while profile 1-3 and 2-4 are diagonal profiles across the shaft. While normal CSL results are indicated for the bottom portion of the tested shaft length, highly abnormal, although relatively consistent, CSL results in the diagonal profiles are indicated by the significant FAT delays which are present in the top approximately 15 feet of the shaft. While not of the same magnitude, highly abnormal CSL results were also collected in the perimeter profiles over this range. Due to the noted abnormalities, the top approximate 15 feet of the shaft needed to be further addressed. Considering the abnormal CSL results, retesting was requested to be performed on November 14, after an additional 2 day wait period (i.e. 6 days from concrete placement), and the same profiles are presented in Fig 3. for comparison. Meanwhile, TIP results were being recorded and conveyed, however, the owner for the project began questioning the integrity of the shaft based on the CSL results. Significant improvement in the arrival time and energy reductions were observed for all profiles during the retest. While profile 1-3 indicated a maximum FAT delay of 15% and an energy reduction of less than 6 dB in this upper section of the tested shaft length, the remaining profiles indicated satisfactory results within normal range. Therefore, based on the normal results in the CSL retest, the top approximate 15 feet of the shaft was determined to have satisfactory integrity via CSL.
4
Fig. 2 Representative CSL data for shaft P1-1.
Fig. 3 Representative CSL data for shaft P1-1 retest.
For all three shafts at Pier 1, TIP data collection was sampled every 15 minutes from just after concrete placement and continued through November 12 (data collected for approximately 4 days). The time to peak temperature was observed to occur at 86.8, 73.3 and 30.0 hours after concrete placement for shafts P1-1, P1-2, and P1-3, respectively. To note, it was reported all three shafts were placed with the same concrete mix design and the surrounding construction conditions (i.e. soils, casing etc.) were the same. As detected, for shafts P1-1 and P1-2, elevated temperatures were not observed until nearly 48 hours after concrete placement while elevated temperatures were observed in just a few hours after concrete placement for shaft P1-3. Selected plots of temperature vs depth for shaft P1-1 are presented in Figs 4 and 5. These plots show thermal profiles for 0, 4 and 36 hours after concrete placement (Fig 4), as well as 48, 72 and 85.5 hours
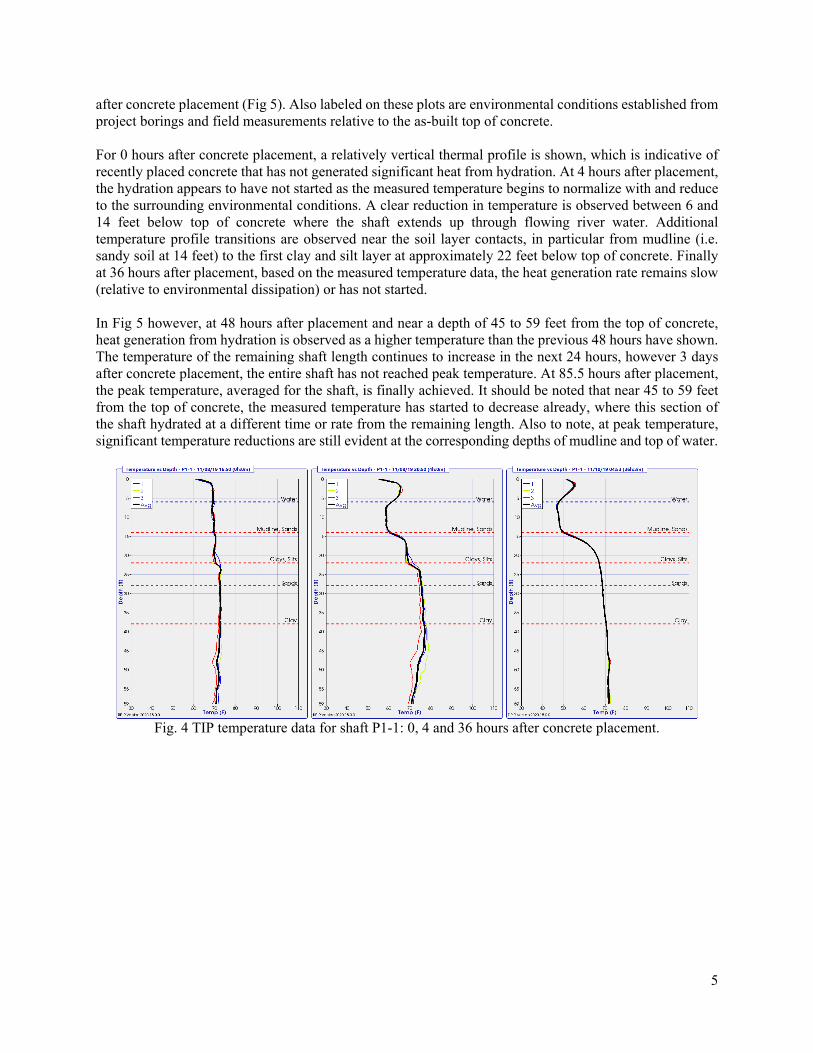
5
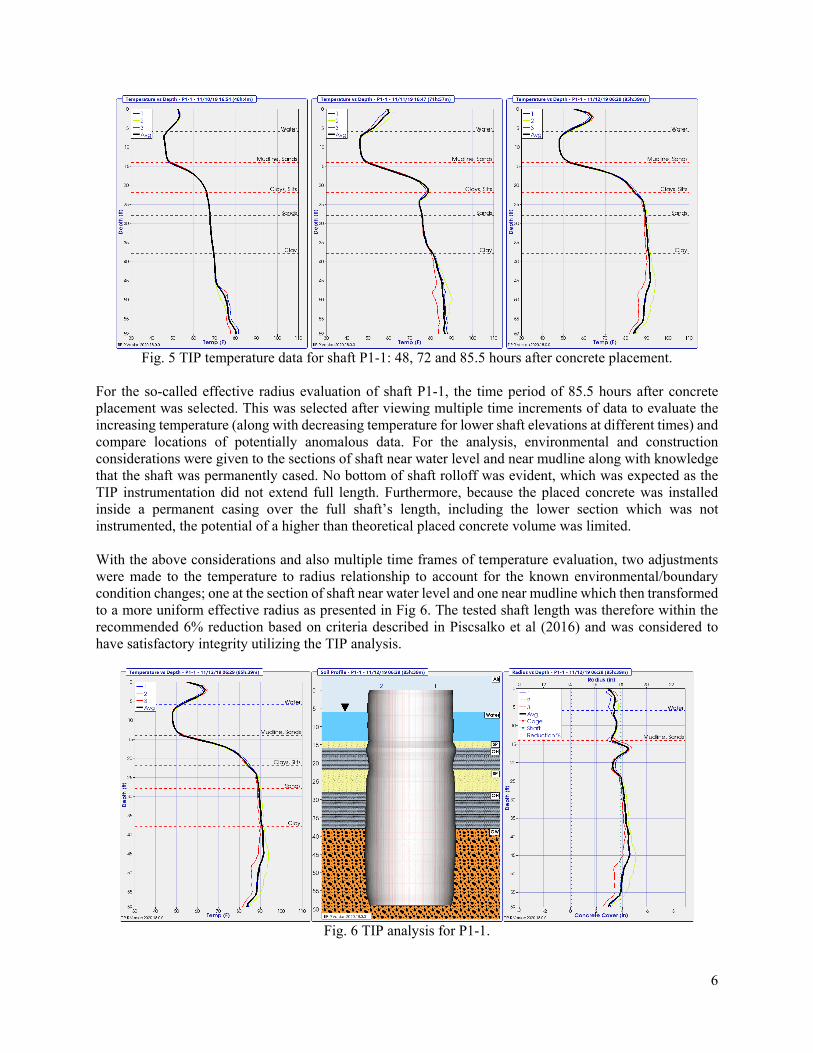
after concrete placement (Fig 5). Also labeled on these plots are environmental conditions established from project borings and field measurements relative to the as-built top of concrete. For 0 hours after concrete placement, a relatively vertical thermal profile is shown, which is indicative of recently placed concrete that has not generated significant heat from hydration. At 4 hours after placement, the hydration appears to have not started as the measured temperature begins to normalize with and reduce to the surrounding environmental conditions. A clear reduction in temperature is observed between 6 and 14 feet below top of concrete where the shaft extends up through flowing river water. Additional temperature profile transitions are observed near the soil layer contacts, in particular from mudline (i.e. sandy soil at 14 feet) to the first clay and silt layer at approximately 22 feet below top of concrete. Finally at 36 hours after placement, based on the measured temperature data, the heat generation rate remains slow (relative to environmental dissipation) or has not started. In Fig 5 however, at 48 hours after placement and near a depth of 45 to 59 feet from the top of concrete, heat generation from hydration is observed as a higher temperature than the previous 48 hours have shown. The temperature of the remaining shaft length continues to increase in the next 24 hours, however 3 days after concrete placement, the entire shaft has not reached peak temperature. At 85.5 hours after placement, the peak temperature, averaged for the shaft, is finally achieved. It should be noted that near 45 to 59 feet from the top of concrete, the measured temperature has started to decrease already, where this section of the shaft hydrated at a different time or rate from the remaining length. Also to note, at peak temperature, significant temperature reductions are still evident at the corresponding depths of mudline and top of water.
Fig. 4 TIP temperature data for shaft P1-1: 0, 4 and 36 hours after concrete placement.
6
Fig. 5 TIP temperature data for shaft P1-1: 48, 72 and 85.5 hours after concrete placement.
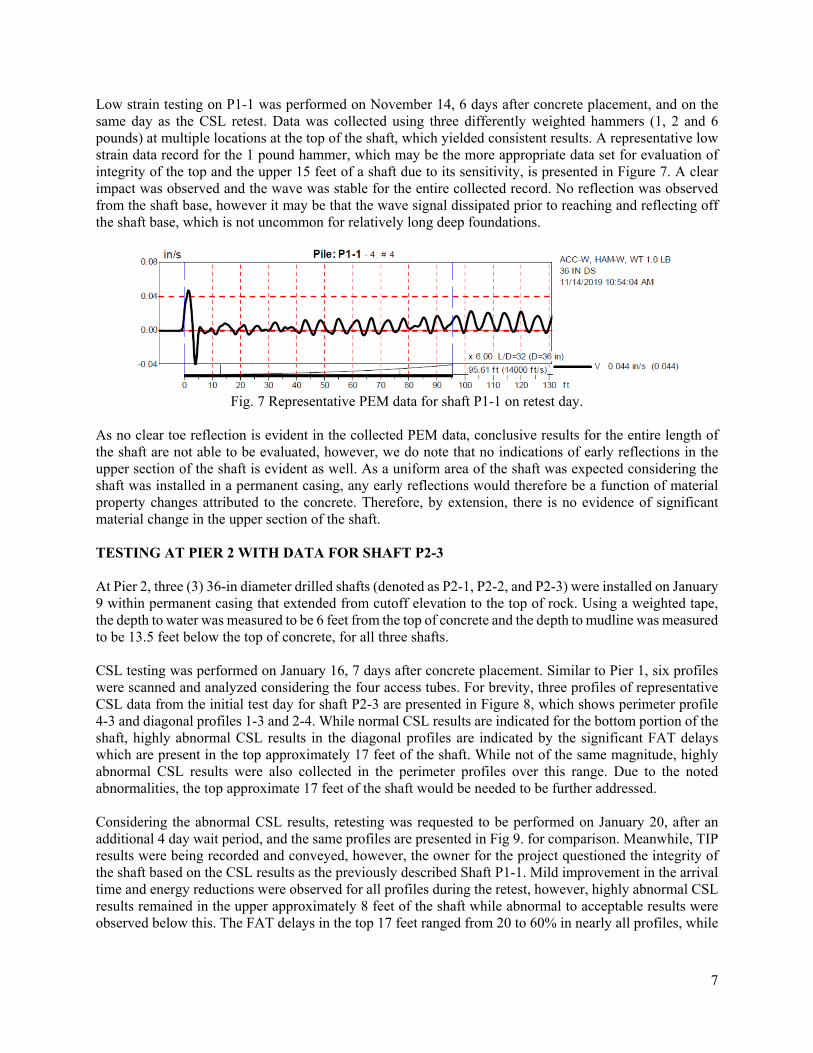
For the so-called effective radius evaluation of shaft P1-1, the time period of 85.5 hours after concrete placement was selected. This was selected after viewing multiple time increments of data to evaluate the increasing temperature (along with decreasing temperature for lower shaft elevations at different times) and compare locations of potentially anomalous data. For the analysis, environmental and construction considerations were given to the sections of shaft near water level and near mudline along with knowledge that the shaft was permanently cased. No bottom of shaft rolloff was evident, which was expected as the TIP instrumentation did not extend full length. Furthermore, because the placed concrete was installed inside a permanent casing over the full shaft’s length, including the lower section which was not instrumented, the potential of a higher than theoretical placed concrete volume was limited. With the above considerations and also multiple time frames of temperature evaluation, two adjustments were made to the temperature to radius relationship to account for the known environmental/boundary condition changes; one at the section of shaft near water level and one near mudline which then transformed to a more uniform effective radius as presented in Fig 6. The tested shaft length was therefore within the recommended 6% reduction based on criteria described in Piscsalko et al (2016) and was considered to have satisfactory integrity utilizing the TIP analysis.
Fig. 6 TIP analysis for P1-1.
7
Low strain testing on P1-1 was performed on November 14, 6 days after concrete placement, and on the same day as the CSL retest. Data was collected using three differently weighted hammers (1, 2 and 6 pounds) at multiple locations at the top of the shaft, which yielded consistent results. A representative low strain data record for the 1 pound hammer, which may be the more appropriate data set for evaluation of integrity of the top and the upper 15 feet of a shaft due to its sensitivity, is presented in Figure 7. A clear impact was observed and the wave was stable for the entire collected record. No reflection was observed from the shaft base, however it may be that the wave signal dissipated prior to reaching and reflecting off the shaft base, which is not uncommon for relatively long deep foundations.
Fig. 7 Representative PEM data for shaft P1-1 on retest day.
As no clear toe reflection is evident in the collected PEM data, conclusive results for the entire length of the shaft are not able to be evaluated, however, we do note that no indications of early reflections in the upper section of the shaft is evident as well. As a uniform area of the shaft was expected considering the shaft was installed in a permanent casing, any early reflections would therefore be a function of material property changes attributed to the concrete. Therefore, by extension, there is no evidence of significant material change in the upper section of the shaft. TESTING AT PIER 2 WITH DATA FOR SHAFT P2-3 At Pier 2, three (3) 36-in diameter drilled shafts (denoted as P2-1, P2-2, and P2-3) were installed on January 9 within permanent casing that extended from cutoff elevation to the top of rock. Using a weighted tape, the depth to water was measured to be 6 feet from the top of concrete and the depth to mudline was measured to be 13.5 feet below the top of concrete, for all three shafts. CSL testing was performed on January 16, 7 days after concrete placement. Similar to Pier 1, six profiles were scanned and analyzed considering the four access tubes. For brevity, three profiles of representative CSL data from the initial test day for shaft P2-3 are presented in Figure 8, which shows perimeter profile 4-3 and diagonal profiles 1-3 and 2-4. While normal CSL results are indicated for the bottom portion of the shaft, highly abnormal CSL results in the diagonal profiles are indicated by the significant FAT delays which are present in the top approximately 17 feet of the shaft. While not of the same magnitude, highly abnormal CSL results were also collected in the perimeter profiles over this range. Due to the noted abnormalities, the top approximate 17 feet of the shaft would be needed to be further addressed. Considering the abnormal CSL results, retesting was requested to be performed on January 20, after an additional 4 day wait period, and the same profiles are presented in Fig 9. for comparison. Meanwhile, TIP results were being recorded and conveyed, however, the owner for the project questioned the integrity of the shaft based on the CSL results as the previously described Shaft P1-1. Mild improvement in the arrival time and energy reductions were observed for all profiles during the retest, however, highly abnormal CSL results remained in the upper approximately 8 feet of the shaft while abnormal to acceptable results were observed below this. The FAT delays in the top 17 feet ranged from 20 to 60% in nearly all profiles, while
8
no additional FAT delays were observed further down the tested length. Therefore, based on the CSL retest results, the top approximate 17 feet of the shaft still needed to be further addressed.
Fig. 8 Representative CSL data for shaft P2-3.
Fig. 9 Representative CSL data for shaft P2-3 retest.
For all three shafts at Pier 2, data collection for TIP was sampled every 15 minutes and continued from just after concrete placement through January 15 (for the first approximate 144 hours). The time to peak temperature was 54.0, 29.0 and 77.0 hours after concrete placement for shafts P2-1, P2-2, and P2-3, respectively. Similar to the CSL testing, available thermal data for TIP testing also extended to 59 feet. Data was automatically recorded via connected dataloggers from the time of concrete placement through
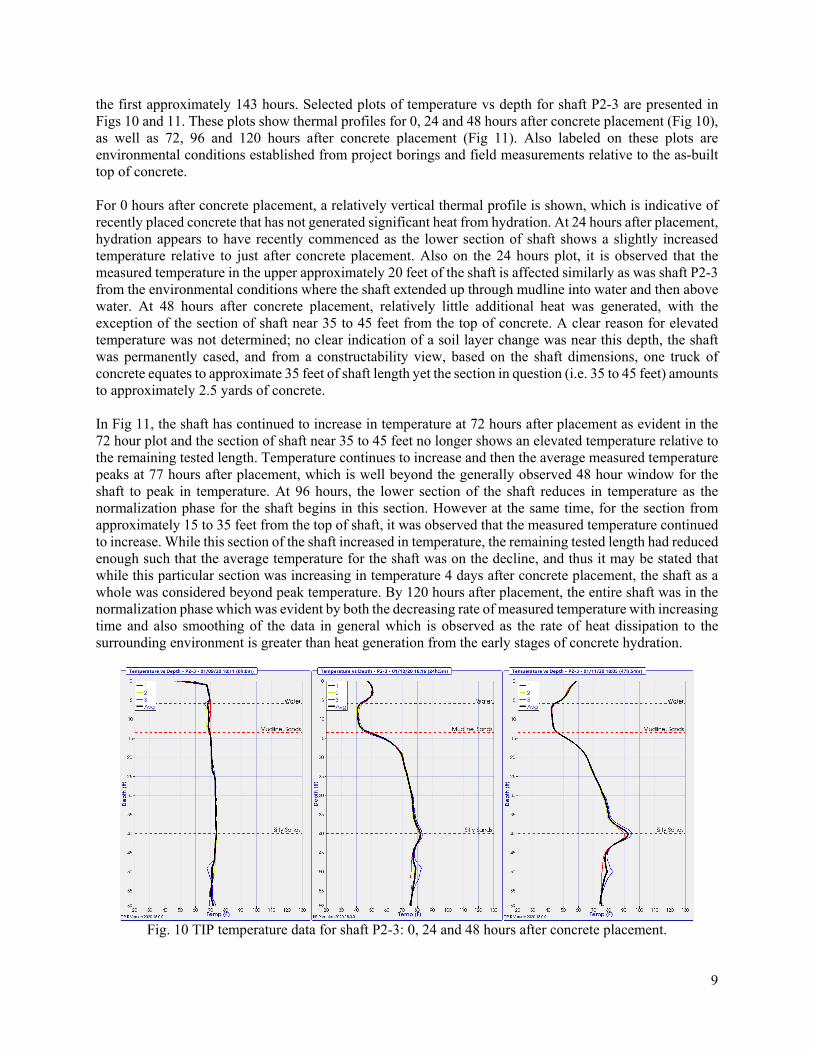
9
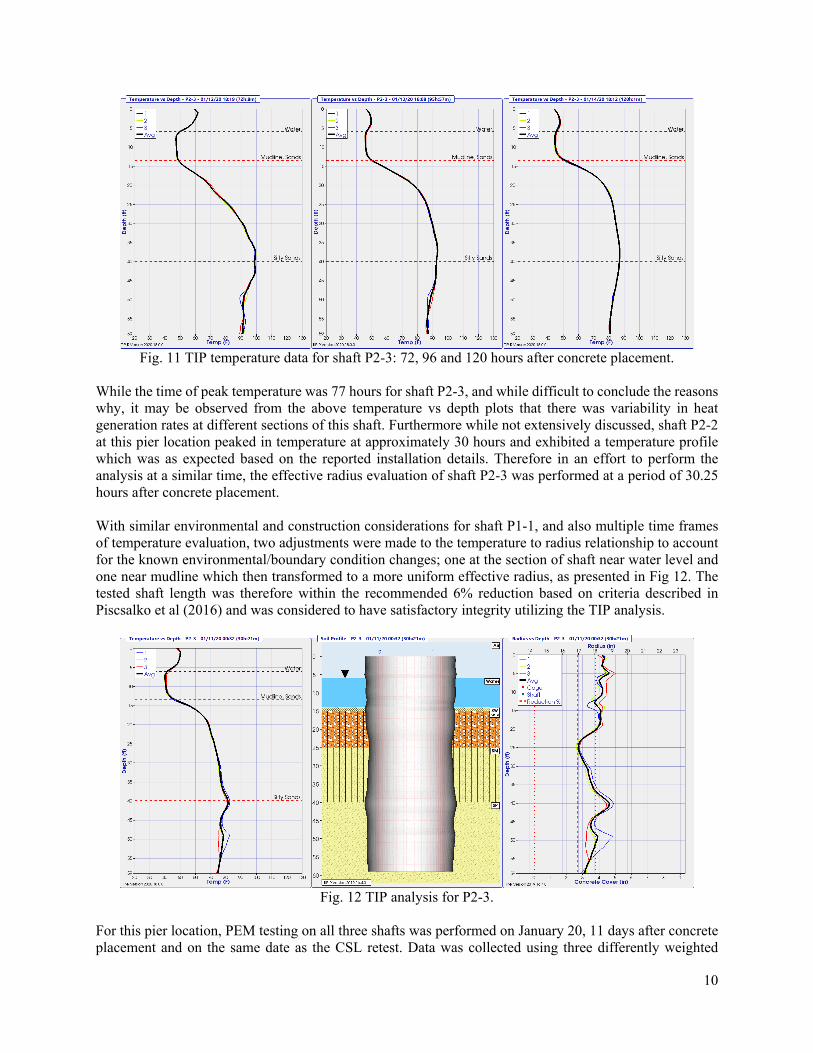
the first approximately 143 hours. Selected plots of temperature vs depth for shaft P2-3 are presented in Figs 10 and 11. These plots show thermal profiles for 0, 24 and 48 hours after concrete placement (Fig 10), as well as 72, 96 and 120 hours after concrete placement (Fig 11). Also labeled on these plots are environmental conditions established from project borings and field measurements relative to the as-built top of concrete. For 0 hours after concrete placement, a relatively vertical thermal profile is shown, which is indicative of recently placed concrete that has not generated significant heat from hydration. At 24 hours after placement, hydration appears to have recently commenced as the lower section of shaft shows a slightly increased temperature relative to just after concrete placement. Also on the 24 hours plot, it is observed that the measured temperature in the upper approximately 20 feet of the shaft is affected similarly as was shaft P2-3 from the environmental conditions where the shaft extended up through mudline into water and then above water. At 48 hours after concrete placement, relatively little additional heat was generated, with the exception of the section of shaft near 35 to 45 feet from the top of concrete. A clear reason for elevated temperature was not determined; no clear indication of a soil layer change was near this depth, the shaft was permanently cased, and from a constructability view, based on the shaft dimensions, one truck of concrete equates to approximate 35 feet of shaft length yet the section in question (i.e. 35 to 45 feet) amounts to approximately 2.5 yards of concrete. In Fig 11, the shaft has continued to increase in temperature at 72 hours after placement as evident in the 72 hour plot and the section of shaft near 35 to 45 feet no longer shows an elevated temperature relative to the remaining tested length. Temperature continues to increase and then the average measured temperature peaks at 77 hours after placement, which is well beyond the generally observed 48 hour window for the shaft to peak in temperature. At 96 hours, the lower section of the shaft reduces in temperature as the normalization phase for the shaft begins in this section. However at the same time, for the section from approximately 15 to 35 feet from the top of shaft, it was observed that the measured temperature continued to increase. While this section of the shaft increased in temperature, the remaining tested length had reduced enough such that the average temperature for the shaft was on the decline, and thus it may be stated that while this particular section was increasing in temperature 4 days after concrete placement, the shaft as a whole was considered beyond peak temperature. By 120 hours after placement, the entire shaft was in the normalization phase which was evident by both the decreasing rate of measured temperature with increasing time and also smoothing of the data in general which is observed as the rate of heat dissipation to the surrounding environment is greater than heat generation from the early stages of concrete hydration.
Fig. 10 TIP temperature data for shaft P2-3: 0, 24 and 48 hours after concrete placement.
10
Fig. 11 TIP temperature data for shaft P2-3: 72, 96 and 120 hours after concrete placement.
While the time of peak temperature was 77 hours for shaft P2-3, and while difficult to conclude the reasons why, it may be observed from the above temperature vs depth plots that there was variability in heat generation rates at different sections of this shaft. Furthermore while not extensively discussed, shaft P2-2 at this pier location peaked in temperature at approximately 30 hours and exhibited a temperature profile which was as expected based on the reported installation details. Therefore in an effort to perform the analysis at a similar time, the effective radius evaluation of shaft P2-3 was performed at a period of 30.25 hours after concrete placement. With similar environmental and construction considerations for shaft P1-1, and also multiple time frames of temperature evaluation, two adjustments were made to the temperature to radius relationship to account for the known environmental/boundary condition changes; one at the section of shaft near water level and one near mudline which then transformed to a more uniform effective radius, as presented in Fig 12. The tested shaft length was therefore within the recommended 6% reduction based on criteria described in Piscsalko et al (2016) and was considered to have satisfactory integrity utilizing the TIP analysis.
Fig. 12 TIP analysis for P2-3.
For this pier location, PEM testing on all three shafts was performed on January 20, 11 days after concrete placement and on the same date as the CSL retest. Data was collected using three differently weighted
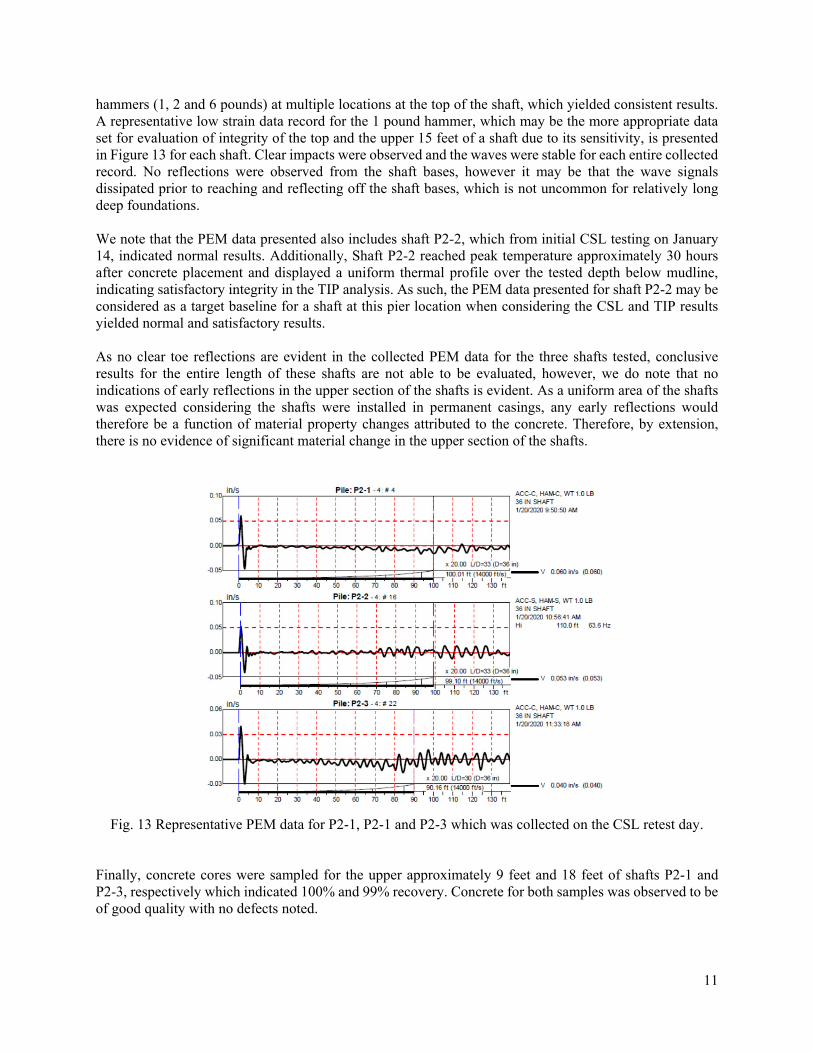
11
hammers (1, 2 and 6 pounds) at multiple locations at the top of the shaft, which yielded consistent results. A representative low strain data record for the 1 pound hammer, which may be the more appropriate data set for evaluation of integrity of the top and the upper 15 feet of a shaft due to its sensitivity, is presented in Figure 13 for each shaft. Clear impacts were observed and the waves were stable for each entire collected record. No reflections were observed from the shaft bases, however it may be that the wave signals dissipated prior to reaching and reflecting off the shaft bases, which is not uncommon for relatively long deep foundations. We note that the PEM data presented also includes shaft P2-2, which from initial CSL testing on January 14, indicated normal results. Additionally, Shaft P2-2 reached peak temperature approximately 30 hours after concrete placement and displayed a uniform thermal profile over the tested depth below mudline, indicating satisfactory integrity in the TIP analysis. As such, the PEM data presented for shaft P2-2 may be considered as a target baseline for a shaft at this pier location when considering the CSL and TIP results yielded normal and satisfactory results. As no clear toe reflections are evident in the collected PEM data for the three shafts tested, conclusive results for the entire length of these shafts are not able to be evaluated, however, we do note that no indications of early reflections in the upper section of the shafts is evident. As a uniform area of the shafts was expected considering the shafts were installed in permanent casings, any early reflections would therefore be a function of material property changes attributed to the concrete. Therefore, by extension, there is no evidence of significant material change in the upper section of the shafts.
Fig. 13 Representative PEM data for P2-1, P2-1 and P2-3 which was collected on the CSL retest day.
Finally, concrete cores were sampled for the upper approximately 9 feet and 18 feet of shafts P2-1 and P2-3, respectively which indicated 100% and 99% recovery. Concrete for both samples was observed to be of good quality with no defects noted.
12
CONCLUSIONS AND CONSIDERATIONS Integrity testing and evaluation of test results performed on drilled shafts is not always a straightforward procedure, yet the testing is critical due to the limited number of foundation support elements as well as the intended lifespan of the structure. For the discussed integrity test methods, CSL, TIP and PEM, to be more reliably performed and evaluated, an appropriate amount of time must elapse for the hydration process to occur, however, the appropriate time for this to occur for each shaft may vary. If CSL testing is performed too soon, unfavorable results may be obtained as the shaft has not yet appropriately cured. Similarly, if the testing is performed too late, then unfavorable results may be obtained due to potential de-bonding effects over time. For both cases, the results may not be representative of the true integrity of the shaft which may lead to unnecessary concerns and costs for addressing and/or remediation efforts. For this reason, a recommended time window typically of 4-7 days for testing to consider these limitations can be attempted to be predicted, however, it is difficult to know how concrete will cure with time due to the many variables that may affect the hydration process without monitoring. For TIP testing, temperature measurements during the hydration process are obtained and analysis may be performed after a maximum temperature is reached. The time to peak temperature for drilled shafts is generally observed in less than 2 days after placement, however, may be longer. While it is generally expected for the time of peak temperature to be similar for shafts constructed utilizing the same reported concrete mix within several hours, and with identical construction methods in similar environmental conditions, as was the construction sequence for this case study, the collected TIP data shows evidence of different start times for elevating temperatures, heat generation rates, and times to peak temperatures along the lengths of several drilled shafts. This observation may offer insight and provide an aid to establishing an appropriate testing time and guidance for the evaluation of CSL and TIP results in order to avoid obtaining and reporting on potentially unrepresentative integrity test results. Shafts P1-1 and P2-3 showed atypical results during the initial CSL tests. Shaft P1-1 showed an improvement in the upper 15-ft section during a retest which was performed an additional 2 days after the initial test, allowing for the shaft to eventually be accepted by the owner, while shaft P2-3 did not show significant improvement in the upper 17-ft after 4 additional days after the initial test which, resulting in shaft coring to be performed. For both shafts, these specific depths correlated well to where the shafts extended up through mudline and again through water. We also note that coring results for shaft P2-3 indicated good quality samples with no defects noted and the TIP results showed both shafts to be satisfactory. Additionally, the PEM testing also showed no evidence of significant material changes in the upper section of the shafts. We do note that the data collected by the thermal wire method (ASTM D7949 method B) was paramount for proper evaluation and analysis as multiple time increments were naturally sampled every 15 minutes. For the probe method (ASTM D7949 method A), while possible to be done, multiple data sets over several days would have been required to gain the same level of insight. The TIP results for these shafts showed clear correlations of reduced temperatures measured in the upper sections where the shafts extend up through mudline and again through water, which may be explained by the flowing river water pulling heat away from the shafts at a more rapid rate than is observed without this boundary and/or environmental condition change. The reduced temperatures may be a cause for delays in the hydration process for the upper section of the shafts, which may then result in requiring additional time for the upper section to cure appropriately while the bottom portion of the shaft may have already appropriately cured. This effect may be a contributing factor for the CSL results to evidently improve in shaft P1-1 during the retest. In addition to the observation stated above, varying temperatures and heat generation rates along the depths of these shafts were identified, particularly for shaft P2-3, such that at later times the lower section of the shaft was past peak temperature and normalizing, while heat generation was continuing or only beginning at upper sections of the shaft at the same time. As such, it may be possible
13
that the thermal expansion during the hydration process is variable with depth as well, which may inadvertently contribute to the debonding of a CSL access tube from the concrete by the time when a CSL test is performed. This may be a contributing factor for the atypical CSL results as seen for shaft P2-3. While this case study is limited in size, all the shafts observed through TIP to peak after more than 48 hours after concrete placement displayed significant CSL arrival time delays and/or energy reductions and the evident varying temperatures with depth may be a consideration when evaluating CSL results. For future projects where both TIP and CSL testing are performed, it is recommended that CSL testing be performed no sooner than after peak temperature is identified, and potentially with some additional lag time to account for potential delays in the concrete gaining early strength. For TIP, comparing different sections of a given shaft at different times may be appropriately evaluated and used for analysis and assessment of integrity of a shaft, as well as to aid in explaining the differences in the behavior of the hydration process within the shaft. With multiple collected time increments, selection of an appropriate analysis time may be made, which includes the knowledge of when heat generation from hydration begins, when peak temperature is, and at what time the normalization phase begins. Finally, this project benefitted from the several integrity tests performed which provided a more complete picture for assessment. While not always the case for a variety of reasons, by considering the CSL, TIP and PEM results, in addition to the concrete core samples, shafts were evaluated by pairing the benefits of each individual test method and provided confidence in evaluating the integrity of the installed drilled shafts.
REFERENCES ASTM D5882-13, “Standard Test Method for low-strain impact integrity testing of deep foundations” American Society for Testing and Materials, Philadelphia, PA, Construction Vol. 4:09 ASTM D6760-16, “Standard Test Method for integrity testing of concrete deep foundations by ultrasonic crosshole testing”, American Society for Testing and Materials, Philadelphia, PA, Construction Vol. 4:09 ASTM D7949-14, “Standard Test Methods for Thermal Integrity Profiling of Concrete Deep Foundations”, American Society for Testing and Materials, Philadelphia, PA, Construction Vol. 4:09 Mullins, G., Kranc, S. May (2007). “Thermal Integrity Testing of Drilled Shafts.” Final Report Submitted to Florida Department of Transportation, Project BD544-20, Tampa, FL; 2007 Piscsalko, G., Likins, G., Mullins, G., October (2016). “Drilled Shaft Acceptance Criteria Based Upon Thermal Integrity).” DFI 41st Annual Conference on Deep Foundations, New York, NY; Rausche, F., Likins, G., Hussein, M., May (1988). “Pile Integrity by Low and High Strain Impacts.” Third International Conference on the Application of Stress-Wave Theory to Piles, Ottawa, Canada, pp 44-55. Webster, K., Rausche, F., January (2011). “Pile and Shaft Integrity Test Results, Classification, Acceptance and/or Rejection.” Compendium of Papers of the Transportation Research Board (TRB) 90th Annual Meeting, Washington, D.C.


![UN UPR Counterplan – HJPV - Wikispaces Web viewCourts [**15] interpreting the word in various contexts have drawn conflicting conclusions, ... Larson 5/10/15 – AFP ... "The tragic](https://img.pdfslide.us/doc/110x75/5a7256117f8b9abb538d6c94/un-upr-counterplan-hjpv-wikispaces-nbspdoc-fileweb.jpg)