Embed Size (px)
Citation preview
116
CHAPTER VI
COMPANY ATTRIBUTES AND EXTENT OF INTANGIBLE
ASSETS DISCLOSURE
The results of chapter 5 reveal that the extent of disclosure of intangible assets
varies from company to company. It could be due to the influence of different corporate
specific attributes.
This chapter analyses the association between the extent of intangible assets
disclosure and corporate attributes. The corporate attributes studied are size of a firm, its
profitability, leverage, listing category, nature of industry, foreign activity and audit firm
size. These explanatory variables have been divided into three groups, consistent with
Lang and Lundholm (1993), Wallace et al. (1994) and Oliveira et al (2006). These groups
are:
i) structural variables, including firm size, leverage, and audit firm size;
ii) performance variables, including profitability; and
iii) market variables, comprising industry, listing status and foreign activity
6.1. HYPOTHESES DEVELOPMENT
Based on the theoretical considerations and empirical research, several hypotheses
have been developed that relate company-specific characteristics to the disclosure of
intangible assets by companies in India. All hypotheses have been stated in both null and
alternate form.
6.1.1 Size of a firm
Firm size is perhaps the most consistent corporate specific characteristic which
has been found to be associated with the level of intangible assets disclosure. Bozzolan et
al (2003, 2006), Meca and Martinez (2005), Oliveira et al (2006), Guthrie et al (2006),
Carlin et al (2006) and White et al (2007) found positive relation between size of a firm
and extent of intangible assets disclosure. However, Kang and Gray (2006) and Kamath
117
(2008a) observed no correlation between intangible assets reporting in the annual reports
and size of the companies.
Larger companies may be hypothesised to disclose more intangible assets related
information in the annual report than smaller companies for a variety of reasons. Firstly,
the cost of disseminating and accumulating detailed information may be relatively low
for the larger corporations than the smaller corporations (Cerf, 1961; Singhvi & Desai,
1971; Buzby, 1975 and Firth, 1979). The big companies have the resources and expertise
to produce more information in their company‟s annual reports (Ahmed & Nicholls, 1994
and Hossain & Adams, 1994). Hence, little extra cost may be incurred to increase
disclosure, i.e. lower incremental cost of producing information for large firms (Lang and
Lundholm, 1993). In addition, larger corporations might need to collect more intangible
assets information for their internal management system.
Secondly, larger companies undertake more activities, and usually have different
business units which may have different critical success factors and different long term
value-creating potential (Hackstone and Milne, 1996). This means that more information
needs to be disclosed to provide stakeholders with a complete picture of the company.
Thirdly, larger firms tend to go to the stock market for financing more often than
smaller firms and as a result may disclose more information in their annual reports for
their own interest (i.e. capital need hypothesis; Cerf, 1961).
Fourthly, smaller firms may feel that their intangible assets disclosure activities
could endanger their competitive oppositions with respect to other larger firms in their
industry, i.e. reluctance of small firm to inform their competitors (Singhvi & Desai, 1971;
Buzby, 1975; Raffournier, 1995). As a result, smaller companies may tend to disclose
less information concerning its intangible assets than large companies.
Fifthly, Wallace and Naser (1995) state the impact of large size companies on the
economy. These can be considerable as these companies account for a significant
proportion of goods and services produced, consumption of raw materials and number of
people employed. The large companies are likely to come under the scrutiny of various
interested parties and therefore tend to disclose adequate and detailed intangible assets
related information in their annual reports.
118
Sixthly, large corporations are likely to have a higher level of internal reporting to
keep senior management informed and therefore likely to have relevant information
available (Cerf, 1961; Buzby, 1975 and Owusu-Ansah, 1998; Depoers, 2000).
Seventhly, it has been suggested that the annual reports of large corporations are
more likely to be scrutinised by financial analysts than those of smaller firms and
investors may interpret non-disclosure as bad news which could adversely affect firm
value. Thus, larger firms may have an incentive to disclose more information related to
its intangible assets than smaller firms.
Finally, as far as political costs are concerned, bigger companies are more vigil in
the public eye which will tend to make them exhibit greater disclosure than the smaller
firms (Firth, 1979; Holthausen and Leftwitch, 1983; Watts and Zimmerman, 1990).
Agency theory shows that a company has to satisfy the needs of creditors and investors.
Therefore, it should provide detailed information in annual reports to avoid information
asymmetries (Jensen & Meckling 1976). Thus, bigger firms make more disclosure to
minimise agency and political costs.
The priori expectation is that larger companies will have higher levels of
intellectual capital reporting than smaller companies. Several measures of size are
available in the literature. The total sales, total assets and market capitalisation are used
as surrogates of size of a firm in this study. The foregoing discussions lead to
development of the following null and alternate hypotheses:
H01: The size of a company as measured by its total assets or total sales or total market
capitalization has no significant impact on its intangible assets disclosure score.
H1: The size of a company as measured by its total assets or total sales or total market
capitalization has a significant impact on its intangible assets disclosure score.
6.1.2 Leverage of a firm
Several studies investigated the relationship between leverage (book value of debt
to shareholder‟s equity) and intangible assets disclosure. It is viewed that companies with
a higher level of leverage have high level of financial risk (Patton and Zelenka, 1997) and
thus disclose more information. Agency theory can also be used to explain the influence
of leverage on the level of voluntary disclosure by a firm. When firms incur outside debt,
119
agency costs arise from conflicts of interest between equity and debt investors (Berger &
Bonaccorsi di Patti, 2006). These agency costs are comprised of a reduction in value of
the firm and increased monitoring costs owing to the fact that the manager will try and
reallocate the wealth of the debt-holder to the firm. The greater the level of debt, the
wider apart the two parties‟ interests (Jensen & Meckling, 1976) and hence the need for
higher monitoring costs. Increased disclosure by a firm can reduce these monitoring
costs. Thus, firms with high leverage levels have an incentive to make voluntary
disclosures in order to reduce agency costs.
Media agenda-setting theory (Cohen, 1963) has also been used to explain why a
firm‟s leverage level could be associated with its intangible assets disclosure levels. If a
firm has „good news‟, low levels of debt for example, then it will attempt to highlight this
positive information to the market through making voluntary disclosures in its annual
report (Sujan & Abeysekera, 2007). Media agenda setting theory therefore suggests the
opposite of agency theory. If a company has low leverage levels it will increase its
voluntary disclosures to inform the market of its strong position.
Prior studies have provided mixed results on the association between leverage and
intangible assets disclosure levels. Oliveira et al (2006), Bozzolan el al (2006) and
Woodrock & Whiting‟s (2009) showed no association between the extent of voluntary
intangible assets disclosure and leverage, whereas Meca & Martinez (2005) and White et
al. (2007) observed a significant positive relationship between the two. The following
null and alternate hypotheses are tested in this study:
H02: The leverage of a company as measured by its debt-equity ratio has no significant
impact on its intangible assets disclosure score.
H2: The leverage of a company as measured by its debt-equity ratio has a significant
impact on its intangible assets disclosure score.
6.1.3 Audit Firm Size
Many authors have suggested that auditors play a role in defining the disclosure
policy of their clients (Raffournier, 1995). Large audit firms are widely scattered across
the world while small audit firms operate domestically. The classification of audit firms
into two groups has been drawn on the assumption that the large firms have more concern
120
for their reputation and therefore are more willing to associate with firms that disclose
more information in their published financial reports. On the other hand, small audit
firms do not possess the power to influence the disclosure practices of their clients.
Rather they attempt to meet the needs of their clients in order to retain them (Firth, 1979
and Wallace and Naser, 1995). Oliveira et al. (2006) argued that large auditing firms may
encourage their clients to disclose more information as they want to preserve their
reputation, develop their expertise, and ensure that they retain their clients.
Chalmers and Godfrey (2004) argue that high profile auditing companies are
more likely to demand high levels of disclosure to maintain their reputation and to avoid
reputation costs. Dumontier and Raffournier (1998) observe that the auditors want their
clients to comply with complex accounting standards for the sake of their reputation and
in their own interest. They may use the information disclosed by their clients as a signal
about their own quality (Inchausti, 1997). The other reason advocated by Patton and
Zelenka (1997) is that the audit by big-six-audit firm is believed to bring enhanced
credibility to the financial reports. This is also linked to the fact that major international
auditing companies have more knowledge about International Accounting Standards
(IAS) and so the costs of implementing and auditing them to their clients is lower than for
smaller auditing companies.
This hypothesis is based on the argument that companies audited by big-six audit
firms have substantial agency costs. They try to reduce them by contracting with these
auditing firms. Auditing is argued to be a way of reducing agency costs (Jensen &
Meckling, 1976 and Watts & Zimmerman, 1983) and the companies that have high
agency costs tend to contract high quality auditing companies. Thus, there is a positive
relationship between agency costs and the disclosure decision (Inchausti, 1997).
Oliveira et al. (2006) and Woodrock & Whiting‟s (2009) are the sole studies to
examine the relationship between the audit firm size and the extent of its intangible assets
disclosure. They concluded that companies with a Big Four auditor disclose more
121
intangible asset information as compared to companies with non-Big four auditors. The
following null and alternate hypotheses have been formulated and tested in this study:
H03: The audit firm size of a company has no significant impact on its intangible assets
disclosure score.
H3: The audit firm size of a company has a significant impact on its intangible assets
disclosure score.
This has been used as a dummy variable. The companies being audited by Big-six audit firms (Price
Waterhouse; A.F. Ferguson; S.B. Baltiboi; Delloitte; Haskins and Sells and B.S.R. & Co.) were assigned a
score of 1 and others 0.
6.1.4. Profitability of a Firm
A number of researchers have used profitability as an explanatory variable for
differences in the disclosure levels. A company‟s profit comes from its continued
investment in intangible assets. The companies which have more investment in intangible
assets will tend to disclose more information about them. Therefore the more an
enterprise can make profits, the more it will tend to disclose the information about
intangible assets. The higher the performance of companies is, the more it will discloses
intellectual capital to the public (Li et al, 2008). Singhvi and Desai (1971) pointed out
that a company with high profits will disclose more information about intellectual capital.
Meca and Martinez (2005) verified a positive relationship between intellectual capital
disclosure and the corporate profitability.
Companies having higher profitability may disclose more information relating its
intangible assets in their corporate annual reports than the companies with lower
profitability (or losses) for a number of reasons. Firstly, if the profitability of a company
is high, management may disclose more detailed information in their corporate annual
reports in order to experience the comfort of communicating it as good news. On the
other hand, if profitability is low, management may disclose less information in order to
cover up the reasons for losses or lower profits (Singhvi and Desai, 1971). It can be
linked to theoretical framework of reporting practices also. Agency theory suggests that
122
managers of very profitable firms will use external information in order to obtain
personal advantages. Therefore, they will disclose detailed information in order to
support the continuance of their positions and compensation arrangements (Inchausti,
1997).
Signalling theory suggests that profitable firms are more likely to disclose more
information to the market to differentiate themselves from poorer performers. Wallace
and Naser (1995) argue that a profitable company is more likely to signal its good
performance to the market by disclosing more information in its annual report. Political
process theory argues that firms with huge profits will be interested in disclosing more
information in order to justify the level of profits. However, the empirical studies found
mixed results.
Researchers have used a number of measures to determine the associations
between profitability and disclosure levels. The return on assets, returns on sales, return
on net worth and return on capital employed have been used as a determinant of
profitability and its association with the level of disclosure in the present study. The
following specific null and alternate hypotheses have been formulated and tested.
H04: The profitability of a company as measured by its ROA or ROS or ROCE or
RONW has no significant impact on its intangible assets disclosure score.
H4: The profitability of a company as measured by its ROA or ROS or ROCE or
RONW has a significant impact on its intangible assets disclosure score.
6.1.5 Listing Category of a Company
The listing category of a firm also influences the disclosure level of a firm. The
relationship between a company‟s listing category and disclosure practices is based on
agency cost and the signalling arguments (Lopes and Rodrigues, 2007). Every Indian
company listed on a stock exchange has to comply with its listing agreement. The
companies whose shares are actively traded have always been scrutinised sharply by the
123
market as a whole and investors in particular. Thus, to reduce agency, political and
monitoring costs more disclosure is being demanded from A category firms than others.
The other reasons being that the international investors have shown their interest
in the Indian capital market after 1993-94. The companies listed under A category are
assumed to be audited by big-six audit firms, have overseas operations and might have
listing on foreign stock exchange and are actively traded on stock exchanges. Such
companies are believed to be disclosing better and detailed information. This argument is
even stronger if the listed company wants to raise its capital in foreign markets (capital-
need hypothesis, Cooke, 1989).
Oliveira et al‟s (2006) study showed a significant influence of listing category on
the level of intangible assets disclosure. So, the above discussion has lead to the
formulation and testing of the following null and alternate hypotheses:
H05: The listing category of a firm has no significant impact on its intangible assets
disclosure score.
H5: The listing category of a firm has a significant impact on its intangible assets
disclosure score.
The impact of listing category of a firm has also been examined by introducing dummy variable. The score of
1 has been given for companies falling under „A‟ listing category and 0 otherwise.
6.1.6. Foreign Activity
Another possible motive for increased disclosures on intangible assets is the
degree of foreign activity of the firm. With the increase in the level of foreign trade, a
company needs to increase their disclosures relating to intangible assets to prove its credit
worthiness to its foreign clients. Managers of companies operating in several
geographical areas have to control a greater amount of information, due to the higher
complexity of the firm‟s operations (Cooke, 1989b). They are prone to increase their
disclosure to show their international presence to stakeholders as a perceived good signal
(Cooke, 1989b, Raffournier, 1995 and Depoers, 2000).. Accordingly, the following null
and alternate hypotheses have been framed:
124
H06: The extent of foreign activity of a company as measured by its total exports to
total sales ratio has no significant impact on its intangible assets disclosure score.
H6: The extent of foreign activity of a company as measured by its total exports to
total sales ratio has a significant impact on its intangible assets disclosure score.
6.1.7 Nature of Industry
The nature of industry and the degree of competition within an industry to which
a company belongs may also influence its intangible assets disclosure level. This can be
explained by stakeholder theory, signalling theory, legitimacy theory, proprietary theory
and media agenda-setting theory. Stakeholder theory purports that shareholders have a
right to be provided with information about how the organisation‟s activities affect them
(Vergauwen & Alem, 2005), particularly if they are less powerful shareholders who
cannot access information through private meetings (Holland, 2001). So in order to
satisfy the stakeholders‟ need for information, firms are forced to make voluntary
disclosures about their intangible assets.
Signalling theory suggests that, within an industry, any deviation from established
corporate reporting practice may be perceived by the market as bad news (Giner, 1997).
Additionally, mandatory financial reporting is claimed to be less informative in high
technology industries which make larger investments in intangibles (such as R&D,
human capital and brand development) (Collins et al., 1997; Francis and Schipper, 1999;
Lev and Zarowin, 1999).
Legitimacy theory asserts that organisations, as part of a social contract, will take
action to ensure that their activities are perceived as legitimate (Lindblom, 1994;
Wilmshurst & Frost, 2000). Firms with high levels of intangible assets are more likely to
engage in voluntary intangible assets disclosure because they cannot legitimise their
status through the traditional symbols of corporate success, the tangible hard assets
(Guthrie et al., 2004). They need to communicate how the firm uses its intangible assets
to generate value (Sciulli et al., 2002).
125
Proprietary costs also vary according to industry. Different industries have
different characteristics relative to market competition, the type of private information,
and the threat of entry of new firms into the market. These factors provide incentives for
companies belonging to the same industry to disclose more information than firms in
another industry.
The fifth theory that has been used to explain the level of voluntary intangible
assets disclosure is that of media agenda-setting theory. This theory suggests that firms
(as a form of media) set the agenda for public opinion by emphasizing or highlighting
certain issues. Therefore “intangible assets intensive firms” boast of their intangible
assets to signal their superiority over competitors (Sujan & Abeysekera, 2007).
Most studies have supported the hypothesis that firms that are high in intangible
assets (e.g. “high-tech.”, knowledge intensive industries) are more likely to engage in
voluntary intangible assets disclosures (e.g. Bozzolan et al., 2003; Petty & Cuganesan,
2005; Bozzolan et al., 2006; Oliveira et al., 2006; Sujan & Abeysekera, 2007; Woodrock
& Whiting, 2009) and some studies have chosen to base their research solely on samples
of firms from high intellectual capital industries (e.g. Sonnier et al., 2007; White et al.,
2007). Accordingly, the null and alternate hypotheses of the study are
H07: The nature of industry to which a company belongs has no significant impact on
its intangible assets disclosure score.
H7: The nature of industry to which a company belongs has a significant impact on its
intangible assets disclosure score.
6.2. RESULTS AND DISCUSSIONS
The effect of different corporate attributes on the extent of intangible assets
disclosure has been studied with the help of two-factor ANOVA test, Univariate and
backward step-wise regression analysis. The results of these have been discussed in the
following sub-parts:
6.2.1 Two-factor ANOVA
126
Intangible assets disclosure trends have been analysed for each of the corporate
attributes (size of the firm- total sales, total assets and market capitalization, leverage,
audit firm size, profitability- ROS, ROA, ROCE and RONW, listing status and foreign
activity) for both years of the study. Each attribute (except dummy variables) was divided
into three broad categories. First category, „High‟ consists of disclosure scores of all
those companies which fall above 66.67th
percentile values for each respective attribute.
„Medium‟ second category consists of disclosure scores of all those companies which fall
between 33.33 to 66.67th
percentile for each respective attribute. Third category „Low‟
comprises disclosure score of companies which fall below 33.33rd
percentile for each
respective attribute.
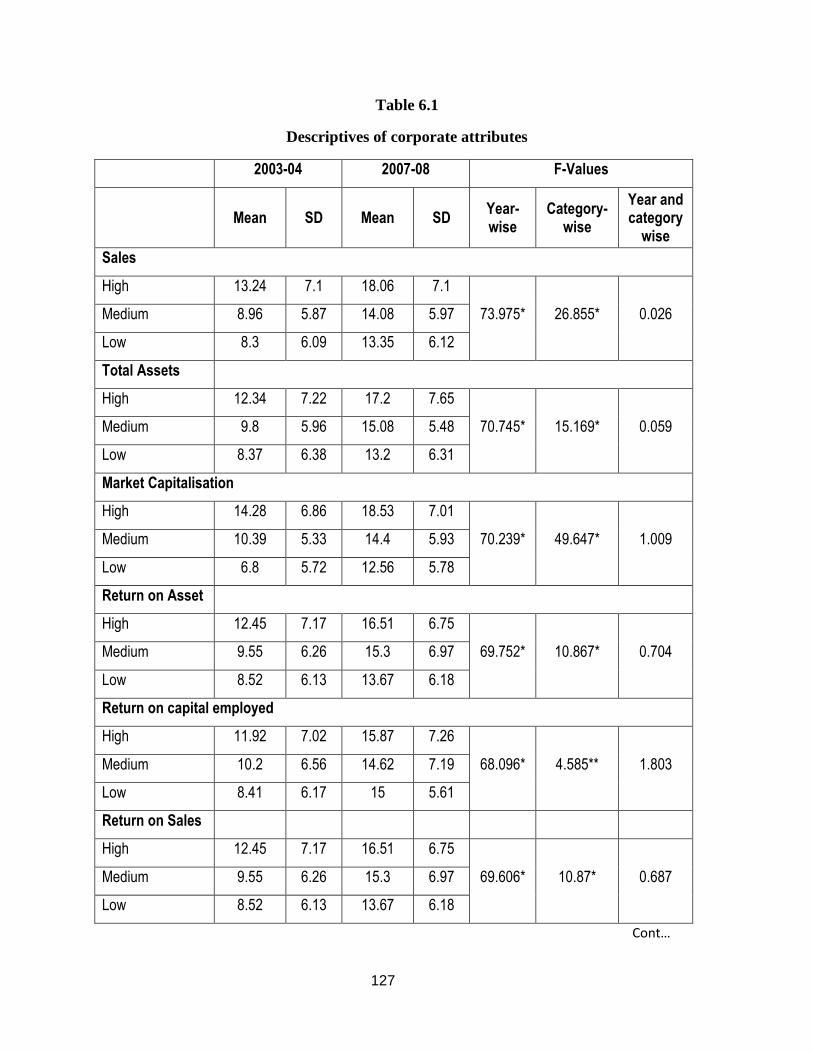
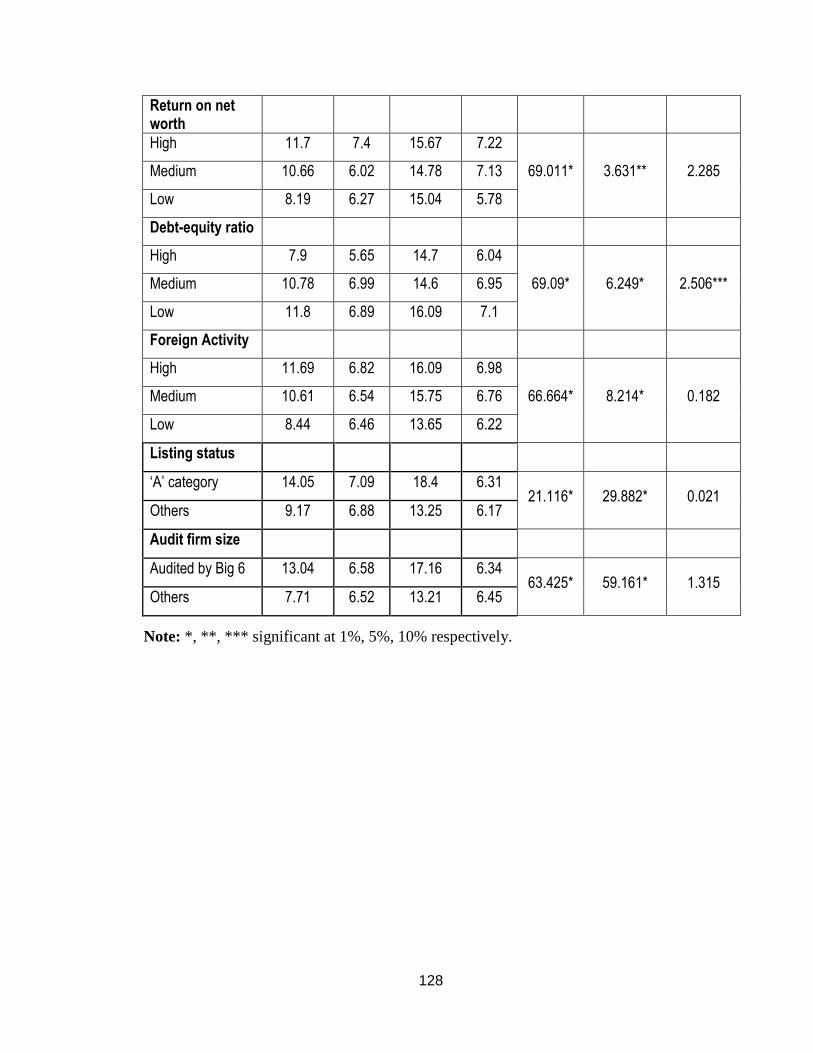
Table 6.1 shows mean and standard deviation values for categories of all the
above corporate attributes for both years of the study. Also, in order to examine any
significant difference in the mean disclosure score of each category (i.e. high, medium
and low) over two years of study, two factor ANOVA test was conducted. In table 6.1, F-
values „across years‟ highlights significant difference in disclosure score over both years
of the study; F-values „across categories‟ illustrates any significant difference in
intangible assets disclosure score across different categories; and F-values „Year and
category wise‟ shows differences in disclosure scores when both years and categories are
together taken into consideration. The ANOVA test pre-condition of equal variances was
satisfied by conducting Levene‟s test of homogeneity of variance. The Levene‟s test‟s
significance for all corporate attributes was greater than 0.05, which satisfied the above
ANOVA test prerequisite.
127
Table 6.1
Descriptives of corporate attributes
2003-04 2007-08 F-Values
Mean SD Mean SD
Year-wise
Category-wise
Year and category
wise
Sales
High 13.24 7.1 18.06 7.1
73.975* 26.855* 0.026 Medium 8.96 5.87 14.08 5.97
Low 8.3 6.09 13.35 6.12
Total Assets
High 12.34 7.22 17.2 7.65
70.745* 15.169* 0.059 Medium 9.8 5.96 15.08 5.48
Low 8.37 6.38 13.2 6.31
Market Capitalisation
High 14.28 6.86 18.53 7.01
70.239* 49.647* 1.009 Medium 10.39 5.33 14.4 5.93
Low 6.8 5.72 12.56 5.78
Return on Asset
High 12.45 7.17 16.51 6.75
69.752* 10.867* 0.704 Medium 9.55 6.26 15.3 6.97
Low 8.52 6.13 13.67 6.18
Return on capital employed
High 11.92 7.02 15.87 7.26
68.096* 4.585** 1.803 Medium 10.2 6.56 14.62 7.19
Low 8.41 6.17 15 5.61
Return on Sales
High 12.45 7.17 16.51 6.75
69.606* 10.87* 0.687 Medium 9.55 6.26 15.3 6.97
Low 8.52 6.13 13.67 6.18
Cont…
128
Return on net worth
High 11.7 7.4 15.67 7.22
69.011* 3.631** 2.285 Medium 10.66 6.02 14.78 7.13
Low 8.19 6.27 15.04 5.78
Debt-equity ratio
High 7.9 5.65 14.7 6.04
69.09* 6.249* 2.506*** Medium 10.78 6.99 14.6 6.95
Low 11.8 6.89 16.09 7.1
Foreign Activity
High 11.69 6.82 16.09 6.98
66.664* 8.214* 0.182 Medium 10.61 6.54 15.75 6.76
Low 8.44 6.46 13.65 6.22
Listing status
‘A’ category 14.05 7.09 18.4 6.31 21.116* 29.882* 0.021
Others 9.17 6.88 13.25 6.17
Audit firm size
Audited by Big 6 13.04 6.58 17.16 6.34 63.425* 59.161* 1.315
Others 7.71 6.52 13.21 6.45
Note: *, **, *** significant at 1%, 5%, 10% respectively.
129
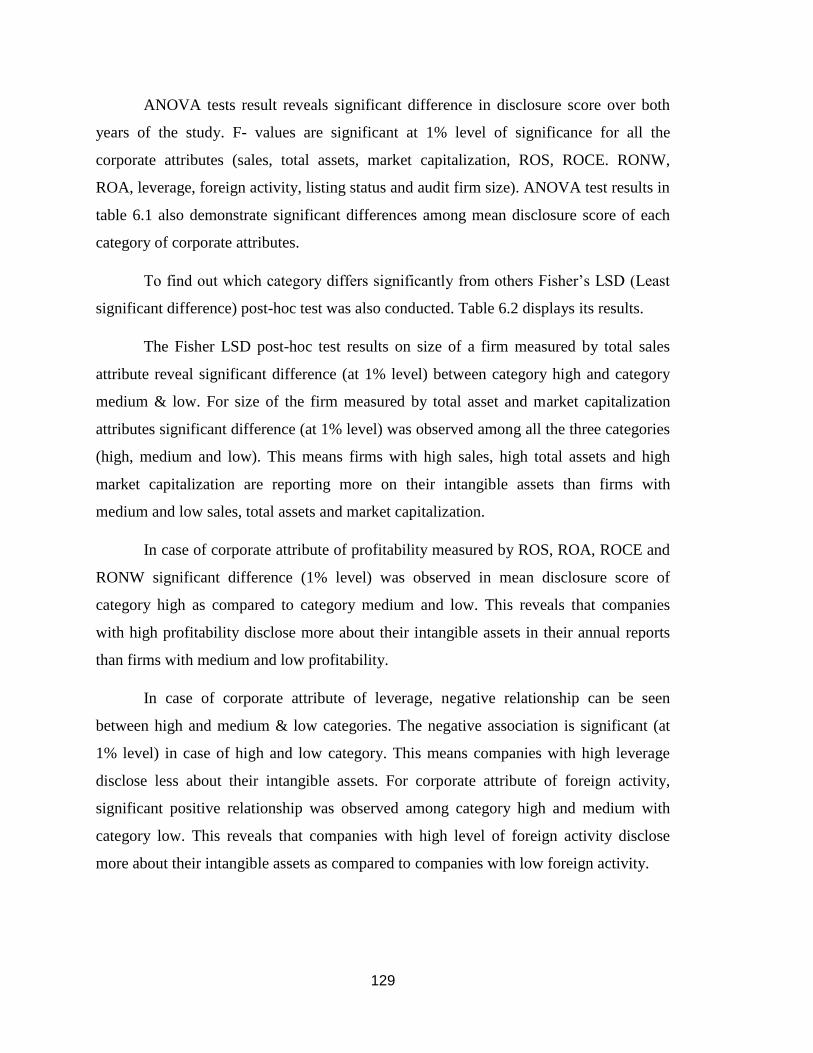
ANOVA tests result reveals significant difference in disclosure score over both
years of the study. F- values are significant at 1% level of significance for all the
corporate attributes (sales, total assets, market capitalization, ROS, ROCE. RONW,
ROA, leverage, foreign activity, listing status and audit firm size). ANOVA test results in
table 6.1 also demonstrate significant differences among mean disclosure score of each
category of corporate attributes.
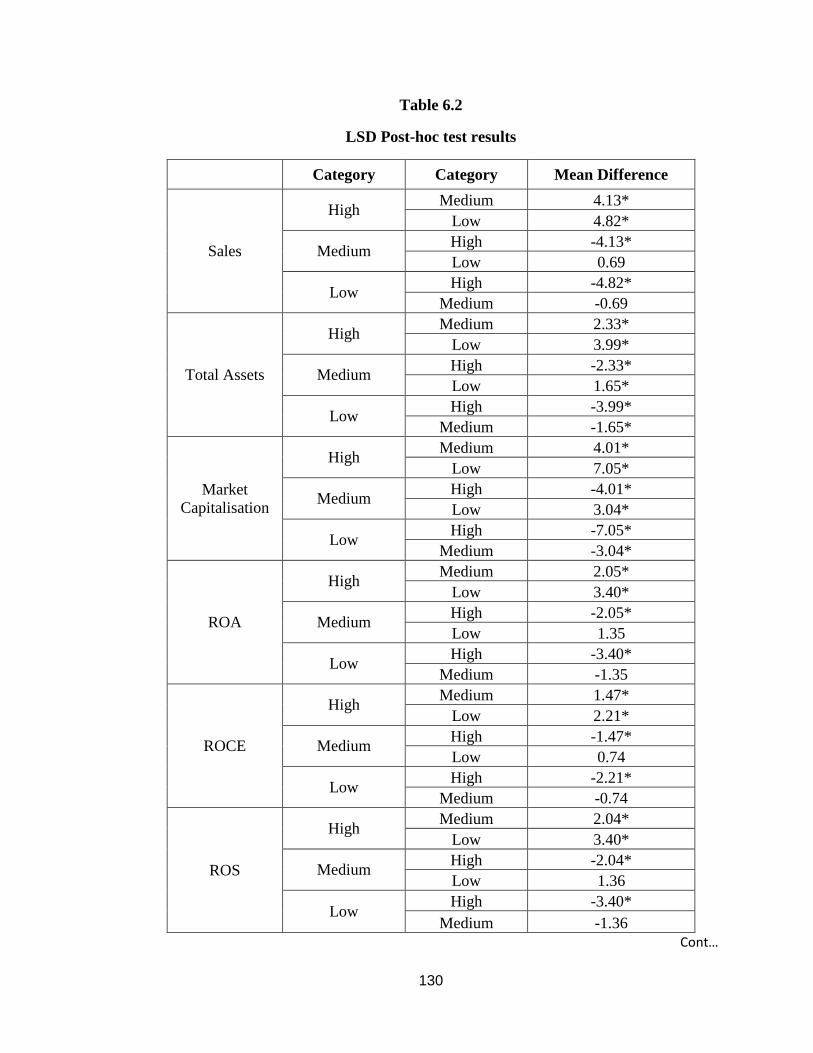
To find out which category differs significantly from others Fisher‟s LSD (Least
significant difference) post-hoc test was also conducted. Table 6.2 displays its results.
The Fisher LSD post-hoc test results on size of a firm measured by total sales
attribute reveal significant difference (at 1% level) between category high and category
medium & low. For size of the firm measured by total asset and market capitalization
attributes significant difference (at 1% level) was observed among all the three categories
(high, medium and low). This means firms with high sales, high total assets and high
market capitalization are reporting more on their intangible assets than firms with
medium and low sales, total assets and market capitalization.
In case of corporate attribute of profitability measured by ROS, ROA, ROCE and
RONW significant difference (1% level) was observed in mean disclosure score of
category high as compared to category medium and low. This reveals that companies
with high profitability disclose more about their intangible assets in their annual reports
than firms with medium and low profitability.
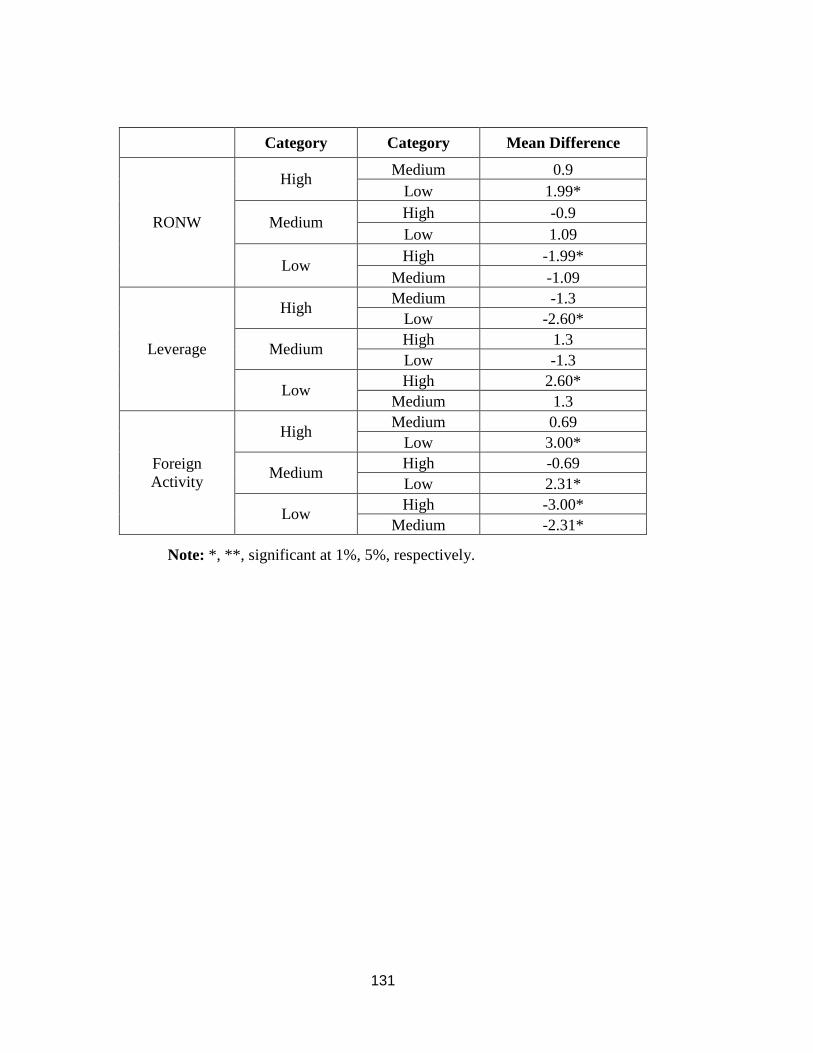
In case of corporate attribute of leverage, negative relationship can be seen
between high and medium & low categories. The negative association is significant (at
1% level) in case of high and low category. This means companies with high leverage
disclose less about their intangible assets. For corporate attribute of foreign activity,
significant positive relationship was observed among category high and medium with
category low. This reveals that companies with high level of foreign activity disclose
more about their intangible assets as compared to companies with low foreign activity.
130
Table 6.2
LSD Post-hoc test results
Category Category Mean Difference
Sales
High Medium 4.13*
Low 4.82*
Medium High -4.13*
Low 0.69
Low High -4.82*
Medium -0.69
Total Assets
High Medium 2.33*
Low 3.99*
Medium High -2.33*
Low 1.65*
Low High -3.99*
Medium -1.65*
Market
Capitalisation
High Medium 4.01*
Low 7.05*
Medium High -4.01*
Low 3.04*
Low High -7.05*
Medium -3.04*
ROA
High Medium 2.05*
Low 3.40*
Medium High -2.05*
Low 1.35
Low High -3.40*
Medium -1.35
ROCE
High Medium 1.47*
Low 2.21*
Medium High -1.47*
Low 0.74
Low High -2.21*
Medium -0.74
ROS
High Medium 2.04*
Low 3.40*
Medium High -2.04*
Low 1.36
Low High -3.40*
Medium -1.36
Cont…
131
Category Category Mean Difference
RONW
High Medium 0.9
Low 1.99*
Medium High -0.9
Low 1.09
Low High -1.99*
Medium -1.09
Leverage
High Medium -1.3
Low -2.60*
Medium High 1.3
Low -1.3
Low High 2.60*
Medium 1.3
Foreign
Activity
High Medium 0.69
Low 3.00*
Medium High -0.69
Low 2.31*
Low High -3.00*
Medium -2.31*
Note: *, **, significant at 1%, 5%, respectively.
132
6.2.2 Regression Analysis
Further, the detailed effect of different corporate attributes on the extent of
intangible assets disclosure has been studied with the help of regression analysis. For
regression analysis, it is essential to assess the validity of the Model (regression
equation).
Assessing the Validity of the Model (regression equation) is necessary to find out
the impact of various corporate-specific attributes on the disclosure practices of sample
Indian private sector companies for the financial years 2003-04 and 2007-08 respectively.
It is pre-emptive to check the existence of multicollinearity among the
explanatory independent variables before proceeding to the results of regression analysis.
Multicollinearity or collinearity is the situation where two or more independent variables
are highly correlated and can have damaging effects on the results of multiple regression.
The correlation matrix is a powerful tool for getting a rough idea of the relationship
between predictors. The suggested rule of thumb is that, if the pair-wise or zero-order
correlation coefficient between two regressors is high say, in excess of 0.8, then
multicollinearity is a serious problem (Gujarati, 2006, p.359). The solution to this
multicollinearity drawback is to drop that variable and thereafter run regression analysis
with rest of the variables. Another way to check the multicollinearity is to compute the
average VIF (Variance inflation factor). As a rule of thumb, if the average VIF of a
variable exceeds 1 which will happen if correlation coefficient exceeds 0.80, then that
variable is said to be highly collinear (Gujarati, 2006, p. 362).
6.2.2.1 Checking the Normality of Data
It was essential to check the distribution of independent and dependent variables.
Certain descriptives like skewness and kurtosis were calculated to test the normality of
data. The disclosure score is found to be within range of skewness (-1 to 1) and kurtosis
(-2 to 2) but the size of a firm measured in all explanatory variables is found to be not
normal. Thus, natural log transformation has been done to make it normal (see, for e.g.
Raffournier, 1995; Patton & Zelenka, 1997and Owusu-Ansah, 1998).
133
6.2.2.2 Correlation Analysis
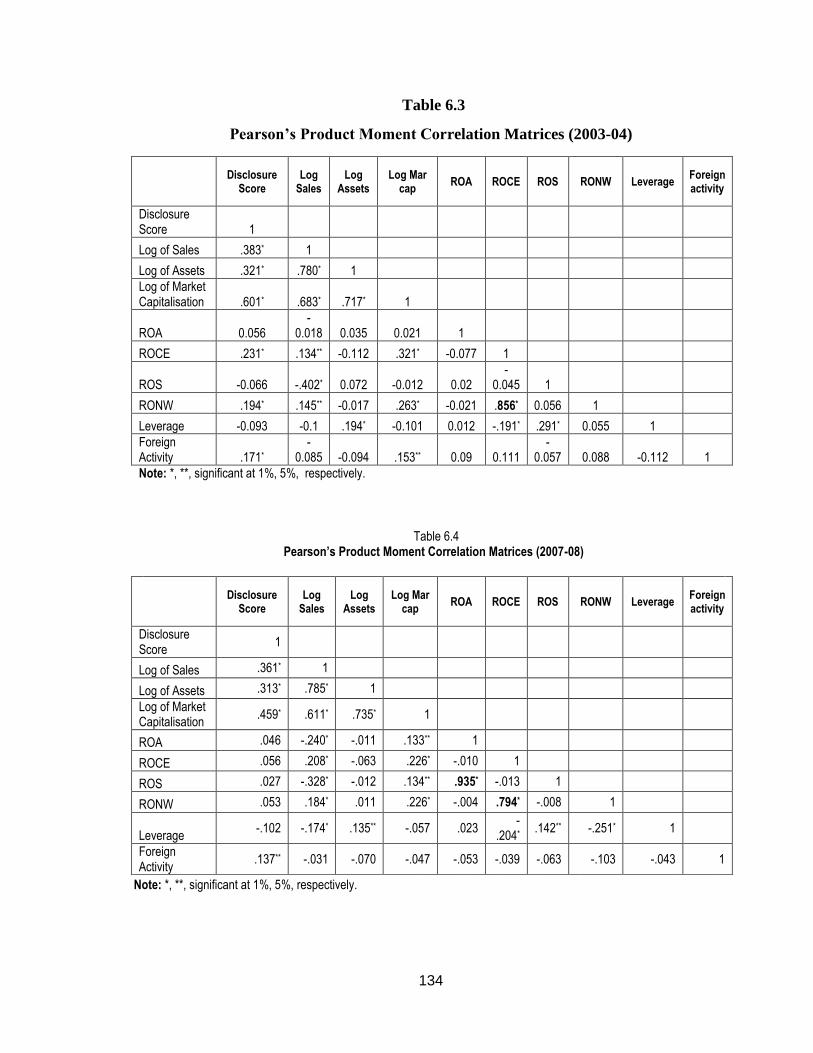
The Pearson product moment correlation (r) was computed to examine the
correlation between the dependent and independent variables and with the dependent
variables. A correlation matrix of all the values of r for the explanatory variables along
with dependent variables was constructed and is shown in table 6.1 and table 6.2 for the
years 2003-04 and 2007-08 respectively.
Table 6.3 illustrates that multicollinearity is an issue of concern in the case of
measures of profitability of a firm i.e. between RONW and ROCE. RONW and ROCE
have coefficient of correlation (.856), above the rule of thumb (0.80), significant at 1%
level. Thus, the problem of multicollinearity exists only between these measures of
profitability for the financial year 2003-04. Rest of the variables do not have problem of
multicollinearity among them.
The results of table 6.4 bring to light that the problem of high value of correlation
coefficient appears in the case of measures of profitability for the year 2007-08. It was
found in the case of ROS and ROA (.935) and RONW and ROCE (.794) significant at
1% level. Thus the problem of multicollinearity exists among only these explanatory
variables. The problem was checked by taking only one measure of profitability in a
regression equation at a time. Rests of the variables do not have any problem of
multicollinearity among them for the year 2007-08.
134
Table 6.3
Pearson’s Product Moment Correlation Matrices (2003-04)
Disclosure
Score Log
Sales Log
Assets Log Mar
cap ROA ROCE ROS RONW Leverage
Foreign activity
Disclosure Score 1
Log of Sales .383* 1 Log of Assets .321* .780* 1
Log of Market Capitalisation .601* .683* .717* 1
ROA 0.056 -
0.018 0.035 0.021 1 ROCE .231* .134** -0.112 .321* -0.077 1
ROS -0.066 -.402* 0.072 -0.012 0.02 -
0.045 1 RONW .194* .145** -0.017 .263* -0.021 .856* 0.056 1
Leverage -0.093 -0.1 .194* -0.101 0.012 -.191* .291* 0.055 1 Foreign
Activity .171* -
0.085 -0.094 .153** 0.09 0.111 -
0.057 0.088 -0.112 1
Note: *, **, significant at 1%, 5%, respectively.
Table 6.4 Pearson’s Product Moment Correlation Matrices (2007-08)
Disclosure
Score Log
Sales Log
Assets Log Mar
cap ROA ROCE ROS RONW Leverage
Foreign activity
Disclosure Score
1
Log of Sales .361* 1
Log of Assets .313* .785* 1
Log of Market Capitalisation
.459* .611* .735* 1
ROA .046 -.240* -.011 .133** 1
ROCE .056 .208* -.063 .226* -.010 1
ROS .027 -.328* -.012 .134** .935* -.013 1
RONW .053 .184* .011 .226* -.004 .794* -.008 1
Leverage -.102 -.174* .135** -.057 .023
-.204*
.142** -.251* 1
Foreign Activity
.137** -.031 -.070 -.047 -.053 -.039 -.063 -.103 -.043 1
Note: *, **, significant at 1%, 5%, respectively.
135
Regression analysis has been performed in two parts. The first part deals with the
application of Univariate regression analysis and afterwards backward step-wise
regression analysis was run.
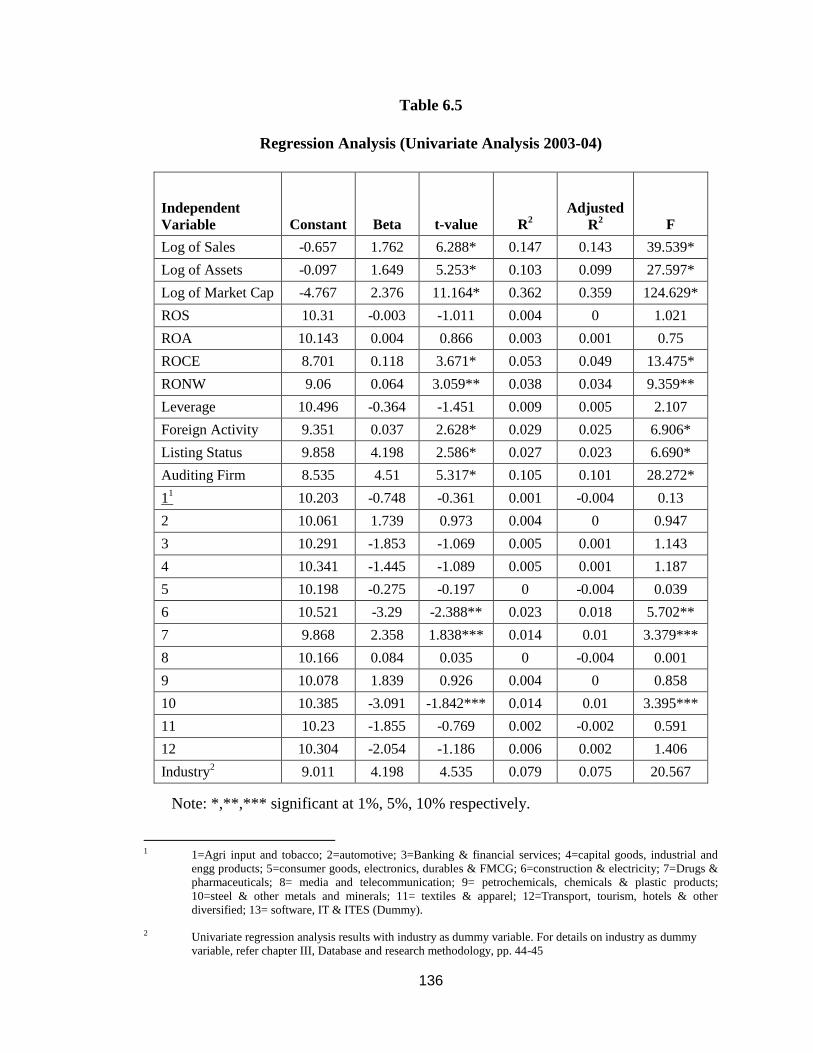
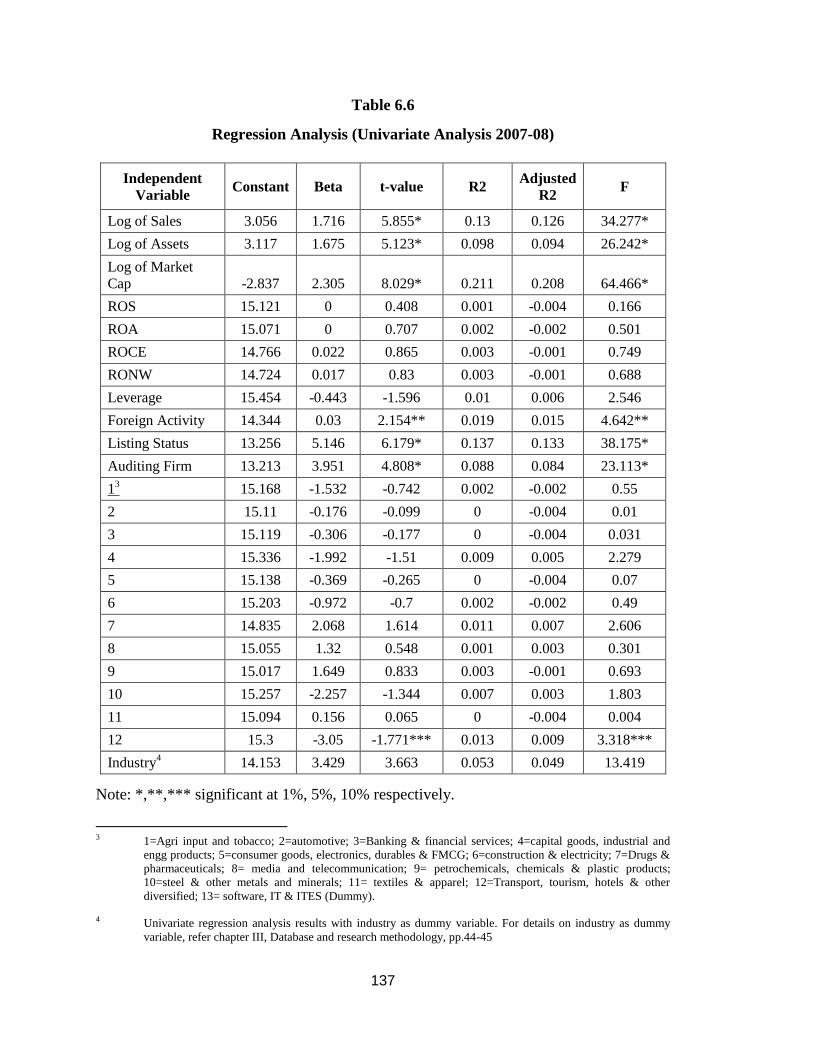
6.2.2.3 Univariate Regression Analysis
To see the individual impact of various independent variables on the dependent
variable the Univariate regression analysis is performed. This means if any change occurs
in the dependent variable due to change in the proportion of different independent
variables, then the researcher needs to analyse the variations in the dependent variable by
the various independent variables individually. This helps in drawing better conclusions
about the influence of different explanatory variables on the dependent variable. Table
6.5 and table 6.6 explain the results of Univariate regression analysis for the two years of
the study.
The results of table 6.5 and 6.6 reveal that the size of a firm as measured in the
terms of three explanatory variables namely sales, or assets, or market capitalization is
found to be significant at 1% level. All have positive association with the disclosure of
intangible assets by selected companies in India. It implies hereby that the large size
companies have higher disclosure of intangible assets. Such results are well evidenced by
literature. The values of adjusted R2
in case of sales (.143), and assets (.099) are far less
than that in the case of market capitalization (.359) for 2003-04. Similarly the values of
adjusted R2
in case of sales (.126) and assets (.094) are also considerably lower than that
in the case of market capitalization (.208) for the year 2007-08. The F values (124.629,
64.466) are also significant at 1% level of significance. Thus, size of a company as
measured by market capitalization explains better variations in disclosure of intangible
assets by the companies in India for the two years of the study.
136
Table 6.5
Regression Analysis (Univariate Analysis 2003-04)
Independent
Variable Constant Beta t-value R2
Adjusted
R2 F
Log of Sales -0.657 1.762 6.288* 0.147 0.143 39.539*
Log of Assets -0.097 1.649 5.253* 0.103 0.099 27.597*
Log of Market Cap -4.767 2.376 11.164* 0.362 0.359 124.629*
ROS 10.31 -0.003 -1.011 0.004 0 1.021
ROA 10.143 0.004 0.866 0.003 0.001 0.75
ROCE 8.701 0.118 3.671* 0.053 0.049 13.475*
RONW 9.06 0.064 3.059** 0.038 0.034 9.359**
Leverage 10.496 -0.364 -1.451 0.009 0.005 2.107
Foreign Activity 9.351 0.037 2.628* 0.029 0.025 6.906*
Listing Status 9.858 4.198 2.586* 0.027 0.023 6.690*
Auditing Firm 8.535 4.51 5.317* 0.105 0.101 28.272*
11 10.203 -0.748 -0.361 0.001 -0.004 0.13
2 10.061 1.739 0.973 0.004 0 0.947
3 10.291 -1.853 -1.069 0.005 0.001 1.143
4 10.341 -1.445 -1.089 0.005 0.001 1.187
5 10.198 -0.275 -0.197 0 -0.004 0.039
6 10.521 -3.29 -2.388** 0.023 0.018 5.702**
7 9.868 2.358 1.838*** 0.014 0.01 3.379***
8 10.166 0.084 0.035 0 -0.004 0.001
9 10.078 1.839 0.926 0.004 0 0.858
10 10.385 -3.091 -1.842*** 0.014 0.01 3.395***
11 10.23 -1.855 -0.769 0.002 -0.002 0.591
12 10.304 -2.054 -1.186 0.006 0.002 1.406
Industry2 9.011 4.198 4.535 0.079 0.075 20.567
Note: *,**,*** significant at 1%, 5%, 10% respectively.
1 1=Agri input and tobacco; 2=automotive; 3=Banking & financial services; 4=capital goods, industrial and
engg products; 5=consumer goods, electronics, durables & FMCG; 6=construction & electricity; 7=Drugs &
pharmaceuticals; 8= media and telecommunication; 9= petrochemicals, chemicals & plastic products;
10=steel & other metals and minerals; 11= textiles & apparel; 12=Transport, tourism, hotels & other
diversified; 13= software, IT & ITES (Dummy).
2 Univariate regression analysis results with industry as dummy variable. For details on industry as dummy
variable, refer chapter III, Database and research methodology, pp. 44-45
137
Table 6.6
Regression Analysis (Univariate Analysis 2007-08)
Independent
Variable Constant Beta t-value R2
Adjusted
R2 F
Log of Sales 3.056 1.716 5.855* 0.13 0.126 34.277*
Log of Assets 3.117 1.675 5.123* 0.098 0.094 26.242*
Log of Market
Cap -2.837 2.305 8.029* 0.211 0.208 64.466*
ROS 15.121 0 0.408 0.001 -0.004 0.166
ROA 15.071 0 0.707 0.002 -0.002 0.501
ROCE 14.766 0.022 0.865 0.003 -0.001 0.749
RONW 14.724 0.017 0.83 0.003 -0.001 0.688
Leverage 15.454 -0.443 -1.596 0.01 0.006 2.546
Foreign Activity 14.344 0.03 2.154** 0.019 0.015 4.642**
Listing Status 13.256 5.146 6.179* 0.137 0.133 38.175*
Auditing Firm 13.213 3.951 4.808* 0.088 0.084 23.113*
13 15.168 -1.532 -0.742 0.002 -0.002 0.55
2 15.11 -0.176 -0.099 0 -0.004 0.01
3 15.119 -0.306 -0.177 0 -0.004 0.031
4 15.336 -1.992 -1.51 0.009 0.005 2.279
5 15.138 -0.369 -0.265 0 -0.004 0.07
6 15.203 -0.972 -0.7 0.002 -0.002 0.49
7 14.835 2.068 1.614 0.011 0.007 2.606
8 15.055 1.32 0.548 0.001 0.003 0.301
9 15.017 1.649 0.833 0.003 -0.001 0.693
10 15.257 -2.257 -1.344 0.007 0.003 1.803
11 15.094 0.156 0.065 0 -0.004 0.004
12 15.3 -3.05 -1.771*** 0.013 0.009 3.318***
Industry4 14.153 3.429 3.663 0.053 0.049 13.419
Note: *,**,*** significant at 1%, 5%, 10% respectively.
3 1=Agri input and tobacco; 2=automotive; 3=Banking & financial services; 4=capital goods, industrial and
engg products; 5=consumer goods, electronics, durables & FMCG; 6=construction & electricity; 7=Drugs &
pharmaceuticals; 8= media and telecommunication; 9= petrochemicals, chemicals & plastic products;
10=steel & other metals and minerals; 11= textiles & apparel; 12=Transport, tourism, hotels & other
diversified; 13= software, IT & ITES (Dummy).
4 Univariate regression analysis results with industry as dummy variable. For details on industry as dummy
variable, refer chapter III, Database and research methodology, pp.44-45
138
The profitability of a firm is found to have positive and significant association
with disclosure score when measured in the terms of ROCE and RONW for the year
2003-04. It is positively associated in the terms of ROA for the year 2003-04 and ROS,
ROA, ROCE and RONW for the year 2007-08. But a negative association has been
found in the case of profitability of a firm measured in the terms of ROS for the year
2003-04. Hence, no conclusive result could be found out and is advocated by the
literature. However, profitability of a company as measured by ROCE has a positive
effect on disclosure score for the two years of the study. The value of adjusted R2 of
ROCE (.049) is more than RONW (.034) with F value (13.475) significant at 1% level
for the year 2003-04 implying hereby that ROCE is a better indicator of overall
profitability position of a firm. It means that the more profitable firms will disclose more
information.
The results of table 6.5 and 6.6 show, that the audit firm size and listing category
of a firm have positive association with the disclosure scores at 1% level of significance.
It implies hereby that the firms being audited by big-six audit firms and listed as A
category in the Indian stock exchanges have more extent of intangible assets disclosure.
The level of foreign activity of a firm is also found to have positive association with
disclosure score at 1% and 5% level of significance for the years 2003-04 and 2007-08
respectively. It shows that the firms having high exports disclose more information about
their intangible assets to their investors. Leverage of a firm was found to be negatively
associated with its intangible assets disclosure score for both years of the study. Thus the
firms with high debt in their capital structure disclose less on their intangible assets.
The nature of industry influences the intangible assets disclosure level of selected
companies in India. As per the first approach5, except construction, pharmaceutical and
steel industry for the year 2003-04 and transport industry for the year 2007-08, others
industrial sectors could not significantly influence the disclosure score individually. The
pharmaceutical industry has more extent of intangible assets disclosure while
construction, steel and transport industry has less extent of disclosure as compared to
software industry. But these sectors significantly influence the variations in the
intangible assets disclosure score for two years of the study. The second approach also
shows industry to be significant attribute (at 1% level of significance) that has an impact
on the level of intangible asset reporting by companies.
5 Industry attribute has been studied under two approaches. For more details refer Chapter III, Database and
Research Methodology, pp.44-45
139
6.2.2.4. Backward Step-wise Regression Analysis
The regression equation analysing the impact of various corporate specific
attributes on the intangible assets disclosure score for two years of the study can be
framed as follows:
Y = β0 +β1X1 +β2 X2 +β3 X3 +β4 X4 +β5 X5 +β6 X6 +β7-18 X7-18+ ε
Where Y = Disclosure score;
X1 = Size of a firm (log of market capitalization);
X2 = Profitability of a firm (ROCE);
X3 = Leverage of a firm;
X4 = Foreign Activity;
X5 = Listing category of a firm;
X6 = Audit firm size of a firm;
X7-18 = Industry type6;
β = Slopes of the independent variables while β0 is a constant or
the value of Y when all values of X are zero;
ε = εt ~ (0, N).
Initially, multivariate regression was performed by taking into consideration all
independent variables hypothesised to have association with the disclosure score. This
could not reveal any conclusive result. Afterwards backward stepwise regression analysis
was run. It appears to be the preferred method of exploratory analyses where the analysis
begins with a full or saturated model and variables are eliminated from the model in an
iterative process. The fit of the model is tested after the elimination of each variable to
ensure that the model still adequately fits the data. The analysis is complete when no
more variables could be eliminated from the model.
The results of backward step-wise regression analysis results for the year 2003-04
and 2007-08, including the adjusted R2, F-statistic values and significant corporate
attributes, of all regression equations has been shown in table 6.7 and 6.8 respectively.
6 1=Agri input and tobacco; 2=automotive; 3=Banking & financial services; 4=capital goods, industrial and
engg products; 5=consumer goods, electronics, durables & FMCG; 6=construction & electricity; 7=Drugs &
pharmaceuticals; 8= media and telecommunication; 9= petrochemicals, chemicals & plastic products;
10=steel & other metals and minerals; 11= textiles & apparel; 12=Transport, tourism, hotels & other
diversified; 13= software, IT & ITES (Dummy).
140
Table 6.7
Backward Stepwise Regression Analysis (2003-04) Variables/Equation 1 2 3 4 5 6 7 8 9 10 11 12 13 14 15 16 17
Constant 0.463 0.463 0.488 0.223 -0.584 -1.041 -1.330 -1.965 -2.188 -2.244 -2.267 -2.456 -2.980 -3.185 -3.265 -3.537 -3.690 (0.950) (0.944) (0.991) (0.442) (-1.031) (-1.708) (-2.157) (-2.960) (-3.261) (-3.346) (-3.385) (-3.633) (-4.183) (-4.421) (-4.536) (-4.857) (-5.051)
log market capitalisation 8.777* 8.813* 9.605* 10.320* 10.153* 10.138* 10.031* 10.106* 10.110* 10.022* 9.933* 10.055* 10.545* 10.609* 10.574* 10.650* 10.604* (2.201) (2.202) (2.251) (2.328) (2.266) (2.263) (2.245) (2.262) (2.266) (2.230) (2.187) (2.209) (2.264) (2.276) (2.274) (2.292) (2.286)
ROCE 0.571 0.576
(0.018) (0.018) × × × × × × × × × × × × × × ×
Leverage -0.031
(-0.007) × × × × × × × × × × × × × × × ×
Foreign activity -1.532 -1.536 -1.572 -1.613
(-0.024) (-0.024) (-0.024) (-0.025) × × × × × × × × × × × × ×
Listing dummy 1.260 1.263 1.204
(1.821) (1.821) (1.721) × × × × × × × × × × × × × ×
Audit firm size 2.451** 2.472** 2.458* 2.666* 2.865* 3.098* 3.162* 3.499* 3.426* 3.498* 3.482* 3.510* 3.405* 3.485* 3.490* 3.661* 3.924* (1.988) (1.990) (1.974) (2.119) (2.271) (2.417) (2.473) (2.683) (2.629) (2.683) (2.674) (2.697) (2.605) (2.662) (2.672) (2.792) (2.960)
17 -2.477** -2.497** -2.616* -2.613* -2.101** -1.870*** -1.595 -1.302
(-5.364) (-5.370) (-5.554) (-5.553) (-3.991) (-3.366) (-2.832) (-2.241) × × × × × × × × ×
2 -2.848* -2.862* -2.909* -2.820* -2.307** -2.072** -1.753*** -1.417 -1.232
(-5.730) (-5.733) (-5.807) (-5.618) (-3.892) (-3.241) (-2.683) (-2.070) (-1.782) × × × × × × × ×
3 -2.396** -2.487** -2.573** -2.540** -2.086** -1.898*** -1.705*** -1.481 -1.373 -1.273 -1.169
(-7.332) (-7.356) (-7.547) (-7.458) (-5.722) (-5.063) (-4.529) (-3.872) (-3.582) (-3.313) (-3.036) × × × × × ×
4 -3.248* -3.259* -3.374* -3.245* -2.806* -2.616* -2.280** -1.927** -1.700*** -1.500 -1.277 -1.174
(-5.543) (-5.545) (-5.678) (-5.425) (-4.017) (-3.392) (-2.870) (-2.262) (-1.959) (-1.702) (-1.423) (-1.304) × × × × ×
5 -2.665* -2.680* -2.661* -2.509** -1.959*** -1.680*** -1.319
(-4.758) (-4.762) (-4.715) (-4.404) (-2.994) (-2.317) (-1.769) × × × × × × × × × ×
6 -3.608* -3.622* -3.847* -3.701* -3.383* -3.257* -2.941* -2.633* -2.439** -2.236** -2.020** -1.929*** -1.763*** -1.640 -1.532 -1.369 (-7.030) (-7.033) (-7.277) (-6.925) (-5.168) (-4.490) (-3.935) (-3.266) (-2.985) (-2.684) (-2.378) (-2.266) (-2.046) (-1.890) (-1.765) (-1.569) 7 -3.048* -3.060* -3.064* -3.094* -2.650* -2.444** -2.086** -1.728*** -1.504 -1.258
(-4.843) (-4.846) (-4.843) (-4.895) (-3.808) (-3.172) (-2.618) (-2.031) (-1.738) (-1.418) × × × × × × ×
8 -2.205*** -2.220** -2.415** -2.330** -1.812*** -1.585
(-5.448) (-5.454) (-5.771) (-5.559) (-3.940) (-3.303) × × × × × × × × × × ×
9 -1.543 -1.550 -1.644 -1.623 -1.029
(-3.115) (-3.118) (-3.272) (-3.234) (-1.863) × × × × × × × × × × × ×
10 -3.515* -3.540* -3.672* -3.577* -3.181* -3.020* -2.720* -2.410** -2.228** -2.048** -1.858*** -1.772*** -1.607 -1.495 -1.400 (-6.498) (-6.503) (-6.660) (-6.470) (-5.225) (-4.554) (-4.010) (-3.343) (-3.058) (-2.774) (-2.484) (-2.364) (-2.119) (-1.961) (-1.837) × ×
11 -3.062* -3.078* -3.218* -3.205* -2.816* -2.628* -2.379** -2.121** -1.977** -1.834*** -1.679*** -1.623 -1.505 -1.432 (-6.818) (-6.822) (-7.028) (-7.008) (-5.824) (-5.181) (-4.638) (-4.022) (-3.729) (-3.436) (-3.121) (-3.017) (-2.784) (-2.643) × × ×
12 -3.125* -3.148* -3.282* -3.143* -2.729* -2.527** -2.226** -1.900*** -1.718*** -1.539 -1.347 -1.267 -1.103 (-5.819) (-5.824) (-5.988) (-5.688) (-4.604) (-3.947) (-3.405) (-2.759) (-2.470) (-2.186) (-1.890) (-1.775) (-1.529) × × × ×
R Square 0.484 0.484 0.483 0.479 0.472 0.469 0.462 0.458 0.453 0.449 0.445 0.441 0.437 0.434 0.428 0.423 0.418
Adjusted R Square 0.436 0.438 0.440 0.439 0.435 0.434 0.430 0.428 0.426 0.425 0.423 0.422 0.421 0.420 0.417 0.415 0.412
F 10.046* 10.692* 11.378* 12.013* 12.582* 13.465* 14.269* 15.351* 16.659* 18.294* 20.325* 22.992* 26.546* 31.579* 38.764* 50.798* 74.948*
DW 1.966 1.966 1.966 1.966 1.966 1.966 1.966 1.966 1.966 1.966 1.966 1.966 1.966 1.966 1.966 1.966 1.966
Note: *,**,*** significant at 1%, 5%, 10% respectively
7 1= Agri input and tobacco; 2=automotive; 3=Banking & financial services; 4=capital goods, industrial and engg products; 5=consumer goods, electronics, durables &
FMCG; 6=construction & electricity; 7=Drugs & pharmaceuticals; 8= media and telecommunication; 9= petrochemicals, chemicals & plastic products; 10=steel & other
metals and minerals; 11= textiles & apparel; 12=Transport, tourism, hotels & other diversified; 13= software, IT & ITES (Dummy).
141
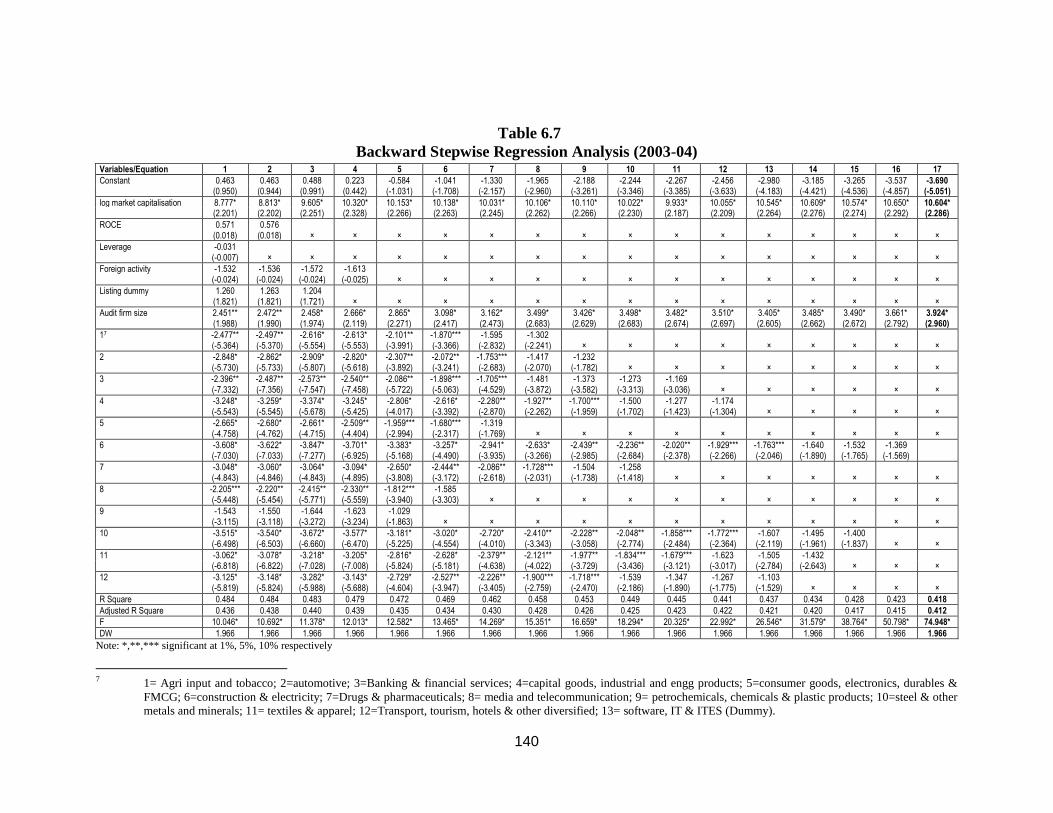
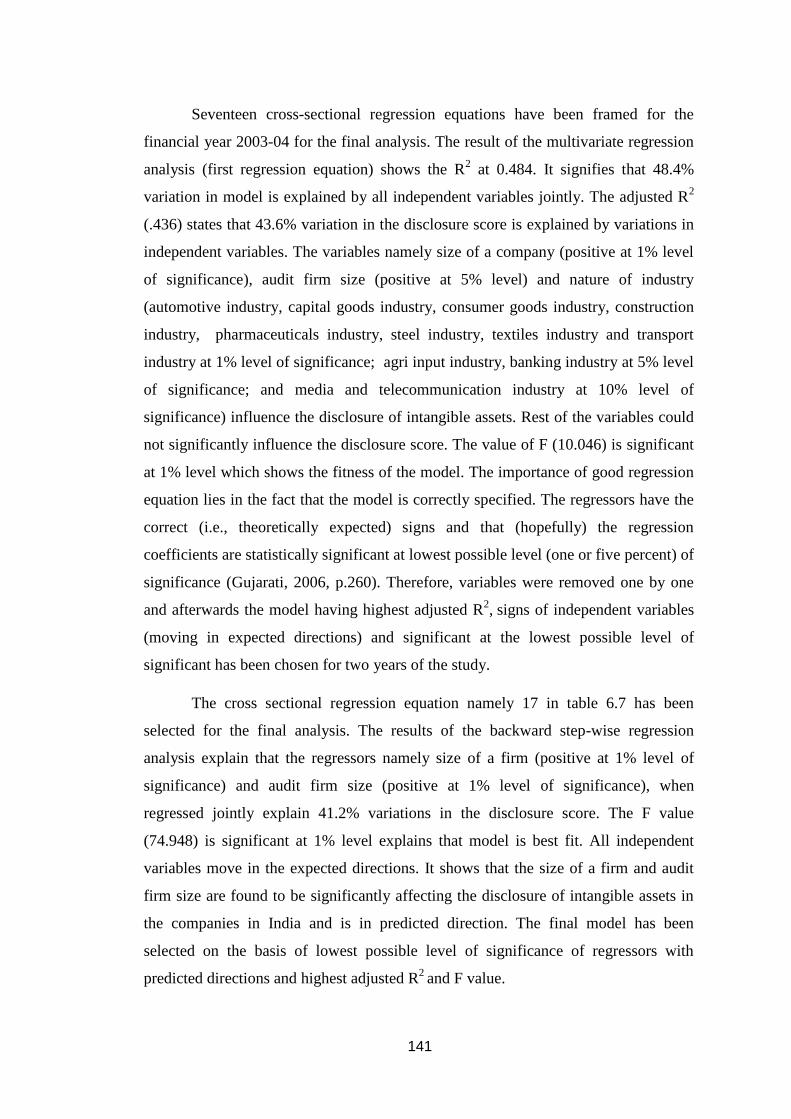
Seventeen cross-sectional regression equations have been framed for the
financial year 2003-04 for the final analysis. The result of the multivariate regression
analysis (first regression equation) shows the R2 at 0.484. It signifies that 48.4%
variation in model is explained by all independent variables jointly. The adjusted R2
(.436) states that 43.6% variation in the disclosure score is explained by variations in
independent variables. The variables namely size of a company (positive at 1% level
of significance), audit firm size (positive at 5% level) and nature of industry
(automotive industry, capital goods industry, consumer goods industry, construction
industry, pharmaceuticals industry, steel industry, textiles industry and transport
industry at 1% level of significance; agri input industry, banking industry at 5% level
of significance; and media and telecommunication industry at 10% level of
significance) influence the disclosure of intangible assets. Rest of the variables could
not significantly influence the disclosure score. The value of F (10.046) is significant
at 1% level which shows the fitness of the model. The importance of good regression
equation lies in the fact that the model is correctly specified. The regressors have the
correct (i.e., theoretically expected) signs and that (hopefully) the regression
coefficients are statistically significant at lowest possible level (one or five percent) of
significance (Gujarati, 2006, p.260). Therefore, variables were removed one by one
and afterwards the model having highest adjusted R2, signs of independent variables
(moving in expected directions) and significant at the lowest possible level of
significant has been chosen for two years of the study.
The cross sectional regression equation namely 17 in table 6.7 has been
selected for the final analysis. The results of the backward step-wise regression
analysis explain that the regressors namely size of a firm (positive at 1% level of
significance) and audit firm size (positive at 1% level of significance), when
regressed jointly explain 41.2% variations in the disclosure score. The F value
(74.948) is significant at 1% level explains that model is best fit. All independent
variables move in the expected directions. It shows that the size of a firm and audit
firm size are found to be significantly affecting the disclosure of intangible assets in
the companies in India and is in predicted direction. The final model has been
selected on the basis of lowest possible level of significance of regressors with
predicted directions and highest adjusted R2
and F value.
142
Table 6.8
Backward Stepwise Regression Analysis (2007-08) Variables/Equation 1 2 3 4 5 6 7 8 9 10 11 12
Constant -0.384 -0.386 -0.406 -0.668 -0.910 -1.044 -0.954 -1.039 -1.195 -1.344 -1.481 -1.611 (-1.381) (-1.367) (-1.040) (-1.562) (-2.045) (-2.323) (-2.108) (-2.291) (-2.604) (-2.918) (-3.203) (-3.476) log market capitalisation 5.617* 5.660* 8.684* 8.698* 8.717* 8.672* 8.752* 8.671* 8.641* 8.614* 8.544* 8.572* (2.631) (2.630) (2.582) (2.565) (2.568) (2.545) (2.481) (2.433) (2.421) (2.418) (2.398) (2.410) ROCE -1.105 -1.128 -1.127 -1.080 -0.969 -0.851 (-0.027) (-0.027) (-0.027) (-0.025) (0.022) (-0.020) × × × × × × Leverage 0.024 (0.007) × × × × × × × × × × × Foreign activity -0.495 -0.496 -0.500 (-0.008) (-0.008) (-0.008) × × ×× × × × × × × Listing dummy -0.136 -0.134 (-0.169) (-0.166) × × × × × × × × × × Audit firm size 2.576** 2.616* 2.619* 2.697* 2.784* 2.883* 2.927* 3.163* 3.150* 3.206* 3.507* 3.495* (2.058) (2.054) (2.048) (2.092) (2.148) (2.214) (2.244) (2.392) (2.381) (2.426) (2.611) (2.606) 18 -2.302** -2.312** -2.341** -2.369** -2.252** -2.103** -2.083** -1.879*** -1.707*** -1.541 -1.367 (-5.187) (-5.183) (-5.212) (-4.717) (-4.316) (-3.933) (-3.891) (-3.433) (-3.026) (-2.713) (-2.386) × 2 -2.047** -2.056** -2.071** -2.109** -1.977** -1.808*** -1.801*** -1.566 -1.365 (-4.293) (-4.289) (-4.306) (-3.782) (-3.387) (-3.005) (-2.991) (-2.522) (-2.114) × × × 3 -3.079* -3.274* -3.278* -3.575* -3.511* -3.388* -3.337* -3.141* -3.002* -2.823* -2.626* -2.513** (-7.087) (-7.068) (-7.053) (-6.474) (-6.077) (-5.665) (-5.561) (-5.039) (-4.619) (-4.300) (-3.941) (-3.764) 4 -3.094* -3.101* -3.115* -3.380* -3.318* -3.188* -3.394* -3.193* -3.064* -2.849* -2.624* -2.472** (-5.483) (-5.483) (-5.492) (-5.018) (-4.657) (-4.309) (-4.511) (-4.048) (-3.640) (-3.327) (-2.998) (-2.809) 5 -2.132** -2.138** -2.163** -2.244** -2.116** -1.937*** -2.038*** -1.766*** -1.548 -1.312 (-3.969) (-3.967) (-3.990) (-3.499) (-3.115) (-2.739) (-2.865) (-2.359) (-1.952) (-1.627) × × 6 -3.164* -3.177* -3.192* -3.632* -3.587* -3.470* -3.476* -3.278* -3.150* -2.942* -2.705* -2.569** (-6.380) (-6.377) (-6.388) (-5.784) (-5.390) (-4.986) (-4.992) (-4.455) (-4.041) (-3.714) (-3.325) (-3.146) 7 -1.645 -1.650*** -1.669*** -1.598 -1.427 -1.209 -1.233 -0.925 (-2.594) (-2.592) (-2.608) (-2.328) (-1.948) (-1.577) (-1.607) (-1.148) × × × × 8 -1.128 -1.158 -1.189 -1.080 -0.922 (-2.925) (-2.938) (-2.982) (-2.450) (-2.024) × × × × × × × 9 -1.578 -1.582 -1.589 -1.520 -1.368 -1.185 -1.149 (-3.448) (-3.445) (-3.451) (-3.001) (-2.595) (-2.185) (-2.116) × × × × × 10 -3.385* -3.393* -3.405* -3.545* -3.484* -3.360* -3.347* -3.148* -3.010* -2.823* -2.607* -2.488** (-6.753) (-6.752) (-6.759) (-6.327) (-5.922) (-5.512) (-5.485) (-4.949) (-4.538) (-4.209) (-3.811) (-3.630) 11 -0.856 -0.864 -0.864 -0.753 (-2.065) (-2.056) (-2.052) (-1.708) × × × × × × × × 12 -3.414* -3.426* -3.445* -3.565* -3.506* -3.384* -3.338* -3.141* -3.003* -2.820* -2.610* -2.491** (-6.865) (-6.862) (-6.876) (-6.461) (-6.043) (-5.629) (-5.536) (-5.016) (-4.609) (-4.281) (-3.892) (-3.707) R Square 0.356 0.356 0.356 0.355 0.353 0.351 0.349 0.345 0.343 0.338 0.333 0.327 Adjusted R Square 0.304 0.307 0.310 0.312 0.314 0.314 0.315 0.314 0.314 0.312 0.310 0.307 F 6.873* 7.310* 7.799* 8.330* 8.901* 9.527* 10.273* 11.071* 12.100* 13.189* 14.578* 16.333* DW 2.154 2.154 2.154 2.154 2.154 2.154 2.154 2.154 2.154 2.154 2.154 2.154
Note: *,**,*** significant at 1%, 5%, 10% respectively
8 1= Agri input and tobacco; 2=automotive; 3=Banking & financial services; 4=capital goods, industrial and engg products; 5=consumer goods, electronics, durables &
FMCG; 6=construction & electricity; 7=Drugs & pharmaceuticals; 8= media and telecommunication; 9= petrochemicals, chemicals & plastic products; 10=steel & other
metals and minerals; 11= textiles & apparel; 12=Transport, tourism, hotels & other diversified; 13= software, IT & ITES (Dummy).
143
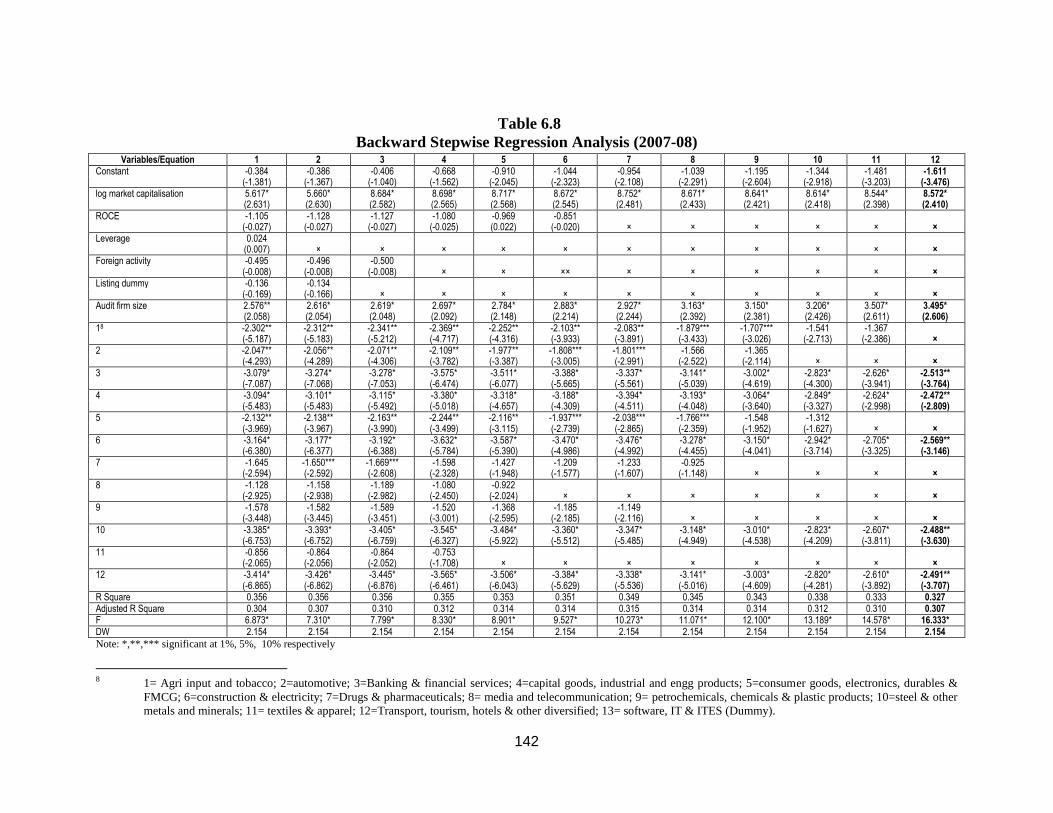
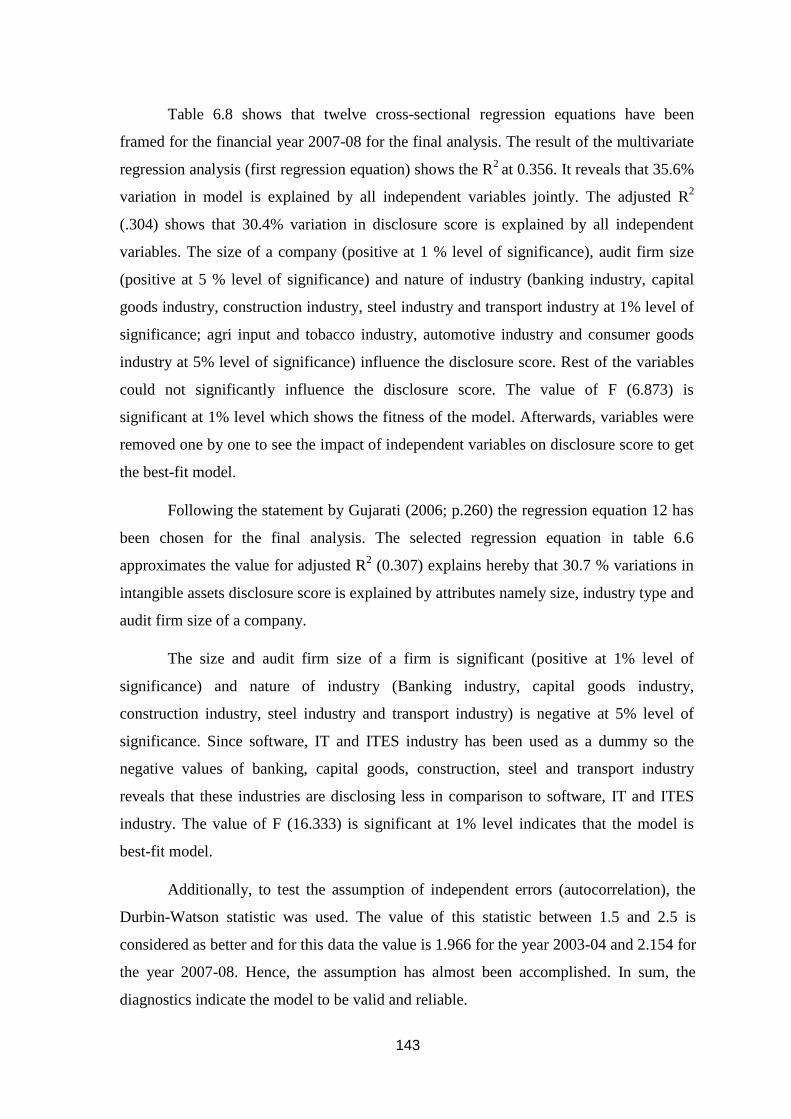
Table 6.8 shows that twelve cross-sectional regression equations have been
framed for the financial year 2007-08 for the final analysis. The result of the multivariate
regression analysis (first regression equation) shows the R2
at 0.356. It reveals that 35.6%
variation in model is explained by all independent variables jointly. The adjusted R2
(.304) shows that 30.4% variation in disclosure score is explained by all independent
variables. The size of a company (positive at 1 % level of significance), audit firm size
(positive at 5 % level of significance) and nature of industry (banking industry, capital
goods industry, construction industry, steel industry and transport industry at 1% level of
significance; agri input and tobacco industry, automotive industry and consumer goods
industry at 5% level of significance) influence the disclosure score. Rest of the variables
could not significantly influence the disclosure score. The value of F (6.873) is
significant at 1% level which shows the fitness of the model. Afterwards, variables were
removed one by one to see the impact of independent variables on disclosure score to get
the best-fit model.
Following the statement by Gujarati (2006; p.260) the regression equation 12 has
been chosen for the final analysis. The selected regression equation in table 6.6
approximates the value for adjusted R2 (0.307) explains hereby that 30.7 % variations in
intangible assets disclosure score is explained by attributes namely size, industry type and
audit firm size of a company.
The size and audit firm size of a firm is significant (positive at 1% level of
significance) and nature of industry (Banking industry, capital goods industry,
construction industry, steel industry and transport industry) is negative at 5% level of
significance. Since software, IT and ITES industry has been used as a dummy so the
negative values of banking, capital goods, construction, steel and transport industry
reveals that these industries are disclosing less in comparison to software, IT and ITES
industry. The value of F (16.333) is significant at 1% level indicates that the model is
best-fit model.
Additionally, to test the assumption of independent errors (autocorrelation), the
Durbin-Watson statistic was used. The value of this statistic between 1.5 and 2.5 is
considered as better and for this data the value is 1.966 for the year 2003-04 and 2.154 for
the year 2007-08. Hence, the assumption has almost been accomplished. In sum, the
diagnostics indicate the model to be valid and reliable.
144
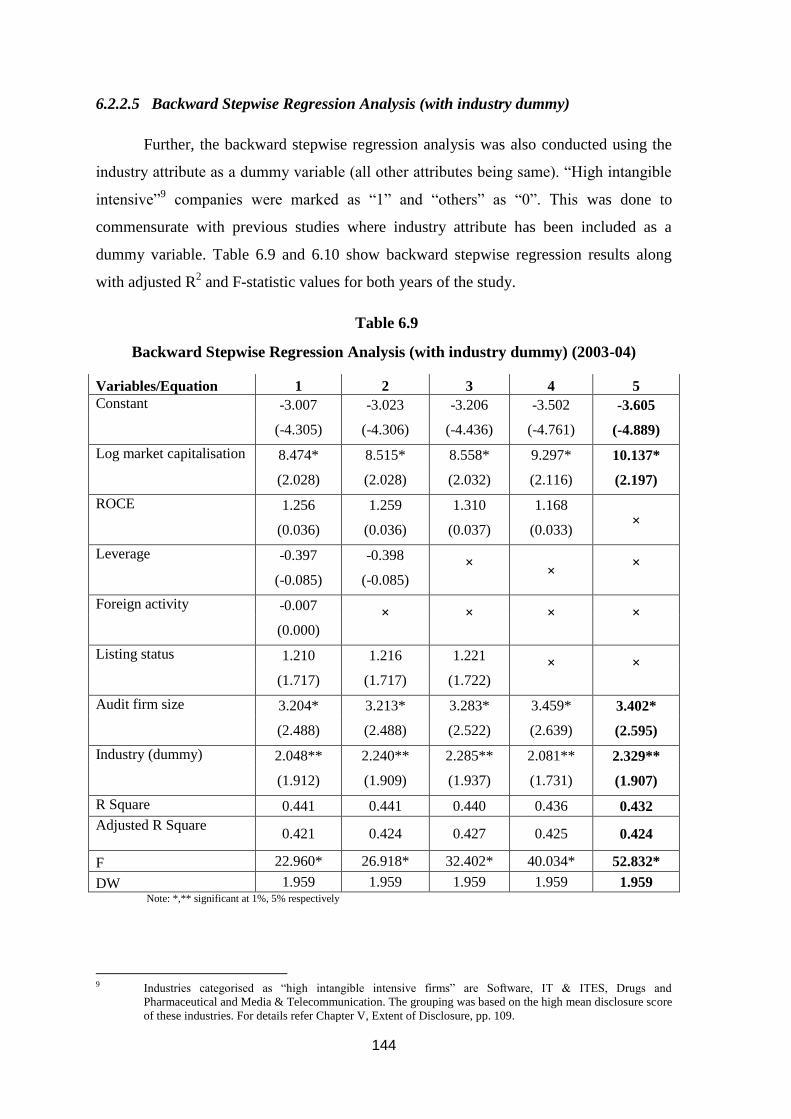
6.2.2.5 Backward Stepwise Regression Analysis (with industry dummy)
Further, the backward stepwise regression analysis was also conducted using the
industry attribute as a dummy variable (all other attributes being same). “High intangible
intensive”9 companies were marked as “1” and “others” as “0”. This was done to
commensurate with previous studies where industry attribute has been included as a
dummy variable. Table 6.9 and 6.10 show backward stepwise regression results along
with adjusted R2 and F-statistic values for both years of the study.
Table 6.9
Backward Stepwise Regression Analysis (with industry dummy) (2003-04)
Variables/Equation 1 2 3 4 5
Constant
-3.007 -3.023 -3.206 -3.502 -3.605
(-4.305) (-4.306) (-4.436) (-4.761) (-4.889)
Log market capitalisation
8.474* 8.515* 8.558* 9.297* 10.137*
(2.028) (2.028) (2.032) (2.116) (2.197)
ROCE
1.256 1.259 1.310 1.168
× (0.036) (0.036) (0.037) (0.033)
Leverage
-0.397 -0.398
× ×
×
(-0.085) (-0.085)
Foreign activity
-0.007
× × × ×
(0.000)
Listing status
1.210 1.216 1.221
× ×
(1.717) (1.717) (1.722)
Audit firm size
3.204* 3.213* 3.283* 3.459* 3.402*
(2.488) (2.488) (2.522) (2.639) (2.595)
Industry (dummy)
2.048** 2.240** 2.285** 2.081** 2.329**
(1.912) (1.909) (1.937) (1.731) (1.907)
R Square 0.441 0.441 0.440 0.436 0.432
Adjusted R Square 0.421 0.424 0.427 0.425 0.424
F 22.960* 26.918* 32.402* 40.034* 52.832*
DW 1.959 1.959 1.959 1.959 1.959 Note: *,** significant at 1%, 5% respectively
9 Industries categorised as “high intangible intensive firms” are Software, IT & ITES, Drugs and
Pharmaceutical and Media & Telecommunication. The grouping was based on the high mean disclosure score
of these industries. For details refer Chapter V, Extent of Disclosure, pp. 109.
145
Table 6.9 shows, five cross-sectional regression equations which have been framed
for the financial year 2003-04. Results of the fifth (final) regression equation show that the
regressors namely size of a firm (positive at 1% level of significance), audit firm size
(positive at 1% level of significance) and nature of industry (positive at 5% level of
significance) when regressed jointly explain 42.4% variations in the disclosure score. The
value of adjusted R2 has slightly improved as compared to the previous model (model with
13 categories of industry explained above). Thus the inclusion of industry as dummy variable
barely contributed to the explanatory power of the model.
The F value of 52.832 is significant at 1% level explains that model is best fit.
The value of Durbin-Watson statistic (1.959) is also within the acceptable limits.
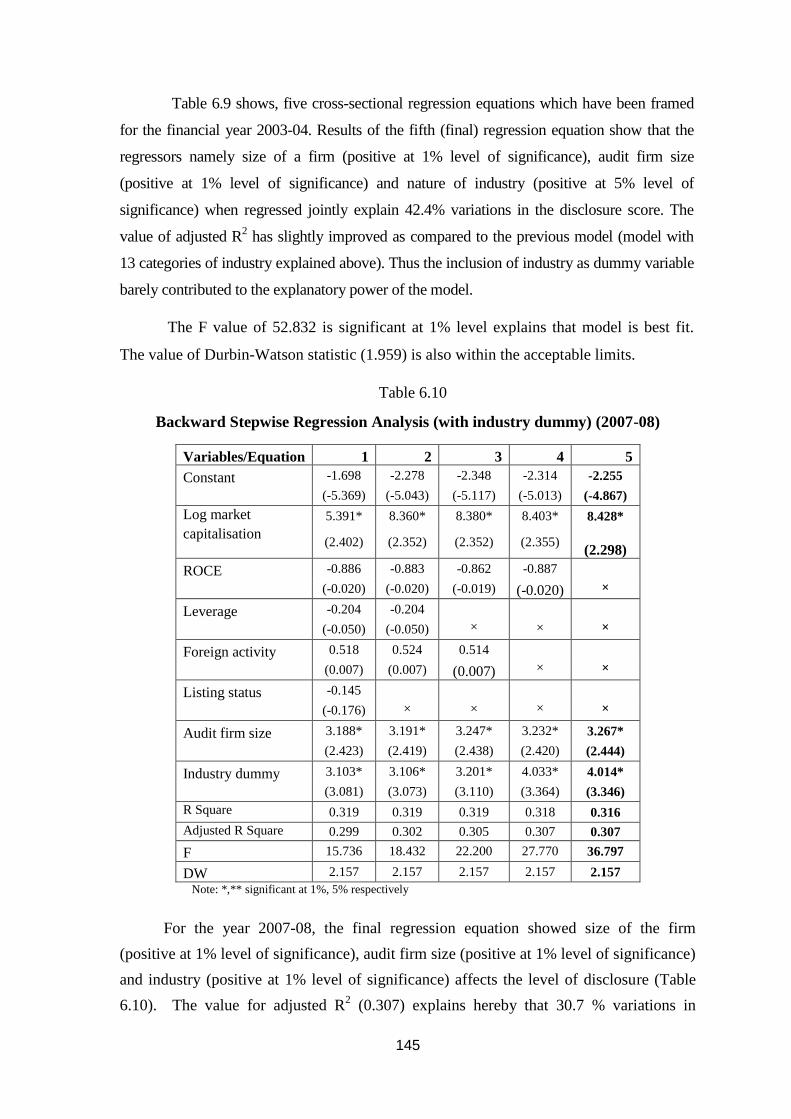
Table 6.10
Backward Stepwise Regression Analysis (with industry dummy) (2007-08)
Variables/Equation 1 2 3 4 5
Constant -1.698 -2.278 -2.348 -2.314 -2.255
(-5.369) (-5.043) (-5.117) (-5.013) (-4.867)
Log market
capitalisation
5.391* 8.360* 8.380* 8.403* 8.428*
(2.402) (2.352) (2.352) (2.355) (2.298)
ROCE -0.886 -0.883 -0.862 -0.887 × (-0.020) (-0.020) (-0.019) (-0.020)
Leverage -0.204 -0.204
×
×
× (-0.050) (-0.050)
Foreign activity 0.518 0.524 0.514
×
× (0.007) (0.007) (0.007)
Listing status -0.145 ×
×
×
× (-0.176)
Audit firm size 3.188* 3.191* 3.247* 3.232* 3.267*
(2.423) (2.419) (2.438) (2.420) (2.444)
Industry dummy 3.103* 3.106* 3.201* 4.033* 4.014*
(3.081) (3.073) (3.110) (3.364) (3.346)
R Square 0.319 0.319 0.319 0.318 0.316
Adjusted R Square 0.299 0.302 0.305 0.307 0.307
F 15.736 18.432 22.200 27.770 36.797
DW 2.157 2.157 2.157 2.157 2.157
Note: *,** significant at 1%, 5% respectively
For the year 2007-08, the final regression equation showed size of the firm
(positive at 1% level of significance), audit firm size (positive at 1% level of significance)
and industry (positive at 1% level of significance) affects the level of disclosure (Table
6.10). The value for adjusted R2 (0.307) explains hereby that 30.7 % variations in
146
disclosure score is explained by attributes namely size of a company, industry type and
audit firm size. The value of adjusted R2,
for the year 2007-08, remained same as in case
of previous model.
F-value (36.797) is also significant at 1% level of significance. The value of
Durbin-Watson statistic (2.157) is also within the acceptable limits.
6.2.6 Testing the Hypotheses
The two-factor ANOVA, Univariate and backward step-wise regression analysis
have been run to test the underlined null and alternate hypotheses.
H01: The size of a company as measured by its total assets or total sales or total
market capitalization has no significant impact on its intangible assets
disclosure score.
H1: The size of a company as measured by its total assets or total sales or total
market capitalization has a significant impact on its intangible assets
disclosure score.
The results from two-factor ANOVA, univariate and backward stepwise
regression analysis reveal that there exists positive and significant relationship between
size of a company measured in terms of market capitalisation and intangible assets
disclosure level. So, this study corroborates the past research in Italy (Bozzolan et al,
2003, 2006), Spain (Meca and Martinez, 2005), Portugal (Oliveira et al, 2006), Australia
(Guthrie et al, 2006; White et al 2007) and Hong Kong (Carlin et al, 2006) where a
positive relationship between size of a firm and extent of intangible assets disclosure was
found. The reasons might be that the large companies are more in the public and
government limelight. Companies with higher market capitalisation tend to disclose more
information to maintain their reputation in domestic as well as international markets, to
reduce agency conflicts and political costs. Also, large companies are likely to be more
progressive and innovative because they have the financial resources that enable this type
of behaviour and therefore have more intangible assets on which to report (Guthrie et al,
2006). According to Carlin et al (2006) firstly large companies are better resourced and
therefore have the financial wherewithal to support pioneering moves such as voluntary
disclosure of intangible assets deemed significant. Secondly, large companies are likely to
have more intangible assets within their structures as they will often have more staff and a
greater number of stakeholders generally. They therefore have more to report. Thus, H1
has been accepted at 1% level of significance and H01 has been rejected.
147
H02: The leverage of a company as measured by its debt-equity ratio has no
significant impact on its intangible assets disclosure score.
H2: The leverage of a company as measured by its debt-equity ratio has a
significant impact on its intangible assets disclosure score.
The Univariate regression analysis indicates negative but insignificant association
between leverage of a firm and its intangible assets disclosure level for both years of the
study. While two-factor ANOVA test revealed negative (significant at 1% level)
association between category „high‟ and category „low‟. The negative relationship of
leverage with intangible assets disclosure score reveals that the firms with high debt content
in their capital structure disclose less information about its intangible assets in comparison
to firms with low debt. This corporate specific attribute is also insignificant when combined
with other independent factors in backward stepwise regression for both years of the study.
Prior studies have shown mixed results on the relationship between leverage and intangible
assets disclosure levels. Oliveira et al (2006), Bozzolan el al (2006) and Woodrock &
Whiting‟s (2009) studies showed no association between the extent of intangible assets
disclosure and leverage, whereas Meca & Martinez (2005), Kang & Gray (2006) and White
et al. (2007) observed a significant negative relationship. Hence null hypothesis (H02) has
been accepted and alternate hypothesis (H2) is rejected for the purpose of current study.
H03: The audit firm size of a company has no significant impact on its intangible
assets disclosure score.
H3: The audit firm size of a company has a significant impact on its intangible
assets disclosure score.
The results of two-factor ANOVA, Univariate and backward step-wise regression
analysis found audit firm size to have positive and significant association with the
disclosure score at 1% level for the years 2003-04 and 2007-08. It implies that the firms
being audited by big-six audit firms disclose more information about its intangible assets in
their annual reports. This could be due to the fact that the big-six audit firms are
internationally recognised auditors who lay emphasis on comprehensive disclosures
practices to maintain their reputation. If the information disclosed in the annual report does
not fulfil the informational needs of the users, it also raises doubts on the efficiency of the
audit firms. Also, big audit firms always compel their clients to meet the investment
decision-making information criterion for the various users of the annual reports. Other
reason that supports the result is that the internationally recognised big audit firms are
meant to signal companies‟ foreign investors of their high quality financial statements
(Owusu-Ansah and Leventis, 2006, p.283). So, audit firm size has significant positive
impact on the intangible assets disclosure score of selected Indian companies (for e.g., see,
148
Oliveira et al, 2006 and Woodrock & Whiting, 2009). H3 has been accepted at 1% level of
significance and H03 has been rejected.
H04: The profitability of a company as measured by its ROA or ROS or ROCE or
RONW has no significant impact on its intangible assets disclosure score.
H4: The profitability of a company as measured by its ROA or ROS or ROCE or
RONW has a significant impact on its intangible assets disclosure score.
The Univariate regression analysis explains that the profitability measured in
terms of ROCE is directly associated with disclosure score in years 2003-04 (1% level of
significance) and 2007-08 This result is supported by studies in Spain (Meca and
Martinez, 2005) and Taiwan (Chang et al, 2008). Two-factor ANOVA test also showed
category „high‟ of ROCE to be positively (at 1% level) related to intangible assets
disclosure score as compared to category „medium‟ and „low‟. But this corporate attribute
is not included in the final regression equation for the years 2003-04 and 2007-08
respectively. Singhvi and Desai (1971) found as expected a positive relation when
profitability alone is considered. This positive influence disappears when the rate of
return is included in conjunction with other variables. Similarly, the multivariate
regression results by Oliveira et al (2006) and Bozzolan et al (2006) also concluded
profitability to be insignificant in affecting the level of intangible assets disclosure. Thus,
H4 has been accepted at 1% level of significance on the basis of two-factor ANOVA and
univariate regression analysis and H04 has been rejected.
H05: The listing category of a firm has no significant impact on its intangible assets
disclosure score.
H5: The listing category of a firm has a significant impact on its intangible assets
disclosure score.
The results of two-factor ANOVA and Univariate regression analysis reveal that the
companies listed in A category on the BSE/NSE have more extent of intangible assets
disclosure as compared to companies listed under other categories, for both years of the study
and this association is significant at 1% level. It is in line with Oliveira et al‟s (2006) study.
The reasons being that A category companies have well-renowned market base in Indian as
well as foreign stock exchanges. These companies are thought to be profitable, efficient and
actively traded by the investors (both domestic as well as foreign). Listing status does not
enter the final regression equation for both the years of the study (similar to Meca &
Martinez, 2005 and Kang & Gray, 2006). Thus, H5 has been accepted at 1% level of
149
significance on the basis of two-factor ANOVA and univariate regression analysis and H05
has been accepted on the basis of backward step-wise regression analysis.
H06: The extent of foreign activity of a company as measured by its total exports to
total sales ratio has no significant impact on its intangible assets disclosure score.
H6: The extent of foreign activity of a company as measured by its total exports to
total sales ratio has a significant impact on its intangible assets disclosure score.
The results of two-factor ANOVA and univariate regression analysis show foreign
activity to be positive and significantly associated with the level of intangible assets
disclosure score for the year 2003-04 at 1% level of significance and at 5% level of
significance for the year 2007-08. It implies that companies with higher levels of foreign
activity disclose more information about its intangible assets to satisfy the needs of
domestic and international stakeholders. But it is not the case when effect of all
independent variables has been taken together. Foreign activity attribute does not enter
the final regression equation. Thus, H6 has been accepted at 1% level of significance for
the year 2003-04 and at 5% level of significance for the year 2007-08 on the basis of
univariate regression analysis. H6 is also accepted at 1% level of significance on the basis
of two-factor ANOVA test. The null hypothesis (H06) can be accepted on the basis of
backward step-wise regression analysis
H07: The nature of industry to which a company belongs has no significant impact
on its intangible assets disclosure score.
H7: The nature of industry to which a company belongs has a significant impact
on its intangible assets disclosure score.
The results of the Univariate and backward step-wise regression analysis indicate
an association between the nature of industry and intangible assets disclosures made by
Indian corporate. Outcome of backward regression analysis for the year 2007-08 shows
the extent of intangible assets disclosure in Indian companies from banking, capital
goods, construction, steel and transport industry is significantly (at 5% level) negatively
associated with the extent of intangible assets disclosure in software and IT industry
(which was taken as a dummy while measuring the industry effect). Also the findings of
backward regression analysis based on classification into two industry groups “high
intangible intensive firms” and “other firms” showed industry attribute affecting the
extent of intangible assets disclosure positively at 5% level of significance for 2003-04
and 1% level of significance for 2007-08. Kang and Gray (2006) explained the reason
being the companies operating in industries heavily influenced by intangible resources
would naturally have more intangible assets, and hence, would disclose more information
150
on intangible assets as a result. Also high intangible intensive firms have incentive to
report and boast of their intangibles in the annual reports to signal their superiority over
competitors in possessing immutable intangibles in their industry (Sujan & Abeysekera,
2007). Further the influence of industry confirms the claims of the stakeholder and
legitimacy theories which propose that if a firm is an intangible assets intensive, it has no
option but to disclose information about its intangible assets so that its stakeholders‟ need
for information is satisfied. Moreover, intangible intensive firms could have limited
physical assets on which they could report, and therefore disclose information on
intangible assets to gain a legitimate status in their communities (Woodrock & Whiting,
2009). Hence, the nature of industry has significant positive impact on the disclosure of
intangible assets (Bozzolan et al., 2003; Meca et al, 2003; Olsson, 2004; Petty &
Cuganesan, 2005; Bozzolan et al., 2006; Oliveira et al., 2006; Sujan & Abeysekera, 2007;
Woodrock & Whiting, 2009).Thus H7 has been accepted for “high intangible intensive
industries” at 5% level of significance for the year 2003-04 and 1% level of significance
for the year 2007-08. The null hypothesis (H07) has been rejected.
6.3 CONCLUSION
The foregoing analysis shows the impact and association of various corporate
attributes on the corporate disclosure practices of selected Indian companies for the two
years of the study. The finding can be summarised as follows.
1. The two-factor ANOVA test revealed significant differences (at 1% level) in the
intangible assets disclosure score over both years of the study and over all the
categories (high, medium and low) of all corporate attributes. Fisher‟s LSD post-
hoc test shows big size firms with high profitability, low leverage and high
foreign activity disclose more about their intangible assets.
2. The Univariate regression analysis for the two years of the study revealed that the
size of a firm measured in terms of three explanatory variables namely, total
assets, total sales and total market capitalization have significant positive impact
on the intangible assets disclosure level of selected companies in India. The
profitability of a company as measured by ROCE has positive association with
disclosure score for both the years of the study. It is significant at 1% level of
significance for the year 2003-04.The audit firm size (positive at 1% level of
significance), listing category of a firm (positive at 1% level of significance) and
the level of foreign activity of a firm (positive at 1% level of significance for
2003-04 and 5% level of significance for 2007-08) have significant impact on
disclosure score. The industries namely, construction (negative at 5% level of
significance), drugs and pharmaceutical (positive at 10% level of significance)
and steel industry (negative at 10% level of significance) are significantly
151
associated with the disclosure score for the year 2003-04. For the years 2007-08
transport industry (negative at 10% level of significance) is significantly
associated with the disclosure score. The leverage of a firm has negative
(insignificant) association with disclosure score. Thus, the results move in the
predicted direction.
3. The backward stepwise regression analysis reveals that the size of a company
measured by market capitalization (positive at 1% level of significance) and audit
firm size (positive at 1% level of significance) affect the intangible assets
disclosure score of the companies in India. Together they explain 41.2%
variations in the disclosure score for the year 2003-04.
4. The backward stepwise regression analysis reveals that the size of a firm
measured by market capitalization (positive at 1% level of significance), audit
firm size (positive at 1% level of significance) and nature of industry (banking,
capital goods, construction, steel and transport industry-negative at 5% level of
significance) explain 30.7% variations in the disclosure of intangible assets of the
selected companies for the year 2007-08. Adjusted R2 has come down in the year
2007-08 as compared to the year 2003-04 may be because the variations in the
intangible assets disclosure has narrowed down in the year 2007-08.
5. The results of backward stepwise regression analysis done on the basis of industry
as a dummy variable reveals that size of a firm, audit firm size and nature of
industry as significant variables that are influencing the intangible assets
disclosure score at 1% level of significance. Together they explain 42.4%
variations in the intangible assets disclosure for the year 2003-04 and 30.7%
variations for the year 2007-08. In comparison to detailed industry classification,
by sorting companies into two broad categories (“high intangible intensive firms”
and “others”), adjusted R2 has slightly increased for the year 2003-04 and
remained same for the year 2007-08.
6. On the basis of the results of the present study, it can be concluded that the size of
a firm, its audit firm size and nature of industry have significant positive impact
on its disclosure of intangible assets and are in predicted direction. Therefore the
alternate hypotheses H1, H3 and H7 have been accepted for this study. The results
of the present study in comparison to studies on intangible assets disclosure
practices in different countries setting have been summarised and presented in
table 6.11. It may be observed from this table that the results of the present study
are consistent with the past research.
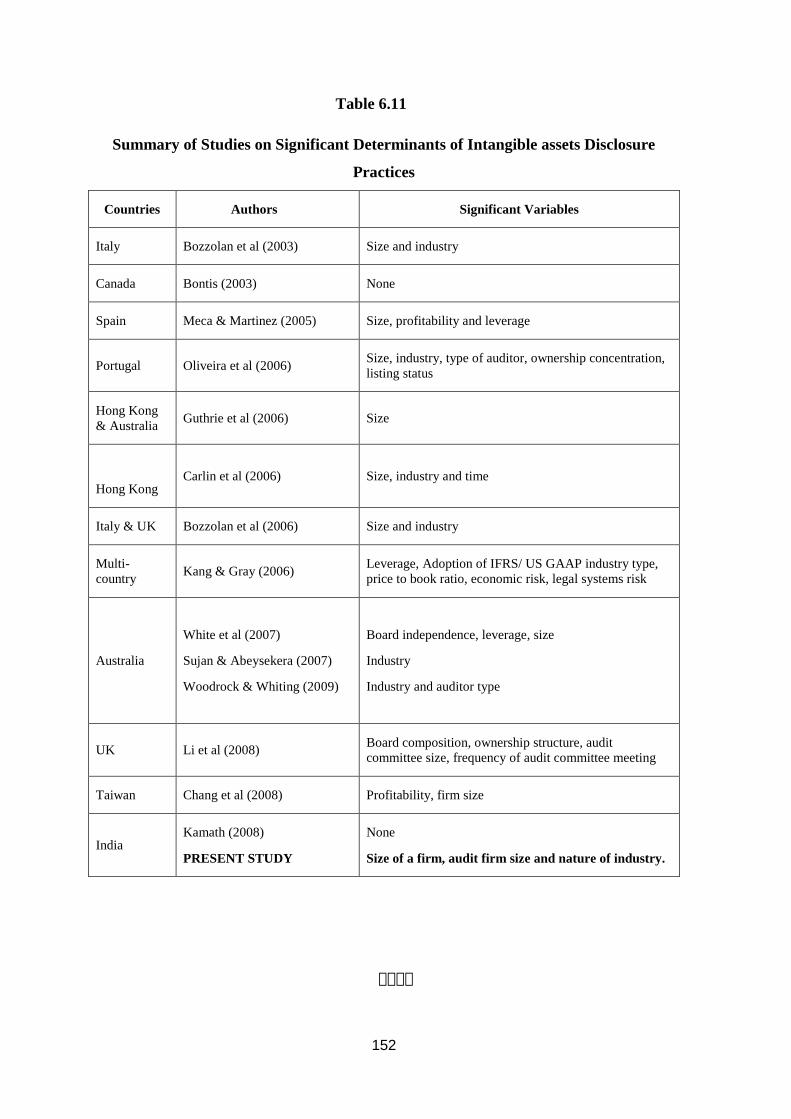
152
Table 6.11
Summary of Studies on Significant Determinants of Intangible assets Disclosure
Practices
Countries Authors Significant Variables
Italy Bozzolan et al (2003) Size and industry
Canada Bontis (2003) None
Spain Meca & Martinez (2005) Size, profitability and leverage
Portugal Oliveira et al (2006) Size, industry, type of auditor, ownership concentration,
listing status
Hong Kong
& Australia Guthrie et al (2006) Size
Hong Kong Carlin et al (2006) Size, industry and time
Italy & UK Bozzolan et al (2006) Size and industry
Multi-
country Kang & Gray (2006)
Leverage, Adoption of IFRS/ US GAAP industry type,
price to book ratio, economic risk, legal systems risk
Australia
White et al (2007)
Sujan & Abeysekera (2007)
Woodrock & Whiting (2009)
Board independence, leverage, size
Industry
Industry and auditor type
UK Li et al (2008) Board composition, ownership structure, audit
committee size, frequency of audit committee meeting
Taiwan Chang et al (2008) Profitability, firm size
India Kamath (2008)
PRESENT STUDY
None
Size of a firm, audit firm size and nature of industry.


![INTANGIBLE VALUE –FACT OR FICTION - AI Home | … · [IAS 38.8] 3. INTANGIBLE VALUE –FACT OR FICTION ... 2.36 INTANGIBLE PROPERTY (INTANGIBLE ASSETS): Non-physical assets, …](https://img.pdfslide.us/doc/110x75/5af0812f7f8b9ac2468e1bc2/intangible-value-fact-or-fiction-ai-home-ias-388-3-intangible-value.jpg)