Embed Size (px)
Citation preview
Private and Public Intangible Capital:Productivity Growth and New Policy Challenges
C. Corrado, (The Conference Board), New YorkJ. Haskel, (Imperial College, CEPR and IZA), LondonC. Jona-Lasinio, (LUISS Lab and ISTAT), Rome
ASSA -SGE3 January 2015, Boston
This project has received funding from the European Union’s Seventh Framework Programme forresearch, technological development and demonstration under grant agreement No. 612774
C. Jona-Lasinio SPINTAN 1 / 13
Aim
Complete the coverage of intangible investment by industry makingpossible analysis of productivity for the total economy based on acomplete accounting of intangible capital inputs.
• Existing measures of intangible investment, INTAN-Invest, covera subset of industries: the market sector
• SPINTAN covers the nonmarket sector
• New conceptual and measurement challenges
• Identify the asset boundary in the total economy• Impute a rate of return to public capital formation• Investigate behavioural link public to private and vice versa(e.g. role of public sector R&D on private sector)
C. Jona-Lasinio SPINTAN 2 / 13
Investment slowdown: a common trend?
0%#
2%#
4%#
6%#
8%#
1970# 1975# 1980# 1985# 1990# 1995# 2000# 2005# 2010# 2015#
United#States## Japan## EU812#
EU#Core#9# EU#Cohesion#4#
forecast#period#201482016#
10%#
15%#
20%#
25%#
30%#
35%#
1970# 1975# 1980# 1985# 1990# 1995# 2000# 2005# 2010# 2015#
United#States## Japan##EU812# EU#Core#9#EU#Cohesion#4#
forecast#period#201482016#
Note: EU Core 9 is Austria, Belgium, Denmark, Finland, France, Germany, Italy, Netherlands, and the United Kingdom. EU Cohesion 4 is Greece, Ireland, Spain and Portugal. EU-12 are the 12 member states that joined the EU between 2004 and 2007.
Data sources: AMECO, OECD.stat
GFCF % of GDP, 1970-2016 General government
Private sector (includes SOEs)
C. Jona-Lasinio SPINTAN 3 / 13
Our contribution
Some education and health is a mix of private and public, market andnon-market. So to do market sector analysis, one should really breakeducation and health into market and nonmarket.• And one should really do this for all other industries too.• What do we do?
• We focus on a number of industries that potentially havesignificant non-market involvement.
• We break those industries into market and non-market.
C. Jona-Lasinio SPINTAN 4 / 13
The scope of intangible assets used by the public sector:industries of interest
because these industries contain significant nonmarket production (e.g., federally-run research
laboratories, public parks and museums) in many countries; see table 1 below. The use of “mar-
ket” vs. “nonmarket” groupings of industries is thus not precise because an industry can reflect
activity carried out by a mix of producers, as is evident with NACE Section R and the larger
section of which NACE Section MB is a part.4
Table 1: SPINTAN Industries of Interest
nace nacesection Industry title number
MB Scientific research and development 72O Public administration and defence; compulsory social security 84P Education 85
QA Human health activities 86QB Residential care and social work activities 87-88R Creative, arts and entertainment activities;
libraries, archives, museums and other cultural activities 90-91Gambling and betting activities;
sports activities and amusement and recreation activities 92-93
Note—NACE Rev. 2.
Before we leave the subject of NACE-defined industries, it must be said that in some countries
there are industries with significant government or nonmarket production besides those listed
in table 1. These tend to be industries that engage in activities not germane to our topic areas,
e.g., transportation and homebuilding. On the other hand, there are industries of interest to our
work in SPINTAN that are not listed, e.g., those receiving government R&D subsidies, but such
industries tend to have little nonmarket production other than their own-produced intangible
assets for which we have already accounted.
Industries vs. Institutional Sector. National accountants classify economic activity according
to institutional sectors, not industries. Figure 2 illustrates the relationship between national
account sectors and the nonmarket/market conceptual distinction in a simplified way. The
national accounts nonmarket sector is found above the horizontal line in figure 2 and consists
of general government (GG) and nonprofit institutions serving households (NPISH). The public
sector is found to the left of the vertical line in figure 2 and consists of general governments and
government sponsored enterprises (GSEs).
Investment activities of the general government and nonprofit institutions (NPI) are the
focus of SPINTAN. It is important to recognize that many nonprofit institutions are considered
4Appendix table A1 (page 45) shows the full intermediate structure of NACE Rev. 2.
5
Besides Public administration and defence, other industries in thetable contain a mix of market and nonmarket producers.
C. Jona-Lasinio SPINTAN 5 / 13
Multiple measurement dimensions of Public intangibles
!CHS
!intangible!assets!
Nonmarket!sector!4!industries!
!Informa9on,!Scien9fic!and!Cultural!assets!
Societal!Competencies!
NA!intangibles!(So$ware,*R&D,*Mineral*explora4on)*
Non!NA!intangibles!(Open*data,*Cultural*and*heritage,*including*design,*Brands,*Organiza4onal*capital,*Func4onBspecific*human*
capital)*
C. Jona-Lasinio SPINTAN 6 / 13
Intangible investment in the total economy:measures developed so far
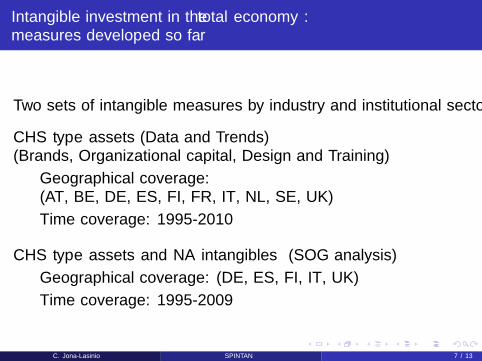
Two sets of intangible measures by industry and institutional sector:
CHS type assets (Data and Trends)(Brands, Organizational capital, Design and Training)• Geographical coverage:(AT, BE, DE, ES, FI, FR, IT, NL, SE, UK)
• Time coverage: 1995-2010
CHS type assets and NA intangibles (SOG analysis)• Geographical coverage: (DE, ES, FI, IT, UK)• Time coverage: 1995-2009
C. Jona-Lasinio SPINTAN 7 / 13
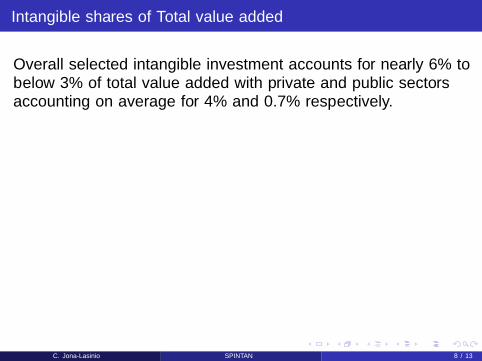
Intangible shares of Total value added
Overall selected intangible investment accounts for nearly 6% tobelow 3% of total value added with private and public sectorsaccounting on average for 4% and 0.7% respectively.
0.00#
1.00#
2.00#
3.00#
4.00#
5.00#
6.00#
uk# nl# be# se# fr# de# fi# it# at# es#Nonmarket# 0.66# 0.37# 0.20# 0.06# 0.32# 0.36# 0.46# 0.38# 0.24# 0.16#Market## 5.05# 5.20# 5.27# 5.19# 4.83# 4.37# 3.49# 3.53# 3.45# 2.65#
C. Jona-Lasinio SPINTAN 8 / 13
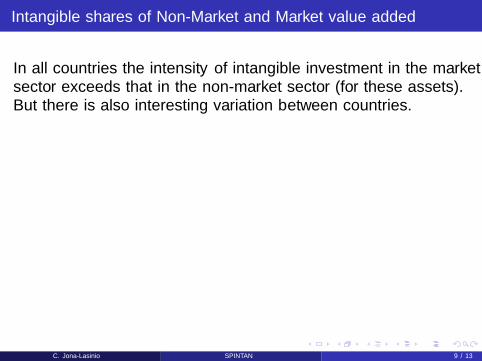
Intangible shares of Non-Market and Market value added
In all countries the “intensity” of intangible investment in the marketsector exceeds that in the non-market sector (for these assets).But there is also interesting variation between countries.
0.00#
1.00#
2.00#
3.00#
4.00#
5.00#
6.00#
7.00#
uk# de# fi# it# at# fr# nl# be# es# se#NMKT# 4.15# 2.86# 2.42# 2.21# 1.78# 1.63# 1.62# 1.33# 1.12# 0.43#MKT# 5.99# 5.00# 4.32# 4.26# 3.98# 6.00# 6.76# 6.21# 3.08# 6.05#
C. Jona-Lasinio SPINTAN 9 / 13
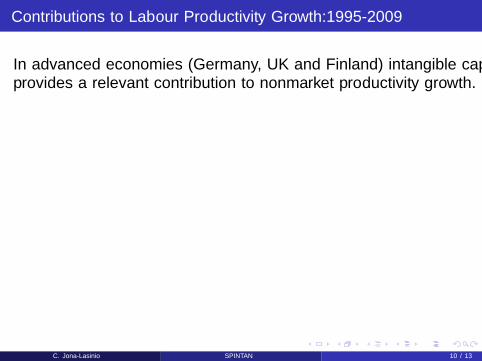
Contributions to Labour Productivity Growth:1995-2009
In advanced economies (Germany, UK and Finland) intangible capitalprovides a relevant contribution to nonmarket productivity growth.
!1.00%
!0.50%
0.00%
0.50%
1.00%
1.50%
2.00%
2.50%
3.00%
es%mkt% es%nmkt% demkt% de%nmkt% it%mkt% it%nmkt% uk%mkt% uknmkt% fi%mkt% fi%nmkt%TFP% !0.43% 0.42% 0.61% 0.53% !0.34% 0.52% 0.73% 0.02% 2.08% 0.36%ICD% 0.29% 0.18% 0.29% 0.65% 0.17% !0.02% 0.64% 0.34% 0.63% 0.25%TCD% 0.92% 0.41% 0.57% !0.02% 0.54% 0.17% 0.81% 0.66% !0.21% !0.65%
C. Jona-Lasinio SPINTAN 10 / 13
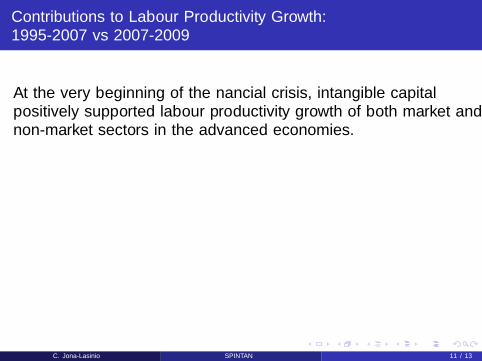
Contributions to Labour Productivity Growth:1995-2007 vs 2007-2009
At the very beginning of the financial crisis, intangible capitalpositively supported labour productivity growth of both market andnon-market sectors in the advanced economies.
!1.00%
0.00%
1.00%
2.00%
3.00%
4.00%
Contribu1ons%to%Labour%Produc1vity%Growth:%1995!2007%%
TCD$ ICD$ TFP$
!6.00%!5.00%!4.00%!3.00%!2.00%!1.00%0.00%1.00%2.00%3.00%4.00%
Contribu1ons%to%Labour%Produc1vity%Growth:%2007!2009%
TCD$ ICD$ TFP$
C. Jona-Lasinio SPINTAN 11 / 13
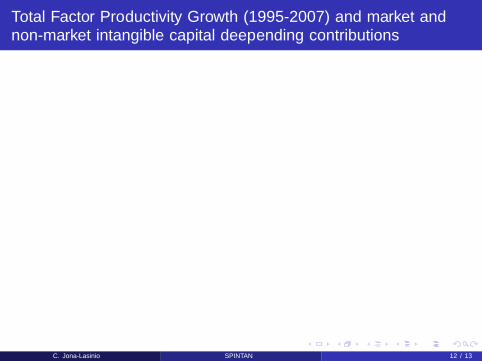
Total Factor Productivity Growth (1995-2007) and market andnon-market intangible capital deepending contributions
Fi NonM
Fi Mkt
UK NonM
UK Mkt
It NonM
It MktDe NonM
DE Mkt
Es NonM
Es Mkt
01
23
4D
lnT
FP
0 .2 .4 .6 .8Contrib DlnK(intang)/H
Market and non-market DlnTFP
De
Es
Fi
It
UK
01
23
4D
lnT
FP
.2 .3 .4 .5 .6 .7Contrib DlnK(intang)/H, Mkt
Market DlnTFP
De
Es
Fi
It
UK
01
23
4D
lnT
FP
0 .2 .4 .6Contrib DlnK(intang)/H, Non-Mkt
Market DlnTFP
C. Jona-Lasinio SPINTAN 12 / 13
Policy challenges
• A primary characteristic of intangible capital, widely supported bygrowth accounting exercises and macroeconomic studies, is to begrowth-promoting.
• This is because intangible investments likely generate spillovers tothe economic system being non-rival and possibly non-excludable.Such spillovers, if they exist, might be within the private sectorand/or between the public and private sector.
• In the light in particular of the claim and counter-claim aroundpublic sector austerity and fiscal policy in Europe, it would bevital to know which, if any, public sector intangibles had positivespillovers to the rest of the economy.
C. Jona-Lasinio SPINTAN 13 / 13