Embed Size (px)
Citation preview
CHAPTER 5
CORPORATE ATTRIBUTES AND EXTENT OF
SUSTAINABILITY REPORTING IN INDIA
The results of chapter 4 depict that the scope of sustainability reporting differs
from company to company and country to country. Different corporate attributes tend to
influence sustainability reporting practices. This chapter scrutinizes the relationship
between the sustainability reporting by companies and selected corporate specific
attributes. The corporate attributes considered include size of a company, profitability,
growth, leverage, listing category, age, nationality, board size, board independence,
advertising intensity and nature of industry.
5.1 HYPOTHESES DEVELOPMENT
Based on the theoretical and empirical considerations, numerous hypotheses have
been framed that associate company-specific characteristics with the sustainability
reporting by Indian companies. These hypotheses are stated in both null and alternative
form.
5.1.1 Size of a company
Company size is in fact the most common corporate attribute which has been
found to be related with the extent of sustainability reporting. Several studies like Meek
et al. (1995), Hossain and Reaz (2007), Jennifer and Taylor (2007), Hoorik (2009),
Lattemann et al. (2009), Reverte (2009), Xiang (2009), Artiach et al. (2010), Yu (2010),
Li et al. (2011), Michelon (2011), Bhayani (2012), Birt (2012), Al-Shubiri et al. (2012),
Ghosh (2013) and Branco et al. (2014) exhibited positive relation between size and
extent of sustainability disclosure. However, Rahman & Widyasari (2008) and Lungu et
al. (2011) observed no correlation between social reporting and size of the companies.
It has been observed that the larger companies disclose more sustainability
information as compared to smaller companies for a number of reasons. First, large
companies have greater political popularity that motivates them to gather greater
consideration from the government, common people and other stakeholders (Artiach et
al. 2010). By providing sustainability information these companies demonstrate that they
Corporate Attributes and Extent of Sustainability Reporting in India
160
carry out their business operations in a liable manner. This enhances their image in the
eyes of public and their goodwill. This improved image reduces public criticism and
minimizes threat of government intervention (Al-Shammari, 2008).
Secondly, large companies are expected to grasp greater economies of scale in
perusing corporate sustainability activities (Artiach et al. 2010). They have lower
information generation costs, and costs of competitive disadvantage connected with their
reporting practices (Meek et al. 1995).
Thirdly, large companies are more likely to encounter greater social problems and
agendas because of their large scale operations & activities and generate greater
stakeholders’ expectations. For example, emissions in the environment that causes
pollution are to some extent in proportion to the size of operations (Artiach et al. 2010),
they have to take up more sustainability efforts to cover the adverse effects of their
activities.
Fourthly, large companies are more capable of putting more resources on
sustainability and its disclosure (Shum et al. 2009; Yu, 2010), as they have more
financial resources as compared to smaller companies.
Fifthly, large companies are supposed to have a superior level of internal
reporting in order to fulfill the information needs of the top management and thus incur
low cost in providing this information to the public (Buzby,1975).
Sixthly, smaller firms are more likely to assume that if they disclose their dealings
fully then this will place them at a competitive disadvantage with larger firms in their
industry (Buzby, 1975; Al-Shammari, 2008).
The previous estimation was that bigger companies will have higher levels of
sustainability disclosure than smaller companies. There are a number of measures of size
in the literature available on this subject. The net sales, total assets and market
capitalization are used as proxies of size of a company in this study. The preceding
discussions lead to development of the following null and alternate hypotheses:
H01: The size of a company as measured by its total assets or net sales or total market
capitalization has no significant impact on its sustainability disclosure score.
H1: The size of a company as measured by its total assets or net sales or total market
capitalization has a significant impact on its sustainability disclosure score.
Corporate Attributes and Extent of Sustainability Reporting in India
161
5.1.2 Profitability of a company
Numerous studies have examined the relationship between profitability and
sustainability disclosure. Companies which experience greater profitability may more
actively disclose sustainable information in comparison to the low-profit earning
companies. This is on account of number of reasons. First, the management of the
company with higher profits may disclose more sustainable information in order to
experience the advantages of communicating it, as it is a positive news (Mahajan and
Chander, 2007) and it helps them to avoid undervaluation of their shares (Oliveira et al.,
2006). Secondly, the higher profits motivate a company to disclose more information
because higher profits raise doubts in the minds of the public and the related disclosure
clears the doubts which lessens the risk of their being negatively selected by the market
(Prencipe, 2010) and to justify the level of profits. Moreover Oliveira et al. (2006)
pointed out that managers are motivated to report information voluntarily in order to
maintain their positions and compensation arrangements because disclosure works as a
tool to monitor their performance. So, they have to disclose better to prove that they are
performing better and thus mark their presence. On the other side, if profitability of a
company is low then management may report lesser information in order to hide the
reasons for declining profits (Singhvi and Desai, 1971).
The empirical studies, have, however found mixed results. Among these
researchers, Xiang (2009), Kartadjumena et al. (2011) and Branco et al. (2014) exhibited
a positive association between profitability and the extent of sustainability disclosure;
whereas Jennifer & Taylor (2007) and Lungu et al. (2011) supported a negative
association between variables. Others as Ho and Wong (2001), Rahman and Widyasari
(2008), Yu (2010) and Li et al. (2011) found no significant relationship regarding
variables.
Prior research reveals that a number of measures have been used by researchers to
determine the association between profitability and corporate disclosure. The return on
assets, return on net worth and return on capital employed have been used as
determinants of profitability and its association with the level of sustainability disclosure
in this study.
Corporate Attributes and Extent of Sustainability Reporting in India
162
Given the mixed results from previous empirical studies, one could expect a
positive, negative, or no relationship between profitability and the level of sustainability
reporting. This discussion, therefore, has directed to the formulation and testing of the
following null and alternate hypotheses:
H02: The profitability of a company as measured by its ROA or ROCE or RONW has
no significant impact on its sustainability disclosure score.
H2: The profitability of a company as measured by its ROA or ROCE or RONW has a
significant impact on its sustainability disclosure score.
5.1.3 Growth of a company
Some studies are using growth of a company as an independent variable for
variations in sustainability disclosure. It is expected that with superior growth
opportunities, companies tend to endeavor on the upgradation of sustainability disclosure
level (Yu, 2010). Faster growth is typically associated with environmental and social
challenges (Ghosh, 2013). However, Al-Shubiri et al. (2012) noticed a positive
significant relationship, whereas, Yu (2010), Prencipe (2010) and Ghosh (2013) noticed
no significant relationship between growth and sustainability disclosure. Eng and Mak
(2003) also observed no significant relationship between disclosure and growth
opportunities. The following null and alternate hypotheses have been formulated and
tested in the study:
H03: The growth of a company as measured in terms of its growth in total assets has no
significant impact on its sustainability disclosure score.
H3: The growth of a company as measured in terms of its growth in total assets has a
significant impact on its sustainability disclosure score.
5.1.4 Leverage of a company
Leverage represents the level of debt in the capital structure of a company which
in turn depicts the relative significance of the company’s financial stakeholders (Artiach
et al. 2010). Many researchers in their studies on disclosure have used leverage as an
explanatory variable. Some have advocated for its positive relationship for a variety of
reasons. First, companies with a greater level of leverage experience high level of
financial risk (Patton and Zelenka, 1997) and hence report more sustainability
Corporate Attributes and Extent of Sustainability Reporting in India
163
information. Companies with high leverage are required to explain their leverage position
in detail in order to get extra funds, whether from banks or stock markets because these
are labeled as risky ones and these companies find it difficult to raise funds without
disclosing detailed information (Al-Shubiri et al, 2012). Secondly, some assume that
companies with high leverage disclose more information as due to higher level of
leverage these are required to furnish detailed information by regulatory authorities, for
example, Ministry of Commerce and Industry, which assesses the obligations of company
and its future cash flows (Al-Shammari, 2008). On the other hand, some studies have
shown support for negative relation because it is also observed that as the companies’
leverage increases the disclosure of their sustainability information decreases. Companies
with high leverage are more interested in making financial disclosures for the sake of
debenture holders and lenders of money. The disclosure requirements of less powerful
claimants as the community and NGOs take a back seat. This leads to the negative
relationship between leverage and sustainability reporting (Artiach et al. 2010). Further,
some advocate that companies whose capital structure has more debt have policy of
disclosing only mandatory information because the companies disclose the maximum
information when they have more share capital (Bhayani, 2012) and sustainability
disclosure is voluntary in nature.
Previous studies have given mixed results on the association between leverage
and sustainability disclosure levels. Rahman and Widyasari (2008), Hoorik (2009) and
Artiach et al. (2010) showed no significant relationship between the extent of
sustainability disclosure and leverage, whereas Yu, (2010) and Al-Shubiri et al. (2012)
supported a significant positive relationship between the two. However, Eng and Mak
(2003), Jennifer & Taylor (2007), Bhayani (2012), Birt (2012) and Branco et al. (2014)
noticed a negative relationship. The foregoing discussion leads to the development of the
following null and alternate hypotheses:
H04: The leverage of a company as measured by its debt-equity ratio has no significant
impact on its sustainability disclosure score.
H4: The leverage of a company as measured by its debt-equity ratio has a significant
impact on its sustainability disclosure score.
Corporate Attributes and Extent of Sustainability Reporting in India
164
5.1.5 Listing Category of a Company
The listing category of a company also affects the corporate sustainability
disclosure level. A company which wants to get itself listed on a stock exchange has to
abide by its listing agreement. Stock market particularly investors are interested in those
companies whose shares are actively traded and hence keep watch on them vigilantly.
“A” category companies are expected to report more information to reduce agency,
political and monitoring costs. Empirical evidence also suggests a significant association
between level of reporting and the listing status of a company. Bhayani (2012) and
Branco et al. (2014) are of the opinion that there is a significant influence of listing
category on the sustainability reporting and assurance. However, Buzby (1975) found
that the disclosure is not affected by listing status. The following are the null and
alternate hypotheses which are framed and tested in this context:
H05: The listing category of a company has no significant impact on its sustainability
disclosure score.
H5: The listing category of a company has a significant impact on its sustainability
disclosure score.
The impact of listing category of a company has been scrutinized by means of
dummy variable. The companies falling under “A” category are given a score of 1 while
companies belonging to the other categories are given 0.
5.1.6 Age of a company
This corporate variable is selected on the basis that older companies might have
enhanced their sustainability reporting practices with the passage of time. The age of a
company also influences its sustainability disclosure level for variety of reasons. First, the
professional staff of older companies is expected to be established, regular and well
controlled to deal with the scientific aspects of sustainability disclosure. Their enhanced
accounting systems are in a better position to produce more exhaustive information at
lesser cost, compared to their younger counterparts (Al-Shammari, 2008). Secondly, a
young company may face a greater competitive disadvantage if it discloses information
regarding certain items namely, research & development expenditure, capital expenditure
and new products. Some companies might use this information in a wrong manner which
will raise the competitive disadvantage for younger company (Al-Shammari, 2008).
Corporate Attributes and Extent of Sustainability Reporting in India
165
However, Hossain & Reaz (2007) and Bhayani (2012) found no association of age with
disclosure level. Therefore, the above arguments have lead to the formulation of
following hypotheses:
H06: The age of a company has no significant impact on its sustainability disclosure
score.
H6: The age of a company has a significant impact on its sustainability disclosure
score.
The age of a company is computed from the year of its incorporation till March
31, 2011.
5.1.7 Nationality
Another possible reason for increased reporting on sustainability is the level of
expansion of operations of a company. Companies extending their operations
multinationally are envisaged to report more information (Chapple and Moon, 2013) and
follow higher standards of reporting for a number of reasons.
First, companies need to increase their disclosures relating to sustainability as it
proves their transparency and competitive positioning (KPMG, 2008b) which ultimately
enhances its credit worthiness among foreign investors.
Secondly, they have to fulfill the regulations of both host country and the parent
country (Karim and Ahmed, 2005). Even, it has been mandated by Securities and
Exchange Board of India (SEBI) for the top hundred NSE/BSE listed entities to submit
Business Responsibility Reports as a part of their annual reports from the year 2012-
2013.
Thirdly, multinational companies are usually equipped with superior accounting
software tools, skilled and efficient management & staff and so have the capacity to
report more information without incurring any increased costs of processing (Mahajan &
Chander, 2007).
Fourthly, they come across new requirements of information that are ahead of
domestic demands. Their internationalized operations result in a larger percentage of
foreign stakeholders in the company (Meek et al., 1995)
Lastly, they have to face closer inspection of political and pressure groups of the
host country that are of the view that these companies are a source of economic
Corporate Attributes and Extent of Sustainability Reporting in India
166
exploitation and agents of imperialist power (Mahajan & Chander, 2007). Hence, they
have a sufficiently good reason to disclose greater information in order to avoid any
excessive pressure or exploitation.
Meek et al. (1995) used multinationality (Extent of Multinational Operations) and
Mahajan & Chander (2007) used residential status as an explanatory variable in
developing their models and both found it to be an insignificant variable in explaining
disclosure levels. Therefore, the following hypotheses have been formulated and tested in
this context:
H07: The nationality of a company has no significant impact on its sustainability
disclosure score.
H7: The nationality of a company has a significant impact on its sustainability
disclosure score.
The influence of nationality is examined by introducing dummy variable, the
score of 1 is given for companies with multinational operations and 0 for domestic
operations.
5.1.8 Board size
Board size is not a common attribute in the studies on sustainability reporting.
However, this variable has been chosen on the basis that the level of sustainability
reporting may vary among companies in response to the number of directors on the
board. The Board of Directors represents the highest committee in the company and is
expected to control the reporting decisions by openly making decisions within the board
(Kent and Monem, 2008). Good corporate governance is anticipated to strengthen the
corporate responsibility attitude within companies (Wise and Ali, 2009). But researchers
came across only one study i.e. by Uyar et al. (2013), which found no significant
relationship between board size and reporting score. So, the following hypotheses have
been formulated and tested:
H08: The board size of a company has no significant impact on its sustainability
disclosure score.
H8: The board size of a company has a significant impact on its sustainability
disclosure score.
Corporate Attributes and Extent of Sustainability Reporting in India
167
5.1.9 Board independence
Board independence is defined as “the proportion of independent directors to the
total number of directors”. The independence of the board depends on the number of
independent, non-executive directors on the board. Their inclusion reduces the chances of
fraud, perhaps for the reason that outside directors are more inclined towards encouraging
companies to disclose better information to outside investors (Eng and Mak, 2003).
Hence it seems that the greater proportion of independent directors’ representation results
in more effective and efficient control on the activities of the board, and in more
voluntary reporting of corporate information. This stimulates more transparency resulting
in more disclosure (Kent and Monem, 2008). Further, Chau and Gray (2010) found that
the level to which independent directors are selected on the board is positively related
with the extent of voluntary disclosure. On the other hand, Xiang (2009) noticed that the
number of independent directors has no remarkable effect on information disclosure
level. Faisal et al. (2012) reported that board independence is not a significant predictor
for sustainability communication. While Eng and Mak (2003) conclude that increase in
number of directors reduces corporate disclosure. The following null and alternate
hypotheses are formulated and tested in the study:
H09: The board independence of a company has no significant impact on its
sustainability disclosure score.
H9: The board independence of a company has a significant impact on its
sustainability disclosure score.
5.1.10 Advertising intensity
Advertising provides companies a means of differentiation and a way of giving
information about sustainability, and hence amplifies the effects of corporate
sustainability performance (Fisman et al., 2008; Wagner 2010). The intensity of
advertisement expenses often influences the sustainability disclosure of a company. Very
few studies have considered this attribute. For example, Ghosh (2013) revealed that the
companies having higher advertisement expenses are likely to be superior in
sustainability. However one study by Gelb (2002) that studied advertising expenditures
indicated that companies with significant levels of this expenditure are expected to give
more importance to “voluntary and more flexible disclosures over traditional mandated
Corporate Attributes and Extent of Sustainability Reporting in India
168
accounting reports”. Therefore, the following null and alternate hypotheses have been
framed and are tested in this study:
H010: The advertising intensity of a company has no significant impact on its
sustainability disclosure score.
H10: The advertising intensity of a company has a significant impact on its
sustainability disclosure score.
5.1.11 Nature of Industry
Nature of industry influences the extent of corporate disclosure because
companies carry out different activities that require different recording and disclosure
(Naser and Hassan, 2013). Sustainability Disclosure tends to be industry specific
(Jennifer and Taylor, 2007; Yu, 2010; Elijido-Ten, 2011; Michelon, 2011; Birt, 2012).
Even Yu (2010) stated that the extent of disclosure varies as per types of industries.
Divergent industries have dissimilar characteristics relative to regulatory requirements,
stakeholder demands, market competition, type of private information, and the threat of
entry of new companies into the market. These characteristics offer incentives for
companies belonging to a particular industry to disclose more information than
companies falling under other industry. For example, the nature of product and research
& development activities of Chemical companies motivates them to be more responsive
about disclosure of information to competitors and the public than companies belonging
to certain other industries (Meek et al., 1995). Also, Consumer Good industry and
Information Technology industry have a low coverage of environmental and social
aspects (Yu, 2010). Proprietary costs also fluctuate according to the nature of industry.
Moreover, companies falling under the same industry have common interest in producing
the similar level of disclosure as this in turn helps them in avoiding negative appreciation
by the market competitive pressures (Lopes and Rodrigues, 2007). It seems that nature of
industry is expected to relate to the quality of sustainability disclosures (Hoorik, 2009). It
is obvious that some industries are comparatively more sensitive to sustainability issues
because they have more legitimate stakeholders to deal with. The urgency of responding
to these stakeholders through disclosure rises when these stakeholders take action against
the companies. Some studies like Newson and Deegan (2002) classified these industries
as high profile and low profile industries. Birt (2012) showed that nature of industry is
Corporate Attributes and Extent of Sustainability Reporting in India
169
positively and significantly related with sustainability disclosures. Moreover, Jennifer
and Taylor (2007), Hoorik (2009), Dilling (2010), Elijido-Ten (2011), Michelon (2011)
and Ghosh (2013) found industry to be a significant variable in sustainability disclosure.
The preceding discussions lead to development of the following null and alternate
hypotheses:
H011: The nature of industry to which a company belongs has no significant impact on
its sustainability disclosure score.
H11: The nature of industry to which a company belongs has a significant impact on its
sustainability disclosure score.
5.2 RESULTS AND DISCUSSIONS
The effect of various corporate attributes on the extent of sustainability reporting
has been investigated with the help of multiple regression analysis. The outcomes of
these have been conferred in the following sub-parts:
5.2.1 Regression Analysis
Since wide differences have been viewed in the sustainability disclosure score of
the selected Indian companies, it becomes crucial to know the reasons of such
differences. The reasons seem company specific. So here an attempt has been made to
find the effect of corporate specific attributes like size of a company, profitability,
growth, leverage, listing category, age of a company, nationality, board size, board
independence, advertising intensity and nature of industry on the sustainability disclosure
score of sample Indian non financial companies for the financial year 2010-11. For this
purpose, it is essential to assess the validity of the Model (regression equation).
5.2.1.1 Checking the Multicollinearity of Data
Before going to the regression analysis, it was informative to verify the presence
of multicollinearity among the independent variables. Sometimes there is destructive
effect on the regression results because two or more of the independent variables are
highly correlated and this refers to the state of multicollinearity. The correlation matrix is
a prevailing measure for obtaining a rough view about the relationship between variables.
Multicollinearity is a serious problem when the pair-wise or zero-order correlation
Corporate Attributes and Extent of Sustainability Reporting in India
170
coefficient between two independent variables is high, that is it exceeds the
recommended rule of thumb, 0.8 (Gujarati, 2012, p. 356). This problem of very high
intercorrelations among independent variables can be solved by dropping that variable
and then running regression analysis with rest of the independent variables. An alternate
way to check this multicollinearity is to calculate the average VIF (Variance inflation
factor) and TOL (Tolerance Limit). As a suggested rule of thumb, the VIF of a variable
should not exceed 10 and the TOL should not exceed 0.10, this prescribed limit is crossed
when R2 go beyond 0.80, and this results in high colliniarity (Gujarati, 2012, p. 359).
5.2.1.2 Checking the Homoscedasticity of Data
Homoscedasticity means that all the disturbances i.e. ui appearing in the
regression function have the same variance (Gujarati, 2012, p. 386). This assumption
when violated is known by the name, heteroscedasticity and is generally expected in a
cross-sectional analysis, when small, medium and large size companies are taken together
in the sample (Gujarati, 2012, p. 397). However, in our sample we have resorted to only
large companies. But for the purpose of confirmation, White’s general hetroscedasticity
test through EViews has been used to check this assumption.
5.2.1.3 Checking the Normality of Data
Normality assumption means that the error term or the random variable of the
regression equation is assumed to follow normal distribution (Koutsoyiannis, 1977).
Skewness and kurtosis are computed to test the normality of data. As a rule of thumb, the
value of skewness for a distributed data is zero and the value of kurtosis can range from -
3 to +3. The skewness and kurtosis in our database is within the standard limit. However,
the size of a company taken in terms of different surrogates in different regression
equations is found to be not normal. If the rough values of these variables are considered
then this could give vast influence to the very large companies. This problem can be
solved by taking their logarithmic transformations as it will lessen the effect on the
regression results (Lungu et al., 2011). Thus, natural log transformation has been done to
make it normal (see Hoorik, 2009; Jennifer and Taylor, 2007; Ghosh, 2013; Lungu et al.,
2011).
Corporate Attributes and Extent of Sustainability Reporting in India
171
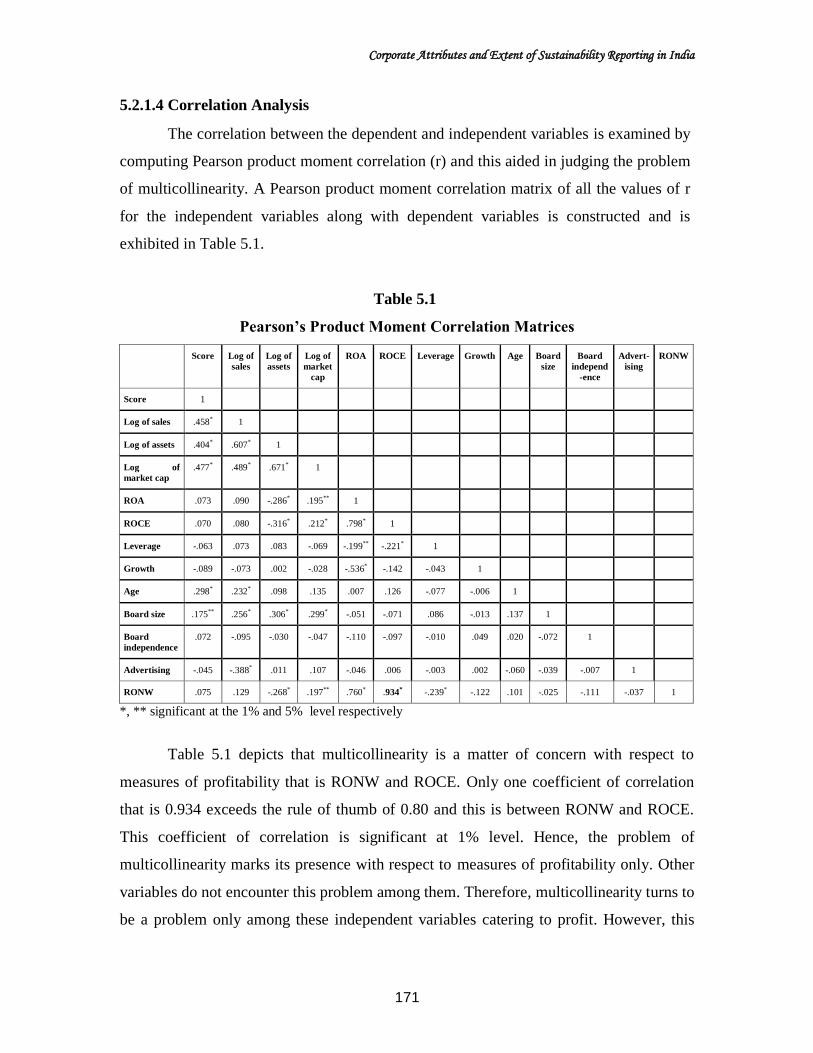
5.2.1.4 Correlation Analysis
The correlation between the dependent and independent variables is examined by
computing Pearson product moment correlation (r) and this aided in judging the problem
of multicollinearity. A Pearson product moment correlation matrix of all the values of r
for the independent variables along with dependent variables is constructed and is
exhibited in Table 5.1.
Table 5.1
Pearson’s Product Moment Correlation Matrices
Score Log of
sales
Log of
assets
Log of
market
cap
ROA ROCE Leverage Growth Age Board
size
Board
independ
-ence
Advert-
ising
RONW
Score 1
Log of sales .458* 1
Log of assets .404* .607* 1
Log of
market cap
.477* .489* .671* 1
ROA .073 .090 -.286* .195** 1
ROCE .070 .080 -.316* .212* .798* 1
Leverage -.063 .073 .083 -.069 -.199** -.221* 1
Growth -.089 -.073 .002 -.028 -.536* -.142 -.043 1
Age .298* .232* .098 .135 .007 .126 -.077 -.006 1
Board size .175** .256* .306* .299* -.051 -.071 .086 -.013 .137 1
Board
independence
.072 -.095 -.030 -.047 -.110 -.097 -.010 .049 .020 -.072 1
Advertising -.045 -.388* .011 .107 -.046 .006 -.003 .002 -.060 -.039 -.007 1
RONW .075 .129 -.268* .197** .760* .934* -.239* -.122 .101 -.025 -.111 -.037 1
*, ** significant at the 1% and 5% level respectively
Table 5.1 depicts that multicollinearity is a matter of concern with respect to
measures of profitability that is RONW and ROCE. Only one coefficient of correlation
that is 0.934 exceeds the rule of thumb of 0.80 and this is between RONW and ROCE.
This coefficient of correlation is significant at 1% level. Hence, the problem of
multicollinearity marks its presence with respect to measures of profitability only. Other
variables do not encounter this problem among them. Therefore, multicollinearity turns to
be a problem only among these independent variables catering to profit. However, this
Corporate Attributes and Extent of Sustainability Reporting in India
172
problem was monitored by considering only one measure of profitability in a regression
equation at one time.
Afterwards, Multiple Regression analysis is applied.
Multiple Regression Analysis
The regression equation analyzing the impact of various corporate specific
attributes on the sustainability disclosure score for 2010-2011 is framed as below:
Y = β0 +β1X1 +β2 X2 +β3 X3 +β4 X4 +β5 X5 +β6 X6 + β7 X7 +β8 X8 +β9 X9 +β10 X10+ β11-23
X11-23+ ε
Where:
Y = Sustainability disclosure score
X1 = Size of a company (log of market capitalization)
X2 = Profitability of a company (ROA)
X3 = Growth of a company
X4 = Leverage of a company
X5 = Listing category of a company
X6= Age of a company
X7= Nationality
X8 = Board size
X9= Board independence
X10= Advertising intensity
X11-23 = Industry type
β = Slopes of the independent variables while β0 is a constant or the value of Y
when all values of X are zero
ε = εi ~ (0, N)
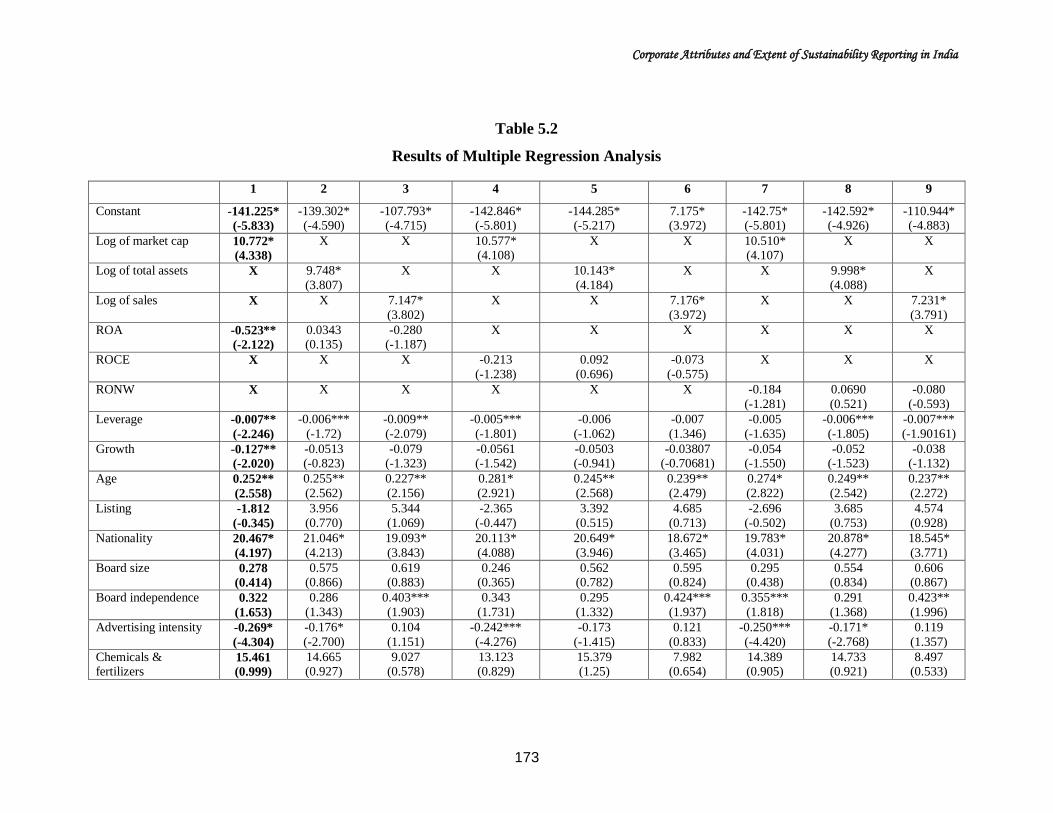
The results from the multiple regression analysis have been presented in Table
5.2. Three separate determinants of company size (sales, assets, and market
capitalization) as well as three different measures of profitability (ROA, ROCE, and
RONW) are used. Each substitute to represent size and profitability is used only once in a
model. This has led to the creation of nine regression equations, the results of which have
been presented in Table 5.2
Corporate Attributes and Extent of Sustainability Reporting in India
173
Table 5.2
Results of Multiple Regression Analysis
1 2 3 4 5 6 7 8 9
Constant -141.225*
(-5.833)
-139.302* (-4.590)
-107.793* (-4.715)
-142.846* (-5.801)
-144.285* (-5.217)
7.175* (3.972)
-142.75* (-5.801)
-142.592* (-4.926)
-110.944* (-4.883)
Log of market cap 10.772*
(4.338)
X X 10.577* (4.108)
X X 10.510* (4.107)
X X
Log of total assets X 9.748*
(3.807)
X X 10.143*
(4.184)
X X 9.998*
(4.088)
X
Log of sales X X 7.147*
(3.802)
X X 7.176*
(3.972)
X X 7.231*
(3.791)
ROA -0.523**
(-2.122)
0.0343 (0.135)
-0.280 (-1.187)
X X X X X X
ROCE X X X -0.213
(-1.238)
0.092
(0.696)
-0.073
(-0.575)
X X X
RONW X X X X X X -0.184
(-1.281)
0.0690
(0.521)
-0.080
(-0.593)
Leverage -0.007**
(-2.246)
-0.006***
(-1.72)
-0.009**
(-2.079)
-0.005***
(-1.801)
-0.006
(-1.062)
-0.007
(1.346)
-0.005
(-1.635)
-0.006***
(-1.805)
-0.007***
(-1.90161)
Growth -0.127**
(-2.020)
-0.0513 (-0.823)
-0.079 (-1.323)
-0.0561 (-1.542)
-0.0503 (-0.941)
-0.03807 (-0.70681)
-0.054 (-1.550)
-0.052 (-1.523)
-0.038 (-1.132)
Age 0.252**
(2.558)
0.255**
(2.562)
0.227**
(2.156)
0.281*
(2.921)
0.245**
(2.568)
0.239**
(2.479)
0.274*
(2.822)
0.249**
(2.542)
0.237**
(2.272)
Listing -1.812
(-0.345)
3.956
(0.770)
5.344
(1.069)
-2.365
(-0.447)
3.392
(0.515)
4.685
(0.713)
-2.696
(-0.502)
3.685
(0.753)
4.574
(0.928)
Nationality 20.467*
(4.197)
21.046*
(4.213)
19.093*
(3.843)
20.113*
(4.088)
20.649*
(3.946)
18.672*
(3.465)
19.783*
(4.031)
20.878*
(4.277)
18.545*
(3.771)
Board size 0.278
(0.414)
0.575 (0.866)
0.619 (0.883)
0.246 (0.365)
0.562 (0.782)
0.595 (0.824)
0.295 (0.438)
0.554 (0.834)
0.606 (0.867)
Board independence 0.322
(1.653)
0.286
(1.343)
0.403***
(1.903)
0.343
(1.731)
0.295
(1.332)
0.424***
(1.937)
0.355***
(1.818)
0.291
(1.368)
0.423**
(1.996)
Advertising intensity -0.269*
(-4.304)
-0.176*
(-2.700)
0.104
(1.151)
-0.242***
(-4.276)
-0.173
(-1.415)
0.121
(0.833)
-0.250***
(-4.420)
-0.171*
(-2.768)
0.119
(1.357)
Chemicals & fertilizers
15.461
(0.999)
14.665 (0.927)
9.027 (0.578)
13.123 (0.829)
15.379 (1.25)
7.982 (0.654)
14.389 (0.905)
14.733 (0.921)
8.497 (0.533)
Corporate Attributes and Extent of Sustainability Reporting in India
174
1 2 3 4 5 6 7 8 9
Consumer Goods
durables & FMCG 7.14
(0.758)
6.631
(0.63)
-0.619
(-0.061)
5.164
(0.554)
5.681
(0.564)
-2.421
(-0.241)
5.306
(0.559)
5.707
(0.543)
-1.994
(-0.196)
Cement and construction
21.621***
(1.799)
16.389 (1.261)
16.751 (1.419)
19.126 (1.587)
16.879 (1.509)
15.656 (1.388)
19.721 (1.638)
16.639 (1.262)
15.758 (1.317)
Diversified and others 3.087
(0.252)
4.182
(0.345)
3.472
(0.29)
0.736
(0.058)
5.217
(0.488)
2.647
(0.247)
1.483
(0.117)
4.778
(0.384)
2.786
(0.225)
Entertainment and
media 6.565
(0.615)
9.646
(0.913)
6.563
(0.582)
-0.499
(-0.05)
10.215
(0.588)
2.615
(0.151)
-4.379
(-0.377)
11.579
(0.994)
0.999
(0.086)
Metal, metal products
& mining 21.100
(1.600)
18.648
(1.435)
23.028***
(1.79)
17.667
(1.313)
18.838***
(1.809)
21.232**
(2.042)
18.842
(1.413)
18.493
(1.410)
21.609***
(1.673)
Oil & Gas 26.666**
(2.581)
19.415*** (1.704)
19.785*** (1.708)
24.336** (2.262)
19.13*** (1.695)
18.449 (1.611)
25.344** (2.361)
18.958 (1.645)
18.726 (1.585)
Drugs &
pharmaceuticals -7.439
(-0.780)
-4.930
(-0.469)
-6.352
(-0.636)
-9.303
(-0.954)
-4.231
(-0.406)
-7.131
(-0.687)
-8.581
(-0.877)
-4.648
(-0.436)
-6.866
(-0.674)
Power 4.813
(0.448)
1.111
(0.097)
10.405
(0.938)
3.623
(0.330)
1.407
(0.134)
10.033
(0.970)
4.101
(0.374)
1.292
(0.111)
10.070
(0.889)
Software, IT & ITES 32.243**
(2.607)
33.402** (2.509)
36.848* (2.882)
28.422** (2.271)
33.152* (2.803)
34.476* (2.901)
28.555** (2.267)
33.213** (2.464)
34.618* (2.679)
Textile -7.424
(-0.647)
-10.344 (-0.934)
-7.346 (-0.697)
-10.973 (-0.933)
-9.64 (-0.575)
-8.985 (-0.532)
-10.056 (-0.849)
-10.057 (-0.895)
-8.693 (-0.806)
Telecommunications -17.410
(-1.339)
-22.612***
(-1.673)
-18.641
(-1.529)
-16.078
(-1.225)
-22.383
(-1.458)
-17.520
(-1.149)
-15.691
(-1.199)
-22.422
(-1.641)
-17.691
(-1.426)
Automotives &
transport 5.799
(0.555)
2.43
(0.216)
1.607
(0.147)
3.741
(0.353)
2.526
(0.259)
0.502
(0.0509)
4.291
(0.403)
2.344
(0.206)
0.699
(0.063)
R-square 0.472 0.451 0.452 0.463 0.453 0.447 0.462 0.453 0.448
Adjusted R-square 0.382 0.357 0.358 0.371 0.359 0.352 0.37 0.359 0.353
F 5.216* 4.795* 4.802* 5.026* 4.832* 4.710* 5.003* 4.820* 4.722*
F (sig) 0.000 0.000 0.000 0.000 0.000 0.000 0.000 0.000 0.000
DW 1.73 1.721 1.664 1.681 1.688 1.618 1.665 1.7 1.624
Note: * significant at 1% level
** significant at 5% level
*** significant at 10% level
Corporate Attributes and Extent of Sustainability Reporting in India
175
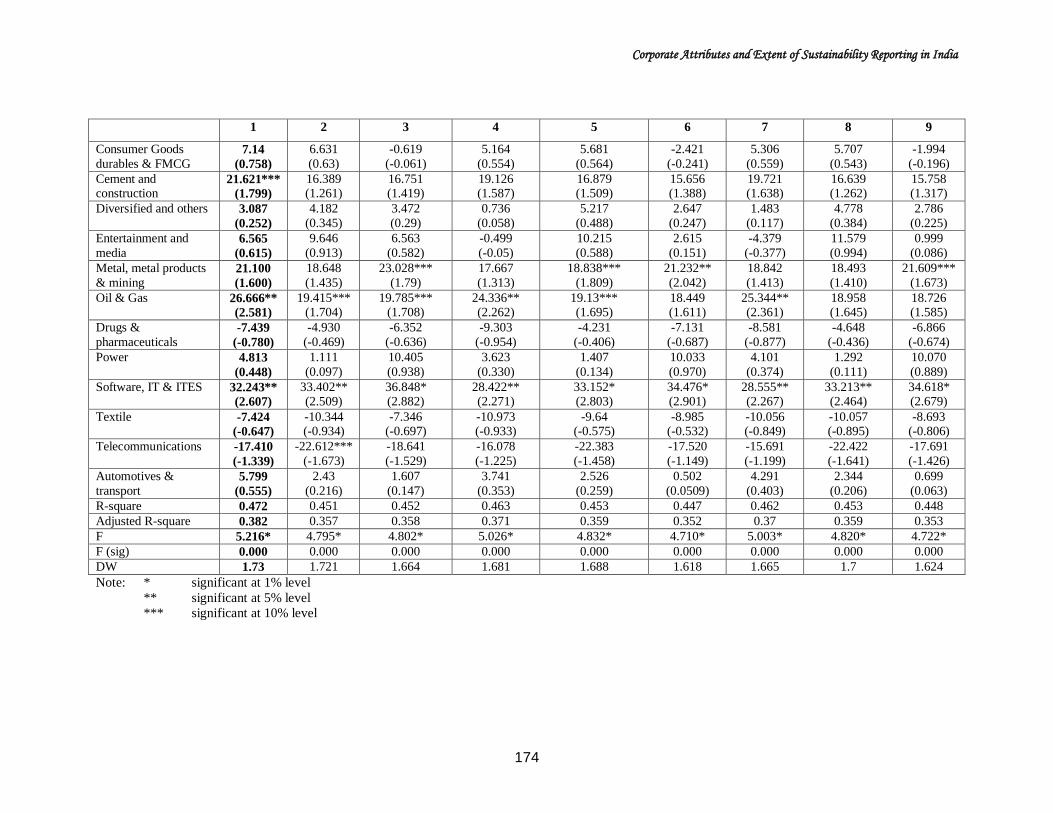
Table 5.2 reveals that for all models, different measures of size, age, nationality
and Software, IT & ITES industry are found to be significant. ROA and growth are
significant at 5% level when applied in combination with log of market capitalization.
Other profitability surrogates could not significantly explain variations in the disclosure
level. The board independence is found to be significant at 10% level in explaining
variations in sustainability disclosure, when applied in combination of log of sales with
ROA, ROCE and RONW, and log of market capitalization with RONW, the surrogate of
size and profitability. Leverage and advertising intensity are also found to be significant,
but only in certain surrogates of size and profitability. Other variables could not find any
place in explaining significant variations in the disclosure level. So, out of 9 models, the
model, which is satisfying validity requirements and having improved adjusted R2 has
been chosen and selected as a valid model. Hence, the model 1 i.e. with combination of
log of market capitalization, ROA, growth, leverage, listing category, age of a company,
nationality, board size, board independence, advertising intensity and nature of industry is
selected. It has an adjusted R
2 of 0.382, F value of 5.216. This is significant at 1% level of
significance. DW comes out to be 1.73 which is within the acceptable limits. In this
model, log of market capitalization ROA, growth, leverage, age of a company,
nationality, Oil & Gas, Cement & Construction and Software, IT & ITES industry are
found to be significant. Log of market capitalization and nationality are positively
significant at 1% level, while age and nature of industry (Software, IT & ITES and Oil &
Gas) are significant at 5% level. It shows that companies with large size, older,
multinational operations and belonging to Software, IT & ITES, Cement & construction
and Oil & Gas industry have significant sustainability disclosure. Since Capital &
Engineering goods industry has been taken as a dummy. The positive values of Oil &
Gas, Cement & Construction and Software, IT & ITES depicts that these industries are
reporting more information as compared to Capital & Engineering goods industry.
However, advertising intensity is negatively significant at 1% level and ROA, leverage,
growth at 5% level. This shows that the company’s profits, leverage, growth and
advertising intensity are negatively related with the extent of sustainability disclosure.
Other variables were found to be insignificant.
Corporate Attributes and Extent of Sustainability Reporting in India
176
5.2.2 Testing The Hypotheses
Multiple regression analysis has been performed in order to check the following
null and alternate hypotheses. These are discussed as below:
H01: The size of a company as measured by its total assets or net sales or total
market capitalization has no significant impact on its sustainability
disclosure score.
H1: The size of a company as measured by its total assets or net sales or total
market capitalization has a significant impact on its sustainability disclosure
score.
The results from multiple regression analysis support for the positive and
significant relationship between size of a company considered in terms of market
capitalization and sustainability reporting. So, the results of this study are in line with the
past research in India (Hossain and Reaz, 2007; Bhayani, 2012; Ghosh, 2103), India and
China (Lattemann et al., 2009), Netherlands (Hoorik, 2009), China (Xiang, 2009), US
and Japan (Jennifer and Taylor, 2007), US (Artiach et al., 2010), Continental Europe, UK
and USA (Meek et al. 1995; Michelon,2011), Jordan (Al-Shubiri et al., 2012), Hong
Kong (Yu, 2010), Spain (Reverte, 2009) and Portugal (Branco et al., 2014). These studies
support the positive relationship between size of a company and extent of sustainability
reporting. Perhaps it is because large corporations are more in limelight among general
public and government. These companies place greater weight on building their corporate
image and sustainability reporting is being used them as renowned measure to maintain
their public image and goodwill (Yu, 2010). Moreover, they have more financial
resources to implement the sustainability reporting framework. Also, Companies with
higher market capitalization can maintain their reputation in domestic as well as
international markets by disclosing more information. Thus, the null hypothesis H01 has
been rejected at 1% level of significance and the alternate hypothesis H1 has been
accepted.
H02: The profitability of a company as measured by its ROA or ROCE or RONW
has no significant impact on its sustainability disclosure score.
Corporate Attributes and Extent of Sustainability Reporting in India
177
H2: The profitability of a company as measured by its ROA or ROCE or RONW
has a significant impact on its sustainability disclosure score.
The multiple regression analysis depicts that the profitability of a company
measured in terms of ROA has significant negative relationship with sustainability
disclosure score. This result is in accordance with studies namely Jennifer and Taylor
(2007) and Lungu et al. (2011). The negative relationship of profitability with
sustainability disclosure score shows that the companies with high profits disclose less
sustainability information. This might be because companies have low disclosure because
they make profit at the cost of sustainability (Yu, 2010). Further, highly profitable
companies are able to build up internal resources for financing their future activities and
do not need to depend upon external resources for raising additional capital. Hence,
profitable companies develop a tendency of making less voluntary disclosures as
Sustainability (Chander, 1992). It also seems that the companies with higher profits are
focusing on their economic aspects and focus less on the betterment of society and
environment. Thus, the null hypothesis, H02 has been rejected at 5% level of significance
and the alternate hypothesis, H2 has been accepted.
H03: The growth of a company as measured in terms of its growth in total assets
has no significant impact on its sustainability disclosure score.
H3: The growth of a company as measured in terms of its growth in total assets
has a significant impact on its sustainability disclosure score.
The multiple regression analysis reveals that the growth measured in terms of
total assets has significant negative relationship with sustainability disclosure score.
Company’s growth depend upon the subsistence of rising markets and entry into fresh but
profitable markets. In both these circumstances higher level of information disclosure
may expose the reality of business opportunities to their counterparts and this will result
in potential disadvantage in terms of proprietary cost. Perhaps for this reason the extent
of voluntary disclosure is estimated to be negatively related to the growth rate of
company (Prencipe, 2010). Moreover, it might be because of the economic growth as the
priority of these companies that they put their financial resources in building up their
assets like a pure economic organization. Hence, these companies initiate less to promote
Corporate Attributes and Extent of Sustainability Reporting in India
178
sustainability. Thus, the null hypothesis H03 has been rejected at 5% level of significance
and the alternate hypothesis H3 has been accepted.
H04: The leverage of a company as measured by its debt-equity ratio has no
significant impact on its sustainability disclosure score.
H4: The leverage of a company as measured by its debt-equity ratio has a
significant impact on its sustainability disclosure score.
The multiple regression analysis specifies negative and significant association
between leverage of a company and sustainability disclosure score. This negative
relationship of leverage with sustainability disclosure score shows that the corporations
whose capital structure includes high debt content report comparatively lesser
information about its social and environmental efforts than companies with low debt. The
disclosure is expected to reduce with the increase of leverage because leverage helps to
control the free cash flow problem. Also, the agency costs of debt are monitored through
restrictive debt covenants in debt agreements rather greater reporting of information in
the annual reports (Jensen, 1986). Previous empirical studies have also shown mixed
results on the relationship between leverage and sustainability disclosure. Our results are
similar to Bhayani (2012), Birt (2012), Ghosh (2013) and Branco et al. (2014), who
observed a significant negative relationship between the extent of sustainability reporting
and leverage, whereas Ho and Wong (2001), Rahman and Widyasari (2008), Hoorik
(2009), Jennifer and Taylor (2007) observed an insignificant relationship between these
variables. Hence the null hypothesis H04 has been rejected at 5% level of significance and
the alternate hypothesis H4 has been accepted for the purpose of current study.
H05: The listing category of a company has no significant impact on its
sustainability disclosure score.
H5: The listing category of a company has a significant impact on its
sustainability disclosure score.
The results of multiple regression analysis exhibits that the corporations listed as
A category on the BSE do not have significant impact on the extent of sustainability
disclosure in comparison to companies listed under other categories namely B, S, T, TS
and Z. It is in line with evidence advanced by literature as suggested by Buzby (1975)
Corporate Attributes and Extent of Sustainability Reporting in India
179
and Mahajan and Chander (2007). The reason being that all sample companies are
renowned and have strong market base both in Indian and foreign stock exchanges. Thus,
H05 has been accepted and alternatively H5 has been rejected.
H06: The age of a company has no significant impact on its sustainability
disclosure score.
H6: The age of a company has a significant impact on its sustainability disclosure
score.
The multiple regression analysis explains that the age of a company has positive
association with sustainability disclosure score and is significant at 5 percent level. It
seems that old firms might have improved their financial reporting practices over time
(Alsaeed, 2006). Further, Ghosh (2013) observed that older companies report more about
their sustainability performance. It seems they might have fulfilled their economic goals
and built sufficient resources and surpluses to report on sustainability. It also offers them
a competitive edge for their sustenance amongst their younger counterparts. The results
of this study are in consonance with those of the past research (Prencipe, 2003; Al-
Shubiri et al. 2012). Therefore, H06 has been rejected at 5 percent level of significance,
accepting alternate hypothesis H6.
H07: The nationality of a company has no significant impact on its sustainability
disclosure score.
H7: The nationality of a company has a significant impact on its sustainability
disclosure score.
The results of multiple regression analysis shows a positive association between
nationality and sustainability disclosure score and is significant at 1% level of
significance. It implies that the companies which are extending their operations
multinationally disclose more information about its sustainability performance in order to
fulfill the requirements of both domestic and international stakeholders. This could be
due to the fact that these companies are internationally recognized. Therefore,
governments and public also lay emphasis on their comprehensive disclosures practices.
These practices are essential for them to sustain their repute. The failure to accomplish
the informational needs of the users by the company raises doubts about the competence
Corporate Attributes and Extent of Sustainability Reporting in India
180
of the company. It is also predicted by Al-Shammari (2008) that companies equipped
with greater international activities report supplementary information as compared to
companies which cater only to local operations. Companies which have multinational
operations are required to increase their voluntary reporting in order to mark their
international presence in the eyes of stakeholders and this is considered as a good signal
(Oliveira et al. 2006). So, nationality has a positive and significant impact on the
sustainability disclosure score. Thus, H07 has been rejected at 1% level of significance
and H7 has been accepted.
H08: The board size of a company has no significant impact on its sustainability
disclosure score.
H8: The board size of a company has a significant impact on its sustainability
disclosure score.
The results of multiple regression analysis found that board size is not related to
the sustainability disclosure score. As the board size increases, the board's capacity for
monitoring also increases. But there are certain disadvantages related with larger board
size. Larger board size increases the innate cost of distorted communication and delayed
decision making (John and Senbet, 1998). Also board size and board quality are different.
The efficiency of board’s working is important rather than just its size (Uyar et al., 2013).
Therefore, H08 has been accepted. Thus, it is not a predictor of sustainability disclosure
score as found by final regression equation.
H09: The board independence of a company has no significant impact on its
sustainability disclosure score.
H9: The board independence of a company has a significant impact on its
sustainability disclosure score.
The results of multiple regression analysis found that board independence is not
related to the sustainability disclosure score. It means that the number of independent
directors has no remarkable effect on sustainability information disclosure level. As
pointed by Ho and Wang (2001), that independent directors are not actively forcing the
company to disclose more of the non mandatory information. And this is in line with
Corporate Attributes and Extent of Sustainability Reporting in India
181
evidence advanced by literature (Ho and Wang, 2001; Lopes and Rodrigues, 2007; Kent
and Monem, 2008; Xiang, 2009). Thus, H09 is accepted and H9 is rejected.
H010: The advertising intensity of a company has no significant impact on its
sustainability disclosure score.
H10: The advertising intensity of a company has a significant impact on its
sustainability disclosure score.
The results of multiple regression analysis found that advertising intensity has
negative association with the sustainability disclosure score and is significant at 1% level.
It shows that companies going for selling, advertisement and distribution activities are
resorting less towards sustainability reporting. Advertising oriented companies invest
their resources on generating product differentiation, building customer loyalty and
enhancing brand image. These companies do not like to spend exorbitantly on non
mandatory disclosures as sustainability. Thus, H010 has been rejected at 1% level of
significance and H10 has been accepted.
H011: The nature of industry to which a company belongs has no significant impact
on its sustainability disclosure score.
H11: The nature of industry to which a company belongs has a significant impact
on its sustainability disclosure score.
The results of multiple regression analysis indicate a significant association
between nature of industry and sustainability disclosure. Results reveal that Oil & Gas
and Software, IT & ITES are significant at 5% level while Cement and Construction is
significant at 10% level. Yu (2010) stated that Oil & Gas companies disclose more
information on the social contributions in order to sustain their public image and
goodwill. Oil and Gas industry operations also have potential impacts on the environment
(Tronkina, 2010). Therefore, companies in these industries i.e. with heavy environmental
impacts are expected to be subject to significantly more stakeholder pressure regarding
their environmental performance, and so would be expected to display a greater degree of
disclosure activism (Reverte, 2009). Even, Meek et al. (1995) emphasized that the
companies in certain industries namely Oil, Chemicals and Mining are more active to
report non-financial information for example, related to the environment in order to show
Corporate Attributes and Extent of Sustainability Reporting in India
182
their greater concern towards social accountability issues. Further the reason of high
sustainability disclosure in Software, IT & ITES industry is supported by the view that
the inappropriate and inefficient usage of energy in this industry causes release of
dangerous acids and toxic compounds which are harmful to human health (Adamson et
al., 2005). So, this industry undertakes more sustainable efforts to show its concern for
society. Cement and Construction industry has also realized the importance of
sustainability as it involves Carbon emissions and global cement manufacture accounts
for about five percent of all man-made CO2 emissions. In order to address the
sustainability issues the leading cement companies have created the Cement
Sustainability Initiative (CSI), under the support of the World Business Council for
Sustainable Development (WBCSD, 2012). Thus, in simple words it can be said that the
category of industry to which a particular company belongs definitely affects its
sustainability disclosure (Jennifer and Taylor, 2007; Al-Shammari, 2008); Hoorik, 2009;
Lattemann et al., 2009; Yu, 2010; Michelon, 2011; Ghosh, 2013)
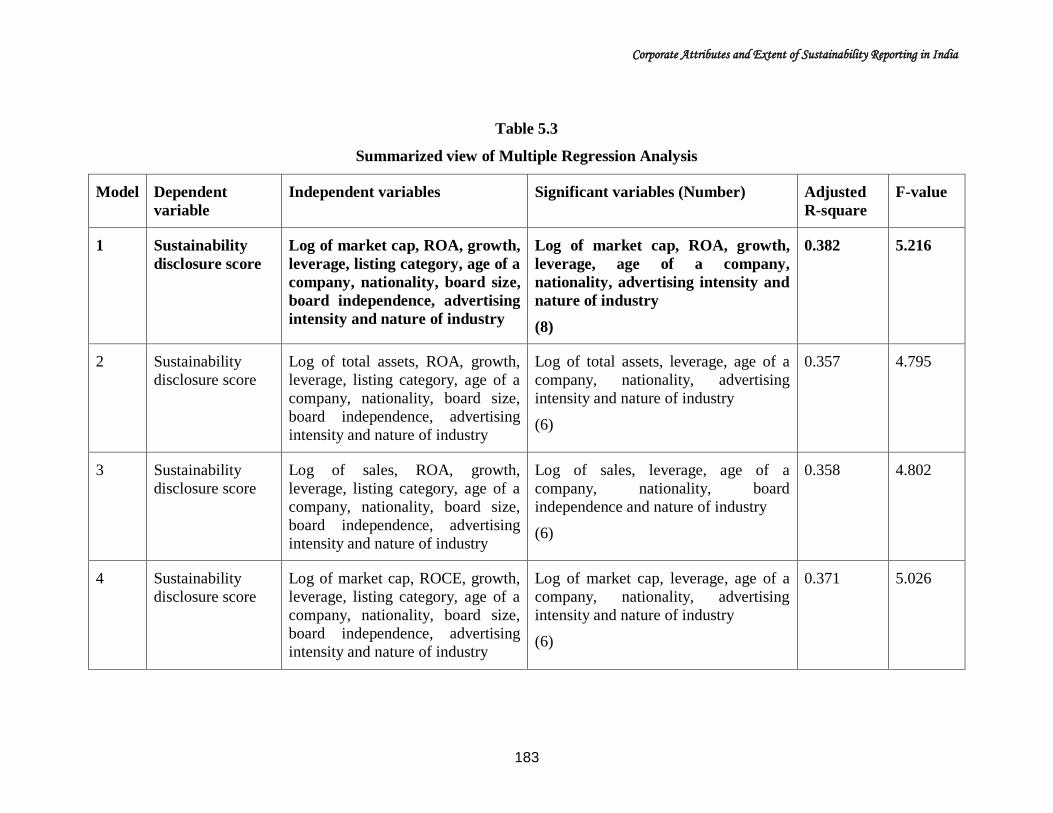
5.3 CONCLUSION
The preceding analysis explains the impact of various corporate attributes on the
sustainability reporting practices of selected Indian companies and their association. The
findings can be summarized as shown in table 5.3.
Corporate Attributes and Extent of Sustainability Reporting in India
183
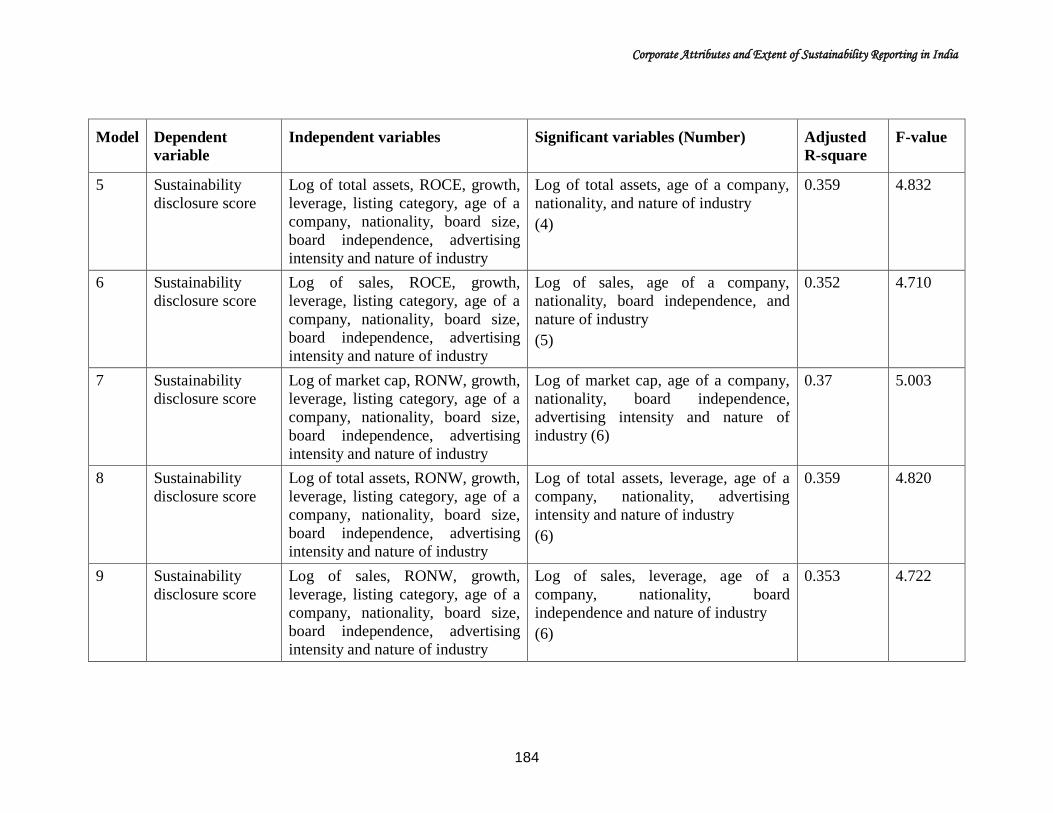
Table 5.3
Summarized view of Multiple Regression Analysis
Model Dependent
variable
Independent variables Significant variables (Number) Adjusted
R-square
F-value
1 Sustainability
disclosure score
Log of market cap, ROA, growth,
leverage, listing category, age of a
company, nationality, board size,
board independence, advertising
intensity and nature of industry
Log of market cap, ROA, growth,
leverage, age of a company,
nationality, advertising intensity and
nature of industry
(8)
0.382 5.216
2 Sustainability
disclosure score
Log of total assets, ROA, growth,
leverage, listing category, age of a
company, nationality, board size,
board independence, advertising
intensity and nature of industry
Log of total assets, leverage, age of a
company, nationality, advertising
intensity and nature of industry
(6)
0.357 4.795
3 Sustainability
disclosure score
Log of sales, ROA, growth,
leverage, listing category, age of a
company, nationality, board size,
board independence, advertising
intensity and nature of industry
Log of sales, leverage, age of a
company, nationality, board
independence and nature of industry
(6)
0.358 4.802
4 Sustainability
disclosure score
Log of market cap, ROCE, growth,
leverage, listing category, age of a
company, nationality, board size,
board independence, advertising
intensity and nature of industry
Log of market cap, leverage, age of a
company, nationality, advertising
intensity and nature of industry
(6)
0.371 5.026
Corporate Attributes and Extent of Sustainability Reporting in India
184
Model Dependent
variable
Independent variables Significant variables (Number) Adjusted
R-square
F-value
5 Sustainability
disclosure score
Log of total assets, ROCE, growth,
leverage, listing category, age of a
company, nationality, board size,
board independence, advertising
intensity and nature of industry
Log of total assets, age of a company,
nationality, and nature of industry
(4)
0.359 4.832
6 Sustainability
disclosure score
Log of sales, ROCE, growth,
leverage, listing category, age of a
company, nationality, board size,
board independence, advertising
intensity and nature of industry
Log of sales, age of a company,
nationality, board independence, and
nature of industry
(5)
0.352 4.710
7 Sustainability
disclosure score
Log of market cap, RONW, growth,
leverage, listing category, age of a
company, nationality, board size,
board independence, advertising
intensity and nature of industry
Log of market cap, age of a company,
nationality, board independence,
advertising intensity and nature of
industry (6)
0.37 5.003
8 Sustainability
disclosure score
Log of total assets, RONW, growth,
leverage, listing category, age of a
company, nationality, board size,
board independence, advertising
intensity and nature of industry
Log of total assets, leverage, age of a
company, nationality, advertising
intensity and nature of industry
(6)
0.359 4.820
9 Sustainability
disclosure score
Log of sales, RONW, growth,
leverage, listing category, age of a
company, nationality, board size,
board independence, advertising
intensity and nature of industry
Log of sales, leverage, age of a
company, nationality, board
independence and nature of industry
(6)
0.353 4.722
Corporate Attributes and Extent of Sustainability Reporting in India
185
Table 5.3 reveals that there are 9 models. The first equation is the best as it is
satisfying validity requirements and has an improved adjusted R2. It has an adjusted
R
2 of
0.382, F value of 5.216 which is significant at 1% level of significance. Therefore, the
model 1 i.e. with combination of log of market capitalization, ROA, growth, leverage,
listing category, age of a company, nationality, board size, board independence,
advertising intensity and nature of industry is selected. In this model, log of market
capitalization, ROA, growth, leverage, age of a company, nationality, advertising
intensity, Oil & Gas, Cement & Construction and Software, IT & ITES industry are
found to be significant.
These corporate attributes along with their significance status are depicted in table 5.4
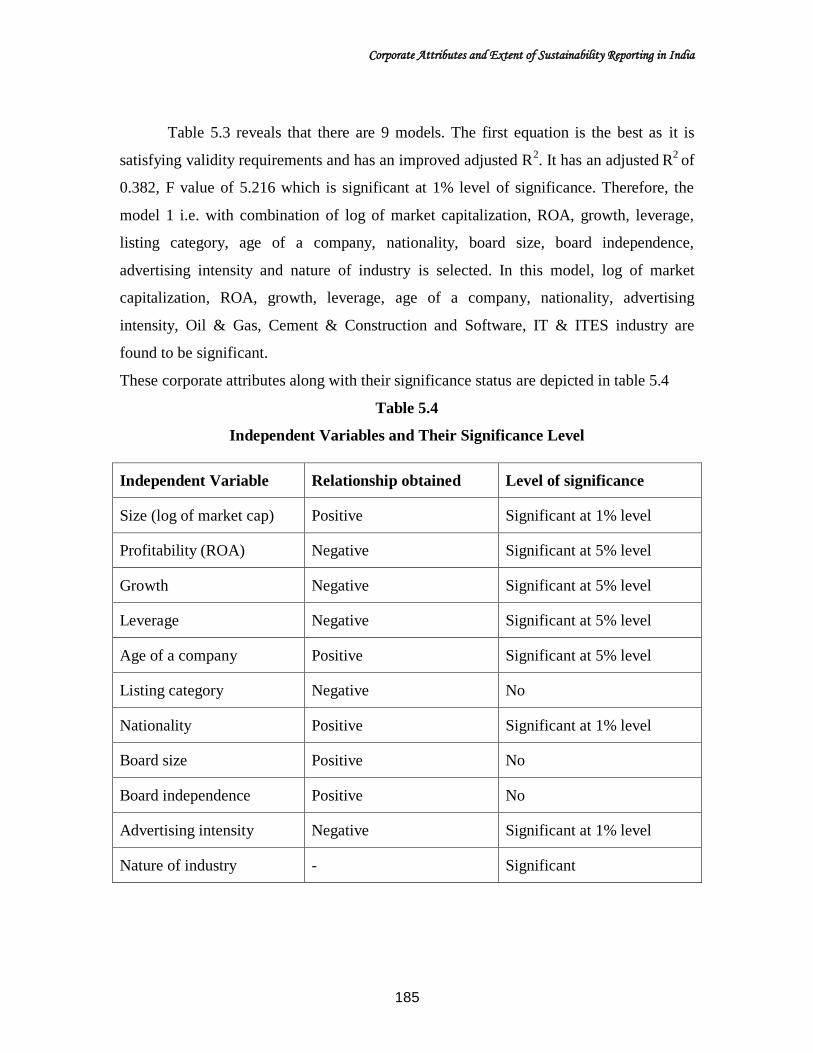
Table 5.4
Independent Variables and Their Significance Level
Independent Variable Relationship obtained Level of significance
Size (log of market cap) Positive Significant at 1% level
Profitability (ROA) Negative Significant at 5% level
Growth Negative Significant at 5% level
Leverage Negative Significant at 5% level
Age of a company Positive Significant at 5% level
Listing category Negative No
Nationality Positive Significant at 1% level
Board size Positive No
Board independence Positive No
Advertising intensity Negative Significant at 1% level
Nature of industry - Significant
Corporate Attributes and Extent of Sustainability Reporting in India
186
Table 5.4 highlights that size measured in terms of log of market capitalization
and nationality are positively significant at 1% level, while age and nature of industry
(Software, IT & ITES and Oil & Gas) significant at 5% level. Companies with large size,
older, multinational operations and belonging to Software, IT & ITES and Oil & Gas
industry have significant sustainability disclosure. However, advertising intensity is
negatively significant at 1% level while ROA, leverage, growth are negatively significant
at 5% level. This shows that the company’s profits, leverage, growth and advertising
intensity are negatively related with the extent of sustainability disclosure. Other
variables were found to be insignificant.
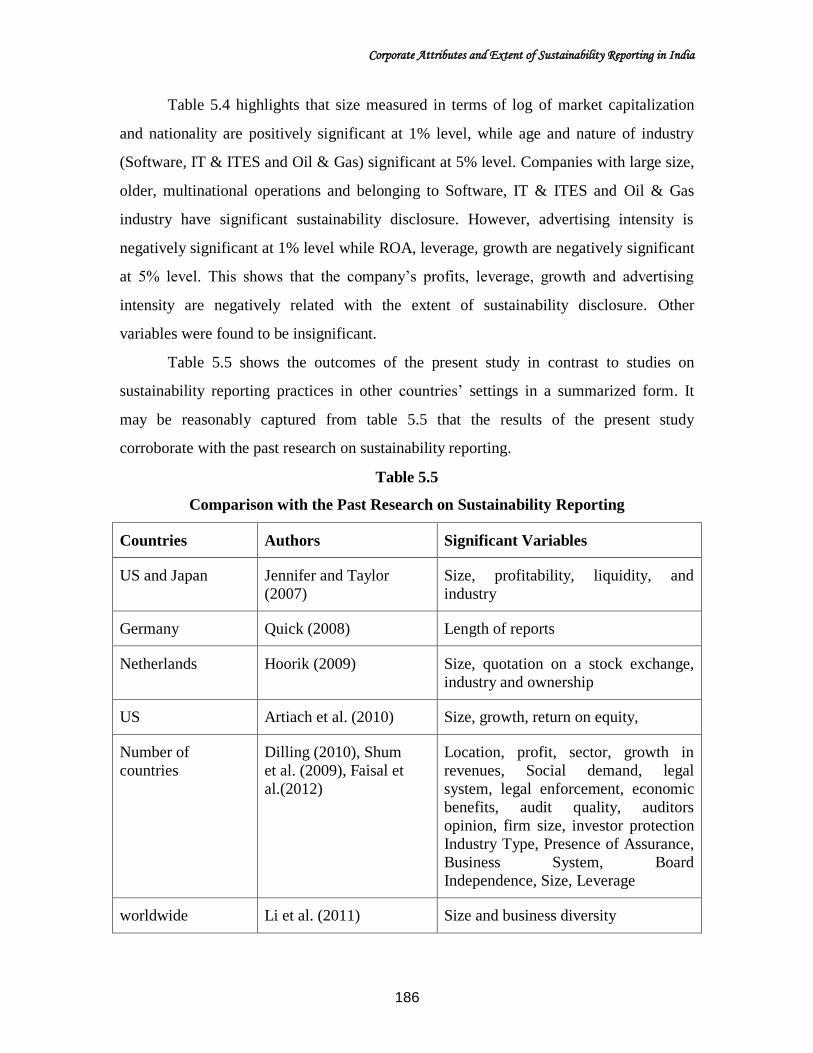
Table 5.5 shows the outcomes of the present study in contrast to studies on
sustainability reporting practices in other countries’ settings in a summarized form. It
may be reasonably captured from table 5.5 that the results of the present study
corroborate with the past research on sustainability reporting.
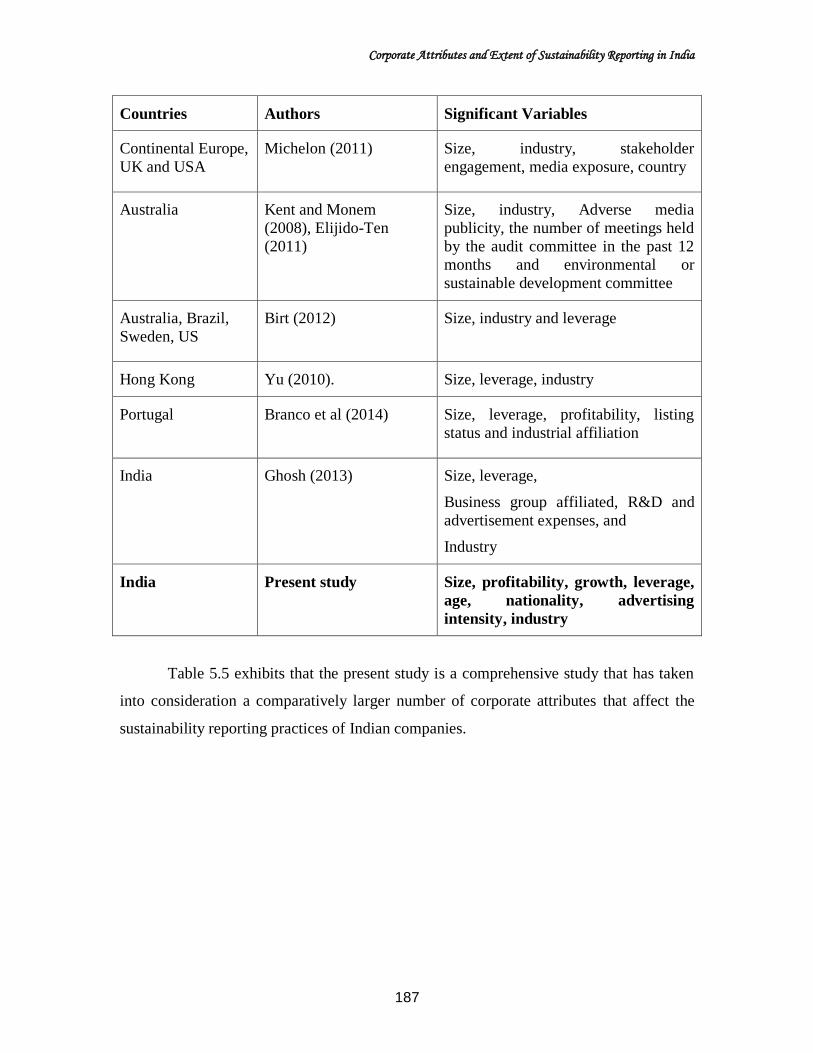
Table 5.5
Comparison with the Past Research on Sustainability Reporting
Countries Authors Significant Variables
US and Japan Jennifer and Taylor
(2007)
Size, profitability, liquidity, and
industry
Germany Quick (2008) Length of reports
Netherlands Hoorik (2009) Size, quotation on a stock exchange,
industry and ownership
US Artiach et al. (2010) Size, growth, return on equity,
Number of
countries
Dilling (2010), Shum
et al. (2009), Faisal et
al.(2012)
Location, profit, sector, growth in
revenues, Social demand, legal
system, legal enforcement, economic
benefits, audit quality, auditors
opinion, firm size, investor protection
Industry Type, Presence of Assurance,
Business System, Board
Independence, Size, Leverage
worldwide Li et al. (2011) Size and business diversity
Corporate Attributes and Extent of Sustainability Reporting in India
187
Countries Authors Significant Variables
Continental Europe,
UK and USA
Michelon (2011)
Size, industry, stakeholder
engagement, media exposure, country
Australia Kent and Monem
(2008), Elijido-Ten
(2011)
Size, industry, Adverse media
publicity, the number of meetings held
by the audit committee in the past 12
months and environmental or
sustainable development committee
Australia, Brazil,
Sweden, US
Birt (2012)
Size, industry and leverage
Hong Kong Yu (2010). Size, leverage, industry
Portugal Branco et al (2014)
Size, leverage, profitability, listing
status and industrial affiliation
India Ghosh (2013) Size, leverage,
Business group affiliated, R&D and
advertisement expenses, and
Industry
India Present study Size, profitability, growth, leverage,
age, nationality, advertising
intensity, industry
Table 5.5 exhibits that the present study is a comprehensive study that has taken
into consideration a comparatively larger number of corporate attributes that affect the
sustainability reporting practices of Indian companies.