Embed Size (px)
Citation preview
68
CHAPTER-V
EXTENT OF INTANGIBLE ASSETS DISCLOSURE
This chapter discusses the extent of intangible assets disclosure by the companies. The
extent of disclosure has been measured in terms of attribute-wise disclosure, category-wise
disclosure and company-wise disclosure by applying intangible assets disclosure index to the
annual reports of the sample companies in India for the years 2003-04 and 2007-08. The nature
of intangible asset disclosure has also been studied
This chapter has been divided into two sections. Section I discusses the attribute-wise
disclosure, category-wise disclosure and nature of disclosure. Section II deals with the
company-wise disclosure of intangible assets information presented in the annual reports of
selected sample companies in India for both the years of study.
SECTION – I
5.1. ATTRIBUTE-WISE DISCLOSURE IN ANNUAL REPORTS
This section explains the attribute-wise analysis for each and every category of
intangible assets disclosure index1. The intangible assets disclosure index consists of five main
categories, out of which four relate to voluntary intangible assets disclosure and one relate to
disclosure requirements as per Accounting Standard-26 on Intangible assets.
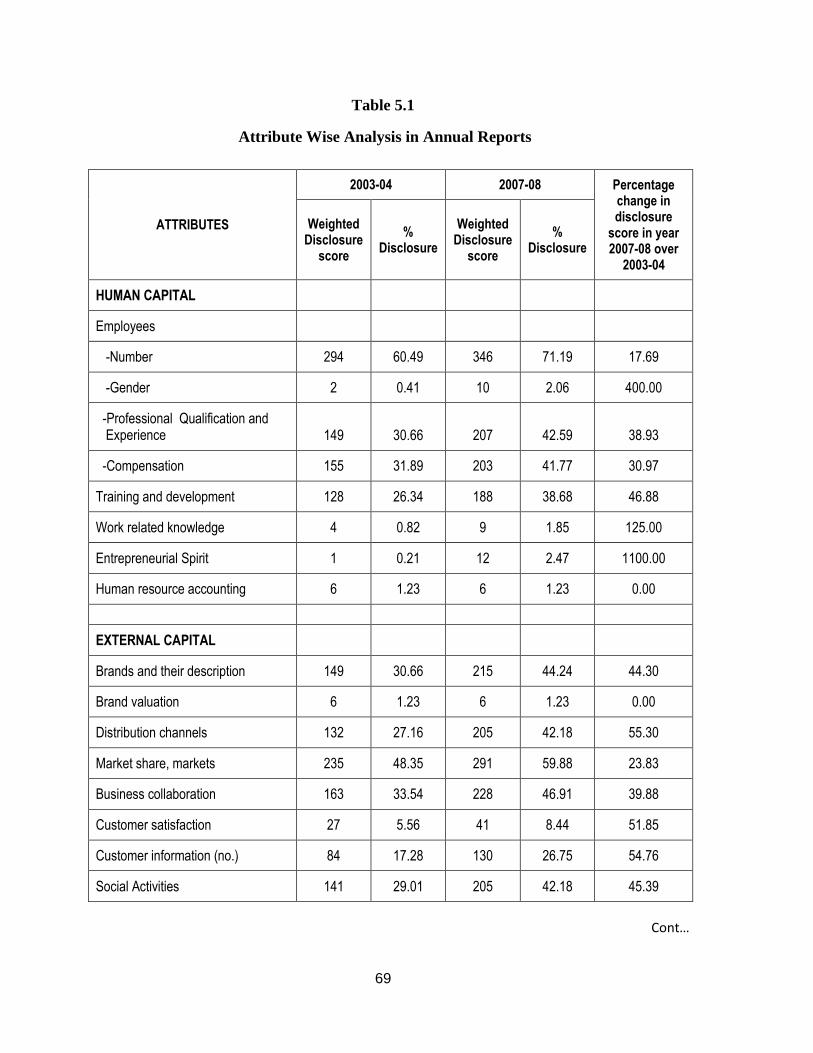
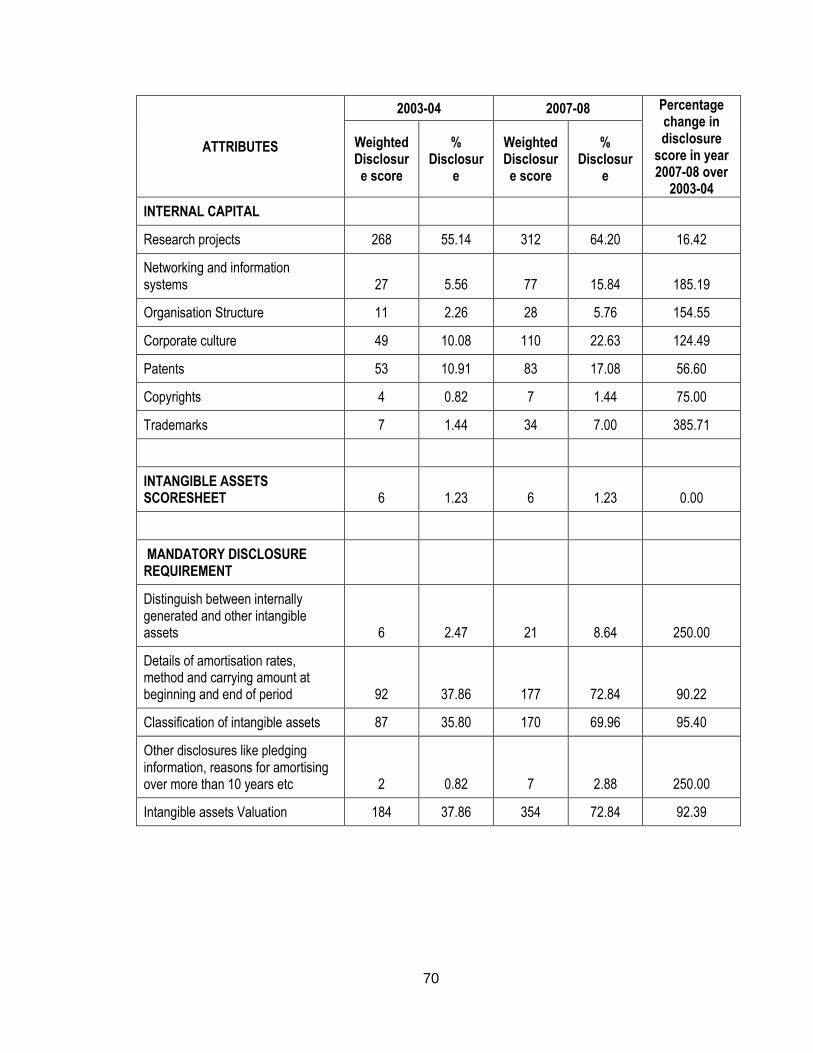
Table 5.1 presents the attribute-wise disclosure both in absolute figures as well as in
percentages for the years 2003-04 and 2007-08 respectively. The attribute-wise disclosure
score has been calculated for each attribute included in the intangible assets disclosure index,
by dividing the total weighted disclosure score attained for that attribute with the maximum
weighted disclosure score.
The maximum disclosure score for attributes in human capital, external capital,
internal capital, intangible assets scoresheet category and for attribute intangible assets
valuation2 in mandatory disclosure requirement category is 486 (243 companies multiply with
maximum score of 2). The maximum score for remaining attributes in mandatory disclosure
requirement category is 243 (243 companies multiply with maximum score of 1).
For example, the training and development attribute in human capital category for
the year 2003-04 has weighted disclosure score of 128 and the percentage disclosure of
26.34% (score attained 128 divided by 486 maximum disclosure score).
1 For details, see chapter III, Database and Research Methodology, pp. 40. 2 Intangible assets valuation falls in the Mandatory disclosure requirement category. A score of 0 or 2 has been given to this
attribute as valuation has to be in monetary terms and cannot be qualitatively stated.
69
Table 5.1
Attribute Wise Analysis in Annual Reports
ATTRIBUTES
2003-04 2007-08 Percentage change in disclosure
score in year 2007-08 over
2003-04
Weighted Disclosure
score
% Disclosure
Weighted Disclosure
score
% Disclosure
HUMAN CAPITAL
Employees
-Number 294 60.49 346 71.19 17.69
-Gender 2 0.41 10 2.06 400.00
-Professional Qualification and Experience 149 30.66 207 42.59 38.93
-Compensation 155 31.89 203 41.77 30.97
Training and development 128 26.34 188 38.68 46.88
Work related knowledge 4 0.82 9 1.85 125.00
Entrepreneurial Spirit 1 0.21 12 2.47 1100.00
Human resource accounting 6 1.23 6 1.23 0.00
EXTERNAL CAPITAL
Brands and their description 149 30.66 215 44.24 44.30
Brand valuation 6 1.23 6 1.23 0.00
Distribution channels 132 27.16 205 42.18 55.30
Market share, markets 235 48.35 291 59.88 23.83
Business collaboration 163 33.54 228 46.91 39.88
Customer satisfaction 27 5.56 41 8.44 51.85
Customer information (no.) 84 17.28 130 26.75 54.76
Social Activities 141 29.01 205 42.18 45.39
Cont…
70
ATTRIBUTES
2003-04 2007-08 Percentage change in disclosure
score in year 2007-08 over
2003-04
Weighted Disclosure score
% Disclosur
e
Weighted Disclosure score
% Disclosur
e
INTERNAL CAPITAL
Research projects 268 55.14 312 64.20 16.42
Networking and information systems 27 5.56 77 15.84 185.19
Organisation Structure 11 2.26 28 5.76 154.55
Corporate culture 49 10.08 110 22.63 124.49
Patents 53 10.91 83 17.08 56.60
Copyrights 4 0.82 7 1.44 75.00
Trademarks 7 1.44 34 7.00 385.71
INTANGIBLE ASSETS SCORESHEET 6 1.23 6 1.23 0.00
MANDATORY DISCLOSURE REQUIREMENT
Distinguish between internally generated and other intangible assets 6 2.47 21 8.64 250.00
Details of amortisation rates, method and carrying amount at beginning and end of period 92 37.86 177 72.84 90.22
Classification of intangible assets 87 35.80 170 69.96 95.40
Other disclosures like pledging information, reasons for amortising over more than 10 years etc 2 0.82 7 2.88 250.00
Intangible assets Valuation 184 37.86 354 72.84 92.39
71
A brief look of the table 5.1 shows that disclosure score in the year 2007-08 over
the year 2003-04 has improved for all attributes except three (for these three attributes it
remained constant). There is also significant change in percentage disclosure score in
year 2007-08 as compared to year 2003-04.
5.1.1 HUMAN CAPITAL
This category highlights the employee-based value drivers for a company. Human
capital depends on the competence, intellectual ability, and attitudes of the organization’s
members. It is usually described as the gathered knowledge, skills and experiences that a
company’s employees possess. Human capital is a binding factor between the various
components of intangible assets. “Our ASSETS walk out of the door each evening. We
have to make sure that they come back the next morning," says Narayana Murthy, Non-
Executive Chairman and Chief Mentor of Infosys (Infosys Technologies Ltd., Annual
report 2007-08). When a company invests in human capital, it increases its own value,
gaining a sustainable long-run competitive advantage. This category has total of eight
attributes.
The disclosure of Number of employees of a company is an indication of its
strength. As can be seen from the table 5.1, in both years, Number of employees is the
most reported attribute in the category of human resources. It has highest weighted
disclosure score of 60.49% in 2003-04 and 71.19% in 2007-08. The disclosure on number
of employees aids in analysing the change in operations of the company, and results in
depicting future growth prospects and stability to its investors.
The next attribute of human capital is the gender of employees working in a
company. It is an information regarding proportion of men and women who are
professional employees. This information is vital as businesses are consistently
recognising that a higher percentage of professional women in an organization translate
into a more innovative workforce. Companies acknowledge the valuable contributions
made by women at different managerial roles due to their innate skill sets. The present
study reveals least reporting regarding this attribute. Disclosure score is 0.41% and
72
2.06% for 2003-04 and 2007-08 respectively. Infosys Technologies is flagship company
to report this attribute : “we are the first Indian IT company to set up a Diversity Office
for promoting diversity and inclusivity Our gender inclusivity model is an individually-
tailored combination of support systems, company practices, and management policies
under the umbrella of IWIN – Infosys Women’s Inclusivity Network. IWIN is devoted to
creating a gender-sensitive work environment and making us the Employer of Choice for
women.” (Infosys Technologies Ltd., Annual report 2007-08, p.9)
Professional qualification and experience is one of the most significant intangible
assets attribute among the human capital category. These people-based skills are essential
for operation and success of any organisation. They also depict quality of employees
working in an organisation. Disclosing information relating to educational qualification
of employees may signal to investors about high calibre management staff in the
company and superior hiring policies. However, only moderate disclosures of 30.66% in
2003-04 and 42.59% in 2007-08 have been made by the selected companies for this
attribute. This attribute is second most reported attribute in human capital category for
the year 2007-08 (Table 5.4).
The attribute Compensation has a weighted disclosure score of 31.89% in 2003-
04 which improved to 41.77% in 2007-08. The significance of this attribute can be
judged from the fact that the compensation given to employees in financial and non-
financial forms has positive impact on their performance and motivation. It also cements
in the development of other intangibles within the same category like employee
capabilities and employee satisfaction. Tata Steel Ltd. reported on this attribute as
“Having always focussed on people as the key resources, fair compensation has been an
area of importance. A market based benchmarking of compensation is undertaken to
ensure that Tata Steel remains employer of choice in all the countries in which it
operates.” (Tata Steel Ltd., Annual report 2007-08, p.65). Table 5.4 shows that this
attribute is the second most reported for the year 2003-04.
73
Training and development activities are very essential for a company to update
the professional skills and knowledge of its employees. Galbreath (2005) found that
intangible resources like skills and capabilities of employees have a higher contribution
to a company’s success than other tangible or intangible assets. . Disclosure regarding
training and development information in the annual reports gives its stakeholders an
evidence of company’s commitment to invest in its employees which influences its
performance and thereby shareholders return. For example Sterlite Industries India Ltd
discloses in its 2007-08 annual report “During 2007-08, Sterlite conducted 437 training
programmes, which averaged 50.43 hours of training per employee. In the same period,
HZL invested a total of 14,252 man-days in employee training: an average of 6.24 man-
days per executive and an average of 2.24 man-days of training across all categories.”
(Sterlite Industries India Ltd., Annual Report 2007-08, p.32) Keeping in mind this fact a
high disclosure was expected. However, for the year 2003-04, the disclosure of this
attribute was only 26.34% which increased to 38.68% in the year 2007-08.
Work related knowledge and entrepreneurial spirit which are eminent intangible
assets attributes to contribute towards value-creation in business and thus the wealth of
investors. However these attributes have hardly been reported by companies for both the
years of study. Low disclosure regarding entrepreneurial spirit of employees is in contrast
to the Guthrie and Petty (2000) study on Australian companies, where it was the most
frequently reported attribute of intellectual capital. In the present study most of
disclosures relating to this attribute are in qualitative form. Information in the annual
reports, regarding problem-solving approach, risk-taking attitude, client handling
techniques, innovative abilities of employees helps investors in judging the strengths of
an organisation.
Bata India Ltd. reported its entrepreneurial spirit as: “To develop the culture of
entrepreneurship, the Company has encouraged existing employees to take the new stores
as a franchisee”. (Bata India Ltd., Annual report 2007-08, p.14)
74
Thermax Ltd. reported that: “We foster an entrepreneurial spirit throughout our
businesses and value the ability to foresee business opportunities early in the cycle and
act on them swiftly. Whether it is developing organic growth projects, making strategic
acquisitions or creating entrepreneurs from within, we ensure an entrepreneurial spirit at
the heart of our workplace. I would like to see more of this in the company as we grow,
where people take ownership of new ideas, new ways of doing the same thing and new
business models” (Thermax Ltd., Annual report 2007-08, p. 4)
Ambuja Cements Ltd. reported on work- related knowledge of its employees as
“Our trouble shooting and maintenance teams at Rabriyawas deserve acknowledgement
for the manner in which they applied innovation and ideas. They solved the problem of
SLC fan vibration and stopped losses in clinker production, estimated at around Rs 13
crores.” (Ambuja cement Ltd., Annual report 2007-08, p.14).
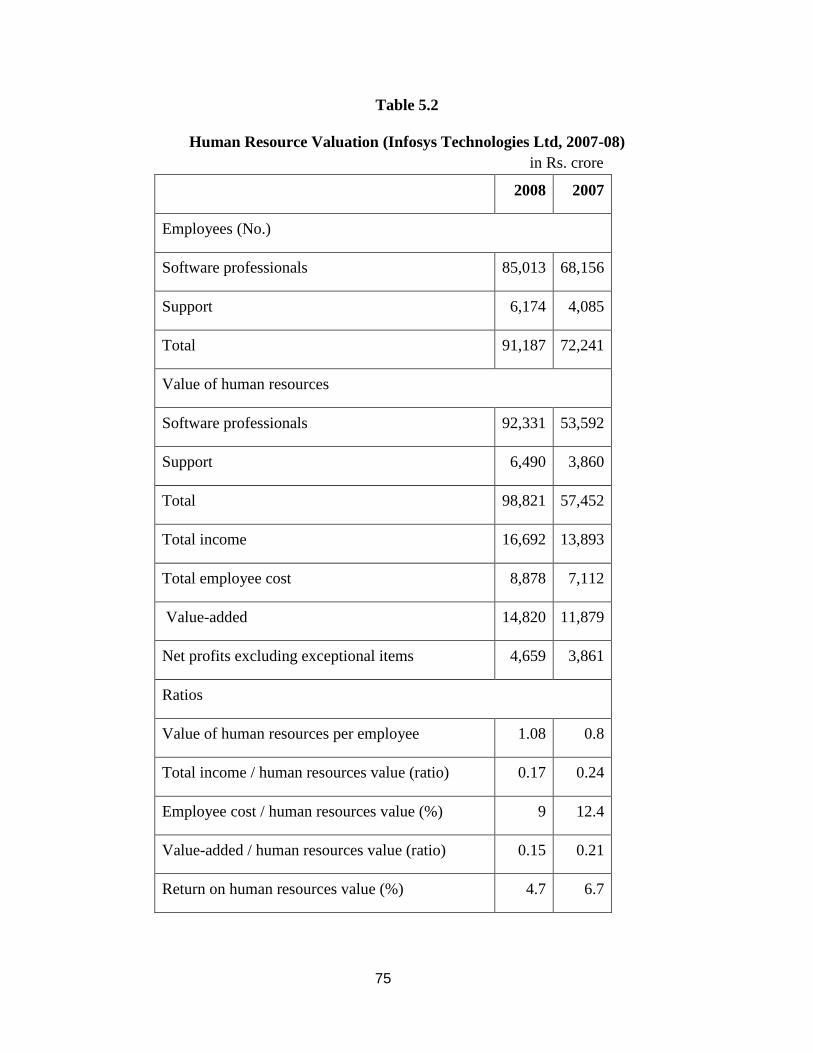
The disclosure regarding the final attribute human resource accounting in this
category is very low for both the years of the study. Only Infosys Technologies Ltd.,
Satyam Computer Services Ltd. and Infotech Enterprises Ltd. belonging to software
industry have disclosed this item as additional information to shareholders for the two
years of the study. The companies namely Infosys Technologies Ltd. and Satyam
Computer Services Ltd. have used Lev & Schwartz model for computing the human
resource value. Both the companies have given detailed disclosure of this information by
computing present value of future earnings of the employees (human resources) and
various ratios to evaluate it. Table 5.2 gives the summary of human resource valuation
from the annual report of Infosys Technologies Ltd.
75
Table 5.2
Human Resource Valuation (Infosys Technologies Ltd, 2007-08)
in Rs. crore
2008 2007
Employees (No.)
Software professionals 85,013 68,156
Support 6,174 4,085
Total 91,187 72,241
Value of human resources
Software professionals 92,331 53,592
Support 6,490 3,860
Total 98,821 57,452
Total income 16,692 13,893
Total employee cost 8,878 7,112
Value-added 14,820 11,879
Net profits excluding exceptional items 4,659 3,861
Ratios
Value of human resources per employee 1.08 0.8
Total income / human resources value (ratio) 0.17 0.24
Employee cost / human resources value (%) 9 12.4
Value-added / human resources value (ratio) 0.15 0.21
Return on human resources value (%) 4.7 6.7
76
5.1.2 EXTERNAL CAPITAL
This intangible assets category represents relationship of a company with its
customers. suppliers, business partners, industry associates, market channels, investors,
society etc. This category is classified into eight sub-categories which are brands and
their description, brand valuation, distribution channels, markets & market share,
business collaboration, customers, customer satisfaction and social activities.
In today’s market place, brands have primary importance to businesses. Many of
the world’s biggest companies derive more than half of their value because of their
brands. Building strong brands through effective marketing can have a very positive
impact on company’s share price as well. Also development of brands helps companies in
enhancing their market share by securing repeated customer orders and building brand
loyalty. Companies in India have increased the use of annual reports as a medium to
inform outside world about their brands. Information disclosure regarding this has
incremented from 30.66% in 2003-04 to 44.24% in 2007-08. Widespread distribution of
annual reports, have made them as an effective means, by which companies can exchange
detailed information regarding all its brand portfolio, number of brands, brand logos etc.
in an economical and effective way. An appropriate example of this is Reliance Industries
Ltd. annual report for the year 2007-08 (Page 2) where they have given list of all its
brands and products.
Brand valuation is a tool employed by companies to manage their brands in order
to deliver optimal and sustainable value to its stakeholders. A brand’s value constitutes
to be an important component in the value of a company. It is a powerful way of
identifying areas of strength and weakness for the brand. Brand valuation has become a
means for communicating about brand in shareholder value terms, both internally and
externally. Investors nowadays prefer greater understanding and disclosure of brand
valuation and marketing performance information to improve their investment decisions.
Despite the significance of its communication externally, only Infosys Technologies Ltd.
and Satyam Computer Services Ltd. from software industry and Alembic Ltd. from
pharmaceutical industry have disclosed their brand valuation information in their annual
reports for the years 2003-04 and 2007-08 respectively. Low disclosures regarding brand
77
valuation in annual reports could be inferred from the fact that companies yet do not
realise the significance of brand value in determining its true overall value. The other
reasons could be that companies do not want to share this information with its
stakeholders because of its brand value being low. Satyam Computers Services Ltd.
reported on brand valuation as
“As on March 31, 2008, the Brand value of the Company was Rs. 9,873 crores (US$2,467
mn.), as computed below:
i) PBIT reduced by non-branded income was taken as profit for brand valuation.
ii) Profits of previous two years were considered at present value and weightage
factor was applied to arrive at weighted profit.
iii) 5% of average capital employed was provided for non brand purposes.
iv) Income Tax at current rate was provided.
v) Brand multiple was estimated based on certain parameters and internal
evaluation.”
Distribution channels are the means used to transfer goods or services from its
manufacturer to its end user. A strong distribution network constitutes to be an important
intangible asset for an organisation, as it signifies regular sales and constant orders.
Distribution has emerged as one of the few remaining areas where companies can build
and sustain competitive advantage. The information disclosure regarding distribution
channels by companies was 27.16% in 2003-04. With a 55.30% increase, it was 42.18%
in the year 2007-08. For example, Aditya Birla Nuvo Ltd. quotes “To enhance its
competitive strength, BSLAMC more than doubled its distribution network to reach 78
branches and over 17,500 financial advisors in March 2008.” (Aditya Birla Nuvo Ltd.,
Annual report 2007-08, p.16)
Another vital attribute in external capital category, is the market where a company
operates and its market share. Market share can be defined as the percentage of all sales
within a market that is held by one brand / product or company. Information concerning
markets and market share of a company helps its stakeholders to assess its products,
customers, regional coverage, strengths, longevity, growth potential etc. Disclosure
regarding this attribute is 48.35% in 2003-04. It increased to 59.88% in 2007-08. Within

78
the external capital category, this attribute is the most frequently reported attribute for
both years of the study (Table 5.4). The high disclosure could be due to the fact that
information regarding this attribute is usually collected by company’s marketing
department. Thus, the marginal cost of preparing these data for external reporting
purposes is low.
Business collaborations is the second most reported intangible assets attribute in
this category, for both the years of study (Table 5.4). The importance placed to business
collaborations is not surprising as mutual alliances and other forms of collaborative
arrangements, of an organisation with its industry associates or strategic partners, are
becoming common way of conducting business and implementing growth strategies.
They also constitute to be an important source of competitive advantage. These joint
ventures help an organisation in improving its performance, increasing geographical
presence and diversifying into related businesses by developing alliances that
complement their core competencies. They also assist in gaining synergies in internal
operations and external opportunities. Effective reporting about business alliances
undertaken by a company helps its stakeholders in making sound investment decisions.
Disclosures regarding this attribute are 33.54% in 2003-04 which increased to 46.91% in
2007-08. Business collaboration is the top-scoring attribute in similar researches by
Guthrie et al (2006), Sujan & Abeysekera (2007) and Woodrock & Whiting (2009).
Also many companies equate their competitive advantage with their capacity to
deliver high levels of customer satisfaction. The products are changing, and so are
consumers. The companies have to make great efforts to improve and maintain good
relationships with their clients, who are increasingly demanding improved products and
services with accelerated delivery times and at lower prices. Satisfied customers are
challenging yet important intangible assets for an organisation For example Aruna
Sundarajan (Secretary IT Government of Kerela) appreciates Tulip Telecom Ltd “I am
extremely satisfied with the network rolled out by Tulip Telecom Limited Ltd and wish
them continuous success in this field -” (Tulip Telecom ltd., Annual report 2007-08, p.4).
But companies make meagre disclosure regarding this attribute in their annual reports.
Only 5.56% disclosure score in 2003-04 and 8.44% in 2007-08 has been reported
79
regarding this attribute. This non-disclosure pattern may be taken to indicate that only
companies with good customer feedbacks wants to mention this fact in their annual
report.
Further the information with regard to customers has a disclosure of 17.28% in
the year 2003-04 and 26.75% in the year 2007-08. This information helps the investors to
know about the major customers, reliance on major customers, customer base widespread
ness, new customers added, geographical distribution of customers etc of the respective
company. The investor analyses this information to draw conclusions on reputation,
credit worthiness and forward sales of the company. Though this information is
significant to investors its disclosure is not very high. The possible reason for these low
disclosures could be confidentiality of the information from its competitors. An
illustration of this attribute from the annual report of I-flex Solutions Ltd. is “Our
operations and business depend on our relationships with a number of large customers.
Our Revenues from our top ten customers for fiscal 2008 were at 32% and 26% for fiscal
year 2007, as a percentage of our total revenues. The top-ten customers in our Services
Business contributed 42% of the total services revenues and the top ten customers in the
Products Business contributed 36% of the total products revenues during fiscal 2008.” (I-
flex Solutions ltd., Annual report 2007-08, p. 44).
As a social citizen, it is the duty of every company to be sensitive towards societal
needs or meet its social responsibilities. Companies should also contribute towards
environment protection and community development. For discharging the above
responsibilities companies are focusing on creation of healthcare, food security,
education and income generation, through the development of rural infrastructure,
empowerment and community outreach programmes. Fulfilling societal needs helps
company in attracting investors, recruiting employees, creating positive press image,
developing new products and services etc. It also makes a company more competitive by
reducing risk of sudden damage to reputation and sales. There is 29.01% disclosure
related to this attribute in the annual reports for the year 2003-04, which increased to
42.18% in 2007-08. Few companies have disclosed it in details as separate report
80
annexed as additional information to the shareholders while others have disclosed it as
information annexed to the management discussion and analysis and director’s report
section of the annual report under the heading social concerns. A large number of
companies have also attached photographs of these corporate responsibility initiatives.
Tata Steel Ltd. reported its social responsibility as “The Tata Steel Group’s focus
in the area of corporate sustainability includes Social Sustainability; Environmental
Sustainability; Social Welfare; Sport; and Inclusive Growth. This last ensures that the
Group’s successes are shared by all its constituents and stakeholders.” (Tata Steel Ltd.,
Annual Report 2007-08, p- 67)
Annual report of Hindalco industries Ltd. mentions that. “As a Group we have
been and continue to be extremely sensitive to societal needs. In our own small way, we
try to bring in some relief and make a difference to the lives of the weaker sections of
society who live close to our plants. We try to provide health care and raise life
expectancy, and reduce infant mortality. Through our endeavours in education, we lift
literacy rates. Through empowerment and training processes, we promote sustainable
livelihood.” (Hindalco Industries Ltd., Annual report 2007-08, p.54)
5.1.3 INTERNAL CAPITAL
Internal capital is defined as the structure, processes, technologies,
methodologies, procedures, routines, systems and culture of an organisation. It comprises
the capabilities of a company, its infrastructure and organisational processes to
manufacture products and render services to the market. Intangible assets of this category
are idiosyncratic to a company and they constantly need to adapt to changing business
scenarios. These assets give the organization a unique advantage over its competitors as
these are not licensed to outsiders and are under company’s control. There are seven
attributes in this category namely research activities, networking and information system,
organisation structure, corporate culture, patents, trademarks and copyrights.
81
Research Activities is the most disclosed attribute in internal capital category for
both the years of study (Table 5.4). They represent lifeblood for any organisation. They
help the business to innovate its products and services. They can further help in boosting
sales, increasing profitability, opening new markets, attracting best employees, finding
new business partners, attracting external finance etc. Disclosure for this attribute is
around 55.14% in the year 2003-04 which increased to 64.20% in the year 2007-08. Easy
availability of research related information could be a possible reason for its high
disclosure. Sun pharmaceutical Industries Ltd. has disclosed on this attribute as “Our
teams at the R&D centres continue their task of building pipelines-developing cost
effective & efficient processes for dosage forms as well as APIs, scaling these up from the
labs to the plants, working on product development for demanding international markets,
developing ANDAs for a strong pipeline in the US.” (Sun pharmaceutical Industries Ltd,
Annual report 2007-08, p.12)
Networking and information systems which is another internal capital attribute,
refers to business’s modus operandi and methods in relation to its internal processes and
administrative systems. These internal methods, procedures, routines, technologies are
roots of an organisation. The information on these disclosures being company specific,
internal and confidential, low disclosures is found on this attribute. Disclosures regarding
networking and information systems is 5.56% in 2003-04 whereas it is15.84% in 2007-
08. Sterlite Industries Ltd. reports on its networking and information systems as “From
1999, Sterlite has been operating in a SAP environment. As on date, we operate nine
modules of SAP: Finance and Costing, Production Planning, Plant Maintenance, Quality
Management, Sales and Distribution, Material Management, Human Capital
Management and Supplier Relationship Management. In addition, we also have a non-
SAP based, web-enabled customer portal, where our customers can log in to extract
various information such as test certificates, account status, invoices, answers to
technical queries and so on.” (Sterlite Industries Ltd., Annual report 2007-08, p.34)
Another internal capital attribute unique to any company, is its organisation
structure. A company’s organisation structure determines the manner and extent to which
82
roles, power, and responsibilities are delegated, controlled, and coordinated, and how
information flows within the levels of management. A well managed and stable
organisation structure of any company is its important intangible assets and it depicts its
internal soundness and steadiness. The disclosure regarding this attribute is 2.26% in
2003-04 and 5.76% in 2007-08.
Corporate culture refers to the combined beliefs, values, ethics, procedures, and
atmosphere of an organization. It determines a company’s dress code, work environment,
working hours, rules for getting ahead and getting promoted, how the business world is
viewed, what is valued, who is valued, and much more. Intangible assets like
organisation culture are hard for competitors to replicate. This internal capital attribute
has mostly been reported in qualitative form in the annual reports. This attribute has
10.08% disclosure in 2003-04 and 22.63% disclosure in 2007-08. This is the second most
reported attribute in internal capital category for the year 2007-08 (Table 5.4).
Other significant intellectual capital attributes in internal capital category are
patents, copyrights and trademarks. Patents have voluntary disclosure score of 10.91% in
2003-04 and 17.08 % in 2007-08. Likewise copyrights have disclosure score of 0.82%
which increased to 1.44% in 2007-08 and trademarks have disclosure score of 1.44% in
2003-04 followed by 7..00% in 2007-08. These intellectual property assets are usually
owned by a corporation and are valued based on their commercial potential. A
corporation can derive its revenues from licensing these assets to outside users. Larsen
and Toubro Ltd. reported that “The Division has put serious and conscious efforts to
generate innovative ideas and create great value for the organisation by protecting them
through intellectual property rights. 2007-2008 has been another successful year on this
front, wherein 101 patent applications in addition to 31 Design Registrations and 11
Trademark filings have been made.” (Larsen and Toubro Ltd., Annual Report 2007-08,
p.58)
83
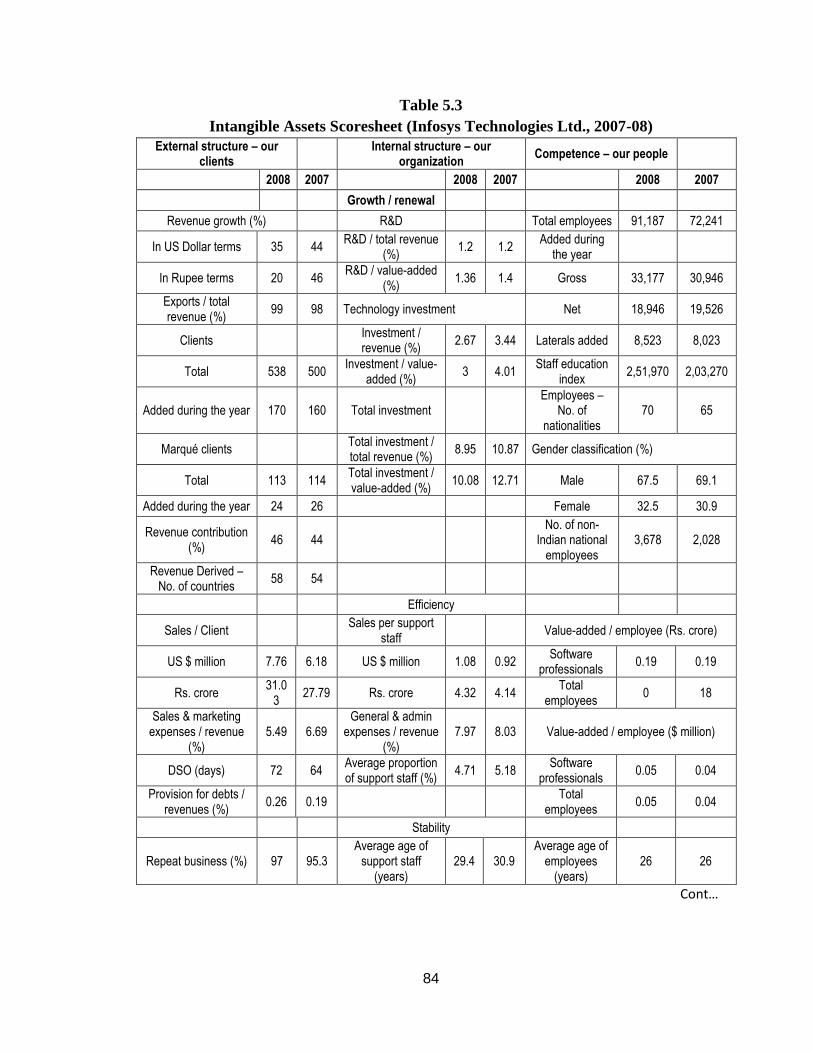
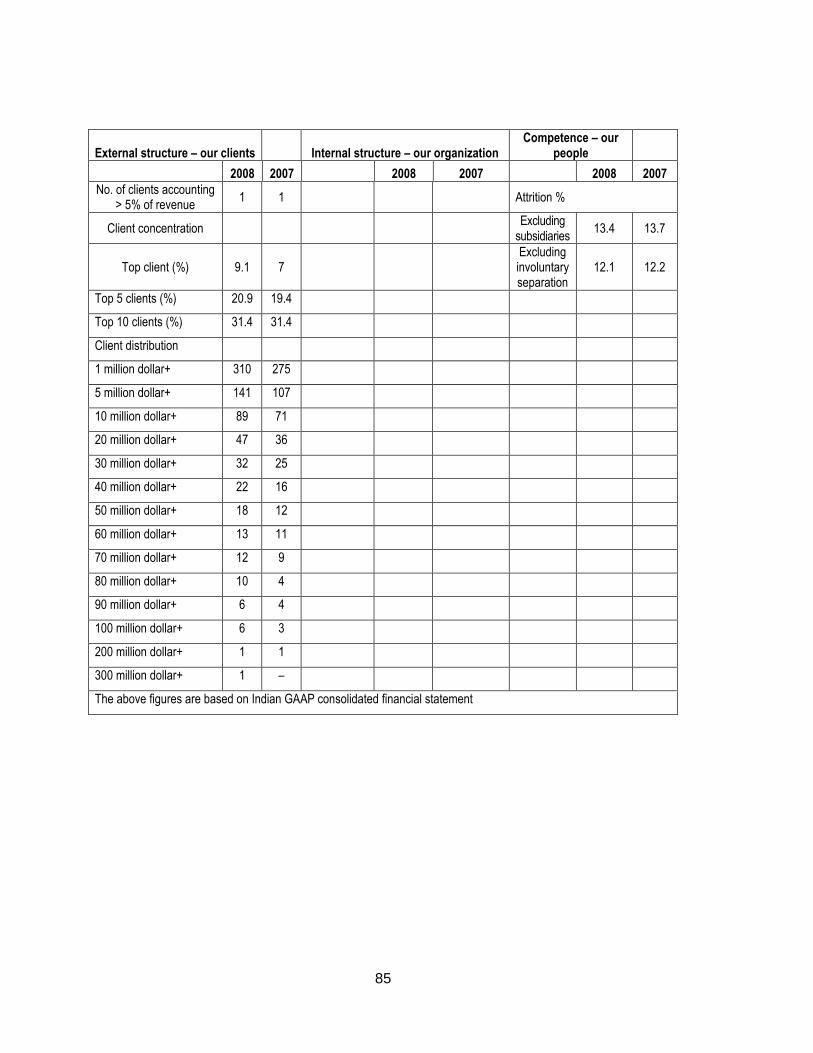
5.1.4 INTANGIBLE ASSETS SCORESHEET
Intangible assets Scoresheet has been disclosed only in annual reports of Infosys
Technologies Ltd., Satyam Computer Services Ltd. and Infotech Enterprises Ltd. for both
the years. The intangible assets statement provided by these companies clearly points out
the company’s intangible assets and their growth, by giving a comparative picture over
the years. It has been presented as additional information to the investors. These
companies strongly believe that the intangible assets scoresheet provides a tool to the
investors for evaluating their market worthiness. However lack of awareness among
corporates regarding the importance of intangible assets scoresheet in determining the
true value of their company could have resulted in its meagre disclosure. An illustration
of intangible assets scoresheet from the annual report of Infosys Technologies Ltd for the
year 2007-08 is given in Table 5.3:
5.1.5 MANDATORY DISCLSOURE REQUIREMENT
Accounting Standard 26 on Intangible assets issued by the Institute of Chartered
Accountants of India in 2002 specifies some disclosure requirements for companies
having intangible assets in their balance sheets. These requirements have been
categorised into four sub-heads which are:
(a) Distinguish between internally generated and other intangible assets;
(b) Details of amortisation rates, method and carrying amount at beginning and end
of period;
(c) Classification of intangible assets; and
(d) Other disclosures like pledging information, reasons for amortising over more
than 10 years etc.
The sub-head (a) above which is distinguishing between internally generated and
other intangible assets, has a disclosure score of 2.47% in the year 2003-04 and 8.64% in
the year 2007-08. Low disclosure score for both the years shows that not many
companies, which have intangible assets in their books, are differentiating between
internally generated and acquired intangible assets.
84
Table 5.3
Intangible Assets Scoresheet (Infosys Technologies Ltd., 2007-08)
External structure – our clients
Internal structure – our organization
Competence – our people
2008 2007
2008 2007
2008 2007
Growth / renewal
Revenue growth (%)
R&D
Total employees 91,187 72,241
In US Dollar terms 35 44 R&D / total revenue
(%) 1.2 1.2
Added during the year
In Rupee terms 20 46 R&D / value-added
(%) 1.36 1.4 Gross 33,177 30,946
Exports / total revenue (%)
99 98 Technology investment Net 18,946 19,526
Clients
Investment / revenue (%)
2.67 3.44 Laterals added 8,523 8,023
Total 538 500 Investment / value-
added (%) 3 4.01
Staff education index
2,51,970 2,03,270
Added during the year 170 160 Total investment
Employees – No. of
nationalities 70 65
Marqué clients
Total investment / total revenue (%)
8.95 10.87 Gender classification (%)
Total 113 114 Total investment / value-added (%)
10.08 12.71 Male 67.5 69.1
Added during the year 24 26
Female 32.5 30.9
Revenue contribution (%)
46 44
No. of non-Indian national
employees 3,678 2,028
Revenue Derived – No. of countries
58 54
Efficiency
Sales / Client
Sales per support staff
Value-added / employee (Rs. crore)
US $ million 7.76 6.18 US $ million 1.08 0.92 Software
professionals 0.19 0.19
Rs. crore 31.0
3 27.79 Rs. crore 4.32 4.14
Total employees
0 18
Sales & marketing expenses / revenue
(%) 5.49 6.69
General & admin expenses / revenue
(%) 7.97 8.03 Value-added / employee ($ million)
DSO (days) 72 64 Average proportion of support staff (%)
4.71 5.18 Software
professionals 0.05 0.04
Provision for debts / revenues (%)
0.26 0.19
Total employees
0.05 0.04
Stability
Repeat business (%) 97 95.3 Average age of
support staff (years)
29.4 30.9 Average age of
employees (years)
26 26
Cont…
85
External structure – our clients Internal structure – our organization Competence – our
people
2008 2007 2008 2007 2008 2007
No. of clients accounting > 5% of revenue
1 1
Attrition %
Client concentration
Excluding subsidiaries
13.4 13.7
Top client (%) 9.1 7
Excluding involuntary separation
12.1 12.2
Top 5 clients (%) 20.9 19.4
Top 10 clients (%) 31.4 31.4
Client distribution
1 million dollar+ 310 275
5 million dollar+ 141 107
10 million dollar+ 89 71
20 million dollar+ 47 36
30 million dollar+ 32 25
40 million dollar+ 22 16
50 million dollar+ 18 12
60 million dollar+ 13 11
70 million dollar+ 12 9
80 million dollar+ 10 4
90 million dollar+ 6 4
100 million dollar+ 6 3
200 million dollar+ 1 1
300 million dollar+ 1 –
The above figures are based on Indian GAAP consolidated financial statement
86
As-26 also requires that companies should give details of amortisation rates,
method and carrying amount at beginning and end of period. This requirement has been
fulfilled by all the companies which had intangible assets as a part of their balance sheet.
Disclosure score for this sub-head is 37.86% in 2003-04 and 72.84% in 2007-08.
Classification of intangible assets into separate classes is also one of the requisite
of AS 26. For the year 2003-04, out of 37.86% companies having intangible assets in
their balance sheet, 35.80% companies are categorising them into classes like software,
brand, licences etc. Similarly for the year 2007-08, 69.96% companies are categorising
their intangible assets, out of a total of 72.84% of sample companies which recognise
intangible assets in their books of accounts.
Other disclosures like pledging information, reasons for amortising over more
than 10 years etc. have achieved a score of 0.82% in 2003-04 and 2.88% in 2007-08.
Low disclosure for this sub-head could be due to limited applicability of this disclosure
requirement.
Intangible assets Valuation
In India there is an increasing awareness among corporate to disclose and value
their intangible assets. Intangible assets Valuation means assigning a fair monetary value
to intangible assets (whether internally generated or acquired from outside) in a company.
As mentioned in research methodology a score of “2” has been assigned to companies
valuing their intangible assets and “0” for not valuing them. Accordingly, this category
has received a disclosure score of 37.86% in 2003-04 and 72.84% in 2007-08.
87
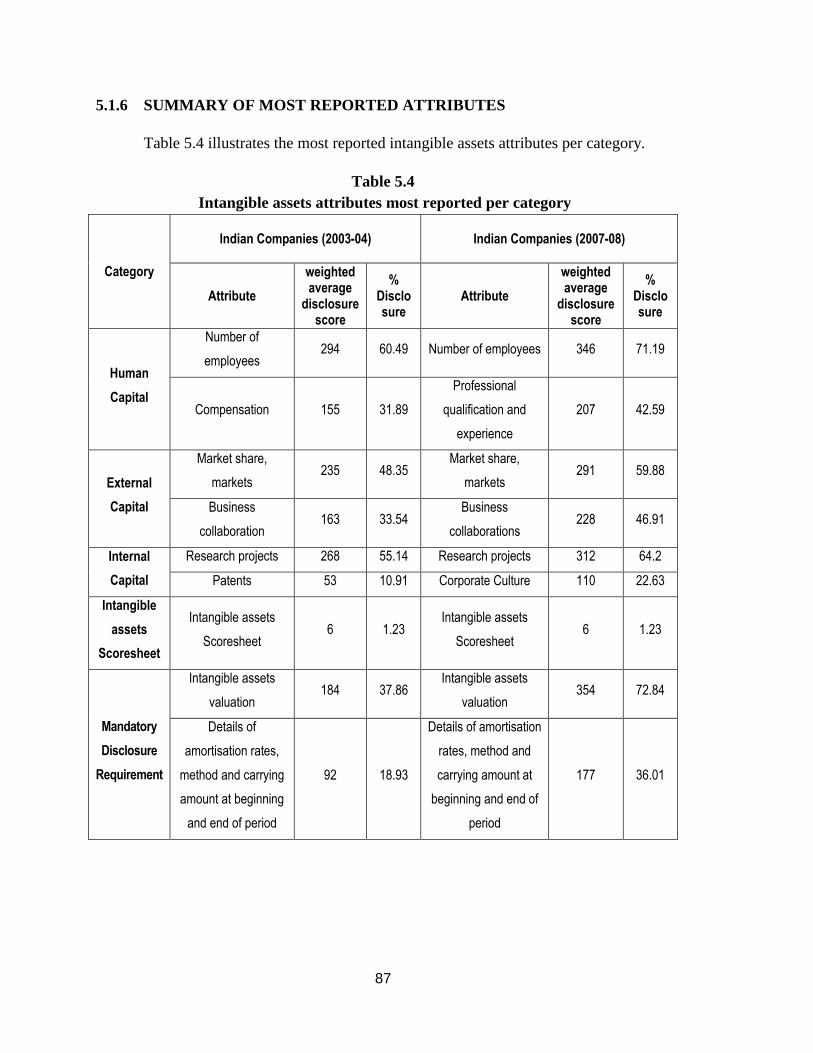
5.1.6 SUMMARY OF MOST REPORTED ATTRIBUTES
Table 5.4 illustrates the most reported intangible assets attributes per category.
Table 5.4
Intangible assets attributes most reported per category
Category
Indian Companies (2003-04)
Indian Companies (2007-08)
Attribute
weighted average
disclosure score
% Disclosure
Attribute
weighted average
disclosure score
% Disclosure
Human
Capital
Number of
employees 294 60.49 Number of employees 346 71.19
Compensation 155 31.89
Professional
qualification and
experience
207 42.59
External
Capital
Market share,
markets 235 48.35
Market share,
markets 291 59.88
Business
collaboration 163 33.54
Business
collaborations 228 46.91
Internal
Capital
Research projects 268 55.14 Research projects 312 64.2
Patents 53 10.91 Corporate Culture 110 22.63
Intangible
assets
Scoresheet
Intangible assets
Scoresheet 6 1.23
Intangible assets
Scoresheet 6 1.23
Mandatory
Disclosure
Requirement
Intangible assets
valuation 184 37.86
Intangible assets
valuation 354 72.84
Details of
amortisation rates,
method and carrying
amount at beginning
and end of period
92 18.93
Details of amortisation
rates, method and
carrying amount at
beginning and end of
period
177 36.01
88
The attribute “Number of employees” and “Compensation” for the year 2003-04
whereas attribute “Number of employees” and “Professional qualification and
experience” for the year 2007-08 are the most reported attributes from the human capital
category.
“Market share, markets” and “Business collaboration” are most highly disclosed
attributes in external capital category for both the years of study.
Further in internal capital category, “Research projects” and “Patents” for the
year 2003-04 plus “Research projects” and “Corporate culture” for the year 2007-08, are
most reported intangible assets.
Similarly for mandatory disclosure requirement category, “Intangible assets
valuation” and “Details of amortisation rates, method and carrying amount at beginning
and end of period” are most disclosed attributes in annual reports.
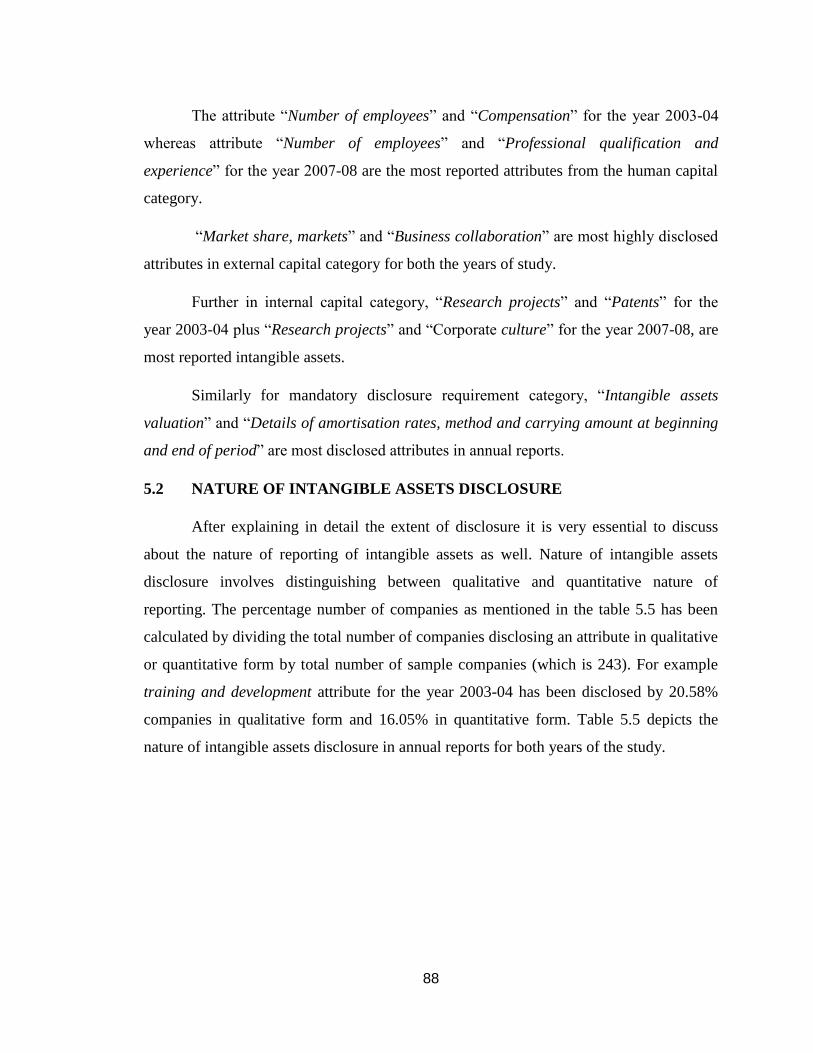
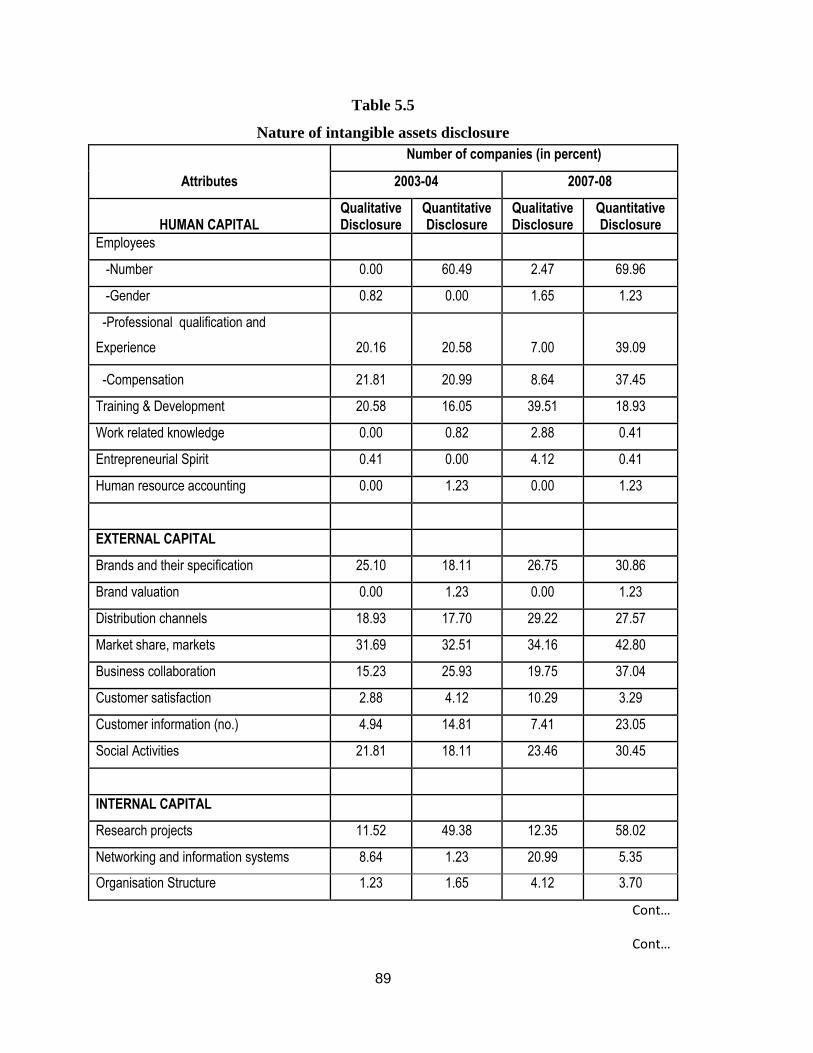
5.2 NATURE OF INTANGIBLE ASSETS DISCLOSURE
After explaining in detail the extent of disclosure it is very essential to discuss
about the nature of reporting of intangible assets as well. Nature of intangible assets
disclosure involves distinguishing between qualitative and quantitative nature of
reporting. The percentage number of companies as mentioned in the table 5.5 has been
calculated by dividing the total number of companies disclosing an attribute in qualitative
or quantitative form by total number of sample companies (which is 243). For example
training and development attribute for the year 2003-04 has been disclosed by 20.58%
companies in qualitative form and 16.05% in quantitative form. Table 5.5 depicts the
nature of intangible assets disclosure in annual reports for both years of the study.
89
Table 5.5
Nature of intangible assets disclosure
Attributes
Number of companies (in percent)
2003-04 2007-08
HUMAN CAPITAL Qualitative Disclosure
Quantitative Disclosure
Qualitative Disclosure
Quantitative Disclosure
Employees
-Number 0.00 60.49 2.47 69.96
-Gender 0.82 0.00 1.65 1.23
-Professional qualification and
Experience 20.16 20.58 7.00 39.09
-Compensation 21.81 20.99 8.64 37.45
Training & Development 20.58 16.05 39.51 18.93
Work related knowledge 0.00 0.82 2.88 0.41
Entrepreneurial Spirit 0.41 0.00 4.12 0.41
Human resource accounting 0.00 1.23 0.00 1.23
EXTERNAL CAPITAL
Brands and their specification 25.10 18.11 26.75 30.86
Brand valuation 0.00 1.23 0.00 1.23
Distribution channels 18.93 17.70 29.22 27.57
Market share, markets 31.69 32.51 34.16 42.80
Business collaboration 15.23 25.93 19.75 37.04
Customer satisfaction 2.88 4.12 10.29 3.29
Customer information (no.) 4.94 14.81 7.41 23.05
Social Activities 21.81 18.11 23.46 30.45
INTERNAL CAPITAL
Research projects 11.52 49.38 12.35 58.02
Networking and information systems 8.64 1.23 20.99 5.35
Organisation Structure 1.23 1.65 4.12 3.70
Cont…
Cont…
90
Attributes
Number of companies (in percent)
2003-04 2007-08
Qualitative Disclosure
Quantitative Disclosure
Qualitative Disclosure
Quantitative Disclosure
Corporate culture 19.34 0.41 43.62 0.82
Patents 4.53 8.64 2.88 15.64
Copyrights 0.82 0.41 1.23 0.82
Trademarks 1.23 0.82 2.47 5.76
INTANGIBLE ASSETS SCORESHEET 0.00 1.23 0.00 1.23
MANDATORY DISCLOSURE
REQUIREMENTS
Distinguish between internally generated
and other intangible assets 2.88 N.A. 8.64 N.A.
Details of amortisation rates, method and
carrying amount at beginning and end of
period 38.27 N.A. 72.84 N.A.
Classification of intangible assets 36.21 N.A. 69.96 N.A.
Other disclosures like pledging
information, reasons for amortising over
more than 10 years etc 1.23 N.A. 2.88 N.A.
Intangible assets valuation 0.00 38.27 0.00 72.84
91
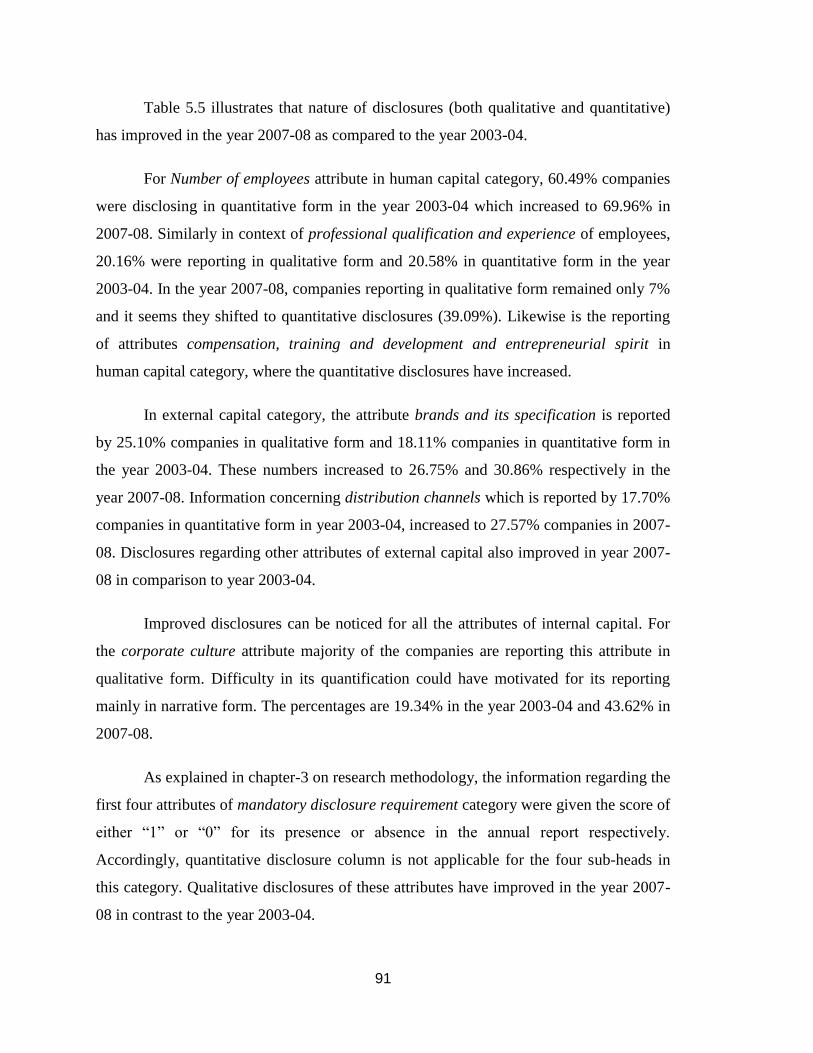
Table 5.5 illustrates that nature of disclosures (both qualitative and quantitative)
has improved in the year 2007-08 as compared to the year 2003-04.
For Number of employees attribute in human capital category, 60.49% companies
were disclosing in quantitative form in the year 2003-04 which increased to 69.96% in
2007-08. Similarly in context of professional qualification and experience of employees,
20.16% were reporting in qualitative form and 20.58% in quantitative form in the year
2003-04. In the year 2007-08, companies reporting in qualitative form remained only 7%
and it seems they shifted to quantitative disclosures (39.09%). Likewise is the reporting
of attributes compensation, training and development and entrepreneurial spirit in
human capital category, where the quantitative disclosures have increased.
In external capital category, the attribute brands and its specification is reported
by 25.10% companies in qualitative form and 18.11% companies in quantitative form in
the year 2003-04. These numbers increased to 26.75% and 30.86% respectively in the
year 2007-08. Information concerning distribution channels which is reported by 17.70%
companies in quantitative form in year 2003-04, increased to 27.57% companies in 2007-
08. Disclosures regarding other attributes of external capital also improved in year 2007-
08 in comparison to year 2003-04.
Improved disclosures can be noticed for all the attributes of internal capital. For
the corporate culture attribute majority of the companies are reporting this attribute in
qualitative form. Difficulty in its quantification could have motivated for its reporting
mainly in narrative form. The percentages are 19.34% in the year 2003-04 and 43.62% in
2007-08.
As explained in chapter-3 on research methodology, the information regarding the
first four attributes of mandatory disclosure requirement category were given the score of
either “1” or “0” for its presence or absence in the annual report respectively.
Accordingly, quantitative disclosure column is not applicable for the four sub-heads in
this category. Qualitative disclosures of these attributes have improved in the year 2007-
08 in contrast to the year 2003-04.
92
Intangible assets valuation information has been provided by almost double the
number of companies in 2007-08 as compared to year 2003-04. While 38.27% companies
were valuing its intangibles in year 2003-04, it increased to 72.84% companies in the
year 2007-08.
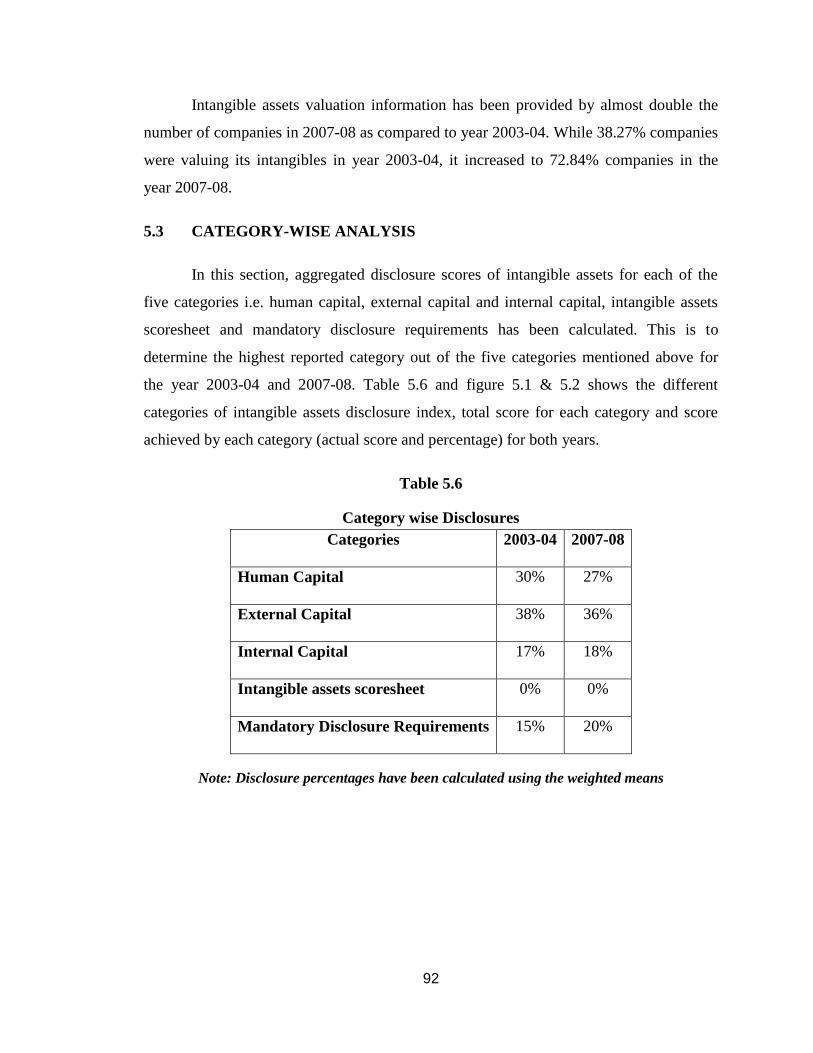
5.3 CATEGORY-WISE ANALYSIS
In this section, aggregated disclosure scores of intangible assets for each of the
five categories i.e. human capital, external capital and internal capital, intangible assets
scoresheet and mandatory disclosure requirements has been calculated. This is to
determine the highest reported category out of the five categories mentioned above for
the year 2003-04 and 2007-08. Table 5.6 and figure 5.1 & 5.2 shows the different
categories of intangible assets disclosure index, total score for each category and score
achieved by each category (actual score and percentage) for both years.
Table 5.6
Category wise Disclosures
Categories 2003-04 2007-08
Human Capital 30% 27%
External Capital 38% 36%
Internal Capital 17% 18%
Intangible assets scoresheet 0% 0%
Mandatory Disclosure Requirements 15% 20%
Note: Disclosure percentages have been calculated using the weighted means
93
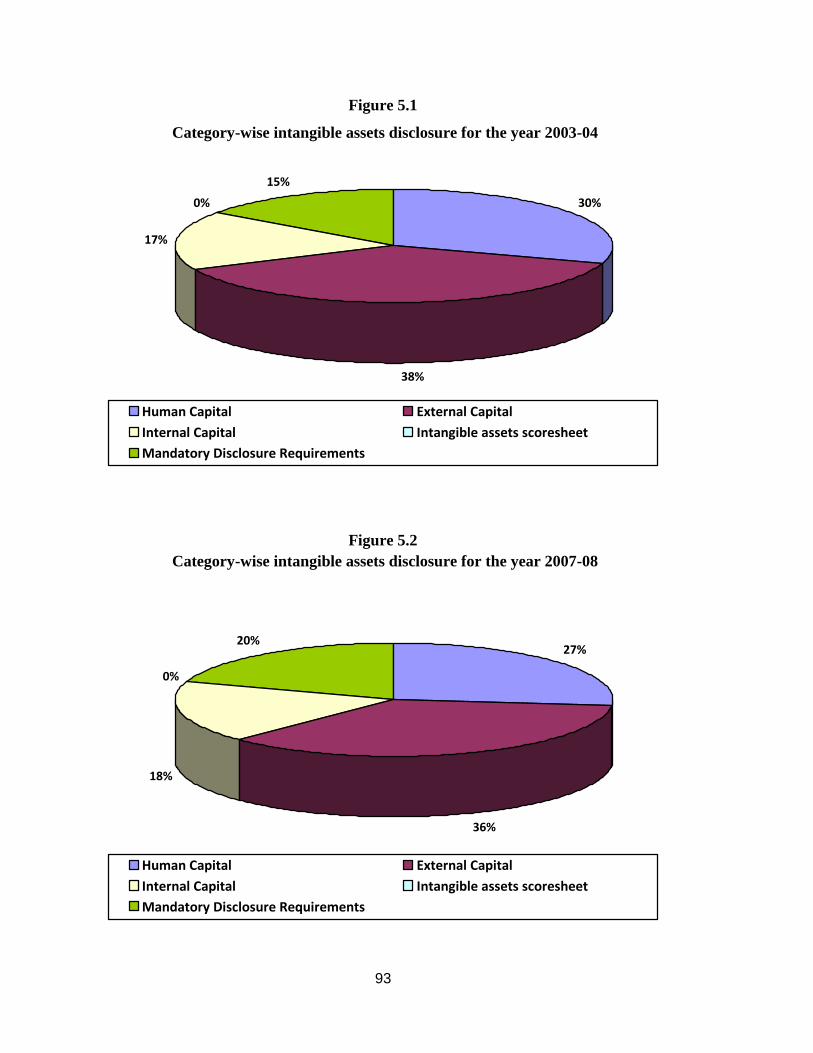
Figure 5.1
Category-wise intangible assets disclosure for the year 2003-04
30%
38%
17%
0%
15%
Human Capital External Capital
Internal Capital Intangible assets scoresheet
Mandatory Disclosure Requirements
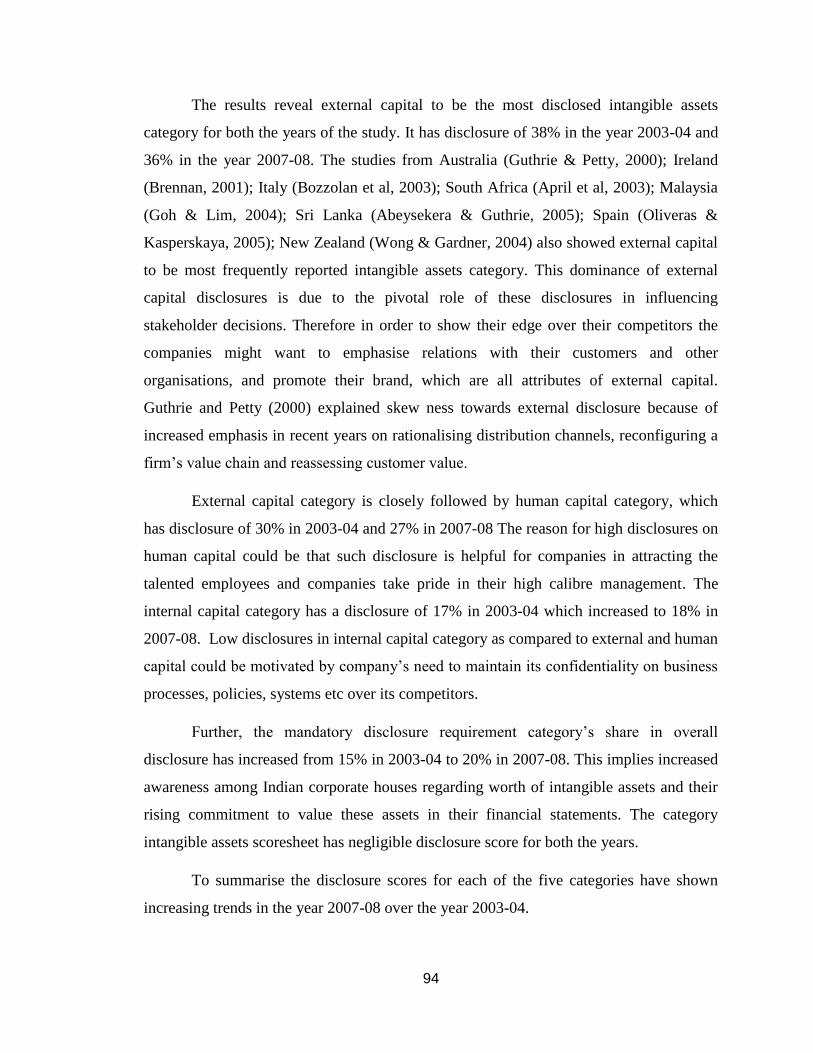
Figure 5.2
Category-wise intangible assets disclosure for the year 2007-08
27%
36%
18%
0%
20%
Human Capital External Capital
Internal Capital Intangible assets scoresheet
Mandatory Disclosure Requirements
94
The results reveal external capital to be the most disclosed intangible assets
category for both the years of the study. It has disclosure of 38% in the year 2003-04 and
36% in the year 2007-08. The studies from Australia (Guthrie & Petty, 2000); Ireland
(Brennan, 2001); Italy (Bozzolan et al, 2003); South Africa (April et al, 2003); Malaysia
(Goh & Lim, 2004); Sri Lanka (Abeysekera & Guthrie, 2005); Spain (Oliveras &
Kasperskaya, 2005); New Zealand (Wong & Gardner, 2004) also showed external capital
to be most frequently reported intangible assets category. This dominance of external
capital disclosures is due to the pivotal role of these disclosures in influencing
stakeholder decisions. Therefore in order to show their edge over their competitors the
companies might want to emphasise relations with their customers and other
organisations, and promote their brand, which are all attributes of external capital.
Guthrie and Petty (2000) explained skew ness towards external disclosure because of
increased emphasis in recent years on rationalising distribution channels, reconfiguring a
firm’s value chain and reassessing customer value.
External capital category is closely followed by human capital category, which
has disclosure of 30% in 2003-04 and 27% in 2007-08 The reason for high disclosures on
human capital could be that such disclosure is helpful for companies in attracting the
talented employees and companies take pride in their high calibre management. The
internal capital category has a disclosure of 17% in 2003-04 which increased to 18% in
2007-08. Low disclosures in internal capital category as compared to external and human
capital could be motivated by company’s need to maintain its confidentiality on business
processes, policies, systems etc over its competitors.
Further, the mandatory disclosure requirement category’s share in overall
disclosure has increased from 15% in 2003-04 to 20% in 2007-08. This implies increased
awareness among Indian corporate houses regarding worth of intangible assets and their
rising commitment to value these assets in their financial statements. The category
intangible assets scoresheet has negligible disclosure score for both the years.
To summarise the disclosure scores for each of the five categories have shown
increasing trends in the year 2007-08 over the year 2003-04.
95
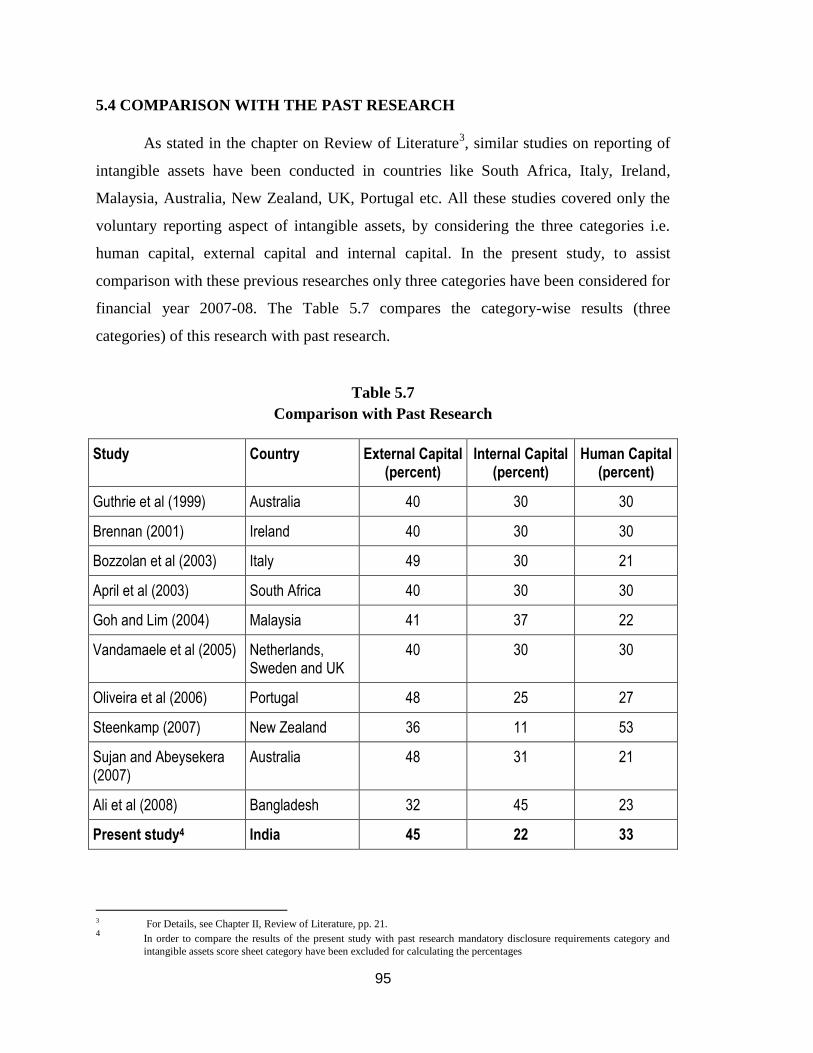
5.4 COMPARISON WITH THE PAST RESEARCH
As stated in the chapter on Review of Literature3, similar studies on reporting of
intangible assets have been conducted in countries like South Africa, Italy, Ireland,
Malaysia, Australia, New Zealand, UK, Portugal etc. All these studies covered only the
voluntary reporting aspect of intangible assets, by considering the three categories i.e.
human capital, external capital and internal capital. In the present study, to assist
comparison with these previous researches only three categories have been considered for
financial year 2007-08. The Table 5.7 compares the category-wise results (three
categories) of this research with past research.
Table 5.7
Comparison with Past Research
Study Country External Capital (percent)
Internal Capital (percent)
Human Capital (percent)
Guthrie et al (1999) Australia 40 30 30
Brennan (2001) Ireland 40 30 30
Bozzolan et al (2003) Italy 49 30 21
April et al (2003) South Africa 40 30 30
Goh and Lim (2004) Malaysia 41 37 22
Vandamaele et al (2005) Netherlands, Sweden and UK
40 30 30
Oliveira et al (2006) Portugal 48 25 27
Steenkamp (2007) New Zealand 36 11 53
Sujan and Abeysekera (2007)
Australia 48 31 21
Ali et al (2008) Bangladesh 32 45 23
Present study4 India 45 22 33
3 For Details, see Chapter II, Review of Literature, pp. 21. 4 In order to compare the results of the present study with past research mandatory disclosure requirements category and
intangible assets score sheet category have been excluded for calculating the percentages
96
As is clear from the table, external capital is the highest reported intangible assets
category for most of the studies. The results drawn from the current study covering
Indian companies also shows external capital as the highest disclosed intangible assets
category followed by human capital and internal capital category. Internal capital is least
reported and this is similar to the study on intellectual capital disclosure conducted in
Portugal (Oliveira et al, 2006) and New Zealand (Steenkamp, 2007).
SECTION-II
5.5 COMPANY- WISE ANALYSIS
The company-wise disclosure score has been calculated by dividing the total
weighted disclosure index score obtained by a company during a particular year by the
maximum score for the company (which is 54).The disclosure score has been calculated
in percentages so as to make the disclosure of the companies comparable.
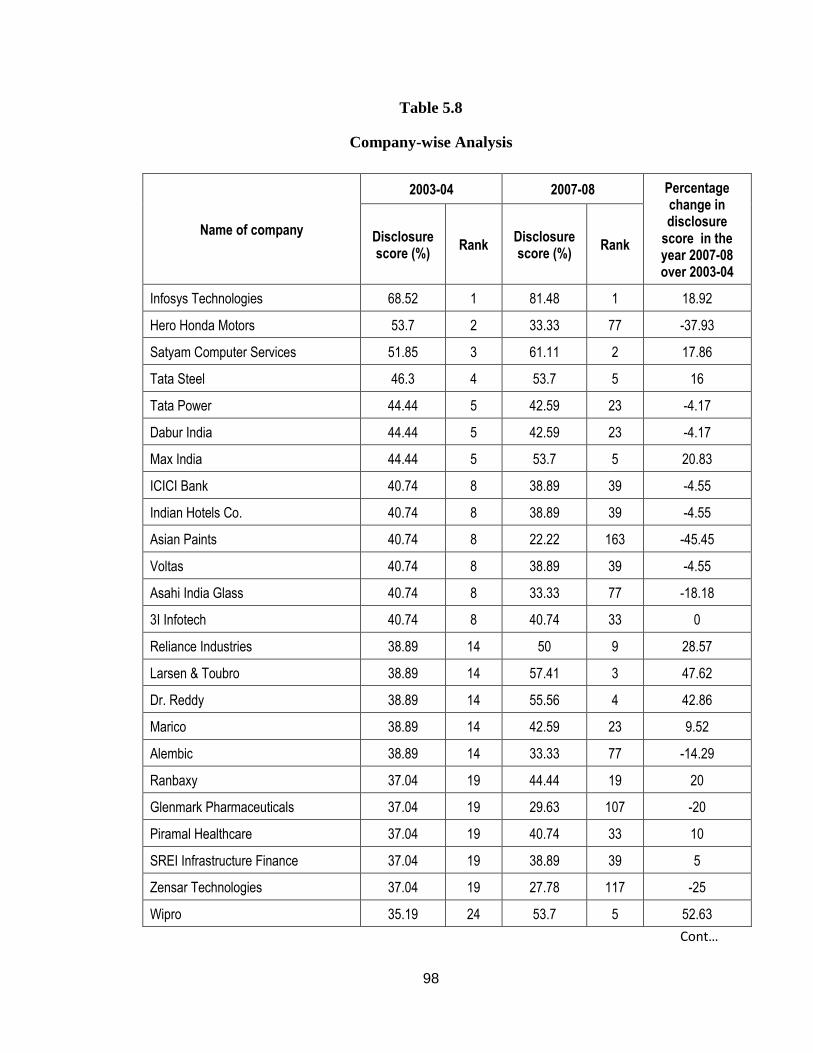
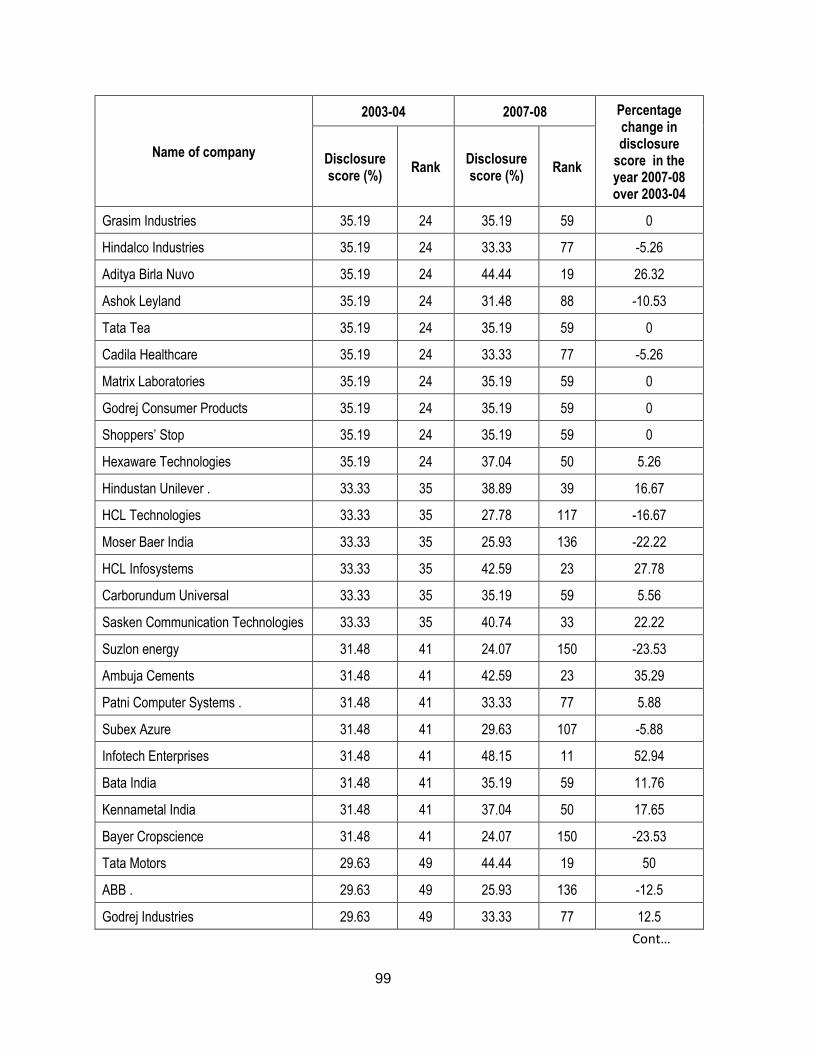
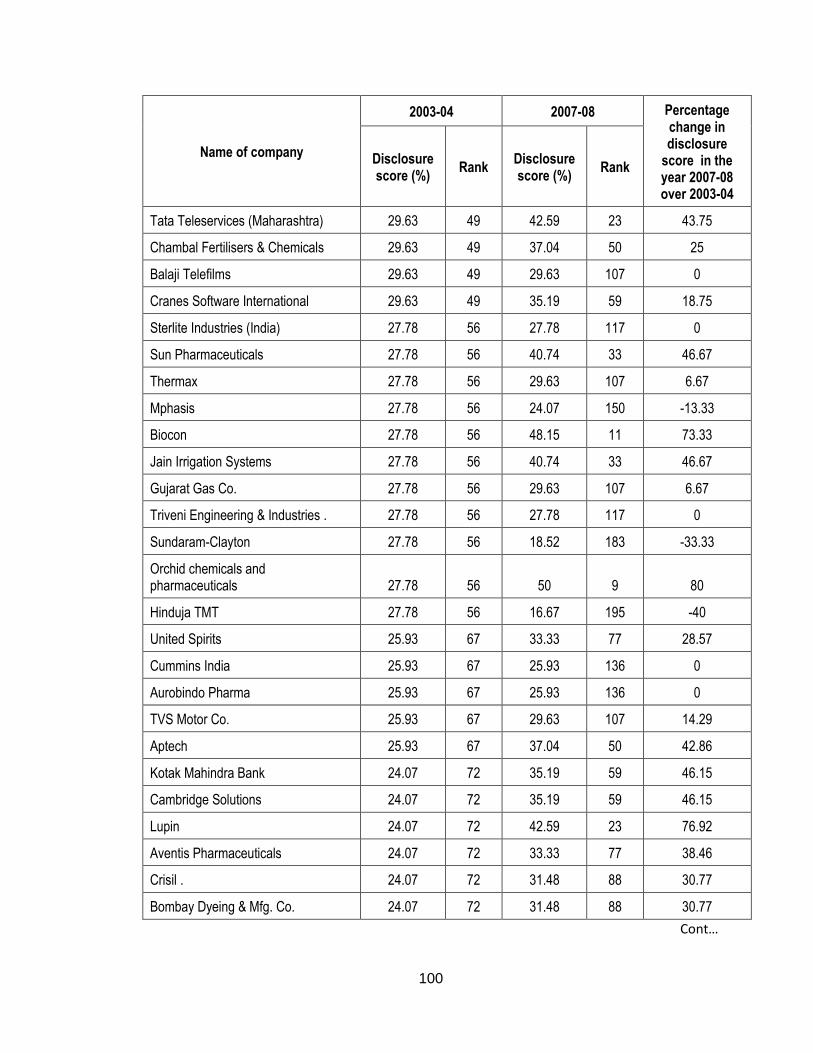
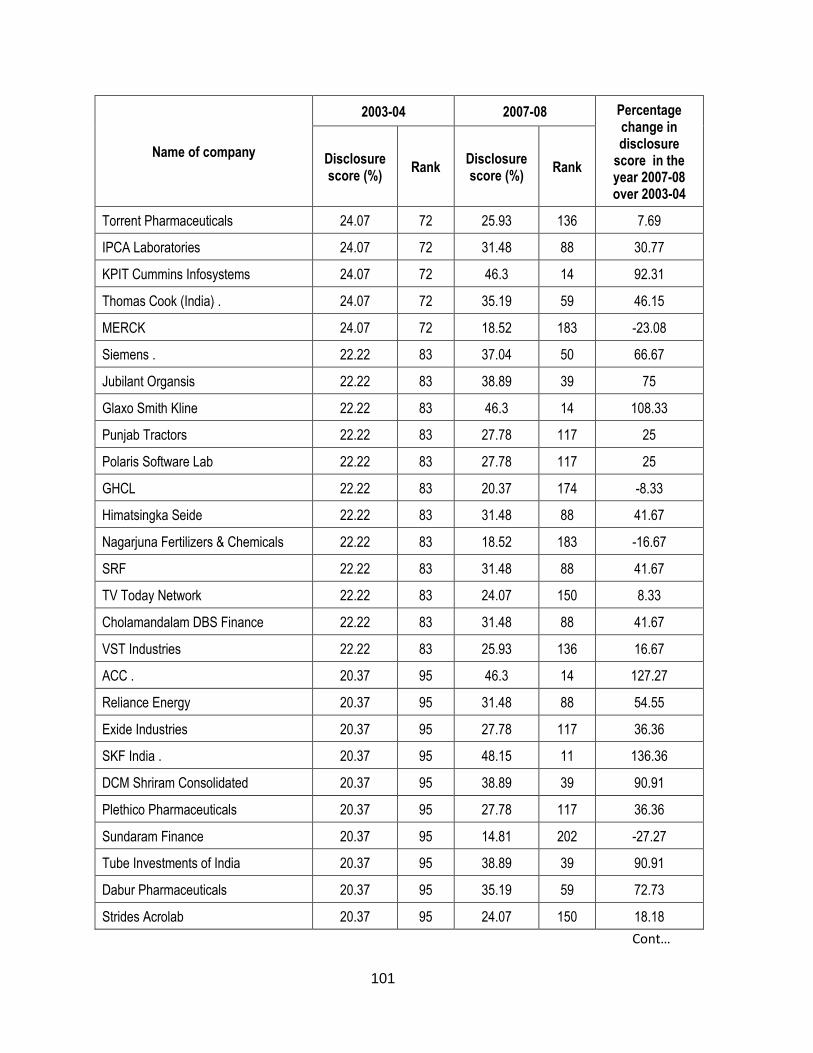
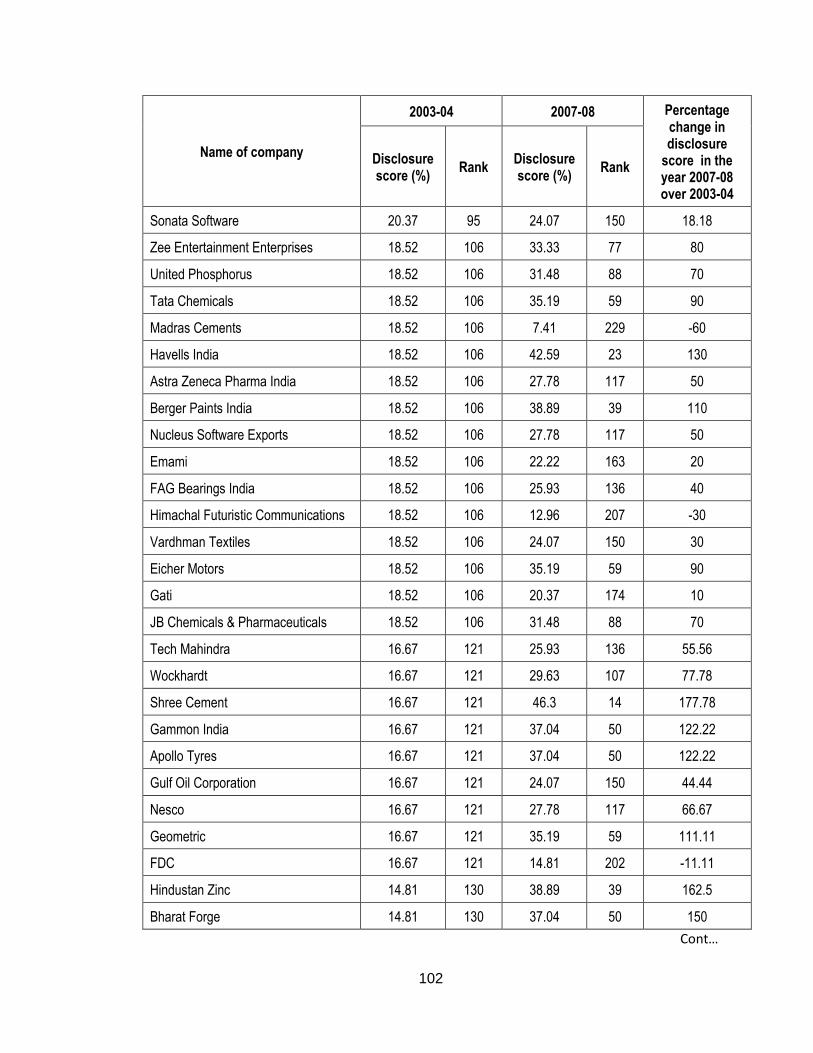
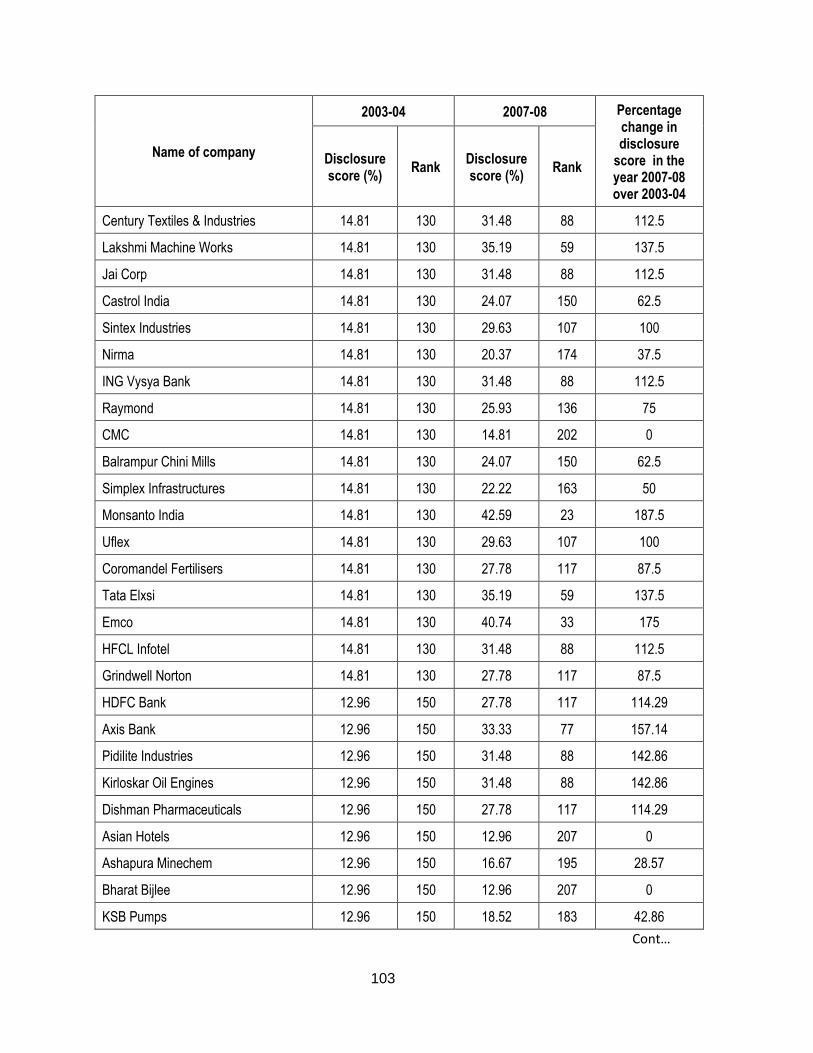
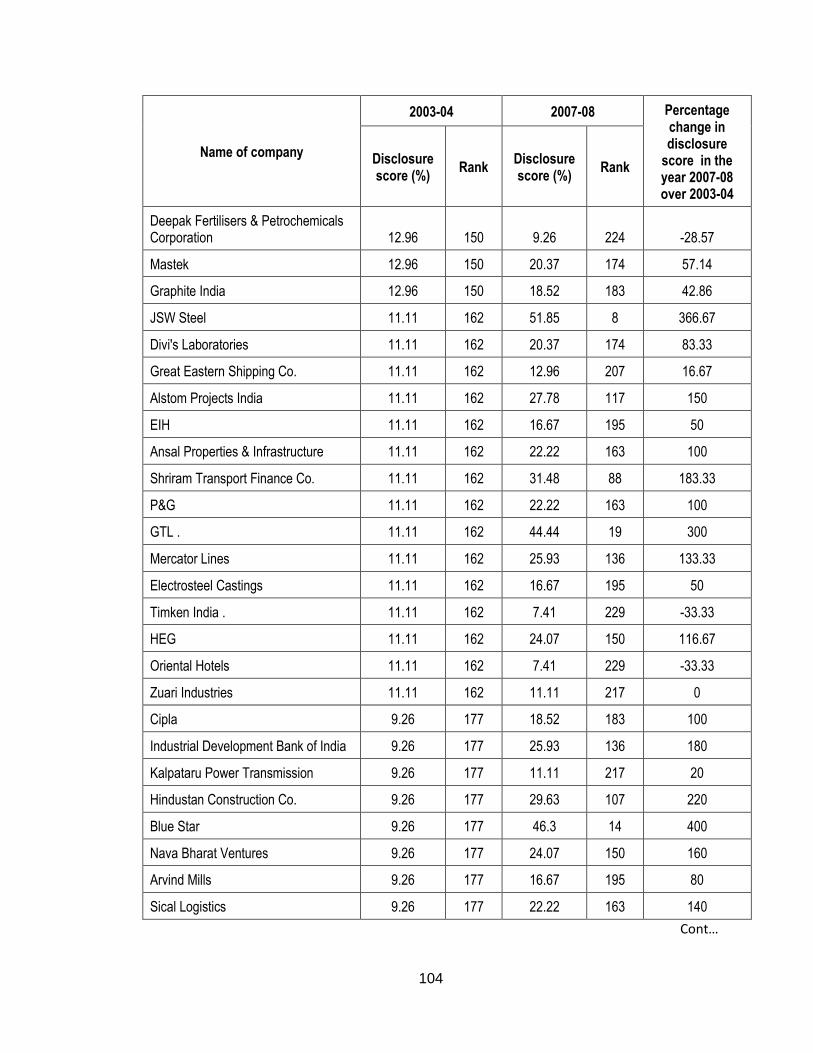
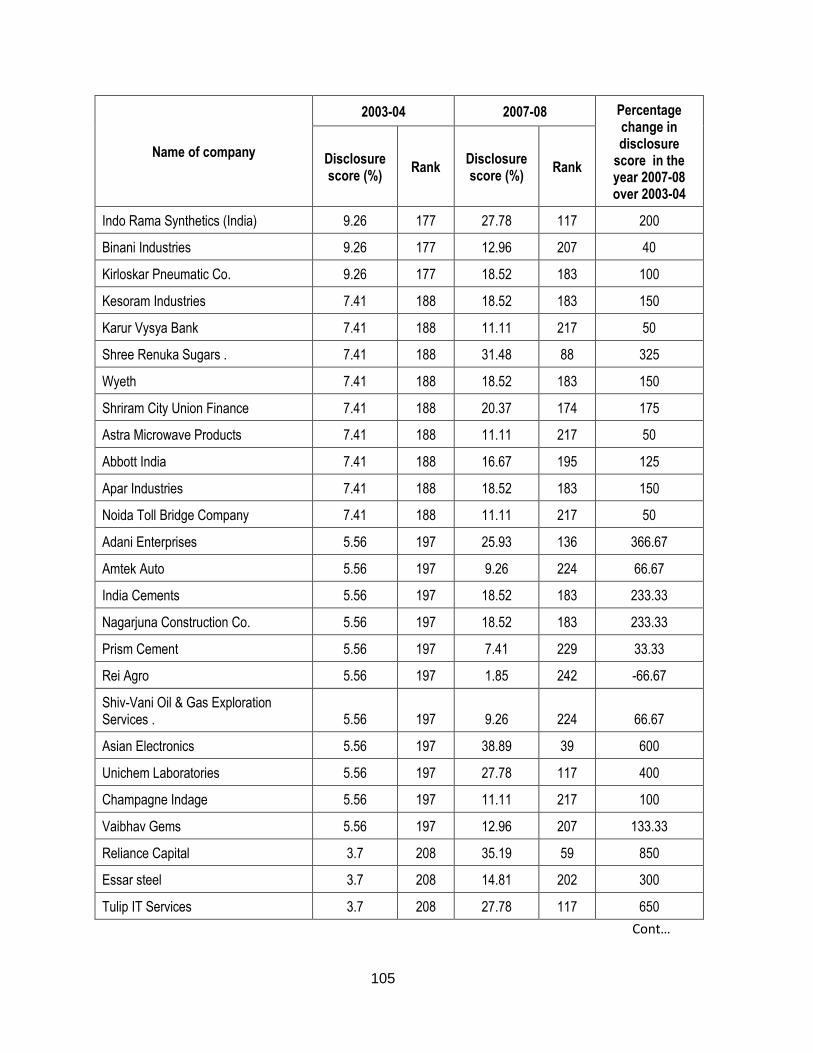
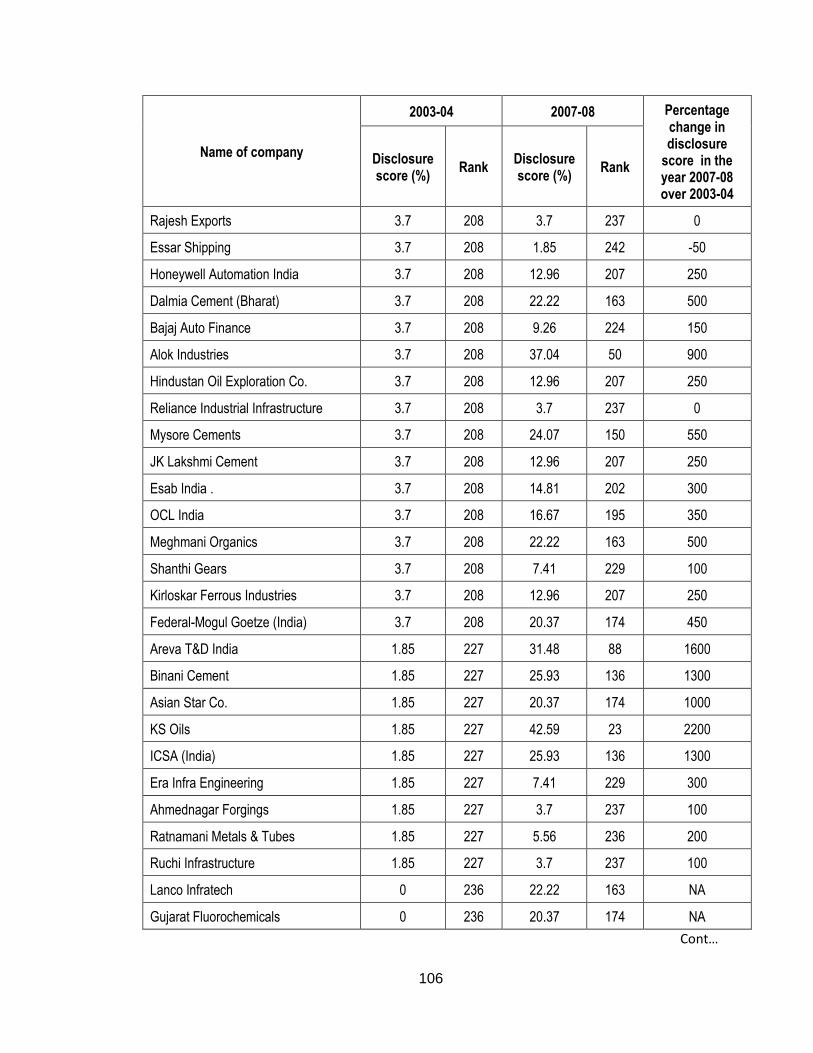
Table 5.8 explains the company-wise disclosure of intangible assets for the years
2003-04 and 2007-08 respectively. The companies have been ranked in the descending
order of their 2003-04 disclosure score. The respective 2007-08 scores have been
mentioned corresponding to their 2003-04 scorecard.
An analysis of this table reveals that disclosure score has improved in case of 191
companies decreased in case of 35 companies and remained constant for 17 companies
in the year 2003-04 and 2007-08.
Infosys Technologies Ltd. occupies highest position in intangible assets disclosure
for both years of the study. The company’s disclosure score of 68.52% in the year 2003-
04 has increased to 81.48% in the year 2007-08. The highest disclosure maintained by
Infosys Technologies Ltd. (68.52) is followed by Hero Honda Motors Ltd (53.70),
Satyam Computer Services Ltd. (51.85%), Tata Steel Ltd. (46.30%) Tata Power Ltd.
(44.44%), Dabur India Ltd. (44.44%), Max India Ltd. (44.44%), ICICI Bank Ltd.
(40.74%). Indian Hotels Co Ltd , Asian Paints Ltd., Voltas Ltd. , Asahi India Glass Ltd ,
3i Infotech Ltd., Reliance Industries Ltd. (38.89%), Larsen and Toubro Ltd., Dr. Reddy
Ltd., Marico Ltd., Alembic Pharmaceuticals Ltd., Ranbaxy Ltd. ( 37.04%) for the year
2003-04.
97
A wide variation can be observed in the disclosure scores of companies for the
year 2007-08 over the year 2003-04. Table 5.6 exhibits that the highest disclosure score
has been achieved by Infosys Technologies Ltd. (81.48%) is followed by Satyam
Computer Services Ltd. ( 61.11%), Larsen and Toubro Ltd. ( 57.41%), Dr. Reddy Ltd.
(55.56%), Tata Steel Ltd (53.70), Max India Ltd., Wipro Ltd., JSW Steel Ltd. (51.85%),
Orchid Chemicals & Pharmaceuticals Ltd. ( 50%), Reliance Industries Ltd., SKF India
Ltd. (48.15%), ACC Ltd. (46.30%), Glaxosmithkline Ltd., KPIT Cummins Infosystems
Ltd. for the year 2007-08.
The table 5.8 also highlights that Infosys Technologies Ltd., Satyam Computer
services Ltd., Tata Steel Ltd., Max India Ltd., Reliance Industries Ltd., Larsen and
Toubro Ltd., Dr. Reddy Ltd., Wipro Ltd. are among top 10 companies, for disclosing
their intangible assets for the years 2003-04 as well as 2007-08.
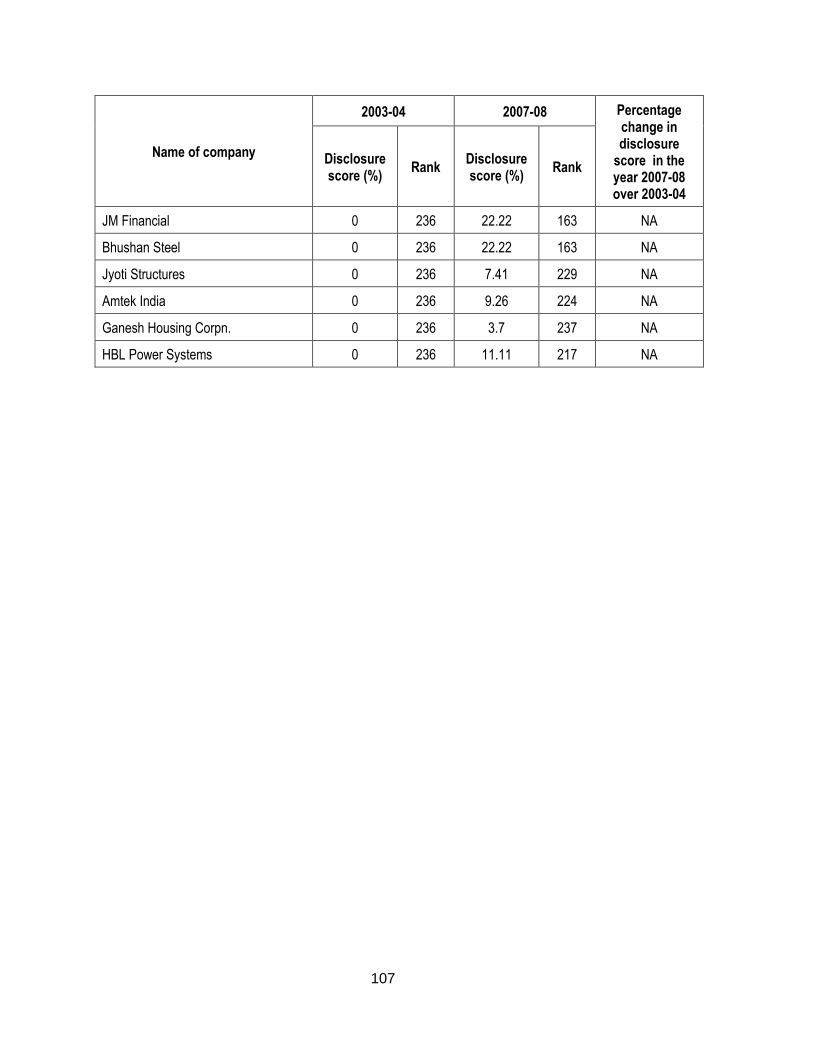
HBL Power Systems Ltd., Ganesh Housing Corporation Ltd., Amtek Auto Ltd.,
Jyoti Structures Ltd., Bhushan Steel Ltd., JM Financial Ltd., Gujurat Fluorochemicals
Ltd., Lanco Infratech Ltd. have zero disclosure score for the year 2003-04. The disclosure
score for these companies significantly improved upto 22.22% in the year 2007-08.
The companies having least disclosure score for the year 2007-08 are Rei agro
Ltd.( 1.85%), Essar Shipping Ltd. (1.85%), Rajesh Exports Ltd. (3.7%), Reliance
Industrial Infrastructure Ltd., Ahmednagar Forgings Ltd., Ruchi Infrastructure Ltd.,
Ganesh Housing corporation Ltd., Ratnamani Metals & Tubes Ltd (5.56%), Madras
Cements Ltd. (7.41%), Timken India Ltd., Oriental Hotels Ltd., Prism Cement Ltd.,
Shanthi Gears Ltd., Era Infra Engineering Ltd., Jyoti Structures Ltd., Deepak Fertilisers
& Petrochemicals Corporation Ltd. (9.26%). However, none of the companies have zero
disclosure score for the year 2007-08.
98
Table 5.8
Company-wise Analysis
Name of company
2003-04 2007-08 Percentage change in disclosure
score in the year 2007-08 over 2003-04
Disclosure score (%)
Rank Disclosure score (%)
Rank
Infosys Technologies 68.52 1 81.48 1 18.92
Hero Honda Motors 53.7 2 33.33 77 -37.93
Satyam Computer Services 51.85 3 61.11 2 17.86
Tata Steel 46.3 4 53.7 5 16
Tata Power 44.44 5 42.59 23 -4.17
Dabur India 44.44 5 42.59 23 -4.17
Max India 44.44 5 53.7 5 20.83
ICICI Bank 40.74 8 38.89 39 -4.55
Indian Hotels Co. 40.74 8 38.89 39 -4.55
Asian Paints 40.74 8 22.22 163 -45.45
Voltas 40.74 8 38.89 39 -4.55
Asahi India Glass 40.74 8 33.33 77 -18.18
3I Infotech 40.74 8 40.74 33 0
Reliance Industries 38.89 14 50 9 28.57
Larsen & Toubro 38.89 14 57.41 3 47.62
Dr. Reddy 38.89 14 55.56 4 42.86
Marico 38.89 14 42.59 23 9.52
Alembic 38.89 14 33.33 77 -14.29
Ranbaxy 37.04 19 44.44 19 20
Glenmark Pharmaceuticals 37.04 19 29.63 107 -20
Piramal Healthcare 37.04 19 40.74 33 10
SREI Infrastructure Finance 37.04 19 38.89 39 5
Zensar Technologies 37.04 19 27.78 117 -25
Wipro 35.19 24 53.7 5 52.63
Cont…
99
Name of company
2003-04 2007-08 Percentage change in disclosure
score in the year 2007-08 over 2003-04
Disclosure score (%)
Rank Disclosure score (%)
Rank
Grasim Industries 35.19 24 35.19 59 0
Hindalco Industries 35.19 24 33.33 77 -5.26
Aditya Birla Nuvo 35.19 24 44.44 19 26.32
Ashok Leyland 35.19 24 31.48 88 -10.53
Tata Tea 35.19 24 35.19 59 0
Cadila Healthcare 35.19 24 33.33 77 -5.26
Matrix Laboratories 35.19 24 35.19 59 0
Godrej Consumer Products 35.19 24 35.19 59 0
Shoppers’ Stop 35.19 24 35.19 59 0
Hexaware Technologies 35.19 24 37.04 50 5.26
Hindustan Unilever . 33.33 35 38.89 39 16.67
HCL Technologies 33.33 35 27.78 117 -16.67
Moser Baer India 33.33 35 25.93 136 -22.22
HCL Infosystems 33.33 35 42.59 23 27.78
Carborundum Universal 33.33 35 35.19 59 5.56
Sasken Communication Technologies 33.33 35 40.74 33 22.22
Suzlon energy 31.48 41 24.07 150 -23.53
Ambuja Cements 31.48 41 42.59 23 35.29
Patni Computer Systems . 31.48 41 33.33 77 5.88
Subex Azure 31.48 41 29.63 107 -5.88
Infotech Enterprises 31.48 41 48.15 11 52.94
Bata India 31.48 41 35.19 59 11.76
Kennametal India 31.48 41 37.04 50 17.65
Bayer Cropscience 31.48 41 24.07 150 -23.53
Tata Motors 29.63 49 44.44 19 50
ABB . 29.63 49 25.93 136 -12.5
Godrej Industries 29.63 49 33.33 77 12.5
Cont…
100
Name of company
2003-04 2007-08 Percentage change in disclosure
score in the year 2007-08 over 2003-04
Disclosure score (%)
Rank Disclosure score (%)
Rank
Tata Teleservices (Maharashtra) 29.63 49 42.59 23 43.75
Chambal Fertilisers & Chemicals 29.63 49 37.04 50 25
Balaji Telefilms 29.63 49 29.63 107 0
Cranes Software International 29.63 49 35.19 59 18.75
Sterlite Industries (India) 27.78 56 27.78 117 0
Sun Pharmaceuticals 27.78 56 40.74 33 46.67
Thermax 27.78 56 29.63 107 6.67
Mphasis 27.78 56 24.07 150 -13.33
Biocon 27.78 56 48.15 11 73.33
Jain Irrigation Systems 27.78 56 40.74 33 46.67
Gujarat Gas Co. 27.78 56 29.63 107 6.67
Triveni Engineering & Industries . 27.78 56 27.78 117 0
Sundaram-Clayton 27.78 56 18.52 183 -33.33
Orchid chemicals and pharmaceuticals 27.78 56 50 9 80
Hinduja TMT 27.78 56 16.67 195 -40
United Spirits 25.93 67 33.33 77 28.57
Cummins India 25.93 67 25.93 136 0
Aurobindo Pharma 25.93 67 25.93 136 0
TVS Motor Co. 25.93 67 29.63 107 14.29
Aptech 25.93 67 37.04 50 42.86
Kotak Mahindra Bank 24.07 72 35.19 59 46.15
Cambridge Solutions 24.07 72 35.19 59 46.15
Lupin 24.07 72 42.59 23 76.92
Aventis Pharmaceuticals 24.07 72 33.33 77 38.46
Crisil . 24.07 72 31.48 88 30.77
Bombay Dyeing & Mfg. Co. 24.07 72 31.48 88 30.77
Cont…
101
Name of company
2003-04 2007-08 Percentage change in disclosure
score in the year 2007-08 over 2003-04
Disclosure score (%)
Rank Disclosure score (%)
Rank
Torrent Pharmaceuticals 24.07 72 25.93 136 7.69
IPCA Laboratories 24.07 72 31.48 88 30.77
KPIT Cummins Infosystems 24.07 72 46.3 14 92.31
Thomas Cook (India) . 24.07 72 35.19 59 46.15
MERCK 24.07 72 18.52 183 -23.08
Siemens . 22.22 83 37.04 50 66.67
Jubilant Organsis 22.22 83 38.89 39 75
Glaxo Smith Kline 22.22 83 46.3 14 108.33
Punjab Tractors 22.22 83 27.78 117 25
Polaris Software Lab 22.22 83 27.78 117 25
GHCL 22.22 83 20.37 174 -8.33
Himatsingka Seide 22.22 83 31.48 88 41.67
Nagarjuna Fertilizers & Chemicals 22.22 83 18.52 183 -16.67
SRF 22.22 83 31.48 88 41.67
TV Today Network 22.22 83 24.07 150 8.33
Cholamandalam DBS Finance 22.22 83 31.48 88 41.67
VST Industries 22.22 83 25.93 136 16.67
ACC . 20.37 95 46.3 14 127.27
Reliance Energy 20.37 95 31.48 88 54.55
Exide Industries 20.37 95 27.78 117 36.36
SKF India . 20.37 95 48.15 11 136.36
DCM Shriram Consolidated 20.37 95 38.89 39 90.91
Plethico Pharmaceuticals 20.37 95 27.78 117 36.36
Sundaram Finance 20.37 95 14.81 202 -27.27
Tube Investments of India 20.37 95 38.89 39 90.91
Dabur Pharmaceuticals 20.37 95 35.19 59 72.73
Strides Acrolab 20.37 95 24.07 150 18.18
Cont…
102
Name of company
2003-04 2007-08 Percentage change in disclosure
score in the year 2007-08 over 2003-04
Disclosure score (%)
Rank Disclosure score (%)
Rank
Sonata Software 20.37 95 24.07 150 18.18
Zee Entertainment Enterprises 18.52 106 33.33 77 80
United Phosphorus 18.52 106 31.48 88 70
Tata Chemicals 18.52 106 35.19 59 90
Madras Cements 18.52 106 7.41 229 -60
Havells India 18.52 106 42.59 23 130
Astra Zeneca Pharma India 18.52 106 27.78 117 50
Berger Paints India 18.52 106 38.89 39 110
Nucleus Software Exports 18.52 106 27.78 117 50
Emami 18.52 106 22.22 163 20
FAG Bearings India 18.52 106 25.93 136 40
Himachal Futuristic Communications 18.52 106 12.96 207 -30
Vardhman Textiles 18.52 106 24.07 150 30
Eicher Motors 18.52 106 35.19 59 90
Gati 18.52 106 20.37 174 10
JB Chemicals & Pharmaceuticals 18.52 106 31.48 88 70
Tech Mahindra 16.67 121 25.93 136 55.56
Wockhardt 16.67 121 29.63 107 77.78
Shree Cement 16.67 121 46.3 14 177.78
Gammon India 16.67 121 37.04 50 122.22
Apollo Tyres 16.67 121 37.04 50 122.22
Gulf Oil Corporation 16.67 121 24.07 150 44.44
Nesco 16.67 121 27.78 117 66.67
Geometric 16.67 121 35.19 59 111.11
FDC 16.67 121 14.81 202 -11.11
Hindustan Zinc 14.81 130 38.89 39 162.5
Bharat Forge 14.81 130 37.04 50 150
Cont…
103
Name of company
2003-04 2007-08 Percentage change in disclosure
score in the year 2007-08 over 2003-04
Disclosure score (%)
Rank Disclosure score (%)
Rank
Century Textiles & Industries 14.81 130 31.48 88 112.5
Lakshmi Machine Works 14.81 130 35.19 59 137.5
Jai Corp 14.81 130 31.48 88 112.5
Castrol India 14.81 130 24.07 150 62.5
Sintex Industries 14.81 130 29.63 107 100
Nirma 14.81 130 20.37 174 37.5
ING Vysya Bank 14.81 130 31.48 88 112.5
Raymond 14.81 130 25.93 136 75
CMC 14.81 130 14.81 202 0
Balrampur Chini Mills 14.81 130 24.07 150 62.5
Simplex Infrastructures 14.81 130 22.22 163 50
Monsanto India 14.81 130 42.59 23 187.5
Uflex 14.81 130 29.63 107 100
Coromandel Fertilisers 14.81 130 27.78 117 87.5
Tata Elxsi 14.81 130 35.19 59 137.5
Emco 14.81 130 40.74 33 175
HFCL Infotel 14.81 130 31.48 88 112.5
Grindwell Norton 14.81 130 27.78 117 87.5
HDFC Bank 12.96 150 27.78 117 114.29
Axis Bank 12.96 150 33.33 77 157.14
Pidilite Industries 12.96 150 31.48 88 142.86
Kirloskar Oil Engines 12.96 150 31.48 88 142.86
Dishman Pharmaceuticals 12.96 150 27.78 117 114.29
Asian Hotels 12.96 150 12.96 207 0
Ashapura Minechem 12.96 150 16.67 195 28.57
Bharat Bijlee 12.96 150 12.96 207 0
KSB Pumps 12.96 150 18.52 183 42.86
Cont…
104
Name of company
2003-04 2007-08 Percentage change in disclosure
score in the year 2007-08 over 2003-04
Disclosure score (%)
Rank Disclosure score (%)
Rank
Deepak Fertilisers & Petrochemicals Corporation 12.96 150 9.26 224 -28.57
Mastek 12.96 150 20.37 174 57.14
Graphite India 12.96 150 18.52 183 42.86
JSW Steel 11.11 162 51.85 8 366.67
Divi's Laboratories 11.11 162 20.37 174 83.33
Great Eastern Shipping Co. 11.11 162 12.96 207 16.67
Alstom Projects India 11.11 162 27.78 117 150
EIH 11.11 162 16.67 195 50
Ansal Properties & Infrastructure 11.11 162 22.22 163 100
Shriram Transport Finance Co. 11.11 162 31.48 88 183.33
P&G 11.11 162 22.22 163 100
GTL . 11.11 162 44.44 19 300
Mercator Lines 11.11 162 25.93 136 133.33
Electrosteel Castings 11.11 162 16.67 195 50
Timken India . 11.11 162 7.41 229 -33.33
HEG 11.11 162 24.07 150 116.67
Oriental Hotels 11.11 162 7.41 229 -33.33
Zuari Industries 11.11 162 11.11 217 0
Cipla 9.26 177 18.52 183 100
Industrial Development Bank of India 9.26 177 25.93 136 180
Kalpataru Power Transmission 9.26 177 11.11 217 20
Hindustan Construction Co. 9.26 177 29.63 107 220
Blue Star 9.26 177 46.3 14 400
Nava Bharat Ventures 9.26 177 24.07 150 160
Arvind Mills 9.26 177 16.67 195 80
Sical Logistics 9.26 177 22.22 163 140
Cont…
105
Name of company
2003-04 2007-08 Percentage change in disclosure
score in the year 2007-08 over 2003-04
Disclosure score (%)
Rank Disclosure score (%)
Rank
Indo Rama Synthetics (India) 9.26 177 27.78 117 200
Binani Industries 9.26 177 12.96 207 40
Kirloskar Pneumatic Co. 9.26 177 18.52 183 100
Kesoram Industries 7.41 188 18.52 183 150
Karur Vysya Bank 7.41 188 11.11 217 50
Shree Renuka Sugars . 7.41 188 31.48 88 325
Wyeth 7.41 188 18.52 183 150
Shriram City Union Finance 7.41 188 20.37 174 175
Astra Microwave Products 7.41 188 11.11 217 50
Abbott India 7.41 188 16.67 195 125
Apar Industries 7.41 188 18.52 183 150
Noida Toll Bridge Company 7.41 188 11.11 217 50
Adani Enterprises 5.56 197 25.93 136 366.67
Amtek Auto 5.56 197 9.26 224 66.67
India Cements 5.56 197 18.52 183 233.33
Nagarjuna Construction Co. 5.56 197 18.52 183 233.33
Prism Cement 5.56 197 7.41 229 33.33
Rei Agro 5.56 197 1.85 242 -66.67
Shiv-Vani Oil & Gas Exploration Services . 5.56 197 9.26 224 66.67
Asian Electronics 5.56 197 38.89 39 600
Unichem Laboratories 5.56 197 27.78 117 400
Champagne Indage 5.56 197 11.11 217 100
Vaibhav Gems 5.56 197 12.96 207 133.33
Reliance Capital 3.7 208 35.19 59 850
Essar steel 3.7 208 14.81 202 300
Tulip IT Services 3.7 208 27.78 117 650
Cont…
106
Name of company
2003-04 2007-08 Percentage change in disclosure
score in the year 2007-08 over 2003-04
Disclosure score (%)
Rank Disclosure score (%)
Rank
Rajesh Exports 3.7 208 3.7 237 0
Essar Shipping 3.7 208 1.85 242 -50
Honeywell Automation India 3.7 208 12.96 207 250
Dalmia Cement (Bharat) 3.7 208 22.22 163 500
Bajaj Auto Finance 3.7 208 9.26 224 150
Alok Industries 3.7 208 37.04 50 900
Hindustan Oil Exploration Co. 3.7 208 12.96 207 250
Reliance Industrial Infrastructure 3.7 208 3.7 237 0
Mysore Cements 3.7 208 24.07 150 550
JK Lakshmi Cement 3.7 208 12.96 207 250
Esab India . 3.7 208 14.81 202 300
OCL India 3.7 208 16.67 195 350
Meghmani Organics 3.7 208 22.22 163 500
Shanthi Gears 3.7 208 7.41 229 100
Kirloskar Ferrous Industries 3.7 208 12.96 207 250
Federal-Mogul Goetze (India) 3.7 208 20.37 174 450
Areva T&D India 1.85 227 31.48 88 1600
Binani Cement 1.85 227 25.93 136 1300
Asian Star Co. 1.85 227 20.37 174 1000
KS Oils 1.85 227 42.59 23 2200
ICSA (India) 1.85 227 25.93 136 1300
Era Infra Engineering 1.85 227 7.41 229 300
Ahmednagar Forgings 1.85 227 3.7 237 100
Ratnamani Metals & Tubes 1.85 227 5.56 236 200
Ruchi Infrastructure 1.85 227 3.7 237 100
Lanco Infratech 0 236 22.22 163 NA
Gujarat Fluorochemicals 0 236 20.37 174 NA
Cont…
107
Name of company
2003-04 2007-08 Percentage change in disclosure
score in the year 2007-08 over 2003-04
Disclosure score (%)
Rank Disclosure score (%)
Rank
JM Financial 0 236 22.22 163 NA
Bhushan Steel 0 236 22.22 163 NA
Jyoti Structures 0 236 7.41 229 NA
Amtek India 0 236 9.26 224 NA
Ganesh Housing Corpn. 0 236 3.7 237 NA
HBL Power Systems 0 236 11.11 217 NA
108
The above table reveals that the range of disclosure score of the companies varies
from zero to 68.52% for the year 2003-04 and from 1.85% to 81.48% for the year 2007-
08. Infosys Technologies has occupied first position for both years of the study. Infosys
Technologies was the first Indian company to incorporate additional disclosures like
Intangible assets Scoresheet, Brand Valuation, Human Resource Accounting in its annual
reports.
Most of the intangible assets information is given in Management Discussion and
Analysis section of annual report.
In addition to the above, the average number of attributes reported per company
(total number of attributes reported by sample companies divided by total number of
companies) is 7 in the year 2003-04 and 10 in the year 2007-08. Also the maximum and
the minimum number of attributes reported for any one company is 23 & 0 for the year
2003-04 and 26 & 1 for the year 2007-08 respectively
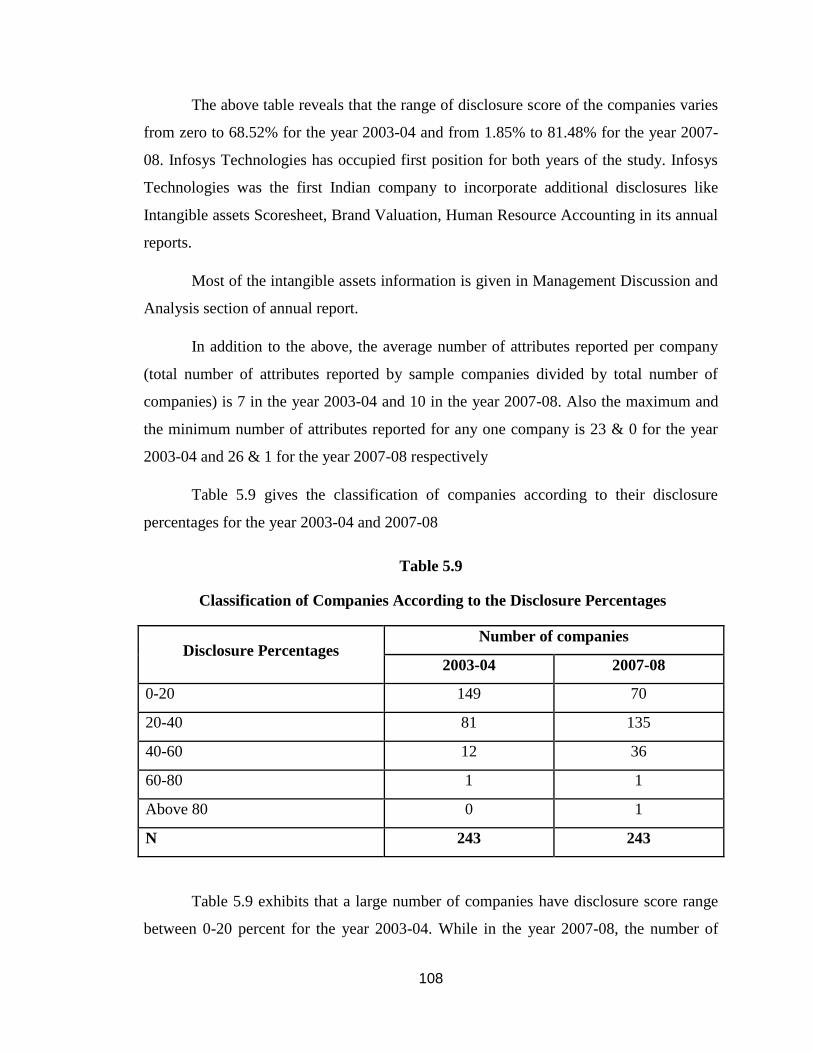
Table 5.9 gives the classification of companies according to their disclosure
percentages for the year 2003-04 and 2007-08
Table 5.9
Classification of Companies According to the Disclosure Percentages
Disclosure Percentages Number of companies
2003-04 2007-08
0-20 149 70
20-40 81 135
40-60 12 36
60-80 1 1
Above 80 0 1
N 243 243
Table 5.9 exhibits that a large number of companies have disclosure score range
between 0-20 percent for the year 2003-04. While in the year 2007-08, the number of
109
companies having disclosure score range between 0-20 percent has declined and shifted
to higher disclosure score range of 20-40 percent. The companies whose disclosure score
remarkably improved in the year 2007-08 over the year 2003-04 are KS Oils ltd (1.85%
to 42.59%), ICSA ltd ( 1.85% to 25.93%), Binani Cement (1.85% to 25.93%), Asian Star
Co. (1.85% to 20.37%) etc. This shift marks the companies’ consistent efforts to improve
their intangible assets disclosures.
Table 5.9 also exhibits that number of companies disclosing within the range of
40-60 percent have also increased from 12 to 36. While none of the companies is
disclosing in “above 80” range in the year 2003-04, Infosys Technologies is the first
company to break into this range for the year 2007-08.
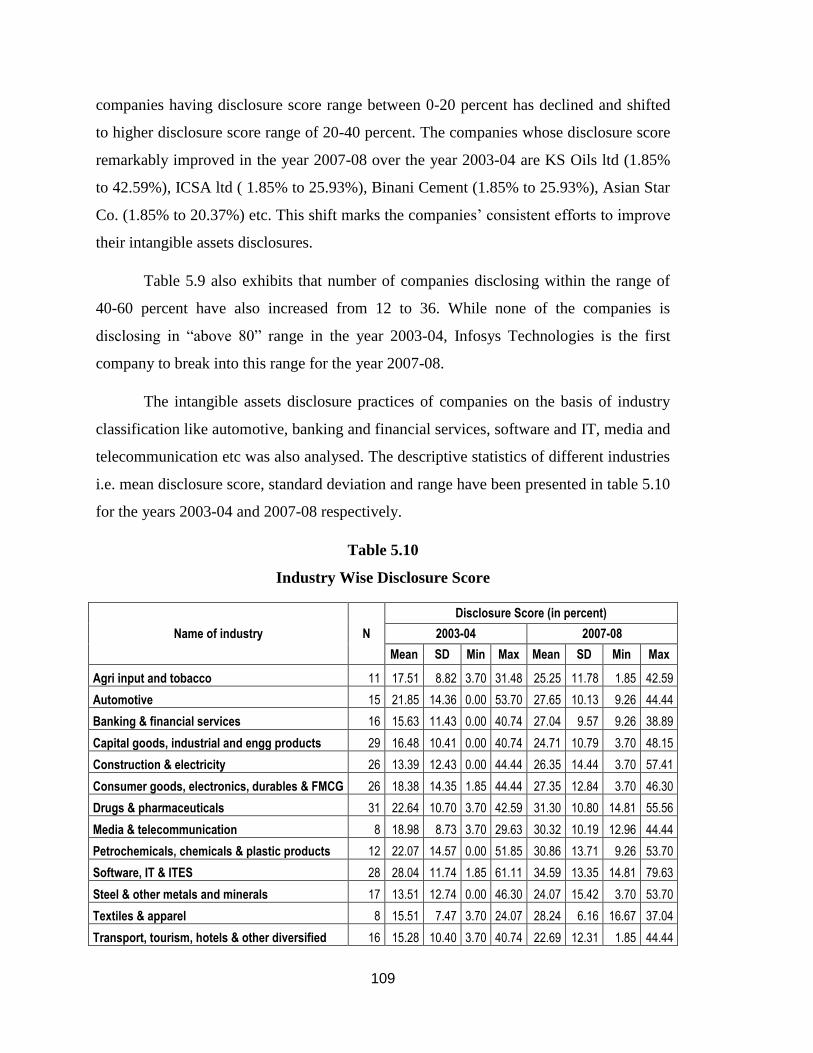
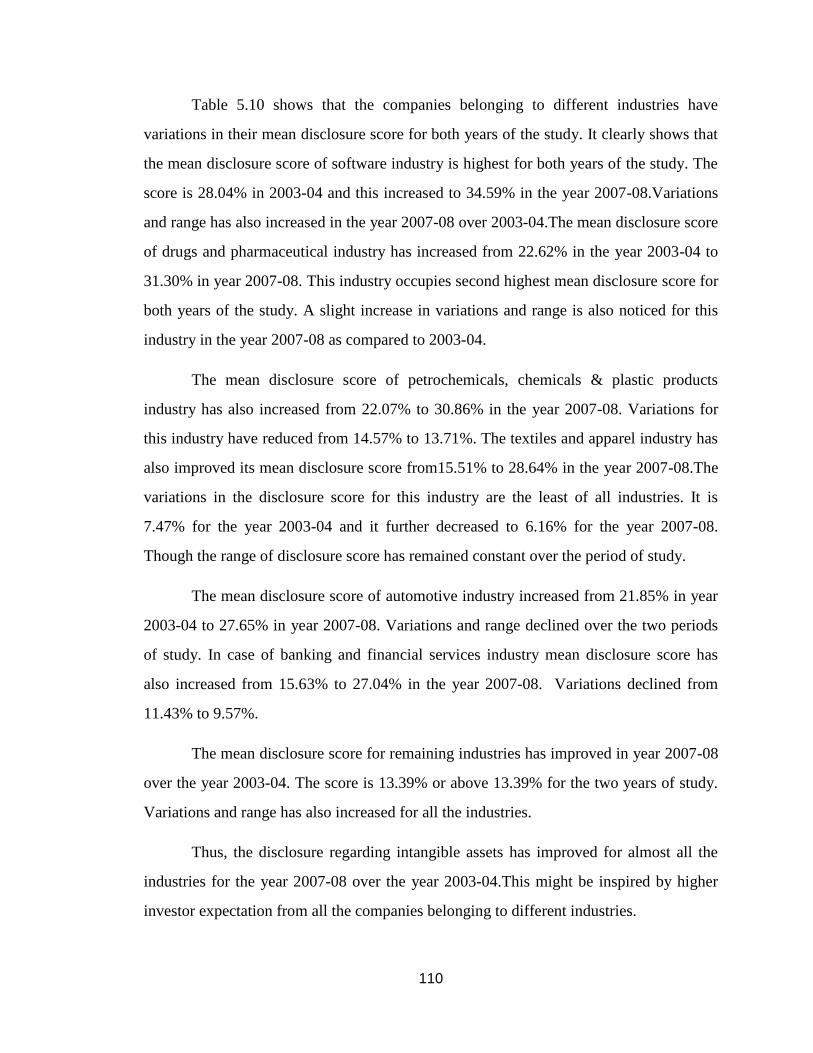
The intangible assets disclosure practices of companies on the basis of industry
classification like automotive, banking and financial services, software and IT, media and
telecommunication etc was also analysed. The descriptive statistics of different industries
i.e. mean disclosure score, standard deviation and range have been presented in table 5.10
for the years 2003-04 and 2007-08 respectively.
Table 5.10
Industry Wise Disclosure Score
Name of industry N
Disclosure Score (in percent)
2003-04 2007-08
Mean SD Min Max Mean SD Min Max
Agri input and tobacco 11 17.51 8.82 3.70 31.48 25.25 11.78 1.85 42.59
Automotive 15 21.85 14.36 0.00 53.70 27.65 10.13 9.26 44.44
Banking & financial services 16 15.63 11.43 0.00 40.74 27.04 9.57 9.26 38.89
Capital goods, industrial and engg products 29 16.48 10.41 0.00 40.74 24.71 10.79 3.70 48.15
Construction & electricity 26 13.39 12.43 0.00 44.44 26.35 14.44 3.70 57.41
Consumer goods, electronics, durables & FMCG 26 18.38 14.35 1.85 44.44 27.35 12.84 3.70 46.30
Drugs & pharmaceuticals 31 22.64 10.70 3.70 42.59 31.30 10.80 14.81 55.56
Media & telecommunication 8 18.98 8.73 3.70 29.63 30.32 10.19 12.96 44.44
Petrochemicals, chemicals & plastic products 12 22.07 14.57 0.00 51.85 30.86 13.71 9.26 53.70
Software, IT & ITES 28 28.04 11.74 1.85 61.11 34.59 13.35 14.81 79.63
Steel & other metals and minerals 17 13.51 12.74 0.00 46.30 24.07 15.42 3.70 53.70
Textiles & apparel 8 15.51 7.47 3.70 24.07 28.24 6.16 16.67 37.04
Transport, tourism, hotels & other diversified 16 15.28 10.40 3.70 40.74 22.69 12.31 1.85 44.44
110
Table 5.10 shows that the companies belonging to different industries have
variations in their mean disclosure score for both years of the study. It clearly shows that
the mean disclosure score of software industry is highest for both years of the study. The
score is 28.04% in 2003-04 and this increased to 34.59% in the year 2007-08.Variations
and range has also increased in the year 2007-08 over 2003-04.The mean disclosure score
of drugs and pharmaceutical industry has increased from 22.62% in the year 2003-04 to
31.30% in year 2007-08. This industry occupies second highest mean disclosure score for
both years of the study. A slight increase in variations and range is also noticed for this
industry in the year 2007-08 as compared to 2003-04.
The mean disclosure score of petrochemicals, chemicals & plastic products
industry has also increased from 22.07% to 30.86% in the year 2007-08. Variations for
this industry have reduced from 14.57% to 13.71%. The textiles and apparel industry has
also improved its mean disclosure score from15.51% to 28.64% in the year 2007-08.The
variations in the disclosure score for this industry are the least of all industries. It is
7.47% for the year 2003-04 and it further decreased to 6.16% for the year 2007-08.
Though the range of disclosure score has remained constant over the period of study.
The mean disclosure score of automotive industry increased from 21.85% in year
2003-04 to 27.65% in year 2007-08. Variations and range declined over the two periods
of study. In case of banking and financial services industry mean disclosure score has
also increased from 15.63% to 27.04% in the year 2007-08. Variations declined from
11.43% to 9.57%.
The mean disclosure score for remaining industries has improved in year 2007-08
over the year 2003-04. The score is 13.39% or above 13.39% for the two years of study.
Variations and range has also increased for all the industries.
Thus, the disclosure regarding intangible assets has improved for almost all the
industries for the year 2007-08 over the year 2003-04.This might be inspired by higher
investor expectation from all the companies belonging to different industries.
111
The finding that the mean disclosure score of software, IT and ITES industry is
highest as compared to other industries is not surprising. Firms in this knowledge based
industry need to be more proactive as they face greater competition and they often have
to rely on immutable intangibles that are difficult for competitors to imitate (Teece,
2000).
The high mean disclosure score for Drugs and pharmaceutical industry could be
motivated by the need to recognise the research activities and patents in this industry.
Further brands, customers and markets are key competitive factors which influence the
business of companies in media and telecommunication industry. This could be the
reason for high mean disclosure score for this industry.
5.6 DESCRIPTIVE STATISTICS
Table 5.11 explains the descriptive statistics for each of the five categories of
intangible assets disclosure index. The table shows that the disclosures (though low) have
improved for both the years of the study. The overall mean disclosure is 18.84% for the
year 2003-04. It increased to 28.09% in the year 2007-08. Overall variation remained
same for both the years but the range of disclosures has increased in the year 2007-08.
The range of intangible asset disclosure is zero to 68.52% in 2003-04 and 1.85%
to 81.48% in 2007-08. After removing the disclosure score of outperforming companies
(namely Infosys Technologies Ltd. and Satyam Computer Services Ltd.) the range comes
down to zero to 53.70% for the year 2003-04 and 1.85% to 57.41% for the year 2007-08.
The mean disclosure score of human capital is 5.63% in the year 2003-04 and it
increased to 7.48% in the year 2007-08. Variation and range of scores also improved in
the year 2007-08 over the year 2003-04. Similarly for categories external capital and
internal capital mean disclosure score, variation and range improved in the year 2007-08
as compared to the year 2003-04, except for the range of external capital category which
remained same for both the years of the study.
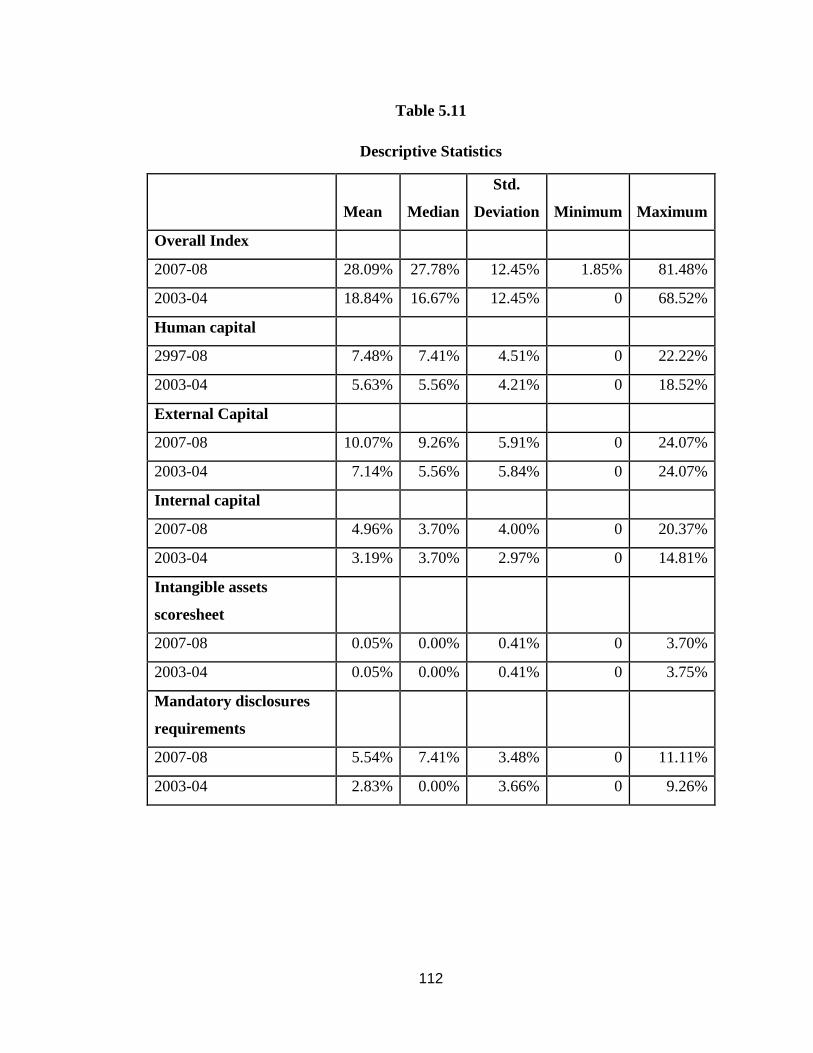
112
Table 5.11
Descriptive Statistics
Mean Median
Std.
Deviation Minimum Maximum
Overall Index
2007-08 28.09% 27.78% 12.45% 1.85% 81.48%
2003-04 18.84% 16.67% 12.45% 0 68.52%
Human capital
2997-08 7.48% 7.41% 4.51% 0 22.22%
2003-04 5.63% 5.56% 4.21% 0 18.52%
External Capital
2007-08 10.07% 9.26% 5.91% 0 24.07%
2003-04 7.14% 5.56% 5.84% 0 24.07%
Internal capital
2007-08 4.96% 3.70% 4.00% 0 20.37%
2003-04 3.19% 3.70% 2.97% 0 14.81%
Intangible assets
scoresheet
2007-08 0.05% 0.00% 0.41% 0 3.70%
2003-04 0.05% 0.00% 0.41% 0 3.75%
Mandatory disclosures
requirements
2007-08 5.54% 7.41% 3.48% 0 11.11%
2003-04 2.83% 0.00% 3.66% 0 9.26%
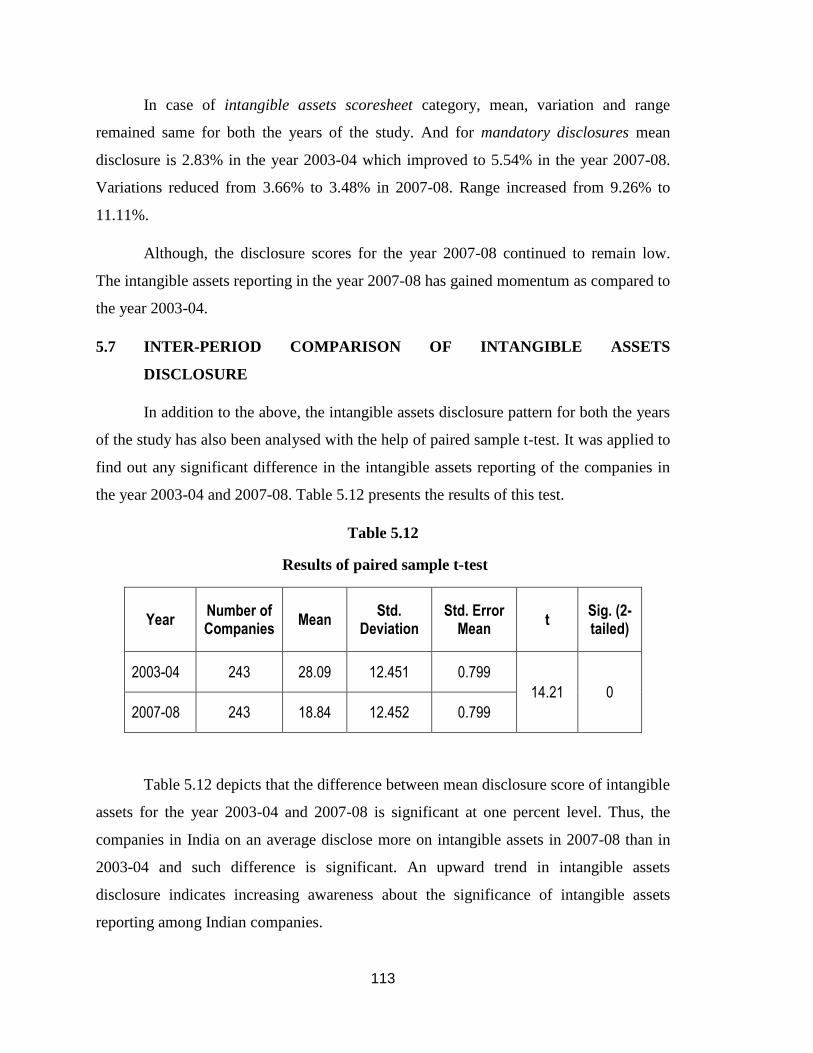
113
In case of intangible assets scoresheet category, mean, variation and range
remained same for both the years of the study. And for mandatory disclosures mean
disclosure is 2.83% in the year 2003-04 which improved to 5.54% in the year 2007-08.
Variations reduced from 3.66% to 3.48% in 2007-08. Range increased from 9.26% to
11.11%.
Although, the disclosure scores for the year 2007-08 continued to remain low.
The intangible assets reporting in the year 2007-08 has gained momentum as compared to
the year 2003-04.
5.7 INTER-PERIOD COMPARISON OF INTANGIBLE ASSETS
DISCLOSURE
In addition to the above, the intangible assets disclosure pattern for both the years
of the study has also been analysed with the help of paired sample t-test. It was applied to
find out any significant difference in the intangible assets reporting of the companies in
the year 2003-04 and 2007-08. Table 5.12 presents the results of this test.
Table 5.12
Results of paired sample t-test
Year Number of Companies
Mean Std.
Deviation Std. Error
Mean t
Sig. (2-tailed)
2003-04 243 28.09 12.451 0.799
14.21 0
2007-08 243 18.84 12.452 0.799
Table 5.12 depicts that the difference between mean disclosure score of intangible
assets for the year 2003-04 and 2007-08 is significant at one percent level. Thus, the
companies in India on an average disclose more on intangible assets in 2007-08 than in
2003-04 and such difference is significant. An upward trend in intangible assets
disclosure indicates increasing awareness about the significance of intangible assets
reporting among Indian companies.
114
5.8 CONCLUSION
Based on the above discussions and analysis of the intangible assets disclosure
practices of selected Indian companies made on the basis of attribute-wise and company-
wise disclosures, the following conclusions can be drawn:
1. The level of intangible assets disclosure is low in case of Indian firms, though it
has improved in the year 2007-08 as compared to the year 2003-04.
2. Out of the five categories of the intangible assets disclosure index, external
capital is the most reported category for both the years of the study. It has
disclosure score of 38% and 36% in the years 2003-04 and 2007-08 respectively.
This could be due to the pivotal role of these disclosures in influencing
stakeholder decisions. In order to prove their edge over their competitors the
companies might want to emphasize on relations with their distributors, business
associates, customers, society and other organizations, and promote their brand,
which are all attributes of external capital.
3. In all the five categories the attributes most reported are “number of employees”
(human capital), “markets & market share” (external capital), “business
collaborations” (external capital), “research projects” (internal capital),
“intangible assets valuation” (mandatory disclosure requirement) and “details of
amortisation rates, method and carrying amount at beginning and end of period”
(mandatory disclosure requirement).
4. Reporting of intangible assets is very unorganised and unsystematic. This is due
to lack of an established, and generally accepted framework for reporting these
assets. It may also be the case that companies are genuinely committed to the idea
of managing and developing their intangible assets but do not have, or are not
aware of benefits, from its disclosure to stakeholders. Some companies view the
development of intangible assets as being an internal management issue and
therefore outside the scope of the annual report (Guthrie, 2000).
5. The lack of established and generally accepted intangible assets reporting
framework has contributed to unorganised and unsystematic reporting of these
assets.
115
6. Analysis of qualitative and quantitative nature of disclosure shows that the
intangible assets reporting is mainly qualitative. Though in the year 2007-08 there
is s shift in trend towards quantitative disclosures over the year 2003-04.
7. The mean disclosure score of intangible assets for 243 companies improved in
2007-08 over 2003-04 and those differences are significant at 1% level of
significance.
8. Most of the intangible assets disclosures were found in the Management
Discussion and Analysis (MDA) section of annual report.
9. Infosys Technologies Ltd has the highest intangible assets disclosure score for
both years of the study (2003-04: 68.52%, 2007-08: 81.48%). Satyam Computer
Services Ltd., Tata steel Ltd., Max India Ltd., Reliance Industries Ltd., Larsen
and Toubro Ltd., Dr.Reddy Ltd., Wipro Ltd., are few other companies with high
disclosure scores for both the years of the study.
10. Software industry has highest mean disclosure score in India. This could be
motivated by the paramount importance of intangible assets to these businesses
and high overseas stakeholders’ expectations.