Embed Size (px)
Citation preview
Kennesaw State UniversityDigitalCommons@Kennesaw State University
Dissertations, Theses and Capstone Projects
12-1-2010
Community's Safety Net: A Comparative Analysisof the Role of Nonprofit Hospitals in Barrow andClayton Counties in Providing Services to itsMedicaid PopulationCarlene CogginsKennesaw State University
Julie JohnKennesaw State University
Follow this and additional works at: http://digitalcommons.kennesaw.edu/etdPart of the Health Policy Commons
This Thesis is brought to you for free and open access by DigitalCommons@Kennesaw State University. It has been accepted for inclusion inDissertations, Theses and Capstone Projects by an authorized administrator of DigitalCommons@Kennesaw State University.
Recommended CitationCoggins, Carlene and John, Julie, "Community's Safety Net: A Comparative Analysis of the Role of Nonprofit Hospitals in Barrow andClayton Counties in Providing Services to its Medicaid Population" (2010). Dissertations, Theses and Capstone Projects. Paper 430.
Community's Safety Net:
A Comparative Analysis of the Role of Nonprofit Hospitals in Barrow and
Clayton Counties in Providing Services to its Medicaid Population
Carlene Coggins and Julie John
A Practicum Paper
Submitted in Partial Fulfillment of the Requirements for the
Master of Public Administration
Kennesaw State University December 2010

i
Community's Safety Net:
A Comparative Analysis of the Role of Nonprofit Hospitals in Barrow and
Clayton Counties in Providing Services to its Medicaid Population
Executive Summary
Nonprofit hospitals serve as part of the healthcare safety net to deliver a significant level
of care to low-income, uninsured, underinsured, Medicaid and other vulnerable groups in
society. Safety net hospitals are defined as those hospitals where at least 10 percent of the costs
of care provided is uncompensated. Nonprofit hospitals are granted tax exemptions from the
government and in exchange they are required to meet community benefit standards which
include offering care to a relatively large proportion of uninsured or socially disadvantaged
individuals.
Increasing poverty levels due to rising unemployment, foreclosures and economic
distress have placed the safety net structure under tremendous stress. Policy makers are
concerned whether the nonprofit hospitals are able to provide the level of community benefits to
justify the forgone tax revenue estimated at $20 billion annually. The purpose of this study is to
determine whether, in spite of the changing environment, nonprofit hospitals provide community
benefits to low-income groups, and specifically to the Medicaid patients who visit their
emergency departments.
The emergency department plays a critical role in the safety net of every community and
extremely report high usage rates by Medicaid patients. Many of these patients often choose the
emergency department as their primary source of care because of barriers they encounter in
accessing healthcare.
A case study method was used to determine the visit rate levels of Medicaid patients to
the emergency departments of both the Barrow Regional Medical Center and the Southern
ii
Regional Medical Center from 2004 to 2008. Both facilities are nonprofit hospitals in Barrow
and Clayton counties, two counties whose poverty levels ranged from 11.3 to 14.7 percent.
High poverty level rates are indicative of low-income households that are, in turn, confronted
with many challenges, including access to healthcare. A similar analysis was conducted at the
state level and the results reflected the findings at the county level, for instance visit rates were
high for certain diseases.
It was established that emergency departments benefit the community by providing
residents with crucial, on-demand healthcare services. The study concludes by recommending
that in order to ensure the continued efficient and effective use of emergency departments,
efforts should be made to reduce their use for non-emergent purposes through education,
collaboration and other strategic interventions. Whether it serves as a first choice or last chance
source of care, it is proven that the emergency departments provide a valuable and irreplaceable
service for all community residents. It is not a tangible benefit but one that is highly valued.
iii
Acknowledgements
We convey our sincere gratitude to Dr. Andrew Ewoh for the professional advice and
encouragement he offered. His painstaking attention to detail, insightful comments and genuine
interest in our progress challenged us to develop a document which we can be proud of and, at
the same time adhere to the standards of Kennesaw State University. To our professors who
enlightened our classes at Kennesaw State: Drs. Ulf Zimmermann, Sungjoo Choi, Chenaz
Seelarbokus, Barbara Neuby, William Baker, and JoAnn Foster, we are better equipped to
perform our roles as public administrators.
We also thank each other for coming together to form a positive working relationship. To
our respective families, friends and colleagues who exercised much patience and encouraged us
along the way, we are forever grateful.
iv
Community's Safety Net:
A Comparative Analysis of the Role of Nonprofit Hospitals in Barrow and
Clayton Counties in Providing Services to its Medicaid Population
Table of Contents
Executive Summary.........................................................................................................
Acknowledgements.........................................................................................................
Introduction ....................................................................................................................
Literature Review ...........................................................................................................
Barrow County............................................................................................................
Clayton County ..........................................................................................................
Safety Net Areas ........................................................................................................
Role of Nonprofit Hospitals as Safety Net .................................................................
Nonprofit Hospitals ....................................................................................................
Community Benefits ..................................................................................................
Insurance ....................................................................................................................
Barrow Regional Medical Center ..............................................................................
Southern Regional Medical Center ............................................................................
Factors Affecting Access to Care ...............................................................................
Hospitals .....................................................................................................................
Insurance Coverage ....................................................................................................
Poverty and Access ....................................................................................................
Emergency Care .........................................................................................................
Methodology...................................................................................................................
Identifying the Sample Population .............................................................................
Selecting Variables and their Measurements .............................................................
Data Analysis .............................................................................................................
Study Limitations .......................................................................................................
Findings ..........................................................................................................................
Reasons for Visits ......................................................................................................
Visits by Age Categories ...........................................................................................
Recommendations and Conclusion ................................................................................
References ......................................................................................................................
Appendices .....................................................................................................................
i
iii
1
3
3
4
5
6
6
8
10
12
13
13
14
15
17
18
20
21
22
22
23
23
27
30
32
38
43
1
Community's Safety Net:
A Comparative Analysis of the Role of Nonprofit Hospitals in Barrow and
Clayton Counties in Providing Services to its Medicaid Population
Introduction
The scope of health services has not kept pace with the expanding population in
metropolitan Atlanta. The fact that there is a large number of low-income earners among the
population of metropolitan Atlanta, is indicative of an inability on their part to afford healthcare.
To assist with this dilemma, nonprofit hospitals were established to serve as safety nets. The key
question is what role, if any, do the nonprofit hospitals have to play in addressing the problems
posed by the increasing number of uninsured and underinsured?
From the mid 1950s to 1969, the Internal Revenue Service (IRS) required a hospital
seeking exemption under 501(c)(3) to be ―operated to the extent of its financial ability for those
not able to pay for the services rendered‖ (Internal Revenue Service 1956). The "financial ability
standard" was a reflection of a policy decision that tax-exempt hospitals should provide a
significant amount of care to those who could not afford to pay for it. But, in 1969, the Internal
Revenue Service issued Revenue Ruling 69-545, which discarded free care or charity care as the
key requirement for exemption. Instead, "promotion of health" for the benefit of the community
itself was considered a charitable purpose, thus giving rise to the community benefit standard.
This standard has been in existence for more than 40 years, with very little regulatory changes
(Internal Revenue Service 1969).
The introduction of Medicaid and Medicare programs in 1965 offered a new coverage for
many medically needy. According to Fox and Schaffer (1991), "the IRS issued the 1969
Revenue Ruling creating the community benefit standard partly in response to requests from
2
nonprofit hospitals that the IRS eliminate the free care requirement" (Fox and Schaffer 1991,
251).
The number of the uninsured has grown to more than 46 million. Similarly, the scale of
financial benefits that nonprofit hospitals collect from federal and state tax exemptions have
grown. The tax revenue amount annually forgone by the government is estimated to be twenty
billion dollars (Crossley 2008, 2).
The purpose of this study is to explore the level of emergency care provided by nonprofit
hospitals to the low-income, underserved and uninsured population, and to determine whether
these hospitals, in spite of the changing financial, economic, and social environment, still benefit
the communities they serve. Specifically, the level of care rendered to those receiving Medicaid
coverage is also examined.
The researchers compiled demographic information on metropolitan Atlanta, Barrow and
Clayton counties. Information was also collected on the nonprofit hospitals in Barrow and
Clayton counties in relation to their role as safety net providers, the tax exemptions they receive
in return for delivering healthcare to vulnerable groups, and the community benefits expected
from their services. The objectives and scope of coverage of Medicaid are also addressed in the
study. A detailed examination was then undertaken on the key factors that affect the different
players involved in the delivery of healthcare, for example, hospitals and health professionals.
Some of the factors affecting the beneficiaries of healthcare were also examined.
An analysis was conducted on patient visits to the emergency departments of Barrow
Regional Medical Center and Southern Regional Medical Center. The analysis was done using
the OASIS Web Query Tool and included the demographics of Medicaid patients who use the
emergency departments. A cross-sectional analysis was also performed using similar
3
demographics available at the state level. The final part of the study contained the key findings
and recommendations for safety net providers and policymakers to address issues uncovered by
this research.
Literature Review
The Atlanta-Sandy Springs-Marietta Metropolitan Statistical Area (MSA) or metro
Atlanta as it is more popularly called was designated by the U.S. Census Bureau as the
metropolitan area of the state’s capital, Atlanta. In addition to Atlanta, the metropolitan area
spans up to 28 counties in north Georgia. Between 2000 and 2007, the metro Atlanta population
grew by 24 percent to about 5.3 million in 2007. The addition of approximately one million new
residents accounted for 76 percent of the state’s total population growth (Georgia Power and
Metro Atlanta Chamber 2009, 2). During that same period, metro Atlanta moved from an
eleventh place ranking in population to ninth and became the nation’s fastest growing MSA
(Georgia Power and Metro Atlanta Chamber 2009, 2). Two of the counties that are located in
metropolitan Atlanta are Barrow County and Clayton County.
Barrow County
Barrow County was created in 1914 as a way of settling a dispute among the citizens of
the City of Winder, which at the time was located at the juncture of three counties, Gwinnett,
Jackson, and Walton. The new county was named for David Crenshaw "Uncle Dave" Barrow,
long-time chancellor of the University of Georgia (Barrow County 2010). Winder was
designated as the county seat. The other main towns in Barrow County are Auburn, Bethlehem,
Braselton, Carl, and Statham. As of July 1, 2009, Barrow’s resident total population was
4
estimated at 72,158, reflecting a 56.4 percent increase from April 1, 2000. The median income
for a household in the county was $51,318, and approximately 11.3 percent of the population
lived below the poverty line (U.S. Census Bureau 2010). The information below was extracted
from Barrow County’s approved budget for fiscal year 2010 and reflects the serious economic
situation which the county and so many others are experiencing:
A decrease in the General Fund Budget and use of reserves in the amount of $414,325.
Several departments have merged to form fewer departments.
A net loss of 56 positions was realized in the FY 2010 budget due to layoffs, position
changes, retirements and voluntary staff reductions.
No market adjustments or merit increases will be provided for full-time, part-time,
temporary, or seasonal employee salaries (Barrow County 2010).
Clayton County
Clayton County is Georgia’s 125th county and falls within the five-county core of the
Atlanta metropolitan area. The county was formed in 1858 from parts of Fayette and Henry
counties, and was named to honor Judge Augustin S. Clayton, who held the county's first
sessions of the superior court and later served in both the Georgia House of Representatives and
Senate (Clayton County 2010). The City of Jonesboro holds the county seat. The 2000 census
showed that the population of Clayton County was 236,517, while in 2009 it was estimated at
275,772, representing a 16.6 percent increase. However, from 2000 to 2008, the median
household income for the county had dropped from $57,466 to $46,293. In 2007, the county
ranked second of 26 counties in relation to a decline in household income for counties in
5
Georgia. The percentage of the population living below the poverty line was listed at 14.7
percent (U.S. Census Bureau 2010).
Safety Net Areas
The high percentage of persons living below the poverty level in Barrow and Clayton
counties is a situation reflected in many areas throughout the United States. In fact, the official
poverty rate jumped from 13.2 percent in 2008 to 14.3 percent in 2009, and was the second
statistically significant annual increase in the poverty rate since 2004, when poverty increased to
12.7 percent from 12.5 percent in 2003 (U.S. Census Bureau 2010). Demographic information
related to Barrow and Clayton counties, as well as aggregated county information, are presented
in summary form in Appendix A. In the majority of situations where poverty exists, it is the low-
income households that are primarily affected. Many low-income working families are
struggling to get by, and are often forced to make impossible choices among food, housing, and
healthcare and other priorities. Government safety net programs were established to protect
families during tough times—before they fall into poverty. But rising unemployment,
foreclosures, and economic distress are putting pressure on a system already in need of updates
and repairs (Ullman 1999).
The healthcare safety net consists of a wide variety of providers delivering care to low-
income and other vulnerable populations, including the uninsured and those covered by
Medicaid. Many of these providers have either a legal mandate or an explicit policy to provide
services regardless of a patient's ability to pay. Major safety net providers include public
hospitals and community health centers as well as teaching and community hospitals, private
physicians, and other providers who deliver a substantial amount of care to these populations
6
(U.S. Department of Health and Human Services 2000). There are many other ways to describe
safety net hospitals. For example, the Institute of Medicine defines safety net hospitals as "those
providers that deliver a significant level of health care to uninsured, Medicaid, and other
vulnerable patients" (Institute of Medicine 2000, 1). Other researchers have defined safety net
hospitals as those hospitals where at least 10 percent of the costs of care provided is
uncompensated. One feature that consistently defines safety net hospitals is that they provide
care to a relatively large proportion of uninsured or socially disadvantaged individuals.
Role of Nonprofit Hospitals as Safety Nets
According to the National Association of Public Hospitals, safety net members account
for two percent of all hospitals but provide 25 percent of the nation’s uncompensated care.
Barrow Regional Medical Center and Southern Regional Medical Center, as nonprofit hospitals
and safety net members, form part of that figure. Information was obtained from the American
Hospital Directory that Barrow Regional Medical Center, located in Winder, is the only hospital
in Barrow County. There were no listings for hospitals in the other major cities of Barrow
County. Similarly, apart from Southern Regional Medical Center, no other acute hospital was
listed for Clayton County (American Hospital Directory 2010).
Nonprofit Hospitals
Nonprofit hospitals receive various tax exemptions from the government and are required
to meet community-benefit standards. This is one of the factors that differentiate for-profit
hospitals from the nonprofit hospitals. For a hospital to qualify for exemption from federal
income taxes, it must be organized and operated exclusively for a charitable, educational, or
7
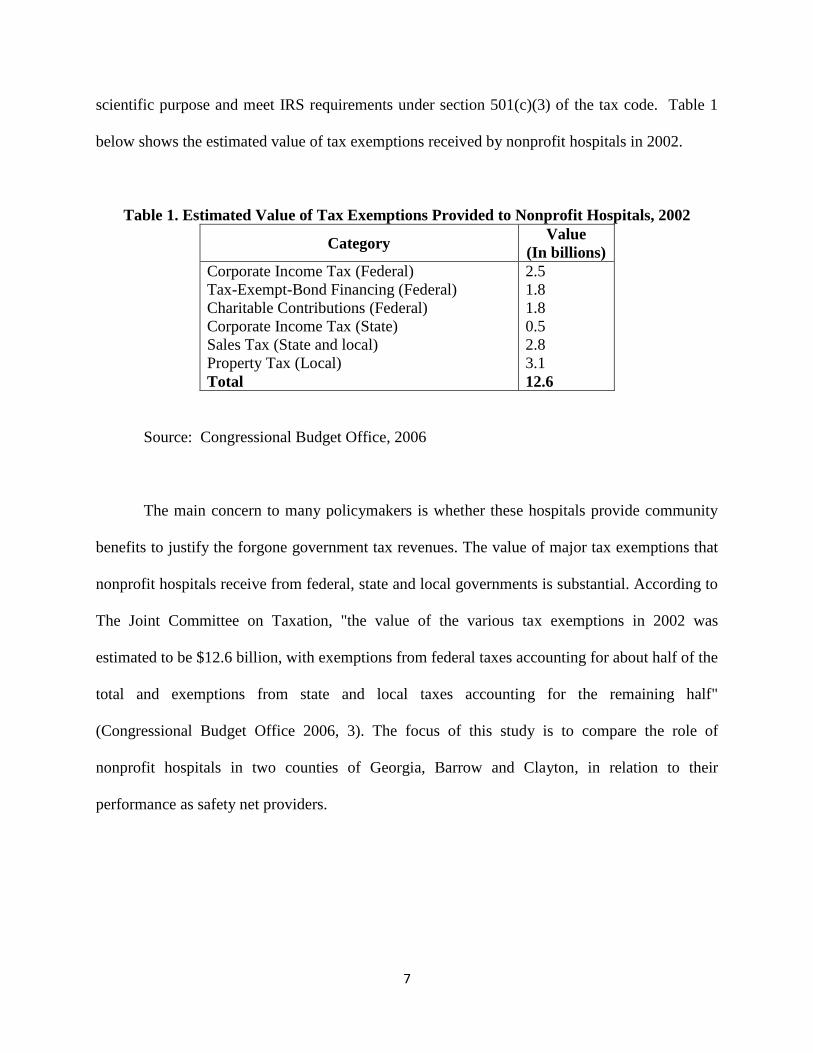
scientific purpose and meet IRS requirements under section 501(c)(3) of the tax code. Table 1
below shows the estimated value of tax exemptions received by nonprofit hospitals in 2002.
Table 1. Estimated Value of Tax Exemptions Provided to Nonprofit Hospitals, 2002
Category Value
(In billions)
Corporate Income Tax (Federal)
Tax-Exempt-Bond Financing (Federal)
Charitable Contributions (Federal)
Corporate Income Tax (State)
Sales Tax (State and local)
Property Tax (Local)
Total
2.5
1.8
1.8
0.5
2.8
3.1
12.6
Source: Congressional Budget Office, 2006
The main concern to many policymakers is whether these hospitals provide community
benefits to justify the forgone government tax revenues. The value of major tax exemptions that
nonprofit hospitals receive from federal, state and local governments is substantial. According to
The Joint Committee on Taxation, "the value of the various tax exemptions in 2002 was
estimated to be $12.6 billion, with exemptions from federal taxes accounting for about half of the
total and exemptions from state and local taxes accounting for the remaining half"
(Congressional Budget Office 2006, 3). The focus of this study is to compare the role of
nonprofit hospitals in two counties of Georgia, Barrow and Clayton, in relation to their
performance as safety net providers.
8
Community Benefits
"The community benefit standard is the legal standard for determining whether a
nonprofit hospital is exempt from federal income tax under section 501(c)(3) of the Internal
Revenue Code" (Internal Revenue Service 2009, 1). This standard is used by the IRS to assess
whether a hospital is exempt or taxable. Since these nonprofit hospitals receive federal income
tax exemption on the basis of the healthcare services they provide, they are periodically
scrutinized to determine whether the community benefits from their services. This benefit
standard was last modified in 1969 by the Internal Revenue Service (IRS). The most recent
development is the Senate Finance Committee hearing, ―Taking the Pulse of Charitable Care and
Community Benefits at Nonprofit Hospitals,‖ held on September 13, 2006, which highlighted the
many dimensions of the community benefit standard (Ernst and Young 2006).
According to United States Government Accountability Office's statement prepared by
David M. Walker before the Committee on Ways and Means, House of Representatives
community benefits include "such services as the provision of health education and screening
services to specific vulnerable populations within a community, as well as activities that benefit
the greater public good, such as education for medical professionals and medical research"
(Walker 2005, 1). In order to identify the community benefits, the economic concept of a public
good—something that benefits all, whether they pay or not—has been used in many studies
(Nicholson et al. 2000). Nicholson and others (2000) state that most medical services provided
by hospitals are considered private goods. But, some medical services that treat or prevent
contagious diseases have an important public good element. Though a less obvious one, the use
of medical services by low-income and high-risk persons can be an important type of public
9
good (Nicholson et al. 2000). For this study, the measurement of community benefits is based
on the emergency care received by the Medicaid population of the Barrow and Clayton counties.
The charitable services or the community benefit services of these nonprofit hospitals
have been a cornerstone of the society's safety net. Many studies have been conducted by various
agencies to examine the safety net aspect of hospitals. The 2000 Institute of Medicine report on
the healthcare safety net is worth mentioning. In the aftermath of Hurricane Katrina, high
immigration levels, and new fiscal and policy pressures on care for vulnerable population, the
committee that wrote the 2000 Institute of Medicine report on the healthcare safety net
reconvened in 2006 to reflect on the safety net from the perspective of the rising number of
uninsured and underinsured people. The committee noted that although the public hospitals are
surviving in aggregate, they remain in uncertain financial trouble (Lewin and Baxter 2007).
Another study that needs to be mentioned here is done by Stephen M. Davidson and Ronald C.
Wacker in 1974 to determine to what extent community hospitals are serving patients covered by
the Medicaid program. The study found that a substantial number of low-income people
bypassed nearby hospitals to obtain service in a relatively few teaching hospitals located miles
further away, thereby increasing the cost, as well as the potential medical risks (Davidson and
Wacker 1974).
Furthermore a study conducted by the Congressional Budgeting Office in 2006, found
that, when compared to for-profit hospitals, nonprofit hospitals provided higher levels of
uncompensated care. The study also found that, "nonprofit hospitals were more likely than
otherwise similar for-profit hospitals to provide certain specialized services but were found to
provide care to fewer Medicaid-covered patients as a share of their total patient population"
(Congressional Budget Office 2006, 9).
10
Insurance
Medicaid is a critical component of our society's safety net in the absence of universal
health coverage. Medicaid takes on the highest-risk, sickest, and often most expensive
population from private insurance and Medicare (Rowland and Tallon 2003). Medicaid is a joint
federal and state program created in 1965, through Title XIX of the Social Security Act, to help
low-income individuals and families who fit in an eligibility group recognized by federal and
state law. The specific objectives of the Medicaid program are to: (a) Provide broad health care
coverage to certain lower income populations, (b) offer special community-based coverage for
certain disabled and elder populations, (c) extend supplemental coverage to lower income
Medicare beneficiaries, and (d) Offset the high costs of institutional care for lower and moderate
income Georgians (Centers for Medicare and Medicaid Services 2005).
Medicaid covers forty-seven million low-income people, including twenty-four million
children, eleven million adults, and more than thirteen million elderly and disabled people, at an
estimated annual cost to the federal and state governments of $250 billion (Centers for Medicare
and Medicaid Services 2005). It is jointly funded by state and federal governments, and is
managed by the states. Regardless of the interstate differences, the non-federal cost turned out to
be considerably higher than expected, thus contributing to fiscal crises in many states. Whether
or not a person is eligible for Medicaid will depend on the state where he or she lives. The
eligible group served by Medicaid includes certain categories of low-income adults and their
children, pregnant women, parents of eligible children, people with certain disabilities and
elderly needing nursing home care.
One of the primary requirements for Medicaid is having limited assets, but poverty alone
does not necessarily qualify an individual for Medicaid. According to the Centers for Medicare
11
and Medicaid Services, "Medicaid does not provide medical assistance for all poor persons. Even
under the broadest provisions of the Federal statute (except for emergency services for certain
persons), the Medicaid program does not provide health care services, even for very poor
persons, unless they are in one of the designated eligibility groups" (Centers for Medicare and
Medicaid Services 2005). Since each state manages the program, there are variations in the plan
across the country. For our study we will discuss Medicaid coverage in Georgia, focusing
specifically on Barrow and Clayton counties.
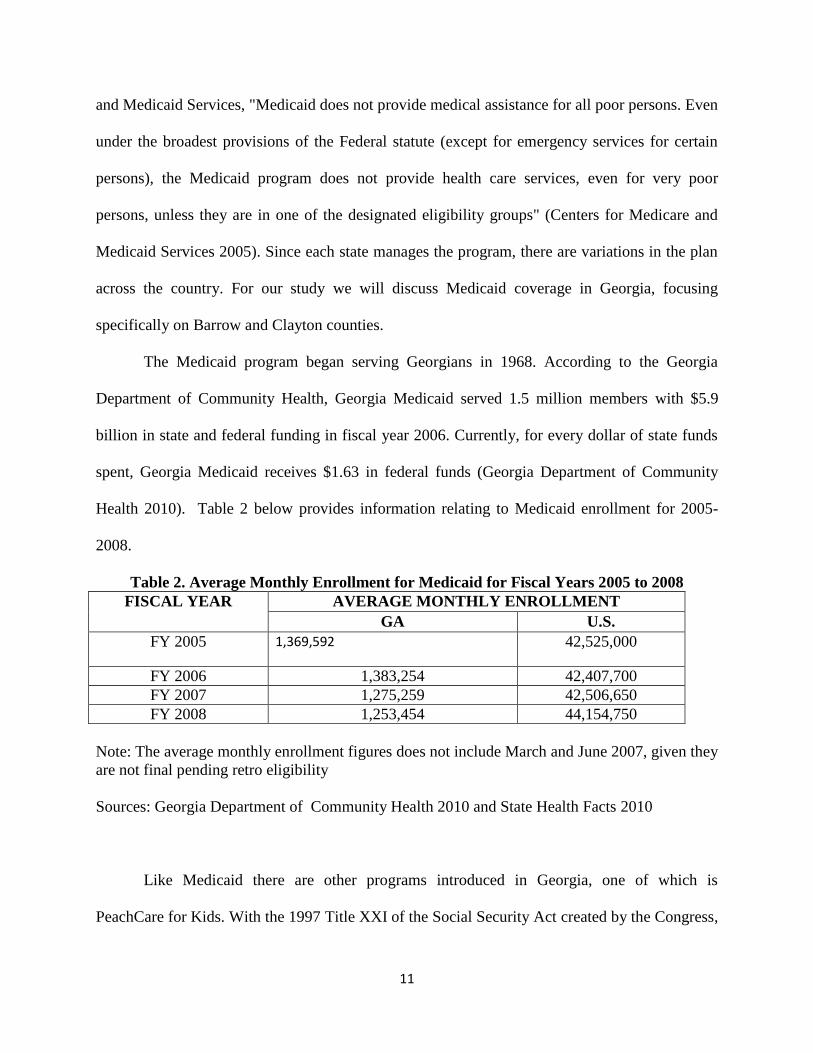
The Medicaid program began serving Georgians in 1968. According to the Georgia
Department of Community Health, Georgia Medicaid served 1.5 million members with $5.9
billion in state and federal funding in fiscal year 2006. Currently, for every dollar of state funds
spent, Georgia Medicaid receives $1.63 in federal funds (Georgia Department of Community
Health 2010). Table 2 below provides information relating to Medicaid enrollment for 2005-
2008.
Table 2. Average Monthly Enrollment for Medicaid for Fiscal Years 2005 to 2008
FISCAL YEAR AVERAGE MONTHLY ENROLLMENT
GA U.S.
FY 2005 1,369,592 42,525,000
FY 2006 1,383,254 42,407,700
FY 2007 1,275,259 42,506,650
FY 2008 1,253,454 44,154,750
Note: The average monthly enrollment figures does not include March and June 2007, given they
are not final pending retro eligibility
Sources: Georgia Department of Community Health 2010 and State Health Facts 2010
Like Medicaid there are other programs introduced in Georgia, one of which is
PeachCare for Kids. With the 1997 Title XXI of the Social Security Act created by the Congress,
12
the states were given an opportunity to create programs to increase access to affordable health
insurance. Georgia introduced PeachCare for Kids in 1999, providing comprehensive healthcare
to children through the age of 18 who do not qualify for Medicaid and live in households with
incomes at or below 235 percent of the federal poverty level (PeachCare for Kids 2010).
Georgia Families is another such program. This program delivers healthcare services to
members of Medicaid and PeachCare for Kids. The program is a partnership between the
Department of Community Health and private care management organizations. Georgia Families
allows members to select a health care plan that fits their needs by providing a choice of health
plan (Georgia Department of Community Health 2010).
The focus of this study is on Medicaid, and the Barrow Regional Medical Center and the
Southern Regional Medical Center offer services to this population. A brief description of some
of the services they provide are addressed below.
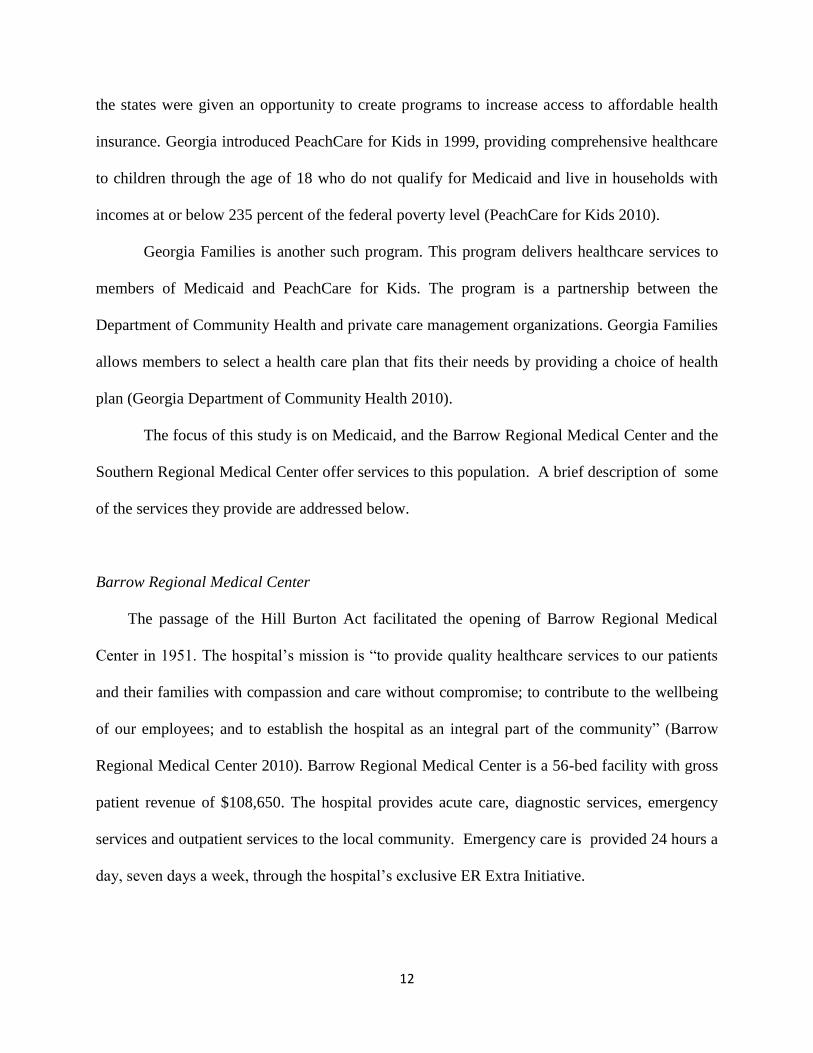
Barrow Regional Medical Center
The passage of the Hill Burton Act facilitated the opening of Barrow Regional Medical
Center in 1951. The hospital’s mission is ―to provide quality healthcare services to our patients
and their families with compassion and care without compromise; to contribute to the wellbeing
of our employees; and to establish the hospital as an integral part of the community‖ (Barrow
Regional Medical Center 2010). Barrow Regional Medical Center is a 56-bed facility with gross
patient revenue of $108,650. The hospital provides acute care, diagnostic services, emergency
services and outpatient services to the local community. Emergency care is provided 24 hours a
day, seven days a week, through the hospital’s exclusive ER Extra Initiative.
13
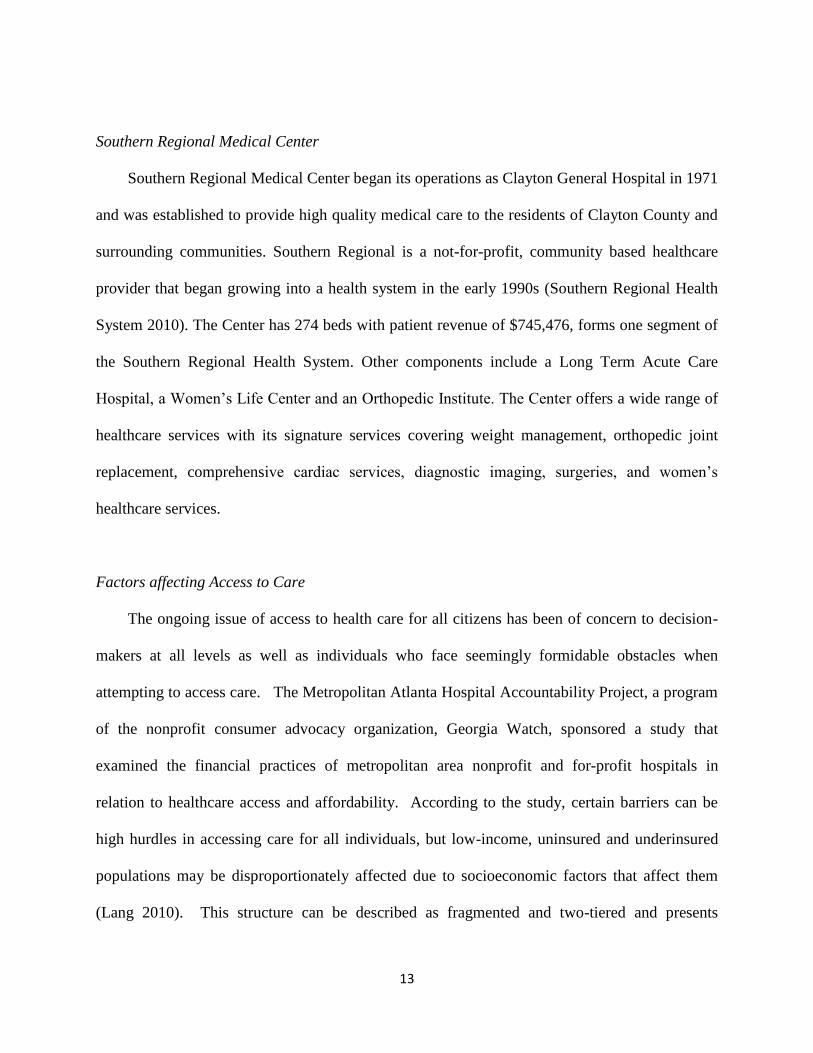
Southern Regional Medical Center
Southern Regional Medical Center began its operations as Clayton General Hospital in 1971
and was established to provide high quality medical care to the residents of Clayton County and
surrounding communities. Southern Regional is a not-for-profit, community based healthcare
provider that began growing into a health system in the early 1990s (Southern Regional Health
System 2010). The Center has 274 beds with patient revenue of $745,476, forms one segment of
the Southern Regional Health System. Other components include a Long Term Acute Care
Hospital, a Women’s Life Center and an Orthopedic Institute. The Center offers a wide range of
healthcare services with its signature services covering weight management, orthopedic joint
replacement, comprehensive cardiac services, diagnostic imaging, surgeries, and women’s
healthcare services.
Factors affecting Access to Care
The ongoing issue of access to health care for all citizens has been of concern to decision-
makers at all levels as well as individuals who face seemingly formidable obstacles when
attempting to access care. The Metropolitan Atlanta Hospital Accountability Project, a program
of the nonprofit consumer advocacy organization, Georgia Watch, sponsored a study that
examined the financial practices of metropolitan area nonprofit and for-profit hospitals in
relation to healthcare access and affordability. According to the study, certain barriers can be
high hurdles in accessing care for all individuals, but low-income, uninsured and underinsured
populations may be disproportionately affected due to socioeconomic factors that affect them
(Lang 2010). This structure can be described as fragmented and two-tiered and presents
14
implications for low-income families. For a large fraction of Americans, their jobs do not
provide health insurance or other benefits, and although government programs are available for
children, adults without private healthcare coverage have few options. Extensive poverty, the
increasing proportion of minority households, and the growing dependence on insecure service
sector work all influence access to healthcare for families at the economic margin (Angel, Lein
and Henrici 2006). An examination will be undertaken to explore some the issues that affect
different players involved in the delivery of healthcare as well as some of the factors that affect
the beneficiaries of healthcare.
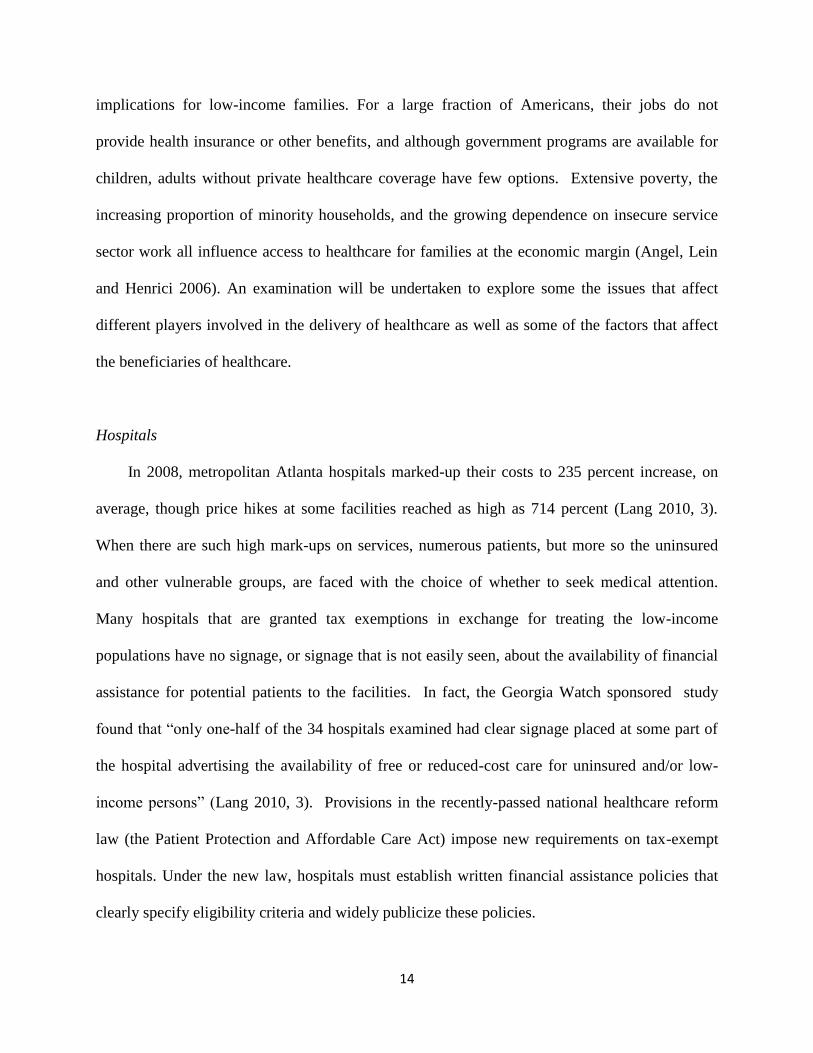
Hospitals
In 2008, metropolitan Atlanta hospitals marked-up their costs to 235 percent increase, on
average, though price hikes at some facilities reached as high as 714 percent (Lang 2010, 3).
When there are such high mark-ups on services, numerous patients, but more so the uninsured
and other vulnerable groups, are faced with the choice of whether to seek medical attention.
Many hospitals that are granted tax exemptions in exchange for treating the low-income
populations have no signage, or signage that is not easily seen, about the availability of financial
assistance for potential patients to the facilities. In fact, the Georgia Watch sponsored study
found that ―only one-half of the 34 hospitals examined had clear signage placed at some part of
the hospital advertising the availability of free or reduced-cost care for uninsured and/or low-
income persons‖ (Lang 2010, 3). Provisions in the recently-passed national healthcare reform
law (the Patient Protection and Affordable Care Act) impose new requirements on tax-exempt
hospitals. Under the new law, hospitals must establish written financial assistance policies that
clearly specify eligibility criteria and widely publicize these policies.
15
Nonetheless, safety net hospitals that provide subsidized care for the vulnerable populations
are prone to incur a huge amount of debt due to the level of subsidies, and the fact that they are
sometimes never reimbursed for such services. Some hospitals have had to close their doors
because of the financial strain they experience. After only two years of operation, DeKalb
Medical Center at Hillandale began to experience shortfalls as a result of a large number of
unpaid bills. Southern Regional Medical Center almost closed its doors in December of 2008
due to the cost of care for its uninsured patients, who comprised a significant percent of its total
patient load. The hospital provided about $80 million in indigent care that year (Lang 2010, 6).
In recognition of the fact that the small number of safety net hospitals provide a disproportionate
share of indigent care, the Institute of Medicine (IOM) released a report in 2000 describing the
healthcare safety net—the nation’s ―system‖ of providing health care to low-income and other
vulnerable populations—as ―intact but endangered‖ (Lewin and Baxter 2007). IOM
recommended improved monitoring of the structure, capacity, and financial stability of the safety
net. In terms of patient revenue margin, public safety-net hospitals fared much worse than other
hospitals with –6.7 percent compared to –0.8 percent for nonprofit safety-net hospitals and 2.2
percent for investor-owned safety-net hospitals (U.S. Department of Health and Human Services
2007).
Insurance Coverage
Insurance status is a key determinant in a consumer’s ability to afford needed healthcare,
and those that have no form of insurance, whether private or public, are especially affected,
though each group has its own particular challenges (Lang 2010). It was reported by the
Associated Press that healthcare insecurity is becoming a major issue as the downturn in the
16
economy continues (Kerr 2009). It has also been documented that nearly one in four people
expressed fear of losing coverage in the next year. About the same number reported that they or a
family member delayed seeing a doctor in the past year because of what it might cost.
Despite the important role that health insurance plays in obtaining necessary care, 1.6
million Georgians, or 18 percent of Georgia population, are uninsured (Georgians for a Healthy
Future 2009). This figure forms part of the 42.6 million Americans that lack health insurance
(Billings, Parikh, and Mijanovich 2000). In Georgia, the uninsured are nearly four times more
likely than the insured to have gone without a routine check-up in the past two years, and are
more likely than the insured to experience avoidable hospitalizations for conditions such as
diabetes, hypertension, and asthma (Georgians for a Healthy Future 2009). Seventy-two percent
of consumers who were surveyed in the Georgia Watch sponsored study identified themselves as
underinsured and stated they often delay preventive and other care due to the fear of the cost, as
they are uncertain whether they can pay their part of a hospital bill (Lang 2010).
Also the Georgia Watch sponsored study found that poorer individuals are much more
likely than higher-income individuals to lack insurance, and account for nearly two-thirds of all
uninsured consumers. The Commonwealth Fund study confirms this fact that a disproportionate
number of those who lack health insurance are low-income workers (Billings, Parikh and
Mijanovich 2000). Moreover, low-income workers are less likely than those with high incomes to
have employee-sponsored health insurance. The foregoing discussion is supported by the
findings in an article published by Georgians for a Healthy Future which stated that the majority
of nonelderly uninsured Georgians are in working families, four-fifths of the uninsured are in
families with at least one worker, and nearly 70 percent are in families with at least one full-time
17
worker (Georgians for a Healthy Future 2009). From 2000 to 2007, health insurance premiums
for Georgia working families increased by 72.5 percent (Lang 2010, 8).
Furthermore, Census figures showed that the economic cycle during 200 to 2007 period was
one of the weakest on record for working families, leaving many unable to afford their medical
bills. A study of nonprofit hospitals in Barrow and Clayton counties is justified since these
counties were determined to have among the highest level of uninsured persons. Of the counties
involved in the Georgia Watch sponsored study, Pickens County and Clayton County had the
highest level of uninsured patients, about 23 percent of their total residents, followed closely by
Barrow and Bartow counties with 20 percent (Lang 2010, 5). Uninsurance rates vary between
different regions of the state, from a low of 12 percent uninsured in the East Metro Public Health
District to a high of 24 percent uninsured in the Clayton Public Health District (Georgians for a
Healthy Future 2009).
Poverty and access
Historically, it has been demonstrated that unemployment and poverty rates keep rising
after a recession ends. In 2008, 39.8 million people were in poverty; in 2009, the figure
increased to 43.6 million therefore, poverty rates are likely to continue to rise in 2010 (Urban
Institute 2010). Unemployment benefits do not ensure that unemployed workers will avoid
poverty, partly because many low-income workers are not eligible for benefits (Nichols, 2010).
There are many factors that are responsible for low income households experiencing poor health,
but the more important are limited access to low-cost care, lack of transportation options to
access timely care, increased likelihood of having a dangerous job and unhealthy lifestyle habits.
The findings of the Georgia Watch sponsored study showed that low-income persons spend their
18
limited income first on basic necessities such as food, clothing, and housing, which leaves no
additional funds for healthcare, especially private insurance and preventive care (Lang 2010, 7).
The foregoing information underscores some of the reasons why the uninsured or underinsured
tend to utilize the emergency departments as their primary point of care.
Emergency Care
An Emergency Department is defined as a hospital facility that provides unscheduled
outpatient services to patients whose conditions require immediate care, which is staffed 24
hours a day. All metropolitan Atlanta acute care facilities operate an emergency department that
operates 24 hours a day, seven days a week. Under the Emergency Medical Treatment and Labor
Act, hospitals participating in the Medicare program are required to stabilize and treat anyone
who enters the emergency room, regardless of their insurance status or ability to pay. However,
the law does not require emergency departments to provide care for those who do not have an
emergency diagnosis. Emergency conditions are defined as currently threatening a person’s life
or long-term health.
When illness or injury strikes, Americans count on the emergency care system to respond
with timely and high-quality care. At the same time, the increasing use of the emergency system
represents failures of the larger healthcare system (Institute of Medicine of the National
Academies 2007). Many low-income, uninsured and underinsured individuals use the emergency
room as their access point to a hospital and as their primary care provider for two main reasons.
First, many uninsured consumers avoid care until a condition escalates to an emergency
situation. Second, these consumers believe the emergency room is their only health care option,
because it is the only place in a hospital where care is guaranteed regardless of the patient’s
19
ability to pay (Lang 2010). A cross-sectional survey administered to self-referred non-urgent
patients of a university emergency department concluded, among other things, that many of the
patients were unaware of other places to go for their current health problem. Even those patients
with a primary care provider sought care in the emergency department because it was believed to
provide better care despite its perceived increase in both waiting time and cost (Northington,
Brice and Zou 2005).
A Commonwealth Fund study classified emergency department visits according to four
basic categories:
Non-emergent. Cases where immediate care is not required within 12 hours (e.g., sore
throat).
Emergent-primary care treatable. Care is needed within 12 hours, but care could be
provided in a typical primary care setting (infant with a 102° fever).
Emergent-emergency department care needed: preventable/avoidable. Immediate care in
an emergency department setting is needed, but the condition could potentially have been
prevented or avoided with timely and effective ambulatory care (asthma, diabetic
ketoacidosis, etc.).
Emergent-emergency department care needed: not preventable/avoidable. Immediate care
in an emergency department setting is needed, and the condition could not have been
prevented/avoided with ambulatory care—heart attacks, multiple trauma, and so on—
(Billings, Parikh and Mijanovich 2000).
Visits involving preventive care are more appropriately addressed in a clinical or primary
care setting than in an emergency room which is the most expensive point of entry at a hospital.
For example, it typically costs $715 to treat a urinary tract infection in an emergency room
20
whereas it can be treated more affordably in a clinic or primary care setting. In Georgia, the
average clinic visit is $29 and an average primary care doctor visit can range from $75 to $120.
About 37 percent of all emergency room visits in 2007 were during regular business hours,
making clinics and urgent care centers viable alternatives to the emergency room when non-
emergent care is needed (Lang 2010, 16).
The emergency department of Barrow Regional Medical Center has two distinct areas of
treatment, a FastTrack area with 3 beds for minor emergencies and another area with nine beds
for major healthcare emergencies. Fast Track handles all minor care, ranging from sore throats to
minor orthopedic injuries. Initial assessments are generally done within 15 minutes of arrival and
patients with non-life threatening conditions are usually evaluated, treated and discharged to
their homes in typically less than two hours. In order to deliver the fastest quality care possible,
the emergency room has a computerized tracking system that records every second the patient
spends in the emergency department (Barrow Regional Medical Center 2010). Southern
Regional Medical Center's Emergency Department treats nearly 80,000 patients a year, making it
one of the busiest in the State of Georgia. The Department is designed to handle almost every
type of emergent and critical care situation, and is equipped with 39 acute beds, all with state-of-
the-art bedside monitoring equipment. The Emergency Department treats patients dealing with
serious injuries, life-threatening illnesses, and multiple system organ failures (Southern Regional
Health System 2010).
Methodology
The design of the study was of a descriptive nature where the researchers combined a case
study approach with a cross-sectional method. Use of the case study approach allowed for the
21
inclusion of an in-depth, detailed information on Barrow and Clayton counties. Socio-
demographic, economic and health information related to the two counties were extracted from
federal records including the U.S. Census Bureau, Census of Governments, USA Counties, and
Current Population Survey. The County and City Data Book and the University of Georgia
website provided comprehensive information on the two counties in relation to population,
education, income and poverty levels. Articles published by Georgia Watch and the Urban
Institute were helpful in providing current positions on the issue. This approach not only allowed
greater insight to be gained into the issue but also revealed any weaknesses in the system and
which could serve as an impetus for proposing a new program or strategy to improve the quality
of life for the communities. Since the researchers limited their case study to an analysis of a few
factors that influence the effectiveness of safety nets, the strength of the case study approach,
combining diverse pieces of information to obtain a better picture, was not fully utilized.
Identifying the sample population
The demographic information obtained from the two counties provided justification for
focusing on the two nonprofit hospitals in Barrow and Clayton counties, but more specifically,
the patient population that visits their emergency departments. The patients who visit the
hospitals’ emergency departments comprise the insured, the uninsured, the underinsured and
other vulnerable groups. We chose as our unit of analysis the percentage of that population who
received Medicaid assistance.
22
Selecting variables and their measurements
The variables considered were cause for visit, age, and sexual orientation. Age refers to the
proportion of persons in the corresponding age groups of the target population; cause refers to
the underlying cause of illness; and sexual orientation refers to gender that is either male and
female. Detailed definitions of the terms used in the analysis are presented in Appendix B.
Data Analysis
In order to make the assumption that county level information was an accurate reflection of
the information available at the nonprofit hospital level, the researchers manipulated information
provided in the Online Analytical Statistical Information System (OASIS). The OASIS Web
Query Tool was the principal mechanism through which available qualitative information
relating to the counties was manipulated. This proved to be a very reliable source of information
since it is the repository of relevant health information which all hospitals are required to submit
to the Georgia Department of Human Resources, Division of Public Health. It provides
standardized health data by county on emergency visits, hospital discharge, and population.
Therefore, reporting on the usage pattern of the emergency departments by Medicaid patients of
the two counties was facilitated. The data generated for the years, 2004, 2005, 2006, 2007 and
2008 allowed for a comparative analysis to be undertaken. The inclusion of a cross-sectional
design to compare data at the state level proved a valuable strategy since it reinforced what was
reflected at the county level and could serve to stimulate further research on the issue. Future
research could be undertaken not only by administrators but also by professionals in other fields
of work who have different interests. It is well documented that the greatest value of cross-
sectional studies is in describing the relationships among several variables, but they are not very
23
appropriate for providing investigators with causes. From the analysis, an assessment was done
to determine whether nonprofit hospitals in Barrow and Clayton counties were meeting their role
of safety net providers and providing community benefits.
Study limitations
It is well known that hospitals offer many other services in addition to emergency care.
Therefore, concentration on a specific service can only serve as an indicator of the level of
performance by safety nets. Also exclusion of such important variables as race created a bias in
the results since it is well documented that strong health disparities exist among the various
races. The limited coverage of factors which are involved in offering Medicaid coverage was
also a constraint. Lastly, evaluating the performance of safety net hospitals in two of twenty-
eight counties in metropolitan Atlanta may not be sufficient to arrive at a conclusive decision on
their effectiveness. It must also be stressed that administrative data on its own can seldom
establish a clear causal link between outcomes and the factors that led to the outcomes. Safety
net performance is undoubtedly affected by many variables, including resource supply,
composition, support levels, demand levels, etc.
Findings
This section of the study examines the results of visits made by the Medicaid population
of Barrow and Clayton counties to the emergency departments of Barrow Regional Medical
Center and Southern Regional Medical Center. The examination highlights and compares trends
from 2004 to 2008 according to county, emergency department visit rate, principal reason for
visit, age categories and sexual orientation. A review of the tables in Appendix C indicate that
24
some cells indicate an asterisk. This occurred where the size of the selected population was
unknown and census population estimates were used as the denominator in the calculation of the
data. The major findings for years 2004 to 2008 follow.
Year 2004:
- Endocrine, Nutritional and Metabolic Diseases: A relatively high visit rate (1,692.7 visits
per 100,000 persons) was recorded for the 0-12 age category in Barrow County.
- Mental and Behavioral Disorders: The 13-19 and 20-29 age categories for both counties
showed higher visit rate levels than the other age categories.
- Nervous System Diseases, Bone and Muscle Diseases, and External Causes: Barrow
County recorded higher visit rate levels than Clayton County in all age categories.
Year 2005:
- Infectious and Parasitic Diseases: The visit rate levels for the 0-12 age category in both
counties are high in comparison to the other age categories (1,803.9 visits per 100,000
persons in Barrow County, and 973.7 per 100,000 in Clayton County).
- Mental and Behavioral Disorders: The 13-19, 20-29 and 30-44 age categories for both
counties showed higher visit rate levels than the other age categories. This trend
continued in the 45-49 age category for Barrow County.
- Digestive System Diseases: Comparatively high visit rate levels are recorded for the 0-12
age category in both counties (1,274.3 visits per 100,000 persons in Barrow County and
1,458.8 visits per 100,000 persons in Clayton County).
25
- Reproductive and Urinary System Diseases: The visit rate level in the 20-29 age category
for Clayton County was approximately three times that of Barrow County (1,416.4 visits
per 100,000 persons in Clayton County and 486.9 visits per 100,000 persons in Barrow
County).
- Respiratory Diseases: Visits made by the 0-12 age category for these diseases recorded
the highest visit rate level for both counties.
- Males and females recorded visit rate levels which were almost similar for respiratory
related diseases.
Year 2006:
- Infectious and Parasitic Diseases: In Barrow County, the 0-12 age category showed an
extremely high visit rate compared to all the other age categories for both counties.
- Respiratory Diseases: Relatively high visit rate levels were recorded for all categories in
both counties, with the 0-12 age category in both counties showing the highest levels.
- Digestive System Diseases: The 0-12 age category for both counties recorded the highest
visit rate level among the age categories (1,033.3 visits per 100,000 persons in Barrow
County and 1,300.1 per 100,000 in Clayton County). This trend was similar to that for
2005.
- External Causes: Visit rate levels were comparatively high for the 0-12 and 13-19 age
categories in both counties.
- Male and female visit rates for External Causes are higher in Barrow County than in
Clayton County.
26
Year 2007:
- Infectious and Parasitic Diseases: Barrow County had higher visit rate levels than
Clayton County in all age groups, except 20-29 and 30-44 age categories.
- Mental and Behavioral Disorders: The visit rate levels were very similar in both counties
with highest levels shown in the 13-19 and 20-29 age categories.
- Nervous System Diseases and Respiratory Diseases: The visit rate levels were higher in
all age categories for Barrow County. However, the 20-29 age category visit rate level
for Respiratory Diseases was lower than that of Clayton County.
- Digestive System Diseases: Among the 0-12 age category, the visit rate level was higher
than the other categories for both counties.
- External Causes: Barrow County showed much higher visit rate levels in all age
categories than Clayton County.
Year 2008:
- Infectious and Parasitic Diseases: Barrow County had a higher visit rate than Clayton
County for all age categories. The pattern approximates that of 2007.
- A similar pattern is evident in the visit rates for Nervous System Diseases and
Respiratory Diseases. However, in the 0-12 and 13-19 age groups, the levels for Barrow
County were almost double and triple times that of Clayton County for Infectious and
Parasitic Diseases.
27
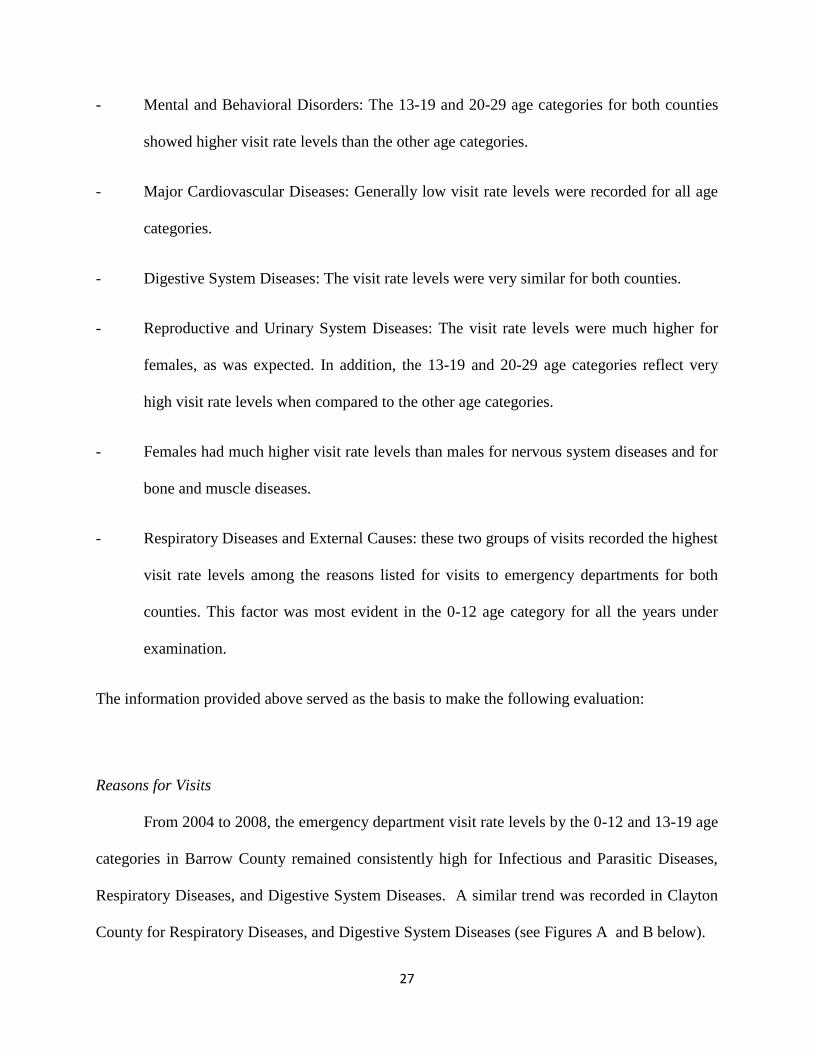
- Mental and Behavioral Disorders: The 13-19 and 20-29 age categories for both counties
showed higher visit rate levels than the other age categories.
- Major Cardiovascular Diseases: Generally low visit rate levels were recorded for all age
categories.
- Digestive System Diseases: The visit rate levels were very similar for both counties.
- Reproductive and Urinary System Diseases: The visit rate levels were much higher for
females, as was expected. In addition, the 13-19 and 20-29 age categories reflect very
high visit rate levels when compared to the other age categories.
- Females had much higher visit rate levels than males for nervous system diseases and for
bone and muscle diseases.
- Respiratory Diseases and External Causes: these two groups of visits recorded the highest
visit rate levels among the reasons listed for visits to emergency departments for both
counties. This factor was most evident in the 0-12 age category for all the years under
examination.
The information provided above served as the basis to make the following evaluation:
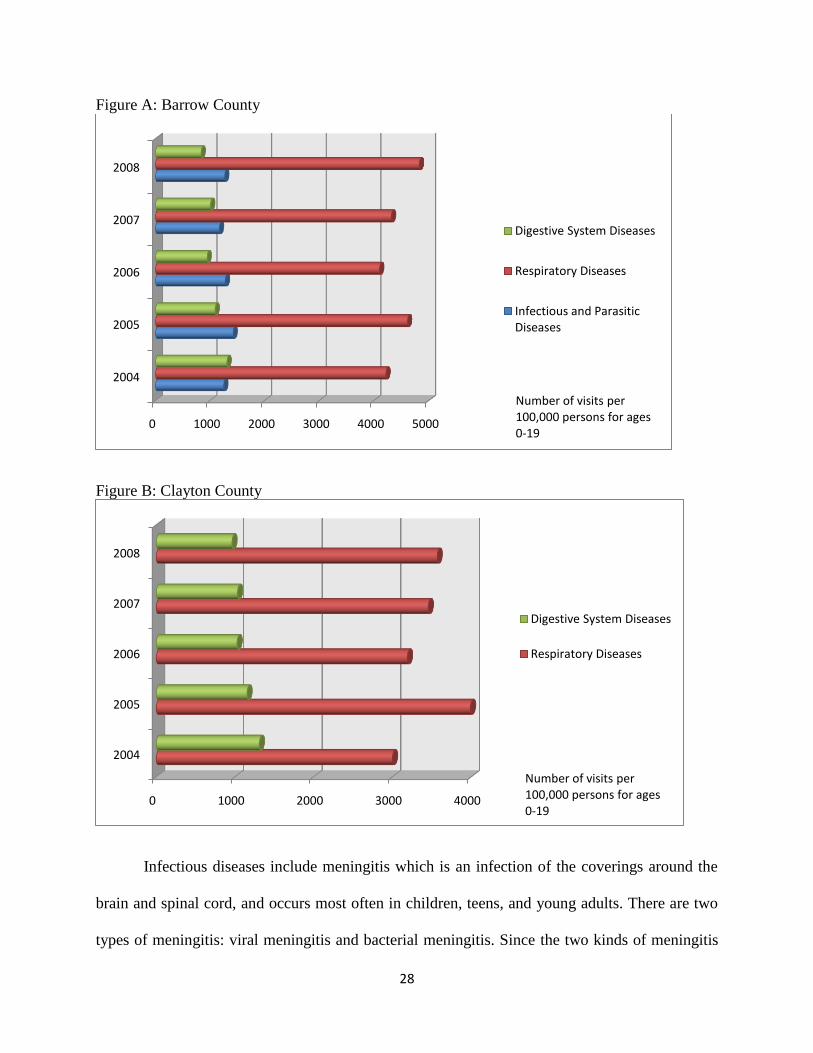
Reasons for Visits
From 2004 to 2008, the emergency department visit rate levels by the 0-12 and 13-19 age
categories in Barrow County remained consistently high for Infectious and Parasitic Diseases,
Respiratory Diseases, and Digestive System Diseases. A similar trend was recorded in Clayton
County for Respiratory Diseases, and Digestive System Diseases (see Figures A and B below).
28
Figure A: Barrow County
Figure B: Clayton County
Infectious diseases include meningitis which is an infection of the coverings around the
brain and spinal cord, and occurs most often in children, teens, and young adults. There are two
types of meningitis: viral meningitis and bacterial meningitis. Since the two kinds of meningitis
0 1000 2000 3000 4000 5000
2004
2005
2006
2007
2008
Digestive System Diseases
Respiratory Diseases
Infectious and Parasitic Diseases
Number of visits per100,000 persons for ages 0-19
0 1000 2000 3000 4000
2004
2005
2006
2007
2008
Digestive System Diseases
Respiratory Diseases
Number of visits per100,000 persons for ages 0-19
29
share the same symptoms, it is highly recommended that persons displaying symptoms related to
this disease should see a doctor immediately for a diagnosis to be done. If not treated promptly,
bacterial meningitis could lead to death. Respiratory diseases range from mild and self-limiting
such as the common cold to life-threatening such as bacterial pneumonia or pulmonary
embolism. Included among digestive system diseases are ruptured appendix, and gastrointestinal
bleeding. If a person has appendicitis and does not have surgery in time, the appendix can
rupture and cause serious problems, sometimes even leading to death. Similarly, gastrointestinal
bleeding could lead to death if left untreated.
Many of the illnesses mentioned above affect young children who accounted for the
highest visit rate levels. When children have fevers, particularly those that are prolonged or carry
high temperatures, there is cause for much concern that they may have a serious illness.
Therefore, they are often taken for emergency treatment as a form of precaution. The
descriptions and effects of the diseases cited above convey the immediacy and urgency with
which affected patients should seek medical attention. The case has been made repeatedly that
the emergency department may not be the most appropriate for the treatment of the diseases
affecting Medicaid patients, a large percentage of whom comprise children. However, they are
impacted by the treatment administered during emergency visits.
It was previously noted in this study that even when persons have insurance coverage,
they sometimes delay preventive and other care due to the fear of cost. Another major
contributory factor to the high rates of visits to the emergency department is the lack of
knowledge or education about the importance of having a primary healthcare provider. For some
of the diseases, visit rate levels to the emergency departments of the two nonprofit hospitals are
very high and recommendations will include educating Medicaid patients about seeking care
30
early and elsewhere. While no information was available in this study about how many lives are
actually saved through visits to the emergency departments, the 1992 National Hospital Statistics
Survey reported that of 119.2 million visits made to emergency departments, 12.8 percent (15.3
million visits and 5.2 visits per 100 population) resulted in admission to the hospital (Pitts et al.
2008).
Utilization rates between the two counties fluctuated according to reason for visit but
generally, Barrow County which has a smaller population recorded higher visit rates than
Clayton County. The size of Barrow County in relation to the high visit rate levels for some
diseases could cause concern. However, Barrow Regional Medical Center should be commended
for its ability to treat such large numbers of patients and highlights the fact that size does not
matter in relation to the impact of community benefit. In fact, the Center was cited in a study as
one of two hospitals in metropolitan Atlanta that provided the highest level of free care for poor
people (Lang 2010).
Visits by Age Categories
Visits for respiratory diseases reflected an extremely high visit rate among the 0-12 and
13-19 age categories in both counties. However, while the visit rate decreased for the 20-29 age
group, the reduction was not as steep in Clayton County as it was in Barrow County (see Figures
A and B above). These trends may be explained by the fact that shortness of breath, labored or
difficult breathing, asthma, and wheezing have been judged to be among the leading causes of
visits to the emergency department. In addition, the expectation is that as a person gets older, the
31
symptoms associated with asthma and wheezing usually decrease or disappear leading to less
reasons to seek emergency care.
Several circumstances may explain the high visit rate levels among these age
categories. On many occasions, seeking treatment is delayed until a person’s medical condition
has seriously worsened. If treatment is received earlier in an ambulatory care setting, the trip to
the emergency department might have been avoided. For children aged 0-2 years, adults are
unable to purchase over-the-counter medications to relieve symptoms. Therefore, adults use the
emergency department to obtain the required medications as well as to receive supportive care.
Some adults administer home treatments or remedies for some of the illnesses and only when the
children’s conditions do not improve, are the children rushed for emergency care. Another
reason for emergency visits could be that many working parents are unable to keep appointments
with primary care providers and therefore seek medical attention for their children in the
emergency department. A major reason is related to an adult’s decision to take persons in these
age groups (particularly the 0-12 age group) for emergency care since in most cases they are
unable to describe their symptoms very well.
When external causes are excluded from the list of reasons for visits, overall persons 0-12
and 13-19 years of age had a higher emergency department visit rate than persons in the other
four age categories. The 2006 emergency department Summary state that the most common
reasons for emergency department visits among children (aged 15 years and under) included
fever, cough, vomiting, and earache, and the most common specific principal reasons given by
adult patients (aged 15 years and older) for seeking emergency care were, in descending
frequency: chest pain, abdominal pain, back pain, headache, and shortness of breath (Pitts et al.
2008).
32
Among visits made for reproductive and urinary system diseases, the highest visit rate
levels were recorded among the 13-19 and 20-29 age categories. This is expected since these age
categories (particularly the 20-29 age category) are included in the period when most females
decide to have children. Pregnancy-related illnesses may include complications during
pregnancies, miscarriages or abortions, all of which could lead patients to seek emergency care.
Even though it was reported that it is costlier to treat a urinary tract infection in the emergency
room than in a clinic or primary care setting, a visit to the emergency department sometimes
saves the lives of persons.
An analysis of emergency visits by Medicaid patients at the state level was conducted
using the same variables as for the county analyses and for the same period 2004 to 2008 (see
Appendix C). The data obtained reveal a similar trend in relation to the high visit rate levels for
specific diseases.
Analysis of emergency department records usually cannot provide a causal explanation
for high visit rates for non-emergent, primary care treatable, or preventable/avoidable conditions.
However, an analysis of patterns of use among subgroups in the population could assist in
identifying areas of particular concern to focus further inquiry or to develop intervention
strategies. Therefore, the researchers make the following recommendations for rationalizing the
flow of Medicaid patients to emergency departments of the two nonprofit hospitals.
Recommendations and Conclusion
High usage rates of emergency departments are typically the result of a failure of the
primary care delivery system. However, if other parties such as health educators, community
33
leaders and the patients themselves, share responsibility for ensuring the correct use of
emergency departments, this could lead to effectiveness, equity and efficiency in the system.
An important first step would be to make the primary care delivery system more
responsive to the residents it serves by understanding the factors that influence the decisions of
patients when they become ill and how they want healthcare services delivered. Their
unawareness of alternative places to seek care and their belief that better care is provided in the
emergency department need to be addressed. The primary care delivery system should seek to
reduce waiting times at clinics and doctors’ offices, expand office hours, and facilitate telephone
consultations so that patients could obtain care that is more timely and appropriate. Educational
strategies informed by patients’ preferences should also be developed by the primary care system
to assist patients identify warning signs of disease and better manage chronic conditions. The
provision of community benefits such as clinic support, health screenings and appropriate
follow-up care could assist in patients’ health conditions being more affordably treated in
settings outside the emergency room.
The introduction of mandatory managed care for most Medicaid beneficiaries has meant
lower payment rates and loss of Medicaid market share for many safety net primary care
providers, including public hospitals and community health centers. This occurrence led to
competition for Medicaid patients. On the other hand, collaboration would lead to a more
cohesive network of safety net providers which would in turn allow for scarce resources to be
better leveraged in the community, and function more effectively on behalf of the low-income
and uninsured residents of Barrow and Clayton counties. Eventual cost-effectiveness could be
achieved if the primary care delivery system could be better rewarded for providing a lower-cost
alternative to emergency department use and for preventing emergency conditions from
34
developing (Billings, Parikh and Mijanovich 2000). The Patient Protection and Affordable Care
Act proposes the expansion of Medicaid to all non-Medicare eligible individuals under age 65. It
is expected that an expansion of the Medicaid population would lead to more resources to be
shared among primary care providers. Without stronger incentives and higher payment rates,
there will be fewer sources of primary care in the future and a greater dependence on emergency
departments.
When patients visit the emergency departments, health educators should serve as
gatekeepers and seize the opportunity to share information about total wellness programs. Where
these programs exist, health educators should seek to intensify them and launch new programs
wherever the target groups are most likely to converge, such as in schools. Action of this nature
could lead to lifestyle changes. In addition, some level of equity could be gained in the
healthcare system by enacting programs that help reduce barriers to health care access, such as
screenings with appropriate follow-up care and health education. The overall fiscal and physical
health of a community will also be enhanced.
Hospitals are required to submit uniform, computerized emergency department records,
similar to that from which the findings for this study were extracted. The ability to track
developments and calculate data from population-based rates would allow for more detailed
analysis and the targeting of specific geographic areas or population subgroups within Barrow
and Clayton counties where the most serious problems exist. There is a strong likelihood that
some health educators reside within the community where they are employed. This places them
in an advantageous position to share health improvement data with key stakeholders, and become
involved in local change efforts to increase overall access and avoid the misuse of emergency
departments.
35
Community leaders should be used as change agents, and to introduce programs to
support community coalitions in the design, implementation, and evaluation of unique
community-driven strategies. These programs could be instrumental in diverting patients away
from, and reduce the use of, emergency departments as the first point of access. Programs similar
to the Eat Smart Program organized by the Vegetarian Society of the District of Columbia could
be developed for Medicaid patients and their families (Carter 2008). This program addresses the
health disparities in Washington D.C. and aims to educate the population on how they can avoid
life-threatening illnesses through adopting a plant-based diet and reduce expenditure on
processed foods. Eat Smart offers nutrition, cooking and shopping classes to its students wherein
they will understand the connection between health and diet. The inability of the primary care
system to deliver care to those who most need it is one of the social determinants of health. Poor
and unequal living conditions are the consequence of poor social policies and program, unfair
economic arrangements, and bad politics. Therefore action on the social determinants of health
must involve the whole of government, civil society and local communities.
The percentage of persons living below the poverty level in Barrow and Clayton counties
range from 11.3 to 14.7 percent. Where poverty exists, as it does in Barrow and Clayton
counties, low-income households are usually adversely affected in several ways including lack of
access to appropriate healthcare. Government safety net programs were established to protect
families who fall into this category but they are under increasing pressure to deliver the services
for which they were established.
The healthcare safety net comprises a wide variety of primary care systems to deliver
care to low-income and other vulnerable populations, including the uninsured and those covered
by Medicaid. Healthcare safety net providers have a legal mandate to provide services regardless
36
of a patient’s ability to pay and much of this care takes place in the emergency departments. the
Barrow Regional Medical Center and the Southern Regional Medical Center, both nonprofit
hospitals, comprise part of the healthcare safety net. Concern has been expressed about the level
of community benefits that nonprofit hospitals offer in return for tax exemptions they receive.
When nonprofit hospitals do not provide the appropriate level of community benefits, inequity in
the level of care results since other hospitals are forced to carry the burden of care for those who
need assistance. This study successfully determined that nonprofit hospitals still provide a
community benefit through the services received by Medicaid patients in the emergency
departments.
Medicaid is a critical component of any safety net program and offers insurance coverage
to low-income individuals and families who fit into an eligibility group recognized by federal
and state law. Some of the patients covered by Medicaid delay preventive and other care due to
fear of cost or because of uncertainty whether they can pay their part of the hospital bill. Others
avoid care until their condition escalates into an emergency, are unaware of alternatives for
treatment or believe that better care is received through emergency care. If departments other
than the emergency departments of Barrow Regional Medical Center and Southern Regional
Medical Center could assist low-income, uninsured and underinsured patients to access
affordable healthcare and provide clinic support, health screenings and appropriate follow-up
care, health conditions of patients could be more affordably treated in settings outside the
emergency room. A component of the Patient Protection and Affordable Care Act includes the
creation of a new Medicaid state plan option which would permit certain Medicaid enrollees to
designate a provider as a health home. The creation of a such structure should serve to divert
some of patients who visit the emergency departments to other departments of a safety net
37
hospital and allow for care management, care coordination, and health promotion (Focus on
Health Reform 2010).
While it has been established that visits to emergency departments play a major role in
saving lives, and that a visit to the emergency department could be indicative of an urgency, it is
not always the most appropriate facility to visit. The conditions of many patients who visit are
non-emergent, and others whose conditions are emergent, could be treated in a primary care
setting. If their use for non-emergent cases is substantially reduced, nonprofit hospitals could
better fulfill the community benefits they are expected to offer through services offered in the
emergency departments. Waiting times would be shortened, hallway boarding would be reduced
and generally there would be greater efficiency in the operations of emergency departments.
Accessible and high quality emergency services provide a benefit that is not tangible but
yet highly valued. This is a community benefit that too often goes unnoticed. Whether it serves
as a first choice or last chance source of care, the emergency department provides a valuable and
irreplaceable service for all community residents, including low-income underserved
populations.
38
References
American Hospital Directory. 2010. Individual hospital statistics.
http://www.ahd.com/freesearch.php (accessed September 23, 2010).
Angel, Ronald, Laura Lein, and Jane Henrici. 2006. Poor families in America’s health care
crisis. Cambridge ; New York : Cambridge University Press.
Barrow County. 2010. Homepage.
http://barrowcounty.georgia.gov/03/home/0,2230,8894809,00.html (accessed September
3, 2010).
Barrow Regional Medical Center History. 2010. Homepage
http://www.barrowregional.com/default.aspx (accessed September 8, 2010).
Billings, John, Nina Parikh, and Tod Mijanovich. 2000. Emergency room use: The New York
story. The Commonwealth Fund.
http://www.commonwealthfund.org/usr_doc/billings_nystory.pdf?section=4039
(accessed November 3, 2010).
Centers for Medicare and Medicaid Services. 2005. Medicaid at-a-glance.
http://www.cms.gov/MedicaidDataSourcesGenInfo/02_MAAG2005.asp (accessed June
5, 2010).
Carter, Avi. 2008. Vegetarian action: Eat smart program encourages healthy eating for minority
and low-income populations in Washington, D.C. Vegetarian Journal, 27 (2): 35.
Clayton County. 2010. Homepage.
http://claytoncounty.georgia.gov/03/home/0,2230,8304791,00.html (accessed September
3, 2010).
39
Congressional Budget Office. 2006. Nonprofit hospitals and the provision of community benefits.
http://www.cbo.gov/ftpdocs/76xx/doc7695/12-06-Nonprofit.pdf (accessed September 9,
2010).
Crossley, Mary A. 2008. Non-profit hospitals, tax exemption and access for the uninsured.
Pittsburg Journal of Environmental and Public Health Law.
http://pjephl.law.pitt.edu/files/Crossley.pdf (accessed July 21, 2010).
Davidson, M. Stephen, and Ronald C. Wacker. 1974. Community hospitals and Medicaid.
Medical Care, 12 (2): 115-130.
Ernst and Young. 2006. Community benefit information from non-profit hospitals: lessons
learned from the 2006 IRS compliance check questionnaire. 27 November.
http://www.aha.org/aha/content/2006/pdf/061127-ErnstYcombenreport.pdf (accessed
June 27, 2010).
Focus on Health Reform. 2010. Patient Protection and Affordable Care Act (P.L. 111-148).
Summary of New Health Reform Law. http://www.kff.org/healthreform (accessed on
September 10, 2010).
Fox, Daniel M., and Daniel C. Schaffer. 1991. Tax administration as health policy: hospitals, the
internal revenue service, and the courts. Journal of Health Politics, Policy and Law
16(2): 251-279.
Georgia County Guide. 2010. Center for Agribusiness and Economic Development. University
of Georgia. http://www.georgiastats.uga.edu/counties (accessed September 12, 2010).
Georgia Department of Community Health. 2010. Georgia families.
http://dch.georgia.gov/00/channel_title/0,2094,31446711_42144860,00.html (accessed
October 29, 2010).
40
Georgians for a Healthy Future. 2009. Issues. http://healthyfuturega.org/issues/coverage
(accessed September 27, 2010).
Georgia Power and Metro Atlanta Chamber of Commerce. 2009. Metro Atlanta overview.
http://www.metroatlantachamber.com/content (accessed September 10, 2010).
Internal Revenue Service. 2009. IRS exempt organizations hospital study.
http://www.irs.gov/pub/irs-tege/execsum_hospprojrept.pdf (accessed Sep 7, 2010).
Internal Revenue Service. 1956. Revenue Ruling 56-185, 1956-1 C.B. 202.
Internal Revenue Service. 1969. Revenue Ruling 69-545, 1969-2 C.B. 117.
Institute of Medicine of the National Academies. 2007. Hospital-based emergency care at the
breaking point. Committee on the Future of Emergency Care in the United States Health
System. Washington, DC: National Academies Press.
Institute of Medicine of the National Academies. 2000. America’s healthcare safety net: intact
but endangered. Report Summary.
Kerr, Jennifer. 2009. Poll: Many Americans fear growing health costs. http://www.ap.org
(accessed September 12, 2010).
Lang, Holly. 2010. Metropolitan Atlanta hospital accountability project, Georgia Watch.
Lewin, E. Marion, and Raymond J. Baxter. 2007. America's health care safety net: Revisiting the
2000 IOM report. Health Affairs , 26 (5): 1490-1494.
Nichols, Austin. 2010. Poverty in the United States. Urban Institute Research of Record.
Nicholson, Sean, Mark V. Pauly, Lawton R. Burns, Agnieshka Baumritter, David A. Asch. 2000.
Measuring community benefits provided by for-profit and nonprofit hospitals. Health
Affairs 19(6): 168-177.
41
Northington, William, Jane Brice and Bin Zou. 2005. Use of an emergency department by
nonurgent patients. The American Journal of Emergency Medicine 23: 131-137.
Online Analytical Statistical Information System (OASIS). 2010. Georgia Department
of Human Resources, Division of Public Health, Office of Health Information and Policy.
http://oasis.state.ga.us/oasis/ (accessed July 30, 2010).
PeachCare for Kids. 2010. What is peachcare for kids?
http://www.peachcare.org/FaqView.aspx?displayFaqId=101 (accessed October 29,
2010).
Pitts, Stephen R., Richard W. Niska, Jianmin Xu, and Catharine W. Burt. 2008. National
Hospital Ambulatory Medical Care Survey: 2006 Emergency Department Summary.
National Health Statistics Reports. 7
Rowland, Diane, & James R. Tallon Jr. 2003. Medicaid: Lessons from a decade. Health Affairs,
22 (1): 138. http://www.proquest.com (accessed September 25, 2010).
Southern Regional Health System. 2010. http://www.southernregional.org/index.aspx (accessed
September 8, 2010).
State Health Facts. 2010. Medicaid enrollment.
http://www.statehealthfacts.org/profileind.jsp?ind=198&cat=4&rgn=12&cmprgn=1
(accessed September 5, 2010).
Ullman, Frank. 1999. Health policy for low-income people in Georgia. Urban Institute Research
of Records. Highlights from State Reports.
Urban Institute. 2010. Research area: Poverty and safety net. Research Record. Washington,
D.C.
42
U.S. Census Bureau. 2010. Income, poverty and health insurance in the United States: 2009 –
Highlights. Current Population Survey (CPS), 2010 Annual Social and Economic
Supplement (ASEC).
U.S. Department of Health and Human Services. 2000. The role of our safety net providers and
the uninsured. http://www.hhs.gov/asl/testify/t000323b.html (accessed July 7, 2010).
Walker, D. M. 2005. Nonprofit, For-Profit, and Government Hospitals: Uncompensated Care
and Other Community Benefits. Testimony, United States Government Accountability
Office.
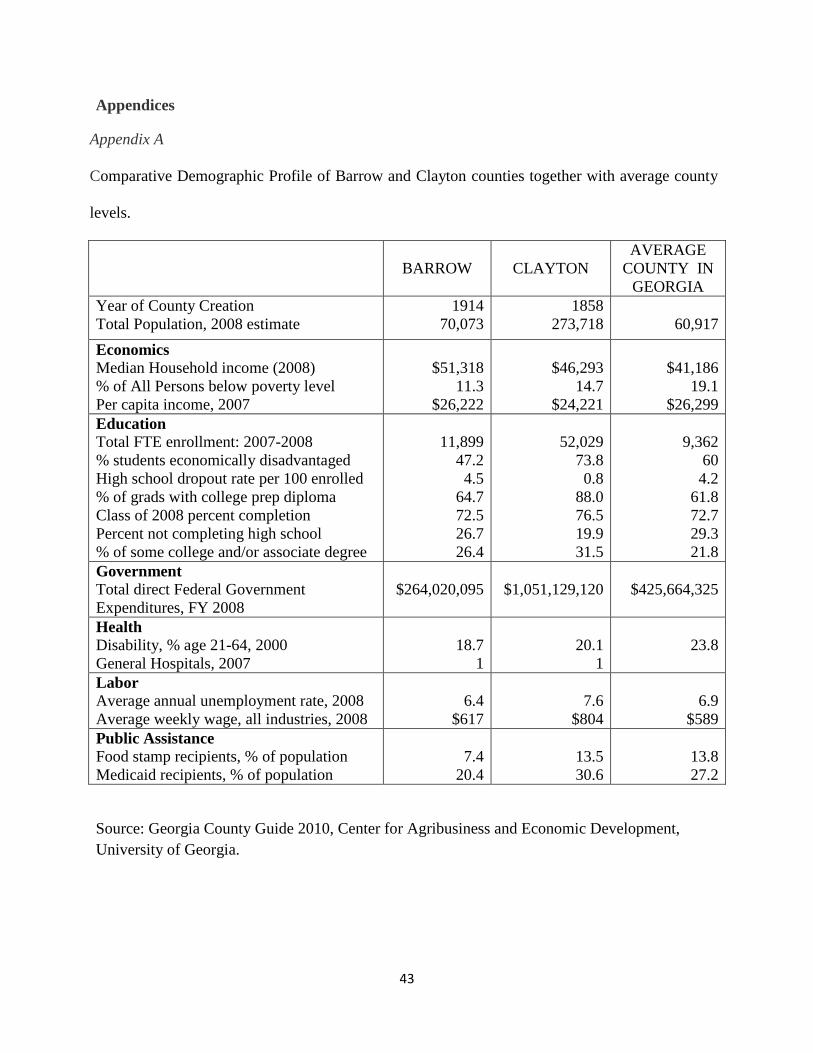
43
Appendices
Appendix A
Comparative Demographic Profile of Barrow and Clayton counties together with average county
levels.
BARROW CLAYTON
AVERAGE
COUNTY IN
GEORGIA
Year of County Creation
Total Population, 2008 estimate
1914
70,073
1858
273,718
60,917
Economics
Median Household income (2008)
% of All Persons below poverty level
Per capita income, 2007
$51,318
11.3
$26,222
$46,293
14.7
$24,221
$41,186
19.1
$26,299
Education
Total FTE enrollment: 2007-2008
% students economically disadvantaged
High school dropout rate per 100 enrolled
% of grads with college prep diploma
Class of 2008 percent completion
Percent not completing high school
% of some college and/or associate degree
11,899
47.2
4.5
64.7
72.5
26.7
26.4
52,029
73.8
0.8
88.0
76.5
19.9
31.5
9,362
60
4.2
61.8
72.7
29.3
21.8
Government
Total direct Federal Government
Expenditures, FY 2008
$264,020,095
$1,051,129,120
$425,664,325
Health
Disability, % age 21-64, 2000
General Hospitals, 2007
18.7
1
20.1
1
23.8
Labor
Average annual unemployment rate, 2008
Average weekly wage, all industries, 2008
6.4
$617
7.6
$804
6.9
$589
Public Assistance
Food stamp recipients, % of population
Medicaid recipients, % of population
7.4
20.4
13.5
30.6
13.8
27.2
Source: Georgia County Guide 2010, Center for Agribusiness and Economic Development,
University of Georgia.
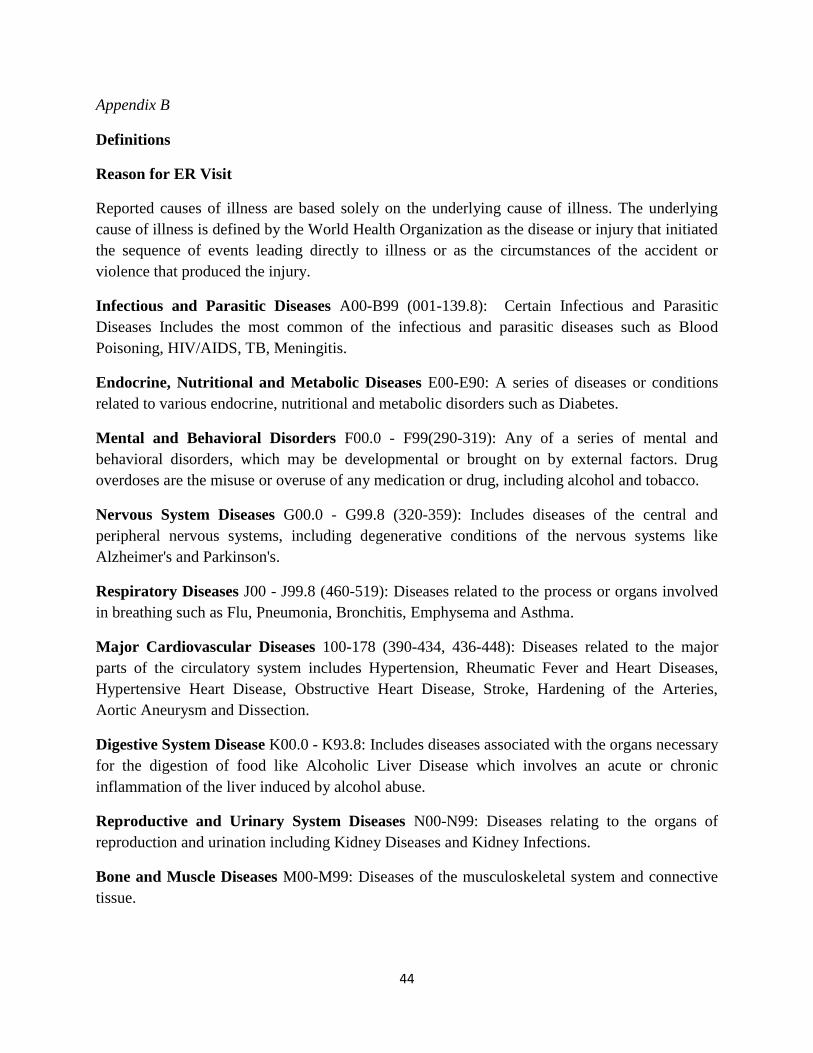
44
Appendix B
Definitions
Reason for ER Visit
Reported causes of illness are based solely on the underlying cause of illness. The underlying
cause of illness is defined by the World Health Organization as the disease or injury that initiated
the sequence of events leading directly to illness or as the circumstances of the accident or
violence that produced the injury.
Infectious and Parasitic Diseases A00-B99 (001-139.8): Certain Infectious and Parasitic
Diseases Includes the most common of the infectious and parasitic diseases such as Blood
Poisoning, HIV/AIDS, TB, Meningitis.
Endocrine, Nutritional and Metabolic Diseases E00-E90: A series of diseases or conditions
related to various endocrine, nutritional and metabolic disorders such as Diabetes.
Mental and Behavioral Disorders F00.0 - F99(290-319): Any of a series of mental and
behavioral disorders, which may be developmental or brought on by external factors. Drug
overdoses are the misuse or overuse of any medication or drug, including alcohol and tobacco.
Nervous System Diseases G00.0 - G99.8 (320-359): Includes diseases of the central and
peripheral nervous systems, including degenerative conditions of the nervous systems like
Alzheimer's and Parkinson's.
Respiratory Diseases J00 - J99.8 (460-519): Diseases related to the process or organs involved
in breathing such as Flu, Pneumonia, Bronchitis, Emphysema and Asthma.
Major Cardiovascular Diseases 100-178 (390-434, 436-448): Diseases related to the major
parts of the circulatory system includes Hypertension, Rheumatic Fever and Heart Diseases,
Hypertensive Heart Disease, Obstructive Heart Disease, Stroke, Hardening of the Arteries,
Aortic Aneurysm and Dissection.
Digestive System Disease K00.0 - K93.8: Includes diseases associated with the organs necessary
for the digestion of food like Alcoholic Liver Disease which involves an acute or chronic
inflammation of the liver induced by alcohol abuse.
Reproductive and Urinary System Diseases N00-N99: Diseases relating to the organs of
reproduction and urination including Kidney Diseases and Kidney Infections.
Bone and Muscle Diseases M00-M99: Diseases of the musculoskeletal system and connective
tissue.
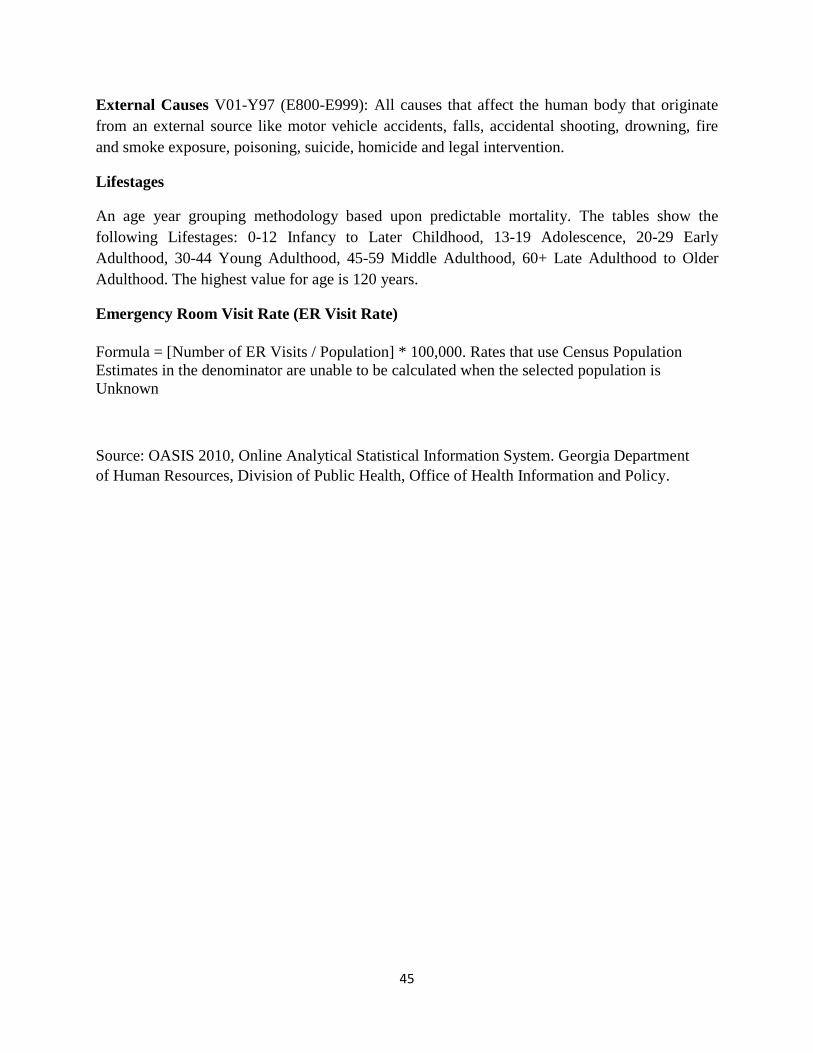
45
External Causes V01-Y97 (E800-E999): All causes that affect the human body that originate
from an external source like motor vehicle accidents, falls, accidental shooting, drowning, fire
and smoke exposure, poisoning, suicide, homicide and legal intervention.
Lifestages
An age year grouping methodology based upon predictable mortality. The tables show the
following Lifestages: 0-12 Infancy to Later Childhood, 13-19 Adolescence, 20-29 Early
Adulthood, 30-44 Young Adulthood, 45-59 Middle Adulthood, 60+ Late Adulthood to Older
Adulthood. The highest value for age is 120 years.
Emergency Room Visit Rate (ER Visit Rate)
Formula = [Number of ER Visits / Population] * 100,000. Rates that use Census Population
Estimates in the denominator are unable to be calculated when the selected population is
Unknown
Source: OASIS 2010, Online Analytical Statistical Information System. Georgia Department
of Human Resources, Division of Public Health, Office of Health Information and Policy.
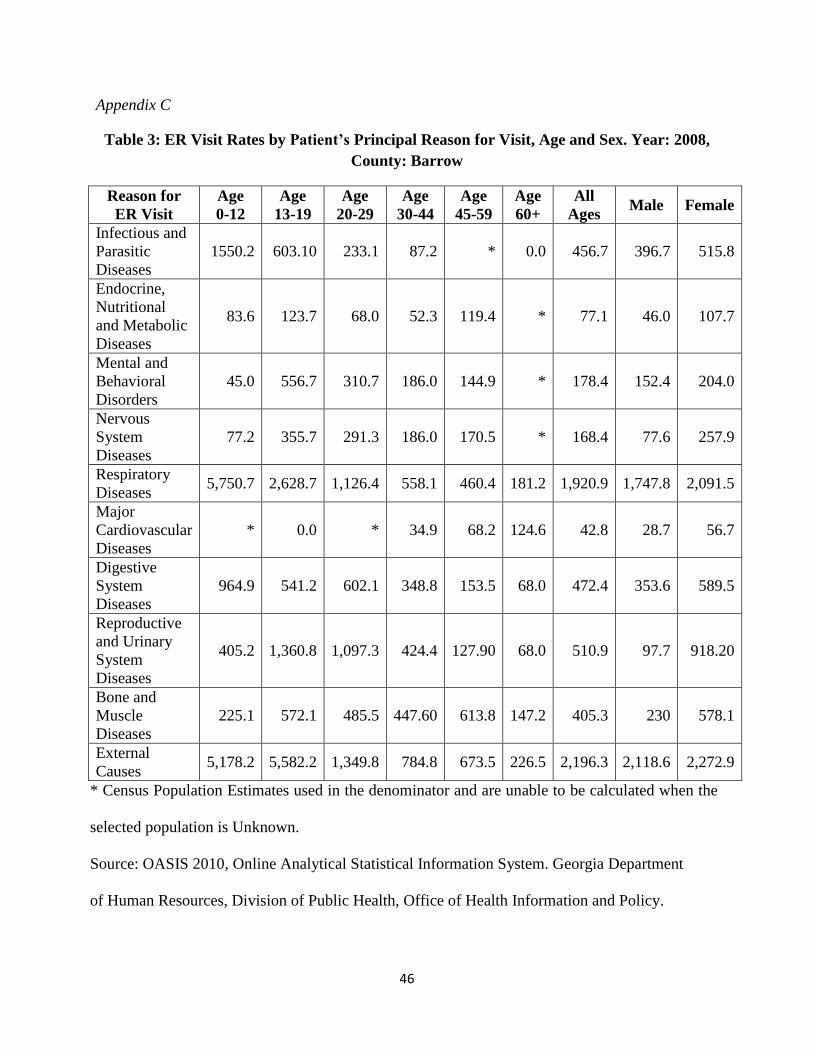
46
Appendix C
Table 3: ER Visit Rates by Patient’s Principal Reason for Visit, Age and Sex. Year: 2008,
County: Barrow
* Census Population Estimates used in the denominator and are unable to be calculated when the
selected population is Unknown.
Source: OASIS 2010, Online Analytical Statistical Information System. Georgia Department
of Human Resources, Division of Public Health, Office of Health Information and Policy.
Reason for
ER Visit
Age
0-12
Age
13-19
Age
20-29
Age
30-44
Age
45-59
Age
60+
All
Ages Male Female
Infectious and
Parasitic
Diseases
1550.2 603.10 233.1 87.2 * 0.0 456.7 396.7 515.8
Endocrine,
Nutritional
and Metabolic
Diseases
83.6 123.7 68.0 52.3 119.4 * 77.1 46.0 107.7
Mental and
Behavioral
Disorders
45.0 556.7 310.7 186.0 144.9 * 178.4 152.4 204.0
Nervous
System
Diseases
77.2 355.7 291.3 186.0 170.5 * 168.4 77.6 257.9
Respiratory
Diseases 5,750.7 2,628.7 1,126.4 558.1 460.4 181.2 1,920.9 1,747.8 2,091.5
Major
Cardiovascular
Diseases
* 0.0 * 34.9 68.2 124.6 42.8 28.7 56.7
Digestive
System
Diseases
964.9 541.2 602.1 348.8 153.5 68.0 472.4 353.6 589.5
Reproductive
and Urinary
System
Diseases
405.2 1,360.8 1,097.3 424.4 127.90 68.0 510.9 97.7 918.20
Bone and
Muscle
Diseases
225.1 572.1 485.5 447.60 613.8 147.2 405.3 230 578.1
External
Causes 5,178.2 5,582.2 1,349.8 784.8 673.5 226.5 2,196.3 2,118.6 2,272.9
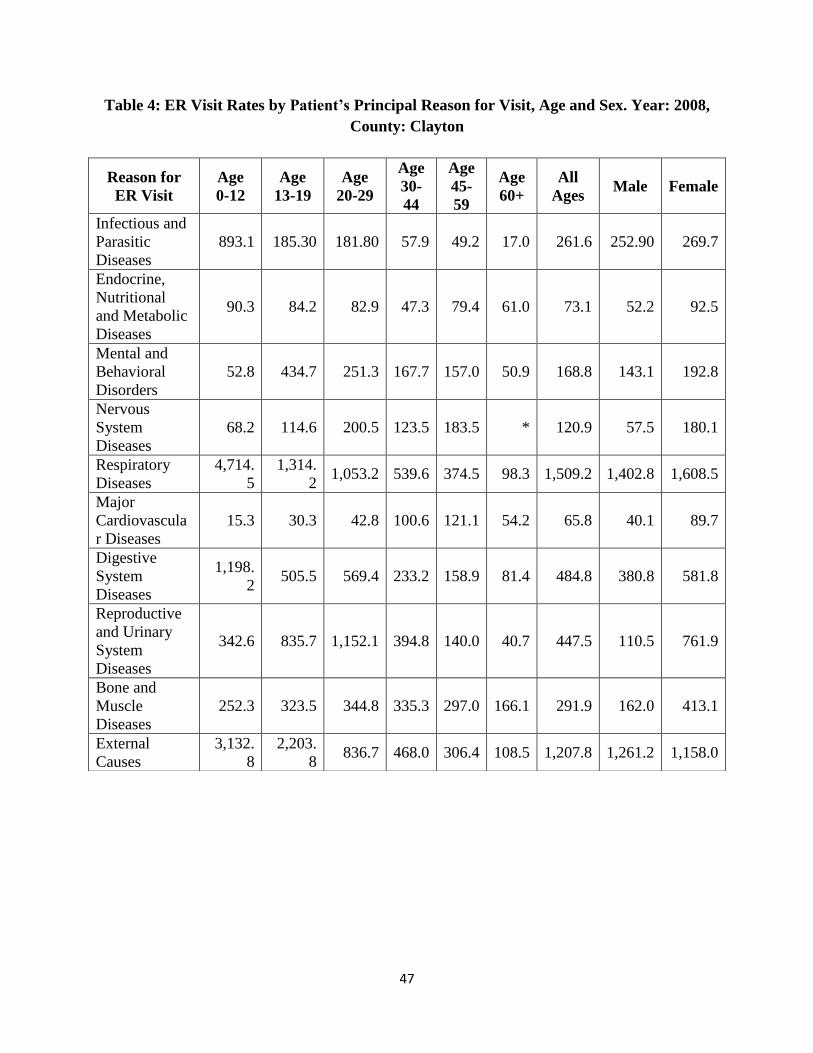
47
Table 4: ER Visit Rates by Patient’s Principal Reason for Visit, Age and Sex. Year: 2008,
County: Clayton
Reason for
ER Visit
Age
0-12
Age
13-19
Age
20-29
Age
30-
44
Age
45-
59
Age
60+
All
Ages Male Female
Infectious and
Parasitic
Diseases
893.1 185.30 181.80 57.9 49.2 17.0 261.6 252.90 269.7
Endocrine,
Nutritional
and Metabolic
Diseases
90.3 84.2 82.9 47.3 79.4 61.0 73.1 52.2 92.5
Mental and
Behavioral
Disorders
52.8 434.7 251.3 167.7 157.0 50.9 168.8 143.1 192.8
Nervous
System
Diseases
68.2 114.6 200.5 123.5 183.5 * 120.9 57.5 180.1
Respiratory
Diseases
4,714.
5
1,314.
2 1,053.2 539.6 374.5 98.3 1,509.2 1,402.8 1,608.5
Major
Cardiovascula
r Diseases
15.3 30.3 42.8 100.6 121.1 54.2 65.8 40.1 89.7
Digestive
System
Diseases
1,198.
2 505.5 569.4 233.2 158.9 81.4 484.8 380.8 581.8
Reproductive
and Urinary
System
Diseases
342.6 835.7 1,152.1 394.8 140.0 40.7 447.5 110.5 761.9
Bone and
Muscle
Diseases
252.3 323.5 344.8 335.3 297.0 166.1 291.9 162.0 413.1
External
Causes
3,132.
8
2,203.
8 836.7 468.0 306.4 108.5 1,207.8 1,261.2 1,158.0
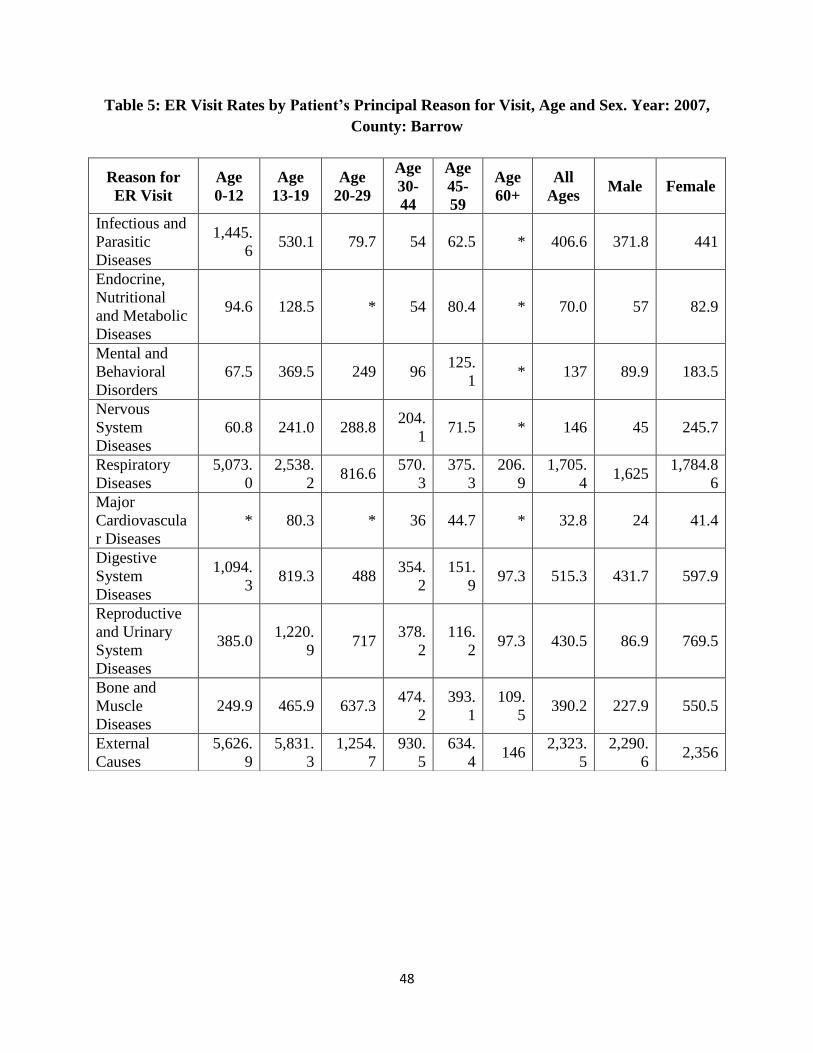
48
Table 5: ER Visit Rates by Patient’s Principal Reason for Visit, Age and Sex. Year: 2007,
County: Barrow
Reason for
ER Visit
Age
0-12
Age
13-19
Age
20-29
Age
30-
44
Age
45-
59
Age
60+
All
Ages Male Female
Infectious and
Parasitic
Diseases
1,445.
6 530.1 79.7 54 62.5 * 406.6 371.8 441
Endocrine,
Nutritional
and Metabolic
Diseases
94.6 128.5 * 54 80.4 * 70.0 57 82.9
Mental and
Behavioral
Disorders
67.5 369.5 249 96 125.
1 * 137 89.9 183.5
Nervous
System
Diseases
60.8 241.0 288.8 204.
1 71.5 * 146 45 245.7
Respiratory
Diseases
5,073.
0
2,538.
2 816.6
570.
3
375.
3
206.
9
1,705.
4 1,625
1,784.8
6
Major
Cardiovascula
r Diseases
* 80.3 * 36 44.7 * 32.8 24 41.4
Digestive
System
Diseases
1,094.
3 819.3 488
354.
2
151.
9 97.3 515.3 431.7 597.9
Reproductive
and Urinary
System
Diseases
385.0 1,220.
9 717
378.
2
116.
2 97.3 430.5 86.9 769.5
Bone and
Muscle
Diseases
249.9 465.9 637.3 474.
2
393.
1
109.
5 390.2 227.9 550.5
External
Causes
5,626.
9
5,831.
3
1,254.
7
930.
5
634.
4 146
2,323.
5
2,290.
6 2,356
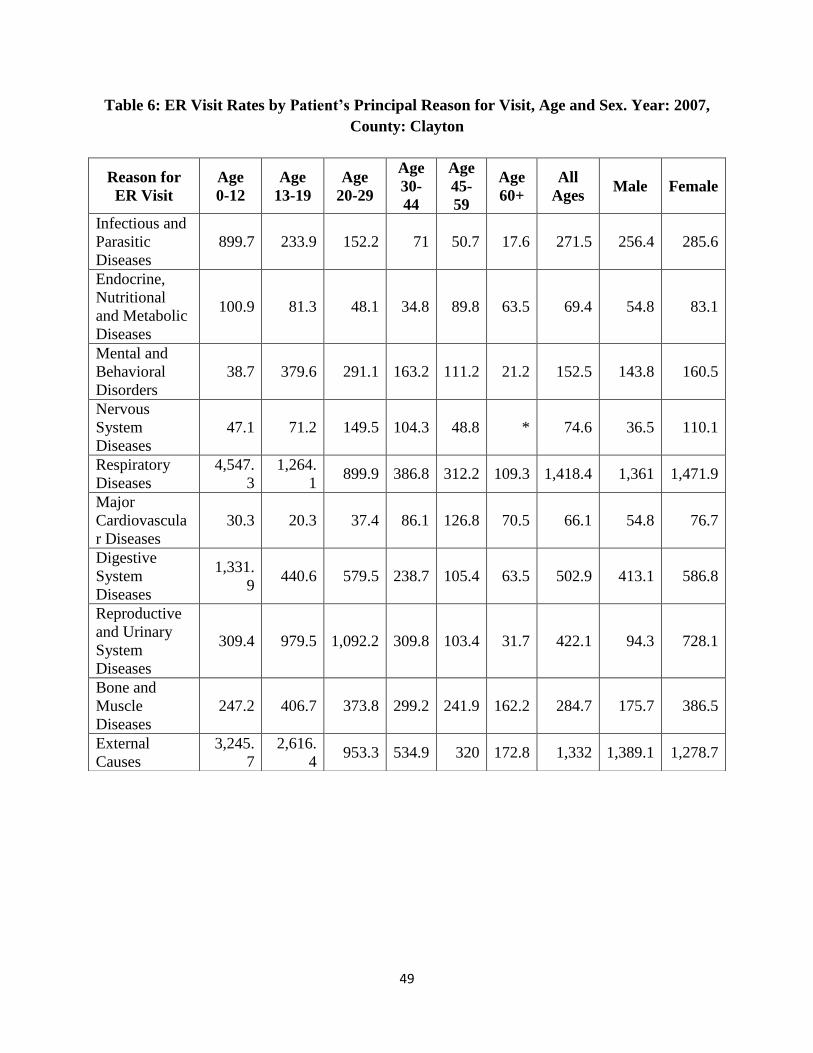
49
Table 6: ER Visit Rates by Patient’s Principal Reason for Visit, Age and Sex. Year: 2007,
County: Clayton
Reason for
ER Visit
Age
0-12
Age
13-19
Age
20-29
Age
30-
44
Age
45-
59
Age
60+
All
Ages Male Female
Infectious and
Parasitic
Diseases
899.7 233.9 152.2 71 50.7 17.6 271.5 256.4 285.6
Endocrine,
Nutritional
and Metabolic
Diseases
100.9 81.3 48.1 34.8 89.8 63.5 69.4 54.8 83.1
Mental and
Behavioral
Disorders
38.7 379.6 291.1 163.2 111.2 21.2 152.5 143.8 160.5
Nervous
System
Diseases
47.1 71.2 149.5 104.3 48.8 * 74.6 36.5 110.1
Respiratory
Diseases
4,547.
3
1,264.
1 899.9 386.8 312.2 109.3 1,418.4 1,361 1,471.9
Major
Cardiovascula
r Diseases
30.3 20.3 37.4 86.1 126.8 70.5 66.1 54.8 76.7
Digestive
System
Diseases
1,331.
9 440.6 579.5 238.7 105.4 63.5 502.9 413.1 586.8
Reproductive
and Urinary
System
Diseases
309.4 979.5 1,092.2 309.8 103.4 31.7 422.1 94.3 728.1
Bone and
Muscle
Diseases
247.2 406.7 373.8 299.2 241.9 162.2 284.7 175.7 386.5
External
Causes
3,245.
7
2,616.
4 953.3 534.9 320 172.8 1,332 1,389.1 1,278.7
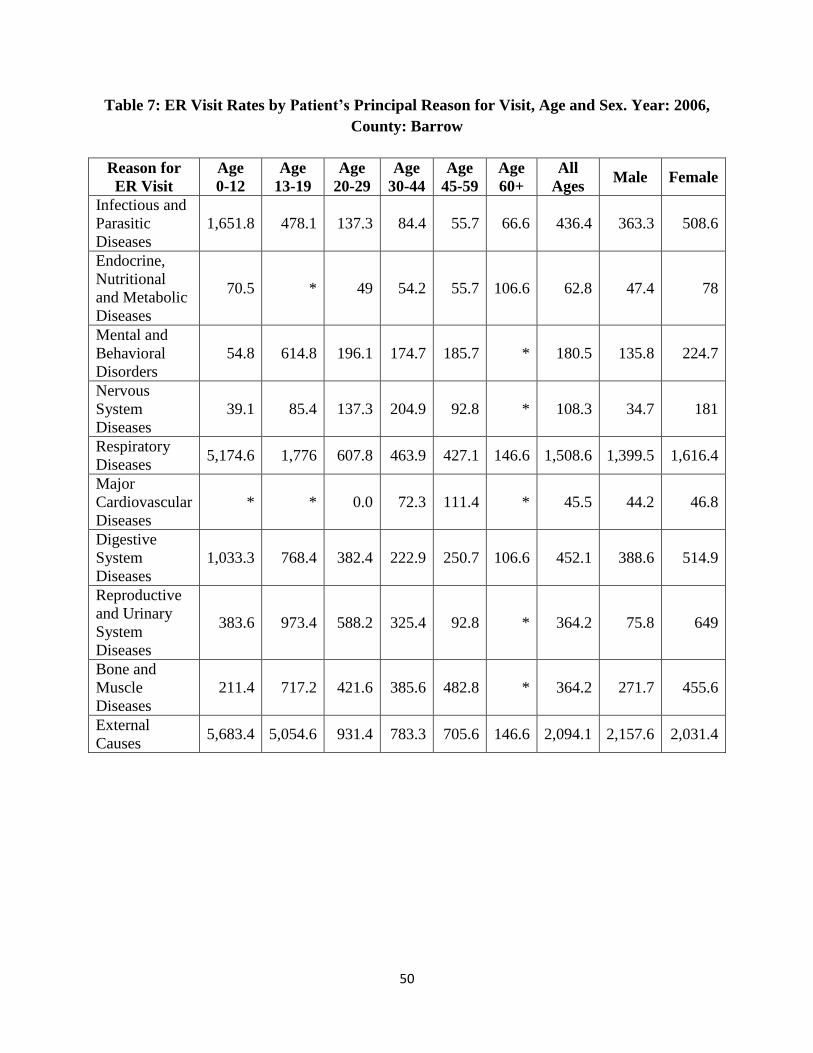
50
Table 7: ER Visit Rates by Patient’s Principal Reason for Visit, Age and Sex. Year: 2006,
County: Barrow
Reason for
ER Visit
Age
0-12
Age
13-19
Age
20-29
Age
30-44
Age
45-59
Age
60+
All
Ages Male Female
Infectious and
Parasitic
Diseases
1,651.8 478.1 137.3 84.4 55.7 66.6 436.4 363.3 508.6
Endocrine,
Nutritional
and Metabolic
Diseases
70.5 * 49 54.2 55.7 106.6 62.8 47.4 78
Mental and
Behavioral
Disorders
54.8 614.8 196.1 174.7 185.7 * 180.5 135.8 224.7
Nervous
System
Diseases
39.1 85.4 137.3 204.9 92.8 * 108.3 34.7 181
Respiratory
Diseases 5,174.6 1,776 607.8 463.9 427.1 146.6 1,508.6 1,399.5 1,616.4
Major
Cardiovascular
Diseases
* * 0.0 72.3 111.4 * 45.5 44.2 46.8
Digestive
System
Diseases
1,033.3 768.4 382.4 222.9 250.7 106.6 452.1 388.6 514.9
Reproductive
and Urinary
System
Diseases
383.6 973.4 588.2 325.4 92.8 * 364.2 75.8 649
Bone and
Muscle
Diseases
211.4 717.2 421.6 385.6 482.8 * 364.2 271.7 455.6
External
Causes 5,683.4 5,054.6 931.4 783.3 705.6 146.6 2,094.1 2,157.6 2,031.4
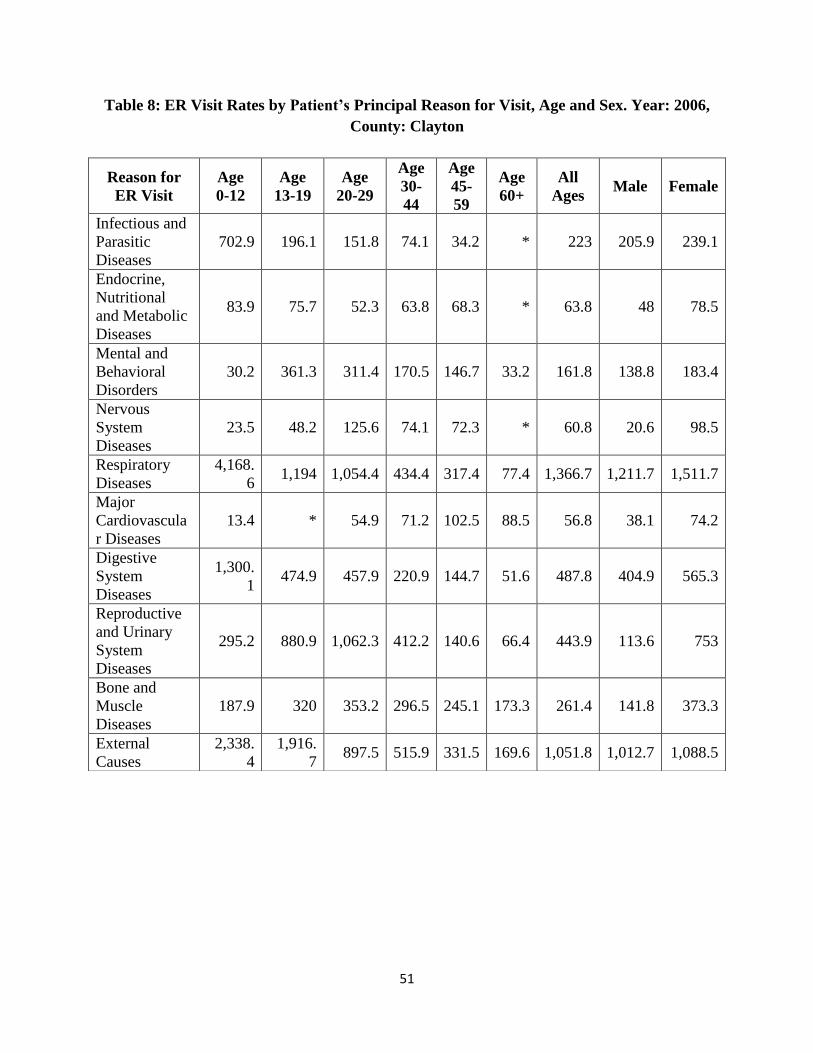
51
Table 8: ER Visit Rates by Patient’s Principal Reason for Visit, Age and Sex. Year: 2006,
County: Clayton
Reason for
ER Visit
Age
0-12
Age
13-19
Age
20-29
Age
30-
44
Age
45-
59
Age
60+
All
Ages Male Female
Infectious and
Parasitic
Diseases
702.9 196.1 151.8 74.1 34.2 * 223 205.9 239.1
Endocrine,
Nutritional
and Metabolic
Diseases
83.9 75.7 52.3 63.8 68.3 * 63.8 48 78.5
Mental and
Behavioral
Disorders
30.2 361.3 311.4 170.5 146.7 33.2 161.8 138.8 183.4
Nervous
System
Diseases
23.5 48.2 125.6 74.1 72.3 * 60.8 20.6 98.5
Respiratory
Diseases
4,168.
6 1,194 1,054.4 434.4 317.4 77.4 1,366.7 1,211.7 1,511.7
Major
Cardiovascula
r Diseases
13.4 * 54.9 71.2 102.5 88.5 56.8 38.1 74.2
Digestive
System
Diseases
1,300.
1 474.9 457.9 220.9 144.7 51.6 487.8 404.9 565.3
Reproductive
and Urinary
System
Diseases
295.2 880.9 1,062.3 412.2 140.6 66.4 443.9 113.6 753
Bone and
Muscle
Diseases
187.9 320 353.2 296.5 245.1 173.3 261.4 141.8 373.3
External
Causes
2,338.
4
1,916.
7 897.5 515.9 331.5 169.6 1,051.8 1,012.7 1,088.5
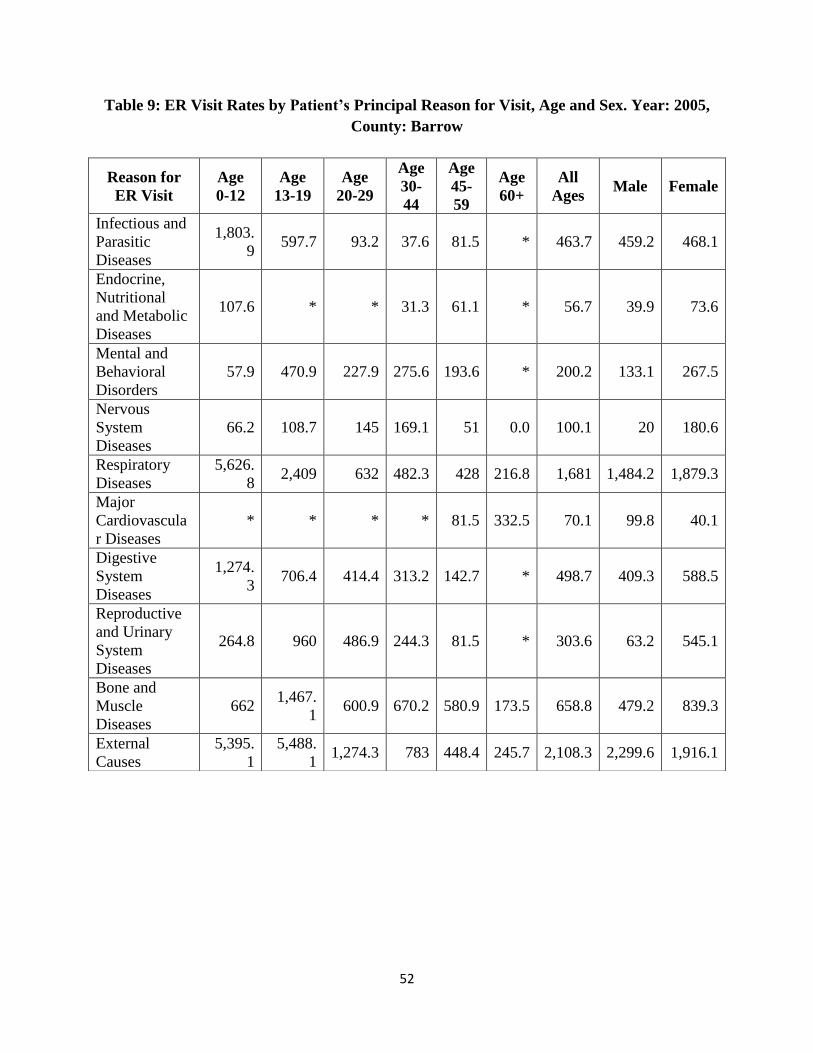
52
Table 9: ER Visit Rates by Patient’s Principal Reason for Visit, Age and Sex. Year: 2005,
County: Barrow
Reason for
ER Visit
Age
0-12
Age
13-19
Age
20-29
Age
30-
44
Age
45-
59
Age
60+
All
Ages Male Female
Infectious and
Parasitic
Diseases
1,803.
9 597.7 93.2 37.6 81.5 * 463.7 459.2 468.1
Endocrine,
Nutritional
and Metabolic
Diseases
107.6 * * 31.3 61.1 * 56.7 39.9 73.6
Mental and
Behavioral
Disorders
57.9 470.9 227.9 275.6 193.6 * 200.2 133.1 267.5
Nervous
System
Diseases
66.2 108.7 145 169.1 51 0.0 100.1 20 180.6
Respiratory
Diseases
5,626.
8 2,409 632 482.3 428 216.8 1,681 1,484.2 1,879.3
Major
Cardiovascula
r Diseases
* * * * 81.5 332.5 70.1 99.8 40.1
Digestive
System
Diseases
1,274.
3 706.4 414.4 313.2 142.7 * 498.7 409.3 588.5
Reproductive
and Urinary
System
Diseases
264.8 960 486.9 244.3 81.5 * 303.6 63.2 545.1
Bone and
Muscle
Diseases
662 1,467.
1 600.9 670.2 580.9 173.5 658.8 479.2 839.3
External
Causes
5,395.
1
5,488.
1 1,274.3 783 448.4 245.7 2,108.3 2,299.6 1,916.1

53
Table 10: ER Visit Rates by Patient’s Principal Reason for Visit, Age and Sex. Year: 2005,
County: Clayton
Reason for
ER Visit
Age
0-12
Age
13-19
Age
20-29
Age
30-
44
Age
45-
59
Age
60+
All
Ages Male Female
Infectious and
Parasitic
Diseases
973.7 308.2 229.7 104.6 47.6 * 316.5 280.6 350.4
Endocrine,
Nutritional
and Metabolic
Diseases
89.9 67.3 66.4 65.4 77.9 56.5 72.4 62.1 82.2
Mental and
Behavioral
Disorders
56 375.6 298.6 174.4 93 37.7 160.1 138 181
Nervous
System
Diseases
20.4 28.3 168.4 136.6 47.6 * 76.1 13 136
Respiratory
Diseases
5,280.
6
1,310.
9 1,184.2 555 361.1 184.6 1,696.1 1,528.9 1,854.6
Major
Cardiovascula
r Diseases
15.3 17.7 33.2 107.5 93 82.9 61.9 29.1 93.1
Digestive
System
Diseases
1,458.
8 527.9 678.9 296.4 142.7 56.5 582.2 460.8 697.2
Reproductive
and Urinary
System
Diseases
376.6 1,084.
1 1,416.4 486.7 162.2 52.8 562.4 119.6 982.2
Bone and
Muscle
Diseases
210.3 428.7 423.7 342.9 287.6 233.6 314.2 136.5 482.7
External
Causes
2,725.
9
2,356.
1 1,043.8 611.7 335.2 173.3 1,232.6 1,094.9 1,363.2
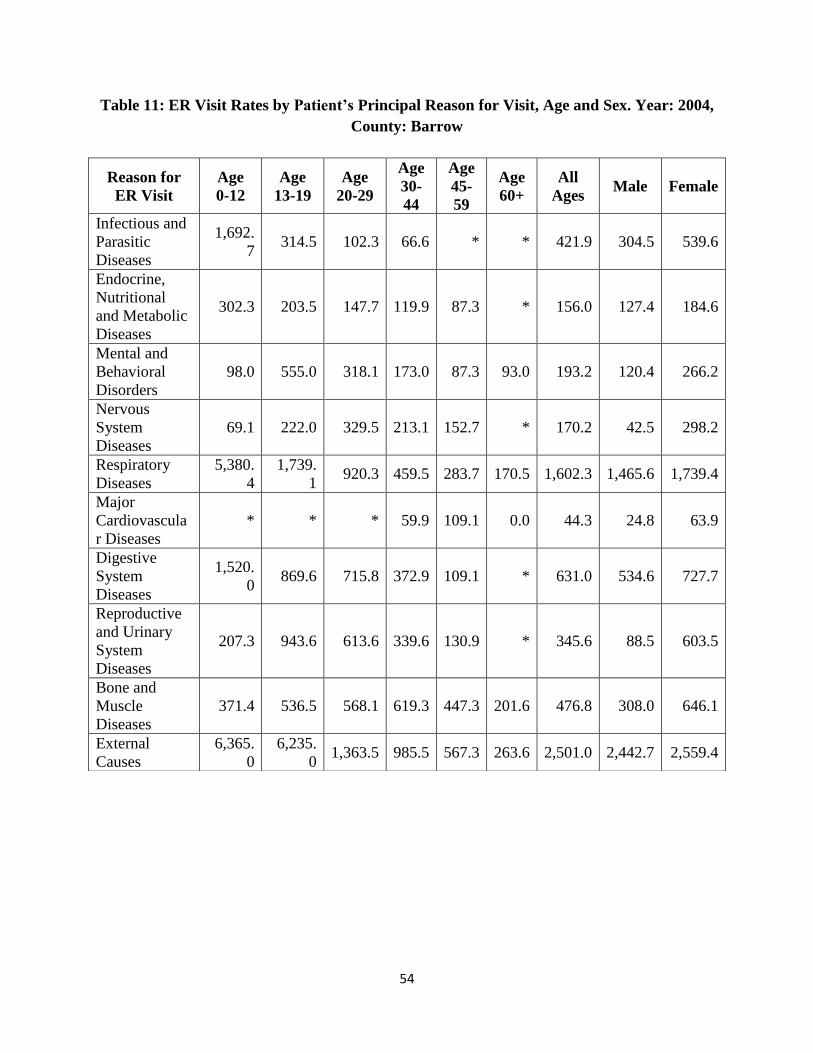
54
Table 11: ER Visit Rates by Patient’s Principal Reason for Visit, Age and Sex. Year: 2004,
County: Barrow
Reason for
ER Visit
Age
0-12
Age
13-19
Age
20-29
Age
30-
44
Age
45-
59
Age
60+
All
Ages Male Female
Infectious and
Parasitic
Diseases
1,692.
7 314.5 102.3 66.6 * * 421.9 304.5 539.6
Endocrine,
Nutritional
and Metabolic
Diseases
302.3 203.5 147.7 119.9 87.3 * 156.0 127.4 184.6
Mental and
Behavioral
Disorders
98.0 555.0 318.1 173.0 87.3 93.0 193.2 120.4 266.2
Nervous
System
Diseases
69.1 222.0 329.5 213.1 152.7 * 170.2 42.5 298.2
Respiratory
Diseases
5,380.
4
1,739.
1 920.3 459.5 283.7 170.5 1,602.3 1,465.6 1,739.4
Major
Cardiovascula
r Diseases
* * * 59.9 109.1 0.0 44.3 24.8 63.9
Digestive
System
Diseases
1,520.
0 869.6 715.8 372.9 109.1 * 631.0 534.6 727.7
Reproductive
and Urinary
System
Diseases
207.3 943.6 613.6 339.6 130.9 * 345.6 88.5 603.5
Bone and
Muscle
Diseases
371.4 536.5 568.1 619.3 447.3 201.6 476.8 308.0 646.1
External
Causes
6,365.
0
6,235.
0 1,363.5 985.5 567.3 263.6 2,501.0 2,442.7 2,559.4
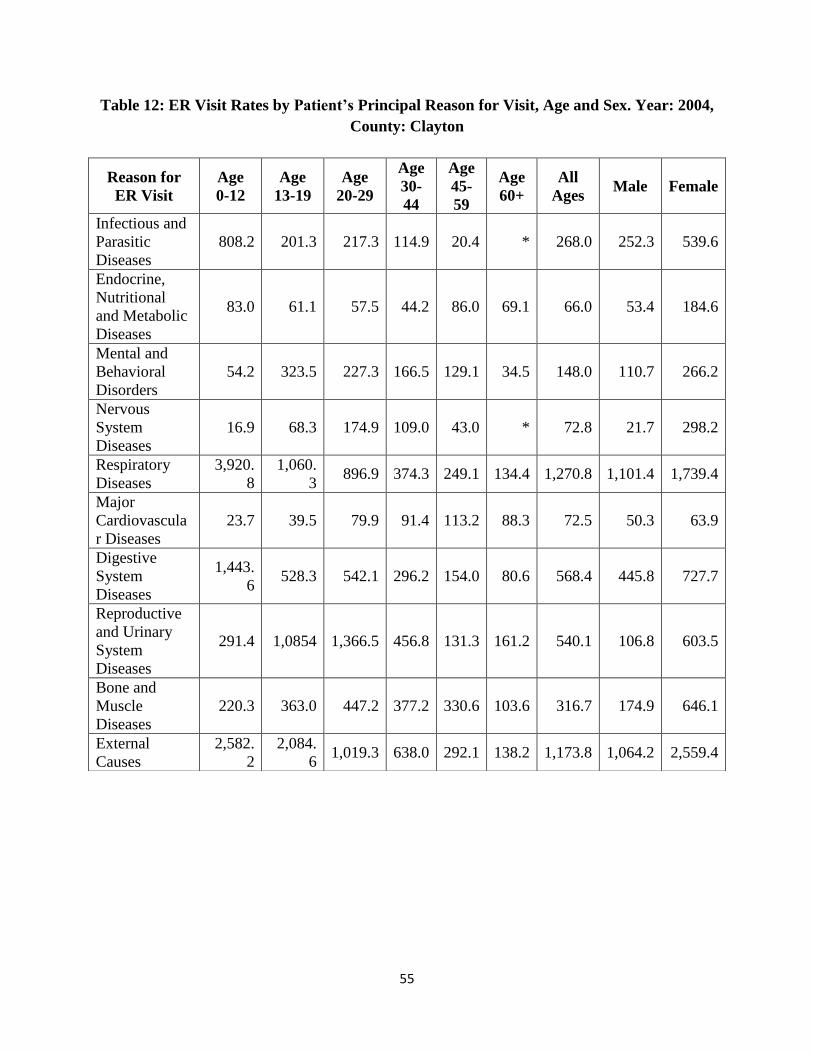
55
Table 12: ER Visit Rates by Patient’s Principal Reason for Visit, Age and Sex. Year: 2004,
County: Clayton
Reason for
ER Visit
Age
0-12
Age
13-19
Age
20-29
Age
30-
44
Age
45-
59
Age
60+
All
Ages Male Female
Infectious and
Parasitic
Diseases
808.2 201.3 217.3 114.9 20.4 * 268.0 252.3 539.6
Endocrine,
Nutritional
and Metabolic
Diseases
83.0 61.1 57.5 44.2 86.0 69.1 66.0 53.4 184.6
Mental and
Behavioral
Disorders
54.2 323.5 227.3 166.5 129.1 34.5 148.0 110.7 266.2
Nervous
System
Diseases
16.9 68.3 174.9 109.0 43.0 * 72.8 21.7 298.2
Respiratory
Diseases
3,920.
8
1,060.
3 896.9 374.3 249.1 134.4 1,270.8 1,101.4 1,739.4
Major
Cardiovascula
r Diseases
23.7 39.5 79.9 91.4 113.2 88.3 72.5 50.3 63.9
Digestive
System
Diseases
1,443.
6 528.3 542.1 296.2 154.0 80.6 568.4 445.8 727.7
Reproductive
and Urinary
System
Diseases
291.4 1,0854 1,366.5 456.8 131.3 161.2 540.1 106.8 603.5
Bone and
Muscle
Diseases
220.3 363.0 447.2 377.2 330.6 103.6 316.7 174.9 646.1
External
Causes
2,582.
2
2,084.
6 1,019.3 638.0 292.1 138.2 1,173.8 1,064.2 2,559.4
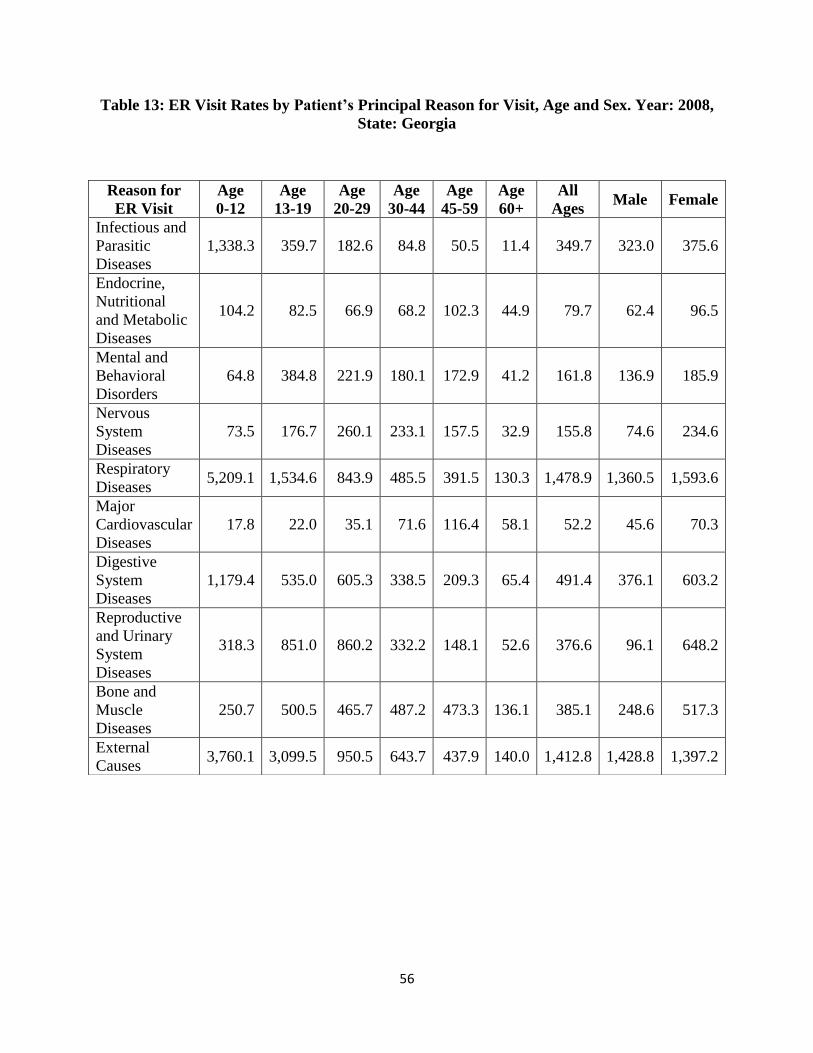
56
Table 13: ER Visit Rates by Patient’s Principal Reason for Visit, Age and Sex. Year: 2008,
State: Georgia
Reason for
ER Visit
Age
0-12
Age
13-19
Age
20-29
Age
30-44
Age
45-59
Age
60+
All
Ages Male Female
Infectious and
Parasitic
Diseases
1,338.3 359.7 182.6 84.8 50.5 11.4 349.7 323.0 375.6
Endocrine,
Nutritional
and Metabolic
Diseases
104.2 82.5 66.9 68.2 102.3 44.9 79.7 62.4 96.5
Mental and
Behavioral
Disorders
64.8 384.8 221.9 180.1 172.9 41.2 161.8 136.9 185.9
Nervous
System
Diseases
73.5 176.7 260.1 233.1 157.5 32.9 155.8 74.6 234.6
Respiratory
Diseases 5,209.1 1,534.6 843.9 485.5 391.5 130.3 1,478.9 1,360.5 1,593.6
Major
Cardiovascular
Diseases
17.8 22.0 35.1 71.6 116.4 58.1 52.2 45.6 70.3
Digestive
System
Diseases
1,179.4 535.0 605.3 338.5 209.3 65.4 491.4 376.1 603.2
Reproductive
and Urinary
System
Diseases
318.3 851.0 860.2 332.2 148.1 52.6 376.6 96.1 648.2
Bone and
Muscle
Diseases
250.7 500.5 465.7 487.2 473.3 136.1 385.1 248.6 517.3
External
Causes 3,760.1 3,099.5 950.5 643.7 437.9 140.0 1,412.8 1,428.8 1,397.2
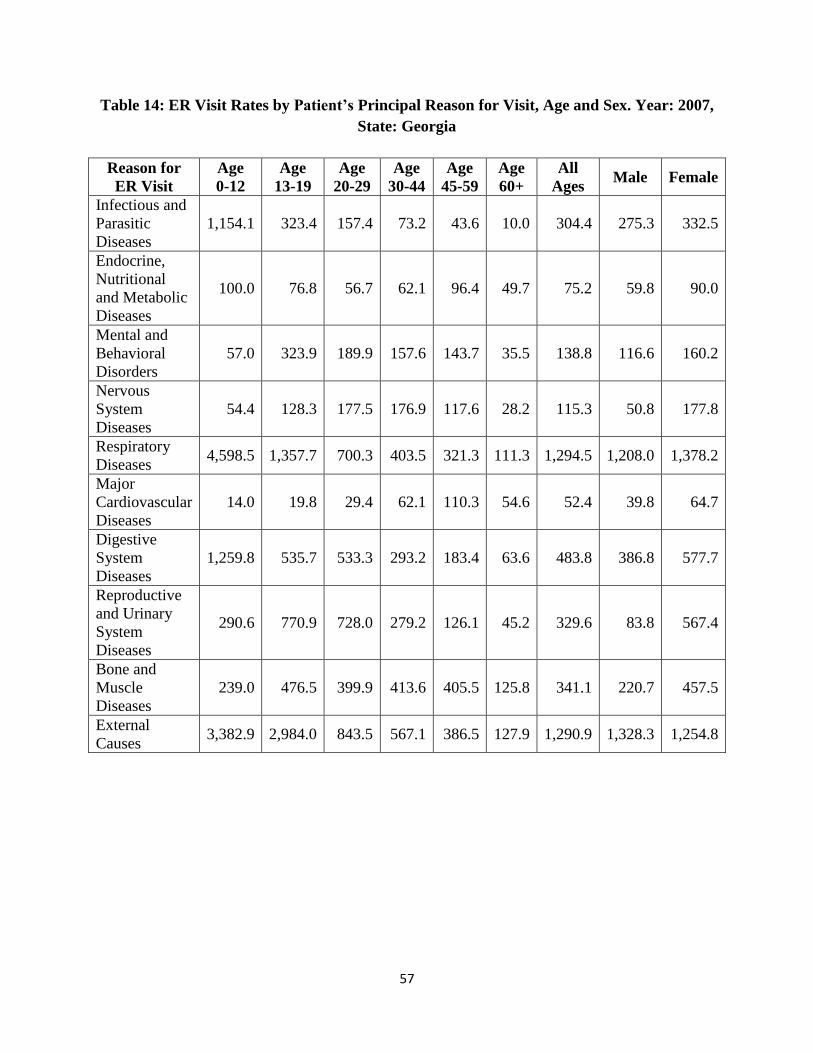
57
Table 14: ER Visit Rates by Patient’s Principal Reason for Visit, Age and Sex. Year: 2007,
State: Georgia
Reason for
ER Visit
Age
0-12
Age
13-19
Age
20-29
Age
30-44
Age
45-59
Age
60+
All
Ages Male Female
Infectious and
Parasitic
Diseases
1,154.1 323.4 157.4 73.2 43.6 10.0 304.4 275.3 332.5
Endocrine,
Nutritional
and Metabolic
Diseases
100.0 76.8 56.7 62.1 96.4 49.7 75.2 59.8 90.0
Mental and
Behavioral
Disorders
57.0 323.9 189.9 157.6 143.7 35.5 138.8 116.6 160.2
Nervous
System
Diseases
54.4 128.3 177.5 176.9 117.6 28.2 115.3 50.8 177.8
Respiratory
Diseases 4,598.5 1,357.7 700.3 403.5 321.3 111.3 1,294.5 1,208.0 1,378.2
Major
Cardiovascular
Diseases
14.0 19.8 29.4 62.1 110.3 54.6 52.4 39.8 64.7
Digestive
System
Diseases
1,259.8 535.7 533.3 293.2 183.4 63.6 483.8 386.8 577.7
Reproductive
and Urinary
System
Diseases
290.6 770.9 728.0 279.2 126.1 45.2 329.6 83.8 567.4
Bone and
Muscle
Diseases
239.0 476.5 399.9 413.6 405.5 125.8 341.1 220.7 457.5
External
Causes 3,382.9 2,984.0 843.5 567.1 386.5 127.9 1,290.9 1,328.3 1,254.8
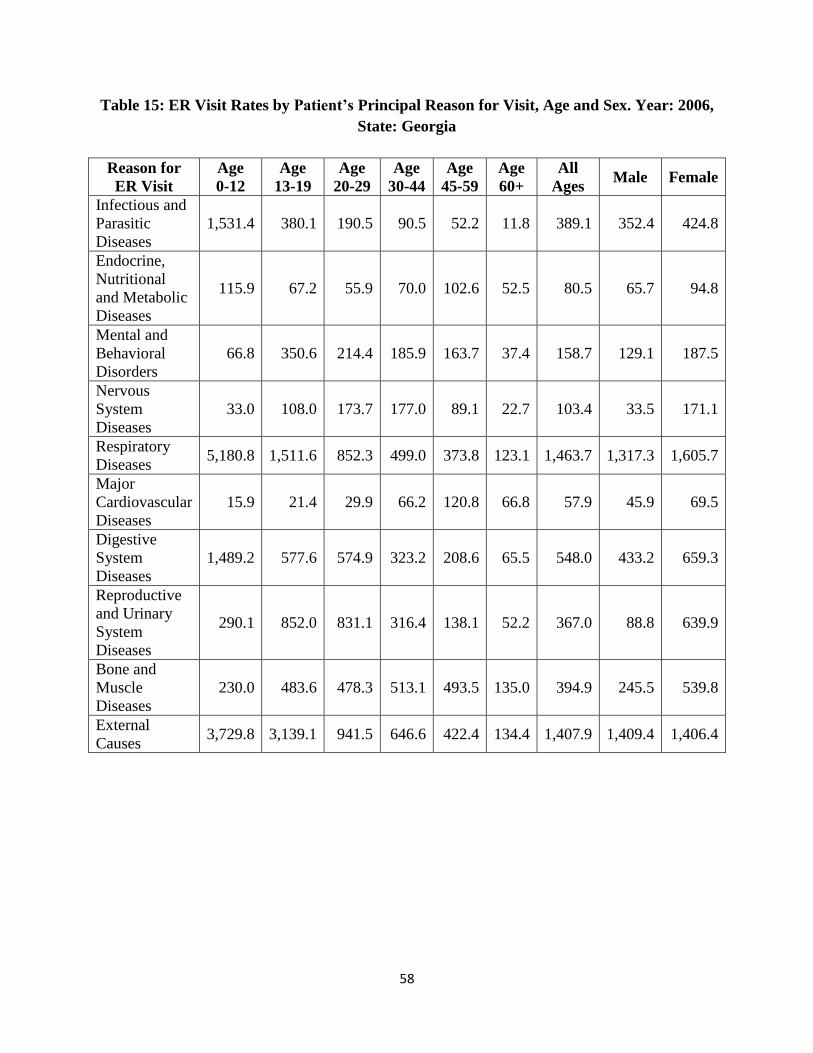
58
Table 15: ER Visit Rates by Patient’s Principal Reason for Visit, Age and Sex. Year: 2006,
State: Georgia
Reason for
ER Visit
Age
0-12
Age
13-19
Age
20-29
Age
30-44
Age
45-59
Age
60+
All
Ages Male Female
Infectious and
Parasitic
Diseases
1,531.4 380.1 190.5 90.5 52.2 11.8 389.1 352.4 424.8
Endocrine,
Nutritional
and Metabolic
Diseases
115.9 67.2 55.9 70.0 102.6 52.5 80.5 65.7 94.8
Mental and
Behavioral
Disorders
66.8 350.6 214.4 185.9 163.7 37.4 158.7 129.1 187.5
Nervous
System
Diseases
33.0 108.0 173.7 177.0 89.1 22.7 103.4 33.5 171.1
Respiratory
Diseases 5,180.8 1,511.6 852.3 499.0 373.8 123.1 1,463.7 1,317.3 1,605.7
Major
Cardiovascular
Diseases
15.9 21.4 29.9 66.2 120.8 66.8 57.9 45.9 69.5
Digestive
System
Diseases
1,489.2 577.6 574.9 323.2 208.6 65.5 548.0 433.2 659.3
Reproductive
and Urinary
System
Diseases
290.1 852.0 831.1 316.4 138.1 52.2 367.0 88.8 639.9
Bone and
Muscle
Diseases
230.0 483.6 478.3 513.1 493.5 135.0 394.9 245.5 539.8
External
Causes 3,729.8 3,139.1 941.5 646.6 422.4 134.4 1,407.9 1,409.4 1,406.4
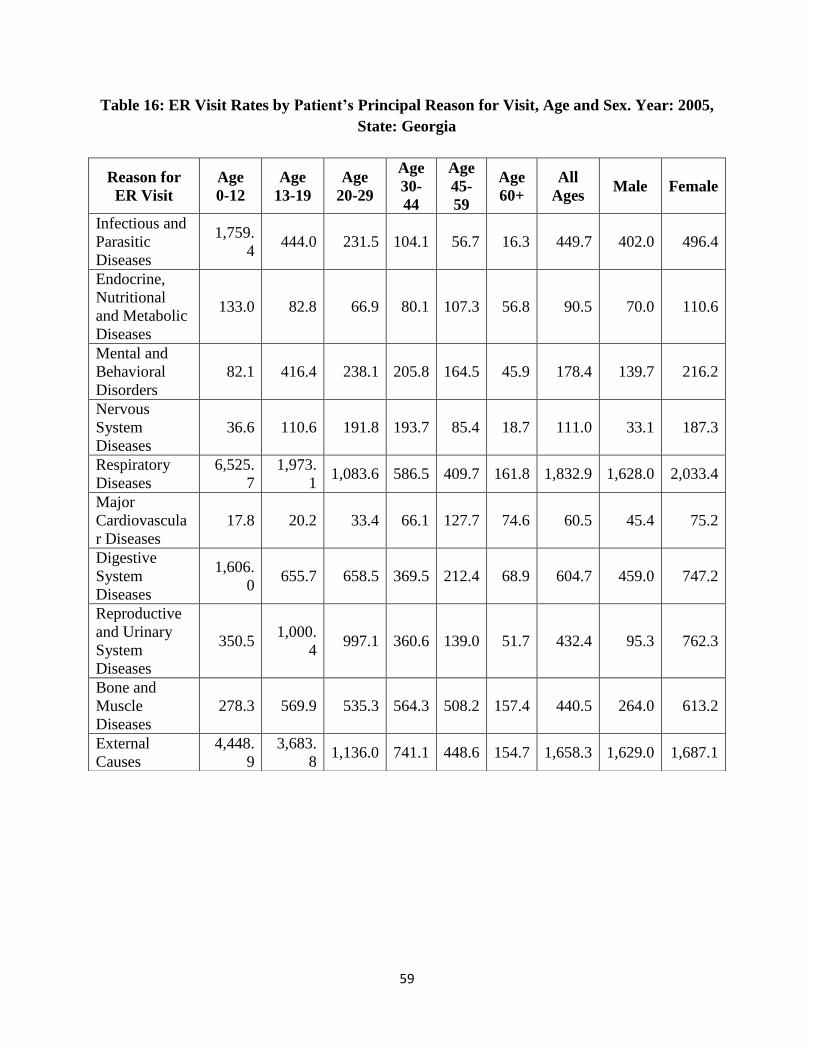
59
Table 16: ER Visit Rates by Patient’s Principal Reason for Visit, Age and Sex. Year: 2005,
State: Georgia
Reason for
ER Visit
Age
0-12
Age
13-19
Age
20-29
Age
30-
44
Age
45-
59
Age
60+
All
Ages Male Female
Infectious and
Parasitic
Diseases
1,759.
4 444.0 231.5 104.1 56.7 16.3 449.7 402.0 496.4
Endocrine,
Nutritional
and Metabolic
Diseases
133.0 82.8 66.9 80.1 107.3 56.8 90.5 70.0 110.6
Mental and
Behavioral
Disorders
82.1 416.4 238.1 205.8 164.5 45.9 178.4 139.7 216.2
Nervous
System
Diseases
36.6 110.6 191.8 193.7 85.4 18.7 111.0 33.1 187.3
Respiratory
Diseases
6,525.
7
1,973.
1 1,083.6 586.5 409.7 161.8 1,832.9 1,628.0 2,033.4
Major
Cardiovascula
r Diseases
17.8 20.2 33.4 66.1 127.7 74.6 60.5 45.4 75.2
Digestive
System
Diseases
1,606.
0 655.7 658.5 369.5 212.4 68.9 604.7 459.0 747.2
Reproductive
and Urinary
System
Diseases
350.5 1,000.
4 997.1 360.6 139.0 51.7 432.4 95.3 762.3
Bone and
Muscle
Diseases
278.3 569.9 535.3 564.3 508.2 157.4 440.5 264.0 613.2
External
Causes
4,448.
9
3,683.
8 1,136.0 741.1 448.6 154.7 1,658.3 1,629.0 1,687.1

60
Table 17: ER Visit Rates by Patient’s Principal Reason for Visit, Age and Sex. Year: 2004,
State: Georgia
Reason for
ER Visit
Age
0-12
Age
13-19
Age
20-29
Age
30-
44
Age
45-
59
Age
60+
All
Ages Male Female
Infectious and
Parasitic
Diseases
1,542.
9 354.9 198.0 91.5 46.9 13.7 394.7 353.6 434.8
Endocrine,
Nutritional
and Metabolic
Diseases
132.3 69.7 59.9 73.0 105.0 53.4 85.5 66.9 103.7
Mental and
Behavioral
Disorders
86.0 410.3 225.8 215.4 161.9 46.0 178.6 141.5 214.7
Nervous
System
Diseases
37.9 118.0 209.8 189.5 87.9 19.4 114.3 37.4 189.5
Respiratory
Diseases
5,507.
1
1,566.
5 919.5 511.7 371.7 149.0 1,565.9 1,394.4 1,733.6
Major
Cardiovascula
r Diseases
15.8 17.8 30.6 60.9 117.8 66.3 54.8 40.2 69.1
Digestive
System
Diseases
1,603.
9 627.1 660.0 364.4 212.7 72.9 605.9 468.1 740.7
Reproductive
and Urinary
System
Diseases
327.6 996.1 999.3 353.7 136.7 57.1 427.5 94.1 753.7
Bone and
Muscle
Diseases
259.4 532.2 510.4 577.6 518.3 151.9 433.4 265.2 598.0
External
Causes
4,409.
9
3,525.
3 1,171.2 765.8 451.4 157.2 1,662.4 1,621.8 1,702.1