Embed Size (px)
Citation preview
Communicating with Farmers through Social Networks
Ariel BenYishay U. of New South Wales
Mushfiq Mobarak Yale University
Motivation
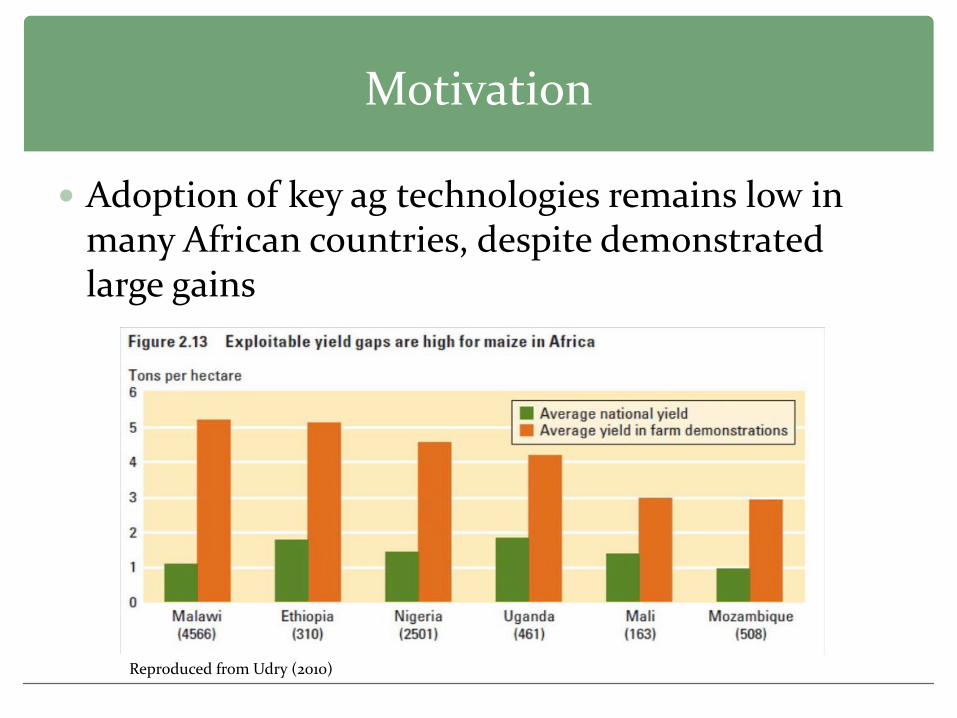
Adoption of key ag technologies remains low in many African countries, despite demonstrated large gains
Reproduced from Udry (2010)
Motivation
Adoption of key ag technologies remains low in many African countries, despite demonstrated large gains
Two Conservation Farming Technologies: Pit planting in southern Africa: returns of 50-100% in 1st
year (Haggblade and Tembo 2003) Compost application also has substantial returns for
maize production (Nyirongo et al 1999)
Limited adoption: In our Malawi sample, baseline PP adoption = 1% Baseline composting adoption = 19%
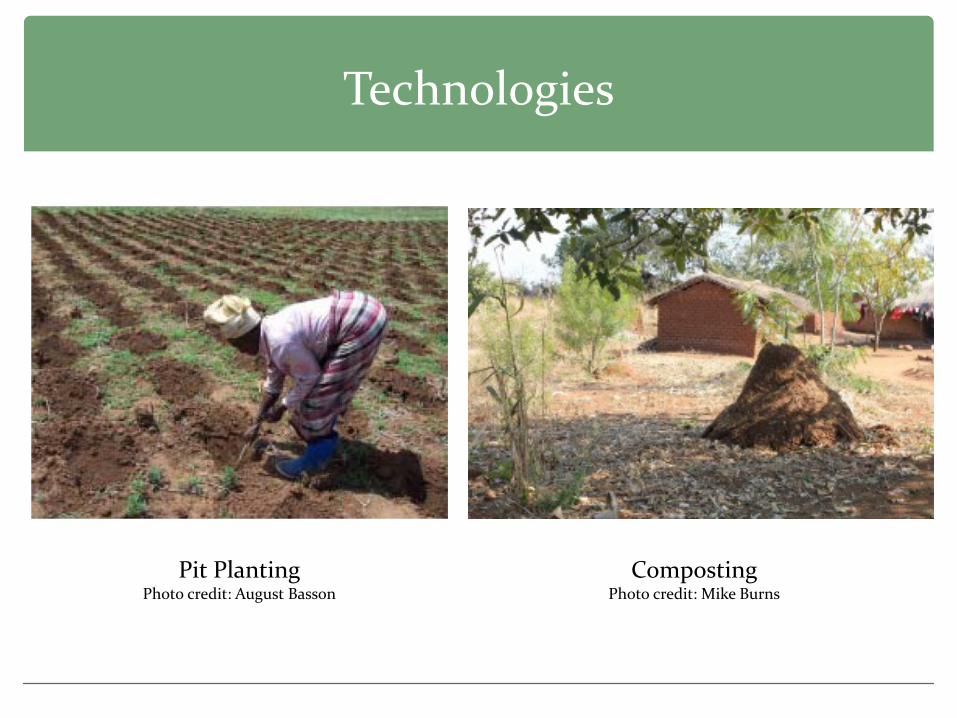
Technologies
Pit Planting Photo credit: August Basson
Composting Photo credit: Mike Burns
Why Don’t People Adopt?
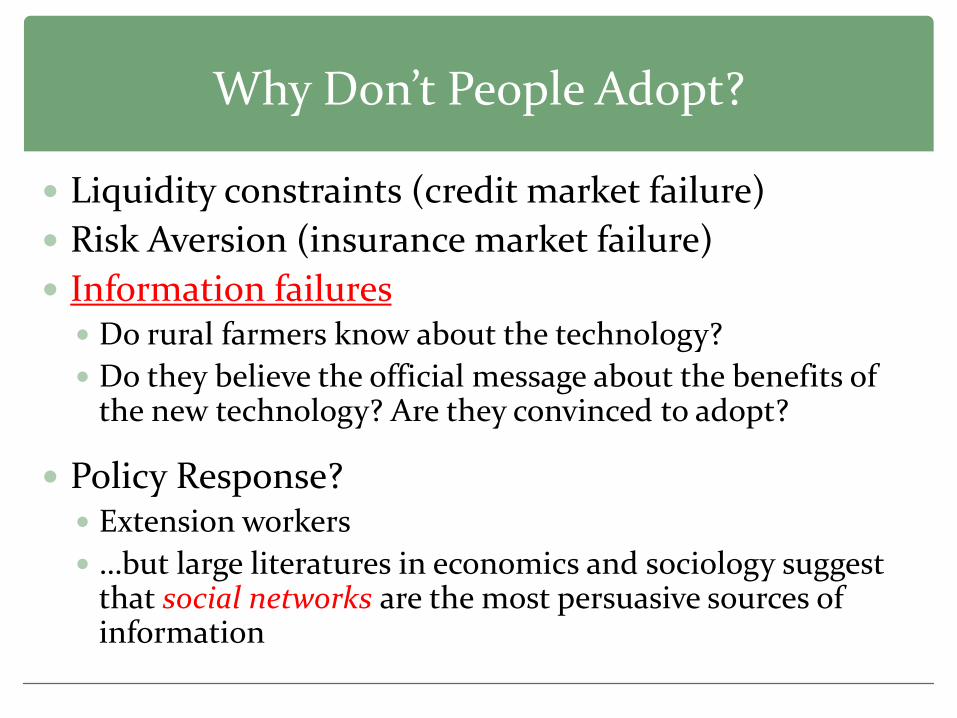
Liquidity constraints (credit market failure) Risk Aversion (insurance market failure) Information failures Do rural farmers know about the technology? Do they believe the official message about the benefits of
the new technology? Are they convinced to adopt?
Policy Response? Extension workers …but large literatures in economics and sociology suggest
that social networks are the most persuasive sources of information
Extension Services
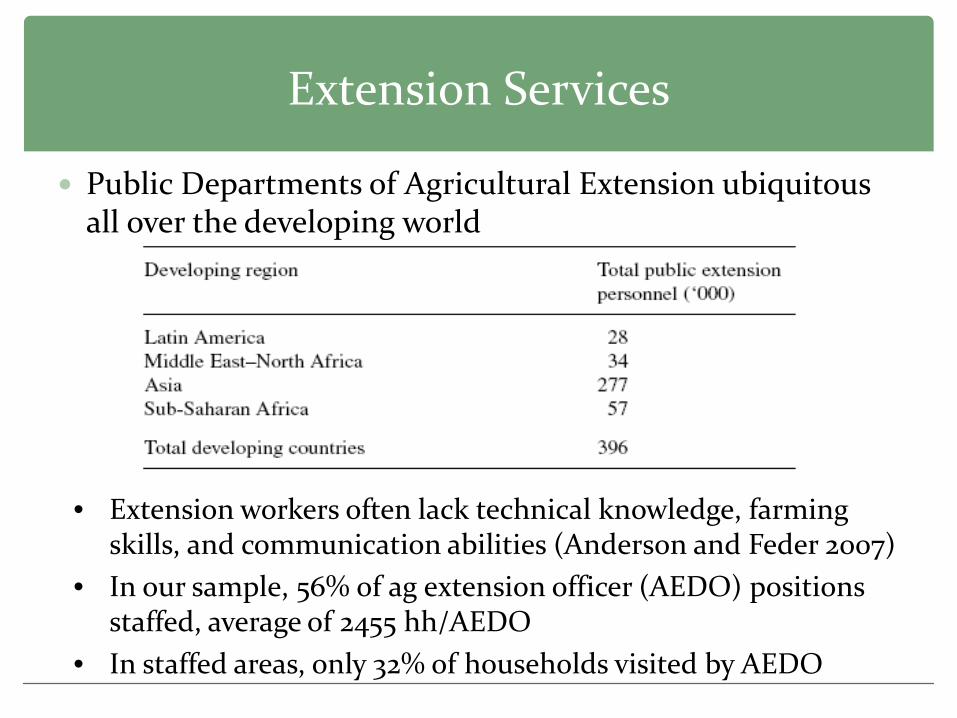
Public Departments of Agricultural Extension ubiquitous all over the developing world
• Extension workers often lack technical knowledge, farming skills, and communication abilities (Anderson and Feder 2007)
• In our sample, 56% of ag extension officer (AEDO) positions staffed, average of 2455 hh/AEDO
• In staffed areas, only 32% of households visited by AEDO

Literature on Social Learning
Economists, sociologists have long recognized the importance of social learning in agriculture (Griliches 1957, Rogers 1962), and in many other technologies and behaviors (health, employment,..)
Strong social network effects on technology adoption in India, Mozambique, Ghana [Foster and Rosenzweig 1995, Munshi 2004, Conley and Udry 2010] When do farmers decide to incorporate neighbors’ experiences? The models assume an automatic seamless transmission of knowledge
from one network member to another Each farmer observes “trials” of neighbors, and automatically learns
Duflo, Kremer and Robinson (2010) report the absence of social network effects in Kenya

Contributions of our Project
Policy+Academic: We try to get inside the black box of the information
transmission process with a large-scale field experiment. With learning externalities, when and why does information get
shared? Does teaching effort matter? Do teachers need to be
incentivized? Who should you incentivize? People with a comparative
advantage in communication? Highest stature or most representative?
Policy: Can extension services be improved cost-effectively by
incorporating social networks? How, exactly? To make use optimal use of social networks, we need to
understand who teaches, who learns, and how.
Project Description
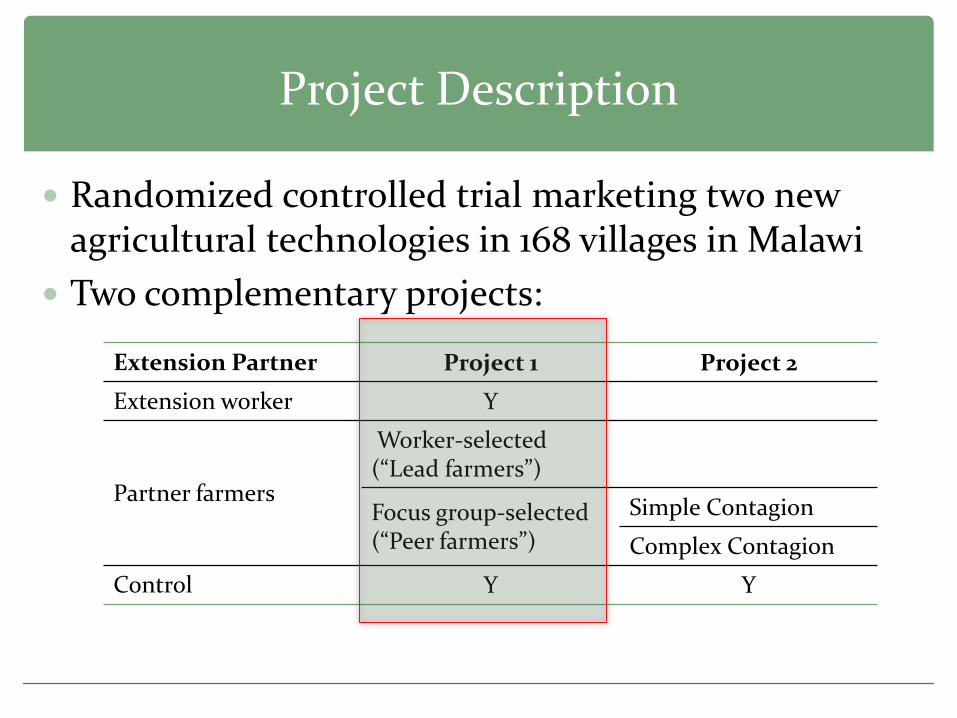
Randomized controlled trial marketing two new agricultural technologies in 168 villages in Malawi
Two complementary projects: Extension Partner Project 1 Project 2
Extension worker Y
Partner farmers
Worker-selected (“Lead farmers”)
Focus group-selected (“Peer farmers”)
Simple Contagion
Complex Contagion
Control Y Y
Research Design for Project 1
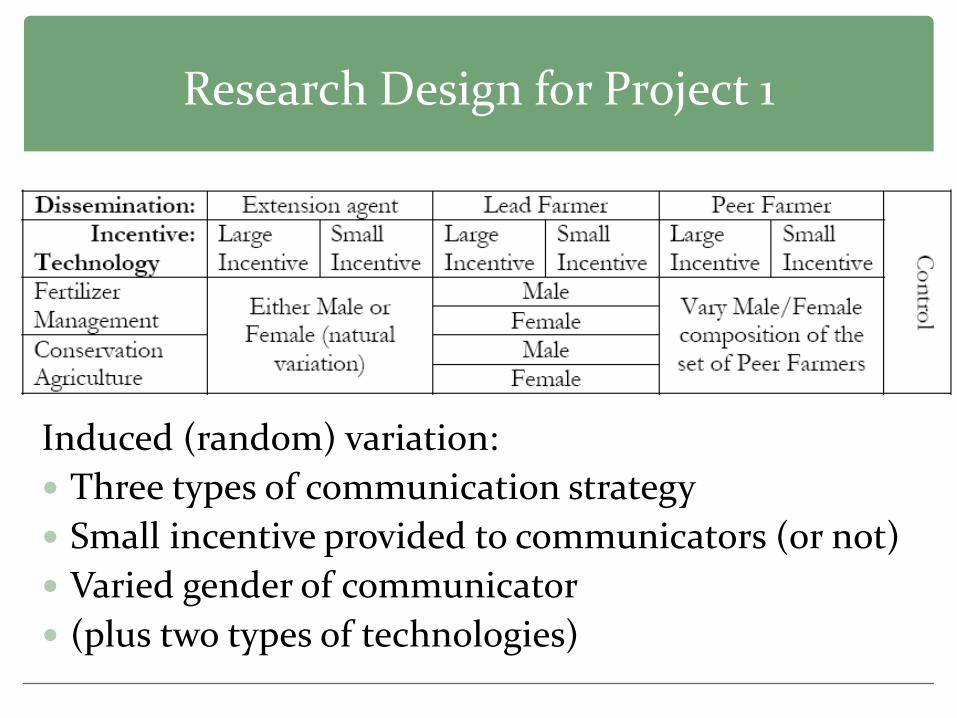
Induced (random) variation: Three types of communication strategy Small incentive provided to communicators (or not) Varied gender of communicator (plus two types of technologies)
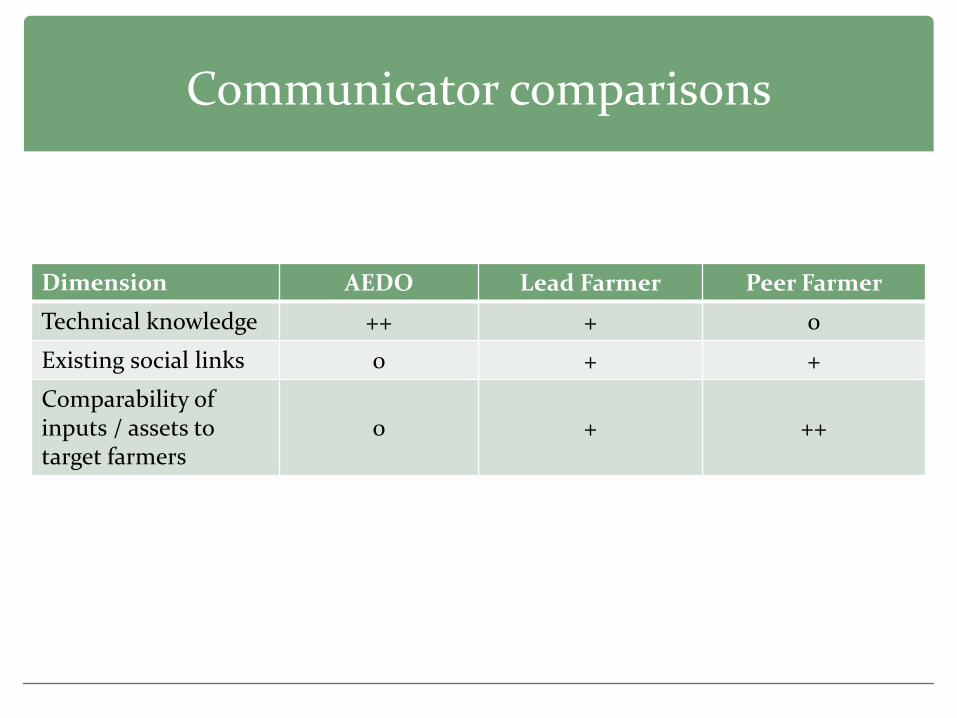
Communicator comparisons
Dimension AEDO Lead Farmer Peer Farmer
Technical knowledge ++ + 0
Existing social links 0 + +
Comparability of inputs / assets to target farmers
0 + ++
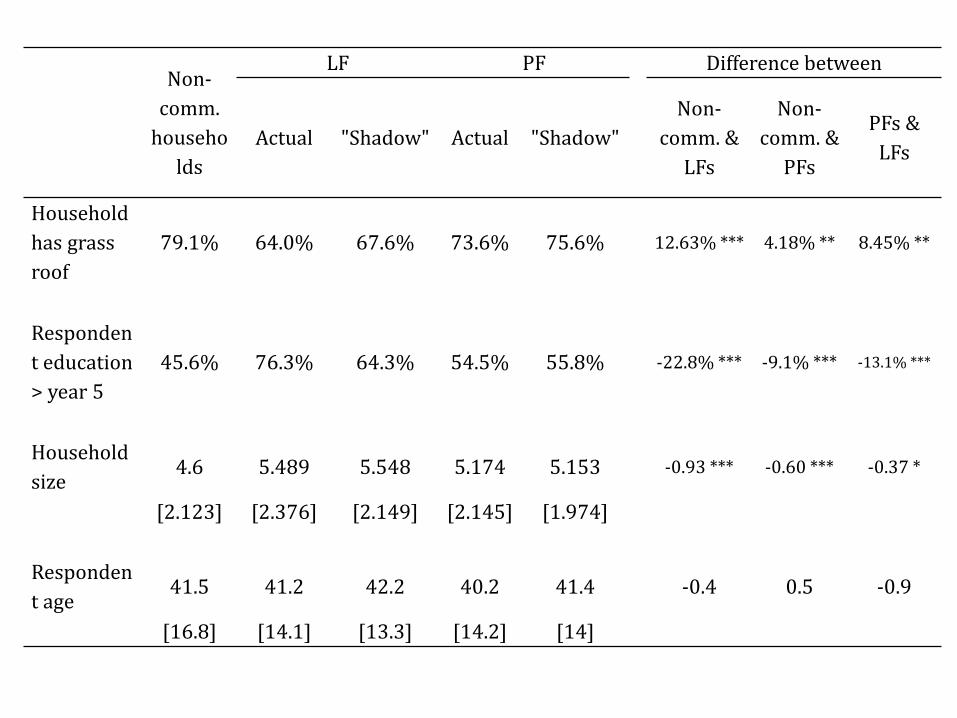
Non-comm.
households
LF PF Difference between
Actual "Shadow" Actual "Shadow" Non-
comm. & LFs
Non-comm. &
PFs
PFs & LFs
Household has grass roof
79.1% 64.0% 67.6% 73.6% 75.6% 12.63% *** 4.18% ** 8.45% **
Respondent education > year 5
45.6% 76.3% 64.3% 54.5% 55.8% -22.8% *** -9.1% *** -13.1% ***
Household size
4.6 5.489 5.548 5.174 5.153 -0.93 *** -0.60 *** -0.37 *
[2.123] [2.376] [2.149] [2.145] [1.974]
Respondent age
41.5 41.2 42.2 40.2 41.4 -0.4 0.5 -0.9
[16.8] [14.1] [13.3] [14.2] [14]
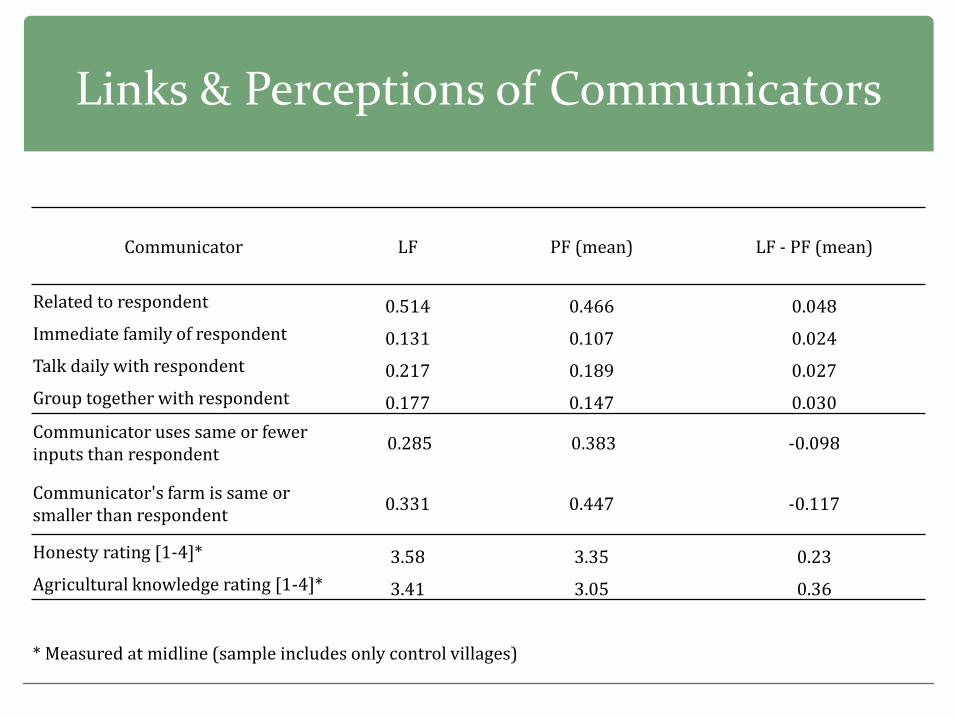
Communicator LF PF (mean) LF - PF (mean)
Related to respondent 0.514 0.466 0.048 Immediate family of respondent 0.131 0.107 0.024 Talk daily with respondent 0.217 0.189 0.027 Group together with respondent 0.177 0.147 0.030 Communicator uses same or fewer inputs than respondent 0.285 0.383 -0.098
Communicator's farm is same or smaller than respondent 0.331 0.447 -0.117
Honesty rating [1-4]* 3.58 3.35 0.23 Agricultural knowledge rating [1-4]* 3.41 3.05 0.36
* Measured at midline (sample includes only control villages)
Links & Perceptions of Communicators
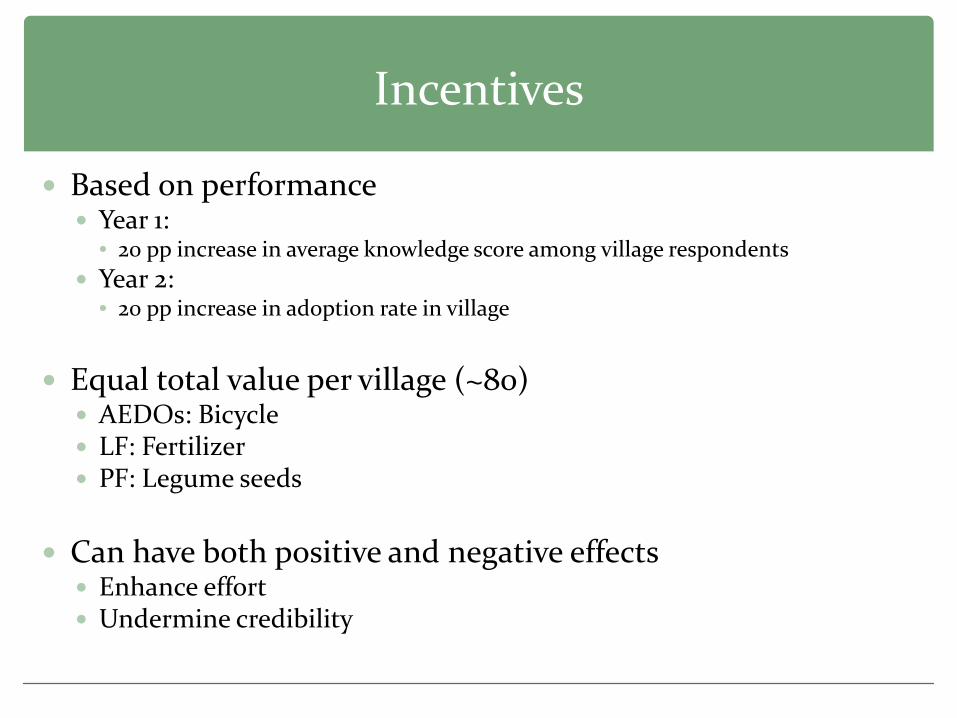
Incentives
Based on performance Year 1:
• 20 pp increase in average knowledge score among village respondents Year 2:
• 20 pp increase in adoption rate in village
Equal total value per village (~80)
AEDOs: Bicycle LF: Fertilizer PF: Legume seeds
Can have both positive and negative effects Enhance effort Undermine credibility
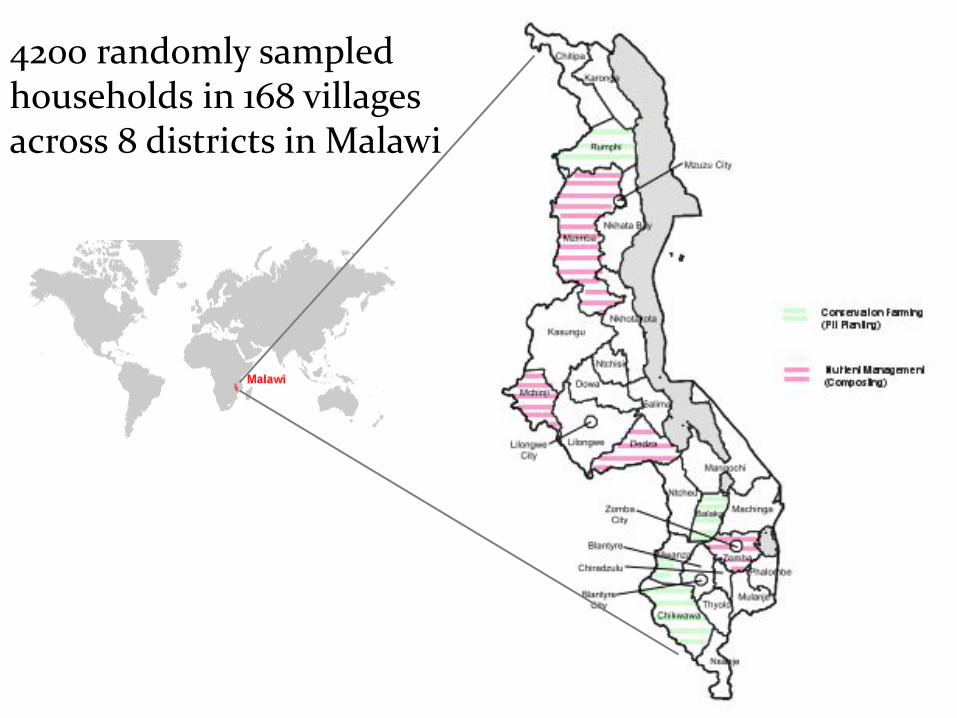
4200 randomly sampled households in 168 villages across 8 districts in Malawi
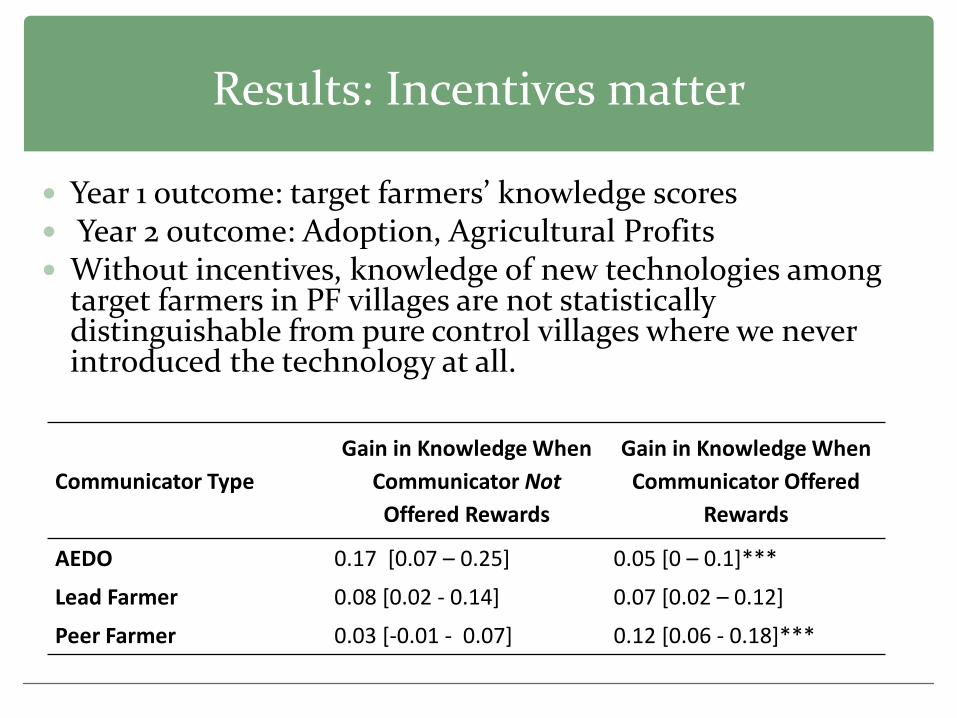
Results: Incentives matter
Year 1 outcome: target farmers’ knowledge scores Year 2 outcome: Adoption, Agricultural Profits Without incentives, knowledge of new technologies among
target farmers in PF villages are not statistically distinguishable from pure control villages where we never introduced the technology at all.
Communicator Type Gain in Knowledge When
Communicator Not Offered Rewards
Gain in Knowledge When Communicator Offered
Rewards
AEDO 0.17 [0.07 – 0.25] 0.05 [0 – 0.1]***
Lead Farmer 0.08 [0.02 - 0.14] 0.07 [0.02 – 0.12]
Peer Farmer 0.03 [-0.01 - 0.07] 0.12 [0.06 - 0.18]***
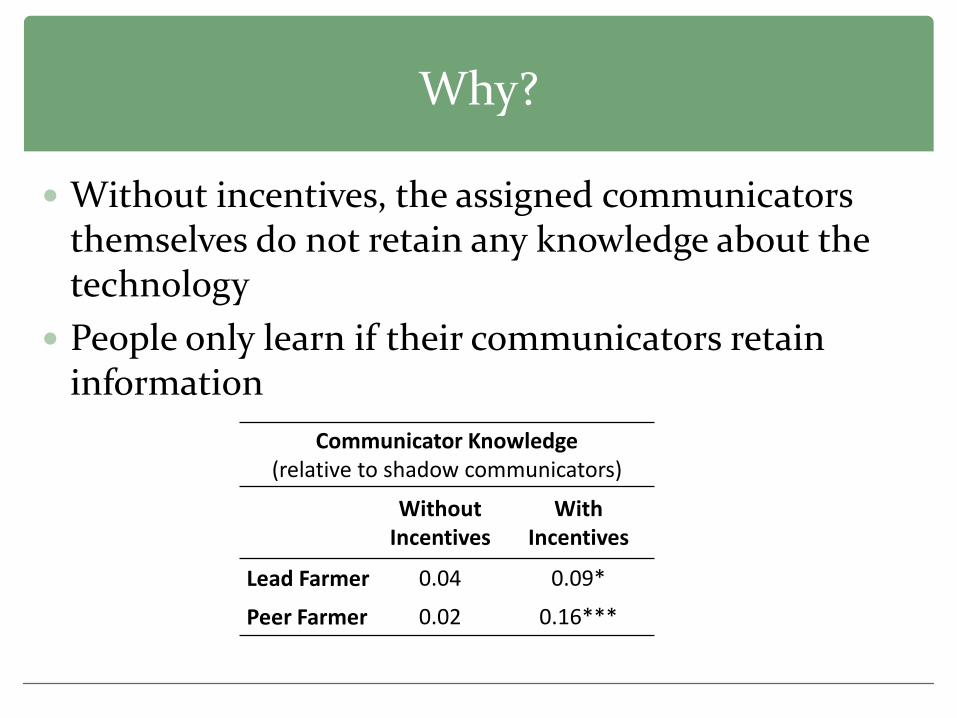
Why?
Without incentives, the assigned communicators themselves do not retain any knowledge about the technology
People only learn if their communicators retain information
Communicator Knowledge (relative to shadow communicators)
Without Incentives
With Incentives
Lead Farmer 0.04 0.09*
Peer Farmer 0.02 0.16***
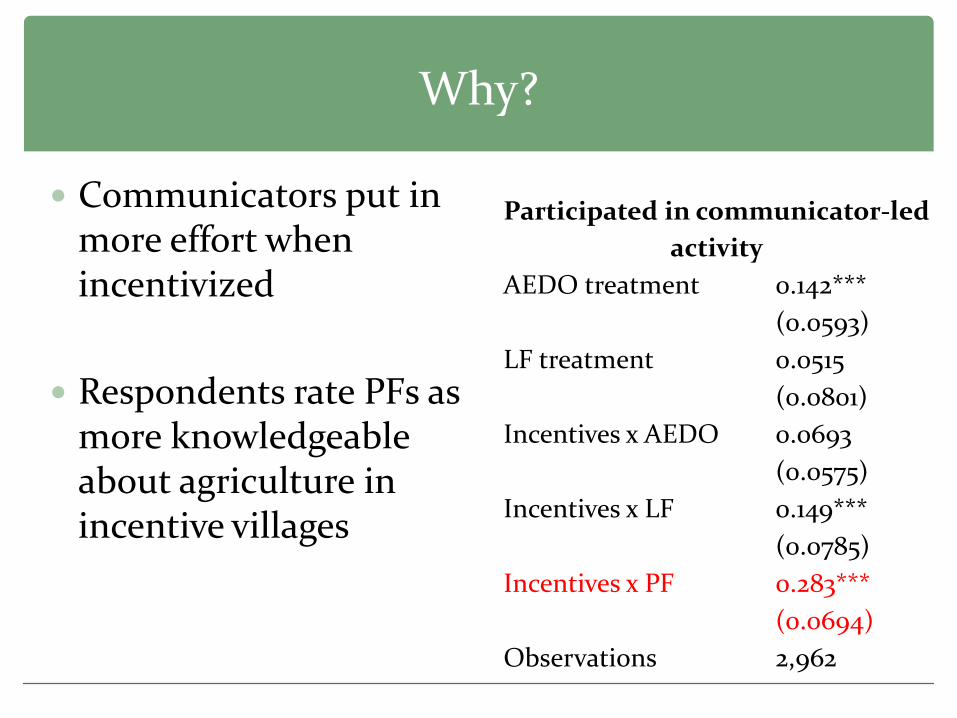
Why?
Participated in communicator-led activity
AEDO treatment 0.142*** (0.0593)
LF treatment 0.0515 (0.0801)
Incentives x AEDO 0.0693 (0.0575)
Incentives x LF 0.149*** (0.0785)
Incentives x PF 0.283*** (0.0694)
Observations 2,962
Communicators put in more effort when incentivized
Respondents rate PFs as more knowledgeable about agriculture in incentive villages
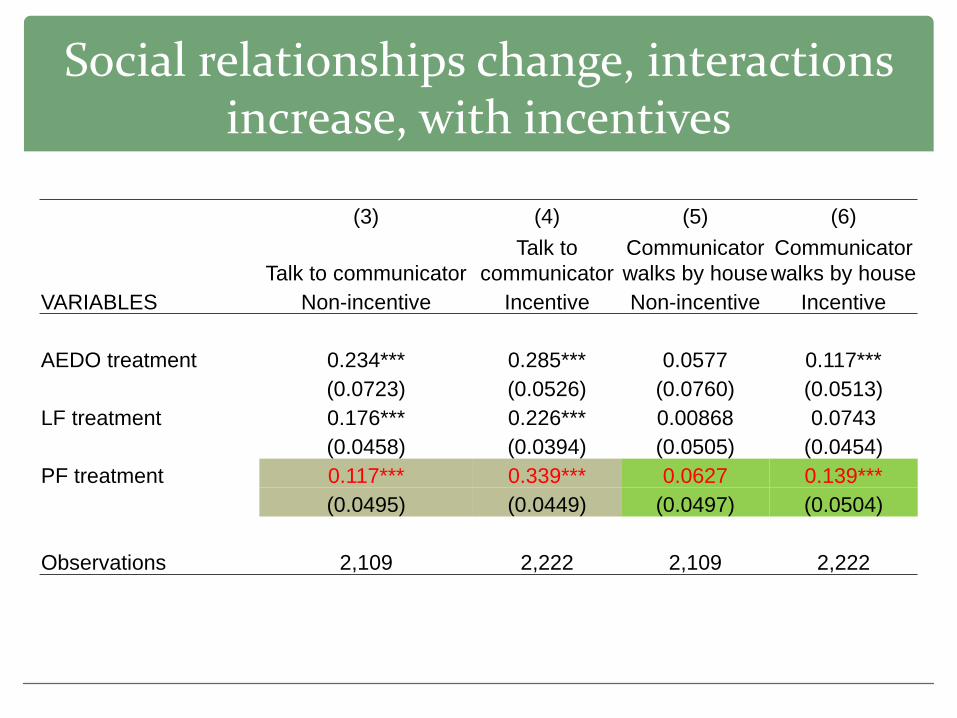
Social relationships change, interactions increase, with incentives
(3) (4) (5) (6)
Talk to communicator Talk to
communicator Communicator walks by house
Communicator walks by house
VARIABLES Non-incentive Incentive Non-incentive Incentive AEDO treatment 0.234*** 0.285*** 0.0577 0.117***
(0.0723) (0.0526) (0.0760) (0.0513) LF treatment 0.176*** 0.226*** 0.00868 0.0743
(0.0458) (0.0394) (0.0505) (0.0454) PF treatment 0.117*** 0.339*** 0.0627 0.139***
(0.0495) (0.0449) (0.0497) (0.0504)
Observations 2,109 2,222 2,109 2,222
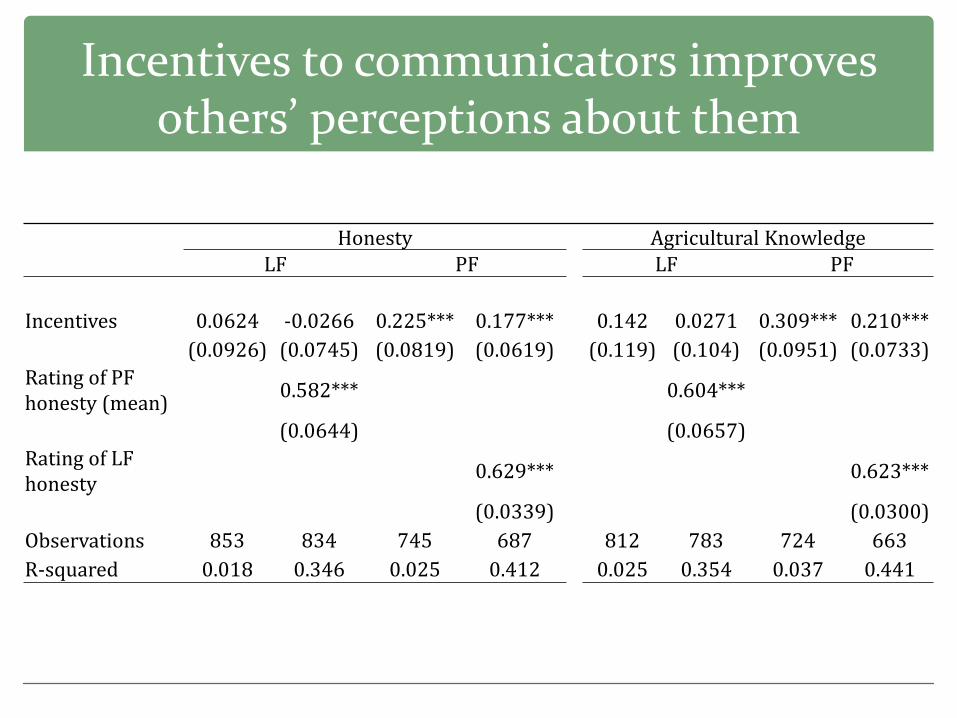
Honesty Agricultural Knowledge LF PF LF PF
Incentives 0.0624 -0.0266 0.225*** 0.177*** 0.142 0.0271 0.309*** 0.210*** (0.0926) (0.0745) (0.0819) (0.0619) (0.119) (0.104) (0.0951) (0.0733)
Rating of PF honesty (mean) 0.582*** 0.604***
(0.0644) (0.0657) Rating of LF honesty 0.629*** 0.623***
(0.0339) (0.0300) Observations 853 834 745 687 812 783 724 663 R-squared 0.018 0.346 0.025 0.412 0.025 0.354 0.037 0.441
Incentives to communicators improves others’ perceptions about them
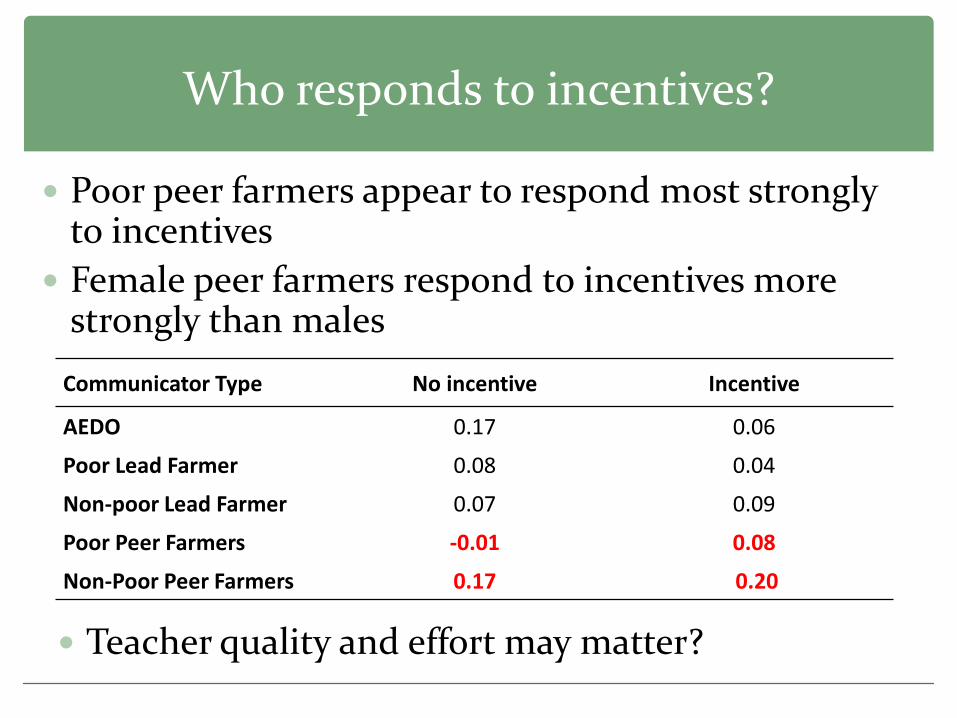
Who responds to incentives?
Poor peer farmers appear to respond most strongly to incentives
Female peer farmers respond to incentives more strongly than males
Communicator Type No incentive Incentive
AEDO 0.17 0.06
Poor Lead Farmer 0.08 0.04
Non-poor Lead Farmer 0.07 0.09
Poor Peer Farmers -0.01 0.08
Non-Poor Peer Farmers 0.17 0.20
Teacher quality and effort may matter?
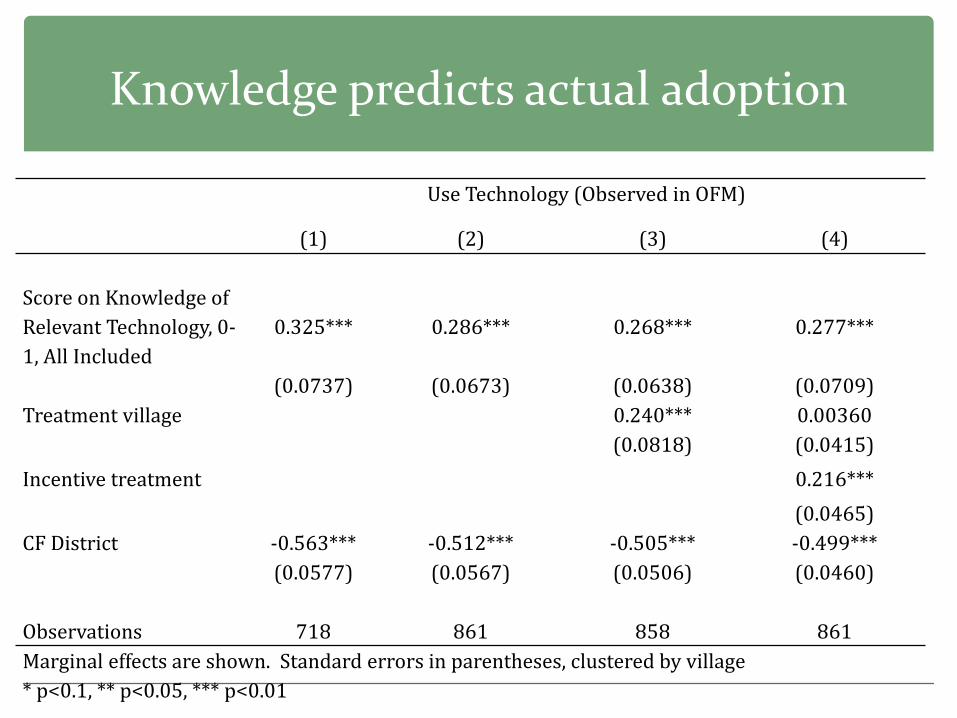
Use Technology (Observed in OFM)
(1) (2) (3) (4) Score on Knowledge of Relevant Technology, 0-1, All Included
0.325*** 0.286*** 0.268*** 0.277***
(0.0737) (0.0673) (0.0638) (0.0709) Treatment village 0.240*** 0.00360
(0.0818) (0.0415) Incentive treatment 0.216***
(0.0465) CF District -0.563*** -0.512*** -0.505*** -0.499***
(0.0577) (0.0567) (0.0506) (0.0460)
Observations 718 861 858 861 Marginal effects are shown. Standard errors in parentheses, clustered by village * p<0.1, ** p<0.05, *** p<0.01
Knowledge predicts actual adoption
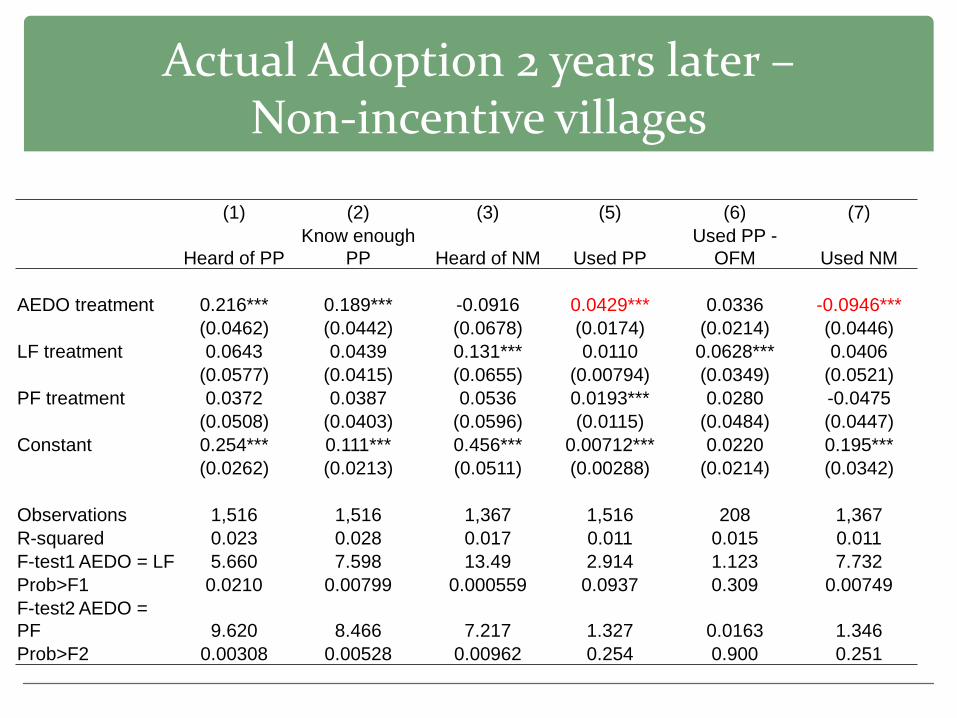
Actual Adoption 2 years later – Non-incentive villages
(1) (2) (3) (5) (6) (7)
Heard of PP Know enough
PP Heard of NM Used PP Used PP -
OFM Used NM AEDO treatment 0.216*** 0.189*** -0.0916 0.0429*** 0.0336 -0.0946***
(0.0462) (0.0442) (0.0678) (0.0174) (0.0214) (0.0446) LF treatment 0.0643 0.0439 0.131*** 0.0110 0.0628*** 0.0406
(0.0577) (0.0415) (0.0655) (0.00794) (0.0349) (0.0521) PF treatment 0.0372 0.0387 0.0536 0.0193*** 0.0280 -0.0475
(0.0508) (0.0403) (0.0596) (0.0115) (0.0484) (0.0447) Constant 0.254*** 0.111*** 0.456*** 0.00712*** 0.0220 0.195***
(0.0262) (0.0213) (0.0511) (0.00288) (0.0214) (0.0342)
Observations 1,516 1,516 1,367 1,516 208 1,367 R-squared 0.023 0.028 0.017 0.011 0.015 0.011 F-test1 AEDO = LF 5.660 7.598 13.49 2.914 1.123 7.732 Prob>F1 0.0210 0.00799 0.000559 0.0937 0.309 0.00749 F-test2 AEDO = PF 9.620 8.466 7.217 1.327 0.0163 1.346 Prob>F2 0.00308 0.00528 0.00962 0.254 0.900 0.251
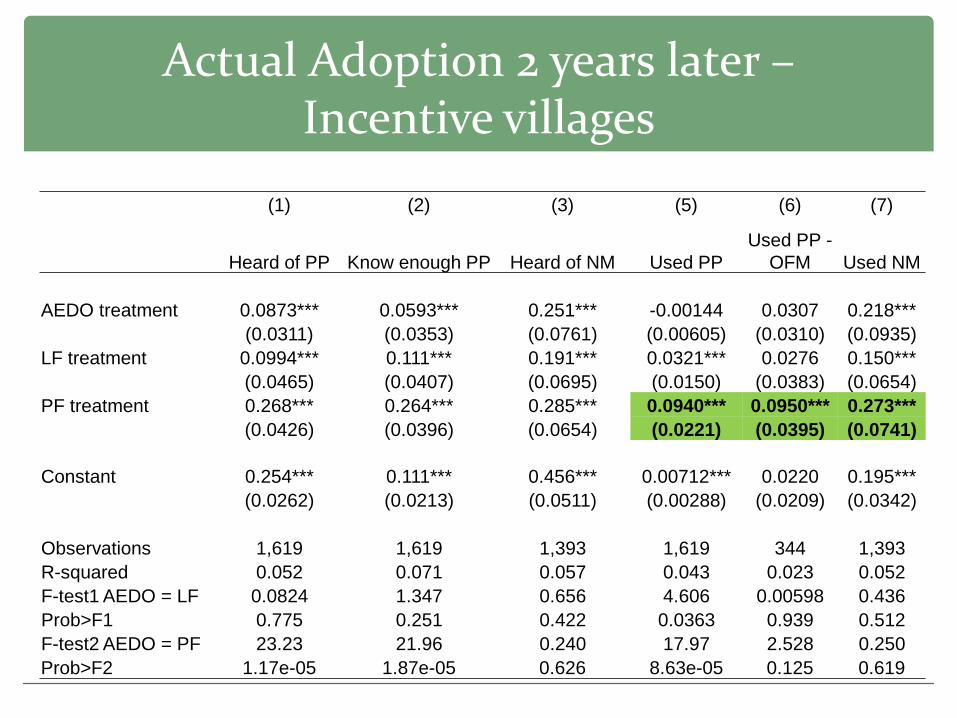
Actual Adoption 2 years later – Incentive villages
(1) (2) (3) (5) (6) (7)
Heard of PP Know enough PP Heard of NM Used PP Used PP -
OFM Used NM AEDO treatment 0.0873*** 0.0593*** 0.251*** -0.00144 0.0307 0.218***
(0.0311) (0.0353) (0.0761) (0.00605) (0.0310) (0.0935) LF treatment 0.0994*** 0.111*** 0.191*** 0.0321*** 0.0276 0.150***
(0.0465) (0.0407) (0.0695) (0.0150) (0.0383) (0.0654) PF treatment 0.268*** 0.264*** 0.285*** 0.0940*** 0.0950*** 0.273***
(0.0426) (0.0396) (0.0654) (0.0221) (0.0395) (0.0741)
Constant 0.254*** 0.111*** 0.456*** 0.00712*** 0.0220 0.195*** (0.0262) (0.0213) (0.0511) (0.00288) (0.0209) (0.0342)
Observations 1,619 1,619 1,393 1,619 344 1,393 R-squared 0.052 0.071 0.057 0.043 0.023 0.052 F-test1 AEDO = LF 0.0824 1.347 0.656 4.606 0.00598 0.436 Prob>F1 0.775 0.251 0.422 0.0363 0.939 0.512 F-test2 AEDO = PF 23.23 21.96 0.240 17.97 2.528 0.250 Prob>F2 1.17e-05 1.87e-05 0.626 8.63e-05 0.125 0.619
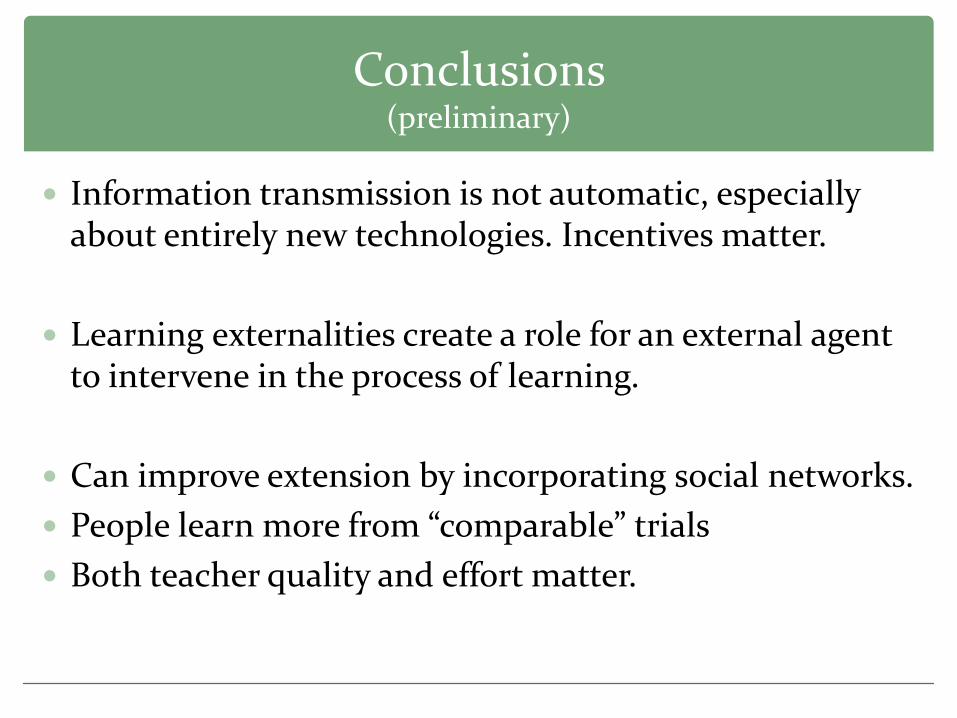
Conclusions (preliminary)
Information transmission is not automatic, especially about entirely new technologies. Incentives matter.
Learning externalities create a role for an external agent to intervene in the process of learning.
Can improve extension by incorporating social networks. People learn more from “comparable” trials Both teacher quality and effort matter.
Extra slides
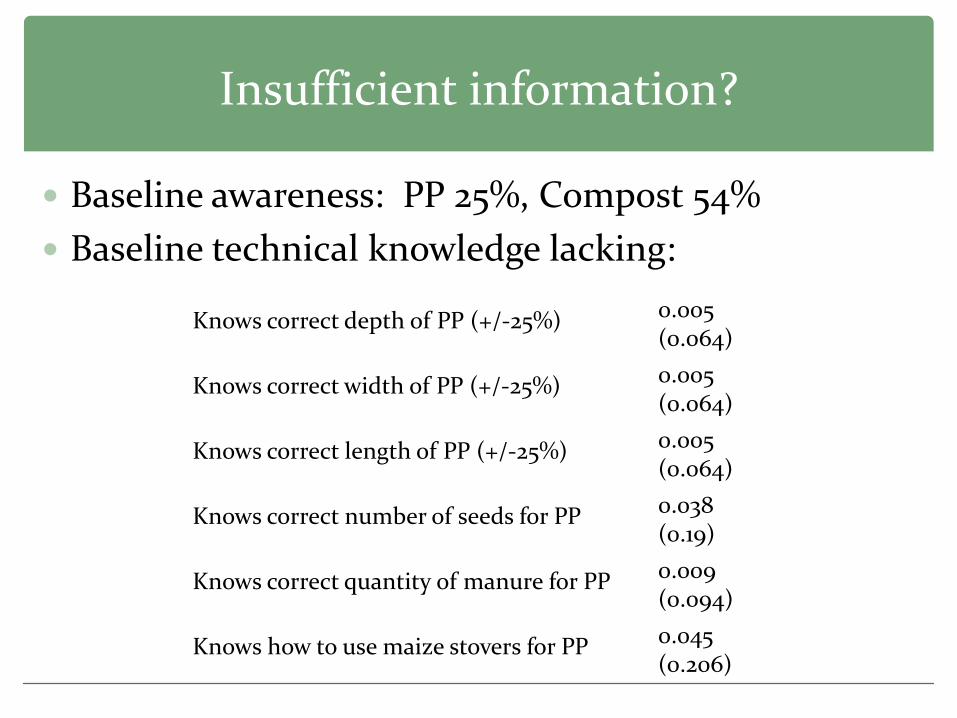
Insufficient information?
Baseline awareness: PP 25%, Compost 54% Baseline technical knowledge lacking:
Knows correct depth of PP (+/-25%) 0.005 (0.064)
Knows correct width of PP (+/-25%) 0.005 (0.064)
Knows correct length of PP (+/-25%) 0.005 (0.064)
Knows correct number of seeds for PP 0.038 (0.19)
Knows correct quantity of manure for PP 0.009 (0.094)
Knows how to use maize stovers for PP 0.045 (0.206)
Social networks literature
Social learning in other contexts: Job information: Beaman (2009), Magruder (2009) Deworming: Miguel and Kremer (2007) Health behaviours: Godlonton and Thornton (2009), Oster
and Thornton (2009)
Social promoters and incentives: Kremer et al (2009), Ashraf, Bandiera, and Jack (2011)
Sample
4200 randomly sampled households in 168 villages across 8 districts in Malawi
Communication treatment assignments: AEDO: 25 villages LF: 50 villages PF: 45 villages