Embed Size (px)
Citation preview

Social Networks in Ghana1
Christopher R. UdryYale [email protected]
Timothy G. ConleyUniversity of Chicago
May, 2004
1This research has been funded by The Pew Charitable Trusts through its projecton Moral and Social Dimensions of Microeconomic Behavior in Poor Communities.The underlying field research received financial support from the NSF (grants SBR-9617694 and SES-9905720), International Food Policy Research Institute, Institutefor the Study of World Politics, World Bank Research Committee, Fulbright Pro-gram, ESRC and Social Science Reseach Council. We thank members of the Pewnetwork for many helpful comments.

Abstract
In this chapter we examine social networks among farmers in a developingcountry. We use detailed data on economic activities and social interac-tions between people living in four study villages in Ghana. It is clear thateconomic development in this region is being shaped by the networks ofinformation, capital and influence that permeate these communities. Thischapter explores the determinants of these important economic networks.We first describe the patterns of information, capital, labor and land trans-action connections that are apparent in these villages. We then discussthe interconnections between the various economic networks. We relatethe functional economic networks to more fundamental social relationshipsbetween people in a reduced form analysis. Finally, we propose an equi-librium model of multi-dimensional network formation that can provide afoundation for further data collection and empirical research.

I Introduction
The design of economic policy in Africa has been, and continues to be, ham-pered by dependence upon misleading units of analysis inherited from ven-erable models that were developed in a radically different social context. Wethink about ‘firms’ that produce, interacting through markets with ‘house-holds’ that consume, and about small enterprises in which the roles of the‘household’ and the ‘firm’ are merged. It is increasingly clear, however, thatthe very definition of the core units of the ‘household’ and ‘firm’ are problem-atic in many African contexts and that the facile use of these concepts canlead to misleading judgments about the process of economic development.
In Africa, the boundaries of ‘household,’ ‘firm’ and ‘market’ are mobileand permeable. Things resembling market transactions occur within house-holds and family-like interactions take place across households and firms.Rather than conceptualizing membership in a household or firm as a zero-one event, it is fruitful to think of individuals as participating in numeroussocial relationships of varying qualities and intensities with a variety of dif-ferent people. Important insights about the structure of African economiesand the design of appropriate economic policy are gained by the recognitionthat people are embedded within social networks.
Some of these implications are apparent in the Eastern Region of Ghana.The region is one of the key foci of Ghana’s development strategy of expand-ing non-traditional exports. It is experiencing a transformation of its farm-ing system from the production of local foodstuffs to intensive cultivationof pineapple for export as fresh fruit to Europe. The salient aspects of thistransformation include learning about a set of new technologies, alterna-tions in established patterns of land resource management, a dramatic shiftto more capital-intensive production and important new risks. On each ofthese dimensions, patterns of change have been fundamentally conditionedby the composition of social networks.
For example, in Conley and Udry (2001, 2003), we find that informationabout the proper use of the new technology passes informally between farm-ers. Farmers experiment with varying levels of input intensity (particularlyfertilizer) and they discuss the results of their experiments with a restrictedset of peers. Farmers learn from these discussions. Our data show, for ex-ample, that a given farmer will begin to use more fertilizer after a neighborwith whom he is linked in an information network uses high amounts of fer-tilizer and achieves surprisingly high profits. As a consequence, people whoare strongly connected with many other pineapple farmers (call them cen-tral) have learned the contours of this radically new technology more rapidly
1

than others. We hypothesize that, in turn, other farmers value informationconnections with these central farmers because of the value of the knowledgethat central farmers have obtained from others. The particular structure ofthe information network in these villages has had a dramatic effect on thediffusion of these new techniques.
Similarly, we find that access to land is secured via informal channelsof political power. Plots in Ghana, as in much of Africa, are controlled byindividuals, not households. Goldstein and Udry (2004) show that profitson women’s farms are much lower than those of their husbands. In thesevillages, land fertility is maintained by periodic fallowing, and we show thatthe reason for the much lower profits on wives’ plots is the fact that theyare left fallow for shorter periods than are the plots of their husbands. This,in turn, is a consequence of the fact that the ties of mutual obligation andpolitical influence that undergird land tenure security — and thus permitextended fallow periods for men — largely bypass their wives. In southernGhana, access to land is based on negotiation, status and identity withina corporate group. Those with relatively weak ties to the group leadershipare reluctant to fallow their land for fear of finding it reallocated to a rivalwhen it is time to re-establish cultivation. Women are disproportionatelylikely to inhabit the margins of this political network and so fallow relativelylittle. What is particularly striking about our findings is the extent to whichthe “household” is inconsequential for cultivation decisions. The politicalinfluence of the husband seems to be entirely irrelevant for the security oftenure of the wife. It is in those households in which the husband holdsa political office and the wife does not that the gap in fallowing (and thusfertility and profits) between the husband’s plots and the wife’s plots islargest.
Political influence and thus security of access to land flows through net-works that cleave households. Similarly, husbands and wives tend to par-ticipate in separate insurance networks. Goldstein (2002) shows that risk-sharing between husbands and wives is highly imperfect. Women pool riskwith other women in their villages more than with their husbands, andmen share risk with male members of their extended families. Other finan-cial flows show a similar pattern. Rates of return on capital invested in thisexport-led rural economy are astonishingly high (Goldstein and Udry 1999a).However, net financial inflows are small and largely follow well-establishedpaths between individuals with deep social connections: sometimes betweenhusband and wife, but more often between siblings, long-term friends andmembers of the extended family. It is clear that credit constraints apply atthe level of the individual, not the “household”: there were numerous in-
2

stances during our fieldwork in which a wife was unable to make potentiallyprofitable investments (say, in pineapple cultivation or a non-farm enter-prise) as the husband was expanding his on-going enterprise. Once again, itis the individual’s position in the relevant social network that is the crucialdeterminant of access to a valued resource.
Our work thus far has made it clear that economic development in thisregion is being shaped by the networks of information, capital and influ-ence that permeate these communities. The first goal of this chapter is todescribe the patterns of information, capital, labor and land transactionconnections that are apparent in these villages. We discuss the intercon-nections between the various economic networks: how closely related arethe functionally different connections between individuals? We then relatethese functional connections between individuals to more fundamental spa-tial, kinship, migration, gender and religious relationships between people.Finally, we propose an equilibrium model of multi-dimensional network for-mation that can provide a foundation for further empirical research. Ourhope is that this chapter can serve as a resource for future data collectionon social networks guided by economic theory.
II Data and Setting
The research was conducted in four clusters of villages in the Eastern Regionof Ghana. Commercial agriculture is no recent innovation in the study area.Historically, the farming systems of the study area have undergone a seriesof significant changes. In the 19th century, oil palm production sparkedthe first inflow of migration to the area. This district was at the heart ofGhana’s cocoa revolution at the turn of the 20th century (Hill 1963). In 1930,swollen shoot disease devastated cocoa production and farmers adopted asystem based on intercropped cassava and maize. Most recently (since theearly 1990s), farmers in the area have moved towards intensive pineappleproduction for export.
The southern Ghanaian forest-savanna transition zone has seen adramatic reduction in forest cover since the 1970s (as evidenced by aerialphotography (Gyasi et al 1994) and satellite imagery (Hawthorne and Abu-Juam 1995), important reductions in fallow lengths over the same period(Gyasi et al 1994, Amanor 1994) and increased evidence of soil deteriorationand infestation by pests, particularly the virulent weed known locally asakyeampong) (Gyasi 1990; Amanor 1994). Land rights, however, havenot been transformed into anything close to individualized freehold tenure.
3

Berry (2001) notes that land in southern Ghana “is subject to multiple,overlapping claims and ongoing debate over these claims’ legitimacy andtheir implications for land use and the distribution of revenue” (2001, p.xxi). Goldstein and Udry (2004) provide evidence that fallowing decisionsare strongly influenced by the cultivator’s political position in the villageand lineage.
Within each village cluster we selected 60 married couples (or triples - abit more than five percent of husbands have multiple wives) for our sample.Each member of the pair or triple was interviewed 15 times during the courseof the two years. Every interview was carried out in private, usually by anenumerator of the same gender.
The survey was centered around a core group of agricultural activityquestionnaires (plot activities, harvests, sales, credit) that were administeredduring each visit. In addition, about 35 other modules were administeredon a rotating basis. We also administered (once per field) an in-depth plotrights and history questionnaire and mapped each plot using a geographicalinformation system. We supplemented this with data on soil fertility: theorganic matter and pH of each plot was tested each year.
Much of the analysis of this paper is based on data we collected on thesocial and economic interactions of our sample members with other people,and in particular with other people in our sample. We recorded data onthe contacts that each of our respondents had with other individuals (in thedata archive, this is the “individual roster”). ‘Contacts’ include learninginteractions, credit and gift transactions, sales/purchases of farm inputs andoutputs and labor and land market interactions. In the second year of thesurvey, for each such transaction we asked the respondent to provide certaininformation about the other party to the transaction. Data was recorded onthe relationship and frequency of contact between the respondent and thecontact, the residence and occupation of the contact and the identificationnumber of the contact if he/she is in the sample. Every contact has aunique identification number so we can trace them throughout the differentquestionnaires.
These contacts are reasonably well-defined for credit, gift, purchase/sale,land and labor transactions. However, the nature of learning interactions ismore subtle and subjective. We asked a long series of questions about spe-cific tasks, ideas and decisions. For example, “Did anyone advise you whichparticular crops to plant on your farm?”, or “From whom did you first learnabout the idea of using fertilizer?” Our list of information links for any indi-vidual includes anyone named in response to these questions. In principle,all pairs of respondents who learned about farming from each other should
4

be listed. In fact, it is impossible to record the names of all individualswith whom respondents discuss farming, so enumerators were instructed torequest the names of individuals with whom more than casual conversationstook place. Two important issues arise as a consequence. First, differentrespondents interpret ‘casual’ differently, and second, important informationmight be transmitted during quite casual conversation.
Therefore, we also collected complementary data on information inter-actions from questions about randomly selected pairs of respondents. Wecollected two such datasets. One was focused particularly on learning aboutpineapple. The other was more general. Consider the latter. Each samplerespondent was questioned about a random sample (without replacement)of seven other individuals in the same village, and with three other pre-determined individuals who appear to be focal in the village. Links foreach respondent are defined according to his responses to specific questionsabout the relationship with the selected persons. For example, “Have youever gone to ___ for advice about your farm?” For each pair of individu-als we also record information on the frequency of contact, the period overwhich they have interacted and information on familial relations. This typeof data has proven particularly useful for understanding the process of sociallearning through network connections. It is less useful for understandingthe overall shape of social networks in the villages because it provides noinformation on interactions between individuals outside the random sampleof seven for each respondent. Therefore, for the remainder of the chapterwe utilize data from the ‘individual rosters’ of each of the respondents.
In addition to the data on social and economic interactions, we will makeuse of data on each respondent’s family background, wealth and education.Finally, we rely on our data on the spatial relationships between the plotsof our respondents derived from the village and plot maps.
III Networks of Information, Finance, Land andLabor in Southern Ghana
The data on network links provides us with a random sample from whichwe can infer some characteristics of the social and economic networks inour research villages. The data are ‘egocentric’ in the parlance of networktheory: we know (in principle) about the links from our sample individualsto other people. If one of these links happens to be to another individualin our sample then we know a great deal about both nodes of that link, andabout further connections along the network. However, if the individual at
5

the other end of the link is not a member of our sample, then our informationis quite limited. In particular, we know nothing about further links alongthe network.
A simple consequence of our fixed sample size across villages is that theprobability that both nodes of a given link are included in our sample islower in a large village than in a small village. This fact does not hinderinference about the relative densities of networks across villages. Let Lt
v bethe number of links of type t in village v. The density of the t network inv is defined as
∆tv =
2Ltv
nv(nv − 1)(1)
(Wasserman and Faust 1994). Clearly, ∆tv ranges from 0 to 1 (for a complete
network in which each individual is connected to each other individual).Consider two villages v and u with ∆t
v = ∆tu. However, the sizes of the
villages could differ (nv 6= nu). Since the densities are equal,
Ltv =
nv(nv − 1)nu(nu − 1)
Ltu. (2)
A link is observed in our data if both involved individuals are in our sample.Therefore, if S is the fixed sample size across villages, the probability of
observing any given link in village v is³
Snv
´2. The expected number of
links observed in village v isµS
nv
¶2Ltv =
µS
nv
¶2 nv(nv − 1)nu(nu − 1)
Ltu ≈
µS
nu
¶2Ltu (3)
(for large nu, nv), which is the expected number of links observed in villageu.
Our sampling was based on villages, and hence captures links only if bothindividuals reside in the village. It is commonly assumed that the villageis the natural domain for the analysis of social and economic networks inrural West Africa, but that need not be true in all places and for all typesof social network. These villages, in particular, have long been tightlyintegrated into the regional, national and global economy. An analysis ofconnections entirely within the village may be profoundly misleading if themost important interactions generally cross village boundaries.
The data permit us to identify the relative extent of interactions withinand across village boundaries by network type. For most of the interactionswe consider the majority of activity occurs within the village. Most of
6

the individuals named by our respondents as sources of information aboutfarming reside within the village. 66% of the recorded cases of learningactivity occurred with other people in the village. This proportion variesacross villages, from a low of 53% in the smallest village to between 70%and 80% in the remaining three villages.
Financial interactions are similarly concentrated within villages. 59%of credit transactions and gift exchanges occur within village boundaries;virtually all the rest with relatives and friends outside the village. Only13 of 719 loans were taken from formal or semi-formal sources. Again, theproportion rises with village size, from 54% in the smallest village to 65%in the largest. 62% of the individuals from whom our respondents obtainedland reside within the same village. This proportion ranges from 47% inthe smallest village to 74%.
Labor transactions appear to be even more concentrated within villages.76% of identified non-household labor used on sample plots comes fromwithin the village. However, this is likely to be an overestimate of thedegree of concentration, because 40% of non-family labor is identified in ourdata simply as anonymous “no relation.” For these transactions, we do notrecord the residence of the laborers, so we do not know if they originatefrom the village. Informal discussions and observation during the fieldresearch make it apparent that a substantial proportion of this kind of laboris brought in as daily wage labor from nearby towns. Moreover, mostwithin-village labor transactions occur when a household head or spousehires dependents in other households. When this is the case, we do not haveinformation on the household identifier of the hired worker, so the link cannot be included in much of the analysis that follows.
In dramatic contrast, only 7.6% of sales of farm output occur betweenresidents of the village. Virtually all output is sold directly in regionalmarkets, to itinerant traders or, in the case of pineapple, to specializedcommercial exporters.
The predominance of intravillage interactions for information transfer,financial flows and land exchange makes salient the analysis of their village-level networks. We are less confident of the importance of the within-villagelabor network and place less emphasis on this network. Within-village salesof output/purchases of farm inputs are unimportant. Therefore, we do notexamine further the shape or determinants of this network.
All of the networks that we consider are sparse in terms of direct con-nections. Less than 2% of pairs of respondents are connected by any sortof direct link (this corresponds to a network density of approximately .04).Table 1 presents summary statistics on the frequency of the different kinds
7
of links by village. In each case, the denominator of the proportion is thenumber of pairs of individuals in our sample in each village and the nu-merator is the number of observed links of a given type between sampleindividuals. There are few strong differences across villages in the densityof the individual functional networks. Village 2 has a noticeably sparse net-work of labor connections, while the network of land transactions in village3 is particularly dense.
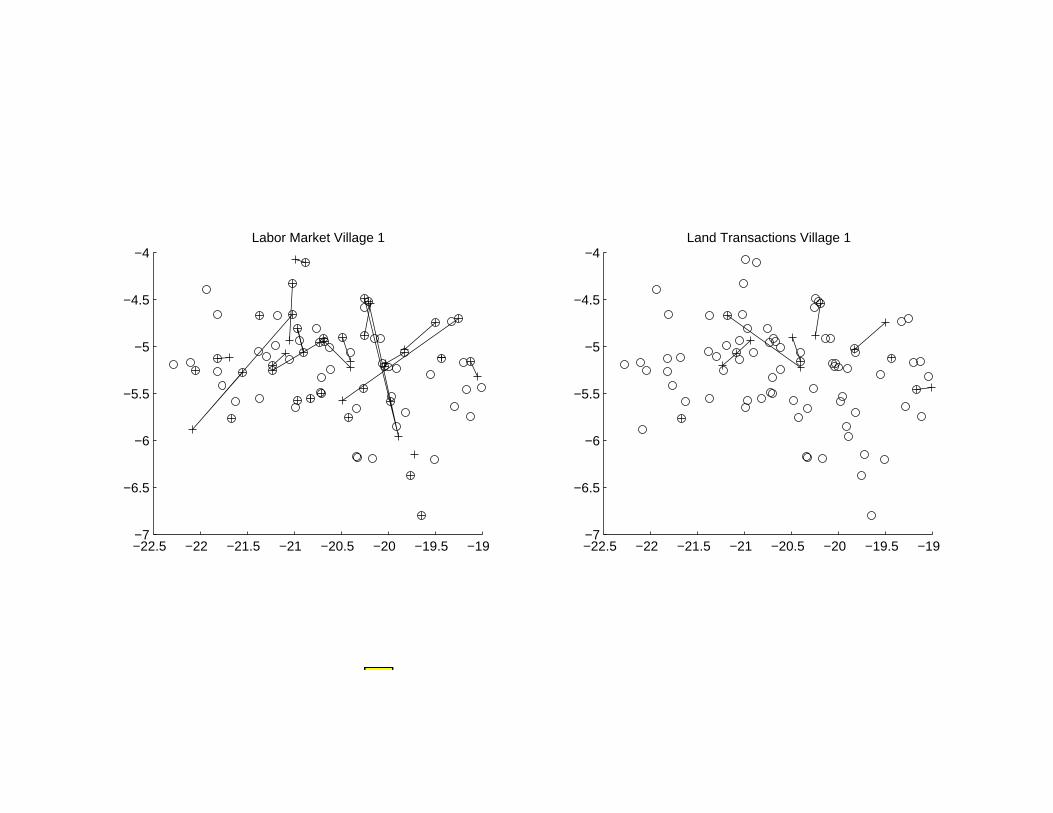
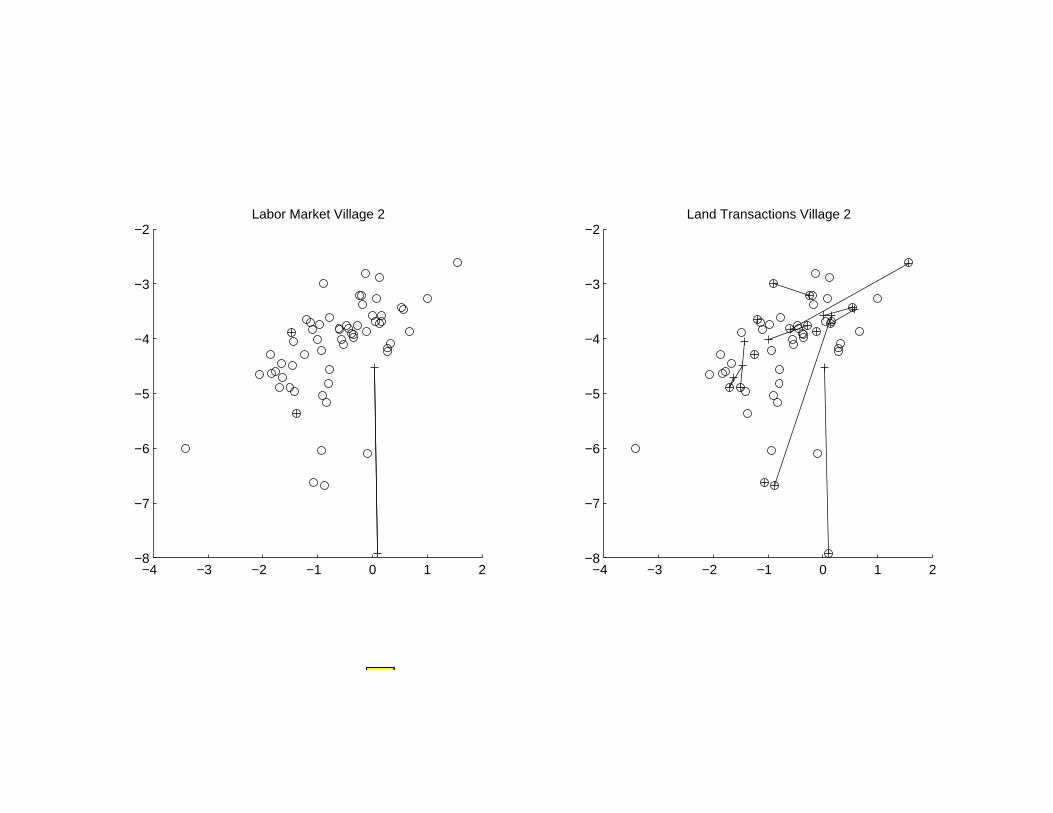
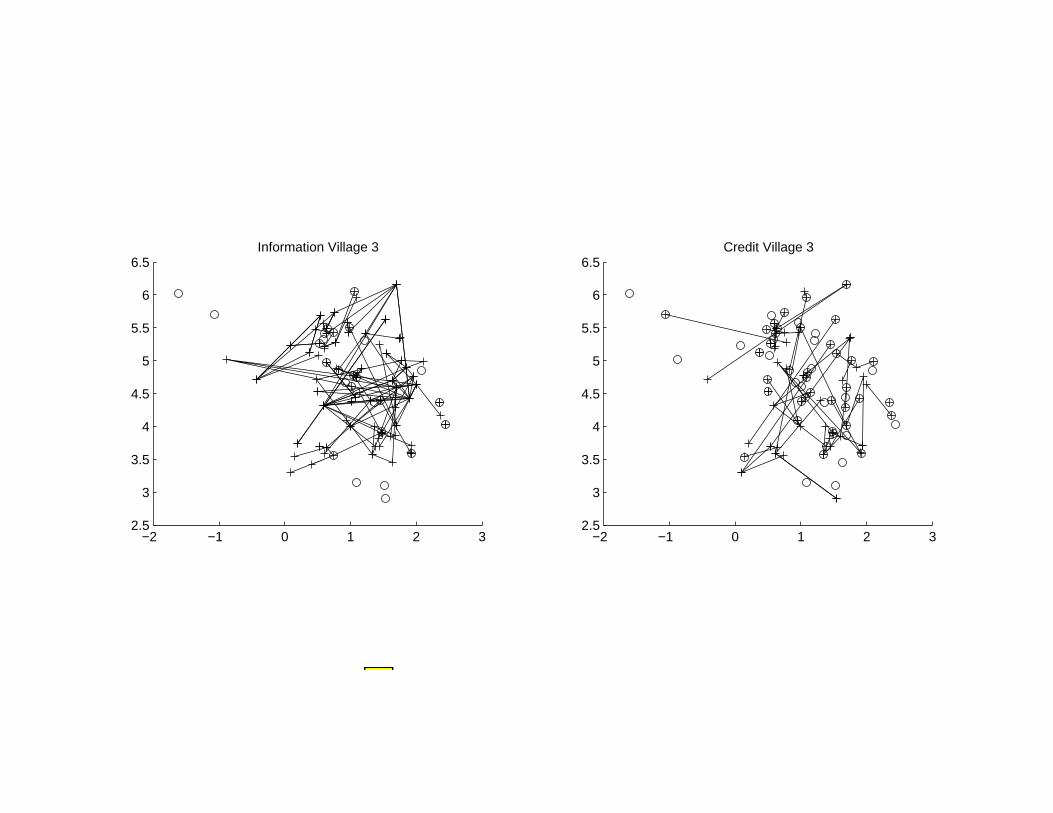
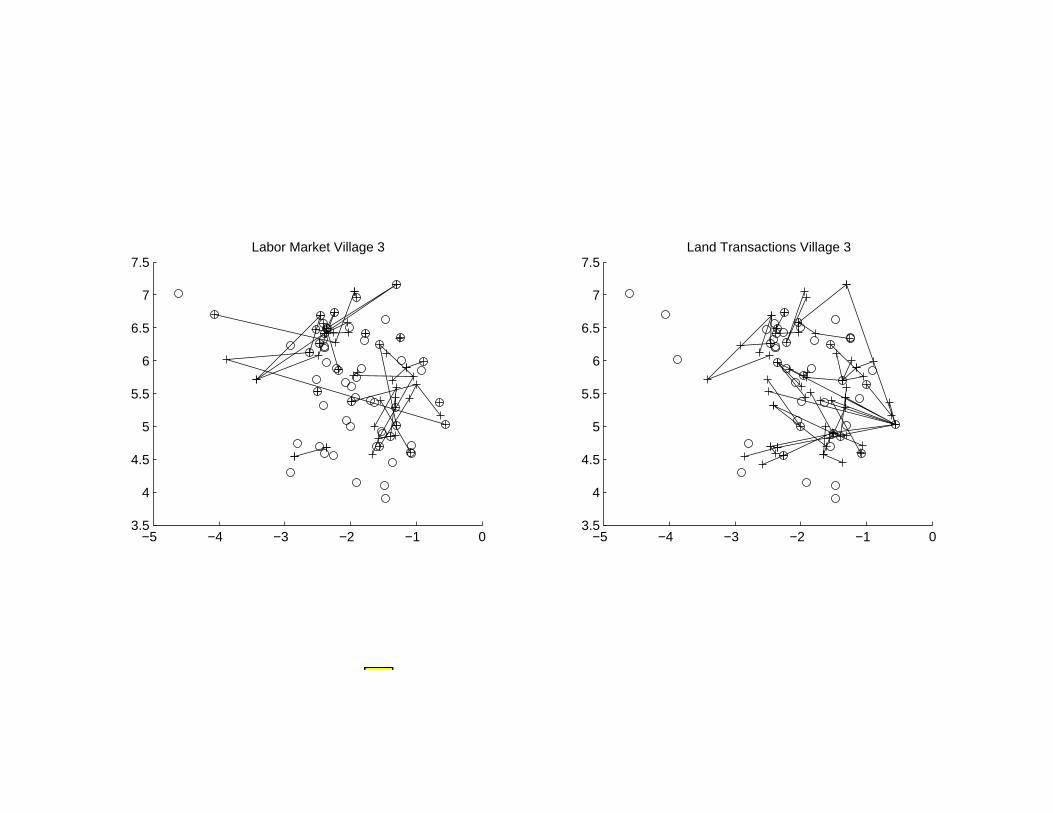
There is a strong spatial element to these networks, and it is useful tobe able to visualize their shape in real space (Faust et al 1999). Figures 1through 4 plot the geographic location and the various network links betweenour sample individuals. The geographic location of each individual is definedby the average position of the plots (s)he cultivates and is indicated by anode of the graph. Links between sample individuals in the various networksare indicated by the edges of the graphs.
There are individuals in each village for each network who appear iso-lated in these graphs. That appearance is a misleading consequence of thestrategy of constructing these graphs based on ‘ego-centric’ data from a ran-dom sample of the population. In fact, for each of these functional networksthere is virtually no one in any of these villages who has no interactions withanyone. Virtually everyone in our sample has learning contacts, exchangescredit and/or gifts, hires labor and has obtained land from someone. If noneof those other parties happens to be in our sample, the individual appearsisolated in the graphs.
The graphs do point in certain interesting directions. First, there is asubstantial, but by no means complete, overlap between the different net-works in a given village. Individuals connected along one dimension appearmore likely to be connected along the others. This impression is stronglysupported by the statistical evidence that follows. Second, information net-works appear to be more characterized than the other networks by the pres-ence of focal individuals, who have multiple links in our sample. Third, it isapparent that connections are more likely between nearby farmers, but thatlinks between more distant individuals are common, particularly for creditnetworks.
Links between individuals in the different functional networks are by nomeans independent. Tables 2 A− F show that the presence of any kind oflink between two individuals is much more likely conditional on the existenceof any other kind of link. Credit and information links are the most closelyassociated: nearly half of the pairs connected by an information link arealso connected by a flow of credit or gifts, compared to an unconditionalprobability of 1.25% for the existence of a credit link. The same general
8
pattern, however, holds for all pairs of networks.Careful analysis is required, therefore, to distinguish the consequences for
behavior or outcomes of different kinds of connections between individuals.A finding, for example, that adoption of a new technology is particularlylikely for an individual who shares an information connection with someonewho has recently had success with that technology might be attributed tosocial learning effects. However, because information links are correlatedwith financial links, this same observation might arise if credit markets areimperfect and the success of the first farmer lowered the cost of capital tothe second. Appropriate attention to the entire set of relevant networksmay make it possible to distinguish between the different kinds of socialinteraction effects that influence behavior.
Alternatively, it might be appropriate to think of a single network ofbasic connections between individuals that can be mobilized for multiplepurposes depending upon circumstances. Over some period, a connectionmight yield flows of finance; at others it might involve a land transaction.Recall how our data on links are constructed: the credit, land and laborlinks are based on the existence of an exchange over the relevant period.Information links are defined somewhat differently because they look backat the whole history of learning interactions over a respondent’s farmingcareer. We believe that these are better-defined measures than some loosenotion of “who could you approach for credit,” land or labor. However, itobviously has its costs because it provides no direct information about thepotential (rather than realized) uses of a given tie between individuals.
Finally, close correlation between links of various types raises the possi-bility that the underlying determinants of network connections are similarfor different types of links. If the different functional links really do havedifferent purposes, this pattern tends to focus our attention on the costsof constructing and maintaining connections, which could well be similarfor different types of links. We turn now, therefore, to an examination ofthe correlations between current ties in the various networks and a set ofarguably deeper social connections between farmers.
IV Predicting Networks
Table 3 provides summary statistics about the social connections between(non-married) pairs of individuals in the villages. The sample is the set ofall within-village pairs of sample individuals, except for pairs linked by mar-
9

riage.1 Approximately one-fifth of pairs are members of the same religion.Again, one-fifth of pairs are members of the same extended matrilineage(each village has two to three matrilineages that account for a collective70 − 80% of the population, and five or six other, smaller matrilineages).For a further fifth of the sample pairings, at least one individual in the pairholds a traditional village or lineage office (for example, is village elder).The two individuals have the same soil type (described as one of three ma-jor groups of soil types) in a third of the pairings. The average absolutevalue of the age difference between the paired individuals is a decade, whilethe average absolute nonland wealth difference is 750, 000 cedis2 (comparedto average wealth of 670, 000 cedis). The average distance between the plotsof pairs of individuals is about 114 kilometers.
Logit estimates of the probabilities that a link exists in a pair are pre-sented for each of the four networks (information, credit, land and labor) inTable 4.3 Let ltij = 1 be an indicator variable that there is a link of typet between individual i and individual j. Let the notation Pr{ltij = 1} referto the probability that ltij = 1 conditional on observable (to the econometri-cian) information. We estimate
Pr{ltij = 1} = Λ(Xijβ), (4)
where Λ is the logistic CDF. Coefficients are presented as odds ratios (eβk),along with z-statistics for the test against the null hypothesis that the oddsratio is unity. The standard errors are heteroskedasticity-consistent.
The covariates and samples are identical across the different regressions,and the predicted probabilities of a link in the middle of the distribution ofthe covariates is very similar (always near 1− 2%), so direct comparisons ofthe odds ratios are sensible.
In each case, gender is a crucial determinant of the likelihood of a linkbetween individuals. It is very rare for non-married individuals of oppositegenders to interact directly in any of these four dimensions. It is also the casethat membership in the same matrilineage is strongly associated with theexistence of any of these network links. This is particularly so in the case ofcredit links, and relatively less so in the case of information and land links.Given the informal enforcement mechanisms that can be brought to bearwithin the matrilineage, it is not surprising to find that credit and mutual
1Married pairs are excluded from the analysis samples in Tables 4 and 5 as well.2The exchange rate during the survey period ranged from 1700 to 2300 cedis per US
dollar.3See Anderson et al (1999) for a discussion of logit models in network analysis.
10

gift exchanges are more common within lineages (Klingelhofer 1972). Moresurprising is the finding that among the four networks, land transactionsare least positively affected by membership in the same lineage. Landrights in southern Ghana are very strongly associated with the matrilineage(Goldstein and Udry 1999b, Berry 2001). It is possible that the relativelysmall increment to the likelihood of a land link associated with membershipin the same matrilineage reflects the potential ambiguities of plot rightswhen land is transferred within the matrilineage. “The process of acquiringand defending rights in land is inherently a political process based on powerrelations among members of the social group” (Bassett and Crummey 1993,p. 20); the transaction may be less problematic when made on a morecommercial basis across lineage boundaries.
The finding that membership in the same church is strongly associatedwith the presence of a credit link again may reflect the informal enforce-ment mechanisms that are available within religious groups. Religion is notstrongly associated with the likelihood of any other type of network connec-tion. Similarly, we find that credit links are much more likely when bothindividuals share a family origin in the same region of Ghana. Region of ori-gin can cross-cut matrilineages in these villages, so this may reflect the socialenforcement mechanisms available to communities formed of migrants.
Farmers who share similar soil characteristics are much more likely toshare an information link than otherwise. This is naturally related to thepotential gains from the information link, if optimal farming practices arevariable across soil types in a non-systematic (or at least non-obvious) man-ner. We also find that land links are much more likely across farmers whoshare soil types; the simultaneity of this relationship makes even tentativeinterpretations problematic. In column 5 of Table 4 we remove this covari-ate and distance, which is subject to the same worry, and show that theremaining odds ratios are generally stable.
Differences in wealth are very strongly associated with the presence ofinformation connections. Looking more closely at the individuals in thenetwork maps of Figure 1 we find that several of the apparently nodal in-dividuals are much wealthier than average, and they tend to be connectedto individuals who are relatively less wealthy. There appears to be a sur-prising element of hierarchy in the information network. This is otherwiseapparent only in the land network, where it is to be expected. Credit andgift exchange, on the other hand, appears to be more horizontally oriented.These exchanges do not often occur between rich and poor. The hypothesisthat the provision of insurance is an important element of credit and giftexchange is consistent with this pattern.
11

Information and land links are much less likely between individuals whoare members of the first generations of their families to reside in the village.For land links this effect is sufficiently strong that there are no instances ofsuch links in our data.
All of these network interactions are more likely between farmers whoare located near each other. One would expect the cost of social interactionsto rise with distance, hence this is a pattern to be expected. In fact, it isthis general pattern that underlies the decision by many researchers to usegeographic location as a proxy for social connections. The relationship be-tween proximity and the likelihood of a network linkage is sufficiently strongthat location may indeed be a reasonable proxy for network membershipfor certain applications. However, it is clearly not an exact relationship,and the impact of distance on the likelihood of interaction varies in an in-teresting way across the networks. In particular, distance has a much lessstrong negative impact on the likelihood of a credit tie than on any of theother network connections. We have shown in other work that there is astrong positive spatial correlation in agricultural shocks (Conley and Udry2003, Goldstein and Udry 2004). This finding, therefore, points again toan important insurance motivation for the credit and gift exchanges.
Deeper social connections between individuals are strongly associatedthe presence of connections in these four social networks. It is possible thatinformation about these deeper relationships between people for predictingnetwork connections is less useful for predicting relatively transitory con-nections. Unfortunately, our data is constructed in such a way that we canexamine only one side of this question. We have no information regard-ing lapsed ties in these social networks. If two individuals once shared aconnection and no longer do, this connection will not appear in our data.However, we do know for how long two individuals who do share a con-nection have interacted.4 The final two rows of Table 4 show that theprobability of correctly predicting a link to exist when the two individualshave known each other for less than 5 years is lower than when the twohave been acquainted for longer periods. This pattern is less evident forcredit links, but is quite strong for each of the other types of connections.While the more fundamental social relations between people are importantpredictors of the likelihood of functional network connections, they are lessuseful in distinguishing more recent connections and will also be less useful
4The precise question is “How long have you known ____?” This is not necessarilythe same as knowing the length of time the two individuals have shared this particularinteraction.
12
to distinguish transitory links more generally.
IV.1 Robustness
The simple logit estimates presented in Table 4 leave open the possibilitythat there are unobserved characteristics of individuals that influence theprobability that they are linked with others. Put simply, it is plausiblethat certain individuals are more likely to build connections in a networkthan others. Consequently, we explore the possibility that the appropriateprobability model takes the form
Pr{ltij = 1} = Λ(Xijβ + λi + λj), (5)
where λi and λj are unobserved individual fixed effects. This model is ob-viously strongly related to the conditional logit model (Chamberlain 1980)but the standard conditioning approach is not available when there are twodimensions of fixed effects. Instead, we adopt a maximum likelihood ap-proach to estimate β and λi. When there is a fixed number of observationsper individual the conventional ML estimator of β is inconsistent. However,the median number of pairs including any individual in our data is 114, sowe rely on the asymptotic consistency of the ML estimator. Estimates ofequation 5 are presented in Table 5.
This estimation strategy implies that any individual who has no linkof a particular type (that is, any i such that ltij = 0 ∀j) contributes noinformation to the estimate of β̂. Such individuals and all of the pairs ofwhich (s)he is a part are dropped from the estimation sample. The precisenumbers are reported in Table 5. In addition, the variable “at least one ofpair holds office” is colinear with the individual effects and is dropped.
The remarkable feature of Table 5 is the overall similarity of the resultsto those reported in Table 4. The strong effect of gender is equally apparentin the Table. Also, distance between plots is once again strongly negativelyassociated with the likelihood of a linkage in any of these dimensions. Onceagain, however, this effect is much less strong for credit links than for any ofthe other types of connections between individuals. As in Table 4, there isa very strong positive association between two individuals sharing the samesoil type and the existence of an information link between them.
The strong positive relationship observed in Table 4 between the absolutevalue of the wealth difference between individuals and the likelihood thatthey share an information link is not replicated in Table 5. The result inTable 4 appears to reflect the fact that certain quite wealthy individuals are
13

focal in the information network. Once this fixed effect is taken out, thewealth difference is negatively related to the likelihood of a linkage.
The very strong positive effect of membership in the same matrilineagefor the likelihood of a credit link that we observed in Table 4 is not asapparent in Table 5. Instead, there is a much stronger effect of being amember of the same religion.
V Modeling Social Networks
The long term goal of this research program is an enriched understandingof individuals’ behavior in the context of multiple and overlapping socialnetworks and, in particular, to acknowledge the agency of the individualsembedded in social networks. The constituent links of the networks arechosen. They confer benefits, imply responsibility and require effort to cre-ate and maintain. The choice to invest in social connections within andacross conventional household boundaries is not so much a simple processof accumulation as of developing an appropriately complementary set of ties— ‘composition’ is Belinga and Guyer’s felicitous term (Belinga and Guyer1995). While the shape of the networks moulds the pattern of economicdevelopment, economic change alters the value of particular network linksand thus the shape of the networks themselves. Our goal is to understandthis dynamic of network formation.
The reduced form analyses of the previous section provide clues as to themotivations that might be driving individuals’ decisions as they compose aset of network connections. The results are consistent with the notion, forexample, that people are willing to pay a higher price for longer-distancecredit connections than they are for information connections. However,in the absence of a model that incorporates both individuals’ motivationsfor shaping the eventual structure of a particular social network and anappropriate equilibrium concept, these hints must remain just hints.
There is a large and useful literature that examines network efficiency,with the goal of characterizing the network configuration that maximizes avalue function (Bolton and Dewatripont 1994; Hendricks et al 1995; Econo-mides 1996). This is appropriate for a planner (such as a telecommuni-cations monopoly), but not for the decentralized process that governs theformation of social networks like those in the sample villages. Instead, wefocus on the incentives of the individuals who build the links of the net-work (Granovetter 1973, 1992; Coleman 1966; Fafchamps and Minten 1999;Fafchamps 1999).
14

Consider for now just two networks: the network for information andthat for credit/gift exchange. The links in these networks are bidirectional:if i and j converse about farming, then information flows in both directions.This is less obviously true of credit links, but to the extent that insurancemotivations are central to these transactions, a bidirectional characterizationis appropriate. Of course, this does not imply that the value of the link isidentical to i and j. Bala and Goyal (1999) model the situation in which ltijis costless to j, while in Jackson and Wolinsky (1996) both parties bear thecost and either can sever the link. It is not entirely clear what approximationis appropriate in these villages. In fact, costs are borne by both parities.But they are also asymmetric; the individual who approaches the other islikely to bear a larger proportion of the cost.
Let N = {1, 2, ...n} be the set of agents in the village. Agent i0s strategyis a vector li = {lIi,1, lIi,2, ...lIi,n, lCi,1, lCi,2, ...lCi,n} where lti,j = 1 if i forms a typet link with j. Let the payoff to i for a direct connection of type t to j beV tij . This represents the value to i of the information exchange or insurancecontract between i and j.5 V t
ij varies across ij pairs.The literature assumes exponential network decay (parameterized by δ),
so that an indirect connection between i and j provides less value than adirect connection. The appropriate model for network decay would likely bevery different depending upon the specific context and the type of network.Information, for example, might be garbled when transferred between peo-ple, in which case exponential decay could be a natural assumption. Thevalue of an indirect link in a financial network might be very different, how-ever, depending upon the nature of the bilateral exchanges. At one extreme,there might be no decay so that everyone in a connected network shares com-plete insurance. One intermediate case would involve a limited commitmentmodel, which might involve complete insurance for small shocks and incom-plete insurance for larger shocks (Ligon 1998). It is clear that even if thedecay in the value of indirect connections in a financial network can be ap-proximated by an exponential process, δ would vary according to the typeof network. We omit that notation for simplicity.
In a given network g, if the shortest path of type t between i and j isd, the value to i is V t
ijδd. The cost of forming links (lIij , l
Cij) is cij(l
Iij , l
Cij),
5Obviously, in general, V tij depends upon the entire network configuration. In virtually
any learning model, the value of an additional bit of information declines as the volume ofinformation increases. The situation is even more complex with respect to credit, in whichV Cij will depend upon the covariance of j
0s income with everyone else connected directlyor indirectly with i. We assume that these effects are small so that we can approximatethe value of the connection in this linear fashion.
15
where 0 < cij(0, 1), cij(1, 0) ≤ cij(1, 1) < cij(0, 1) + cij(1, 0). The value ofa network g in which N(i; g) is the set of individuals with direct or indirectconnections of any type to i in g is
Πi(g) =X
j∈N(i;g)
nV Iijδ
d(i,j;I,g) + V Cij δ
d(i,j;C,g) − cij(lIij , l
Cij)o
(6)
The obvious Nash equilibrium of this network formation game implies aseries of inequality constraints that must hold. Let g−ijt denote network gwithout a type t link between i and j, and g+ijt denote the same networkwith the addition of this link. If ltij = 1, then
Πi(g) > Πi(g−ijt)
Πj(g) > Πj(g−ijt),
while if ltij = 0 then obviously enough
Πi(g) < Πi(g−ijt)
Πj(g) < Πj(g−ijt).
Heterogeneity in the characteristics of individuals (and their deeper socialrelationships to one another) can be introduced. Let V t
ij = V t(xi, xj , εij)
and cij = c(lIij , lCij ; zi, zj , υij)
Bala and Goyal (1999) provide a characterization of the equilibria of arelated model. The network in a village will be connected, and in the sym-metric case (V t
ij = V t and cij = c(lIij , lCij)) there are many Nash equilibria.
This immediately raises very important questions about the feasibility ofestimation (Jovanovic 1989). The problem is less severe in our applica-tion: since V and c vary across pairs of individuals in our model, the setof equilibria is made smaller. Nevertheless, it should not be expected thatthere would be a unique Nash equilibrium of this game, which complicatesestimation of the parameters of V t
ij and cij (Tamer 1999).The most important intuition of this model for empirical work on network
formation is that the expected benefit to i of a link with j depends uponi’s opinion about the links that j has. Hence, i is more likely to pay thecost of linking to j if he thinks that j is linked to many people relevant toi. If j has characteristics (such as a common extended family or a commonchurch) which make it likely that he will have links with individuals whoseexperience is valuable to i (with people who have plots similar to i for aninformation link, for example), then i is more likely to pay for a link with j.The costs of a link between j and, say, k depend on the interaction between
16

aspects of their social backgrounds. Hence, i’s prediction of the networkresources available to j (and thus V t
ij) need not be collinear with the costsof forming the link with j.
This model can in principle be estimated. However, the obstacles to beovercome are daunting. The amount of independent information availableacross individuals within a given network is limited because of the interde-pendence of each individual’s actions. Data may be required on a largenumber of networks in order to distinguish the different equilibria that existin the different villages (Conley and Topa 2003). The need for a broadcross-section of data is in tension with the simultaneous need for rather in-tensive collection of data from each individual, as described below. Webelieve that the more promising direction is to study the dynamics of thenetworks directly, by observing changes in the composition of individuals’network ties. The problem then becomes one of understanding the changein li conditional on the current existence of a particular equilibrium networkg. It remains the case that plausible sources of exogenous variation in cijor V t
ij are required in order to interpret any observed changes in the set ofnetwork links in the village. However, this appears to be the most promisingstrategy and it has important implications for the design of data collection.
VI Lessons for future research
We have argued that patterns of economic change in rural Africa are be-ing shaped by the configurations of social networks in these communities.In turn, individuals’ incentives to make and break network connections areinfluenced by economic transformation. The process through which indi-viduals compose their various network connections, and the implications ofthese connections for economic and social activities is an important fron-tier for empirical research. The data that are generated by conventionalsurveys, however, are not well-suited for this task.
Equation 6 makes explicit the importance of a complete enumeration ofany given social network within a community. It is not possible to calculatethe value of the network — or of any of its constituent links — in its absence.Therefore, if an analysis of the dynamics of social networks is a goal ofthe research the basic strategy of ego-centric analysis based on a randomsample is not appropriate. If the village is sufficiently closed to make itthe relevant domain of the network, then a complete enumeration of thenetwork connections will be required to make progress on understandingthe determinants of network formation. This is a costly decision to make
17
in planning data collection, because for most other purposes a completeenumeration would not be the optimal sampling strategy.
Data on the creation and dissolution of network connections is particu-larly useful to overcome some of the central technical challenges of analyzingthe determinants of the shape of social networks. Therefore, collection ofpanel data might be an appropriate strategy. Alternatively, it might be pos-sible to collect retrospective data on the history of each individual’s links toother individuals in the community.
The potential usefulness of retrospective data on network links is limitedby the need for variation in the returns to or costs of links between individ-uals that are driving the changes in the composition of people’s networks.Data on network connections has to be integrated with more conventionalsocioeconomic data to begin to understand the implications of the networkfor behavior and outcomes, and thus to model the incentives individuals facefor link formation and dissolution. It is not generally possible to collect ret-rospectively such data.
It is clear that functional network connections, like the information,credit, labor and land interactions described in this chapter, are strongly in-fluenced by background variables like geography and family history. In addi-tion to these underlying social variables, any analysis of transitions requiresdata on exogenously changing factors that influence the costs or benefits ofconnections. For example, new market opportunities, new technologies, orchanges in the returns to different kinds of assets could provide sources ofvariation to provide insight into the creation or collapse of network links.
A key advantage of the Ghana dataset discussed in this chapter is the rel-ative precision with which it defines network connections. It is possible, forexample, to distinguish between social interactions that are focused on theexchange of farming information and those that are associated with creditor gift exchange. It is plausible that the incentives people face to developand maintain these different types of connection are different, and in fact wehave provided reduced form evidence that they shaped by different under-lying social connections between people. The weakness of data on realizedinteractions is that they do not necessarily reveal the potential utility of agiven network link.
18

References
Amanor, K.S. The New Frontier: Farmers’ Response to Land Degradation, A West AfricanStudy. London: Zed Books, 1994.
Anderson, C.; Wasserman, S.; and Couch, B. “A p* Primer: Logit Models for Social Networks.”Social Networks 21 (1999): 37-66.
Bala, V., and Goyal, S. “A Non-Cooperative Theory of Network Formation.” Econometrica 68,5 (September 2000): 1181-1229.
Bassett, T., and Crummey, D. Land in African Agrarian Systems. Madison: University ofWisconsin Press, 1993.
Berry, S.S. Chiefs Know their Boundaries: Essays on Property, Power and the Past in Asante,1896-1996. Portsmouth: Heinemann, 2001.
Bolton, P., and Dewatripont, M. “The Firm as a Communication Network.” Quarterly Journalof Economics 109, 8 (1994): 809-840.
Chamberlain, G. “An Analysis of Covariance with Qualitative Data.” Review of EconomicStudies 47 (1980): 225-238.
Coleman, J. Medical Innovation: A Diffusion Study. New York: Bobbs-Merrill, 1966.
Conley, T., and Topa, G. “Estimating Dynamic Local Interactions Models.” Manuscript. Chicago, IL: University of Chicago; New York, N.Y.: New York University, 2003.
Conley, T., and Udry, C. “Social Learning Through Networks: The Adoption of NewAgricultural Technologies in Ghana.” American Journal of Agricultural Economics 83, 3(2001): 668-73.
Conley, T., and Udry, C. “Learning About a New Technology: Pineapple in Ghana.” Manuscript. Chicago, IL: University of Chicago; New Haven, CT: Yale University, 2003.
Economides, N. “The Economics of Networks.” International Journal of IndustrialOrganization 14, 6 (1996): 673-99.
Fafchamps, M. “Ethnicity and Credit in African Manufacturing.” Manuscript. Oxford, UK:Oxford University, 1999.
Fafchamps, M., and Minten, B. “Relationships and Traders in Madagascar.” Journal ofDevelopment Studies 35, 6 (1999): 1-35.
Faust, K.; Entwisle, B.; Rindfuss, R.; Walsh, S.; Sawangdee, Y. “Spatial Arrangement of Socialand Economic Networks in Nang Rong District, Thailand.” Social Networks 21, 2

(1999): 311-337.
Goldstein, M. “Chop Time, No Friends: Intrahousehold and Individual Insurance Mechanismsin Southern Ghana.” Manuscript. London, UK: London School of Economics, 2002.
Goldstein, M., and Udry, C. “Agricultural Innovation and Resource Management in Ghana.”Manuscript. London, UK: London School of Economics; New Haven, CT: YaleUniversity, 1999a.
Goldstein, M., and Udry, C. “Gender and Land Resource Management in Southern Ghana.”Manuscript. London, UK: London School of Economics; New Haven, CT: YaleUniversity, 1999b.
Goldstein, M., and Udry, C. “Gender, Power and Agricultural Investment in Ghana.”Manuscript. London, UK: London School of Economics; New Haven, CT: YaleUniversity, 2004.
Granovetter, M. “Strength of Weak Ties.” American Journal of Sociology 78, 6 (1973): 1360-1380.
_____. “Economic Institutions as Social Constructions–A Framework for Analysis.” ActaSociologica 35, 1 (1992): 3-11.
Guyer, J., and Belinga, S.L.E. “Wealth in People as Wealth in Knowledge: Accumulation andComposition in Equatorial Africa.” Journal of African History 36 (1995): 91-120.
Gyasi, E.A.; Agyepong, G.T.; Ardayfio-Schandorf, E.; Enu-Kwesi, L.; Nabila, J.S.; and Owusu-Bennoah, E. “Environmental Endangerment in the Forest-Savanna Zone of SouthernGhana.” Technical report. Tokyo, Japan: United Nations University, 1994.
Hawthorne, W.D., and Abu-Juam, M. Forest Protection in Ghana With Particular Reference toVegetation and Plant Species. Cambridge, UK: IUCN/ODA/Forest Department Republicof Ghana, 1995.
Hendricks, K.; Piccione, M..; and Tan, G. “The Economics of Hubs: The Monopoly Case.”Review of Economic Studies 62, 1 (1995): 83-101.
Hill, P. Migrant Cocoa Farmers of Southern Ghana. Cambridge, UK: Cambridge UniversityPress, 1963.
Jackson, M.O., and Wolinsky, A. “A Strategic Model of Social and Economic Networks.”Journal of Economic Theory 71, 1 (1996): 44-74.
Jovanovic, B. “Observable Implications of Models with Multiple Equilibria.” Econometrica 57,6 (1989): 1431-37.

Klingelhofer, A. “Agriculture.” In Brokensha, D., editor, Akwapim Handbook. Accra, Ghana:Ghana Publishing Corporation, 1972.
Ligon, E. “Risk Sharing and Information in Village Economics.” Review of Economic Studies65, 4 (1998): 847-64.
Tamer, E. “Incomplete Simultaneous Discrete Response Model with Multiple Equilibria.”Review of Economic Studies 70, 1 (1999): 147-167.
Wasserman, S.; and Faust, K. Social Network Analysis: Methods and Applications. Cambridge:Cambridge University Press, 1994.

Table 1: Incidence of Network ConnectionsFraction of Pairs of Respondents within Villages with Network Connections
1 2 3 4 5
Information Links Credit/Gift Links Land Links Labor LinksVillage
Population
Overall 0.015 0.013 0.005 0.006By Village:
1 0.013 0.011 0.002 0.008 12502 0.016 0.015 0.004 0.001 20003 0.018 0.012 0.010 0.009 4504 0.013 0.013 0.004 0.003 1000

Table 2: Incidence of Network ConnectionsFraction of Pairs of Respondents within Villages with Network ConnectionsConditional on the Existence of Alternative Links
Credit LinkInformation Link no yes
no n 47860 274A (row pct) 99.43 0.57
yes n 406 338(row pct) 54.57 45.43Pearson chi2(1) = 1.2e+04 Pr = 0.000
Land LinkInformation Link no yes
no n 48034 100B (row pct) 99.79 0.21
yes n 602 142(row pct) 80.91 19.09Pearson chi2(1) = 5.3e+03 Pr = 0.000
Labor LinkInformation Link no yes
no n 48042 92C (row pct) 99.81 0.19
yes n 556 188(row pct) 74.73 25.27Pearson chi2(1) = 8.1e+03 Pr = 0.000
Land LinkCredit Link no yes
no n 48134 132D (row pct) 99.73 0.27
yes n 502 110(row pct) 82.03 17.97Pearson chi2(1) = 3.8e+03 Pr = 0.000
Labor LinkCredit Link no yes
no n 48176 90E (row pct) 99.81 0.19
yes n 422 190(row pct) 68.95 31.05Pearson chi2(1) = 1.0e+04 Pr = 0.000
Land LinkLabor Link no yes
no n 48444 154F (row pct) 99.68 0.32
yes n 192 88(row pct) 68.57 31.43Pearson chi2(1) = 5.5e+03 Pr = 0.000

Table 3: Summary Statistics of Link Characteristics
Variable mean std
At least one of pair holds office 0.22 0.41
Same religion 0.23 0.42
Same matrilineage 0.22 0.42
Same gender 0.52 0.50
Same soil type 0.32 0.47
Absolute value of age difference 10.61 11.61
Absolute value of wealth difference 0.75 1.29
Distance between plots (km) 1.27 0.78
Both members of 1st generation in village 0.05 0.21
Families trace origin to same region 0.55 0.50

Table 4: Predicting Network LinksLogit Regressions -- Dependent Variable = 1 if Link Exists
1 2
odds z odds z odds z odds z odds zAt least one of pair holds office 1.17 1.26 0.85 -0.78 1.46 1.92 2.30 4.09 2.17 2.62Same religion 1.06 0.46 1.78 2.92 0.74 -1.19 0.74 -1.19 1.47 1.37Same matrilineage 1.43 2.93 2.17 3.86 1.36 1.44 1.47 1.85 2.08 2.65Same gender 7.29 11.57 3.95 5.75 2.54 4.42 3.41 5.56 3.89 4.41Same soil type 3.09 8.44 1.36 1.55 5.40 6.75 3.39 3.70Absolute value of age difference 1.00 -0.79 1.02 3.43 1.04 7.34 1.04 5.81 1.02 1.86Absolute value of wealth difference 1.23 8.66 0.96 -0.62 1.29 5.22 1.29 6.05 1.08 1.25Distance between plots (km) 0.56 -5.63 0.79 -1.68 0.30 -4.64 0.57 -1.90Both members of 1st generation in village 0.37 -2.37 1.04 0.10 *** **** *** **** 0.78 -0.33Families trace origin to same region 1.09 0.65 2.20 3.22 1.26 1.01 1.31 1.21 1.26 0.75
Predicted probability of link mean std mean std mean std mean std mean stdif link=1 0.027 0.026 0.005 0.003 0.022 0.033 0.01 0.005 0.006 0.006if link=1 & less than 5 years 0.014 0.014 0.005 0.004 0.004 0.007 0.003 0.003 0.002 0.002
standard errors heteroskedasticity consistent n = 40960
***Both families migrants perfectly predicts no land link
Information Links Credit/Gift Links Land Links Labor Links3 43B
Land Links

Table 5: Predicting Network Links, with 2-way fixed effectsLogit Regressions -- Dependent Variable = 1 if Link Exists
1 2
odds z odds z odds z odds z odds zSame religion 1.38 2.09 2.78 3.67 1.33 0.84 1.22 0.69 2.78 2.59Same matrilineage 2.10 4.65 1.55 1.34 0.26 -2.60 0.34 -2.31 2.97 2.46Same gender 6.02 9.15 4.01 5.05 1.89 1.99 1.80 1.89 2.01 1.44Same soiltype 2.14 3.23 2.23 1.76 11.69 3.33 0.29 -1.35Absolute value of age difference 1.00 -0.19 1.00 -0.34 1.09 4.02 1.07 3.92 1.06 2.02Absolute value of wealth difference 0.87 -1.90 0.93 -0.26 1.19 1.03 1.19 1.16 1.43 1.07Distance between plots (km) 0.35 -9.25 0.55 -3.02 0.13 -8.34 0.31 -4.06Both members of 1st generation in village 2.66 1.73 0.53 -1.12 *** *** *** *** 1.75 0.28Families trace origin to same region 1.98 3.22 1.38 0.63 2.49 1.51 1.09 0.18 9.73 2.82
number of individuals droppednumber of observations dropped
standard errors heteroskedasticity consistent n = 40960
***Both families migrants perfectly predicts no land link
358
35786
335
33463
335
33463
247
24696
338
33711
3 4Information Links Credit/Gift Links Land Links Labor Links
3BLand Links

−1.5 −1 −0.5 0 0.5 1 1.5 2−1.5
−1
−0.5
0
0.5
1
1.5Information Village 1
−1.5 −1 −0.5 0 0.5 1 1.5 2−1.5
−1
−0.5
0
0.5
1
1.5Credit Village 1
−22.5 −22 −21.5 −21 −20.5 −20 −19.5 −19−7
−6.5
−6
−5.5
−5
−4.5
−4Labor Market Village 1
−22.5 −22 −21.5 −21 −20.5 −20 −19.5 −19−7
−6.5
−6
−5.5
−5
−4.5
−4Land Transactions Village 1

17 18 19 20 21 22 23−3
−2
−1
0
1
2
3Information Village 2
17 18 19 20 21 22 23−3
−2
−1
0
1
2
3Credit Village 2
−4 −3 −2 −1 0 1 2−8
−7
−6
−5
−4
−3
−2Labor Market Village 2
−4 −3 −2 −1 0 1 2−8
−7
−6
−5
−4
−3
−2Land Transactions Village 2
−2 −1 0 1 2 32.5
3
3.5
4
4.5
5
5.5
6
6.5Information Village 3
−2 −1 0 1 2 32.5
3
3.5
4
4.5
5
5.5
6
6.5Credit Village 3
−5 −4 −3 −2 −1 03.5
4
4.5
5
5.5
6
6.5
7
7.5Labor Market Village 3
−5 −4 −3 −2 −1 03.5
4
4.5
5
5.5
6
6.5
7
7.5Land Transactions Village 3

1.5 2 2.5 3 3.5 4 4.5−3.5
−3
−2.5
−2
−1.5
−1
−0.5
0Information Village 4
1.5 2 2.5 3 3.5 4 4.5−3.5
−3
−2.5
−2
−1.5
−1
−0.5
0Credit Village 4

−1.5 −1 −0.5 0 0.5 1 1.5−2.5
−2
−1.5
−1
−0.5
0
0.5
1Labor Market Village 4
−1.5 −1 −0.5 0 0.5 1 1.5−2.5
−2
−1.5
−1
−0.5
0
0.5
1Land Transactions Village 4