Embed Size (px)
Citation preview

Appendix A A-1
COMMON AVIATION ACRONYMS
AC Advisory Circular ADA Americans with Disabilities Act ADAP Airport Development Aid Program ADF Automatic Direction Finder ADG Airplane Design Group ADO Airport District Office ADT Average Daily Traffic AFD Airport/Facility Directory AFSS Automated Flight Service Station AGL Above Ground Level AIP Airport Improvement Program ALP Airport Layout Plan ALS Approach Light System AMSL Above Mean Sea Level AOA Airport Operations Area APL Aircraft Parking Line Limit ARC Airport Reference Code ARFF Aircraft Rescue and Fire Fighting
Facilities ARP Airport Reference Point ARPT Airport ARTCC Air Route Traffic Control Center ARTS Automated Radar Terminal System ASA Atlantic Southeast Airways ASL Above Sea Level ASM Available Seat Miles ASOS Automated Surface Observation System ASR Airport Surveillance Radar AST Above Ground Storage Tank ASTM American Society for Testing and
Materials ASV Annual Service Volume ATC Air Traffic Control ATCT Air Traffic Control Tower ATIS Automatic Terminal Information Service ATM Available Tonnage Mile AVGAS Aviation Gasoline AWOS Automated Weather Observing System BRL Building Restriction Line CAD Computer Aided Design CAT I-III Category I, II, III ILS Approach CIP Capital Improvements Program
CRJ Canadair Regional Jet CTAF Common Traffic Advisory Frequency DA Decision Altitude DH Decision Height DME Distance Measuring Equipment DNL Day-Night Sound Level DOT Department of Transportation EA Environmental Assessment EIS Environmental Impact Statement EPA Environmental Protection Agency ERG Effective Runway Gradient ERJ Embraer Regional Jet FAA Federal Aviation Administration FAAP Federal Aid Airport Program FAR Federal Aviation Regulation FBO Fixed Base Operator FCT Federal Contract Tower FEMA Federal Emergency Management Agency FOD Foreign Object Debris FONSI Finding of No Significant Impact FSS Flight Service Station FTZ Foreign Trade Zone GA General Aviation GADO General Aviation District Office GAMA General Aviation Manufacturers
Association GAO General Accounting Office GPS Global Positioning Satellites GS Glide Slope HIRL High Intensity Runway Lights HITL High Intensity Taxiway Lights HIWAS Hazardous In-flight Weather Advisory
Service IAP Instrument Approach Procedure ICAO International Civil Aviation Organization IFR Instrument Flight Rules ILS Instrument Landing System IM Inner Marker IMC Instrument Meteorological Conditions
Appendix A A-2
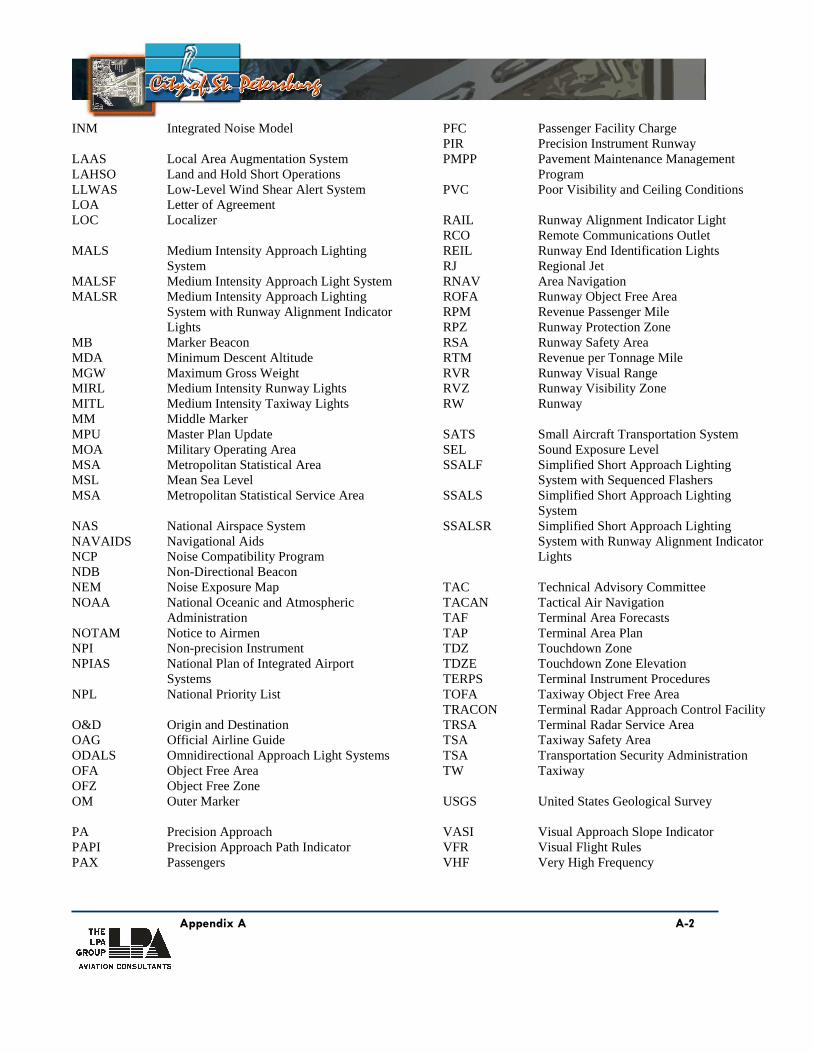
INM Integrated Noise Model LAAS Local Area Augmentation System LAHSO Land and Hold Short Operations LLWAS Low-Level Wind Shear Alert System LOA Letter of Agreement LOC Localizer MALS Medium Intensity Approach Lighting
System MALSF Medium Intensity Approach Light System MALSR Medium Intensity Approach Lighting
System with Runway Alignment Indicator Lights
MB Marker Beacon MDA Minimum Descent Altitude MGW Maximum Gross Weight MIRL Medium Intensity Runway Lights MITL Medium Intensity Taxiway Lights MM Middle Marker MPU Master Plan Update MOA Military Operating Area MSA Metropolitan Statistical Area MSL Mean Sea Level MSA Metropolitan Statistical Service Area NAS National Airspace System NAVAIDS Navigational Aids NCP Noise Compatibility Program NDB Non-Directional Beacon NEM Noise Exposure Map NOAA National Oceanic and Atmospheric
Administration NOTAM Notice to Airmen NPI Non-precision Instrument NPIAS National Plan of Integrated Airport
Systems NPL National Priority List O&D Origin and Destination OAG Official Airline Guide ODALS Omnidirectional Approach Light Systems OFA Object Free Area OFZ Object Free Zone OM Outer Marker PA Precision Approach PAPI Precision Approach Path Indicator PAX Passengers
PFC Passenger Facility Charge PIR Precision Instrument Runway PMPP Pavement Maintenance Management
Program PVC Poor Visibility and Ceiling Conditions RAIL Runway Alignment Indicator Light RCO Remote Communications Outlet REIL Runway End Identification Lights RJ Regional Jet RNAV Area Navigation ROFA Runway Object Free Area RPM Revenue Passenger Mile RPZ Runway Protection Zone RSA Runway Safety Area RTM Revenue per Tonnage Mile RVR Runway Visual Range RVZ Runway Visibility Zone RW Runway SATS Small Aircraft Transportation System SEL Sound Exposure Level SSALF Simplified Short Approach Lighting
System with Sequenced Flashers SSALS Simplified Short Approach Lighting
System SSALSR Simplified Short Approach Lighting
System with Runway Alignment Indicator Lights
TAC Technical Advisory Committee TACAN Tactical Air Navigation TAF Terminal Area Forecasts TAP Terminal Area Plan TDZ Touchdown Zone TDZE Touchdown Zone Elevation TERPS Terminal Instrument Procedures TOFA Taxiway Object Free Area TRACON Terminal Radar Approach Control Facility TRSA Terminal Radar Service Area TSA Taxiway Safety Area TSA Transportation Security Administration TW Taxiway USGS United States Geological Survey VASI Visual Approach Slope Indicator VFR Visual Flight Rules VHF Very High Frequency

Appendix A A-3
VMC Visual Meteorological Conditions VOR VHF Omni-Directional Radar Beacon VORDME VHF Omni-Directional Radar Beacon
with Distance Measuring Equipment VORTAC VHF Omni-directional Range Beacon
with Tactical Aircraft Approach and Navigation
WAAS Wide Area Augmentation System

Appendix B – Aviation Activity Forecasts B-1
Master Plan Update Albert Whitted Airport
AAAppppppeeennndddiiixxx BBB AAAvvviiiaaattt iiiooonnn AAAcccttt iiivvviii tttyyy FFFooorrreeecccaaassstttsss TABLE B-1 HISTORIC AIRPORT OPERATIONS 1995-2004
Calendar Year
Air Taxi Operations GA Military Total
Percent Change in
Total Operations
1995 4,640 112,054 1,460 118,154 1996 2,252 83,059 457 85,768 -27.41% 1997 2,569 80,169 437 83,175 -3.02% 1998 3,074 78,232 426 81,732 -1.73% 1999 2,934 87,864 1,016 91,814 12.34% 2000 3,707 95,545 1,156 100,408 9.36% 2001 4,051 87,815 1,481 93,347 -7.03% 2002 3,999 94,575 3,664 102,238 9.52% 2003 3,872 94,175 5,993 104,040 1.76% 2004 3,876 95,220 7,187 106,283 2.16%
AAGR (%) 1995-2004 -1.98% -1.79% 19.37% -1.17%
AAGR (%) 2000-2004 1.12% -0.09% 57.91% -1.43%
Source: Albert Whitted Airport Management and FAA ATCT, 2005

Appendix B – Aviation Activity Forecasts B-2
Master Plan Update Albert Whitted Airport
FIGURE B-1 HISTORIC AIRPORT OPERATIONS
0
20,000
40,000
60,000
80,000
100,000
120,000
1995
1996
1997
1998
1999
2000
2001
2002
2003
2004
Year
Ope
ratio
ns Air Taxi Operations
GA
Military
TABLE B-2 HISTORIC GA OPERATIONS 1995-2004
Calendar Year Itinerant GA Local GA Total GA
Percent Change in Total GA Operations
1995 43,401 68,653 112,054 1996 38,463 44,596 83,059 -25.88% 1997 36,541 43,628 80,169 -3.48% 1998 37,818 40,414 78,232 -2.42% 1999 37,399 50,465 87,864 12.31% 2000 40,978 54,567 95,545 8.74% 2001 38,446 49,369 87,815 -8.09% 2002 39,718 54,857 94,575 7.70% 2003 42,755 51,420 94,175 -0.42% 2004 43,230 51,990 95,220 1.11%
AAGR (%) 1995-2004 -0.04% -3.04% -1.79%
AAGR (%) 2000-2004 1.35% -1.20% -0.09%
Source: Airport Management and FAA ATCT Records, 2005

Appendix B – Aviation Activity Forecasts B-3
Master Plan Update Albert Whitted Airport
Figure B-2 Historic GA Operations
1995-2004
0
20,000
40,000
60,000
80,000
100,000
120,000
1995
1996
1997
1998
1999
2000
2001
2002
2003
2004
Year
Gen
eral
Avi
atio
n O
pera
tions
Itinerant GA Local GA Total GA
Table B-3 Historic Military Operations 1995-2004
Calendar Year Itinerant Local Total
Percent Change in Total Military
Operations 1995 426 1034 1,460 1996 153 304 457 -68.70% 1997 240 197 437 -4.38% 1998 234 192 426 -2.52% 1999 558 458 1,016 138.50% 2000 635 521 1,156 13.78% 2001 814 667 1,481 28.11% 2002 2,014 1,650 3,664 147.40% 2003 3,294 2,699 5,993 63.56% 2004 3,953 3,234 7,187 19.92%
AAGR (%) 1995-2004 28.09% 13.51% 19.37%
AAGR (%) 2000-2004 57.93% 57.88% 57.91%
Source: Airport Management and FAA ATCT Records, 2005

Appendix B – Aviation Activity Forecasts B-4
Master Plan Update Albert Whitted Airport
Figure B-3 Historic Military Traffic (1995-2004)
01,0002,0003,0004,0005,0006,0007,0008,000
1995
1996
1997
1998
1999
2000
2001
2002
2003
2004
Year
Mili
tary
Ope
ratio
ns
Itinerant
Local
Total
Table B-4 Historic Annual Instrument Operations (1995-2004)
Calendar Years Total Operations Instrument Operatio ns Percent Change in
Instrument Operations 1995 118,154 4,135 1996 85,768 2,916 -29.48% 1997 83,175 2,828 -3.02% 1998 81,732 2,779 -1.73% 1999 91,814 3,122 12.34% 2000 100,408 3,470 11.16% 2001 93,347 3,226 -7.03% 2002 102,238 3,533 9.52% 2003 104,040 3,595 1.76% 2004 106,283 3,724 3.58%
AAGR (%) 1995-2004 -1.17% -1.16% AAGR (%) 2000-2004 -1.43% 1.78%
Source: Airport Management and FAA ATCT Records, 2005

Appendix B – Aviation Activity Forecasts B-5
Master Plan Update Albert Whitted Airport
Figure B-4Annual Instrument Operations (1995-2004)
020,00040,00060,00080,000
100,000120,000140,000
1995
1996
1997
1998
1999
2000
2001
2002
2003
2004
Year
Inst
rum
ent O
pera
tions
Instrument Operations
Total Operations
Table B-5 Historic Based Aircraft Fleet Mix (1005-2004)
Fiscal Year Single Engine Multi-Engine Jet Helicopter
Total Based Aircraft
Percent Change in Fleet Mix
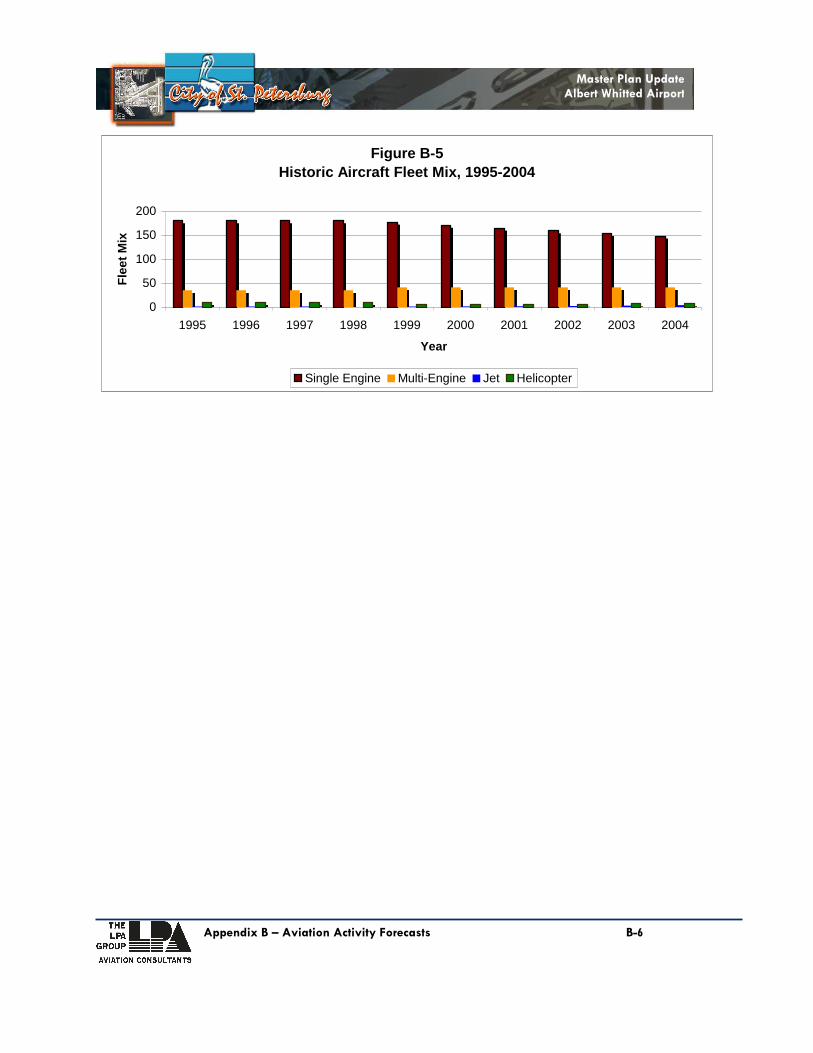
1995 180 35 1 10 226 1996 180 35 1 10 226 0.00% 1997 180 35 1 10 225 -0.44% 1998 180 35 0 10 225 0.00% 1999 177 41 1 5 224 -0.44% 2000 171 41 1 5 219 -2.24% 2001 165 41 2 6 214 -2.24% 2002 159 41 2 6 209 -2.24% 2003 153 41 3 7 205 -2.24% 2004 148 41 4 7 200 -2.24%
2004 Percent Mix 74.00% 20.50% 2.00% 3.50% 100.00%
AAGR (%) 1995-2004 -2.15% 1.77% 16.65% -3.89% -1.35% AAGR (%) 2000-2004 -3.52% 0.00% 31.95% 6.96% -2.24%
Source: Airport Management and FAA ATCT Records, 2005
Appendix B – Aviation Activity Forecasts B-6
Master Plan Update Albert Whitted Airport
Figure B-5 Historic Aircraft Fleet Mix, 1995-2004
0
50
100
150
200
1995 1996 1997 1998 1999 2000 2001 2002 2003 2004
Year
Fle
et M
ix
Single Engine Multi-Engine Jet Helicopter

Appendix B – Aviation Activity Forecasts B-7
Master Plan Update Albert Whitted Airport
Table B-6 Air Taxi Operations Forecast (2005-2024)
Calendar Year FAA TAF Forecast
Historical Trend (Linear
Projection)
Market Share of US Air Taxi
Ops (TAF)
Market Share of Florida Air
Taxi Ops (TAF)
Composite Forecast
Preferred Forecast
Historic 1995 5,111 4,640 4,640 4,640 4,640 4,640 1996 2,369 2,252 2,252 2,252 2,252 2,252 1997 2,671 2,569 2,569 2,569 2,569 2,569 1998 2,641 3,074 3,074 3,074 3,074 3,074 1999 3,250 2,934 2,934 2,934 2,934 2,934 2000 3,420 3,707 3,707 3,707 3,707 3,707 2001 3,981 4,051 4,051 4,051 4,051 4,051 2002 3,988 3,999 3,999 3,999 3,999 3,999 2003 3,865 3,872 3,872 3,872 3,872 3,872 2004 3,915 3,876 3,876 3,876 3,876 3,876
Projected 2005 3,915 4,008 4,010 4,170 4,026 4,026 2006 3,915 4,101 4,097 4,252 4,091 4,091 2007 3,915 4,194 4,170 4,323 4,150 4,150 2008 3,915 4,287 4,241 4,396 4,210 4,210 2009 3,915 4,379 4,312 4,470 4,269 4,269 2010 3,915 4,472 4,383 4,547 4,329 4,329 2011 3,915 4,565 4,453 4,615 4,387 4,387 2012 3,915 4,658 4,523 4,684 4,445 4,445 2013 3,915 4,751 4,595 4,755 4,504 4,504 2014 3,915 4,844 4,667 4,828 4,563 4,563 2015 3,915 4,936 4,740 4,902 4,623 4,623 2016 3,915 5,029 4,816 4,977 4,684 4,684 2017 3,915 5,122 4,892 5,055 4,746 4,746 2018 3,915 5,215 4,970 5,133 4,808 4,808 2019 3,915 5,308 5,049 5,214 4,871 4,871 2020 3,915 5,401 5,129 5,296 4,935 4,935 2021 3,915 5,493 5,228 5,359 4,999 4,999 2022 3,915 5,586 5,329 5,424 5,064 5,064 2023 3,915 5,679 5,432 5,489 5,129 5,129 2024 3,915 5,772 5,537 5,555 5,195 5,195
AAG (%) 2004-2024 0.00% 1.68% 1.47% 1.52% 1.19% 1.19%
Note: Due to rounding or undisclosed editing, numbers may not sum up Source: Column 1 FAA TAF, 2004
Column 2 FAA ATCT, 2005, SPG Airport Records, 2005 Column 3 FAA TAF, 2004 Column 4 FAA TAF, 2004 Column 5 LPA Analysis, 2005 (Forecast average of Columns 1-4) Column 6 LPA Analysis, 2005 (Column 5)

Appendix B – Aviation Activity Forecasts B-8
Master Plan Update Albert Whitted Airport
Figure B-6Air Taxi Operations Forecast
0
1,000
2,000
3,000
4,000
5,000
6,000
7,000
1995
1997
1999
2001
2003
2005
2007
2009
2011
2013
2015
2017
2019
2021
2023
Year
Air
Tax
i Ope
ratio
ns
FAA TAF Forecast Historical Trend (Linear Projection)
Market Share of US Air Taxi Ops (TAF) Market Share of Florida Air Taxi Ops (TAF)
Composite Forecast Preferred Forecast

Appendix B – Aviation Activity Forecasts B-9
Master Plan Update Albert Whitted Airport
Table B-7 Military Operations Forecast (2005-2024)
Calendar Year
FAA TAF
Forecast
Previous 5-Yr
Historic Trend using
Airport Data
Assumed DOD
budget growth
Market Share of US Military Ops
(TAF)
Market Share of Florida Military
Ops (TAF) Composite Forecast
Preferred Forecast
1995 1433 1460 1,460 1,460 1,460 1,460 1,460 1996 619 457 457 457 457 457 457 1997 417 437 437 437 437 437 437 1998 407 426 426 426 426 426 426 1999 762 1,016 1,016 1,016 1,016 1,016 1016 2000 1,181 1,156 1,156 1,156 1,156 1,156 1156 2001 1,404 1,481 1,481 1,481 1,481 1,481 1481 2002 3,199 3,664 3,664 3,664 3,664 3,664 3664 2003 4,199 5,993 5,993 5,993 5,993 5,634 5,993 2004 3,493 7,187 7,187 7,187 7,187 6,448 7,187
Projected 2005 3493 7,667 7,384 7,190 7,192 6,585 7,387 2006 3493 8,836 7,589 7,191 7,197 6,861 7,589 2007 3493 10,006 7,799 7,191 7,203 7,138 7,799 2008 3493 11,175 8,014 7,192 7,208 7,416 8,014 2009 3493 12,345 8,235 7,193 7,213 7,696 8,235 2010 3493 13,514 8,462 7,194 7,219 7,977 8,462 2011 3493 14,684 8,696 7,195 7,224 8,258 8,696 2012 3493 15,853 8,936 7,196 7,229 8,541 8,936 2013 3493 17,023 9,183 7,197 7,234 8,826 9,183 2014 3493 18,192 9,436 7,198 7,240 9,112 9,436 2015 3493 19,362 9,696 7,199 7,245 9,399 9,696 2016 3493 20,531 9,964 7,200 7,250 9,688 9,964 2017 3493 21,700 10,239 7,201 7,256 9,978 10,239 2018 3493 22,870 10,522 7,202 7,261 10,270 10,522 2019 3493 24,039 10,812 7,203 7,266 10,563 10,812 2020 3493 25,209 11,110 7,204 7,271 10,857 11,110 2021 3493 26,378 11,417 7,211 7,281 11,156 11,417 2022 3493 27,548 11,732 7,217 7,290 11,456 11,732 2023 3493 28,717 12,056 7,223 7,300 11,758 12,056 2024 3493 29,887 12,389 7,230 7,309 12,061 12,389
AAG (%) 2004-2024 0.00% 7.39% 2.76% 0.03% 0.08% 3.18% 2.76%

Appendix B – Aviation Activity Forecasts B-10
Master Plan Update Albert Whitted Airport
Figure B-7 Military Operations Forecast
0
5000
10000
15000
20000
25000
30000
35000
1995
1997
1999
2001
2003
2005
2007
2009
2011
2013
2015
2017
2019
2021
2023
Year
Mili
tary
Ope
ratio
ns
FAA TAF Forecast Previous 5-Yr Historic Trend using Airport Data
Assumed DOD budget growth Market Share of US Military Ops (TAF)
Market Share of Florida Military Ops (TAF) Composite Forecast
Preferred Forecast

Appendix B – Aviation Activity Forecasts B-11
Master Plan Update Albert Whitted Airport
Table B-8 Local vs Itinerant Military Operations (2005-2024) Calendar Year Itinerant Local Total Military
Historic 1995 426 1,034 1,460 1996 153 304 457 1997 240 197 437 1998 234 192 426 1999 558 458 1,016 2000 635 521 1,156 2001 814 667 1,481 2002 2,014 1,650 3,664 2003 3,294 2,699 5,993 2004 3,953 3,234 7,187
Projected 2009 4,529 3,706 8,234 2014 5,190 4,246 9,436 2019 5,947 4,865 10,812 2024 6,814 5,575 12,389
Percentage 2004 55.0% 45.0%
Figure B-8 Local Vs. Itinerant Military Operations
02,0004,0006,0008,000
10,00012,00014,000
1995
1997
1999
2001
2003
2005
2007
2009
2011
2013
2015
2017
2019
2021
2023
Years
Mili
tary
Ope
ratio
ns
Itinerant
Local
TotalMilitary

Appendix B – Aviation Activity Forecasts B-12
Master Plan Update Albert Whitted Airport
Table B-9 GA Operational Forecast
Year TAF FASP Regression Historic Linear
Market Share (of West Central Florida)
% of WCF Composite Preferred
1995 115,406 121,950 112,054 112,054 112,054 15% 112,054 112,0541996 87,350 90,338 83,059 83,059 83,059 11% 83,059 83,0591997 84,563 87,651 80,169 80,169 80,169 10% 80,169 80,1691998 72,670 89,589 78,232 78,232 78,232 10% 78,232 78,2321999 87,636 81,732 87,864 87,864 87,864 11% 87,864 87,8642000 93,084 98,828 95,545 95,545 95,545 12% 95,545 95,5452001 90,709 98,828 87,815 87,815 87,815 10% 87,815 87,8152002 92,188 95,304 94,575 94,575 94,575 11% 94,575 94,5752003 89,635 96,019 94,175 94,175 94,175 10% 94,175 94,1752004 89,796 96,739 95,220 95,220 95,220 10% 95,220 95,2202005 90,855 97,464 92,361 96,860 97,479 95,004 96,1792006 91,912 98,195 92,370 98,529 100,770 96,355 97,1482007 92,898 98,932 92,379 100,226 105,823 98,052 98,1272008 93,894 99,674 92,387 101,953 111,128 99,807 99,1152009 94,901 100,421 92,396 103,709 116,700 101,625 100,1142010 95,918 101,175 92,405 105,496 122,551 103,509 101,1222011 96,947 101,933 92,414 107,313 127,403 105,202 102,1412012 97,987 102,698 92,423 109,162 132,446 106,943 103,1702013 99,037 103,468 92,431 111,042 137,690 108,734 104,2092014 100,099 104,244 92,440 112,955 143,141 110,576 105,2592015 101,173 105,026 92,449 114,901 148,807 112,471 106,3202016 102,258 105,814 92,458 116,880 154,698 114,422 107,3912017 103,355 106,607 92,467 118,893 160,822 116,429 108,4732018 104,463 107,407 92,475 120,942 167,189 118,495 109,5652019 105,583 108,212 92,484 123,025 173,808 120,622 110,6692020 106,716 109,024 92,493 125,144 180,688 122,813 111,7842021 107,460 109,842 92,502 127,300 187,841 124,989 112,9102022 108,210 110,665 92,511 129,493 195,278 127,231 114,0482023 108,966 111,495 92,520 131,724 203,008 129,543 115,1962024 109,729 112,331 92,528 133,993 211,045 131,925 116,357
AARG % 1.007% 0.750% -0.143% 1.723% 4.060% 1.644% 1.007%

Appendix B – Aviation Activity Forecasts B-13
Master Plan Update Albert Whitted Airport
Figure B-9GA Operations Forecast
0
50,000
100,000
150,000
200,000
250,000
1995
1997
1999
2001
2003
2005
2007
2009
2011
2013
2015
2017
2019
2021
2023
Years
Ope
ratio
ns
TAF FASPRegression Historic LinearMarket Share (of West Central Florida) CompositePreferred

Appendix B – Aviation Activity Forecasts B-14
Master Plan Update Albert Whitted Airport
Table B-10 Operational Fleet Mix Forecast (2004-2024)
Year Single Engine %
Multi Engine % Jet % Rotor % Other % Total
Historic 1995 94,523 80.00% 11,162 9.45% 10 0.01% 11,815 10.54% 0 0.00% 118,154 1996 67,757 79.00% 9,145 10.66% 10 0.01% 8,577 10.33% 0 0.00% 85,768 1997 64,877 78.00% 9,659 11.61% 10 0.01% 8,318 10.37% 0 0.00% 83,175 1998 62,934 77.00% 10,260 12.55% 0 0.00% 8,173 10.45% 0 0.00% 81,732 1999 68,861 75.00% 13,772 15.00% 0 0.00% 9,181 10.45% 0 0.00% 91,814 2000 75,306 75.00% 14,003 13.95% 20 0.02% 10,543 11.03% 0 0.00% 100,408 2001 70,010 75.00% 12,892 13.81% 26 0.03% 9,801 11.16% 0 0.00% 93,347 2002 76,679 75.00% 14,790 14.47% 34 0.03% 10,735 10.50% 0 0.00% 102,238 2003 72,180 74.00% 15,073 15.45% 45 0.05% 10,242 10.50% 0 0.00% 104,040 2004 69,399 74.00% 14,466 15.43% 60 0.06% 9,847 10.50% 10 0.01% 106,283
Projected 2005 78,802 73.24% 15,917 14.79% 88 0.08% 10,598 9.85% 17 0.02% 107,590 2006 78,894 72.49% 15,442 14.19% 115 0.11% 10,056 9.24% 25 0.02% 108,829 2007 78,982 71.75% 14,980 13.61% 149 0.14% 9,542 8.67% 37 0.03% 110,076 2008 79,071 71.02% 14,533 13.05% 194 0.17% 9,054 8.13% 54 0.05% 111,339 2009 79,161 70.29% 14,098 12.52% 252 0.22% 8,591 7.63% 80 0.07% 112,618 2010 79,253 69.57% 13,678 12.01% 328 0.29% 8,152 7.16% 117 0.10% 113,914 2011 79,344 68.86% 13,269 11.52% 426 0.37% 7,736 6.71% 173 0.15% 115,224 2012 79,437 68.16% 12,873 11.04% 553 0.47% 7,341 6.30% 256 0.22% 116,551 2013 79,531 67.46% 12,489 10.59% 719 0.61% 6,966 5.91% 378 0.32% 117,896 2014 79,627 66.77% 12,117 10.16% 934 0.78% 6,610 5.54% 558 0.47% 119,259 2015 79,725 66.09% 11,756 9.74% 1,214 1.01% 6,273 5.20% 824 0.68% 120,639 2016 79,825 65.41% 11,406 9.35% 1,578 1.29% 5,953 4.88% 1,217 1.00% 122,039 2017 79,927 64.74% 11,066 8.96% 2,050 1.66% 5,649 4.58% 1,797 1.46% 123,458 2018 80,030 64.08% 10,738 8.60% 2,664 2.13% 5,362 4.29% 2,654 2.12% 124,895 2019 80,136 63.42% 10,419 8.25% 3,463 2.74% 5,088 4.03% 3,919 3.10% 126,353 2020 80,243 62.77% 10,109 7.91% 4,501 3.52% 4,829 3.78% 5,787 4.53% 127,830 2021 80,352 62.13% 9,809 7.59% 5,849 4.52% 4,583 3.54% 8,545 6.61% 129,326 2022 80,463 61.50% 9,519 7.27% 7,603 5.81% 4,350 3.32% 12,620 9.64% 130,843 2023 80,576 60.87% 9,237 6.98% 9,882 7.46% 4,129 3.12% 18,637 14.08% 132,381 2024 80,691 60.24% 8,963 6.69% 12,884 9.59% 3,919 2.93% 27,523 20.55% 133,941
FAA Aerospace Breakdown 0.26% -0.49% 3.45% 0.63% 4.57% Note: Other includes experimental aircraft, sport a ircraft, gliders and any other aircraft that doesn’ t fit into the other four categories Source: FAA Aerospace Forecast, 2004-2016 and THE LPA GROUP INCORPORATED

Appendix B – Aviation Activity Forecasts B-15
Master Plan Update Albert Whitted Airport
Figure B-10 Operational Fleet Mix Forecast
010,00020,00030,00040,00050,00060,00070,00080,00090,000
100,000
1995
1998
2001
2004
2007
2010
2013
2016
2019
2022
Years
Ope
ratio
ns Single-EngineMulti-EngineTurbineRotorcraftOther

Appendix B – Aviation Activity Forecasts B-16
Master Plan Update Albert Whitted Airport
Table B-11 Local Vs. Itinerant Operations (2005-2024) Itinerant Operations Total Local Operations Total Total Year Air Taxi GA Military Itinerant GA Military Loc al Operations
1995 4,640 43,401 426 48,467 68,653 1,034 69,687 118,1541996 2,252 38,463 153 40,868 44,596 304 44,900 85,7681997 2,569 36,541 240 39,350 43,628 197 43,825 83,1751998 3,074 37,818 234 41,126 40,414 192 40,606 81,7321999 2,934 37,399 558 40,891 50,465 458 50,923 91,8142000 3,707 40,978 635 45,320 54,567 521 55,088 100,4082001 4,051 38,446 814 43,311 49,369 667 50,036 93,3472002 3,999 39,718 2,014 45,731 54,857 1,650 56,507 102,2382003 3,872 42,755 3,294 49,922 51,420 2,699 54,118 104,0402004 3,876 43,230 3,953 51,059 51,990 3,234 55,224 106,2832005 4,026 43,665 4,062 51,753 52,514 3,323 55,837 107,5902006 4,091 44,105 4,174 52,371 53,043 3,415 56,458 108,8292007 4,150 44,550 4,289 52,989 53,577 3,509 57,087 110,0762008 4,210 44,998 4,408 53,616 54,117 3,606 57,723 111,3392009 4,269 45,452 4,529 54,250 54,662 3,706 58,368 112,6182010 4,329 45,910 4,654 54,893 55,213 3,808 59,021 113,9142011 4,387 46,372 4,783 55,542 55,769 3,913 59,682 115,2242012 4,445 46,839 4,915 56,199 56,331 4,021 60,352 116,5512013 4,504 47,311 5,050 56,865 56,898 4,132 61,031 117,8962014 4,563 47,788 5,190 57,541 57,472 4,246 61,718 119,2592015 4,623 48,269 5,333 58,226 58,051 4,363 62,414 120,6392016 4,684 48,755 5,480 58,920 58,635 4,484 63,119 122,0392017 4,746 49,247 5,631 59,624 59,226 4,608 63,834 123,4582018 4,808 49,743 5,787 60,338 59,823 4,735 64,557 124,8952019 4,871 50,244 5,947 61,062 60,425 4,865 65,291 126,3532020 4,935 50,750 6,111 61,796 61,034 5,000 66,034 127,8302021 4,999 51,261 6,279 62,539 61,649 5,138 66,787 129,3262022 5,064 51,778 6,453 63,294 62,270 5,280 67,549 130,8432023 5,129 52,299 6,631 64,059 62,897 5,425 68,323 132,3812024 5,195 52,826 6,814 64,835 63,531 5,575 69,106 133,941
AARG % 1.47% 1.01% 2.76% 1.20% 1.01% 2.76% 1.13% 1.16%
Appendix B – Aviation Activity Forecasts B-17
Master Plan Update Albert Whitted Airport
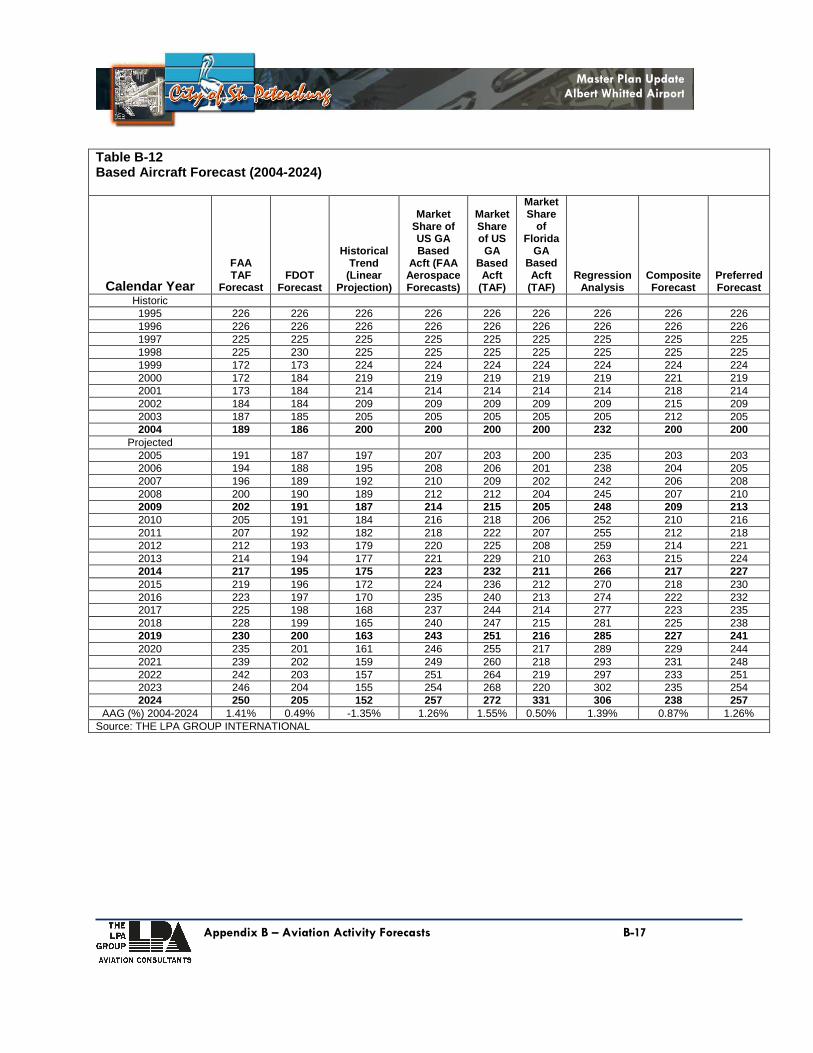
Table B-12 Based Aircraft Forecast (2004-2024)
Calendar Year
FAA TAF
Forecast FDOT
Forecast
Historical Trend
(Linear Projection)
Market Share of US GA Based
Acft (FAA Aerospace Forecasts)
Market Share of US
GA Based Acft
(TAF)
Market Share
of Florida
GA Based Acft
(TAF) Regression
Analysis Composite Forecast
Preferred Forecast
Historic 1995 226 226 226 226 226 226 226 226 226 1996 226 226 226 226 226 226 226 226 226 1997 225 225 225 225 225 225 225 225 225 1998 225 230 225 225 225 225 225 225 225 1999 172 173 224 224 224 224 224 224 224 2000 172 184 219 219 219 219 219 221 219 2001 173 184 214 214 214 214 214 218 214 2002 184 184 209 209 209 209 209 215 209 2003 187 185 205 205 205 205 205 212 205 2004 189 186 200 200 200 200 232 200 200
Projected 2005 191 187 197 207 203 200 235 203 203 2006 194 188 195 208 206 201 238 204 205 2007 196 189 192 210 209 202 242 206 208 2008 200 190 189 212 212 204 245 207 210 2009 202 191 187 214 215 205 248 209 213 2010 205 191 184 216 218 206 252 210 216 2011 207 192 182 218 222 207 255 212 218 2012 212 193 179 220 225 208 259 214 221 2013 214 194 177 221 229 210 263 215 224 2014 217 195 175 223 232 211 266 217 227 2015 219 196 172 224 236 212 270 218 230 2016 223 197 170 235 240 213 274 222 232 2017 225 198 168 237 244 214 277 223 235 2018 228 199 165 240 247 215 281 225 238 2019 230 200 163 243 251 216 285 227 241 2020 235 201 161 246 255 217 289 229 244 2021 239 202 159 249 260 218 293 231 248 2022 242 203 157 251 264 219 297 233 251 2023 246 204 155 254 268 220 302 235 254 2024 250 205 152 257 272 331 306 238 257
AAG (%) 2004-2024 1.41% 0.49% -1.35% 1.26% 1.55% 0.50% 1.39% 0.87% 1.26% Source: THE LPA GROUP INTERNATIONAL

Appendix B – Aviation Activity Forecasts B-18
Master Plan Update Albert Whitted Airport
Exhibit B-12Based Aircraft Forecasts
0
50
100
150
200
250
300
350
1995
1996
1997
1998
1999
2000
2001
2002
2003
2004
2005
2006
2007
2008
2009
2010
2011
2012
2013
2014
2015
2016
2017
2018
2019
2020
2021
2022
2023
2024
Year
Bas
ed A
ircra
ft
FAA TAF Forecast
FDOT Forecast
Historical Trend (Linear Projection)
Market Share of US GA Based Acft (FAA Aerospace Forecasts)
Market Share of FASP Statewide
Market Share of FASP W. Central Florida
Regression Analysis
Composite Forecast
Preferred Forecast

Appendix B – Aviation Activity Forecasts B-19
Master Plan Update Albert Whitted Airport
Table B-13 Based Aircraft Fleet Mix Forecast (2004-2024)
Calendar Year Single Engine Percentage
Multi Engine Percentage Jet Percentage Helicopter Percentage Total
Historic 1995 180 80% 35 15% 1 0% 10 4% 226 1996 180 80% 35 15% 1 0% 10 4% 226 1997 180 80% 35 16% 1 0% 10 4% 225 1998 180 80% 35 16% 0 0% 10 4% 225 1999 177 79% 41 18% 1 0% 5 2% 224 2000 171 78% 41 19% 1 1% 5 2% 219 2001 165 77% 41 19% 2 1% 6 3% 214 2002 159 76% 41 20% 2 1% 6 3% 209 2003 153 75% 41 20% 3 1% 7 3% 205 2004 148 74% 41 21% 4 2% 7 4% 200
Projected 2004 Estimated
Fleet Mix 74.00% 20.50% 2.00% 3.50% 100.00% 2005 150 74% 43 21% 4 2% 6 3% 203 2006 152 74% 43 21% 4 2% 6 3% 205 2007 154 74% 43 21% 4 2% 6 3% 208 2008 156 74% 44 21% 5 2% 6 3% 210 2009 158 74% 45 21% 5 2% 6 3% 213 2010 160 74% 45 21% 5 2% 6 3% 216 2011 162 74% 46 21% 5 2% 7 3% 218 2012 164 74% 46 21% 5 2% 7 3% 221 2013 166 74% 45 20% 6 3% 7 3% 224 2014 168 74% 44 20% 6 3% 7 3% 227 2015 170 74% 46 20% 6 3% 7 3% 230 2016 172 74% 46 20% 6 3% 7 3% 232 2017 174 74% 47 20% 7 3% 7 3% 235 2018 176 74% 48 20% 7 3% 7 3% 238 2019 179 74% 48 20% 7 3% 7 3% 241 2020 181 74% 49 20% 7 3% 7 3% 244 2021 183 74% 50 20% 8 3% 7 3% 248 2022 185 74% 50 20% 8 3% 8 3% 251 2023 188 74% 51 20% 8 3% 8 3% 254 2024 190 74% 51 20% 9 3% 8 3% 257
2024 Estimated Fleet Mix 77.59% 5.57% 3.45% 0.63%
Source: FAA Aerospace Forecasts, 2004-2015 and THE LPA GROUP INCORPORATED

Appendix B – Aviation Activity Forecasts B-20
Master Plan Update Albert Whitted Airport
Figure B-13 Based Aircraft Fleet Mix
0
20
40
60
80
100
120
140
160
180
200
1995
1998
2001
2004
2006
2009
2012
2015
2018
2021
2024
Years
Bas
ed A
ircra
ft Single Engine
Multi Engine
Turbine
Rotorcraft
Appendix B – Aviation Activity Forecasts B-21
Master Plan Update Albert Whitted Airport
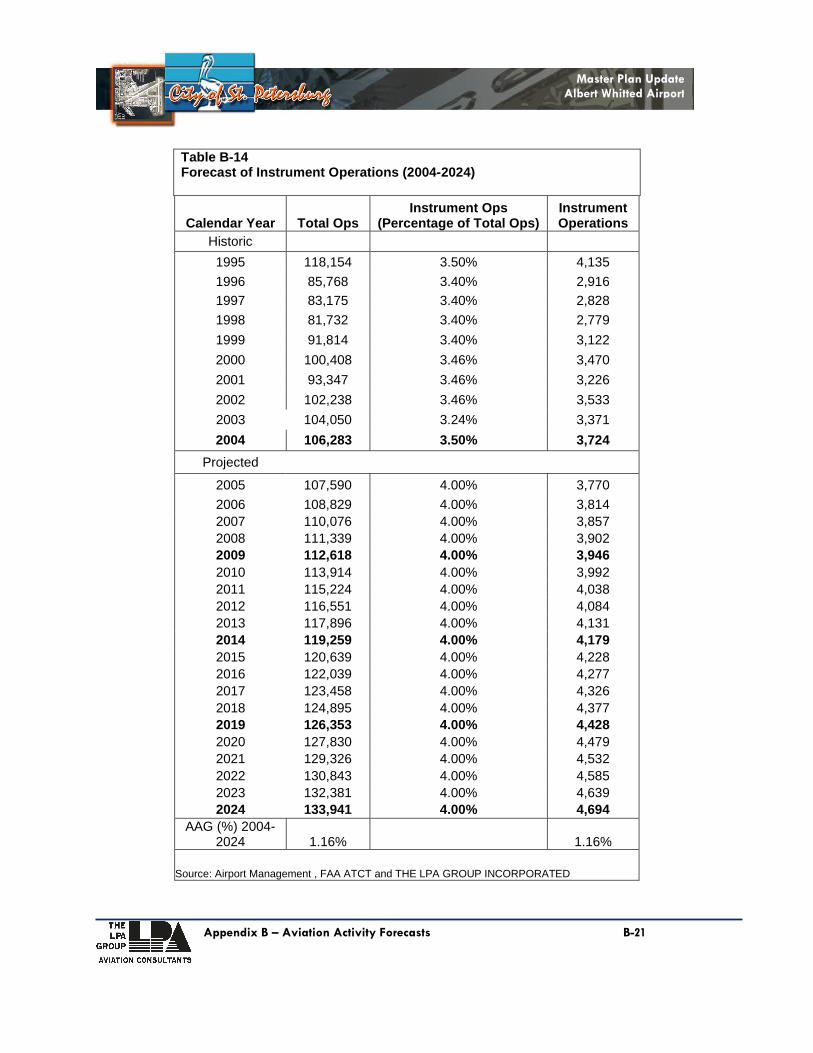
Table B-14 Forecast of Instrument Operations (2004-2024)
Calendar Year Total Ops Instrument Ops
(Percentage of Total Ops) Instrument Operations
Historic
1995 118,154 3.50% 4,135
1996 85,768 3.40% 2,916 1997 83,175 3.40% 2,828
1998 81,732 3.40% 2,779
1999 91,814 3.40% 3,122
2000 100,408 3.46% 3,470
2001 93,347 3.46% 3,226
2002 102,238 3.46% 3,533
2003 104,050 3.24% 3,371
2004 106,283 3.50% 3,724
Projected
2005 107,590 4.00% 3,770
2006 108,829 4.00% 3,814 2007 110,076 4.00% 3,857 2008 111,339 4.00% 3,902 2009 112,618 4.00% 3,946 2010 113,914 4.00% 3,992 2011 115,224 4.00% 4,038 2012 116,551 4.00% 4,084 2013 117,896 4.00% 4,131 2014 119,259 4.00% 4,179 2015 120,639 4.00% 4,228 2016 122,039 4.00% 4,277 2017 123,458 4.00% 4,326 2018 124,895 4.00% 4,377 2019 126,353 4.00% 4,428 2020 127,830 4.00% 4,479 2021 129,326 4.00% 4,532 2022 130,843 4.00% 4,585 2023 132,381 4.00% 4,639 2024 133,941 4.00% 4,694
AAG (%) 2004-2024 1.16% 1.16%
Source: Airport Management , FAA ATCT and THE LPA GROUP INCORPORATED
Appendix B – Aviation Activity Forecasts B-22
Master Plan Update Albert Whitted Airport
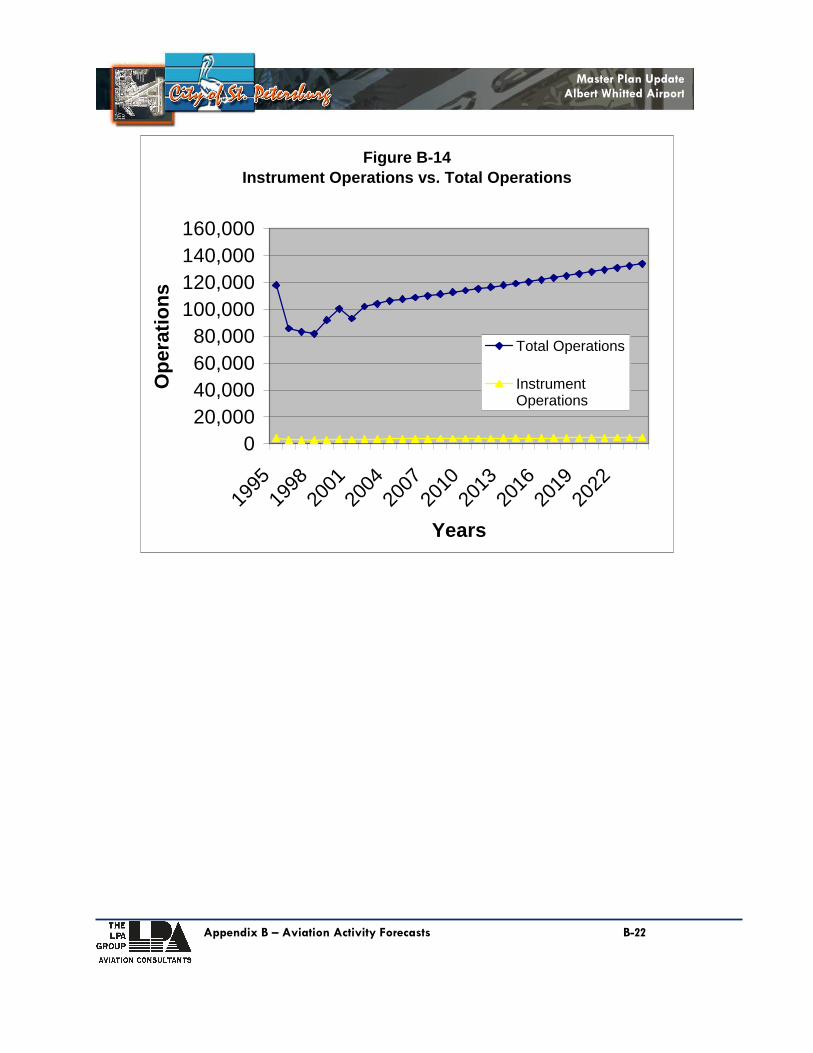
Figure B-14 Instrument Operations vs. Total Operations
020,00040,00060,00080,000
100,000120,000140,000160,000
1995
1998
2001
2004
2007
2010
2013
2016
2019
2022
Years
Ope
ratio
ns
Total Operations
InstrumentOperations

Appendix B – Aviation Activity Forecasts B-23
Master Plan Update Albert Whitted Airport
Table B-15 Peak Hour Operations (2004-2024)
Calendar Year
Total GA Ops
Peak Month/GA
Ops Peak
Month
Average Day/Peak
Month Average
Day
Peak Hour/Average
Day Peak Hour
Historic 1995 118,154 11.00% 12,997 3.29% 427 -- -- 1996 85,768 11.00% 9,434 3.29% 310 -- -- 1997 83,175 10.96% 9,120 3.29% 300 -- -- 1998 81,732 9.16% 7,485 3.29% 246 -- -- 1999 91,814 10.85% 9,959 3.28% 327 -- -- 2000 100,408 9.67% 9,705 3.29% 319 -- -- 2001 93,347 9.63% 8,989 3.28% 295 -- -- 2002 102,238 8.93% 9,131 3.29% 300 9.96% 30 2003 104.040 9.90% 10,305 3.29% 339 9.96% 34 2004 106,283 9.90% 10,527 3.28% 346 9.96% 34
Projected 35 2005 107,590 9.90% 10,657 3.29% 350 9.96% 35 2006 108,829 9.90% 10,779 3.29% 354 9.96% 36 2007 110,076 9.90% 10,903 3.28% 358 9.96% 36 2008 111,339 9.90% 11,028 3.28% 363 9.96% 37 2009 112,618 9.90% 11,155 3.29% 367 9.96% 37 2010 113,914 9.90% 11,283 3.29% 371 9.96% 37 2011 115,224 9.90% 11,413 3.29% 375 9.96% 38 2012 116,551 9.90% 11,544 3.28% 379 9.96% 38 2013 117,896 9.90% 11,677 3.29% 384 9.96% 39 2014 119,259 9.90% 11,812 3.29% 388 9.96% 39 2015 120,639 9.90% 11,949 3.28% 393 9.96% 40 2016 122,039 9.90% 12,088 3.29% 397 9.96% 40 2017 123,458 9.90% 12,228 3.29% 402 9.96% 41 2018 124,895 9.90% 12,371 3.28% 407 9.96% 41 2019 126,353 9.90% 12,515 3.29% 411 9.96% 41 2020 127,830 9.90% 12,661 3.29% 416 9.96% 42 2021 129,326 9.90% 12,809 3.29% 421 9.96% 42 2022 130,843 9.90% 12,960 3.28% 426 9.96% 43 2023 132,381 9.90% 13,112 3.29% 431 9.96% 43 2024 133,941 9.90% 13,266 3.29% 436 9.96% 30
AAG (%) 2004-2024 0.98% 1.16% 1.16% 1.16%
Source: Airport Management , FAA ATCT and THE LPA GROUP INCORPORATED

Appendix B – Aviation Activity Forecasts B-24
Master Plan Update Albert Whitted Airport
Table B-16 Comparison Between TAF and Airport Forecasts (2004- 2024)
Year Airport Forecast TAF (% Difference) Total Operations
Base yr. 2004 106,283 97,204 9.34% Base yr. + 5yrs. 2009 112,618 102,309 10.08% Base yr. + 10yrs. 2014 119,259 107,507 10.93% Base yr. + 15yrs. 2019 126,353 112,991 11.83% Base yr. + 20yrs. 2024 133,941 117,730 13.77%
AAGR (%) 2004-2024 1.16% 0.96% Source: FAA TAF 2004 and THE LPA GROUP, 2005

Appendix B – Aviation Activity Forecasts B-25
Master Plan Update Albert Whitted Airport
Table B-17 Airport Planning Forecasts Forecast Levels and Growth Rates (2004-2024)
Base Year: 2004 Average Annual Compound Growth
Base Yr. Level
Base Yr. + 1yr.
Base Yr. + 5yrs.
Base Yr. + 10yrs.
Base Yr. + 15yrs.
Base Yr. + 20yrs.
Base yr. to
+1
Base yr. to
+5
Base yr. to +10
Base yr. to +15
Base yr. to +20
2004 2005 2009 2014 2019 2024 2004 2005 2009 2014 2019
Operations Itinerant:
Air Carrier 0 0 0 0 0 0 0.00% 0.00% 0.00% 0.00% 0.00% Air Taxi 3,876 4,026 4,269 4,563 4,871 5,195 3.86% 1.62% 1.50% 1.44% 1.40% General
Aviation 43,230 43,665 45,452 47,788 50,244 52,826 1.01% 0.84% 0.92% 0.94% 0.96% Military 3,953 4,062 4,529 5,190 5,947 6,814 2.76% 2.29% 2.51% 2.59% 2.63%
Total Itinerant Operations 51,059 51,753 54,250 57,541 61,062 64,835 1.36% 1.02% 1.09% 1.12% 1.14%
Local:
General Aviation 51,990 52,514 54,662 57,472 60,425 63,531 1.01% 0.84% 0.92% 0.94% 0.96%
Military 3,234 3,323 3,706 4,246 4,865 5,575 2.76% 2.29% 2.51% 2.59% 2.63% Total Local
Operations 55,224 55,837 58,368 61,718 65,291 69,106 1.11% 0.93% 1.02% 1.05% 1.07% TOTAL
OPERATIONS 106,283 107,590 112,618 119,259 126,353 133,941 1.23% 1.16% 1.16% 1.16% 1.11% Instrument Operations 3,724 3,770 3,946 4,179 4,428 4,694 1.24% 0.97% 1.05% 1.09% 1.11% Peak Hour Operations 34 35 37 39 41 43 1.16% 0.99% 1.05% 1.08% 1.11% Cargo/Mail (Exported and Imported Tons) 0 0 0 0 0 0 0.00% 0.00% 0.00% 0.00% 0.00%
Based Aircraft Single Engine* 148 150 158 168 179 190 1.26% 1.05% 1.15% 1.18% 1.20% Multi Engine 41 43 45 45 48 51 3.73% 1.46% 0.92% 1.03% 1.08% Jet 4 4 5 6 7 9 4.07% 3.38% 3.69% 3.81% 3.87% Helicopter 7 6 6 7 7 8 -13.20% -1.51% -0.26% 0.21% 0.46% Other 0 0 0 0 0 0
TOTAL 200 203 213 227 241 257 1.26% 1.05% 1.15% 1.18% 1.20% GA Operations Per Based Aircraft (OPBA) 531 531 529 526 523 521 -0.03% -.08% -0.09% -.09% -0.09% Source: FAA ATCT, Airport Management and THE LPA GROUP INCORPORATED *Note: Single-Engine Based Aircraft includes the new sport aircraft and experimental aircraft

U.S. Department of Transportation
Federal Aviation Administration
ORLANDO AIRPORTS DISTRICT OFFICE 5950 Hazeltine National Dr., Suite 400
Orlando, Florida 32822-5024 Phone: (407) 812-6331 Fax: (407) 812-6978
May 31, 2005 Mr. Richard Lesniak Airport Manager Albert Whitted Airport 107 8th Avenue S.E. St. Petersburg, Florida 33701-3961 Dear Mr. Lesniak: RE: Albert Whitted Airport (SPG); St. Petersburg, Florida AIP No. 3-12-0074-012-2004 Master Plan Update Approval of Terminal Area Forecasts (TAF) The Federal Aviation Administration (FAA) has reviewed the Terminal Area Forecast (TAF) portion of your Airport Master Plan, which was submitted by your consultant, The LPA Group Incorporated, on April 15, 2005. The content of your Airport Master Plan reflects the view of your consultant and the City of St. Petersburg, which is responsible for the accuracy of the data presented. They do not necessarily reflect the official views or policy of the FAA. The FAA will accept your Airport Master Plan TAF for the purpose of completing the Master Plan study. It is understood that FAA’s future decision regarding funding of future airfield development will be based on the FAA’s review and determination of the demand and the need for the development at that time. Please let me know if you have any questions. Sincerely, Vernon P. Rupinta Program Manager Enclosure cc: Tricia Fantinato, The LPA Group Inc. (Tampa) ORL-ADO:[Originator]:[Typist]:[Date]:spg01205_taf-approval.doc

2
[Filing Location]

DRAFT
Regional Guidance Letter Airports Division, Southern Region
Number: RGL 01-2 Line of Business: Airport Planning Date: August , 2001 Subject: Runway Length and Strength Requirements for Business Jet Aircraft ______________________________________________________________________________ Purpose: This Regional Guidance Letter supplements RGL 00-1, Standard Development for “Business Jet” Aircraft, and Advisory Circular (AC) 150/5325-4A, Runway Length Requirements for Airport Design, and provides additional guidance for determining the appropriate runway length and strength for airports expected to serve business jet aircraft. Background: There has been a rapid increase in the business jet aircraft fleet over the past few years. Many new models and several new manufacturers have been introduced into the marketplace. There has also been a general increase in the size of business jet aircraft. As a result, AC 150/5325-4A, and therefore the runway length portion of the Airport Design for Microcomputers program which is based on this AC, is out of date with regard to business jet aircraft. Most of the business jets listed in the AC are now obsolete. While the AC or the microcomputer program should still be used as a general guide in determining the appropriate runway length for airports serving business jet aircraft, additional guidance is needed to ensure the runway length is adequate for the specific makes and models of business jets expected to use the airport on a regular basis. The FAA’s Central Region Airports Division reviewed the performance characteristics of 64 different makes and models of business jet aircraft, 57 of which are listed in the attached table (ref: Table 1. Business Jet Statistics). There was not enough information available to determine the performance characteristics of the remaining models. An analysis of the information in Table 1 revealed the following: Category B Business Jets: 23 of the models studied have approach speeds of 91 knots or more, but less than 121 knots. All of these jets have a wingspan of less than 79 feet, thus fall in Airplane Design Groups I or II. About 5,500 of these jets have been manufactured to date. These aircraft typically weigh between 10,000 and 45,000 pounds, with most weighing less than 30,000 pounds. The takeoff distance required at sea level, standard temperature, and maximum takeoff weight is between 3,200 and 5,500 feet. The landing distance required in dry conditions at sea level, standard temperature, and maximum landing weight ranges from 2,500 to 5,900 feet. Category C Business Jets: 28 of the models studied have approach speeds of 121 knots or more, but less than 141 knots. All but one of these jets have wingspans of less than 79 feet, thus fall in Airplane Design Groups I or II. One jet has a wingspan of 94 feet, thus falls in Airplane Design
RGL 01-2 July 27, 2001
2
Group III. There have been about 5,400 of these jets manufactured to date. Most of them weigh between 13,000 and 45,000 pounds. The takeoff distance required at sea level, standard temperature, and maximum takeoff weight is between 3,200 and 5,700 feet. The landing distance required in dry conditions at sea level, standard temperature, and maximum landing weight ranges from 2,400 to 5,900 feet. Category D Business Jets: Only 4 of the models studied have approach speeds greater than 141 knots. One of them has a wingspan less than 49 feet, thus falls in Airplane Design Group I. Two of them have wingspans greater than 49 feet, but less than 79 feet, thus fall in Airplane Design Group II. One of them has a wingspan greater than 79 feet, but less than 118 feet, thus falls in Airplane Design Group III. There have been about 1,100 of these jets manufactured to date. Three of these aircraft weigh between 60,000 and 95,000 pounds. The fourth weighs 23,500 pounds. The takeoff distance required at sea level, standard temperature, and maximum takeoff weight is between 5,500 and 6,000 feet. The landing distance required in dry conditions at sea level, standard temperature, and maximum landing weight ranges from 3,000 to 3,500 feet. Guidance: Determinations of Required Runway Length for Business Jets: ADO Program Managers should determine the required runway length based on AC 5325-4A or the Airport Design for Microcomputers program. However, this should be supplemented by checking the runway length required for the specific makes and models of business jet aircraft expected to use the airport on a regular basis (regular basis being defined as at least 250 annual takeoff operations). The runway length required for specific business jets may be determined by adjusting the takeoff and landing runway lengths listed in Table 1 for altitude, temperature, maximum difference in runway centerline elevations, i.e., effective gradient (takeoff length only), and wet runway conditions (landing length only). Note that takeoff and landing lengths for some of the aircraft were not available in the data used to compile the table and must be obtained from the manufacturer. The attached spreadsheets (ref: Takeoff Runway Length Adjustment.xls and Landing Runway Length Adjustment.xls) are available electronically in the Airports Reference System to aid Program Managers in making the runway length adjustment calculations. Program Managers may enter the values for takeoff and landing runway length from Table 1, airport elevation, mean maximum daily temperature, and difference between the high and low points of the runway (takeoff runway length only), and have the spreadsheets calculate the adjusted takeoff and landing runway lengths required. The greater of the adjusted takeoff or landing lengths is the recommended runway length for airport design. Note that the takeoff runway lengths in the table are based on the aircraft operating at maximum takeoff weight, i.e., 100 percent useful load. In determining the adjusted takeoff runway length, consideration should be given to the stage length (non-stop haul distance) of the aircraft using the airport on a regular basis. This affects the fuel load to be carried, thus the weight of the aircraft. It may not be appropriate to assume that the aircraft operates at the maximum takeoff weight, i.e., 100 percent useful load. Therefore, the calculated takeoff runway length may be longer than actually required. The use of judgment is necessary in such cases.

RGL 01-2 July 27, 2001
3
The longer of the adjusted runway length calculated for the specific critical business jet aircraft or the runway length obtained from the AC or microcomputer program should be used as the required runway length. Determinations of Required Runway Strength for Business Jets: ADO Program Managers should determine the required runway strength for the specific critical business jet aircraft expected to use the airport on a regular basis (regular basis defined as at least 250 annual takeoff operations). The required strength may be determined based on the maximum takeoff weight listed in Table 1. In general, runways should have a dual wheel pavement strength of 30,000 pounds if they accommodate only category B business jets, 60,000 pounds if they accommodate category B and C business jets, and 90,000 pounds if they accommodate category B, C, and D business jets. However, these are broad generalizations and some category B business jets have a maximum takeoff weight of more than 30,000 pounds. Likewise, some category C business jets have a maximum takeoff weight of more than 60,000 pounds. Therefore, in practice, the pavement strength required for the specific critical aircraft should be used. Point of Contact: Troy Butler, ASO-610B, (404) 305-6722 Robert B. Chapman Acting Manager, Airports Division

RGL 01-2 July 27, 2001
4
Table 1. Business Jet Statistics BUISNESS JETS
1.3 X STALL
WING
MAX
T.O.
LAND.
SPEED SPAN T.O. DIST. DIST. # MFG. ARC KNOTS FEET LBS. ISO ISO AEROSPATIALE SN-601 CORVETTE 40 B-I 118 42.2 14550 NA NA BEECHJET 400A/T/ T-1A JAYHAWK 581 C-I 121 43.5 16100 4169 2960 BOMBARDIER CL-600 CHALLENGER 85 C-II 125 61.8 41250 5700 2775 BOMBARDIER CL-601 CHALLENGER 66 C-II 125 61.8 41250 5700 2775 BOMBARDIER CL-601-3A/3R CHALLENGER
194 C-II 125 61.8 41250 5700 2775
BOMBARDIER CL-604 CHALLENGER 180 C-II 125 61.8 47600 5700 2775 BOMBARDIER BD-700 GLOBAL EXPRESS
85 C-III 126 94 96000 6300 2700
CESSNA 500 CITATION 418 B-I 108 47.1 11850 2930 2270 CESSNA 501 CITATION I/SP 325 B-I 112 46.8 10600 2830 2350 CESSNA 525 CITATIONJET (CJ-1) 430 B-I 107 46.7 10400 3080 2750 CESSNA 525A CITATIONJET II (CJ-2) 30 B-II 118 49.5 12500 3420 2980 CESSNA 550 CITATION II 733 B-II 108 51.7 13300 2990 2270 CESSNA 550 CITATION BRAVO 161 B-II 112 52.2 14800 3600 3180 CESSNA 551 CITATION II/SP 94 B-II 108 51.8 12500 2650 2210 CESSNA 552/T-47A 15 B-II 107 52.2 16300 3180 2800 CESSNA S550 CITATION S/II 162 B-II NA 52.2 15900 NA NA CESSNA 560 CITATION V Ultra 538 B-II 108 52.2 16300 3180 NA CESSNA 560 CITATION ENCORE 25 B-II 108 52.2 16830 3560 2865 CESSNA 560 CITATION EXCEL 160 B-II 107 55.7 20000 3590 3180 CESSNA 650 CITATION III/VI 241 C-II 131 53.3 21000 5150 2900 CESSNA 650 CITATION VII 119 C-II 126 53.6 23000 4850 3220 CESSNA 750 CITATION X 160 C-II 131 63.6 36100 5140 3410 DASSAULT FALCON 10 226 B-I 104 42.9 18740 NA NA DASSAULT FALCON 20 515 B-II 107 53.5 28660 NA NA DASSAULT FALCON 2000 140 B-II 114 63.5 35800 5240 5220 DASSAULT FALCON 50 310 B-II 113 61.9 37480 4715 4875 DASSAULT FALCON 900 190 B-II 100 63.4 45500 4680 5880 DASSAULT FALCON 900 EX 85 C-II 126 63.5 48300 4985 5880 GULFSTREAM II 258 D-II 141 68.8 65300 NA NA GULFSTREAM III 199 C-II 136 77.8 68700 NA NA GULFSTREAM IV 469 D-II 149 77.8 71780 5450 3190 GULFSTREAM V 160 D-III NA 98.6 89000 5990 2950 HAWKER-SIDDELEY 125-400 291 C-I 124 47 23300 NA NA HAWKER-SIDDELEY 125-600 71 C-I 125 47 25000 NA NA BAE 125-700 212 C-I 125 47 24200 NA NA RAYTHEON/HAWKER 125-800 533 B-I 120 51.3 28000 5380 4500 RAYTHEON/HAWKER 125-1000 HORIZON
50 C-II 130 61.9 36000 5250 2340
Continued on next page…

RGL 01-2 July 27, 2001
5
BUISNESS JETS
1.3 X STALL
WING
MAX
T.O.
LAND.
SPEED SPAN T.O. DIST. DIST. # MFG. ARC KNOTS FEET LBS. ISO ISO ISRAEL AIRCRAFT INDUSTRIES JET COMMANDER 1121 & WESTWIND 1123/1124
442 C-I 130 43.3 23500 NA NA
ASTRA 1125 135 C-II 126 52.8 23500 5300 3500 GALAXY 1126 33 C-II 140 58.2 34850 5500 3500 LEARJET 23 100 C-I 124 NA 12500 4000 4300 LEARJET 24 257 C-I 128 35.6 13000 NA NA LEARJET 25 373 C-I 137 35.6 15000 NA NA LEARJET 28/29 9 B-I 120 43.7 15000 NA NA LEARJET 31 220 C-I 124 43.1 16500 3410 2870 LEARJET 35/36 739 C-I 133 39.5 18300 5000 2900 LEARJET 45 145 C-I 129 47.1 20200 4220 3140 LEARJET 55 147 C-I 138 43.7 21500 5310 3250 LEARJET 60 210 D-I 149 43.9 23500 5360 3420 MITSUBISHI MU-300 DIAMOND 111 B-I 109 43.5 14630 4300 3200 RAYTHEON 390 PREMIER 42 B-I 120 44 12500 3792 3300 SABRELINER T-39 140 NA NA NA NA NA NA SABRELINER 40 137 B-I 120 44.5 18650 4900 2950 SABRELINER 60 146 C-I 134 44.6 20200 3500 3400 SABRELINER 65 76 C-II 124 50.5 24000 5450 3345 SABRELINER 75 9 C-I 137 44.5 23300 5500 3750 SABRELINER 75a/80 72 C-II 128 50.4 24500 4460 3450 Notes: NA = Not Available Takeoff Distance is based on maximum takeoff weight and no effective gradient. Landing Distance is based on maximum landing weight and dry pavement and no wind
conditions. ISO = Sea Level at 59 Degrees Fahrenheit Some, but not all data has been checked against the approved aircraft flight manual.

Security Guidelines for General Aviation Airports
Information Publication A-001 May 2004
Version 1.0

This guidance document was developed by TSA, in cooperation with the General Aviation (GA) community. It is intended to provide GA airport owners, operators, and users with guidelines and recommendations that address aviation security concepts, technology, and enhancements. The recommendations contained in this document have been developed in close coordination with a Working Group comprised of individuals representing the entire spectrum of the GA industry. This material should be considered a living document which will be updated and modified as new security enhancements are developed and as input from the industry is received. To facilitate this, TSA has established a mailbox to collect feedback from interested parties. Persons wishing to provide input should send Email to [email protected] and insert “GA Airport Security” in the subject line.
Version 1.0

GA Airport Security IP A-001
Executive Summary ............................................................................................. iii 1. Background....................................................................................................1
1.1. The GA Industry .....................................................................................2 1.2. The Aviation Security Advisory Committee (ASAC)................................3 1.3. GA Airport Vulnerability ..........................................................................4
2. Airport Characteristics ...................................................................................5 3. Recommendations.........................................................................................8
3.1. Personnel ...............................................................................................8 3.1.1. Passengers/Visitors.........................................................................8 3.1.2. Flight Schools and Student Pilots ....................................................9 3.1.3. Aircraft Renters ...............................................................................9 3.1.4. Transient Pilots..............................................................................10
3.2. Aircraft ..................................................................................................10 3.3. Airports/Facilities ..................................................................................11
3.3.1. Hangars.........................................................................................11 3.3.2. Locks .............................................................................................11 3.3.3. Perimeter Control ..........................................................................11 3.3.4. Lighting..........................................................................................12 3.3.5. Signs .............................................................................................12 3.3.6. Identification System .....................................................................13 3.3.7. Airport Planning.............................................................................14
3.4. Surveillance ..........................................................................................14 3.4.1. Airport Community Watch Program...............................................14 3.4.2. Reporting Procedures....................................................................15 3.4.3. Airport Security Committee............................................................16 3.4.4. Law Enforcement Officer (LEO) Support .......................................16 3.4.5. Closed Circuit Television (CCTV) ..................................................16 3.4.6. Intrusion Detection Systems (IDS).................................................17
3.5. Security Procedures & Communications ..............................................17 3.5.1. Security Procedures ......................................................................17 3.5.2. Threat Level Increases ..................................................................17 3.5.3. Threat Communication System .....................................................18
3.6. Specialty Operations ............................................................................19 3.6.1. Agricultural Aircraft Operations......................................................19 3.6.2. Airport Tenant Facilities.................................................................20 3.6.3. Aircraft and Vehicle Fueling Facilities............................................20 3.6.4. Military Facilities ............................................................................20
Appendix A – Airport Characteristics Measurement Tool....................................21 Appendix B – Suggested Airport Security Enhancements ..................................22 Appendix C – Locks ............................................................................................23 Appendix D – Fencing.........................................................................................25 Appendix E – Access Points ...............................................................................28 Appendix F – Lighting .........................................................................................30 Appendix G – Security Procedures Template .....................................................31 Appendix H - Bibliography ..................................................................................39
FAA Advisory Circulars ...................................................................................39
Version 1.0
i

GA Airport Security IP A-001
U.S. Government Regulations.........................................................................40 Other Reports..................................................................................................40
Appendix I – Useful Websites .............................................................................42 Aviation Trade Associations ............................................................................42 Federal Government .......................................................................................42 Other References ............................................................................................42
Version 1.0
ii

GA Airport Security IP A-001
Executive Summary The purpose of the Security Guidelines for General Aviation Airports Information Publication (IP) is to provide owners, operators, sponsors, and other entities charged with oversight of GA airports a set of federally endorsed security enhancements and a method for determining when and where these enhancements may be appropriate. The document does not contain regulatory language nor is it intended to suggest that any recommendations or guidelines should be considered a mandatory requirement. However, program requirements for operators regulated under the Twelve-Five and Private Charter Rules are not addressed in this document, remain in effect, and may be incorporated into airport security procedures if appropriate. TSA launched this project, working collaboratively with key stakeholders, to develop and disseminate appropriate security guidelines for general aviation airports and heliports. A Working Group was established under the Aviation Security Advisory Committee (ASAC) to compile a list of recommended security best practices used throughout the industry. The ASAC delivered its recommendations to TSA in November 2003. These recommendations form the framework for the IP and all of the ASAC recommendations were incorporated. The document offers an extensive list of options, ideas, and suggestions for the airport operator, sponsor, tenant and/or user to choose from when considering security enhancements for GA facilities. This guidance will provide consistency across the Nation with regard to security at GA facilities. The IP also provides a method to discriminate security needs at differing airports. The Airport Characteristics Measurement Tool is a self administered method by which an airport operator can assess an airport’s security characteristics and decide which security enhancements would be most appropriate in that particular environment. The IP outlines seven functional areas of GA airport security. The functional areas include:
• Personnel • Aircraft • Airports/Facilities • Surveillance • Security Plans and Communications • Specialty Operations
Each of the functional areas is further broken down into detailed discussions of methods and strategies for enhancing general aviation security.
Version 1.0
iii

GA Airport Security IP A-001
This is a living document, that is initially being released as Version 1.0 and which will continue to be refined with input from stakeholders.
Version 1.0
iv

GA Airport Security IP A-001
1. Background The purpose of this Information Publication is to provide owners, operators, sponsors, and other entities charged with oversight of GA landing facilities with a set of security best practices and a method for determining when and where these enhancements would be appropriate. Regarding GA, a few definitions are in order:
• GA, as used in this document, means all civil aviation except for scheduled passenger and scheduled cargo service and military aviation.
• Airports, as used in this document, means an area of land or water that is used or intended to be used for the landing and takeoff of aircraft, and includes its buildings and facilities, if any. However, this document does not apply to airports required to comply with the provisions of 49 CFR 1542 or military airports.
This document does not contain regulatory language. It is not intended to suggest that any recommendations or guidelines contained herein might be considered as mandatory requirements to be imposed upon GA facilities or operators, nor are these recommendations and guidelines intended to suggest any specific or general criteria to be met in order to qualify for Federal funding. The intent of this document is to provide a tool that enables GA landing facility managers to assess vulnerabilities and tailor appropriate security measures to their environment -- not to 'stigmatize' airports in any way. Recognizing that every GA landing facility is unique, there are recommendations and guidelines contained in this document that might be considered highly beneficial in one airport environment while being virtually impossible to implement at another facility. The purpose of the document is to provide an extensive list of options, ideas, and suggestions for the airport operator, sponsor, tenant and/or user to choose from when considering security enhancements for GA facilities. When stating in this document that a measure “should” be used it means the measure is recommended to the extent it is consistent with the airport’s circumstances as discussed throughout this document. The Transportation Security Administration (TSA) intends that this document be used to provide effective and reasonable security enhancements at GA facilities across the Nation. To date there have been numerous initiatives undertaken by the GA industry to develop GA airport security guidelines such as awareness programs, reporting methods, and educational courses. These efforts have been considered by TSA and are reflected in this guidance document. Please note that throughout this document many airport terms are used that are the same as or similar to those terms used when describing airports required to comply with the security regulations outlined in 49 CFR Part 1542. It is not the intent of this document to recommend that GA landing facilities meet the same
Version 1.0
1

GA Airport Security IP A-001
security requirements as commercial service airports. However, on occasion it is necessary to use terminology that airport operators are already familiar with in order to facilitate readers’ understanding. Additionally, references are made to Federal Aviation Administration (FAA) guidance materials normally related to commercial service airports and operations. These documents are provided as reference material but may not necessarily constitute an appropriate approach to GA security at your facility.
1.1. The GA Industry As previously stated, as used in this document, GA encompasses all civil aviation, except military aviation and passenger and scheduled cargo service. Some basic statistics available regarding the industry:
• More than 19,000 landing facilities nationwide, including heliports, lakes, and dirt landing strips in remote wilderness areas as well as GA airports near urban settings that rival the size and scope of some air carrier airports.
• More than 200,000 GA aircraft in the U.S. are responsible for 75% of all air traffic.
• FAA certificated and non-certificated aircraft range from one-person ultralights and powered parachutes with extremely limited range and payload capabilities to helicopters, seaplanes, vintage, fabric-and-wood biplanes, experimental airplanes, four-seat single-engine airplanes, twin turboprops, and large and small business jets.
• GA accounts for over 1.3 million jobs, with nearly $20 billion in annual earnings. Its direct and indirect economic impact exceeds $102 billion annually.
• There are more than 630,000 certificated pilots in the U.S., most of whom conduct GA flight operations.
• GA transports approximately 145 million passengers annually in aircraft of all sizes for business and personal reasons.
• An estimated 58% of all GA flights are conducted for business and corporate travel.
• Commercial, non-scheduled flights (charters) are also a component of GA, with more than 22,000 pilots flying some 14,700 aircraft for this industry segment during 2001 alone.
• GA aircraft are used for a wide range of flight operations including personal/family transportation, training, MEDEVAC, transporting medical supplies, emergency services, rescue operations, wildlife surveys, traffic reporting, agricultural aviation, firefighting, and law enforcement.
(Sources: December 2003 FAA Administrator’s Fact Book; GA Serving America www.gaservingamerica.com; National Air Transportation Association)
Version 1.0
2

GA Airport Security IP A-001
Because of the wide variety and scope of GA aircraft and landing locations, any approach to implementing security guidelines must consider the various types of flight operations as well as the size of aircraft involved, among other factors. Therefore, a flexible, common-sense approach to GA airport security is important if the industry is to retain its economic vitality.
1.2. The Aviation Security Advisory Committee (ASAC) Following the 1988 Pan American World Airways Flight 103 tragedy, it was determined a need existed for all segments of the aviation industry to have input into future aviation security considerations. In response, the Aviation Security Advisory Committee (ASAC) was established in 1989 and was managed by the Federal Aviation Administration (FAA). After the terrorist attacks of September 11, 2001, Congress enacted the Aviation and Transportation Security Act (ATSA), which created the TSA. Congress established TSA to develop, regulate, and enforce transportation security standards for all modes of transportation. Consistent with this mission, Congress transferred the bulk of FAA’s civil aviation security responsibilities to TSA. Accordingly, sponsorship of the ASAC was also transferred to TSA. In April 2003, TSA requested ASAC to establish a working group made up of industry stakeholders to develop guidelines for security enhancements at the nation’s private and public use GA landing facilities. TSA made this request because, in the absence of a unified set of federal security standards for GA airports, some state and local governments had begun developing their own airport-related security requirements. TSA recognized that this could result in varied state and local security requirements that could pose an unnecessary burden on airport owners and operators while leaving security gaps in other locations. TSA believed that a better approach would be to address GA airports (both public and private use) in a collaborative forum in order to develop a set of industry endorsed guidelines and “best practices” that are tailored to broad categories of airports. The Working Group represented the GA industry as a whole. Participating members included: • Aircraft Owners & Pilots Association (AOPA) • Airport Consultants Council (ACC) • American Association of Airport Executives (AAAE) • Experimental Aircraft Association (EAA) • GA Manufacturers Association (GAMA) • Helicopter Association International (HAI) • National Air Transportation Association (NATA) • National Association of State Aviation Officials (NASAO) • National Business Aviation Association (NBAA) • United States Parachute Association (USPA)
Version 1.0
3
GA Airport Security IP A-001
Additionally, GA airport managers and representatives of various state government aviation agencies fully participated in the working group's activities.
1.3. GA Airport Vulnerability Historically, GA airports have not been subject to federal rules regarding airport security. Prior to September 11, 2001, the federal government’s role in airport security focused exclusively on those airports serving scheduled operations. Now, however, TSA must examine all aspects of the transportation system for vulnerabilities to terrorist activities. To date TSA has not required GA airports to implement security measures except for those facilities located within the Washington DC Airspace Defense Identification Zone Flight Restricted Zone. Nevertheless, many GA airport managers commonly implement basic security measures found throughout the nation’s airports. Examples include fencing and access control devices for vehicle and pedestrian gates, daily airfield inspections, landside and airfield signage, and public awareness programs for educating the aviation community as well as the general public on the safe and secure use of the facility. TSA has not taken a position that GA airports and aircraft are a threat, in and of themselves. However, as vulnerabilities within other areas of aviation have been reduced, GA may be perceived as a more attractive target and consequently more vulnerable to misuse by terrorists. TSA believes that the security guidelines outlined in this document will help airport managers and aircraft operators determine which security measures they should take at their particular facility to reduce vulnerabilities and encourage the adoption of consistent and appropriate security measures across the nation. TSA also believes that these security guidelines must be federally endorsed to discourage a hodgepodge of state and local guidelines. By definition the term GA includes a broad range of aircraft and aviation activity. Not surprisingly, GA airports vary greatly in size, function and operational characteristics. Just as all commercial service airports differ in their security needs the same is true with GA airports. TSA understands that one size security will not fit the entire spectrum of GA airports. For example, a privately owned landing strip in a rural area would not need to implement the same security measures as a large corporate GA airport near a major metropolitan area. While the potential for misuse of an aircraft operating from the rural airport exists, required adherence to a single requirement across the nation is physically and economically impossible and clearly not reasonable. TSA must instead focus on managing the risk associated with GA facilities recognizing the characteristics that define each facility.
Version 1.0
4

GA Airport Security IP A-001
The ability (physically and financially) of GA airports to voluntarily implement security improvements varies greatly. The majority of these facilities are not self-sustaining in the same manner as commercial service airports. Consequently, the decision to implement security measures must include consideration of economic feasibility and reasonableness.
2. Airport Characteristics Airport Characteristics Measurement Tool In order to assess which security enhancements are most appropriate for a GA landing facility, consideration must be given to those elements that make the airport unique. The most appropriate party to do this would be the person or persons with day-to-day operational control over the facility. This could be a state official, airport manager, or fixed base operator (FBO). In any case, the party doing the assessment should be intimately familiar with the airport, its activities, and the surrounding areas. To assist in this effort, TSA has developed an Airport Characteristics Measurement Tool (found in Appendix A) that can be used to determine where in the risk spectrum the facility lies. The tool is a list of airport characteristics that potentially affect a facility’s security posture. Each of the characteristics is assigned a point ranking, the idea being that certain characteristics affect the security at an airport more so than others. The characteristics have been broken down into the following categories:
• Airport Location – A facility’s proximity to mass population areas or sensitive sites can affect its security posture. For the purpose of this guidance we are considering a mass population area to be an area with a total metropolitan population of at least 100,000 people. A sensitive site is defined as an area which would be considered a key asset or critical infrastructure of the United States. Sensitive sites can include certain military installations, nuclear and chemical plants, centers of government, monuments and iconic structures, and/or international ports. Distance from such sites directly affects the ability of responding agencies to effectively react to an event. The further away from a potential target, the greater the response time available to responding agencies.
• Based Aircraft – A smaller number of based aircraft increases the
likelihood that illegal activities would be identified more quickly than at airports with a large number of based aircraft. In addition, airports with based aircraft of over 12,500 pounds warrant greater scrutiny.
Version 1.0
5

GA Airport Security IP A-001
• Runways – Airports with longer paved runways are able to serve larger aircraft and consequently should be more security conscious. Conversely, because shorter, unpaved runways are not practical for use by large aircraft in many weather conditions, they may present a less attractive launching point for terrorist activities. Airport operators at facilities with multiple runways should only consider the longest operational runway on the airport. Please note: TSA recognizes that airports at higher elevations may need longer runways to accommodate even the smallest of aircraft. It is not the intent of this document to assess points for a longer runway if it is unrealistic that the runway could be used for larger aircraft operations. Individuals using the Airport Characteristics Measurement Tool should understand that the baseline of the Tool was developed to consider aircraft performance at approximately sea level.
• Operations – The number and types of operations that are conducted at
an airport call for different approaches to security. Consider all operations including those operations that are only infrequently conducted at your airport.
Additionally, there is a distinct difference between “public use” airports and “private use” airports. Privately-owned, private-use GA airports receive no public funds and most state government aviation agencies currently have no authority to regulate them. However, TSA believes that some of the guidelines in this report would be beneficial to enhancing the security at these facilities as well. To use the tool, you should choose those characteristics that apply to your facility. Each of the characteristics is assigned a point value from 0-5 as shown in the Appendix A Tool. Assess points for every characteristic that applies to your facility (except for runway length considerations, there may be more than one selection in each category) and total the number of points scored. Example 1 Security Characteristics
Public Use Airport/Heliport
Small, rural, public use field located a significant distance from any sensitive sites
0
15 based aircraft 1 2500’ runway 4 Asphalt runway 1 Flight training is conducted on airfield 3
Total 9
Version 1.0
6

GA Airport Security IP A-001
Example 2 Security Characteristics
Public Use Airport/Heliport
Airport within 30nm of a sensitive site 4 Within the boundaries of Class B airspace 3 50 based aircraft 2 5000’ runway 5 Asphalt runway 1 More than 50,000 aircraft operations per year 4 Part 135 operations 3 Flight training is conducted on airfield 3 Rental aircraft 4
Total 29 Suggested Airport Security Enhancements Appendix B contains groupings of security enhancements that may be appropriate for those facilities scoring within a certain point range on the Airport Characteristics Measurement Tool. The lists of suggested security enhancements are grouped according to the point range totals derived using the Measurement Tool. These lists are by no means complete for every facility, nor are they the only method for improving security. They are suggestions that could be useful at these locations. They should not be used as the sole means of determining what security precautions are appropriate. Instead, airport owners and operators should rely on their experience and intimate knowledge of their facility, applying those items that are both reasonable and effective. This list is an assessment of the most significant characteristics relating to GA airport security. The scope and breadth of GA landing facilities precludes any one document from capturing all characteristics relevant to all GA airports. Users are advised to consider all characteristics germane to security at their particular facility when using the Airport Characteristics Measurement Tool. Mitigating Characteristics TSA also recognizes that some characteristics of GA airports actually serve the purpose of enhancing security, such as having a police presence on the airport property. Other characteristics may negate the need for certain security measures, such as if all of an airport’s runways are grass. Airport operators should use their best judgment when considering mitigating characteristics and their effect on which security enhancements are to be implemented at their airport. Some examples of mitigating circumstances are:
• Operating air traffic control tower on the field • 24/7 airport staffing • Federal, state, local, or contract law enforcement on airport property • All based aircraft under 1500 lbs
Version 1.0
7

GA Airport Security IP A-001
• All runways are grass • Restricted access to the airport • Require ID badges • Documented security Procedures
3. Recommendations Managers and operators of GA airports are encouraged to use the recommended guidelines in this report to enhance the security of their respective facilities. Intrinsic in these recommended guidelines is the concept that GA airports are extremely diverse and that appropriate security measures can be determined only after careful examination of an individual airport. The key findings of the report are encompassed in the following areas:
• Personnel • Aircraft • Airports and Facilities • Surveillance • Security Procedures and Communications • Specialty Operations
3.1. Personnel
3.1.1. Passengers/Visitors A key point to remember regarding GA passengers is that the persons on board these flights are generally better known to airport personnel and aircraft operators than the typical passenger on a commercial airliner. Recreational GA passengers are typically friends, family, or acquaintances of the pilot in command. Charter/sightseeing passengers typically will meet with the pilot or other flight department personnel well in advance of any flights. Suspicious activities such as use of cash for flights or probing or inappropriate questions are more likely to be quickly noted and authorities could be alerted. For corporate operations, typically all parties onboard the aircraft are known to the pilots. Airport operators should develop methods by which individuals visiting the airport can be escorted into and out of aircraft movement and parking areas. By utilizing common sense suggestions, the GA community can help ensure the security of their airport. Prior to boarding, the pilot in command should ensure that:
• The identity of all occupants is verified, • All occupants are aboard at the invitation of the owner/operator, and • All baggage and cargo is known to the occupants.
Version 1.0
8

GA Airport Security IP A-001
3.1.2. Flight Schools and Student Pilots We now know that the September 11 terrorists trained at flight schools in Florida, Arizona, and Minnesota. This has raised concerns among the public and federal law enforcement organizations about flight school security and how it can be improved. In response the federal government and the aviation industry have developed the following recommendations designed to enhance positive control of the aircraft before movement, when an instructor is ready to accompany the student. Flight schools should:
• Require flight students to use proper entrances and exits to ramp areas. If access controls are available, consider having flight school personnel allow access to ramp areas only after establishing positive identification of flight students.
• Establish positive identification of student pilots prior to every flight lesson. • Control aircraft ignition keys so that the student cannot start the aircraft
until the instructor is ready for the flight to begin. • Limit student pilot access to aircraft keys until the student pilot has
reached an appropriate point in the training curriculum. • Consider having any student pilot check in with a specific employee (i.e.
dispatcher, aircraft scheduler, flight instructor, or other "management" official) before being allowed access to parked aircraft.
• Have the student sign or initial a form and not receive keys until an instructor or other "management official" also signs or initials.
• When available, use a different ignition key from the door lock key. The instructor would provide the ignition key when he or she arrives at the aircraft.
TSA is developing a security awareness training program for use by flight schools that may also be used by GA airports. The training program will provide information on suspicious behavior patterns, appropriate responses to such behavior, and GA airport watch programs. The training program will be available electronically on the TSA GA website (www.tsa.gov/public/display?theme=180) in the summer of 2004. The GA website also will contain information regarding any general threats to GA airports or aircraft and major incidents involving GA airports or aircraft.
3.1.3. Aircraft Renters A very large proportion of GA aircraft are used for rental purposes. At most airports, regular aircraft renters are fairly well known, and new renters are typically required by insurance agencies to complete a flight check which ascertains their ability to safely operate rental aircraft. Both of these factors may serve as a deterrent to using GA aircraft for terrorist purposes. However, developing and documenting standard procedures and ensuring flight school
Version 1.0
9

GA Airport Security IP A-001
employees are educated in the procedures further enhances flight school security.
• The identity of an individual renting an aircraft should be verified by checking an individual’s government-issued photo ID as well as his or her airman certificate and current medical certificate necessary for that operation.
• In addition to any aircraft-specific operational and training requirements, a first-time rental customer should be familiarized with local airport operations, including security procedures used at the facility.
• Operators providing rental aircraft should be vigilant for suspicious activities and report them to appropriate officials.
3.1.4. Transient Pilots Airport personnel should strive to establish procedures to identify non-based pilots and aircraft using their facilities. One helpful method would be for airport or FBO operators to establish sign-in/sign-out procedures for all transient operators and associate them with their parked aircraft. Having assigned spots for transient parking areas can help to easily identify transient aircraft on an apron.
3.2. Aircraft The main goal of enhancing GA airport security is to prevent the intentional misuse of GA aircraft for terrorist purposes. Proper securing of aircraft is the most basic method of enhancing GA airport security. Pilots should employ multiple methods of securing their aircraft to make it as difficult as possible for an unauthorized person to gain access to it. Some basic methods of securing a GA aircraft include:
• Ensuring that door locks are consistently used to prevent unauthorized access or tampering with the aircraft.
• Using keyed ignitions where appropriate. • Storing the aircraft in a hangar, if available, and locking hangar doors. • Using an auxiliary lock to further protect aircraft from unauthorized use.
Commercially available options for auxiliary locks include locks for propellers, throttle, and tie-downs.
• Ensuring that aircraft ignition keys are not stored inside the aircraft.
Version 1.0
10

GA Airport Security IP A-001
3.3. Airports/Facilities
3.3.1. Hangars Storage in hangars is one of the most effective methods of securing GA aircraft. TSA recognizes that hangar space at many airports is limited. However, every attempt should be made to utilize hangars when available and ensure that all hangar/personnel doors are secured when unattended. Hangars should be properly marked and numbered for ease of emergency response. These areas are also a good place to install security and informational signs. Hangar locks that have keys that are easily obtained or duplicated should be avoided. Hangar locks should be rekeyed with every new tenant. Proper lighting around hangar areas should be installed. As an additional security measure alarm and intrusion detection systems could also aid in the security of hangars.
3.3.2. Locks Regardless of its quality or cost a lock is simply a delaying device and not a complete bar to entry. As important as the choice of lock is, the decision where to install locks is more important. Such factors to consider may include:
• Is the object to be locked indoors or outdoors? • How many people will need to use the lock (i.e. would a combination be
better than issuing keys)? • Would a certain type of lock impede access in high traffic areas? • How secure should the area be made? • Is the area monitored? • How often will codes, keys, or locks need to be changed for persons
needing access (e.g. new hangar tenants, those with tiedown agreements needing ramp access, etc.)?
• Will use of a lock interfere with fire code egress requirements? A more detailed discussion of locks and their use can be found in Appendix C.
3.3.3. Perimeter Control To delineate and adequately protect security areas from unauthorized access it is important to consider boundary measures such as fencing, walls, or other physical barriers, electronic boundaries (e.g. sensor lines, alarms), and/or natural barriers. Physical barriers can be used to deter and delay the access of unauthorized persons onto sensitive areas of airports. Such structures are usually permanent and are designed to be a visual and psychological deterrent as well as a physical barrier. They also serve to meet safety requirements in many cases. Where possible, security fencing or other physical barriers should be aligned with security area boundaries.
Version 1.0
11

GA Airport Security IP A-001
The choice of an appropriate security boundary design is not only affected by the cost of equipment, installation, and maintenance, but also by effectiveness and functionality, that is, its ability to prevent unauthorized access. However, it is important to note that perimeter control methods alone will not necessarily prevent a determined intruder from entering, nor may they be appropriate for every facility. The strength of any security mechanism is dependent on the airport’s overall security plan. Expending resources on an unnecessary security enhancement (e.g. complete perimeter fencing, and access controls) instead of a more facility specific, reasonable, and more effective method (e.g. tiedown chains with locks) may actually be detrimental to an airport’s overall security posture. More specific information on perimeter control can be found in Appendices D and E.
3.3.4. Lighting Protective lighting provides a means of continuing a degree of protection from theft, vandalism, or other illegal activity at night. Security lighting systems should be connected to an emergency power source, if available. Requirements for protective lighting of airports depend upon the local situation and the areas to be protected. A careful analysis of security lighting requirements should be based on the need for good visibility and the following criteria: employee recognition and badge identification, vehicle access, detection of intruders, and deterrent to illegal entry. Protective lighting is generally inexpensive to maintain, and when properly employed, may provide airport personnel with added protection from surprise by a determined intruder. However, when developing any security lighting plan care should be taken to ensure that lighting does not interfere with aircraft operations. Consider installing outdoor area lighting to help improve the security of aircraft parking and hangar areas, fuel storage areas, airport access points; and other appropriate areas. A more detailed discussion of lighting can be found in Appendix F.
3.3.5. Signs The use of signs provides a deterrent by warning of facility boundaries as well notifying of the consequences for violation. Signs along a fence line should be located such that when standing at one sign, the observer is able to see the next sign in both directions. While signs for security purposes should be designed to
Version 1.0
12

GA Airport Security IP A-001
draw attention, it also should be coordinated with other airport signs for style and consistency when possible. Signs should be constructed of durable materials, contrasting colors, and reflective material where appropriate. Use as concise language as possible. Wording may include – but is not limited to – warnings against trespassing, unauthorized use of aircraft and tampering with aircraft, and reporting of suspicious activity. Signage should include phone numbers of the nearest responding law enforcement agency, 9-1-1, or TSA’s 1-866-GA-SECUR (see section 3.4.2), whichever is appropriate. Many locations with access control or Closed Circuit Television (CCTV) equipment may warrant signage for directional, legal, or law enforcement purposes (e.g. “Alarm will sound if opened”, “Authorized personnel only”, “Notice: All activities in this area are being monitored and recorded”, etc.). For more information refer to Advisory Circular (AC) No: 150/5360-12D, Airport Signing and Graphics. At international airports, designers and airport authorities may also wish to consult the International Civil Aviation Organization (ICAO) Document 9430-C/1080, International Signs to Provide Guidelines to Persons at Airports.
3.3.6. Identification System Some airport operators may wish to consider implementing a method of identifying airport employees or authorized tenant access to various areas of the airport. Currently, there are many systems on the market that may accomplish this. They can range from a simple laminated identification card that includes a photograph of an individual to a sophisticated swipe card with various biometric data. With any identification system, procedures should be developed that include ensuring control and accountability of the media. Some elements that could be part of an identification system include:
• A full-face image • The individual’s full name • Airport name • Employer • A unique identification number • The scope of the individual access and movement privileges (e.g. color
coding) • A clear expiration date
A vehicle identification system may be developed. Such a system can assist airport personnel and law enforcement in identifying authorized vehicles. Vehicles can be identified through use of decals, stickers, or hang tags. Decals
Version 1.0
13

GA Airport Security IP A-001
should be nontransferable; that is, they should not be capable of being removed without destroying their integrity. These systems should also be used to indicate access authorization where appropriate, such as by numbering or color-coding. Issuing authorities should also attempt to make current stickers/decals easily distinguished from expired ones. In addition, any decal application form should contain owner contact information that may be used in the event of an emergency. More suggestions for establishing an identification system can be found in AC-107-1, “Aviation Security – Airports”.
3.3.7. Airport Planning Planning for security should be an integral part of any project undertaken at an airport. The most efficient and cost effective method of instituting security measures into any facility or operation is thorough advance planning and continuous monitoring throughout the project. Selecting, constructing, or modifying a facility without considering the security implications can result in costly modifications and delays. Airport operators should consider addressing future security needs such as access controls and lighting enhancements when planning new hangars or terminal buildings. Security concerns should be included and addressed in airport facility and land leases, airport rules and regulations, and the Minimum Standards document. In addition, airport construction projects can affect airfield security. Construction personnel and vehicle access during projects should be considered.
3.4. Surveillance
3.4.1. Airport Community Watch Program The vigilance of airport users is one of the most prevalent methods of enhancing security at GA airports. Typically, the user population is familiar with those individuals who have a valid purpose for being on the airport property. Consequently, new faces are quickly noticed. Teaching an airport’s users and tenants what to look for with regard to unauthorized and potentially illegal activities is essential to effectively utilizing this resource. Airport managers can either utilize an existing airport watch program or establish their own airport specific plan. A watch program should include elements similar to those listed below. These recommendations are not all-inclusive. Additional measures that are specific to each airport should be added as appropriate, including:
• Coordinate the program with all appropriate stakeholders including airport officials, pilots, businesses and/or other airport users.
• Hold periodic meetings with the airport community. • Develop and circulate reporting procedures to all who have a regular
presence on the airport.
Version 1.0
14

GA Airport Security IP A-001
• Encourage proactive participation in aircraft and facility security and heightened awareness measures. This should include encouraging airport and line staff to ‘query’ unknowns on ramps, near aircraft, etc.
• Post signs promoting the program, warning that the airport is watched. Include appropriate emergency phone numbers on the sign.
• Install a bulletin board for posting security information and meeting notices.
• Provide training to all involved for recognizing suspicious activity and appropriate response tactics. This could include the use of a video or other media for training. The following are some recommended training topics:
o Aircraft with unusual or unauthorized modifications. o Persons loitering for extended periods in the vicinity of parked
aircraft, in pilot lounges, or other areas deemed inappropriate. o Pilots who appear to be under the control of another person. o Persons wishing to rent aircraft without presenting proper
credentials or identification. o Persons who present apparently valid credentials but who do not
display a corresponding level of aviation knowledge. o Any pilot who makes threats or statements inconsistent with normal
uses of aircraft. o Events or circumstances that do not fit the pattern of lawful, normal
activity at an airport. • Utilize local law enforcement for airport security community education. • Encourage tenants to make their staff aware of the airport watch
programs.
3.4.2. Reporting Procedures It is essential that every airport employee, tenant, and user is familiar with reporting unusual or suspicious circumstances on airport property. There are three basic ways that persons can report suspect activities. First is to airport management. Oftentimes questions regarding the legitimacy of an activity can be quickly and easily resolved by bringing it to the attention of an airport employee. A second method is to utilize the GA-SECURE Hotline. TSA developed and implemented a GA hotline in partnership with the National Response Center. 866-GA-SECUR (1-866-427-3287) was launched on December 2, 2002 and operates 24 hours per day 7 days per week. The GA Hotline serves as a centralized reporting system for general aviation pilots, airport operators, and maintenance technicians wishing to report suspicious activity at their airfield.
Version 1.0
15

GA Airport Security IP A-001
The third and most obvious method is to contact local law enforcement using a local phone number or by dialing 911. In instances where the situation could potentially turn dangerous all pilots are strongly encouraged to use this method. However, after contacting 911 or airport management TSA also requests that callers contact the GA Hotline in order to ensure that information surrounding the incident reaches the National Response Center.
3.4.3. Airport Security Committee Airport management should consider establishing an Airport Security Committee. This Committee should be composed of airport tenants and users drawn from all segments of the airport community. The main goal of this group is to involve airport stakeholders in developing effective and reasonable security measures and disseminating timely security information. Meetings should be held regularly for the purpose of giving coordinated direction to the overall airport security program.
3.4.4. Law Enforcement Officer (LEO) Support It is imperative that airport operators establish and maintain a liaison with appropriate law enforcement agencies including local, state, and federal. These organizations can better serve the airport operator when they are familiar with airport operating procedures, facilities, and normal activities. Procedures may be developed to have local LEOs regularly or randomly patrol ramps and aircraft hangar areas, with increased patrols during periods of heightened security. Airport operators should communicate and educate local law enforcement agencies on operational and security procedures at the airport. This may include:
• Recognizing proper airport credentials (e.g. airport ID badges, airmen certificates).
• Recognizing those airport users authorized to drive on the ramp. • Notifying LEOs as to how they can obtain airport access (e.g. who has
gate keys, access codes). • Educating LEOs on airport speed limits, aircraft right-of-way procedures,
and other “normal” operations. • Issuing airport maps with a detailed facility index. • Recognizing “normal” airport operations.
3.4.5. Closed Circuit Television (CCTV) Although CCTV is used for many purposes, its most common use is for surveillance. CCTV systems make it possible for fewer individuals to maintain a constant watch on all areas of the facility. These systems may even provide an alternative to fencing as a method of perimeter security. In conjunction with a perimeter fence, CCTV may also deter security breaches at airports, and may provide an improved response when breaches do occur. Additionally, CCTV video recorders may provide a visual record that can be used to document
Version 1.0
16

GA Airport Security IP A-001
activities that become the subject of investigations. However, the inherent weakness of this system is that it must be monitored to be effective. CCTV may be appropriate only at busier, more complex airports.
3.4.6. Intrusion Detection Systems (IDS) IDS are becoming more and more popular as a method for providing GA airport security. The inherent benefit to such systems is that they can replace the need for physical security personnel to patrol an entire facility or perimeter. Typically, such systems are constantly monitored by a contracting company. If an intrusion or some other specified event (e.g. fire or power outage) is detected, the system administrator notifies police, fire, and/or airport management. Costs vary depending upon the type of system, monitoring fees, and equipment. Such systems can be used to secure terminals, hangars, or other airport facilities, or be used to monitor perimeter security and access points.
3.5. Security Procedures & Communications
3.5.1. Security Procedures GA airport managers/operators may find it helpful to develop written security procedures. Many of these security initiatives are already being conducted on airfields but have not been formalized into a documented program. Documentation provides managers with a traceable and auditable method of ensuring airport employees and tenants are aware of and understand security issues. Such a protocol should minimally consist of, but not be limited to, airport and local law enforcement contact information, including alternates when available, and utilization of a program to increase airport user awareness of security precautions such as Airport Watch. Because security procedures may contain sensitive information, the airport operator should limit access to them to the extent possible. A procedures template can be found in Appendix G.
3.5.2. Threat Level Increases The Homeland Security Advisory System (HSAS) is a mechanism for the Department of Homeland Security to disseminate information regarding the risk of terrorist acts throughout the nation. It provides airport operators with information to implement increased security measures during times of heightened alert and to reduce security procedures at lower threat levels. A written GA security procedure can include reference to and be coordinated with appropriate local response plans as prepared for the specific region in which the landing facility is located. The protocol should emphasize such critical elements as awareness, prevention, preparation, response, and recovery. Intrinsic in
Version 1.0
17
GA Airport Security IP A-001
these recommended guidelines is the concept that each GA airport is unique. Airport operators are encouraged to develop response procedures appropriate to their facility. During times of lower alert levels airport operators may wish to do the following:
• Develop preparedness plans, emergency contact lists, and training programs to ensure key elements of HSAS and preparedness plans are presented to all employees.
• Review and update any previously developed preparedness plans, emergency contact lists, and training programs.
• Communicate with appropriate local federal agency representatives (e.g. DHS, FBI, and TSA).
• Conduct surveillance of facility property, buildings, and aircraft. • Coordinate emergency plans as appropriate with nearby jurisdictions. • Hold security committee meetings to ensure timely dissemination of
security/threat information.
Under most circumstances, the measures for increased alert levels (Orange or Red) are not intended to be sustained for substantial periods. Appropriate actions may include:
• Conducting all measures taken at lower threat condition. • Limiting facility access points. • Making regular surveillance patrols of facility property, buildings, and
aircraft. • Increasing surveillance of critical locations. • Coordinating necessary security efforts with federal, state, and local
law enforcement agencies or any National Guard or other appropriate organizations.
• Preparing to execute contingency procedures, as appropriate. • Ensuring positive identification of pilots and tenants. • Assigning emergency response personnel, pre-positioning, and
mobilize specially trained teams or resources. • Closing the facility.
3.5.3. Threat Communication System The development of a comprehensive contact list is recommended to be included in any airport security procedures. The list should be distributed all appropriate individuals. The following phone numbers should be included on the contact list (include after hour contact numbers where appropriate):
• Landing facility operator • Landing facility manager • Individual with responsibility for facility security
Version 1.0
18

GA Airport Security IP A-001
• Local Police or County Sheriff Department (List all responding LEO Agencies)
• State Aviation Director • County/City Emergency Manager • State Police • Fire Department • State Office of Public Safety/Homeland Security • FBI • Local FAA contact • Local TSA contact (that is, Federal Security Director or designee) • Any other appropriate organization
Additionally, in the event of a security incident, it is essential that first responders and airport management have the capability to communicate. Where possible, coordinate radio communication and establish common frequencies and procedures to establish a radio communications network with local law enforcement. Also important to the communication process is a means by which all new security policies, procedures, and alerts are communicated to tenants and other airport users. One method of accomplishing this is to conduct regular meetings with airport tenants and the flying public to discuss security issues and challenges, establishing a centralized area for posting of security information, or even developing an email alert system.
3.6. Specialty Operations
3.6.1. Agricultural Aircraft Operations TSA recognizes the proactive steps taken by agricultural aircraft operators to secure the industry. TSA suggests that each owner/operator take appropriate steps to secure agricultural aircraft when unattended, including:
• Use multiple devices to secure agricultural aircraft such as throttle and control locks, propeller locks, and hidden ignition switches.
• Store aircraft in hangars with electronic security systems and steel doors. • Park heavy equipment in the front and back of agricultural aircraft when
hangers are not available for storage. Additional security measures can be found on the National Agricultural Aircraft Association’s website at: http://www.agaviation.org/
Version 1.0
19

GA Airport Security IP A-001
3.6.2. Airport Tenant Facilities For those airports with a perimeter fence, many airport tenant facilities have access to the aircraft parking and movement and public areas of the airport through their building. Typically, the tenant leasing the facility is responsible for security. However their access controls may also be incorporated into the airport’s security procedures and/or alarm and reporting system. Airport operators should coordinate with their tenants to ensure that any security procedures or systems do not conflict or leave gaps. For example, airport management should coordinate and ensure security procedures exist and are harmonized with maintenance facilities that have access on both the public side of the fence and the aircraft parking and movement areas.
3.6.3. Aircraft and Vehicle Fueling Facilities Fuel farms are normally placed in as remote a location of the airport as possible for safety and convenience purposes. If feasible, use security fencing, lighting, and access controls whenever possible to control movement in these areas. Trucks used to transfer fuel to aircraft should be secured when not in use. This includes controlling fuel truck keys and not leaving keys in trucks while unattended. Consider marshalling fuel trucks in an easily monitored location.
3.6.4. Military Facilities Some airports may have adjacent or on-airport military facilities such as military Reserve, National Guard, or active duty units. Since each of these situations is unique, and since these facilities are often at least partly within the aircraft movement area, detailed coordination between the airport and the military facility must occur for security procedures and responses. Typical areas of coordination include access control, badging and background check requirements, areas of access, security patrol boundaries, security response responsibilities, and joint and/or shared security system data and equipment.
Version 1.0
20
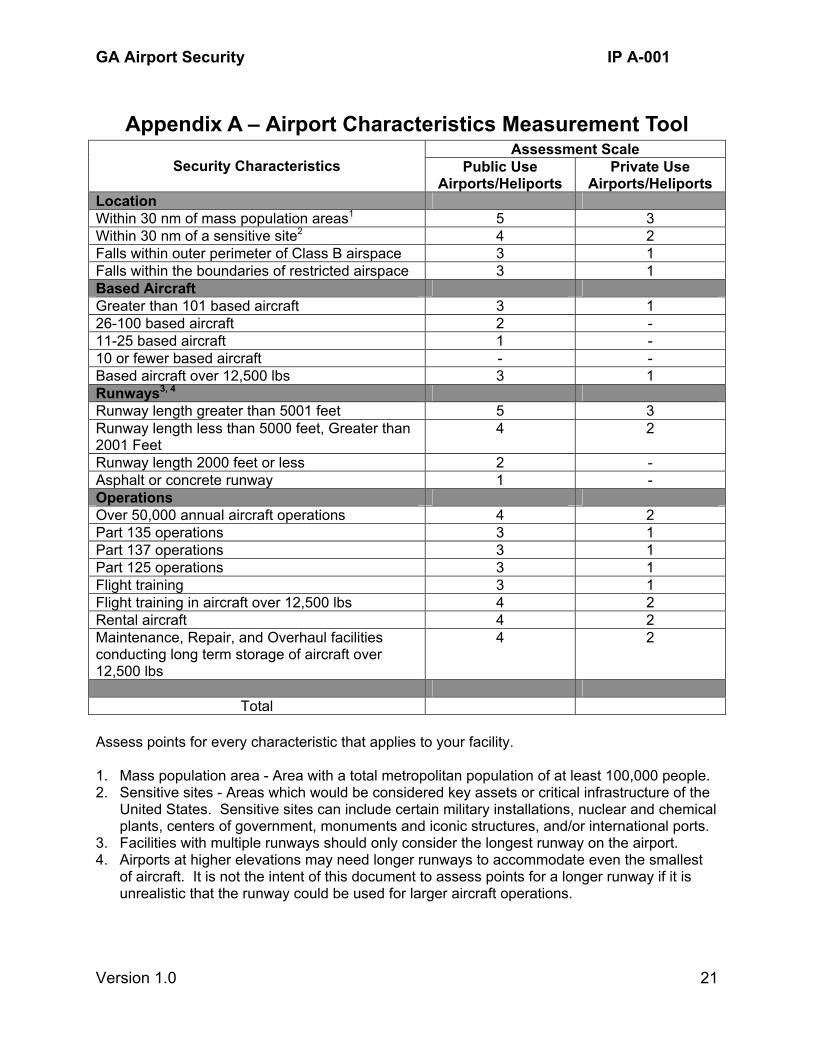
GA Airport Security IP A-001
Appendix A – Airport Characteristics Measurement Tool Assessment Scale
Security Characteristics Public Use Airports/Heliports
Private Use Airports/Heliports
Location Within 30 nm of mass population areas1 5 3 Within 30 nm of a sensitive site2 4 2 Falls within outer perimeter of Class B airspace 3 1 Falls within the boundaries of restricted airspace 3 1 Based Aircraft Greater than 101 based aircraft 3 1 26-100 based aircraft 2 - 11-25 based aircraft 1 - 10 or fewer based aircraft - - Based aircraft over 12,500 lbs 3 1 Runways3, 4 Runway length greater than 5001 feet 5 3 Runway length less than 5000 feet, Greater than 2001 Feet
4 2
Runway length 2000 feet or less 2 - Asphalt or concrete runway 1 - Operations Over 50,000 annual aircraft operations 4 2 Part 135 operations 3 1 Part 137 operations 3 1 Part 125 operations 3 1 Flight training 3 1 Flight training in aircraft over 12,500 lbs 4 2 Rental aircraft 4 2 Maintenance, Repair, and Overhaul facilities conducting long term storage of aircraft over 12,500 lbs
4 2
Total
Assess points for every characteristic that applies to your facility. 1. Mass population area - Area with a total metropolitan population of at least 100,000 people. 2. Sensitive sites - Areas which would be considered key assets or critical infrastructure of the
United States. Sensitive sites can include certain military installations, nuclear and chemical plants, centers of government, monuments and iconic structures, and/or international ports.
3. Facilities with multiple runways should only consider the longest runway on the airport. 4. Airports at higher elevations may need longer runways to accommodate even the smallest
of aircraft. It is not the intent of this document to assess points for a longer runway if it is unrealistic that the runway could be used for larger aircraft operations.
Version 1.0
21

GA Airport Security IP A-001
Appendix B – Suggested Airport Security Enhancements
Points/Suggested Guidelines >45
• Fencing (Section 3.3.3)
• Hangars (Section 3.3.1)
• CCTV (Section 3.4.5)
• Intrusion Detection System (Section 3.4.6)
25-44
• Access Controls (Section 3.3.3)
• Lighting System (Section 3.3.4)
• Personnel ID system (Section 3.3.6)
• Vehicle ID system (Section 3.3.6)
• Challenge Procedures (Section 3.4.1)
15-24
• LEO Support (Section 3.4.4)
• Security Committee (Section 3.4.3)
• Transient Pilot Sign-In/Out Procedures (Section 3.1.4)
0-14
• Signs (Section 3.3.5)
• Documented Security Procedures (Section 3.5.1)
• Positive Passenger/Cargo/Baggage ID (Section 3.1.1)
• All Aircraft Secured (Section 3.2)
• Community Watch Program (Section 3.4.1)
• Contact List (Section 3.5.3)
Version 1.0
22

GA Airport Security IP A-001
Appendix C – Locks Many ingenious methods have been developed to open locks surreptitiously. Some locks require considerable time and expert manipulation for covert opening but all will succumb to force and the proper tools. Further, many locks can be bypassed either because of poor construction of the lock, poor building construction, or improper installation. Locks are an integral part of barriers and their security. In addition to their physiological deterrence, their physical strength and resistance to all but the most determined thief provides security in itself. In addition, the loss in time and usual added noise will give increased probability of detection. It is important that the manager of a facility know each employee who has access to each lock. Key control is as important as the use of locks. There are various types of locks that may be employed at an airport:
• Combination Locks - Combination padlocks can be designed with either fixed or changeable combination mechanisms. However, care should be taken when employing these locks in an area exposed to the elements. Lock combinations should be changed regularly.
• Cipher Locks - A variety of cipher (push button) locks are available. The use of these locks should be limited to controlling access in manned areas as lock codes can be given to unauthorized users. Both electrical and mechanical cipher locks are available. Each may be used with electric release latches, and doors with this type of lock should be equipped with automatic door closers. The electrical cipher lock should also be equipped with a keyed bypass lock to allow access in the event of power failure. These lock codes should also be changed regularly.
• Key Locks - The key type padlock of brass construction with pin tumblers and a hardened shackle are generally the most satisfactory for outside use. Where possible, locks should be rekeyed, replaced, or discarded prior to a new tenant moving in.
Advanced electronic key technologies should also be considered. These systems provide a number of benefits to the user. First, electronic keys provide airport management with the ability to immediately disable access on keys that, are lost or stolen. Second, using electronic keys provide a record of users movements throughout the airport area. Deadbolt locks, built-in door handle locks, or padlocks and metallic keys should be considered to secure an access point, particularly those that are low-risk, low throughput, or significantly distant from the main areas of concern or from the central control station. Such locking systems may involve other procedural issues, such as a key management system and the difficulties of recoring at numerous locations and the reissuing of keys when they are lost or stolen.
Version 1.0 23

GA Airport Security IP A-001
Of primary importance in maintaining the integrity of a locking system is the establishment of effective key control, including control of keys, key codes, key cutting and combination equipment, and key issuance and retrieval. Rigid controls should be established to ensure that:
• If systems requiring key cutting codes and equipment are used, measures are taken to protect them against loss or misuse.
• Key issuance authority is limited to as few personnel as possible to minimize improper distribution.
• Keys are issued to personnel on the basis of operational needs and not as a convenience.
• Keys are retrieved when personnel leave the airport by transfer, dismissal, resignation, or lease expiration.
• Lost keys are reported promptly to the appropriate airport personnel. • Unissued locks and keys are properly safeguarded. • Keys are stamped or engraved with “Do Not Duplicate”. • The key issuance system is periodically audited to ensure accountability
for all keys. An important consideration in such investments in airport equipment is total life cycle costs, not merely the initial capital cost. This is a concept that should carry over into any equipment procurement process.
Version 1.0 24
GA Airport Security IP A-001
Appendix D – Fencing Security fencing is the most common means of securing a perimeter. Fencing can vary in design, height, and type depending on local security needs. Typically, fences are low-maintenance, provide clear visibility for security patrols, and are available in varieties that can be installed in almost any environment. Barbed wire, razor wire, and other available features increase intrusion difficulty. For locations with aesthetic concerns, there are also a large variety of decorative yet functional styles available, as well as opaque styles that limit public visibility of service, storage, or other non-aesthetic areas. Fencing can vary in design and function depending on the facility. Such barriers can range from chain link fencing topped with barbed wire similar to that found at commercial service airports, to a simple split rail fence designed to alert individuals to the presence of the airport operations area. In any case, fencing will not discourage a determined intruder. However, it can serve to alert airport management to the presence of unauthorized individuals. To derive value from a fencing system, airport personnel and users must be educated in the use of a “challenge” system. A challenge system involves airport employees and users confronting unknown personnel on the airport to determine whether or not they have a valid reason for being on airport property. Such a system may include stopping and questioning or even simply greeting the unknown individual and engaging in conversation to determine their purpose for being in a restricted area. It should be noted that while fencing is normally the most effective physical barrier for securing the airside, fencing an entire perimeter may not be economically feasible or even necessary for many airports. Partial fencing of sensitive areas such as the terminal area, aircraft storage, or maintenance areas may be more appropriate and can prove to be just as effective. The physical security barrier provided by a fence provides the following functions1:
• Gives notice of the legal boundary of the outermost limits of a facility or security sensitive area.
• Assists in controlling and screening authorized entries into a secured area by deterring entry elsewhere along the boundary.
• Supports surveillance, detection, assessment, and other security functions by providing a zone for installing intrusion detection equipment and closed-circuit television (CCTV).
• Deters casual intruders from penetrating a secured area by presenting a barrier that requires an overt action to enter.
1 Source: Chain Link Fence Manufacturer’s Institute.
Version 1.0 25

GA Airport Security IP A-001
• Demonstrates the intent of an intruder by their overt action of gaining entry.
• Causes a delay to obtain access to a facility, thereby increasing the possibility of detection.
• Creates a psychological deterrent. • Optimizes the use of security personnel while enhancing the capabilities
for detection and apprehension of unauthorized individuals. • Demonstrates a corporate concern for facility security • Provides a cost effective method of protecting facilities
Some basic fencing features that enhance security include:
• Height - the higher the barrier, the more difficult and time consuming to breach.
• Barbed Wire - adding barbed wire at the top of the fence increases the level of difficulty and time to breach.
• Eliminating handholds - omitting a rail at the top of the fence makes the fence more difficult to climb.
• Burying the bottom of the fencing - eliminates the possibility of forcing the mesh up so that individuals can crawl under.
• Sensor system - addition of an intrusion/alert system adds another level of security to the perimeter.
• Lighting - increases visibility as well as raises the level of psychological deterrent.
• Signage - installed along the fence line, signs are important to indicate private secured areas and the presence of security patrols, alarms, or monitoring systems.
• Clear areas - security effectiveness of perimeter fencing is materially improved by the provision of clear areas on both sides of the fence, particularly in the vicinity of the terminal and any other critical facilities. Such clearance areas facilitate surveillance and maintenance of fencing and deny cover to vandals and trespassers. Suggested clear distances range from 10 to 30 feet, within which there should be no climbable objects, trees, or utility poles abutting the fence line nor areas for stackable crates, pallets, storage containers, or other materials. Likewise, the parking of vehicles along the fence should also be minimized. In addition, landscaping within the clear area should be minimized or eliminated to reduce potential hidden locations for persons, objects, fence damage, and vandalism.
There have been cases in which individuals have gained access to passenger aircraft by scaling or crashing through perimeter fencing. To deter or delay attacks, sufficient distance should be maintained between the perimeter fencing and aircraft parking areas.
Version 1.0 26
GA Airport Security IP A-001
However, airport operators should be careful that increased perimeter controls and measures do not prevent authorized personnel from gaining airfield access (e.g. fire and emergency response vehicles and personnel need to be assured unrestricted access). Additional Information on materials and installation is available in FAA Advisory Circular (AC) 107-1, Aviation Security – Airports; AC 150/5360-13, Planning and Design Guidelines for Airport Terminal Facilities; AC 150/5370-10, Standards for Specifying Construction of Airports, and DOT/FAA/AR-00/52, Recommended Security Guidelines for Airport Planning, Design, and Construction.
Version 1.0 27

GA Airport Security IP A-001
Appendix E – Access Points If perimeter controls are used for an airport, access points for personnel and vehicles through the boundary lines, such as gates, doors, and electronically controlled or monitored access points should also be considered. In addition, access point type and design may be the determining factor in the effectiveness of the security boundary and control in that area. So, in all cases, the number of access points should be minimized and their use and conditions regularly monitored. Any access point through a fence or other boundary should not only be able to control or prevent access, but also differentiate between an authorized and an unauthorized user. At an airport, access through boundary lines is often quite frequent, and must be quick in order to prevent unacceptable delays. In addition, if a boundary access point is not user-friendly, it may be abused, disregarded, or subverted and thus pose a security risk. Regardless of boundary location or type, the number of access points should be minimized for both security and cost efficiency. Gates are the only moveable part of a fence and therefore should be properly constructed with appropriate fittings. Chain link gate specifications are specified in industry and federal guidance documents listed in the bibliography. Gates should be constructed and installed to the same or greater standard of security as any adjacent fencing in order to maintain the integrity of the area. All gates should have self-closures and be equipped so that they can be secured should enhanced security conditions require it. All gates should be sufficiently lighted. Swing gate hinges should be of the non-liftoff type or provided with additional welding to prevent the gates from being removed. Security provided by gates can be improved if they are designed and installed with no more than 4-6” of ground clearance beneath the gate and minimal gaps on both sides of the gate. For vehicle access, limiting the size of the opening increases security, reduces the possibility of one vehicle passing another and shortens the open close cycle time. The cantilever slide gate is the most effective for vehicle security especially one that is electrically operated and tied into an access control system. “Tailgating” entry may be a concern at unstaffed vehicle access points. Tailgating involves an unauthorized vehicle closely following behind an authorized vehicle in order to pass through an access point before the gate closes. The first response to this is usually a procedural one rather than design, since it is the responsibility of the person authorized to use the gate to be certain tailgating does not occur. To reinforce the user’s responsibility, the airport may elect to use signs reminding vehicle operators to confirm gate closure. However, if a fence design solution is desired, an automated two-gate system (also known as vehicle entrapment gate) is one method that can help prevent “tailgate” entry. Such gates are separated one vehicle length apart and are sequenced so that
Version 1.0 28

GA Airport Security IP A-001
the second gate does not open until the first has fully closed. Time-delayed closures are a viable alternative. Timers can be increased or decreased to accommodate threat levels. Sensor arrays have also been used to successfully monitor vehicle movement and assist in detection of “tailgate” entries. “Tailgating” and “reverse tailgating” (where a vehicle enters a gate opened by an exiting vehicle) at automated gates may also be reduced by use of a security equipment layout that provides space for waiting vehicles to stop, which obstructs, or at least deters other vehicles from passing through. Pedestrian/personnel gates can be constructed using a basic padlock or designed with an electrical or mechanical lock or a keypad/card key system tied into an access control system. Pre-hung pedestrian gates/portals installed independent of the fence line are available to isolate the gate from fence lines containing sensor systems, thus reducing possible false alarms.
Version 1.0 29

GA Airport Security IP A-001
Appendix F – Lighting Good protective lighting is achieved by adequate, even light upon bordering areas, glaring lights oriented toward pedestrian and vehicle avenues of approach, and relatively little light on the guard personnel. Lighting units for perimeter fences should be located a sufficient distance within the protected area and above the fence so that the light pattern on the ground will include an area on both the inside and the outside of the fence. Generally, the light band should illuminate the fence perimeter barrier and extend as deeply as possible into the approach area. Limiting factors on the orientation of lights and the depth of the light band may include airport operations and air safety requirements, residences, waterways, and roadways. Types of protective lighting systems and light sources include the following:
• Continuous Lighting. This is the most common protective lighting system. It consists of a series of fixed lights arranged to flood a given area with overlapping zones of light on a continuous basis during the hours of darkness. There are two methods of employment of this system:
o Glare projection lighting where the glare of lights directed across surrounding territory will not be annoying or interfere with adjacent operations;
o Controlled lighting where the width of the lighted strip is restricted to meet a particular need.
• Standby Lighting. Lights in this system are either automatically or manually turned on at a prearranged time, when suspicious activity is detected, or when an interruption of power occurs.
• Movable Lighting. This type of lighting consists of manually-operated, movable flood lights.
• Emergency Lighting. This system may duplicate any of the aforementioned systems. Its use is limited to periods of power failure or other emergencies and is dependent upon an alternate power source.
• Solar Powered Lighting: In areas where electricity does not exist or is cost prohibitive solar powered lighting may be considered a viable alternative and have a wide range of applications.
Lighting of security areas on both sides of gates and selected areas of fencing is highly effective. Lighting is beneficial not only for security inspection, but also to ensure that fence/gate signage is readable and that card readers, keypads, phones, locks, and/or other devices at the gate are visible and usable. Similarly, sufficient lighting is required for any area in which a CCTV camera is intended to monitor activity. Reduced lighting or sensor activated (e.g. proximity, photoelectric, or timers) lighting may be considered in areas which have minimal traffic throughput in the off-peak hours.
Version 1.0 30

GA Airport Security IP A-001
Appendix G – Security Procedures Template
GA Airport Security Procedures
(Airport Name)
(Original Publication Date)
(Date Last Revised)
Version 1.0 31

GA Airport Security IP A-001
Table of Contents Outline all of the sections of the document with corresponding page number for quick reference. Section I: Disclosure Statement / Security Responsibilities Distribution of these Security Procedures should be restricted to individuals with a legitimate need for access to them. Identify the individual who has the responsibility for the development, upkeep and administration of the Airport Security Procedures Section II: General Information
1. Forward
Identify the airport owner and the person(s) responsible for airport activities (e.g. State, county, authority, commission). 2. Introduction and Purpose
Provide a brief introduction that describes the purpose (what will it be used for) and the need (why was it created) for airport security procedures. 3. Distribution
You should list all individuals and agencies that will receive copies of the Airport Security Procedures.
Example: • State / Local Police Department • Fixed Base Operator • Individual Tenants 4. Name and Location of Airport
• Airport Name • Airport Address • Normal Business / 24-hour Emergency / Fax Phone Number • Airport Identifier • Proximity to nearest major city. List the city and provide a state location
map as an attachment. • Airport Geographical Coordinates: latitude, longitude, elevation.
5. Airport Activities
Version 1.0 32

GA Airport Security IP A-001
• Types of flight activities (e.g. flight school, State Police, corporate) • Hours of operation • Number of annual operations • Number of based aircraft
6. Airport Description
• Size: List the size of the airport in approximate acres or square miles. • Runways, Taxiways, Ramps: Identify runways and their dimensions,
taxiways, and ramp areas: Provide an airport layout plan / diagram as an attachment.
• Buildings: o List the number and types of buildings (offices, hangars,
maintenance shops). o List the primary tenants for each of the buildings.
• Airport Tenants: o List hours of operation o List primary and emergency contact information
• Other Airport Facilities
7. Emergency Phone Numbers:
List all appropriate emergency contact numbers. Include point of contact names and office hours of operation as appropriate (e.g. FSD, alternate contacts).
• All Emergencies 911 • State Police (non-emergency) • Local Police (non-emergency) • Local Fire Department • Airport Director (24 hour contact) • Airport Facility Supervisor (pager) • State / Local Aviation Official • Federal Bureau of Investigation Local Field Office • FAA Flight Standards District Office (FSDO) • TSA Airport Watch Hot-Line 866-427-3287 • Local TSA Federal Security Director
Version 1.0 33

GA Airport Security IP A-001
Section III: Definitions and Terms It may be useful to include a list of frequently used terminology to enhance clarity within the document. Section IV: Administration
1. Airport Operator: List who operates the airport.
2. Individual responsible for airport security
List the responsibilities of this individual. These duties may include:
Timely provision of evidence of security measure compliance as may be requested.
•
•
•
•
•
•
•
Maintaining a complete and current list of all individuals with airport access. Maintaining documentation of all training provided in accordance with any current Airport Security Procedures. Maintaining and updating the Airport Security Procedures to reflect the current state of conditions at the airport. Timely distribution of the Airport Security Procedures or specific parts thereof, to appropriate persons or entities. Proper dissemination of all correspondence or other communications with airport tenants and others on security related matters. Daily oversight of security provisions at the airport and ensuring compliance with the Security Procedures.
Section V: Aircraft Movement Area / Security Control
1. Aircraft Movement Area Describe any area that may be used for landing, take-off, and surface maneuvering of aircraft including all intermediate unpaved sections of the airfield encompassed on the airport property. You should also include a map or diagram as an attachment.
2. Describe any perimeter barriers or access controls such as:
Fencing • • • • •
Gates Access Control System Airport Locks Key Control System
Version 1.0 34

GA Airport Security IP A-001
Section VI: Airport Security Procedures Describe any Airport Security Procedures such as:
Aircraft security requirements • • • •
Pedestrian/vehicle access Challenge procedures Reporting of suspicious behavior
Section VII: Airport Emergency Grid Map
Airport operators may also wish to consider creating an emergency locator map. The map should identify all relevant areas of the airport on a grid map such as:
• Runways • Ramp areas • Fence line • Gates • Automobile parking areas • Hydrants • Emergency shelters • Buildings • Hazardous materials sites
This map should be provided to emergency response personnel (fire, EMS, etc.) and law enforcement as well as airport personnel.
Section VIII: Identification of Airport Personnel
Describe any personnel identification methods/systems and the procedures for those that are currently in use. Such as:
• Airport-issued identification badge(s) or card(s) • Identification Badge / Card application procedures • Other acceptable forms of identification • Accountability of lost/stolen identification badges / cards • Temporary airport identification badges / cards • Uniforms which display logo or other identifiable markings
Section IX: Identification of Vehicles
Describe what methods/systems are used to identify authorized vehicles in the air operations area. The following are examples of methods to identify authorized vehicles:
Version 1.0 35
GA Airport Security IP A-001
• Special paint schemes or markings • Decal in a specified location on the vehicle • Hang tags
Section X: Law Enforcement
Describe any agreement(s) and responsibilities that the airport owner/operator(s) may have with law enforcement agencies to provide support, traffic control, police patrols and any emergency responses. Include any written agreements as attachments to the Airport Security Procedures. Also include any methods or systems used (e.g. radios, communications channels, etc.) to directly communicate with law enforcement personnel.
Section XI: Special Events
Describe any procedures that exist for special events such as:
• Air shows • VIP Visits • Events that result in unusual numbers of people on the airport.
Section XII: Increased Security Threats
Describe how security measures are implemented in accordance with the raising and lowering of the Homeland Security Advisory System as described in this Information Publication in Section 3.5.2.
Section XIII: Aviation Security Contingency Plans
Identify and describe all contingency plans and procedures established for security incidents such as:
• Bomb Threats (Bomb Threat Checklist is provided as an example) • Civil Disturbances & Crowd Control • Air Piracy (Hijacking) Actual or Attempted • Suspicious/Unidentified Items
Version 1.0 36
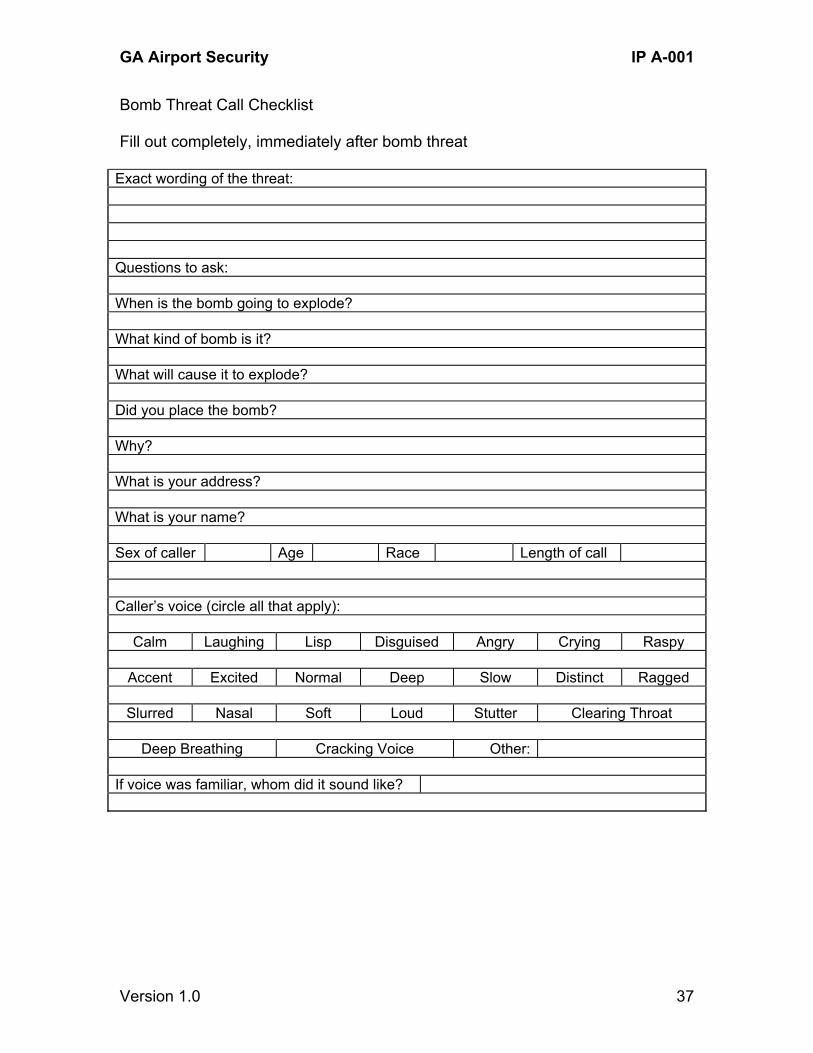
GA Airport Security IP A-001
Bomb Threat Call Checklist Fill out completely, immediately after bomb threat
Exact wording of the threat: Questions to ask: When is the bomb going to explode? What kind of bomb is it? What will cause it to explode? Did you place the bomb? Why? What is your address? What is your name? Sex of caller Age Race Length of call Caller’s voice (circle all that apply):
Calm Laughing Lisp Disguised Angry Crying Raspy
Accent Excited Normal Deep Slow Distinct Ragged
Slurred Nasal Soft Loud Stutter Clearing Throat
Deep Breathing Cracking Voice Other: If voice was familiar, whom did it sound like?
Version 1.0 37

GA Airport Security IP A-001
Background Sounds (Circle all that apply):
Street Noises House Noises Factory Motor Machinery
Long Distance Voice Office Animal Noises Clear
Music Static P.A. System Other: Threat Language (circle all that apply):
Well Spoken Foul Incoherent Educated Irrational Message delivered by:
Recording Threat maker
Remarks: REPORT CALL IMMEDIATELY TO 911 Person who received the call Phone Position
Version 1.0 38

GA Airport Security IP A-001
Appendix H - Bibliography This document provides numerous references and citations to other government and industry sources. These are not intended to be modified by this document in any way, and are generally intended to refer to the most current version of such external resources, to which the reader should go for detailed information.
FAA Advisory Circulars The latest issuance of the following advisory circulars may be obtained from the Department of Transportation, Utilization and Storage Section, M-443.2, Washington, D.C. 20590: [Also see the FAA internet web site at www.faa.gov]
1. 00-2, Advisory Circular Checklist - Contains a listing of all current advisory circulars.
2. 107-1, Aviation Security-Airports - Provides guidance and recommendations for establishing and improving airport security.*
3. 108-1, Air Carrier Security. Provides information and guidance on the implementation of Airplane Operator Security.*
4. 109-1, Aviation Security Acceptance and Handling Procedures-Indirect Air Carrier Security. Provides guidance and information for use by indirect aircraft operators when accepting and handling property to be carried by aircraft operators or by the operator of any civil aircraft for transportation in air commerce.*
5. 129-3, Foreign Air Carrier Security. Provides information and guidance on the implementation foreign air carrier security.*
6. 150/5200-31A, Airport Emergency Plan 7. 150/5300-13, Airport Design 8. 150/5360-13, Planning and Design Guidelines for Airport Terminal
Facilities. Furnishes guidance material for the planning and design of airport terminal buildings and related facilities.
9. 150/5370-10, Standards for Specifying Construction of Airports * - On November 19, 2001, Congress enacted the Aviation and Transportation Security Act (ATSA), Public Law 107–71, 115 Stat. 597, which established the TSA. Pursuant to ATSA, the TSA became responsible for security in all modes of transportation, including civil aviation under Chapter 449 of title 49, United States Code, related research and development activities, and other transportation security functions exercised by DOT. Consequently 14 CFR parts 107, 108, 109, and certain provisions of part 129 were removed and transferred into the relevant parts of 49 CFR 1542, 1544, 1548, and 1546 respectively. While the materials referenced here are related to superceded regulations, they may still provide relevant information and have therefore been included.
Version 1.0 39

GA Airport Security IP A-001
U.S. Government Regulations The TSA issues and administers Transportation Security Regulations (TSRs), which are codified in Title 49 of the Code of Federal Regulations (CFR), Chapter XII, parts 1500 through 1699. Many TSRs are former rules of the Federal Aviation Administration (FAA) that were transferred to TSA when TSA assumed FAA’s civil aviation security function on February 17, 2002. [All of these regulations can be found at http://www.tsa.gov/]. It should be clearly noted that these regulations pertain mainly to regulated entities and not typically to GA operators or facilities and are provided for reference and informational purposes only.
1. 49 CFR Part 1540 Civil Aviation Security: General Rules - This part contains rules that cover all segments of civil aviation security. It contains definitions that apply to Subchapter C, and it contains rules that apply to passengers, aviation employees, and other individuals and persons related to civil aviation security, including airport operators, aircraft operators, and foreign air carriers.
2. 49 CFR Part 1542 Airport Security - This Part requires airport operators to adopt and carry out a security program approved by TSA. It describes requirements for security programs, including establishing secured areas, air operations areas, security identification display areas, and access control systems. This Part also contains requirements for fingerprint based criminal history record checks of specified individuals. This part describes the requirements related to Security Directives issued to airport operators.
3. 49 CFR Part 1544 Aircraft Operator Security: Air Carriers and Commercial Operators - This Part applies to certain aircraft operators holding operating certificates for scheduled passenger operations, public charter passenger operations, private charter passenger operations, and other aircraft operators. This Part requires such operators to adopt and carry out a security program approved by TSA. It contains requirements for screening of passengers and property. This Part also describes requirements applicable to law enforcement officers flying armed aboard an aircraft, as well as requirements for fingerprint based criminal history record checks of specified individuals. This Part describes the requirements related to Security Directives issued to aircraft operators.
4. 49 CFR Part 1550 Aircraft Security Under General Operating and Flight Rules - This part applies to the operation of aircraft for which there are no security requirements in other Parts of Chapter XII, including general aviation aircraft.
Other Reports 1. Recommended Security Guidelines for Airport Planning, Design and
Construction, DOT/FAA/AR-00/52, Federal Aviation Administration, June 2001.
Version 1.0 40

GA Airport Security IP A-001
2. Report of the GA Airports Security Working Group, Aviation Security Advisory Committee, October 1, 2003.
3. GA Airport Security Task Force Recommendations, American Association of Airport Executives, June 2002.
4. GA Security, National Association of State Aviation Officials, December 2002.
Version 1.0 41

GA Airport Security IP A-001
Appendix I – Useful Websites
Aviation Trade Associations Organization Website
Aircraft Owners and Pilots Association www.aopa.org Airports Consultants Council www.acconline.org American Association of Airport Executives
www.aaae.com
Experimental Aircraft Association www.eaa.org GA Manufacturers Association www.gama.aero Helicopter Association International www.rotor.com National Agricultural Aircraft Association
www.agaviation.org
National Air Transportation Association www.nata-online.org National Association of State Aviation Officials
www.nasao.org
National Business Aviation Association www.nbaa.org United States Parachute Association www.uspa.org
Federal Government Organization Website
Department of Homeland Security www.dhs.gov Federal Aviation Administration www.faa.gov Federal Bureau of Investigation www.fbi.gov Transportation Security Administration www.tsa.gov
Other References Organization Website
ASIS International (Industrial security organization)
www.asisonline.org
Aviation Crime Prevention Institute www.acpi.org Chain Link Fence Manufacturers Institute
http://codewriters.com/asites/main-pub.cfm?usr=clfma
Version 1.0 42

Albert Whitted Blue Ribbon Task Force Recommendations Appendix F March 2006
ALBERT WHITTED AIRPORT PROPOSED DEVELOPMENT
AIRPORT DEVELOPMENT
Facilities Task Force Recommendation The LPA Group Incorporated Recommendation
Terminal Building
Build Intermodal GA Terminal of approximately 10,000 SF in the northwest corner of the airport with 14,000 SY of ramp space adjacent to the terminal for aircraft parking.
� Construct 10,600 SF Intermodal Terminal in the northwest corner of the airfield, adjacent to Runway 6, with 7,600 SY of ramp space adjacent to the terminal for aircraft parking.
Runways SPG should retain its present two runway configuration with current lengths or longer. The airport should be fully compatible with the planned Small Aircraft Transportation System (SATS). Runway 6-24 should take into consideration SATS as it pertains to corporate/air taxi operations, safety area standardization, noise relief, north/south non-movement areas, and compatibility with future USFSP expansion. Runway 18-36 safety areas should be brought into compliance with current FAA Standards.
� Maintain existing runway lengths � Improve Runway Safety Areas off of Runway 24,
18, and 36. � Runway improvements standardize safety area,
provide some noise relief and are compatible with future USFSP expansion.
� Meets SATs requirements for corporate use. Evaluated SATS for Air Taxi, but technology still too new to apply Part 135 requirements. Consideration of SATS under Part 135 still being evaluated by FAA FSDO and Airport District Office Washington – National Planning.
Hangars Multiple aircraft storage hangars should be built in proximity to the new terminal. In order to help the Airport to be more self-sufficient, the maximum number of “T” hangars and corporate hangars that can be accommodated should be built as soon as possible. Number of hangars built and construction commencement should coincide with market demand.
� One corporate hangar built south of IGAC terminal. Additional T-Hangar, Box, Corporate and/or Clearspan hangars are provided based upon market demand.
� Additional hangars recommended North and south of Taxiway C and south of Taxiway A.
The Task Force recommends that any hangars intended to be placed on or near any public roadway be positioned such that the hangar doors face inward into the Airport and be designed with conventional construction materials and the portion of the hangar facility, which faces the public roadway, be designed as retail, office or other similar space which is allowed by the IG zoning designation.
� Hangars located adjacent to Terminal and public roads will be constructed to look like or be used as office space with hangar doors facing inward into the Airport and apron areas.
The Task Force recommends that applications be prepared and submitted such that Hangar #1 and the attached office side wings can be designated as a nationally registered historic building, and possible use as a museum and/or educational center.
� Hangar #1 is being refurbished and registered as a nationally historic building. Due to limited hangar space, will continue to be used for hangar facilities and side wings will be refurbished to provide additional office space to interested tenants
Control Tower A new Air Traffic Control Tower must be built. � New ATCT shown on east of existing tower.

Albert Whitted Blue Ribbon Task Force Recommendations Appendix F March 2006
ALBERT WHITTED AIRPORT PROPOSED DEVELOPMENT
MISCELLANEOUS IMPROVEMENTS
Facilities Task Force Recommendation The LPA Group Incorporated Recommendation
Seawall Repair
The Seawall around the Airport needs to be repaired.
� As part of RSA improvements, recommend that Seawall around the airport be repaired. Cost estimate for seawall repair included in cost estimates and financial analysis.
Automobile Parking
Incorporate new design to the parking lot in the southwest corner of the airfield as expeditiously as possible.
� Due to additional parking provided in conjunction with new hangar development, southwest parking area reoriented and fenceline relocated to allow aircraft tie-downs. Automobile parking exceeds existing and anticipated demand.
Airport Perimeter Road
Build a perimeter road along the western boundary of the Airport to connect the north side to the south side.
� Master Plan evaluated connectivity of adding internal perimeter road along western boundary of airfield. Perimeter road recommended as part of master plan development.
Self-Fueling Facility In the master plan process,
recommend planners designate a location for a self-contained, self- service fuel facility in the even market conditions are favorable.
� Based upon market demand, self-service fuel facility recommended adjacent to T-hangars and existing fuel farm south of Taxiway C.

Albert Whitted Blue Ribbon Task Force Recommendations Appendix F March 2006
ALBERT WHITTED AIRPORT PROPOSED DEVELOPMENT
NORTH PROPERTY
Facilities Task Force Recommendation The LPA Group Incorporated Recommendation
Dali Museum Endorse the development of a new Dali Museum building on a portion of the Bayfront Center site.
� Master Plan only evaluated adjacent land use based upon impact to airport. Note, development adjacent to airport was based upon City referendums and acceptance by the public.
Airport Property Line The Task Force recommends that the City re-
designate the north Airport Layout Plan property line to a functional boundary as needed for future Airport development. City should provide funding for future Airport improvements in an amount equal to the fair market value of excess property beyond the functional Airport boundary, in accordance with FAA standards, with funds to be used to match Florida Department of Transportation (FDOT) grants for future Airport capital projects.
� The master plan recommends shifting the functional boundary south of Bayshore Blvd to coincide with Terminal Building development. Recommend that City provide Airport with Fair Market Value for property.
Joint-use Parking The Task Force recommends that the new Airport
buildings built along the northern airport property line share the Bayfront Center parking lots and the existing parking structure with the Mahaffey Theater and Dali Museum. A third level to the existing two level Bayfront Center parking garage should be considered when additional parking is necessary.
� Master Plan evaluated parking needed to meet twenty-year demand. Combined parking was considered; however, decision is to be made by City of St. Petersburg.
Park That a park to be named “Albert Whitted Park” be
created on the northside waterfront of the Airport in Lot 51. The proposed park should be of adequate size to accommodate the needs of citizens and should not infringe on the aviation requirements of the Airport. The City should consider expanding the park by using dredge and fill material to relocate the seawall further north. The park could include, for example, the following features: aviation-themed playground equipment, Veteran’s Memorial Display, bike/jogging paths, outdoor concert facilities, a dog park, multi-purpose sports field, and temporary boat dockage.
� Evaluated park as compatible land use on area north of the existing property line. However, use as outdoor concert facility may have security impacts to the Airport. Benefits of turning Lot 51 into a park may provide alternate stormwater location and allow additional areas of the airport to be developed.

Albert Whitted Blue Ribbon Task Force Recommendations Appendix F March 2006
ALBERT WHITTED AIRPORT PROPOSED DEVELOPMENT
PUBLIC ACCESSIBILITY
Facilities Task Force Recommendation The LPA Group Incorporated Recommendation
Public Transportation As the City develops the Airport, further consideration should be given to improving public accessibility. The City should pursue, in conjunction with PSTA, the expansion of the downtown Looper Service to the Airport/Port area.
� The LPA Group provided a cursory examination of public access to the Airport based upon anticipated demand. Note, use or expansion of the Looper Service is beyond the scope of the Master Plan process.
Street Access The Task Force recommends that
the Airport Master Plan consider narrowing and/or closing the road east of the Bayfront Center and south of the Bayfront Center to create additional land for the Airport and greenspace for the waterfront park. That 1st street S. should be changed to a two-way roadway, thus allowing improved access from downtown to the new Airport improvements. The Task force recommends that the two roads surrounding Albert Whitted Airport be renamed and identified with appropriate honorary signage as follows:
� 1st Street South and Benoist Boulevard
� The entrance leading into the parking lot and main entrance into the new terminal building be called “Albert Whitted Way”.
� Landside access to Airport facilities were evaluated but ultimate development off airport property is the domain of the City of St. Petersburg.
Albert Whitted Blue Ribbon Task Force Recommendations Appendix F March 2006
ALBERT WHITTED AIRPORT PROPOSED DEVELOPMENT
FINANCE
Facilities Task Force Recommendation The LPA Group Incorporated Recommendation
Funding The Task Force recommends that the Mayor and City Council exert all efforts as expeditiously as possible to locate, apply for, and secure all possible grants low interest loans, matching funds, etc., to assist in the funding of the improvements to Albert Whitted Airport. Capital improvement funding sources should include, but not necessarily be limited to, the following:
� Federal Funding - FAA (AIP and F&E Grants) Vision 100 - Line item appropriation for a new control
tower - U.S. Army Corps of Engineers for
seawall/Shoreline work (runway improvements)
� State Funding - FDOT (Planning, improvements and
economic development) - FDOT intermodal grants - DEP – possibly for park
enhancements/Bike Trails � Local/Sponsor (City)
- Bonds (general obligation/revenue) - Cash from sale of Airport land (ALP re-
allocation) - Sales Tax - Ad valoreum tax (increase in millage rate
designated to airport) � Private
- Possibly for hangar construction in the event lease terms are of a sufficient length. This type of funding should be a back-up to grants.
� Funding considerations evaluated in Cost Estimates (Chapter 9) and Financial Analysis (Chapter 10). Anticipate that for specific projects, Airport will obtain 95%, 2.5% and 2.5% funding from Federal, State and local sources through 2008 where federal funding will revert back to 90%. Hangar development and other revenue generating development may include funding from other sources (both public and private).

Albert Whitted Blue Ribbon Task Force Recommendations Appendix F March 2006
ALBERT WHITTED AIRPORT PROPOSED DEVELOPMENT
AIRPORT POLICIES
Facilities Task Force Recommendation The LPA Group Incorporated Recommendation
Leases Recommend that City Council place a referendum question on the November ballot increasing the maximum lease term at Albert Whitted Airport under the City Charter from 10 to 25 years.
� Out of the scope of the Master Plan Update.
Priority should be given to aviation related businesses except when non-aviation related uses are compatible with the approved Airport Master Plan.
� Out of the scope of the Master Plan Update.
Building Criteria
The Task Force recommends that the City encourage all future Airport designers, architects, engineers, planners, City staff, etc., to redevelop the Airport to its highest and best use for aviation; to determine the actual maximum buildable areas on Airport property, to include maximizing potential building heights, maximizing Floor Area Ratios (FAR); and using fire walls to create single, connected buildings without expanses of land in between buildings. A new building development should be designed in such a way to give an overall and consistent appearance to all airport improvements. The Airport shall be designed to be highly efficient with the use of every square foot of land.
� As per the Task Force recommendations, LPA evaluated redevelopment of the Airport to its highest and best use given available airport property. We considered all building and separation requirements while providing cost effective and efficient land use.
The Task Force recommends that all required retention/detention facilities be located outside of any delineated “buildable areas” transient aircraft parking area and burrowing owl habitat.
� LPA evaluated all potential buildable area for transient and based aircraft parking. Burrowing owl habitat was considered as well as stormwater retention.
Timing The Task Force recommends any and all studies be
performed as soon as possible, including but not limited to dredge and fill for runway improvements into Tampa Bay, general aviation needs, FAA runway safety requirements, proposed parkland along the south yacht basin, etc. And that this include all permitting agencies of local, state, and federal departments, and that all costs, time lines mitigation requirements and the like be determined as soon as possible and published to the community at large.
� The phasing of necessary studies associated with future airport development was addressed in Chapter 9 (Cost Estimates) and Chapter 10 (Financial Evaluation) of the master plan update.
The Task Force recommends that the Mayor and City Council exert all possible efforts to redevelop, remodel, where appropriate and or improve Albert Whitted Airport with all possible haste. Those recommendations, which can be performed simultaneously, be done simultaneously in order to save time.
� LPA GROUP recommendation for project phasing performed during the Cost Estimate and Financial Analysis of the Master Plan Update.

Albert Whitted Blue Ribbon Task Force Recommendations Appendix F March 2006
ALBERT WHITTED AIRPORT PROPOSED DEVELOPMENT
AIRPORT POLICIES
Facilities Task Force Recommendation The LPA Group Incorporated Recommendation
The Task Force recommends that the Mayor and City Council send out a published schedule of dates and deadlines for the completion of specific phases of redevelopment at Albert Whitted Airport (i.e. consideration of any studies, study of runway improvements, mitigation, permitting, master planning, and architectural/engineering drawing times.)
� LPA GROUP recommendation for project phasing performed during the implementation chapters of the Master Plan Update.
Management The Task Force recommends that the City consider managing the Airport facilities to encourage use of the facility in keeping with the concept that Albert Whitted Airport is a facility supporting aviation and local participation in aviation.
� Beyond the consultant scope for MPU.
The Task Force recommends that the City conduct a thorough third party rental analysis to set rental rates for hangars and facilities at fair market value.
� Beyond the consultant scope for MPU.
Advisory Committee
The Task Force recommends that the Mayor and City Council establish an ongoing Airport Committee to give advice and make recommendations to the Mayor and City Council. The membership of this committee should not exceed seven.
� Beyond the consultant scope for MPU.
The Task Force recommends that members of the Design Committee serve on the Technical Advisory Committee (TAC) for the Master Plan Update.
� Beyond the consultant scope for MPU.
Grand Prix The Task Force recommends that all consideration be given
to incorporating the Grand Prix of St. Petersburg into any future design(s) of Albert Whitted Airport. The Airport Master Planner should consider designing the Airport Master Plan in conjunction with Grand Prix of St. Petersburg organizers in order to get the raceway and raceway support facilities correct.
� As part of airfield and landside alternative development, the existing Grand Prix of St. Petersburg racetrack was considered in developing compatible airport development.

Albert Whitted Blue Ribbon Task Force Recommendations Appendix F March 2006
ALBERT WHITTED AIRPORT PROPOSED DEVELOPMENT
STUDIES/SURVEYS
Facilities Task Force Recommendation The LPA Group Incorporated Recommendation
Dredge/Fill The Task Force recommends that the City notify the U.S. Army Corps of Engineers, and any other affected agencies, of the City’s potential need for fill material for a potential improvement of Runways 6/24 and 18/36. Any dredge fill (potentially coming from the channel dredging in Tampa Bay) relocated for City use at and for the Airport shall be part of any mitigation negotiations with local, state and federal agencies.
� LPA considered the estimated amount and order of magnitude cost associated with Dredge and Fill during the Chapter 9 and 10, Cost Estimates and Financial Analysis.
� Exact cost estimates will be provided during the initial the Runway Safety Area analysis and first phase of EA
Business/ Marketing Plans
The Task Force recommends that the City develop a Comprehensive Business Plan for the Airport in conjunction with the Master Plan Update.
� Beyond the consultant scope for MPU.
The Task Force recommends that the City develop a Comprehensive Marketing Plan for the Airport. Consideration should be given to coordinating marketing plans for the Airport with other city facilities, including the Dali Museum, The Pier and Tropicana Field.
� Beyond the consultant scope for MPU.
Land Survey The Task Force recommends that the City perform a full and
complete land survey of all Airport property, including but not limited to, surrounding roads, utilities, on-site buildings, FEMA requirements, structures, fueling facilities and the like, landscaping, easements, as well as surrounding zoning, land use designations and actual land uses by individual buildings.
� Beyond the scope of the master plan update.

Albert Whitted Blue Ribbon Task Force Recommendations Appendix F March 2006
ALBERT WHITTED AIRPORT PROPOSED DEVELOPMENT
STUDIES/SURVEYS
Facilities Task Force Recommendation The LPA Group Incorporated Recommendation
Environmental Audit
The Task Force recommends that the City perform an environmental audit for all proposed building sites to determine the extent, if any, of any site contamination. The Study should include expert cost estimates to remediate all found contamination.
� As part of future airport development, the master plan recommends that an environmental assessment be performed.
� Cost and timing of proposed project will be detailed in Chapter 9.
Utility Study The Task Force recommends that a complete study be
performed on all underground and overhead utilities at Albert Whitted Airport to segregate which utilities can be repositioned or eliminated from those utilities which can not be reasonably modified and, therefore, remain as is. Further, the Task Force recommends that the associated easements attached to such utilities be studied to determine which, if any, can be reduced in size in order to facilitate building and site development.
� LPA provided a cursory evaluation of existing utilities on airport in order to provide data on future airport development and cost estimates. Both discussed in Chapter 9 and 10.
The City should prepare a Master Plan for the entire area to include Airport, Bayfront Center/Dali Museum, Lot 51 Park, Progress Energy Park, USF SP, FMRI, Port and Coast Guard Facilities.
� LPA provided the City with proposed development of the Airport in relation to existing and future demand as well as potential impacts of adjacent property development.

Albert Whitted Blue Ribbon Task Force Recommendations Appendix F March 2006
ALBERT WHITTED BLUE RIBBON TASK FORCE AIRPORT DEVELOPMENT RECOMMENDATIONS
RECOMMENDED IMPROVEMENT POTENTIAL FUNDING SOURCES PHASING
FEDERAL STATE LOCAL OTHER AIRPORT IMPROVEMENTS Construct Intermodal General Aviation Terminal
X X Short-Term
FBO/Midsize Hangars X X X X Short-Term 10,000 SY Ramp X X X Short-Term Construct New Air Traffic Control Tower X X Short-Term Construct Internal Circulation Road (Phase I) X X X Short-Term Construct Clearspan Hangar Adjacent to Hangar 1
X X Short-Term
Refurbish Hangar 1 X X X Short-Term Repair Seawall X X X Short-Term STUDIES/SURVEYS Perform Land Survey X X X Short-Term Perform Environmental Audit X X X Short-Term Perform Study of Underground and Overhead Utilities X X X Short-Term Dredge and Fill Runway Improvement Study
X X X Short-Term General Aviation Need Study
X X X Short-Term FAA Runway Safety Requirement Study
X X X Short-Term Conduct third-party rental analysis study
X Short-Term Comprehensive Airport Marketing Plan X X Short-Term AIRPORT IMPROVEMENTS Construct Aircraft Storage Hangars Mid-Term Construct 50 T-Hangars X X X Mid-Term Construct 3 Conventional Hangars X X X X Mid-Term Construct 4 Corporate Hangars X X X Mid-Term Standardize Runway 18-36 Safety Areas X X X Mid-Term Design and Construct self-contained, self-service fuel facility. X X Mid-Term Notes: Short Term = 2004-2009; Mid-Term = 2010-2014; Long-Term = 2015-2024

Albert Whitted Blue Ribbon Task Force Recommendations Appendix F March 2006
ALBERT WHITTED MASTER PLAN UPDATE
AIRPORT DEVELOPMENT RECOMMENDATIONS
RECOMMENDED IMPROVEMENT POTENTIAL FUNDING SOURCES PHASING FEDERAL STATE LOCAL OTHER
AIRPORT IMPROVEMENTS Construct Intermodal General Aviation Terminal and construct 7,600+ SY Terminal Apron
X X Short-Term
Relocated Helipads X X X Short-Term Construct New Air Traffic Control Tower and relocate ASOS
X X X Short-Term
Construct 10,600 SY Tie-Down Apron X X X Short-Term Construct/Extend Taxiway D X X X Short-Term Construct Run-up pads on Runway 6 and 24 X X X Short-Term Install new GA Security Requirements X Short-Term Rehabilitate Hangars #1, #5,#6, #7 and #8 X X X Short-Term Refurbish T-Hangars X X X X Short-Term 10,000 SY Tie-Down Ramp X X X Short-Term Construct 10,000 Clearspan Hangar X X Short-Term Construct Internal Circulation Road X X X Short-Term Repair Seawall X X X Short-Term RSA Upgrades-Design and Construction X X X Short-Term Construct Walls around RSA for Runway 18 and 24
X X X Short-Term
Construct 6-Box Hangars south of Taxiway C X X X Short-Term Non-Precision approach to Runway 6 X Short-Term Relocate fenceline west of Hangar 1 and install 10 Tie-Downs X X X X Short-Term STUDIES/SURVEYS Perform Land Survey X X X Short-Term Perform RSA Analysis/Environmental Audit X X X Short-Term Perform Study of Underground and Overhead Utilities
X X X Short-Term
Dredge and Fill Runway Improvement Study X X X Short-Term General Aviation Need Study X X X Short-Term FAA Runway Safety Requirement Study X X X Short-Term
Conduct third-party rental analysis study X Short-Term Comprehensive Airport Marketing Plan X X Short-Term

Albert Whitted Blue Ribbon Task Force Recommendations Appendix F March 2006
ALBERT WHITTED MASTER PLAN UPDATE
AIRPORT DEVELOPMENT RECOMMENDATIONS (Continued)
RECOMMENDED IMPROVEMENT POTENTIAL FUNDING SOURCES FEDERAL STATE LOCAL OTHER PHASE AIRPORT IMPROVEMENTS Construct Aircraft Storage Hangars: Construct 7-Box Hangars south of T-Hangars X X X X Mid-Term Standardize Runway 18-36 Safety Areas X X X Mid-Term Design and Construct self-contained, self-service fuel facility. X X Mid-Term Expand Tie-down Apron north of Taxiway D X X X Mid-Term FBO/Midsize Hangar adjacent to Terminal X X X Mid-Term Install REILs Mid-Term Mark Displaced Threshold – Runway 36 and extend Runway 18 to maintain runway length X X X Mid-Term Construct Run-up areas on Runways 18 and 24 X X X Mid-Term Narrow and remove Pavement, relocate lighting and upgrade markings – Runway 18-36 X X X Mid-Term AIRPORT IMPROVEMENTS Construct Hangar Storage:
Construct 7 box Hangars south of Taxiway C X X X X Long-Term Construct clearspan hangars north of Taxiway C X X X Long-Term Construct multi-level hangar or refurbish T-Hangars X X X Long-Term Construct 10,000 SF Clearspan Hangar on Former Hangar #3 location X X X Long-Term
Rehabilitate Airfield Pavements X X X Long-Term STUDIES/SURVEYS Master Plan Update X X X Long-Term Notes: Short Term = 2004-2009; Mid-Term = 2010-2014; Long-Term = 2015-2024
Page 1 of 8
City of St. PetersburgDevelopment Services
CHAPTER 16 - ARTICLE XIVALBERT WHITTED AIRPORT
ZONING ORDINANCE*
Sec. 16-1046. Title.
This article shall be known and may be cited as "Albert Whitted Airport Zoning Ordinance."
Sec. 16-1047. Definitions.
The following words, terms and phrases, when used in this article, shall have the meanings ascribed to them inthis section, except where the context clearly indicates a different meaning:
Administrative official means the Mayor, or the official or department designated by the Mayor.
Airport means the Albert Whitted Airport.
Airport elevation means the established elevation of the highest point on the usable landing area in feet abovemean sea level. (AMSL).
Airport hazard means any structure or tree or use of land which would exceed the federal obstruction standardscontained in 14 CFR 77.21 (scope), 77.23 (standards for determining obstruction) and 77.25 (civil airportimaginary surface), and which obstructs the airspace required for the flight of aircraft in taking-off, maneuveringor landing at the airport or is otherwise hazardous to such take-off maneuvering or landing.
Airport Noise Impact Zone means area around the airport measuring one-half the length of the longest runwayon either side of and at the end of each runway centerline.
Airport reference point means the point established as the approximate geographic center of the airport landingarea and so designated.
Board of Adjustment means a board consisting of the members of the Zoning Board of Adjustment appointedin accordance with the terms of chapter 29.
Decision height means the height at which a pilot must decide, during an instrument landing system (ILS)approach, to either continue the approach or to execute a missed approach.
Height, for the purpose of determining the height limits in all zones set forth in this article and shown on thezoning map, means the mean sea level elevation datum unless otherwise specified.
Landing area means the area of the airport used for the landing, takeoff or taxiing of aircraft.
Minimum descent altitude (MDA) means the lowest AMSL altitude to which descent is authorized on finalapproach or during circling-to-land maneuvering in execution of a standard instrument approach procedure

City of St. Petersburg Article XIVCity Code, Chapter 16 Albert Whitted Airport
Page 2 of 8
(SIAP) where electronic glide slope is not provided.
Minimum enroute altitude (MEA) means the lowest published altitude between radio fixes that assures acceptablenavigational signal coverage and meets obstruction clearance requirements between those fixes.
Minimum obstruction clearance altitude (MOCA) means the lowest published altitude between radio fixes onfederal VOR airways, off-airway routes or route segments that meets obstruction clearance requirements for theentire route segment and assures acceptable navigational signal coverage only within 22 miles of a VOR.
Minimum vectoring altitude (MVA) means the lowest AMSL altitude at which aircraft operating on instrumentflight rules (IFR) will be vectored by a radar controller, except when otherwise authorized for radar approaches,departures or missed approaches.
Nonconforming use means any structure, tree or use of land or water which is lawfully in existence at the timethe regulation is prescribed in this article or an amendment thereto becomes effective and which use does notthen meet the requirements of such regulation.
Nonstandard take-off minimums means conditions of existing weather required for take-off at an airport whichexceed the standards prescribed in Federal Aviation Regulations Part 91.
Obstruction means any existing or proposed manmade object or structure or object of natural growth or terrainthat violates the standards contained in 14 CFR 77.21, 77.23 and 77.25.
Person means an individual, firm, copartnership, corporation, company, association, joint stock association orbody politic and includes any trustee, receiver, assignee, administrator, executor, guardian or other similarrepresentative thereof.
Runway means the paved surface of an airport landing strip.
Structure means a non-natural object constructed, placed or installed, including but without limitation thereof,buildings, towers, smokestacks, construction cranes, utility poles and overhead transmission lines.
Tree includes any plant of the vegetable kingdom.
Sec. 16-1048. Notice of proposed construction or alteration.
The owner of any proposed construction or alteration of more than 200 feet in height above the ground levelat its site, or any proposed construction or alteration which exceeds a slope of 100 to 1 extending outward andupward for a horizontal distance of 20,000 feet from the nearest point of each runway from the Albert WhittedAirport shall comply with the provision of 77 CFR Subpart B, by filing a notice of construction or alteration withthe Federal Aviation Administration prior to the issuance of any building permit or consideration of any requestfor a variance to this article. The applicant shall submit documentation showing compliance with the federalrequirement for notification of proposed construction and a valid aeronautical evaluation.
Sec. 16-1049. Zones.
In order to carry out the provisions of this article, there are hereby created and established certain zones which

City of St. Petersburg Article XIVCity Code, Chapter 16 Albert Whitted Airport
Page 3 of 8
include all of the land and waters lying within the approach zones, transition zones, horizontal zone and conicalzone. Such area and zones are shown on the Albert Whitted Airport Zoning Map which is incorporated byreference herein as part of this article and is on file in the Office of the City Clerk. The various zones are herebyestablished and defined as follows:
(1) Primary zone. An area longitudinally centered on each runway, extending 200 feet beyond each endof that runway with a width of 500 feet on Runway 18-36 and 250 feet on Runway 6-24.
(2) Approach zones. An area longitudinally centered on the extended runway centerline and extendingoutward from the end of the primary zone. The inner edge of the approach zone is the same width asthe primary zone extending thereafter to a width of 2,000 feet for Runway 18-36 and 1,250 feet forRunway 6-24 at a distance of 5,000 feet from the edge of the primary zone.
(3) Transition zones. An area extending outward from the sides of each primary zone and approach zoneconnecting them to the horizontal zone.
(4) Horizontal zone. An area around the airport with an outer boundary the perimeter of which isconstructed by swinging arcs of a radii of 5,000 feet from the center of each end of the primary zoneof each runway and connecting the adjacent arcs by lines tangent to those arcs.
(5) Conical zone. A conical zone is hereby established as the area that commences at the periphery of thehorizontal zone and extends outward therefrom a distance of 4,000 feet. The conical zone does notinclude the instrument approach zones and transition zones.
Sec. 16-1050. Height limitations.
(a) Except as otherwise provided in this article, no structure or tree shall be erected, altered, allowedto grow or maintained in any zone created by this article to a height in excess of the height limit hereinestablished for such zone. Such height limitations are hereby established for each of the airport zones in questionas follows:
(1) Approach zones. One foot in height for each 20 feet in horizontal distance from the end of the primaryzone.
(2) Transition zones. One foot in height for each seven feet in horizontal distance from the adjoiningboundary of the primary or approach zone with the horizontal distance measured at right angles to therunway centerline and extended centerline, until the height matches the height of the horizontal zone.
(3) Horizontal zone. One hundred fifty feet above the airport elevation of a height of 5.8 feet above meansea level.
(4) Conical zone. One foot in height for each 20 feet of horizontal distance from the periphery of thehorizontal zone extending to a height of 350 feet above the airport elevation.
(5) Other restrictions. In addition to the height limitations imposed in subsections (1)—(4) above, nostructure or obstruction will be permitted within the City that would cause an MDA, MOCA, MVA or adecision height to be raised or which would impose either the establishment of restrictive minimum climb
City of St. Petersburg Article XIVCity Code, Chapter 16 Albert Whitted Airport
Page 4 of 8
gradients or nonstandard takeoff minimums, as determined by the Federal Aviation Administration inresponse to the filing of a notice of construction or alteration.
(b) Where an area is covered by more than one height limitation, the more restrictive limitation shallprevail.
(c) Nothing in this article shall be construed as prohibiting the growth, construction or maintenanceof any tree or structure to a height up to 35 feet above the surface of the land, except as defined in sections 16-1049(1), 16-1049(2), 16-1049(3), 16-1049(4), and 16-1049(5).
Sec. 16-1051. Use restrictions.
Notwithstanding any other provisions of this article, no use may be made of land or water within any zoneestablished by this article in such manner as to create electrical interference with radio communication betweenthe airport and aircraft, make it difficult for flyers to distinguish between airport lights and others, result in glarein the eyes of flyers using the airport, impair visibility in the vicinity of the airport or otherwise endanger thelanding, taking off or maneuvering of aircraft.
Sec. 16-1052. Nonconforming uses.
(a) Regulations not retroactive. The regulations prescribed by this article shall not be construed torequire the removal, lowering or other changes or alteration of any structure or tree not conforming to theregulations as of the effective date of this article, or otherwise interfere with the continuance of anynonconforming use. Nothing herein contained shall require any change in the construction, alteration orintended use of any structure, the construction or alteration of which was begun prior to the effective date of thisarticle, and is diligently prosecuted.
(b) Nonconforming uses abandoned or destroyed. Whenever the administrative official or designeedetermines that a nonconforming structure or tree has been abandoned, is more than 80 percent torn down,or is physically deteriorated or decayed, no permit shall be granted that would allow such structure or tree toexceed the applicable height limit or otherwise deviate from the provisions of this article.
(c) Marking and lighting. Notwithstanding the preceding provision of this section, the owner of anynonconforming structure or tree is hereby required to install, operate and maintain thereof such markers andlights as shall be deemed necessary by the City to indicate to the operators of aircraft in the vicinity of the airportthe presence of such airport obstructions. Such markers and lights shall be installed, operated and maintainedat the expense of the owner.
Sec. 16-1053. Variances.
(a) Variances. Any person desiring to erect or increase the height of any structure, or permit thegrowth of any tree, or use his property not in accordance with the regulations prescribed in this article or use hisproperty not in accordance with the regulations prescribed in this article, may apply to the Board of Adjustmentor the Environmental Development Commission (EDC) for a variance from such regulations. The EDC shall haveexclusive variance power for all applications involving a site or use which has received or which requires specialexception or site plan approval pursuant to chapter 29, also known as the zoning ordinance. The Board ofAdjustment shall have exclusive variance power for all other applications. At the time of filing, the applicant shall
City of St. Petersburg Article XIVCity Code, Chapter 16 Albert Whitted Airport
Page 5 of 8
forward a copy of the application for variance by certified mail return receipt requested to the Florida Departmentof Transportation (FDOT), Aviation Office. The Department shall have 45 days from receipt of the applicationto provide comments to the Board or EDC, after which time that right is waived. No application for a variancemay be considered unless the applicant shows that he has complied with the requirements of this section andsection 16-1048. No variance shall be approved solely on the basis that such proposed structure will not exceedfederal obstruction standards as contained in 14 C.F.R.ss. 77.21, 77.23, 77.25, 77.28, or 77.29, or otherfederal aviation regulation. Such variances shall be allowed where it is duly found that a literal application orenforcement of the regulations would result in practical difficulty or unnecessary hardship and the relief wouldnot be contrary to the public interest but will do substantial justice and be in accordance with the spirit of thisarticle. In determining whether to grant or deny a variance the Board Adjustment or EDC shall consider:
(1) The nature of the terrain and height of existing structures.
(2) Public and private interests and investments.
(3) The character of flying operations and planned developments of airports.
(4) Federal airways as designated by the Federal Aviation Administration that lie within the radii describedin section 16-1049.
(5) Whether the construction of the proposed structure would cause an increase in the minimum descentaltitude or the decision height at the affected airport.
(6) Technological advances.
(7) The safety of persons on the ground and in the air.
(8) Land use density.
(9) The safe and efficient use of navigable airspace.
(10) The cumulative effects on navigable airspace of all existing structures, proposed structures identified inthe applicable jurisdictions' comprehensive plans, and all other known proposed structures in the area.
(b) Obstruction marking and lighting. Any permit or variance granted shall as a specific condition,require the owner of the structure or tree in question to install, operate and maintain thereon such markers andlights as may be necessary to indicate to aircraft operators the presence of an airport obstruction. Such markingsand lighting shall conform to the specific standards established by chapter 14-60.009(6) Fla. AdministrativeCode, Rules of the Department of Transportation and Federal Aviation Administration Advisory CircularH70/7460-1, G (10/85).
Sec. 16-1053.1. Restrictions in Airport Noise Impact Area.
(a) Construction of any educational facility or residential construction shall not be permitted withinan Airport Noise Impact Area until such time as the City conducts a noise study and amends this section.
(b) Construction of any educational facility of a public or private school within an area extending five

City of St. Petersburg Article XIVCity Code, Chapter 16 Albert Whitted Airport
Page 6 of 8
miles along the runway centerline of the airport and which has a width measuring one-half the length of therunway shall be prohibited. Variances may be granted by the Board of Adjustment or the EnvironmentalDevelopment Commission following the procedures set forth in this article and only if findings are made settingforth how the public policy reasons outweigh the health and safety concerns which prohibit such construction.The continued use or adjacent expansion of existing structures or new structures for which a site has beendetermined as provided in FS 235.19. as of July 1, 1993 are excluded.
Sec. 16-1054. Enforcement.
It shall be the duty of the administrative official to administer and enforce the regulations prescribed in this article.Applications for permits and variances shall be made to the administrative official upon a form furnished by thatofficial. Applications required by this article to be submitted to the administrative official shall be promptlyconsidered and granted or denied. Applications for action by the Board of Adjustment or EDC shall betransmitted by the administrative official in accordance with the provisions of this article.
Sec. 16-1055. Board of Adjustment/EDC.
(a) The Board of Adjustment and the Environmental Development Commission (EDC) establishedby virtue of chapter 29, the zoning ordinance, shall have the authority:
(1) To hear and decide appeals from any order, requirement, decision or determination made by theadministrative official, in the enforcement of this article.
(2) To hear and decide variances to the terms of this article upon which such Board or EDC may be requiredto pass.
(b) The Board of Adjustment and EDC shall consist of the members of the Board of Adjustment orEDC appointed in accordance with the terms of chapter 29.
(c) The Board of Adjustment and EDC shall adopt rules for their governance and procedure inharmony with the provisions of this article. Meetings of the Board of Adjustment or EDC shall be held at the callof the Chair and at such other times as the Board of Adjustment or EDC may determine. The Chair, or if absentthe acting Chair, may administer oaths and compel the attendance of witnesses. All hearings of the Board ofAdjustment or EDC shall be public. The Board of Adjustment or EDC shall keep minutes of its proceedingsshowing the vote of each member upon each question, or, if absent or failing to vote, indicating such fact, andshall keep records of its examinations and other official actions, all of which shall immediately be filed in theOffice of the Board of Adjustment or EDC and shall be a public record.
(d) The concurring vote of a majority of the members of the Board of Adjustment or EDC shall besufficient to reverse any order, requirement, decision or determination of the administrative official or to decidein favor of the applicant on any matter upon which it is required to pass under this article, or to grant anyvariances pursuant to this article.
Sec. 16-1056. Appeals.
(a) Any person aggrieved, or any taxpayer affected, by any decision of the administrative officialmade in the administration of this article, if of the opinion that a decision of the administrative official is an

City of St. Petersburg Article XIVCity Code, Chapter 16 Albert Whitted Airport
Page 7 of 8
improper application of these regulations, may appeal to the Board of Adjustment or EDC.
(b) All appeals shall be brought within 30 days of an adverse ruling of the administrative official, byfiling with the administrative official a notice of appeal specifying the grounds thereof. The administrative officialwhose decision is being appealed shall forthwith transmit to the Board of Adjustment or EDC a copy of the noticeof appeal along with all documents constituting the record upon which the action appealed from was taken.
(c) An appeal shall stay all proceedings in furtherance of the action appealed from, unless theadministrative official certifies to the Board of Adjustment or EDC, after notice of appeal has been filed with it,that by reason of the facts stated in the certificate a stay would, in his opinion, cause imminent peril to life orproperty. In such cases, proceedings shall not be stayed otherwise than by an order of the Board of Adjustmentor EDC on notice to the agency from which the appeal is taken and on due cause shown.
(d) The Board of Adjustment or EDC shall fix a reasonable time for hearing appeals, give publicnotice and due notice to the parties in interest, and decide the same within a reasonable time.
(e) The Board of Adjustment or EDC shall comply with the notice procedures set forth in chapter 29pertaining to variances to the zoning code.
(f) The Board of Adjustment or EDC may, in conformity with the provisions of this article, reverse oraffirm wholly or partly, or modify the order, requirement, decision or determination appealed from and may makesuch order, requirement, decision or determination as ought to be made and to that end shall have all the powersof the administrative agency from which the appeal is taken.
Sec. 16-1057. Judicial review.
Any person aggrieved or affected by any decision of the Board of Adjustment or a decision of the EDC afterappeal to City Council may present to circuit court, in the circuit in which the decision occurs, a petition for theissuance of a writ of certiorari. Such petition shall be presented to the court in the manner and within the timeprovided by the Florida Appellate Rules of Procedure.
Sec. 16-1058. Penalties.
(a) Any person violating any of the provisions of this article, upon conviction in the County Court,shall be punished as provided in section 1-7.
(b) In addition to the provisions of subsection (a) of this section, the City may institute in any courtof competent jurisdiction an action to prevent, restrain, correct, or abate any violations of this article or of anyairport zoning regulation adopted under this article or of any order or ruling made in connection with theadministration or enforcement thereof seeking such relief, by way of injunction or otherwise, as may be properunder the facts and circumstances of the case.
Sec. 16-1059. Fees.
Application fees and appeal fees may be established by the City to cover the administration and material costof processing the applications and appeals. The administration and material costs of enforcement activities mayalso be assessed as determined by the City.

City of St. Petersburg Article XIVCity Code, Chapter 16 Albert Whitted Airport
Page 8 of 8
Sec. 16-1060. Conflicting regulations.
In the event of conflict between any airport zoning ordinance adopted under this article and any other regulationsapplicable to the same area, whether the conflict be with respect to the height of structure or trees, the use ofland, or any other matter, the more stringent limitation or requirement shall govern and prevail.
Sec. 16-1061. Severability.
If any of the provisions of this article or the application thereof to any person or circumstances is held invalid,such invalidity shall not affect other provisions or applications of the ordinance which can be given effect withoutthe invalid provision or application, and to this end the provisions of this article are declared to be severable.
Economic Benefit Analysis H-1 March 2006 Final Draft
AAAppppppeeennndddiiixxx HHH Economic Benefit Analysis INTRODUCTION As one of several aviation-related facilities in the Tampa Bay Region1, Albert Whitted Airport (SPG) is a viable economic contributor to the Florida economy. Although it is designated as a general aviation reliever airport, its role in the regional economy should not be underestimated. SPG, its tenants and users directly provide jobs, earnings and the production of goods and services that ripple throughout the economy. Expenditures by airport tenants, users and the airport itself for goods and services associated with both business and recreational activity further contribute to the economic vitality of the region. Thus, as part of this master plan update, the economic impact of SPG on the region was evaluated. Economic impacts were quantified by the amount of goods and services produced, earnings paid to households, and the number of jobs supported in the Florida economy as a result of activity associated with SPG. Economic impacts are identified in terms of primary and induced impacts. Primary impacts represent direct and indirect economic impacts attributable to business activity at the airport by its tenants and its users. Induced impacts represent the additional production, jobs and household earnings in the economy as a result of primary spending by the Airport. Methodology Economic benefit was base upon information obtained as part of the 2000 Master Plan Update as well as discussions with tenants and City of St. Petersburg staff. The surveys obtained as part of the previous master plan update focused upon information related to type of business activity, percentage of business operation dependent upon the airport, employee and payroll data, revenue and sales data, and expenditure and expense data.
Regional multipliers from the U. S. Department of Commerce’s Regional Input-Output Modeling System (RIMS II) were acquired to quantify induced impacts within the State of Florida. RIMS II
1 One survey of an indirect business provided employment data that was deemed to be inaccurate and overstated the number of employees related to activity at the airport. The data provided was discounted by average ratios for the industry and the reported annual revenues.
Master Plan Update
Albert Whitted Airport

Economic Benefit Analysis H-2 March 2006 Final Draft
multipliers are derived through input-output models that measure the business interactions between various industries at the state, county and city levels. These business interactions result in the induced impacts within the economy, specifically the additional expenditures, earnings and jobs generated by the primary industry.
Study Area SPG is located in St. Petersburg, Florida within Pinellas County. The City of St. Petersburg is part of the Tampa - St. Petersburg-Clearwater Metropolitan Statistical Area, as defined by the U.S. Census Bureau, which includes the following counties:
� Pinellas � Hillsborough � Hernando � Pasco
The Airport’s service area is primarily composed of Pinellas and portions of Manatee (Palmetto/Bradenton), (easily accessible by Sunshine Skyway Bridge and Interstate-275) Hillsborough, and Pasco Counties. Summary demographic and economic data on Pinellas County is provided in Chapter 2, Inventory. The following provides a general overview of the St. Petersburg economy, identifying those industries and sectors that are vital.
The economy of Pinellas County is led by a strong tourism industry. Home to 35 miles of shoreline along the Gulf of Mexico, St. Petersburg/Clearwater beaches are consistently rated amongst the best in Florida and the nation. These natural amenities lend itself to a strong tourism market and the resulting industries to serve visitors. The largest employment sector in Pinellas County is the services industry. The services industry is led by a strong professional services market including health and business services. Employment in the service industries totaled 193,294 jobs in 2004, with 55,627 and 56,893 respectively for the health and business services professions. Though the hotel industry falls in this classification and provides services to the tourism market, its employment of 9,117 is not dominant in this industry. Employment in the retail trade industry is second to that of the services industry in Pinellas County. Retail trade employment totaled 88,961 jobs in 2004, with 29,776 jobs or 33 percent within eating and drinking places.
Pinellas County ranks second in the state for the number of manufacturing firms. Regarded as the gateway to the Florida’s hi-tech industry, sixty-percent of the state’s high technology companies are in the St. Petersburg and Tampa Bay. One third of the states manufacturing companies are located in the area. A survey by a leading technology research company ranked St. Petersburg fifteenth in the nation in hi-tech job growth of firms under 1,000 employees. Additionally, Pinellas

Economic Benefit Analysis H-3 March 2006 Final Draft
ranks second in the state for manufacturers of computers, office equipment, electronic components, and industrial and commercial machinery. Pinellas is home to over 1,200 manufacturing firms that provide over 45,000 jobs.
Economic growth projections for St. Petersburg and the Tampa Bay Region are strong. Continued growth is anticipated in the region’s manufacturing and high technology industries, while the services and retail trade industries are anticipated to remain strong.
PRIMARY ECONOMIC IMPACT Primary economic impacts of SPG can be measured through the number of jobs, the amount of payroll paid to households (earnings) and the value of goods and services (output) produced by businesses operating at the airport. These impacts can be separated into two categories, direct and indirect. Direct economic impacts are those resulting from businesses operating on-airport or fundamentally, 100 percent dependent on aviation related activity. Companies that do not totally rely on airport activity, yet can attribute portions of its business activity to the airport, provide indirect economic impacts. Indirect businesses typically associated with airports include hotels, freight forwarders, travel agencies and rental cars agencies. The number of indirect users of SPG cannot completely be defined, and, therefore, are considered limited. Survey responses as outlined in the 2000 MPU were considered and the data was updated based upon 2004/2005 economic indicators. This data was then proportionally incorporated into the overall evaluation of primary impacts. Primary Employment Activity at SPG supports the employment of 152 people within the St. Petersburg economy. The number represents both direct and indirect employment. Of the number employed, 127 of those positions are full-time positions. These employees represent those working for the airport and its existing airport tenants. FBOs and flight schools represent the largest group of employers at the airport, accounting for 54 percent of the airport related employees. Aircraft maintenance follows by supporting 20 percent of the workforce. Table H-1 presents employment by aggregate categories.

Economic Benefit Analysis H-4 March 2006 Final Draft
TABLE H-1 PRIMARY EMPLOYMENT
1999 2004 Type of
Business Number of Employees
Full-Time Employees
Number of Employees
Full-Time Employees
Projected Employment
(2009) FBO/Flight
Schools/Tours 83 63 100 76 159 Air
Taxi/Commercial Operations 13 12 16 14 25
Aircraft Maintenance
Facility 31 30 37 36 60 Government Organization 14 11 17 13 27
Indirect Businesses 11 11 13 13 21
TOTAL 152 127 182 152 292 Source: The LPA GROUP INCORPORATED, Economic Benefit Survey Results, 1999 and 2005
According to information provided by companies surveyed and the actual growth in employment from 1999 to 2004, growth in the next five years (2009) will likely exceed 290 persons which is approximately 60 percent growth. Future employment levels were accepted as forecasted goals for those respective firms, especially considering anticipated development. Combined with estimates of revenue, businesses operating at the airport will see a bright future.
Primary Payroll Payroll reported in 1999 totaled $2.3 million in earnings paid to households in 1999. Using information provided by local and regional authorities as well as U.S. Census data, payroll in 2004 is estimated to be approximately $3.3 million. This payroll figure represents a portion of the overall payroll data as data was not provided by all companies surveyed. Comparing annual average salaries of specific business groups operating at Albert Whitted to that of Pinellas County provides insight to the strength of certain groups at the airport. The average annual salary for Pinellas County in 2004 was $36,053. Average salaries for government and aircraft maintenance businesses exceed the county’s 2004 average at $34,133 and $27,360, respectively. Table H-2 presents payroll data reported.

Economic Benefit Analysis H-5 March 2006 Final Draft
TABLE H-2 PRIMARY PAYROLL
Type of Business Total Payroll (1999) Total Payroll (2004) FBO/Flight Schools $700,000 $940,800.00
Air Taxi/Commercial Operations 310,000 $416,640.00 Aircraft Maintenance Facility 830,000 $1,115,520.00
Government 424,528 $570,565.63 TOTAL $2,264,528 $3,043,525.63
Source: The LPA Group Incorporated, 1999 Economic Benefit Analysis Survey Results and 2005 data from Airport Management
Primary Expenditures The purchase of goods and services that are in turn used for production of additional goods and service is the foundation of the economic cycle that keeps this nation moving. Primary expenditures represent the needs for materials and resources required in the industry’s productive process. The airport and its tenants were asked to report expenditures for materials and equipment, maintenance and repairs, utilities, vehicle fuel, aviation fuel and advertising/business services, miscellaneous expenditures, and taxes. These expenditures are the basis for the multiplier effect of additional production, jobs and earnings throughout an economy.
In 2004, primary businesses expended over $1.2 million on goods and services. Materials and equipment expenditures represent over $3.4 million or 58 percent of all expenditures at the airport. FBO and aircraft maintenance operations are the major purchasers with over $2.5 million combined. Aviation fuel is the second largest category of goods and services purchased with over $928,000. FBO/Flight School’s purchases represent over 63 percent of aviation fuel acquired with $585,000 purchased. Table H-3 presents expenditures related to SPG.
The Other Expenditures category represents the third largest group of expenditures with $900,000 or 15 percent of all goods and services purchased. This category attempts to capture remaining unaccounted expenditures in the St. Petersburg economy. The Other category is a compilation of remaining industries within the economy, including business services, finance, real estate and insurance companies, hotels, personal services, eating and drinking places, health services, and the like.
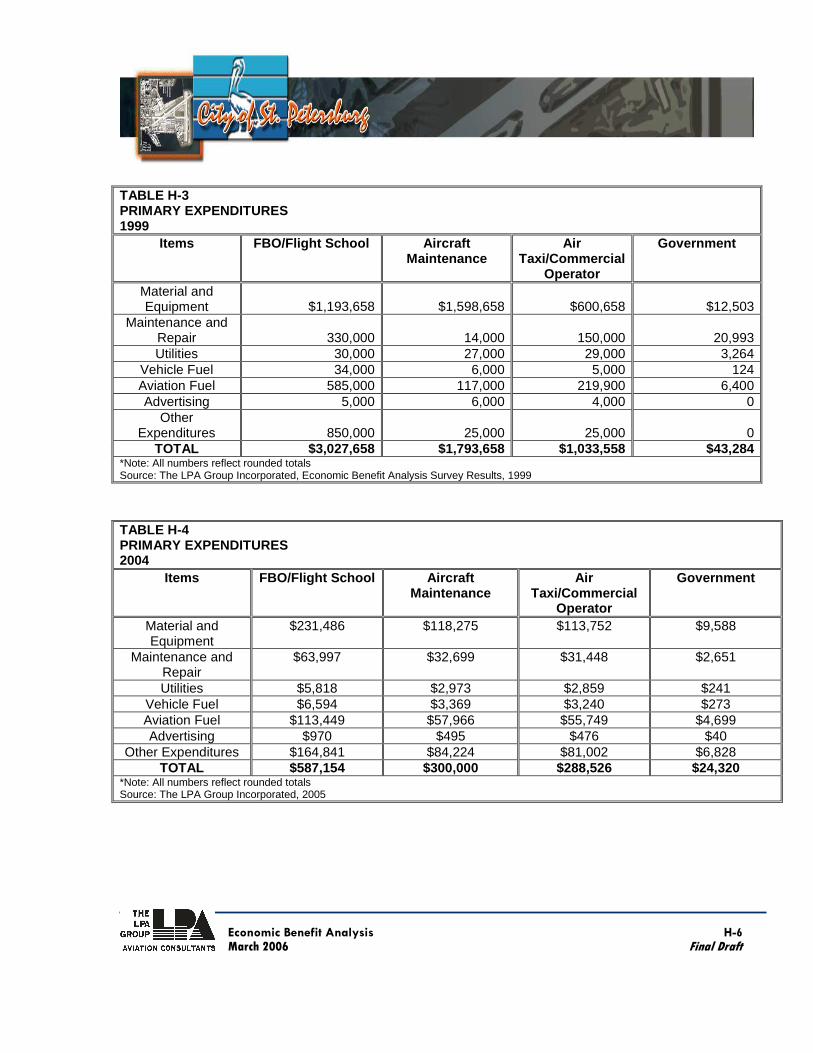
Economic Benefit Analysis H-6 March 2006 Final Draft
TABLE H-3 PRIMARY EXPENDITURES 1999
Items FBO/Flight School Aircraft Maintenance
Air Taxi/Commercial
Operator
Government
Material and Equipment $1,193,658 $1,598,658 $600,658 $12,503
Maintenance and Repair 330,000 14,000 150,000 20,993 Utilities 30,000 27,000 29,000 3,264
Vehicle Fuel 34,000 6,000 5,000 124 Aviation Fuel 585,000 117,000 219,900 6,400 Advertising 5,000 6,000 4,000 0
Other Expenditures 850,000 25,000 25,000 0
TOTAL $3,027,658 $1,793,658 $1,033,558 $43,284 *Note: All numbers reflect rounded totals Source: The LPA Group Incorporated, Economic Benefit Analysis Survey Results, 1999
TABLE H-4 PRIMARY EXPENDITURES 2004
Items FBO/Flight School Aircraft Maintenance
Air Taxi/Commercial
Operator
Government
Material and Equipment
$231,486 $118,275 $113,752 $9,588
Maintenance and Repair
$63,997 $32,699 $31,448 $2,651
Utilities $5,818 $2,973 $2,859 $241 Vehicle Fuel $6,594 $3,369 $3,240 $273 Aviation Fuel $113,449 $57,966 $55,749 $4,699 Advertising $970 $495 $476 $40
Other Expenditures $164,841 $84,224 $81,002 $6,828 TOTAL $587,154 $300,000 $288,526 $24,320
*Note: All numbers reflect rounded totals Source: The LPA Group Incorporated, 2005

Economic Benefit Analysis H-7 March 2006 Final Draft
Capital Improvements Capital improvements represent investments by the airport or its tenants in its facilities, including new facilities, renovation projects and the purchase of new equipment. Unlike production, earnings and employment impacts, impacts associated with capital improvements are typically one-time or short-term impacts. Though a certain amount of these expenditures will occur on an annual basis, this amount of investment cannot be viewed as an annual recurring expenditure by the airport or its tenants.
Based upon discussions with Airport Management, City of St. Petersburg staff, and proposed capital improvements, $24,580,110 in capital improvements are planned for the short-term (2004-2009). Over $23 million was reported for new construction and renovation projects. The bulk of the projected expenditure in construction will result from the construction of a new air traffic control tower, Intermodal General Aviation Terminal, Terminal Apron, and RSA improvements at the airport. Expenditures on equipment and other capital total more than one-half million dollars. These expenditures represent investment in the construction industry, wholesale and retail industries, and the motor vehicle and equipment industry within the state of Florida.
TABLE H-5 CAPITAL IMPROVEMENTS (2004-2024)
Items City of St. Petersburg Other* New Facility/Renovation $1,921,839 $3,931,500
Equipment Purchase $5,000** $300,000 Other Capital Improvements $1,381,355 $0.00
TOTAL $3,308,194 $4,231,500 Capital Improvement Total: $7,539,694
*Note: Other refers to investments by Fixed Based Operator, Aircraft Maintenance and other private investment dollars **Note: Self Fuel, parking and terminal facilities Source: The LPA Group Incorporated, 2005
INDUCED AVIATION IMPACTS Induced impacts represent the additional jobs, earnings and output in the Florida economy as a result of primary expenditures and payroll paid by businesses. Induced impacts are the result of business related expenditures for goods and services, and payroll paid to employees for their contribution to the production process. Business expenditures go to the production of additional goods and services, just as the earnings paid go to expenditures related to supporting families and

Economic Benefit Analysis H-8 March 2006 Final Draft
households. Regional multipliers from the U. S. Department of Commerce’s Regional Input-Output Modeling System (RIMS II) are used to quantify induced impacts within the state of Florida. Regional multipliers gauge the additional goods and services produced to support primary expenditures of airport related businesses, the corresponding jobs supported throughout the regional economy and the resulting amount of payroll paid to those employees. Regional multipliers capture the economic impact derived from the recirculation of money within the Florida economy. For example, a retail business requires inputs from other industries (wholesalers, manufactures, transporters, etc.) before it can produce some good or service for consumption. The production process for a bakery requires products from a dairy, packaging supplier, transportation to deliver its products and business services, including advertisers, accountants, or lawyers. Regional multipliers estimate the economic interaction between an industry and all other industries in the economy. The process holds true for earnings paid. Individuals take their salaries and purchase goods and services throughout the economy, thereby supporting other jobs, earnings paid, and the goods and services produced. Table H-6 presents primary, induced and total production, as well as earnings and employment impacts for SPG. Induced Production Primary expenditures by airport related businesses are in itself a form of output within the economy. In order for these businesses to produce their respective goods and services, they first require resources/supplies (inputs) from other industries within the economy. Direct expenditures by airport related businesses totaled $9.6 million in 2004. Resources and supplies purchased by Airport related businesses represent outputs (goods and services) from the supplying industry. The regional multipliers capture the additional output produced in the region as a result of primary expenditures. Induced output due to primary expenditures of airport related businesses amounted to $11.6 million. This amount represents the additional payroll paid and production related to SPG business.
Induced Employment Induced employment represents the number of employees required in the economy to support primary expenditures by airport related businesses. Primary and payroll related expenditures induce employment totaling 180 additional jobs in the Florida economy. These are jobs in addition to the 155 jobs directly on the airport property.
Induced Payroll Induced payroll provides the additional earnings resulting to those employed in industries producing additional goods and services (output) to support airport related expenditures. Induced

Economic Benefit Analysis H-9 March 2006 Final Draft
payroll due to primary expenditures of airport related businesses totaled estimated $7.4 million in 2004. As the economy recycles, the additional earnings will return to the economy in the form of expenditures by other households.
Capital Improvements Expenditures for capital improvements are treated as short-term impacts as these expenditures are not recurring. Capital improvements represent investments in the construction and motor vehicle and equipment industry. Proposed capital expenditures totaled over $1.2 million and $250,000 in the construction and equipment industries, respectively. This investment results in $4.9 million of induced output and $2.76 million of earnings. Additionally, proposed capital investment supports employment of 121 people in the Florida economy. It can also be stated that this investment can create that many new jobs in the short term. Given the nature of construction, it is best to view this as supporting existing jobs in the economy over the short-term. TOTAL ECONOMIC IMPACT Business activity associated with SPG contributes more than $10.5 million directly to the Florida economy through purchases of goods and services. Primary activity induces additional business related activity within the economy. This activity provides a total of 336 jobs in the regional economy. Total employment is anticipated to increase to 1,073 in ten years based on projected revenues provided. Total production, the purchase of goods and services (including labor) in the economy, totaled over $20.7 million in 2004. Albert Whitted contributes $20 million to the Florida economy on a recurring annual basis. Based on the data provided, SPG productive impact to the economy may increase to well over $50 million based on tenant ten-year estimates of revenue. Earnings paid in the economy are estimated to total over $8.1 million in 2004, and are projected to increase to over $19.8 million in ten years. Table H-6 provides primary, induced and total impacts related to SPG, and Table H-7 provides a summary of anticipated operations and based aircraft through the year 2024.

Economic Benefit Analysis H-10 March 2006 Final Draft
TABLE H-6 TOTAL ECONOMIC IMPACT
PRIMARY IMPACTS Item 1999 2004 2009
Goods and Services $8,003,180 8,811,560 14,098,496 Payroll $2,264,528 2,493,262 3,989,219
Employment 141 155 248 Taxes $115,375 127,029 203,246
Expenditures $8,692,040 9,570,000 15,312,000 Employment 127 182 292
INDUCED IMPACTS Goods and Services $10,588,752 $11,660,000 $18,656,000
Payroll $4,479,691 $4,932,895 $7,892,631 Employment 164 180 289
TOTAL IMPACTS Goods and Services $18,591,932 $33,152,000 $53,043,200
Payroll $6,744,219 $12,025,880 $19,241,408 Employment 305 362 581
Source: The LPA Group Incorporated, 2005

Economic Benefit Analysis H-11 March 2006 Final Draft
TABLE H-7 SUMMARY OF AVIATION ACTIVITY FORECAST
Forecast 2009 2014 2019 2024
Based Aircraft
Total 213 227 241 257 Single-Engine 158 168 179 190 Multi-Engine 45 45 48 51 Jet 5 6 7 9 Rotor 6 7 7 8
Annual Operations
Total 112,618 119,259 126,353 13,391 Local 58,368 61,718 65,291 69,106 Itinerant 54,250 57,541 61,062 64,835
Instrument Operations
Total 3,946 4,179 4,428 4,694
Peak Activity
Peak Month 11,155 11,812 12,515 13,266 ADPM 367 388 411 436
Peak Hour 37 39 41 43
Source: The LPA Group Incorporated, 2005


December 2006 RSA Determination Study Final Draft
TABLE OF CONTENTS
1.0 PROJECT SUMMARY........................................................................................1
1.1 INTRODUCTION.................................................................................................1
1.1.1 Scope Summary/Methodology.....................................................................1 1.1.2 RSA-Runway Environment Relationship.....................................................2 1.2 EXISTING CONDITIONS .................................................................................4
1.2.1 Airfield Overview ........................................................................................4 1.2.2 Existing and Future Conditions and Aircraft Use ......................................5 1.2.3 Existing Runway Design Specifications......................................................8 1.2.3.1 Runway 6-24................................................................................8 1.2.3.2 Runway 18-36............................................................................10 1.3 DEVELOPMENT CONSIDERATIONS........................................................11
1.3.1 Background ...............................................................................................11 1.3.2 Runway Relocation, Shifting, or Realignment ..........................................13 1.3.3 Runway Length Reduction ........................................................................13 1.3.4 Combination of Runway Relocation, Shifting, or Reduction ....................14 1.3.5 Declared Distances ...................................................................................14 1.3.6 Engineered Materials Arresting System (EMAS) .....................................16 1.3.6.1 SPG EMAS Evaluation..............................................................17 1.4 ALTERNATIVES EVALUATION.................................................................17
1.4.1 Alternative A .............................................................................................17 1.4.2 Alternative B .............................................................................................23 1.4.3 Alternative C .............................................................................................25 1.4.4 Alternative D .............................................................................................28 1.5 ENVIRONMENTAL AND OPERATIONAL CONSIDERATIONS ..........30
1.5.1 Alternative A ...........................................................................................30 1.5.2 Alternative B ...........................................................................................31 1.5.3 Alternative C ...........................................................................................31 1.5.4 Alternative D ...........................................................................................31 1.5.5 Regulatory Requirements........................................................................31
1.6 SELECTION OF PREFERRED ALTERNATIVE.......................................32
1.6.1 Preferred Alternative Cost Estimate .......................................................34 1.7 SUMMARY AND CONCLUSION .................................................................36

December 2006 RSA Determination Study Final Draft
LIST OF TABLES
TABLE 1-1 Existing Runway Safety Area Runway 18-36..........................................2
TABLE 1-2 FAA Reference Code Classifications........................................................4
TABLE 1-3 2006 Percent of Annual Aircraft Usage ...................................................5
TABLE 1-4 Very Light Jet Runway Length Requirements at Maximum
Takeoff Weight................................................................................................................6
TABLE 1-5 Existing Light Aircraft Specifications......................................................6
TABLE 1-6 Aircraft Operations Based Upon Fleet Mix.............................................7
TABLE 1-7 2006 Runway Utilization and Estimated Operations..............................7
TABLE 1-8 2024 Runway Utilization and Estimated Operations..............................8
TABLE 1-9 Existing B-I Light Dimension Standards.................................................9
TABLE 1-10 Pavement Strengths ...............................................................................10
TABLE 1-11 Existing Declared Distance Information..............................................15
TABLE 1-12 Alternative A Declared Distance Information.....................................19
TABLE 1-13 2006 Operational Usage of Runway 18-36...........................................19
TABLE 1-14 Existing Fleet Mix Runway Length Evaluation ..................................20
TABLE 1-15 Alternative A Order of Magnitude Costs ............................................21
TABLE 1-16 Alternative B Order of Magnitude Costs.............................................25
TABLE 1-17 Future Displaced Threshold Requirements.........................................26
TABLE 1-18 Alternative C Order of Magnitude Costs ............................................26
TABLE 1-19 Alternative D Order of Magnitude Costs ............................................30
TABLE 1-20 RSA Alternatives Evaluation ................................................................33
TABLE 1-21 Consolidated Costs Estimates ...............................................................35

December 2006 RSA Determination Study Final Draft
LIST OF FIGURES
FIGURE 1-1 Standard Runway Safety Area Profile..................................................3
FIGURE 1-2 Existing Conditions...............................................................................12
FIGURE 1-3 Declared Distances Sample Schematic................................................16
FIGURE 1-4 Alternative A RSA Fulfillment using Declared Distances.................22
FIGURE 1-5 Alternative B RSA Fulfillment using Dredge and Fill.......................24
FIGURE 1-6 Alternative C RSA Fulfillment using Declared Distances, Shifting and Dredge and Fill ..............................................................................................................27
FIGURE 1-7 Alternative D RSA Fulfillment Using Relocated Thresholds............29

1 December 2006 RSA Determination Study Final
1.0 PROJECT SUMMARY As a result of safety directives from the Federal Aviation Administration (FAA), LPA evaluated standardizing runway safety requirements at the Albert Whitted Airport through the use of dredge and fill material on Runways 18, 36 and 24. Based upon the findings of the 2006 master plan update, LPA recommended adding dredge and fill off the north end of Runway 18, and displace the threshold on Runway 36, thereby bringing the safety area into compliance and retaining existing runway length. Based upon the initial master plan findings, at the direction of the FAA, the City of St. Petersburg engaged LPA to perform a Runway Safety Area (RSA) Determination Study to analyze various alternative options as well as financial feasibility. The findings of the RSA study showed that in the long-term use of runway 18-36 will decrease or be limited to single engine and small multi-engine piston aircraft if the existing runway length was shortened to meet safety area requirements. Although the use of declared distances on Runway 18-36 in the short-term is the most cost feasible, its use will impact airport capacity overall especially as a direct result of the introduction of the very light jet (VLJ) market. Still the FAA's review of the RSA Determination Study found that the City's preferred alternative "not practicable" and recommended the use of Declared Distances since the operational analysis showed a negligible impact to the existing aircraft fleet mix. Based upon this decision, the City Administration briefed representatives of the aviation community. It was determined that while the dredge and fill alternative was preferred, the implementation of declared distances until a change in fleet mix warrants was a more practical and cost effective solution to obtaining standardized safety areas. 1.1 INTRODUCTION 1.1.1 Scope Summary/Methodology Based upon the development recommended in the 2006 Master Plan Update, the FAA-Airport Districts Office required an evaluation of existing runway safety area (RSA) deficiencies primarily associated with Runway 18-36. Thus, the Consultant (LPA) using the direction provided in FAA Order 5200.8, Runway Safety Area Alternative Analyses, evaluated several alternative options to comply with prescribed FAA safety standards. Based upon the current guidelines, SPG has inadequate RSA design standards prior to Runway 18 and 36. Due to topographic limitations, the current runway safety area dimensions on Runways 18 and 36 are as follows:

2 December 2006 RSA Determination Study Final
TABLE 1-1
EXISTING RUNWAY SAFETY AREA RUNWAY 18-36
Item FAA Criteria Existing Runway 18 Safety Area 120 x 240 feet 120 x 50 feet Runway 36 Safety Area 120 x 240 feet 120 x 130 feet Source: Albert Whitted Airport 5010, 2006
Since the master plan update recommends the construction and reconstruction of various facilities, the airport must conform to current runway safety area standards to the extent practicable. The FAA Regional Airports Division Manager is required to make a Runway Safety Area determination in accordance with FAA Order 5200.8, Runway Safety Area Program, for each runway at federally obligated airports. Further, the FAA will not issue modifications to standards for nonstandard runway safety areas. Recognizing that conformity with these criteria is difficult; this document evaluates various means by which safety area can be accommodated given the physical constraints of the runway environment. The focal point of this study is to conduct an analysis to evaluate the proper airplane design group and safety area requirements that maximize the utilization of the runways at SPG without compromising safety standards set forth by the FAA. Specifically, the aim is to establish the most viable development alternative that feasibly and practicably complies with the guidance prescribed within the FAA Order. As part of this analysis, declared distances, the use of an Engineered Materials Arresting System (EMAS), cut and fill, runway relocation, shifting, or realignment, or a combination of these alternatives were considered and order of magnitude cost estimates were developed. Additional consideration was also given to object free areas, Part 77 surfaces, and building restriction lines used to establish proposed development areas adjacent to Runways 18, 36, and 24. 1.1.2 RSA-Runway Environment Relationship The runway safety area is an integral part of the runway environment. RSA dimensions are established in AC 150/5300-13, Airport Design, and are based on the Airport Reference Code (ARC). The RSA is intended to provide a measure of safety in the event of an aircraft’s excursion from the runway by significantly reducing the extent of personal injury and the hazard of structural damage during overruns, undershoots and lateral veering. Many circumstances contribute to the potential for aircraft excursions including insufficient runway length, weather conditions with low visibility, site constraints including precipitous terrain drop-offs, bodies of water, wetlands, residential or commercial development, availability of visual and electronic aids for landing, as well as runway contamination caused by rain, snow, and ice. In addition, mechanical failure may inhibit an aircraft’s propensity to decelerate in time during landing or while performing an aborted takeoff. As such, the effects of physical constraints of the airport’s runway environment are compounded during aircraft mechanical malfunctions.

3 December 2006 RSA Determination Study Final
The RSA maintains an important role in the runway environment. Its function is to create a buffer between the runway pavement and non-movement areas. According to the FAA, takeoffs and landings are generally regarded as the most critical phases of flight, during which most aircraft accidents occur. During these segments, aircraft are subject to a variety of controls and are constrained by the runway’s operational dimensions. Moreover, these dimensions test the aircraft’s operational limitations during takeoff and landing maneuvers. A growing list of runway safety area related accidents has contributed to the mounting concern that airports do not provide adequate safety area to reduce injury to persons and property. As a result, the FAA coordinated a study in 1990 that identified a number of airports not in compliance with safety area requirements. Recognizing the significant safety enhancement afforded by runway safety area improvements, the FAA issued Order 5200.8, Runway Safety Area Program, in an effort to guide the improvement process by identifying potential alternatives to the traditional cleared and graded safety areas, which is illustrated in Figure 1-1.
Figure 1-1, Standard Runway Safety Area (RSA) Profile
Source: The LPA Group, 2006 As illustrated in Figure 1-1, the RSA profile runs beyond the structural pavement of the runway along the extended runway centerline. As previously mentioned, the width and length of the RSA is dependent upon the most critical aircraft using the runway. Figure 1-1 represents the traditional cleared and graded safety areas in which sufficient land can be accommodated beyond both runway ends, without the need to displace any thresholds. In this situation, the full length of the runway may be used for aircraft movement. However, as explored later in this document, alternative RSA accommodations can be achieved by employing other means.
Length
RSA RSA Width
Structural Pavement
TORA TODA ASDA LDA

4 December 2006 RSA Determination Study Final
1.2 EXISTING CONDITIONS 1.2.1 Airfield Overview The Albert Whitted Airport (SPG) has a dual runway system consisting of Runway 6-24 and Runway 18-36. Runway 6-24 has a published length of 3,677 feet and width of 75 feet, whereas Runway 18-36 has a published length of 2,864 feet and a width of 150 feet. Runway 18-36 is supplemented by a full-length parallel taxiway, Taxiway B, on the westernmost side, while Runway 6-24 is augmented by Taxiway A, extending from the beginning of Runway 6 and terminating at Runway 18-36. These taxiways adjoin various taxiway connectors to provide ingress and egress to/from the runway environments. The airport was developed from spoilage obtained during dredging of the Port of St. Petersburg. As such, SPG lies on a peninsular landmass around which water forms three sides. Runway 18-36 occupies the easternmost portion of the airport and is situated approximately 290 feet from runway centerline to the water. Runway 6-24 is aligned in a southwest-northeast direction and is situated on the northern portion of the airfield, crossing Runway 18-36 approximately 440 feet from the Runway 18 threshold. FAA Advisory Circular (AC) 150/5300-13, Airport Design, characterizes an Airport Reference Code (ARC) as a coding system used to relate airport design criteria to the operational and physical characteristics of aircraft anticipated to operate at an airport. Each dimensional criterion is specified based on aircraft approach category, represented by a letter A-E corresponding to aircraft approach speed in knots, and airplane design group, represented by a Roman numeral I-VI corresponding to aircraft wingspan in feet. The alphanumeric coding system is most often used to describe the airport’s capacity to handle aircraft that correspond to approach speed and wing span. It is also used to determine runway-specific handling capacity. Table 1-2 summarizes the elements of these categorizations.
TABLE 1-2 FAA REFERENCE CODE CLASSIFICATIONS
Aircraft Approach Category
Aircraft Approach Speed (AS) in Knots
Airplane Design Group
Aircraft Wingspan (WS)
A AS < 91 I WS < 49 ft
B 91 < AS < 121 II 49 ft < WS < 79 ft
C 121 < AS < 141 III 79 ft < WS < 118 ft
D 141 < AS < 166 IV 118 ft < WS < 171 ft
E 166 < AS V 171 ft < WS < 214 ft
VI 214 ft < WS < 262 ft
Source: The LPA Group, 2006

5 December 2006 RSA Determination Study Final
An ARC of B-I ‘Light’ is currently assigned to SPG. This designation coincides with the most demanding aircraft that operates and performs at least 500 operations per year at the airport. ‘Light’ refers to the dimensional standards pertaining to facilities for small airplanes (less than 12,500 lbs maximum takeoff weight) exclusively. The most recent master plan acknowledges that the Beech King Air 90 is the critical aircraft meeting the aforementioned criteria for both Runways 6-24 and 18-36. However, due to technological improvements, aircraft within the ‘Light’ aircraft category, such as the TBM 850 and Eclipse 500, are expected to surge within the next ten years. Thus, as outlined in the 2006 Master Plan Update, an increase in overall operational activity is expected. Although slightly larger turbine aircraft, such as the Cessna Citation II, do currently operate at SPG, existing and anticipated operations do not warrant an increase in the ARC. Therefore, an ARC of B-I Light will continue to drive airport development. 1.2.2 Existing and Future Conditions and Aircraft Use The runway system at SPG consists of four active runways, and because of similar lengths, to some extent, the runways are used interchangeably depending upon wind and instrument weather conditions. Based upon discussions with Air Traffic Control, existing operations on runway 18-36 are currently limited to single-engine piston aircraft primarily due to wind coverage and runway length limitations. Still based upon 300 daily operations, at least 100 operations or 30% are attributed to Runway 18-36. Further, discussions with SPG air traffic control revealed that Runway 6 represents the primary runway due to wind conditions and length. However, operations on Runways 18 and 36 are still significant due to proximity of airfield and navigational facilities. Runway utilization percentages based upon 2005 and 2006 operations are provided in Table 1-3.
TABLE 1-3 2006 PERCENT OF ANNUAL AIRCRAFT USAGE
Runway Total Usage Percent per Runway
6 56% 24 70% 14% 18 18% 36 30% 12%
Source: SPG ATCT, 2006 and meteorological data
However, based upon the FAA approved airport operating forecast and fleet mix, it is anticipated that use of Runway 18-36 by very light jet aircraft and light multi-engine turbine aircraft that can operate on shorter runways will likely increase. Operating lengths obtained from manufacturer specifications for very light jets are shown in Table 1-4.

6 December 2006 RSA Determination Study Final
TABLE 1-4 VERY LIGHT JET RUNWAY LENGTH REQUIREMENTS AT MAXIMUM TAKEOFF WEIGHT Aircraft Take-Off Distance Landing Distance Cessna Citation Mustang 3,120 feet 2,610 feet Adams A-500 2,068 feet 1,818 feet Adams A-700 2,950 feet 2,520 feet Eclipse 500 2,155 feet 2,040 feet Embraer Phenom 100 3,400 feet 3,000 feet Embraer Phenom 300 3,700 feet 3,300 feet Source: Manufacturer Specifications, 2006
In addition to micro jets or very light jets which are poised to enter the market in 2007 and 2008, existing aircraft manufacturers such as Piaggio and EADS also have aircraft which can operate on runways less than 3,000 feet. Examples of which are shown in Table 1-5.
TABLE 1-5 EXISTING LIGHT AIRCRAFT SPECIFICATIONS
Aircraft Takeoff Distance Landing Distance
Piaggio P-180 Avanti 2,850 feet 2,860 feet EADS TBM 850 2,832 feet 2,427 feet Source: Piaggio and EADS Socata, 2006
Thus, according to the approved forecasts as provided in the master plan update, an increase in multi-engine turbine and other operations, primarily associated with very light jet aircraft (VLJs) and the sport pilot aircraft license, is anticipated as shown in Table 1-6.

7 December 2006 RSA Determination Study Final
TABLE 1-6
AIRCRAFT OPERATIONS BASED UPON FLEET MIX
Year Single-Engine
Multi-Engine Piston Turbine1 Rotorcraft Other2 Total
Historic 2004 78,649 16,395 68 11,160 11 106,283 2006 80,954 16,622 75 11,571 13 108,829 Future 2009 84,431 15,689 85 12,200 15 112,618 2014 90,582 15,427 107 13,329 20 119,259 2019 97,230 14,939 135 14,569 26 126,353 2024 104,421 13,328 169 15,934 35 133,941 Source: Albert Whitted Master Plan Update, 2006, SPG ATCT and The LPA Group Incorporated, 2006 Note: 1Forecast Increase in Turbine Operations (turboprop and jet engine) in line with FAA Aerospace Forecast, 2004-2015 and considers the emergence of very light jets into the system 2Increase in "Other" Category based upon introduction of light sport aircraft and growth in experimental aircraft as highlighted in the FAA Aerospace Forecast, 2004-2015
Therefore, based upon the forecast shown in Table 1-6 and the runway utilization percentages outlined in Table 1-3, the following estimate of operations was determined:
TABLE 1-7 2006 RUNWAY UTILIZATION AND ESTIMATED OPERATIONS
Runway Fleet Mix 6-24 18-36 Total 60% 30% 100% Single-Engine 56,732 24,223 80,954 Multi-Engine 11,472 4,950 16,422 Turbine 75 0 75 Other 9 4 13
Total Operations* 68,287 29,177 97,463 Source: The LPA Group Incorporated and FAA Aerospace Forecasts, 2005-2016 Note: Since Rotorcraft are not impacted by runway length, not included in analysis Estimated 30% of Single Engine Piston Aircraft use Runway 18-36 Estimated 30% of Multi-Engine Piston Aircraft use Runway 18-36 Estimated 0% of Turbine Aircraft use Runway 18-36 Estimated 30% of "Other" Aircraft use Runway 18-36

8 December 2006 RSA Determination Study Final
TABLE 1-8
2024 RUNWAY UTILIZATION AND ESTIMATED OPERATIONS Runway Fleet Mix 6-24 18-36 Total 60% 30% 100% Single-Engine 56,484 24,207 80,691 Multi-Engine 6,273 2,689 8,963 Turbine 8,991 3,853 12,844 Other 19,266 8,257 27,523
Total Operations 91,014 39,006 130,022 Source: The LPA Group Incorporated and FAA Aerospace Forecasts, 2006-2017 Note: Since Rotorcraft are not impacted by runway length, not included in analysis Estimated 30% of Single Engine Piston Aircraft use Runway 18-36 Estimated 30% of Multi-Engine Piston Aircraft will use Runway 18-36 Estimated 30% of Turbine Aircraft (includes light turboprop and VLJs) will use Runway 18-36 Estimated 30% of "Other" Aircraft (including new light sport aircraft) will use Runway 18-36
Based upon estimated percentage of daily operations attributed to Runway 18-36, it is estimated that at a minimum 107 daily operations will be attributed to single-engine, multi-engine piston, turbine (composed primarily of VLJs) and light sport aircraft operations in 2024. Although it is difficult to obtain an accurate projection of future operations on Runway 18-36, it is expected that utilization of Runway 18-36 will exceed 30 percent as a direct result of the VLJ and light sport aircraft operational requirements and the addition of a non-precision approach on Runway 36. 1.2.3 Existing Runway Design Specifications The FAA sets forth particular dimensional criteria for runway design and runway separation standards. These standards reflect the variation in aircraft design dimensions and provide safety clearance between taxiway and runway environments. The diversity of operational activity at SPG dictates which runway may be used for particular aircraft performance characteristics such as accelerate-stop, takeoff, and landing distance requirements. These dimensions are fundamental components that establish an index from which RSA dimensional criteria are determined. This section will investigate the existing runway design elements at SPG and will facilitate the discussion for recommending alternative modifications to RSA elements that are presented later in this paper. 1.2.3.1 Runway 6-24 Runway 6-24 is the primary runway at SPG due to its length and all-weather wind coverage relative to Runway 18-36. A 558-foot displaced threshold is located on the approach end of Runway 6 to make allowance for building obstructions that penetrate the

9 December 2006 RSA Determination Study Final
approach surface to the runway. The University of South Florida—St. Petersburg lies within close proximity to the airport and would otherwise obstruct this surface without a displaced threshold. Accordingly, a 263 foot displaced threshold is located on the approach end of Runway 24 to accommodate RSA requirements due to limited land mass beyond this end. Criteria outlined by the FAA state that for the ARC B-I designation, a runway width of 60 feet is required for those facilities with approach visibility minimums not lower than 3/4 of a mile. Consequently, for approach visibility minimums lower than 3/4 of a mile, a 75-foot wide runway is required to meet criteria for ARC B-I. Currently, Runway 6-24 has a published width of 75 feet and is striped for visual operations. Existing runway separation criteria for 6-24 fully comply with FAA designated criteria that correspond to an ARC B-I classification for visual runways with not lower than ¾-statute mile approach visibility minimums. As such, Taxiway A provides a taxiway centerline to runway centerline separation of 150 feet. Table 1-9 depicts separation clearances for Runway 6-24.
TABLE 1-9 EXISTING B-I LIGHT DIMENSION STANDARDS
Existing Dimension 6 24 18 36
FAA Standard B-I Dimension
Runway 6/24 to Taxiway A 150 ft -
Runway 18/36 to Taxiway B - 200 ft 150 ft
Runway Width 75 ft 75 ft 150 ft 150 ft 60 ft
Displaced Threshold 558 ft 263 ft 0 ft 0 ft ---
RSA Length Beyond Runway *240 ft *240 ft 130 ft 50 ft 240 ft
ROFA Width 250 ft 250 ft 250 ft
ROFA Length Beyond Runway *240 ft *240ft 240 ft 240 ft 240 ft
*Note: Runway 6-24 RSA and ROFA Length accommodate through the use of displaced thresholds. Source: The LPA Group; FAA, 2006

10 December 2006 RSA Determination Study Final
1.2.3.2 Runway 18-36 Runway 18-36 is used primarily by single-engine piston aircraft. But since Runway 18 is the only instrument approved runway at SPG, larger multi-engine piston and turbine aircraft, such as the Dassault Falcon jet and Cessna Citation II, use the instrumentation on Runway 18 to provide guidance for a circling approach to Runway 6-24 due to runway length limitations. Since winds favor the use of Runway 6-24 approximately 70 percent of the time and the runway is primarily used by small and light aircraft, a runway length analysis for Runway 18-36 was not conducted as part of the 2006 Master Plan process. Still, the only published instrument approach to SPG in on Runway 18 due to a number of obstructions to Runways 6 and 24. However, the design characteristics and separation standards are the same as those required for Runway 6-24. Runway 18-36 is currently 150 feet wide, which exceeds current and anticipated critical aircraft design characteristics. This width is more than double its required size, signifying the need for the runway’s entire dimensional profile to be revised to meet B-I standards. Table 1-10 Pavement Strengths, identifies the estimated strength of pavement that the runways at SPG can accommodate at an average level of activity. Both rigid and flexible pavement types exist at SPG. Flexible bituminous (asphalt) pavement exists in most areas, and both runways are considered to be in good condition. The published weight bearing capacity of both runways at SPG are not intended to represent maximum allowable weight or as an operating limitation. As such, many airport pavements are capable of supporting aircraft with gross weights of 20-50 percent in excess of the published figures. However, permissible operating weights are a matter of agreement between the airport and user. Existing weight bearing capacity for both runways is sufficient to accommodate both existing and future critical aircraft.
TABLE 1-10 PAVEMENT STRENGTHS
Runway Wheel Configuration 6-24 18-36
Single 60,000 lbs. 60,000 lbs. Dual 105,000 lbs. 105,000 lbs. Dual Tandem 190,000 lbs. 190,000 lbs. Double Dual Tandem --- --- Source: The LPA Group Incorporated, Airport Facilities Directory, 2005
11 December 2006 RSA Determination Study Final
1.3 DEVELOPMENT CONSIDERATIONS 1.3.1 Background This section presents the initial development considerations that were assessed for SPG given the airport’s operational characteristics, number of historical incidents or accidents that may guide the most critical type of development, and the forecast future fleet mix of the airport. Runway 6-24 is designated as the primary runway since it favors prevailing winds nearly 70 percent of the time. The majority of the existing fleet uses this runway on a regular basis. Runway 18-36 is used for a variety of banner towing and training flights, and is most affected by the lack of RSA. Thus, resolution of the RSA deficiencies on Runway 18-36 will require specific development with limited options to achieve standards for maintaining safety area beyond the runway ends that satisfy both the airport and FAA regulations. A key component of this development is preserving already limited runway length without stifling potential future growth. The National Transportation Safety Board (NTSB) maintains a database of aircraft incidents detailing the events that occurred at the airport and the causes of those events. As documented by the NTSB, SPG experienced eight aircraft incidents since 1995, one of which was fatal when in April of 1995 an aircraft on approach to Runway 6 crashed into a residence after failing to extend flaps and maintain airspeed. Several other incidents, although non-fatal, occurred on the runways at SPG, and some involved aircraft braking malfunctions. Despite no reported overruns or undershoots, some aircraft have veered off the runway, but came to a stop in the graded safety area adjacent to the runway. These incidents recall the need to maintain proper safety standards in the event of aircraft malfunctions, low visibility, or poor weather conditions.


13 December 2006 RSA Determination Study Final
Another important component of the development consideration process is identifying the potential future fleet mix expected to operate at SPG. Albert Whitted Airport will continue to be classified as a general aviation airport with no likelihood of commercial airport status or the recertification of the airport’s operating certificate. However, the airport is poised to attract a sizeable number of new-era micro jet aircraft, which will be introduced in part with the Small Aircraft Transportation System (SATS). These turbine-powered aircraft are expected to serve smaller communities with the prospect of increasing and bringing new business activity to small general aviation airports. These micro jets which are classified by their weight and existing prototypes are less than 12,500 lbs. Accordingly, this singular operational characteristic does not require additional runway lengthening at SPG to accommodate very light jet (VLJs) aircraft, although RSA improvements are still necessary. In FAA Order 5200.8, Runway Safety Area Program, five specific alternatives are to be considered for those safety areas that are unable to meet the traditional graded area surrounding the runway. The alternatives evaluation process was resolved through a two-step process that first subjected all design options to a preliminary screening review. In order to achieve the best option for RSA improvements at SPG, several alternatives were analyzed, scrutinized, and then ranked reflecting several factors including cost, environmental impact, safety, and operational efficiency. These alternatives were then refined to include design considerations identified as the most practicable for SPG, which are detailed more thoroughly in the Alternatives Evaluation section of this report. 1.3.2 Runway Relocation, Shifting, or Realignment Existing runway safety area deficiencies at SPG are a direct result of the constrained land mass on which the airport is situated. The topography and environmental habitats surrounding SPG limits runway lengthening and the sensitivity of such require that RSA deficiencies be resolved by other means. The proximity of the runways to Tampa Bay require safety area modifications to extend into the water, which involves land acquisition by means of dredging and filling portions of the bay adjacent to the airport. This development alternative also requires that Runway 18-36 be shifted to the north to satisfy safety area requirements beyond Runway 18. Further, shifting Runway 18-36 to the east is more applicable to the provision for upgrading the approach visibility minimums to less than ¾-statute mile, and is not solely an alternative to resolve RSA deficiencies. 1.3.3 Runway Length Reduction The consideration for runway length reduction is plausible when existing runway length exceeds that which is required for the existing or projected design aircraft. In this regard,

14 December 2006 RSA Determination Study Final
since the existing runway length accommodates the operational requirements of the design aircraft (Beech King Air 90), a reduction in runway length is not a sensible alternative to achieving runway safety area at SPG. 1.3.4 Combination of Runway Relocation, Shifting, or Reduction Consideration was given to a combination of shifting and relocating the runways at SPG, as practicable. Runway relocation was considered in addition to the need for adjusting the runway-to-taxiway centerline separation between Runway 18-36 and Taxiway B to accommodate the upgrade to the most demanding approach on Runway 18, which is currently equipped to handle non-precision instrument approaches. However, as previously mentioned, shifting the runway’s profile laterally is necessary only to achieve less than ¾-statute mile visibility minimums. Due to the lack of viability of the previous development consideration and the limited land upon which the runways can expand, this alternative is limited to runway relocation without considering a simultaneous reduction in runway length. 1.3.5 Declared Distances In cases where standardizing safety area is considered impracticable for a variety of reasons, an alternative to achieving runway safety is determined through the use of declared distances. The FAA revised its standards for runway safety area and linked its design characteristics with declared distance information in Change 10 of AC 150/5300-13, Airport Design on September 26, 2005. Previously, the FAA set forth precise and uniform design characteristics for runway safety area, which established identical dimensions beyond both runway ends. Cognizant that some airports are unable to adhere and comply with these specifications, the FAA incorporated an alternative clause that asserts runway safety areas may be defined within the confines of the runway structural pavement by using declared distances. Consequently, takeoff run available (TORA) would be reduced by the same factor as the standard RSA beyond the runway threshold. For example, localizer antennae may penetrate the inner approach surface for landing aircraft, thus potentially obstructing an aircraft’s safe slope to clear them. The refined RSA area, therefore, would be located or overlap the runway structural pavement. As a result, the pavement area under which the relocated RSA is defined may not be used for takeoff or landing distance calculations. The declared distance alternative allows the airport to determine what portions of an operational runway can be considered to satisfy an aircraft’s accelerate-stop, takeoff, and landing distance requirements while still complying with standard RSA requirements. This option allows the implementation of declared distances for those airports that cannot provide sufficient distance beyond the runway ends. A brief description of each declared distance is denoted in the following.

15 December 2006 RSA Determination Study Final
Takeoff Run Available (TORA) — the distance to accelerate from brake release to lift-off plus safety factors.
Takeoff Distance Available (TODA) — the distance to accelerate from brake release past lift-off to start of takeoff climb plus safety factors.
Accelerate-Stop Distance Available (ASDA) — the distance to accelerate from brake release to V1 and then decelerate to a stop, plus safety factors.
Landing Distance Available (LDA) — the distance from the threshold to
complete the approach, touchdown, and decelerate to a stop, plus safety factors.
TABLE 1-11 EXISTING DECLARED DISTANCE INFORMATION
Declared Distance Runway 6 Runway 24
TORA 3647’ 3677’
TODA 3647’ 3677’ ASDA 3447’ 3437’ LDA 2919’ 3174’
Source: The LPA Group, FAA AFD, 2005
Declared distances are currently in effect for Runway 6-24 at SPG, as highlighted in Table 1-11. Declared distances are not currently utilized on Runway 18-36 due to its short length and design aircraft. Still provisions for future runway development to accommodate required RSA dimensions as outlined in the 2006 Master Plan Update will include a 120 foot displaced threshold on Runway 36.

16 December 2006 RSA Determination Study Final
Figure 1-3, Declared Distances Sample Schematic
Source: The LPA Group, FAA Presentation (Airports Annual Conference), 2005 1.3.6 Engineered Materials Arresting System (EMAS) On occasion, aircraft can and do overrun the ends of runways. An overrun occurs when an aircraft surpasses the pavement confines of a runway environment and proceeds into an unpaved area of the airfield not designated for aircraft use. Aircraft overruns usually occur during landing and aborted takeoffs, during which aircraft are unable to sufficiently decelerate in time to remain on runway pavement. According to FAA AC 150/5220-22, Engineered Materials Arresting Systems for Aircraft Overruns, the majority of these aircraft come to rest within 1,000 feet of the runway end and between the extended edges of the runway. Data collected by the FAA over a 12-year period between 1975 and 1987 indicate that nearly 90 percent of aircraft overruns occur at exit speeds of 70 knots or less. Based upon the potential hazards these incidents may cause, the FAA incorporated a model of runway safety areas into airport design standards. In compliance with these standards, the safety area must be capable, under normal (dry) conditions, of supporting aircraft that overrun the runway without causing structural damage to aircraft or injury to its occupants. However, many airports face the issue of natural obstacles, encroaching development, or environmental restrictions that prohibit the feasible development of these safety areas. Due to the difficulty associated with attaining a standard safety area at many airports, the FAA spearheaded research to explore the use of various materials for arresting systems. Commonly referred to as EMAS, this initiative has gained widespread support. An EMAS is designed to stop an aircraft during an overrun by exerting predictable deceleration forces on its landing gear. The EMAS is considered fixed by its function
TORA

17 December 2006 RSA Determination Study Final
and frangible by its design and is intended to fail at a specific impact load. EMAS structures are sloped and built above the existing grade to absorb the aircraft’s velocity and forward movement. Centered on the extended runway centerline, the EMAS structure is located beyond the end of the runway at a distance determined by available land area and EMAS materials. 1.3.6.1 SPG EMAS Evaluation A core objective of any airport improvement project is balancing effectiveness and cost. The EMAS alternative would be a reasonable means of achieving runway safety area if the expected level of operational activity and fleet diversity were expected to increase over the planning horizon. However, SPG’s role within the aviation system will remain as a general aviation reliever serving the needs of light general aviation aircraft. As described in the previous section, design characteristics that dictate the construction of the EMAS bed is based upon historical data formerly obtained by the FAA. The structural integrity of the EMAS is contingent upon several variables that affect the way in which the structure fails upon impact, including the impact load in terms of weight and velocity of the aircraft prior to contact with the arrestor bed. Thus, the design aircraft at SPG, both existing and expected in the near term, are not compatible with the design attributes of the EMAS, which is intended to arrest heavier aircraft with greater exit speeds. Therefore, for the purposes of this analysis, further consideration was not given to the EMAS alternative as its function is infeasible for the type of operational activity at SPG. 1.4 ALTERNATIVES EVALUATION Compliance with FAA mandated RSA requirements may be attained via several alternatives, each having distinctive benefits and associated disadvantages. As previously emphasized, achieving these standards may be afforded by implementing non-standard substitutes to RSA dimensions published in AC 150/5300-13, Airport Design, as practicable. Additionally, the unique topography of Albert Whitted Airport demands additional consideration to be given to potential environmental impacts, which are discussed in Section 1.5. Therefore, based upon the four potential alternatives outlined by the FAA, four viable alternatives were developed specific to SPG. 1.4.1 Alternative A—RSA Fulfillment Using Declared Distances Only As mentioned earlier, the assimilation of declared distances resolves safety area deficiencies by diminishing runway landing and takeoff lengths independently. Airports that implement this methodology publish their declared distances in airport facility directories and other pilot resources. These resources are consulted to determine landing and departure accommodations relative to a specific runway. As shown in Figure 1-4, Alternative A assumes no structural modifications to the runway safety area. Rather, it

18 December 2006 RSA Determination Study Final
incorporates adjustments to the takeoff run available (TORA) and to the landing distance available (LDA) in order to meet B-I RSA criteria. The existing available RSA length beyond the Runway 18 end is 130 feet, as previously noted in Table 1-9. To achieve a standard 240 foot RSA beyond this runway end for B-I Light aircraft, 110 feet of usable pavement area must be sacrificed, thereby reducing the TORA to 2,754 feet and LDA to 2,564 feet. Reciprocally, existing available RSA length beyond the end of Runway 36 is 50 feet. Thus, an additional 190 feet of pavement must be reserved for safety area, reducing TORA by 2,674 feet and LDA to 2,564 feet. The existing available RSA length beyond the Runway 6 end technically satisfies RSA criteria through the 263 feet displaced threshold. However, based upon the anticipated fleet mix and upgrade of Runway 6-24 to a non-precision approach, it was recommended within the 2005 Master Plan Update that the Runway 24 threshold be relocated to the edge of pavement, approximately 263 feet to the northeast. However, this will make the Runway 24 RSA deficient by nearly 230 feet. Thus, 230 feet of pavement must be sacrificed to achieve RSA standards, thereby increasing the Runway 6 TORA to 3,447 feet and increasing the LDA to 2,942 feet. Table 1-12 outlines the declared distances associated with Alternative A

19 December 2006 RSA Determination Study Final
TABLE 1-12
ALTERNATIVE A DECLARED DISTANCE INFORMATION
Declared Distance Runway 18 Runway 36 Runway 6 Runway 24
Displaced Threshold (Approach End) 190’ 110’ 558' 264'
TORA 2754’ 2674’ 3647’ 3677’
TODA 2864’ 2864’ 3647’ 3677’ ASDA 2754’ 2674’ 3447’ 3437’ LDA 2564’ 2564’ 2919’ 3174’
Source: The LPA Group, 2006
Although this alternative is considered cost effective since it requires no construction, it will limit aircraft use on Runway 18-36. A sizeable portion of pavement is sacrificed in this alternative in order to achieve adequate B-I RSA criterion. Although maintaining satisfactory dimensions for RSA is crucial, the reduction of runway pavement as a means of doing so reduces the airport’s future operating capacity to serve particular aircraft and may lead to a reduction in the airport’s future role in the aviation system. As of 2006, Runway 18-36 accommodates approximately 107 operations per day consisting primarily of single engine and light (under 12,500 pounds) multi-engine piston aircraft. The estimated percentage of use by single engine and multi-engine piston aircraft is provided in Table 1-13.
TABLE 1-13 2006 OPERATIONAL USAGE OF RUNWAY 18-36
Aircraft Type
*Percentage of Operations on Runway 18-36 Estimated Daily Ops
Estimated Yearly Ops
Single-Engine 83% 66 24,223 Multi-Engine 17% 14 4,950
Total Operations 100% 100 29,177 Source: Albert Whitted Airport Air Traffic Control Tower Data and The LPA Group, Inc. 2006
Based upon existing fleet mix and usage of runway 18-36, the following breakdown of operations perApplying runway length requirements for the existing fleet mix, the operational use of Runway 18-36 is provided in Table 1-14.

20 December 2006 RSA Determination Study Final
TABLE 1-14
EXISTING FLEET MIX RUNWAY LENGTH EVALUATION
Aircraft Designation Aircraft
Takeoff Distance over 50 ft Obstacle
Adjusted for Elevation, Temperature, etc
Landing Distance over 50 ft obstacle
Adjusted for Wet Pavement, etc
A-I Cessna 172 1450 1742 1200 1630
A-I Beech Baron 55 1700 2038 1470 1996
A-I Piper Archer 1210 1459 1390 1888 A-I Piper Seneca 1420 1707 1320 1793 B-I Less than 12,500 lbs Beech Baron
58 Pressurized 2376 2836
Beech King Air C90 2261 2700 2498 3393
Beech King Air B90 2180 2605 1672 2271
Beech King Air A90 2150 2569 2010 2730
Beech King Air E90 2024 2420 1960 2662
Piper Navajo before 1977 1950 2333 2110 2866
Piper Navajo after 1977 2200 2628 1690 2295
Aerostar 3080 3667 2700 3667 Source: Aircraft Manufacturers and FAA Takeoff Length and Landing Length Software Key: Red highlight indicates limited runway usage due to Declared Distances Blue highlight indicates limited usage due to existing Runway Length
Anticipated order of magnitude costs associated with Alternative A are shown in Table 1-15.

21 December 2006 RSA Determination Study Final
TABLE 1-15 ALTERNATIVE A ORDER OF MAGNITUDE COSTS
Project Estimated Costs Remark Pavement Markings on Runway 18-36 $10,000 Remark Pavement Markings on Runway 24 $5,000 Add Runway Lighting $1,300 Relocate PAPIs on Runway 24 $32,211 Relocate PAPIs & REILs on Runway 18 $50,000 Relocate PAPIs & REILs on Runway 36 $50,000
Construction Total $148,511 20% Engineering and Administrative Fees $29,702
30% Contingency Fees $44,553
Order of Magnitude Total $222,767 Source: The LPA Group Incorporated Engineering Cost Estimates, 2006
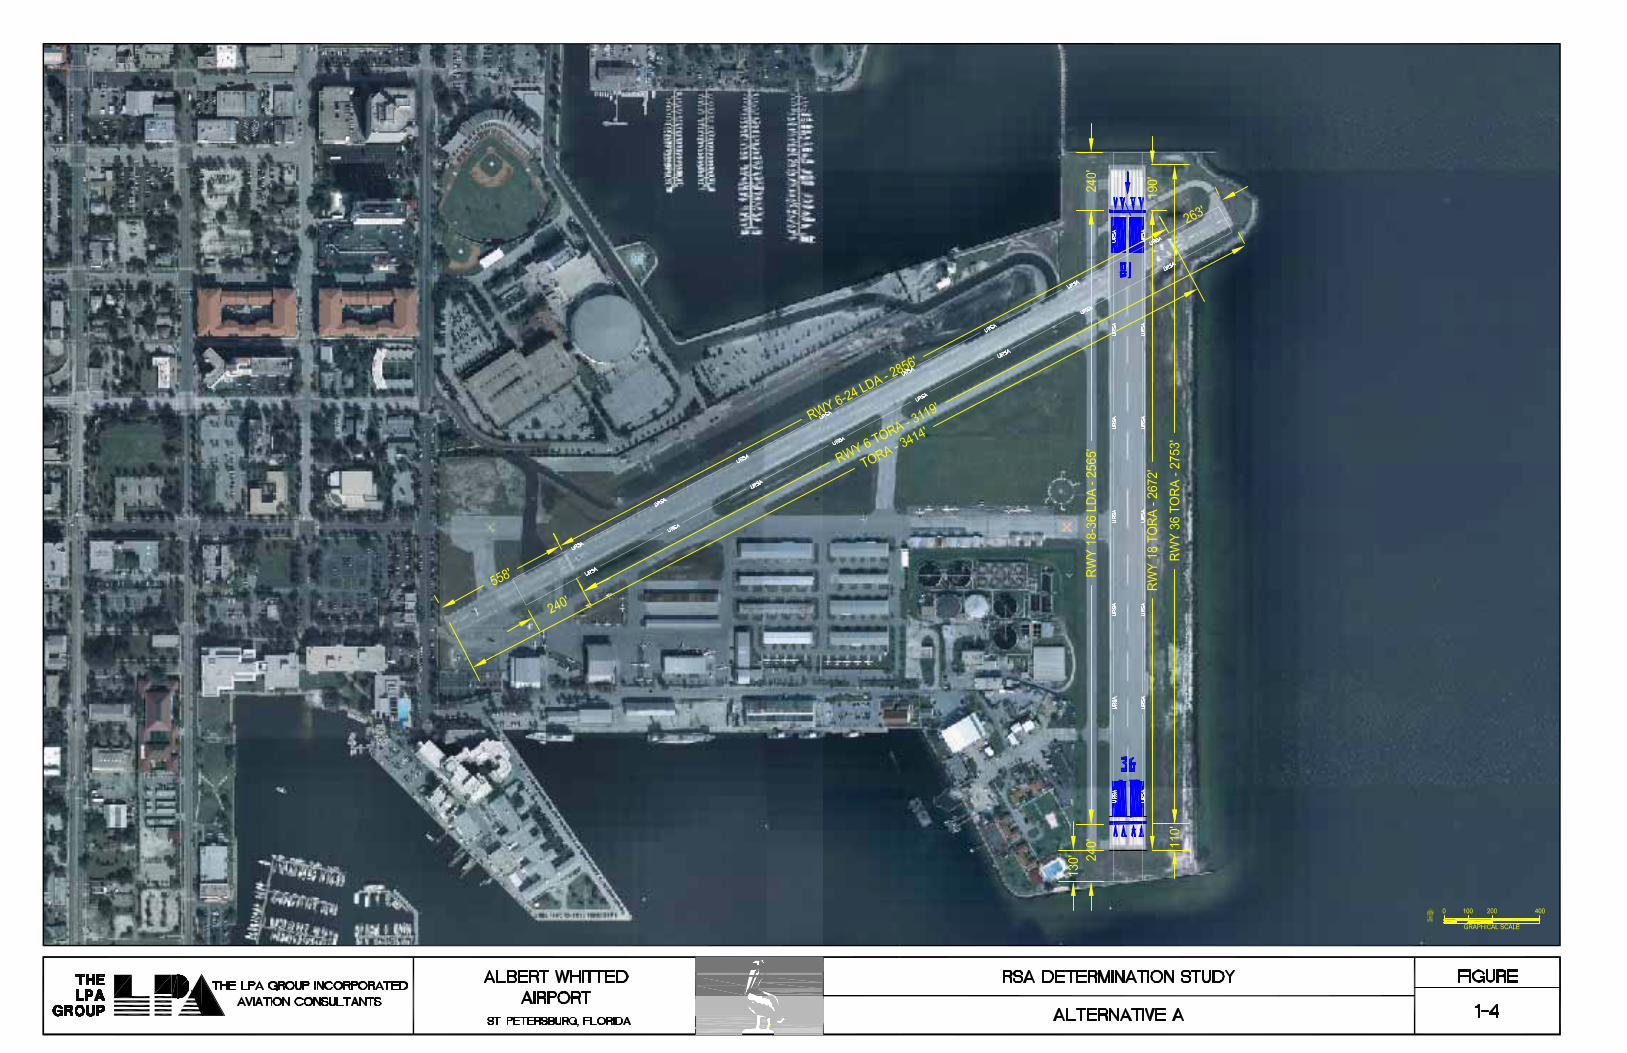

23 December 2006 RSA Determination Study Final
1.4.2 Alternative B—RSA Fulfillment Using Dredge and Fill As outlined in the 2005 Master Plan Update, runway safety expansion into Tampa Bay will be required to address existing deficiencies. However, the surrounding embankments adjacent to existing land areas of the airport may be reclaimed without posing considerable impacts. As such, Alternative B proposes that additional land areas be reclaimed from the Bay within the immediacy of Runways 18, 24 and 36. This will allow Runway 18-36 to maintain its current 2,864 usable pavement length. In order to preserve the length of Runway 18-36, approximately 0.75 acres of land must be acquired on the Runway 18 end and 0.45 acres from the Runway 36 end to satisfy RSA requirements. Further, it is recommended that approximately 0.51 acres of land be acquisitioned on the Runway 24 end to allow the removal of the existing 263 foot displaced threshold. Removal of the displaced threshold on Runway 24 is anticipated to accommodate forecast fleet mix operating requirements and the implementation of a non-precision approach to Runway 6. Figure 1-5 shows the recommended RSA improvements associated with Runways 18, 24 and 36. In total, Approximately 1.71 acres of land must be reclaimed to accommodate standard RSA clearances. This method of attaining runway safety area requirements is costly but may qualify for FAA funding assistance. Due to the potential environmental impacts associated with this project, it is desirable that proposed safety area development on Runways 18 and 36 be coordinated concurrently with development on Runway 24. Further, after consultation with the Army Corps of Engineers, it is expected that SPG may obtain clean fill related to the periodic dredging of Tampa Bay. In addition, an evaluation of sea floor depths beyond the sea wall east of Runway 18-36 revealed previous fill. Therefore, this area is shallower than the channels north of Runway 18 and south of Runway 36. Additionally, an environmental assessment of this area is required to determine the significance and extent of environmental impacts, specifically presence of benthic invertebrate communities as required by FAA Order 1050.1E, Environmental Impacts: Policies and Procedures.
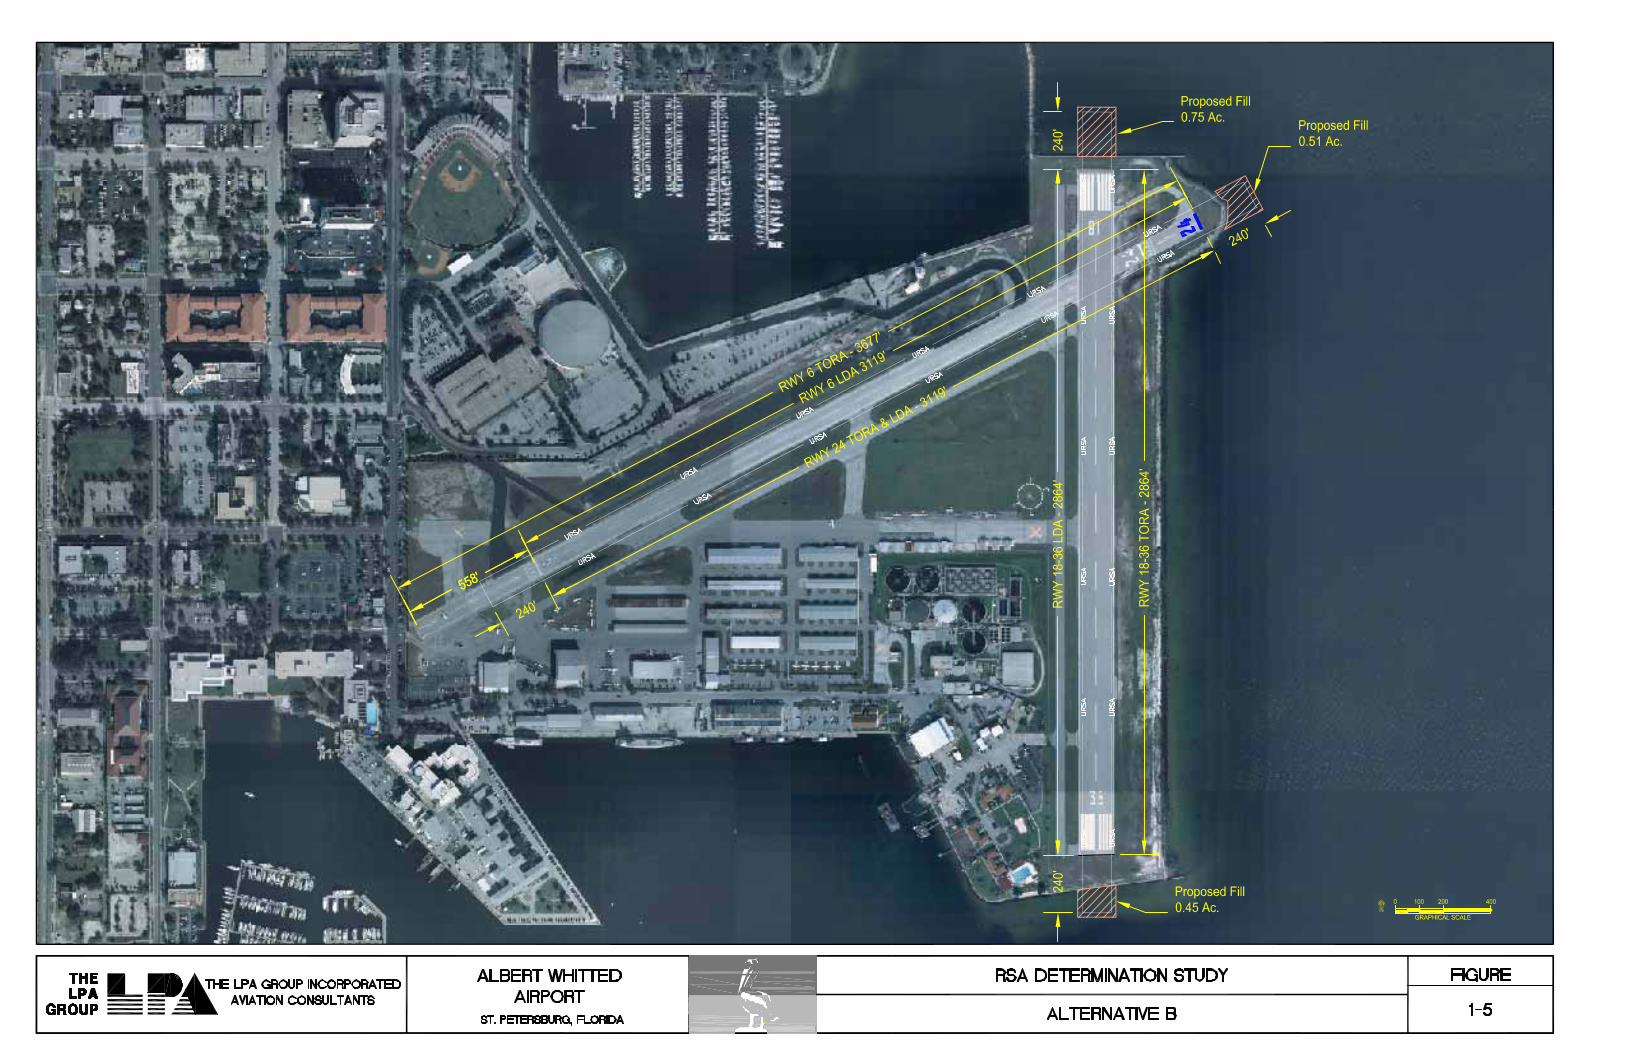

25 December 2006 RSA Determination Study Final
Anticipated order of magnitude costs associated with Alternative B are shown in Table 1-16
TABLE 1-16 ALTERNATIVE B ORDER OF MAGNITUDE COSTS
Project Estimated Costs Dredge and Fill – Runway 18 $300,000 Dredge and Fill – Runway 36 $175,000 Dredge and Fill – Runway 24 $200,000 Relocate PAPIs on Runway 24 $32,211 Runway 24 Markings(new and removal) $5,000 Install MIRL on Runway 24 $2,600 Environmental Assessment $300,000 Environmental Permitting (3 Permits) $150,000
Total Construction and Environmental Costs $1,164,811
20% Engineering and Administrative Fees $232,962
30% Contingency Fees $349,443
Order of Magnitude Total $1,747,217 *Note: Dredge and Fill is based upon RSA requirements and embankment stabilization only. Source: The LPA Group Incorporated Engineering Cost Estimates, 2006
1.4.3 Alternative C—RSA Fulfillment Using Declared Distance, Shifting, and Dredge and Fill Another alternative to resolving RSA deficiencies at SPG incorporates a hybrid scheme that identifies elements of both Alternatives A and B. This proposal for developing sufficient RSA dimensions assumes that declared distances will be incorporated for Runway 36 and land reclamation for Runways 18 and 24. Although some pavement length must be sacrificed in order to achieve RSA requirements, this option preserves as much length as possible while remaining cognizant of cost. While the standard RSA length requirement for the Runway 6 and Runway 36 ends is achieved through the relocation of the thresholds, the Runway 18 and Runway 24 RSA length requirements is achieved through the reclamation of 1.2 and 0.51 acres, respectively, from Tampa Bay. Figure 1-6 provides a graphical illustration of this alternative. Yet, as discussed in Alternative B, SPG may be the beneficiary of clean fill provided by the Corps of Engineers as a result of periodic dredging of Tampa Bay.

26 December 2006 RSA Determination Study Final
The shifting of Runway 18-36 to the north by 110 feet for a total pavement length of 2974 feet will satisfy RSA requirements beyond the Runway 18 end. As a result, landing distance will remain at 2,864 feet and takeoff distance could increase to 2,974 feet. These declared distances, as outlined in Table 1-17, are in conjunction with land reclamation on the Runway 18 end that satisfies RSA dimensional standards. In this alternative, the Runway 6-24 profile will remain the same as that in Alternative B with the provision for shifting the Runway 24 end. Therefore providing the following displaced thresholds:
TABLE 1-17 FUTURE DISPLACED THRESHOLD REQUIREMENTS
RUNWAY TODA ASDA LDA TORA 6 3,677 3,677 3,159 3,677 24 3,677 3,437 3,437 3,677 18 2,974 2,974 2,864 2,974 36 2,974 2,974 2,864 2,974
Source: The LPA Group Incorporated, 2006
Anticipated order of magnitude costs associated with Alternative C are shown in Table 1-18.
TABLE 1-18 ALTERNATIVE C ORDER OF MAGNITUDE COSTS
Project Estimated Costs
Dredge and Fill – Runway 18 $350,000 Dredge and Fill – Runway 24 $200,000 Runway 24 Markings (new and removal) $5,000 Runway 18 Design and Construction $273,124 Relocate PAPI Runway 24 $32,211 Relocate PAPI & REILs Runway 18 $50,000 Relocate PAPI & REILs Runway 36 $50,000 Install MIRL on Runway 24 $1,300 Environmental Assessment $300,000 Environmental Permitting (2 Permits) $100,000
Construction Total $1,361,635 20% Engineering and Administrative $272,327
30% Contingency $408,491
Order of Magnitude Total $2,042,453 Source: The LPA Group Incorporated Engineering Cost Estimates, 2006


28 December 2006 RSA Determination Study Final
1.4.4 Alternative D—RSA Fulfillment Using Relocated Thresholds A fourth alternative for providing RSA criteria is by imposing a threshold relocation option for all runway ends that do not currently satisfy safety area requirements. This alternative does not include pavement area usable for aircraft operations. The relocated threshold is marked by a demarcation bar, which is a 10-foot-wide white-painted stripe that extends across the width of the runway. The distance between the beginning of the runway pavement and the relocated threshold is marked by yellow-painted chevrons, indicating that the pavement is unusable for takeoff, landing, or taxiing aircraft. Alternative D is a cost-effective means of achieving RSA without significant development. However, the critical element of runway length imposes a severe restriction on the available runway pavement suitable for aircraft movement. Effectively, this alternative reduces runway pavement length on Runway 18-36 by nearly 12 percent to 2,564 feet and on Runway 6-24 by nearly 4 percent to 3,542 feet. This alternative impacts the use of Runway 18-36 most significantly and has longer-term negative impacts on the development of the airport and its growth in operational activity by light aircraft, especially SATS aircraft. This issue is further compounded when aircraft activity is limited to Runway 18-36 during Runway 6-24 closures for resurfacing or maintenance.
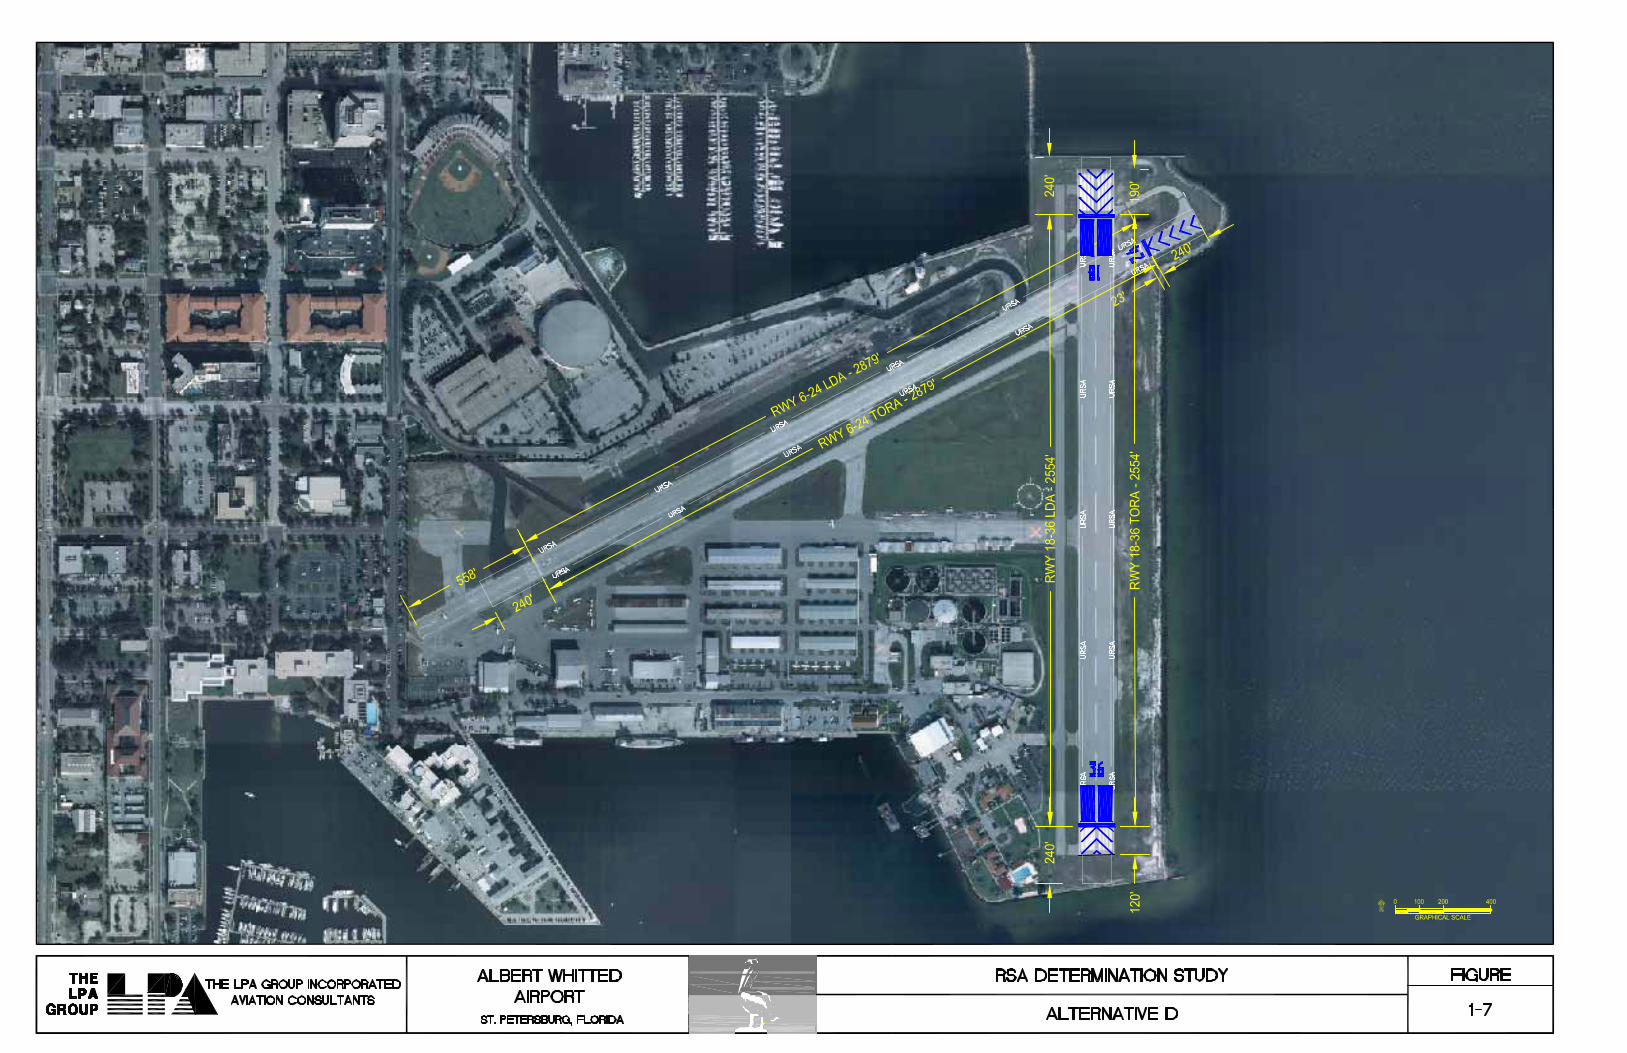

30 December 2006 RSA Determination Study Final
Anticipated order of magnitude costs associated with Alternative A are shown in Table 1-19.
TABLE 1-19 ALTERNATIVE D ORDER OF MAGNITUDE COSTS
Project Estimated Costs Relocate Pavement Markings on Runway 18-36 $10,000 Relocate Pavement Markings on Runway 6-24 $10,000 Remove Runway Lighting (Runway 6 and 24) $2,500 Remove Runway Lighting (Runway 18 and 36) $2,500 Relocate PAPIs & REILs - Runway 18 $50,000 Relocate PAPIs & REILs – Runway 36 $50,000 Relocate PAPIs – Runway 24 $32,211
Total Construction Costs $157,211 20% Engineering and Adminstrative Fees $31,442
30% Contingency $47,163
Order of Magnitude Total $235,817 Source: The LPA Group Incorporated, 2005
1.5 ENVIRONMENTAL AND OPERATIONAL CONSIDERATIONS Existing available literature on land use and cover, seagrass cover, occurrence of terrestrial and aquatic protected species, and other environmental related databases for Pinellas County indicates that there is an existing sparse seagrass community east of the Runway 18/36, scattered isolated mangrove trees along the shoreline, and two active burrowing owl dens within the airport. Although, available existing information indicates that these areas do not contain submerged aquatic vegetation or seagrass, regulatory requirements mandate that development projects demonstrate and document avoidance and minimization of environmental impacts. An environmental assessment of proposed development project areas should be performed during the planning or design phase to determine environmental impacts. The following sections discuss environmental considerations based upon previous studies, available geographic information systems (GIS) maps, and data. 1.5.1 Alternative A Alternative A does not propose any structural activities that would disturb undeveloped land, and, therefore, does not have environmental impacts.

31 December 2006 RSA Determination Study Final
1.5.2 Alternative B Alternative B proposes the extension of the RSA areas that would involve filling a total of approximately 1.71 acres of Tampa Bay consisting of the following:
• Filling approximately .51 acres of the bay east of Runway 24; • Filling an estimated .75 acres of the bay north of Runway 18; and, • Filling about .45 acres of the bay south of Runway 36.
Filling the area south of Runway 36 and north of Runway 18 also impact navigation and boat traffic. This alternative compared to the other four (4) alternatives has the potential to have the highest environmental impact because it proposes to fill the largest area at three (3) different locations. 1.5.3 Alternative C In order to provide required safety area dimensions, Alternative C proposes to fill a total of 1.71 acres of Tampa Bay, which consists of the following:
• Filling of approximately 1.2 acres of the bay north of Runway 18; and, • Filling of an estimated .51 acres of the bay east of Runway 24.
Filling the area north of Runway 18 may pose as an obstruction to navigation. This alternative compared to the other four (alternatives) has the potential to have the second highest environmental impact because it proposes to fill the second largest area at two (2) different locations. 1.5.4 Alternative D: Alternative D consists of permanently relocating the thresholds of Runways 18, 36, 6 and 24 to accommodate the standard safety area dimensions. This alternative will not have any environmental impacts since proposed improvements are all located in developed and previously disturbed areas. Of the four alternatives evaluated, Alternatives A and D will not impact any existing environmental habitats. Alternative C will likely incur less environmental impacts that Alternative B since it limits development to two areas rather than three. 1.5.5 Regulatory Requirements Development projects that involve filling of wetlands in Pinellas County may require regulatory permits and/or coordination from local, state, and federal agencies including:
• Pinellas Water Navigation Authority; • Florida Department of Environmental Protection; • Department of Community Affairs Coastal Zone Management Division; • Army Corps of Engineering;

32 December 2006 RSA Determination Study Final
• United States Coast Guard; • National Marine Fisheries Services; and, • United States Fish and Wildlife Services.
The environmental assessment phase of the project would determine the extent and significance of environmental impacts, which will dictate the regulatory permits required for the construction of the project. 1.6 SELECTION OF PREFERRED ALTERNATIVE An evaluation matrix, which addresses the aforementioned criteria for each alternative, is presented in Table 1-20, RSA Alternatives Evaluation. This matrix summarizes the consultant’s analyses of the development concepts. The recommended RSA concept for SPG was based upon qualitative and quantitative assessment of each airfield alternative option and was carefully scrutinized to complement the ideal airfield layout proposed in the 2005 Master Plan Update. The evaluation scores afford a measurable assessment of the four RSA alternative concepts with respect to the criteria described in this document. Although Alternatives A, use of displaced thresholds only, and D, permanent threshold relocation, were the least expensive of the four alternatives to implement, both alternatives recoup most of the safety area required by sacrificing runway length as denoted by their low scores under Runway Length Preservation. Alternative B maintains the runway length on Runway 18-36, but may incur significant environmental and financial cost related to dredge and fill requirements on both ends of Runway 18 and 26. Whereas Alternative C, which is slightly less expensive allows for use of the entire length of Runway 18-36 while also providing increased landing distance on Runway 24; thereby accommodating a greater percentage of users during inclement weather conditions. Further, the use of declared distances on Runway 36 will allow the existing landing length of 2,864 feet to remain while providing a takeoff distance available of 2,984 feet. Table 1-20 illustrates a comparison and relative scoring of each alternative based upon existing and future operations.

33 December 2006 RSA Determination Study Final
TABLE 1-20
RSA ALTERNATIVES EVALUATION
Evaluation Factors Alternative A Alternative B Alternative C Alternative D
Runway Versatility
Runway 18/36 2 4 5 1
Runway 6/24 3 5 5 1
Implementation Cost
Direct Costs – construction 5 2 2 4 Indirect Costs (lost revenue) 3 5 5 1 Runway Length Preservation TORA Runway 36 3 4 5 1 LDA Runway 36 2 5 5 1 TORA Runway 18 3 4 5 1
LDA Runway 18 2 4 5 1 TORA Runway 24 3 5 5 1 LDA Runway 24 3 5 5 1 TORA Runway 6 3 5 5 1 LDA Runway 6 3 5 5 1
Environmental Factors 5 1 2 5
Total Evaluation Score 40 54 59 20 Average Evaluation Score 3.08 4.08 4.62 1.54
Legend: 1. Poor 2. Fair 3. Satisfactory 4. Very Good 5. Excellent
Based upon an evaluation of the Runway 18-36 and 6-24 RSA alternatives, Alternative C provides the most benefit by preserving the existing 3,677 foot runway length on Runway 6-24 and increasing the length of Runway 18-36 from 2,864 to 2,974. Increasing the pavement available on Runways 6-24 and 18-36 allows the airport to maximize the number of aircraft that could utilize the facilities without taking substantial payload penalties. In addition, in preserving the length of Runway 18-36, aircraft may continue to use the airport during special events or maintenance which may require the closure of Runway 6-24. Thereby, maintaining a level of service and revenues to existing and potential airport users. Recommendations Based upon these criteria, it was determined that the use of dredge and fill in conjunction with the relocation of the Runway 18 threshold and the use of declared distances would provide the airport the flexibility and safety to accommodate existing and forecast

34 December 2006 RSA Determination Study Final
operations. An order of magnitude cost estimate of approximately $5 million including environmental requirements was determined based upon material estimates for 2006. This cost also included at least $400,000 for dredge and fill. However, based upon discussions with the Army Corps of Engineers, it is likely that the cost of the fill would be negligible since it would likely come from various Tampa Bay dredging projects. However, if the recommended improvement is deemed impracticable by the FAA Airport District Office Manager, non-standard safety areas on Runway 18-36 will be maintained. During recent discussions with the FAA-ADO, representatives have stated that the FAA cannot and will not be held liable for incidents or accidents associated with a non-standard safety area of Runway 18-36. As a result, the City of St. Petersburg should consider the legal implications associated with maintaining a non-standard safety area. 1.6.1 Preferred Alternative Cost Estimate Cost estimates are required in order to determine the magnitude of expense associated with the proposed RSA improvements. It is important to note that the final cost estimates considered only the fill requirements needed to meet standard RSA dimensions. Any additional fill needed to accommodate recommended development as outlined in the 2005 Master Plan Update were not included within this report. Based upon the recommended RSA improvements, a detailed cost estimate is provided in Table 1-21. In order to develop the detailed cost estimates associated with Alternative C, The LPA Group prepared calculations based upon average unit costs for major materials, including labor, plus engineering services at 20 percent of construction estimate and 30 percent contingency estimate. Engineering services include design, construction administration, inspection, testing and survey work. Environmental cost estimates were obtained from the local environmental scientist, and include costs project assessment, permitting and mitigation. It is important to note that seawalls will need to be constructed as part of the RSA improvements on both Runways 18 and 24.

35 December 2006 RSA Determination Study Final
TABLE 1-21 CONSOLIDATED COST ESTIMATES
RSA IMPROVEMENTS TO RUNWAYS 18, 36 and 24 Preliminary
Project Estimated Cost Environmental Environmental Assessment $254,000 Environmental Permitting $195,000 Mitigation ($100,000 per credit for salt marsh wetland) $300,000 Survey/Geotechnical $13,000 Subtotal $762,000 Construction Costs and Engineering Fees Runway 24 RSA Improvements (Dredge and Fill) $185,680 Runway 18 RSA Improvements (Dredge and Fill) $393,600 Runway 18 Extension (Paving and Lighting): Extend Runway 18-36 $327,749 Construct Embankment $2,500 Remove existing and remark 18-36 $12,500 Install Electrical Components $250,000 Professional Services (Design) $160,000 Mark Displace Threshold on Runway 36 $5,200 Relocate Markings on Runway 24 $5,200 Construct Wall around RSA Runway 18 $1,950,000 Construct Wall around RSA Runway 24 $1,690,000 Relocate PAPIs and REILs on Runways 18 and 36 $100,000 Subtotal $5,082,429 30% Contingency Fees $1,753,329 ESTIMATED TOTAL $7,597,757 *Note: Anticipated that some clean fill will be provided at low or no cost by the Army Corps of Engineers as part of Tampa Bay Dredging project. Also, does not include fill requirements associated with Taxiway A and Taxiway B extensions. Source: The LPA Group Incorporated Engineering Cost Estimates, 2006

36 December 2006 RSA Determination Study Final
1.7 SUMMARY AND CONCLUSION Albert Whitted Airport is a busy general aviation airport located within the heart of Downtown St. Petersburg. The airport is home to a variety of general aviation traffic including medivac, military, flight training and recreational flying. Of the two runways, Runway 6-24 is the primary with a length of 3,677 feet and an ADG of B-I Light. The crosswind runway, Runway 18-36, has a length of 2,864 feet with an ADG of B-I Light. Runway 6-24’s runway operational length requirements are currently dictated by declared distances due to the number of obstructions in and around the airport as well as limited land mass beyond the end of Runway 24. Unlike Runway 6-24, Runway 18-36 is equipped with non-standard runway safety areas (RSA) also due to limited land mass beyond the runway ends. In an effort to guide the RSA improvement process, the FAA has issued Order 5200.8, Runway Safety Area Program, to address potential alternatives to the traditional cleared and graded safety areas. Thus, several different initial options to accommodate safety area criterion were investigated including the use of declared distances and EMAS. Based upon research and discussions with EMAS providers, it was determined that EMAS is not a feasible solution due to the size and weight of the current and forecast fleet mix. EMAS will not work for aircraft less than 48,000 pounds. As a result, this option was removed from further review. In an attempt to find a viable solution, four alternatives were developed to resolve the RSA deficiencies on Runways 18, 24, and 36. After each alternative was evaluated and scored, it was determined that the most practical solution would be to install fill north of Runway 18 and east of Runway 24 in conjunction with the use of declared distances to maximize the operations. This alternative was chosen since it preserved takeoff and landing length as well as operational efficiency and revenue. It was determined that improvements for Alternative C would cost approximately $5.9 million. Thus, it is recommended that the airport implement Alternative C Runway threshold relocation, declared distances, and the installation of additional fill were all evaluated as part of the RSA analysis for Runways 24, 18 and 36. By incorporating these measures, the airport will be able to create a safe and viable alternative during favorable wind conditions or during closure of the main runway. As indicated earlier, there may be some significant environmental impacts associated with this development. Therefore, an Environmental Assessment is recommended. Due to the anticipated cost of this alternative, this development should be phased in such as way as to limit expenses and maintain the maximum runway length possible. Shortening the runway, using declared distances only or through relocation of the thresholds, is considered unacceptable since it will negatively impact short and long-term

37 December 2006 RSA Determination Study Final
operations at the airport and burdens the City of St. Petersburg. Shortening Runway 18-36 to 2,564 feet will not only limit its use by single-engine piston aircraft and light sport aircraft (approximately 15%), but will disallow its use by VLJs and other short-runway turbine powered aircraft. Based upon existing and anticipated aircraft, daily operations on Runway 18-36 will shrink from 107 in 2006 to an estimated 45 in 2024 based upon the anticipated fleet mix transition over the twenty year planning period. In addition, shortening Runway 18-36 will impact the effectiveness of the non-precision approaches. In other words, why pay to add navigational aids to a runway that has limited use by more sophisticated aircraft. However, by incorporating standard safety area criteria, the airport will create a safe and viable runway alternative during inclement weather, special events and favorable wind conditions while limiting the City of St. Petersburg's legal liability. Further, it will increase the airports capacity and improve the overall flexibility of operations. Since limited environmental impacts are expected, an environmental assessment will likely be required. Further, development should be phased to limit potential impacts to the airport and the surrounding community.