Embed Size (px)
Citation preview
Colombia and SiemensHannover, April 2015
Colombia and SiemensEnrique Gonzalez Z., Corporate Strategy Siemens AG
© Siemens AG 2015. All rights reserved. siemens.com

Siemens’ solid portfolio and geographical mix is the base of today’s and tomorrow’s future success
Power and Gas18%16%
Healthcare Asia, Australia
20%
Germany15%
Revenue by RegionRevenue by Sector
Energy 15%
Wind PowerRenewables8%
18%Process Industries
and Drives 13%
13%
16% 20%
Europe, C.I.S.,Africa,26% 39%
15%
Based on customer locationBuilding Technologies
8%Management
Mobility
10%13%
Digital FactoryMiddle East(excl. Germany)
Americas39%
In millions of € FY 2013 FY 2014
Employees in thousandsRevenue in millions of €
Continuing operationsRevenue and employees
100,000 500 In millions of € FY 2013 FY 2014
New orders 79,755 78,350
Revenue 73,445 71,920
Income 4,409 5,507
,
80,000
60,000
40 000
500
400
300
200
As reported in annual reports
Free cash flow 5,328 5,201
Employees 348,000 343,000
40,000
20,000
0
200
100
FY 20001986 1990 1995 2005 2014
March 2015Page 2
© Siemens AG 2015. All rights reserved. siemens.com
As reported in annual reports

Siemens is a strong local partner for customers in more than 200 countries
Americas Europe, C.I.S., Africa, Middle East
70,00018.8 76
211 000Siemens in Colombia
38.7 139211,000
26% 26%
54% 48%
• Business partner for more than 60 years• More than 1600 employees• Main office for Austral-Andina region• More than 30% of the installed
20%
62% 54% 48%electrical transmission systems has Siemens equipment
• Siemens is the supplier for 49% of the installed fossil power generation C t t f l
62%
Asia, Australia
62,000 14.474
• Competence center for sales, engineering, project management for all Siemens business units
• Factory: 96.000 mt2, design, engineering and production of drives
Barranquilla
Medellin
Cali
Bogotá / Tenjo
20% 26%engineering and production of drives, LV, MV and control panels, high voltage and distribution transformers, shelters for O&G and mining industries
26%
Employees Major production facilitiesRevenue (billions of €)Main office
Production center
Region Austral-Andina main office
S l ffi
March 2015Page 3
© Siemens AG 2015. All rights reserved. siemens.com
All numbers FY 2014 and refering to continuing operations Due to rounding, percentages may not add up to precisely 100
Sales offices

Siemens has been in Colombia since the beginning of the last century
Leo Kopp (founder of Bavaria Brewery), imported a Siemens Water Plant
Siemens Colombia is established in Bogota
1907
1954
Built the first transformers in the manufacturing plant in Colombia
Supplies the control center for the national energy dispatch center
Siemens supplies the first gas turbine in Colombia used for
1960
1998
2004 Siemens supplies the first gas turbine in Colombia used for cogeneration in an industry in Colombia
Project for the interconnection at 550/230 KV for the electrical highway connecting the north and the south of Colombia
2004
2007
Project for the SCADA, protection, auxiliary and medium voltage systems for the power plant Porce III
Siemens opens a new factory in Tenjo, near Bogotá
2008
2009
Siemens supplies steam turbine generator (40 MW), the biggest generation unit in the sugar refinery industry
Seven Turbo generators (3x47 MW Gas Turbines plus 2x21+2x24MW 2012 g ( pSteam Turbines) for the oil refinery in Cartagena
Installation of a SVC system in the substation Bacata. One of the most power full systems installed at the highest level over the sea
2012
2013
March 2015Page 4
© Siemens AG 2015. All rights reserved. siemens.com

Global trends are driving our business along the value chain of electrification
Global trends Market development (illustrative)Global trends
Digital transformation Market growth: ~7-9%
Market development (illustrative)
1
Globalization
Digitalization
M k t th 4 6%
Market growth: 7 9%Networked world of complex and hetero-geneous systems
2 Globalization
AutomationMarket growth: ~4-6%
Global competitiondriving productivity & localization
2
3
Globalization
Urbanization
Electrification Market growth: ~2-3%Infrastructure invest-ment needs of urban agglomerations
3
Demographicchange
Today Mid term-2020Decentralized demand of a growing and aging population
4
Climate change
and aging population
Higher resource efficiency in an all-
5Power Generation Power Transmission,
Distribution & Smart GridEfficient Energy Application Imaging &
In-Vitro Diagnostics
March 2015Page 5
© Siemens AG 2015. All rights reserved. siemens.com
efficiency in an allelectric world

Based on the global trends we were looking for what is coming next after BRIC
SEWEC – Second wave emerging countries
March 2015Page 6
© Siemens AG 2015. All rights reserved. siemens.com
Note: Shown is only group A (Long-term); Not shown: Group B (Short-term), Group C (All ready addressed) and Group D (Watch list)

Trend analysis was based on drivers, enablers andblocking points of GDP growth
SEWEC specific country trends GDP growth drivers
Population
Enablers and blocking points
Exploration of natural resourcesPopulation
Foreign direct investment
Existing infrastructure
Age distrib tion
Political system Laws Security
Exploration of natural resources Oil & Gas
Mining
Biological Age distribution
Education
Urbanization
Biological
Build-up of infrastructure Energy
W tGDP Growth Technology penetration
Lack of wealth
Natural resources
Water
Transportation
Buildings
GDP Growth
Regional associations
Geographic situation
Strength of corporations
Transformation of economic structure Healthcare
Production Public spending Environmental
protectiong p
Entrepreneurship Services protection
March 2015Page 7
© Siemens AG 2015. All rights reserved. siemens.com
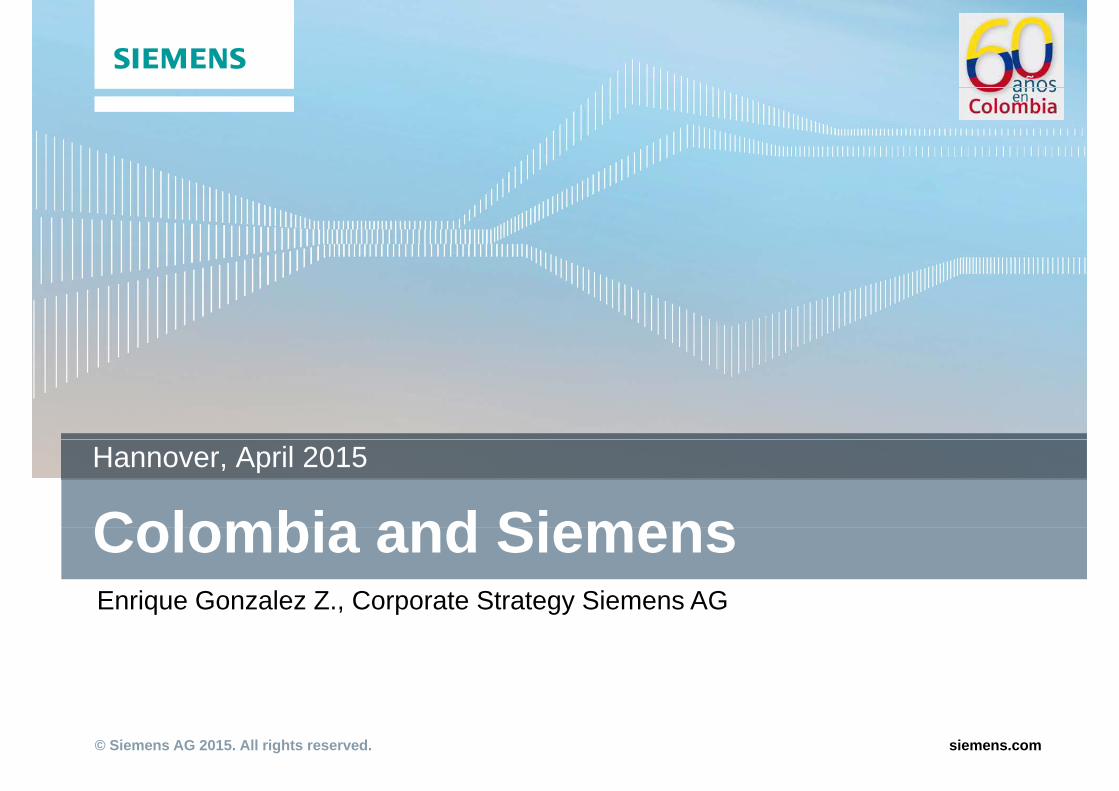
Colombia – Promising economical trendsThe country is seeking to increase local value add
Energy Increasing Power Generation (Energy Mix) Regional Grid Interconnection Latin America
Oil & Gas O&G CAPEX 2012 – 2030: USD 240’’ Conventional and Unconventional O&G
Production Expansion of the value chain and increasing importance of energy efficiency & automation
Biological Economic potential of enormous biodiversity to be developed
Transportation Infrastructure CAPEX 2011 – 2021: USD 55’’
Construction Growing buildings & construction CAPEX of >USD 20’’ per year
March 2015Page 8
© Siemens AG 2015. All rights reserved. siemens.com
Source: ProExport Colombia, Transport Ministry, UPME

Colombia has turned into a vibrant democracyFacts & Expectations along the economic growth path
2000 2014 Future
Economical Crisis beginning Economy in growth Competitive growth energy sector and
situation Crisis beginning y gafter financial crisis
gyexpansion of the value chain
Employment High levels of unemployment
Employment: Increase & formalization period
Low unemployment levelsp y unemployment & formalization period levels
Investment Low levels of investment
The highest levels of investment in history
Maintain investment degree
International relations
Isolated government of the rest of the world
Integrated with the international community
Integrated with the international community
Governability Low High HighGovernability Low High High
Public Institutions Weak Strong Strong
Security High levels of insecurity Democratic security Democratic prosperity
March 2015Page 9
© Siemens AG 2015. All rights reserved. siemens.com
Source: ANDI (Asociación Nacional de Empresarios de Colombia)

Contact
Thank youEnrique Gonzalez Zanetich
Siemens AGWittelsbacherplatz 2Thank you Wittelsbacherplatz 280333 MunichGermany
E-Mail: [email protected]
March 2015Page 10
© Siemens AG 2015. All rights reserved. siemens.com